connecticut greenhouse gas emissions · connecticut greenhouse gas emissions mitigation options...
TRANSCRIPT

Connecticut Greenhouse Gas Emissions
Mitigation Options Overview and Reduction Estimates
Prepared by NESCAUM
December 17, 2010
CT Greenhouse Gas Emissions: Mitigation Options Overview and Reduction Estimates Page
i
Members of Northeast States for Coordinated Air Use Management
Arthur Marin, Executive Director Northeast States for Coordinated Air Use Management
Anne Gobin, Bureau Chief
Connecticut Department of Environmental Protection, Bureau of Air Management
James P. Brooks, Bureau Director Maine Department of Environmental Protection, Bureau of Air Quality
Barbara Kwetz, Director
Massachusetts Department of Environmental Protection, Bureau of Waste Prevention
Robert Scott, Director New Hampshire Department of Environmental Services, Air Resources Division
William O’Sullivan, Director
New Jersey Department of Environmental Protection, Office of Air Quality Management
David Shaw, Director New York Department of Environmental Conservation, Division of Air Resources
Douglas L. McVay, Chief
Rhode Island Department of Environmental Management, Office of Air Resources
Richard A. Valentinetti, Director Vermont Department of Environmental Conservation, Air Pollution Control Division

CT Greenhouse Gas Emissions: Mitigation Options Overview and Reduction Estimates Page
ii
Connecticut Greenhouse Gas Emissions
Mitigation Options Overview and Reduction Estimates
Prepared by NESCAUM
December 17, 2010

CT Greenhouse Gas Emissions: Mitigation Options Overview and Reduction Estimates Page
iii
CONNECTICUT GREENHOUSE GAS EMISSIONS
MITIGATION OPTIONS OVERVIEW AND
REDUCTION ESTIMATES Project Manager Paul Miller, Gary Kleiman Principal Contributors Coralie Cooper
Kathleen Fahey Allison Reilly-Guerette Jason Rudokas Matt Soloman
Ryan Trombly Huiyan Yang

CT Greenhouse Gas Emissions: Mitigation Options Overview and Reduction Estimates Page
iv
Acknowledgments NESCAUM gratefully acknowledges the funding support provided by the Connecticut Department of Environmental Protection. NESCAUM is an association of the eight northeast state air pollution control programs. NESCAUM provides technical guidance and policy advice to its member states. This report was a joint effort between staff at NESCAUM and CT DEP and we thank the following individuals from CT DEP who provided data and comments on this report: Tracy Babbidge Paul Farrell Chris Nelson Rick Rodrigue Lynn Stoddard Printed: December 2010

CT Greenhouse Gas Emissions: Mitigation Options Overview and Reduction Estimates Page
v
TABLE OF CONTENTS
Acknowledgments.............................................................................................................. iv TABLE OF CONTENTS ................................................................................................. v
1. Overview....................................................................................................................... 1 1.1. GWSA background.............................................................................................. 1 1.2. Greenhouse Gas Inventory................................................................................... 1 1.3. Past Efforts........................................................................................................... 2 1.4. Overview of Present Effort .................................................................................. 2 1.5. Next Steps ............................................................................................................ 7
2. Technical Analyses ....................................................................................................... 9 2.1. CT GHG Emissions Reduction Options: Mobile Sources Sector....................... 9 2.2. CT GHG Emissions Reduction Options: Electric Power Generation Sector ... 24 2.3. CT GHG Emissions Reduction Options: Residential, Commercial, and
Industrial Sectors ............................................................................................... 30 2.4. CT GHG Emissions Reduction Options: Land Use Change and Forestry Sector
…........................................................................................................................ 48 Appendix A: Summary of – and Response to – Comments Received on August 19 Draft Report................................................................................................................................ 63

CT Greenhouse Gas Emissions: Mitigation Options Overview and Reduction Estimates Page
1
1. OVERVIEW
1.1. GWSA background The Connecticut Global Warming Solutions Act (GWSA or “the Act”), passed in 2008 (Section 22a-200 et seq. of the Connecticut General Statutes (CGS)), set Connecticut forward on a path toward reducing greenhouse gases (GHGs) to levels necessary to avert the most damaging aspects of climate change. The GWSA is the most significant driver for future climate change actions in Connecticut at this time. The GWSA sets the following mandatory GHG reduction targets for the state:
• By January 2020, reduce GHG emissions to 10 percent below 1990 levels; and
• By January 2050, reduce GHG emissions to 80 percent below 2001 levels.
Pursuant to the Act, the Connecticut Department of Environmental Protection (CT DEP) is required to:
• Publish on its website a baseline inventory of GHG emissions to establish a baseline for such emissions in the state and publish a summary of GHG emission reduction strategies by December 2009;
• Publish on its website by July 2010 the results of GHG reduction modeling scenarios, including, but not limited to, the evaluation of potential economic and environmental benefits and opportunities for economic growth based on such scenarios;
• Analyze GHG emission reduction strategies and, after an opportunity for public comment, make recommendations by July 2011 on which such strategies will achieve the GHG emission levels specified in the Act; and
• Beginning in July 2012 and every three years thereafter, develop with an opportunity for public comment, a schedule of recommended regulatory actions by relevant agencies, policies and other actions necessary to show reasonable further progress towards achieving the GHG emission levels specified in the Act.
1.2. Greenhouse Gas Inventory The complete 2009 Connecticut Greenhouse Gas Inventory as required by Section 22a-200b of CGS is available at www.ct.gov/dep/climatechange. An initial analysis indicates that over 90 percent of all GHG emissions in Connecticut result from the combustion of fossil fuels.
CT Greenhouse Gas Emissions: Mitigation Options Overview and Reduction Estimates Page
2
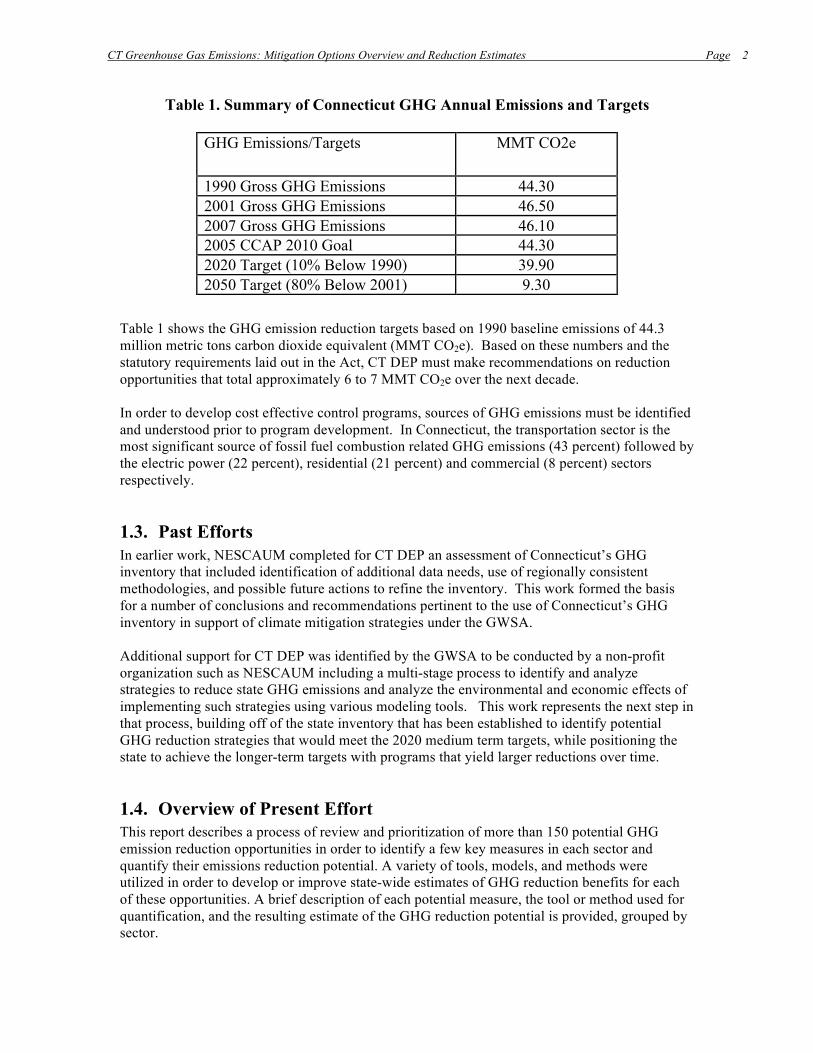
Table 1. Summary of Connecticut GHG Annual Emissions and Targets
Table 1 shows the GHG emission reduction targets based on 1990 baseline emissions of 44.3 million metric tons carbon dioxide equivalent (MMT CO2e). Based on these numbers and the statutory requirements laid out in the Act, CT DEP must make recommendations on reduction opportunities that total approximately 6 to 7 MMT CO2e over the next decade. In order to develop cost effective control programs, sources of GHG emissions must be identified and understood prior to program development. In Connecticut, the transportation sector is the most significant source of fossil fuel combustion related GHG emissions (43 percent) followed by the electric power (22 percent), residential (21 percent) and commercial (8 percent) sectors respectively.
1.3. Past Efforts In earlier work, NESCAUM completed for CT DEP an assessment of Connecticut’s GHG inventory that included identification of additional data needs, use of regionally consistent methodologies, and possible future actions to refine the inventory. This work formed the basis for a number of conclusions and recommendations pertinent to the use of Connecticut’s GHG inventory in support of climate mitigation strategies under the GWSA. Additional support for CT DEP was identified by the GWSA to be conducted by a non-profit organization such as NESCAUM including a multi-stage process to identify and analyze strategies to reduce state GHG emissions and analyze the environmental and economic effects of implementing such strategies using various modeling tools. This work represents the next step in that process, building off of the state inventory that has been established to identify potential GHG reduction strategies that would meet the 2020 medium term targets, while positioning the state to achieve the longer-term targets with programs that yield larger reductions over time.
1.4. Overview of Present Effort This report describes a process of review and prioritization of more than 150 potential GHG emission reduction opportunities in order to identify a few key measures in each sector and quantify their emissions reduction potential. A variety of tools, models, and methods were utilized in order to develop or improve state-wide estimates of GHG reduction benefits for each of these opportunities. A brief description of each potential measure, the tool or method used for quantification, and the resulting estimate of the GHG reduction potential is provided, grouped by sector.
GHG Emissions/Targets MMT CO2e
1990 Gross GHG Emissions 44.30 2001 Gross GHG Emissions 46.50 2007 Gross GHG Emissions 46.10 2005 CCAP 2010 Goal 44.30 2020 Target (10% Below 1990) 39.90 2050 Target (80% Below 2001) 9.30

CT Greenhouse Gas Emissions: Mitigation Options Overview and Reduction Estimates Page
3
In general, the modeling approaches varied by sector with the majority of transportation measures being analyzed with either the U.S. EPA MOVES model (U.S. EPA, 2009a), the U.S. DOE GREET model (U.S. DOE, 2010), or the U.S. EPA NONROAD model (U.S. EPA, 2008). Power generation sector measures were analyzed with NESCAUM’s NE-MARKAL model (Goldstein et al., 2008) and independent U.S. DOE data. Residential, commercial, and industrial sector measures utilized a variety of methods and sources ranging from state data on existing programs to published reports on potential programs, but also included the use of the U.S. DOE eQuest tool (U.S. DOE, 2009c) and the U.S. EPA State Inventory Tool (U.S. EPA, 2010a). The land-use measure relied on published reports and the solid waste measure was analyzed using the U.S. EPA WaRM model (U.S. EPA, 2009c). NESCAUM was provided with a list of over 150 measures that had been identified through a state-wide climate action planning process, subsequent stakeholder input and research by CT DEP. While almost every measure on this list represented a viable strategy to pursue emissions reductions, the measures spanned a wide range of reduction potentials, feasibility, and effectiveness. In addition, several measures appeared to be overlapping and redundant with other measures on the list. Already grouped by sector, NESCAUM undertook the task of further grouping the measures according to the 55 measures that were identified in the 2005 Connecticut Climate Action Plan (Connecticut, 2005). After similar measures had been grouped, NESCAUM identified several key measures in each sector that offered the combination of both large reduction potential and ease of quantification. Measures to build public support – such as outreach and education campaigns – may be required in order to achieve the technology and behavior changes that will ultimately lead to emission reductions; however, it is difficult to assess the effectiveness of such programs and translate them into quantified reduction potential. Rather, we focused directly on the technology and conservation options that could reduce GHG emissions directly. This report does not analyze specific implementation of any GHG reduction strategy nor are the analyzed measures listed below prioritized in any manner. Rather this report should be viewed as a menu of options for the State to consider as it develops its GHG reduction plan. Transportation Light-duty vehicles (LDVs) produce approximately 40 percent of GHG emissions from fossil fuel combustion in the state of Connecticut (NESCAUM, 2003). Seven measures have been considered that represent the greatest achievable near-term (2020) emission reduction potential. These measures include:
1. Continued participation in the California Low Emission Vehicle Program, including the GHG emission standards for light-duty vehicles – As a state that has opted into California’s Low Emission Vehicle Program under §177 of the Clean Air Act, continued enforcement of California emission standards (including GHG standards) could result in up to 3.7 MMT of annual CO2e emissions reduction in 2020.
2. Light-duty vehicle feebate program – Development and implementation of program that provides fiscal incentives for high-efficiency vehicles and assesses a fee for relatively low-efficiency vehicles could achieve up to 2.9 MMT of reduction.
3. Low carbon fuel standard – A regional program to mandate a 10 percent reduction in the carbon intensity of transportation fuels on a full life cycle basis (including implementation of the national renewable fuels standard and recommendations from Governor Rell’s Electric Vehicle Infrastructure Council) could achieve annual tailpipe

CT Greenhouse Gas Emissions: Mitigation Options Overview and Reduction Estimates Page
4
reductions (i.e., in-state reductions) between 0.6 and 1.2 MMT by 2020 depending on compliance path. An additional 1-2 MMT in upstream reductions are also possible, but less certain at this time.
4. Smart growth strategies – Based on a survey of national program opportunities and Hartford-specific estimates of smart growth opportunities, Connecticut implementation of zoning measures geared toward compact development, public transit, and reductions in overall commuting traffic could achieve annual reductions of approximately 0.56 - 0.7 MMT.
5. Vehicle Miles Traveled (VMT) reduction - Strategies geared toward increased ridership on public transportation options could achieve annual reductions of between 0.04 and 0.12 MMT.
6. Speed limits - Reducing the maximum highway speed limit from 65 mph to either 60 or 55 mph could reduce GHG emissions by 0.45 or 0.9 MMT annually.
7. Clean diesel programs – One potential measure for reducing the short-lived climate forcing agent, black carbon, is the installation of approximately 60 auxiliary power units at a cost of $550,000, which would reduce climate forcing by approximately 0.0005 MMT CO2e. Other measures to consider include retrofitting nonroad internal combustion diesel engines with diesel particulate filters. A nonroad engine retrofit program is estimated to achieve 0.1 to 0.3 MMT CO2e if approximately half the fleet were retrofitted.
Electric Power Generation In the power generation sector, three broad reduction strategy categories were seen as key to near-term mitigation efforts. These are:
1. Implement and/or strengthen the Connecticut Renewable Portfolio Standard – The current Renewable Portfolio Standard mandates that 27 percent of all electricity consumed within Connecticut be generated by renewable resources by 2020. GHG emission reductions are estimated at approximately 2.6 MMT in 2020.
2. Expand and/or extend the Regional Greenhouse Gas Initiative (RGGI) – Achieving an additional 10 percent reduction in the existing CO2 cap on large electric generating units (EGUs) between 2019 and 2028 would achieve only 0.2 MMT in 2020, but 1 MMT by 2030. Expanding the source categories subject to the cap to include smaller EGUs and large boilers and requiring a 10 percent reduction in these emissions between 2014 and 2023 could achieve an additional 0.15 MMT annual reduction by 2020.
3. Base-load carbon dioxide (CO2) performance standard – Connecticut could implement a minimum performance standard for CO2 emissions equal to approximately 1,500 lbs per MWh gross output that would effectively limit new coal or oil-based generation. Given the existing requirements of the RGGI program, no net emissions reductions are anticipated from such a measure, but this would act as a backstop and is consistent with EPA’s expressed intention to consider developing performance standards for EGUs.
While there are many other measures that could be implemented in the power generation sector, these three are relatively straightforward to quantify benefits and would encompass other potential measures.
CT Greenhouse Gas Emissions: Mitigation Options Overview and Reduction Estimates Page
5
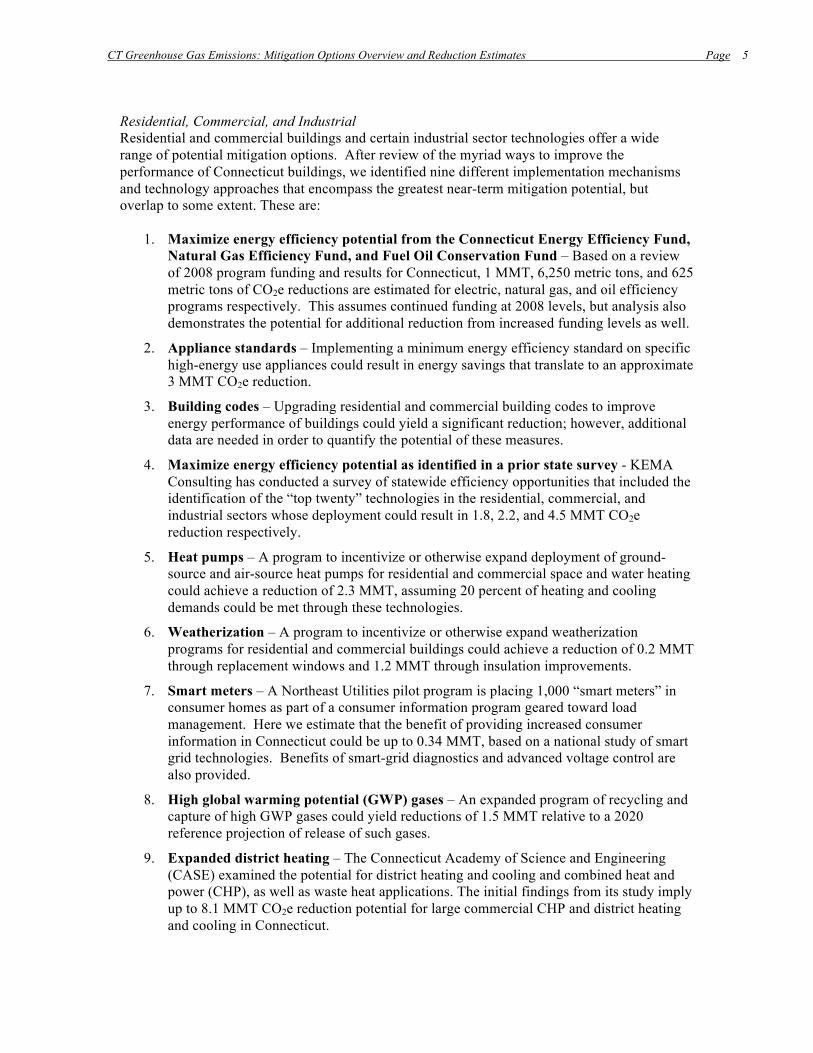
Residential, Commercial, and Industrial Residential and commercial buildings and certain industrial sector technologies offer a wide range of potential mitigation options. After review of the myriad ways to improve the performance of Connecticut buildings, we identified nine different implementation mechanisms and technology approaches that encompass the greatest near-term mitigation potential, but overlap to some extent. These are:
1. Maximize energy efficiency potential from the Connecticut Energy Efficiency Fund, Natural Gas Efficiency Fund, and Fuel Oil Conservation Fund – Based on a review of 2008 program funding and results for Connecticut, 1 MMT, 6,250 metric tons, and 625 metric tons of CO2e reductions are estimated for electric, natural gas, and oil efficiency programs respectively. This assumes continued funding at 2008 levels, but analysis also demonstrates the potential for additional reduction from increased funding levels as well.
2. Appliance standards – Implementing a minimum energy efficiency standard on specific high-energy use appliances could result in energy savings that translate to an approximate 3 MMT CO2e reduction.
3. Building codes – Upgrading residential and commercial building codes to improve energy performance of buildings could yield a significant reduction; however, additional data are needed in order to quantify the potential of these measures.
4. Maximize energy efficiency potential as identified in a prior state survey - KEMA Consulting has conducted a survey of statewide efficiency opportunities that included the identification of the “top twenty” technologies in the residential, commercial, and industrial sectors whose deployment could result in 1.8, 2.2, and 4.5 MMT CO2e reduction respectively.
5. Heat pumps – A program to incentivize or otherwise expand deployment of ground-source and air-source heat pumps for residential and commercial space and water heating could achieve a reduction of 2.3 MMT, assuming 20 percent of heating and cooling demands could be met through these technologies.
6. Weatherization – A program to incentivize or otherwise expand weatherization programs for residential and commercial buildings could achieve a reduction of 0.2 MMT through replacement windows and 1.2 MMT through insulation improvements.
7. Smart meters – A Northeast Utilities pilot program is placing 1,000 “smart meters” in consumer homes as part of a consumer information program geared toward load management. Here we estimate that the benefit of providing increased consumer information in Connecticut could be up to 0.34 MMT, based on a national study of smart grid technologies. Benefits of smart-grid diagnostics and advanced voltage control are also provided.
8. High global warming potential (GWP) gases – An expanded program of recycling and capture of high GWP gases could yield reductions of 1.5 MMT relative to a 2020 reference projection of release of such gases.
9. Expanded district heating – The Connecticut Academy of Science and Engineering (CASE) examined the potential for district heating and cooling and combined heat and power (CHP), as well as waste heat applications. The initial findings from its study imply up to 8.1 MMT CO2e reduction potential for large commercial CHP and district heating and cooling in Connecticut.
CT Greenhouse Gas Emissions: Mitigation Options Overview and Reduction Estimates Page
6
Waste, Land-use Change, Forestry, and Agriculture While these categories span a wide range of potential measures, only two items lend themselves to near-term action and quantification. These are:
1. Implementation of the State’s Solid Waste Management Plan – Action steps identified in the CT DEP’s 2006 Solid Waste Management Plan would result in diversion of 58 percent of the state’s solid waste by 2024 and reduce GHG emissions by approximately 1.6 MMT CO2e relative to a reference case.
2. Conserve and enhance carbon sequestration levels in Connecticut’s forests and fields – Improved management of Connecticut’s agricultural lands and open spaces can significantly reduce land-use associated emissions as well as potentially offset emissions through the creation of new terrestrial carbon sinks. Large uncertainties in the emissions estimation methodology for this sector complicate the quantification of reduction potential. A potential of up to 0.046 MMT CO2e could be reduced cumulatively (over the lifetime of the forest stand) through restocking some of Connecticut’s forested lands and CT DEP and Department of Agriculture conservation programs may offer a first step toward realizing some of this potential.
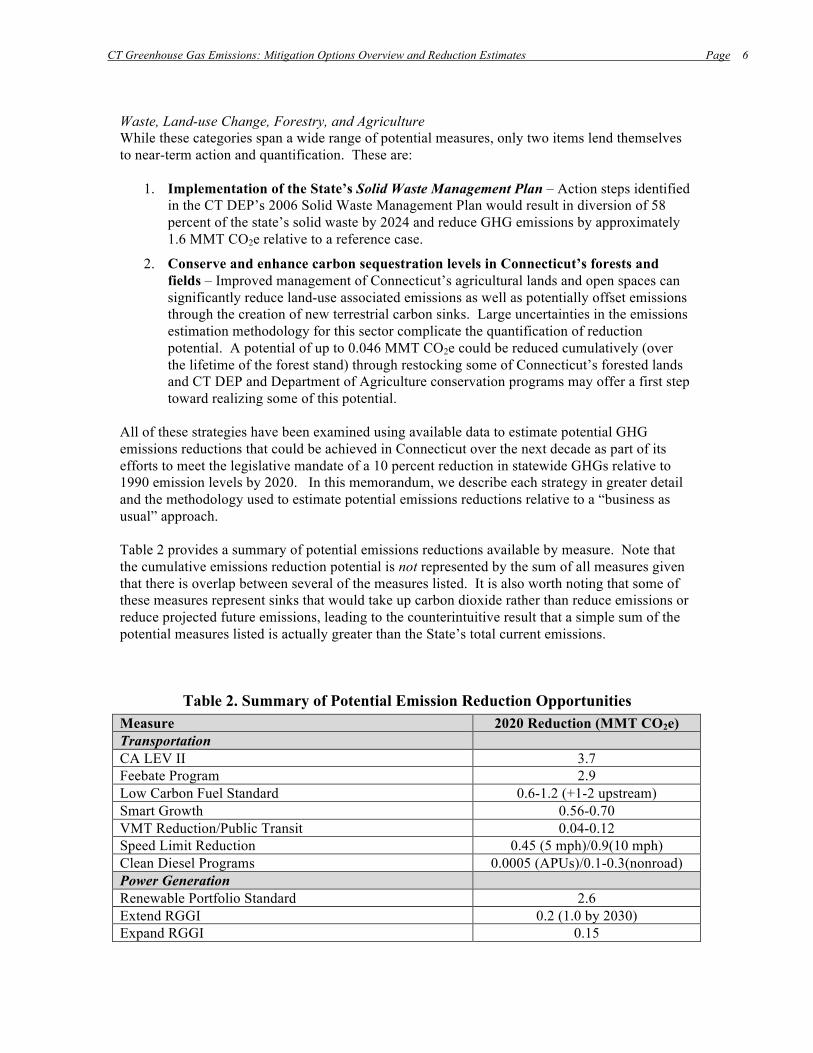
All of these strategies have been examined using available data to estimate potential GHG emissions reductions that could be achieved in Connecticut over the next decade as part of its efforts to meet the legislative mandate of a 10 percent reduction in statewide GHGs relative to 1990 emission levels by 2020. In this memorandum, we describe each strategy in greater detail and the methodology used to estimate potential emissions reductions relative to a “business as usual” approach. Table 2 provides a summary of potential emissions reductions available by measure. Note that the cumulative emissions reduction potential is not represented by the sum of all measures given that there is overlap between several of the measures listed. It is also worth noting that some of these measures represent sinks that would take up carbon dioxide rather than reduce emissions or reduce projected future emissions, leading to the counterintuitive result that a simple sum of the potential measures listed is actually greater than the State’s total current emissions.
Table 2. Summary of Potential Emission Reduction Opportunities Measure 2020 Reduction (MMT CO2e) Transportation CA LEV II 3.7 Feebate Program 2.9 Low Carbon Fuel Standard 0.6-1.2 (+1-2 upstream) Smart Growth 0.56-0.70 VMT Reduction/Public Transit 0.04-0.12 Speed Limit Reduction 0.45 (5 mph)/0.9(10 mph) Clean Diesel Programs 0.0005 (APUs)/0.1-0.3(nonroad) Power Generation Renewable Portfolio Standard 2.6 Extend RGGI 0.2 (1.0 by 2030) Expand RGGI 0.15

CT Greenhouse Gas Emissions: Mitigation Options Overview and Reduction Estimates Page
7
Performance Standard 0 (backstop) Residential, Commercial, Industrial Sectors Conservation Programs 1-2 (electric); 0.006-0.012(gas);
0.001-0.002 (oil) Appliance Standards 3 Building Codes TBD4 “Top 20” efficiency opportunities (Residential, Commercial, Industrial)
1.8 (R), 2.2(C), 4.5(I)
Heat Pumps 2.3 Weatherization 0.2(windows)/1.2(insulation) Smart Meters 0.34 High GWP gas collection 1.5 District Heating 8.1 Waste/Land-Use Solid Waste Management Plan 1.6 Fields and Forests 0.046 (cumulative, not annual) Notes:
1. Total reduction potential is not additive. Several of the measures listed may overlap to a certain extent (e.g., incentive programs for efficient technologies versus the technologies themselves).
2. Some categories list reduction potentials that are greater than the current sector emissions (e.g., terrestrial sequestration offers a carbon sink and could reduce atmospheric carbon levels below current emissions from this sector; high GWP gas emissions such as CFC replacements are low at present, but projected to increase by 2020 when programs could reduce emissions relative to future projections).
3. These are preliminary estimates of reduction potential and many of the technical analyses should be further refined to better reflect current Connecticut-specific circumstances.
4. Additional data is sought during the public comment period on general estimates of residential and commercial building and renovation activity. These data are needed to determine potential GHG benefits attributable to improved building codes.
1.5. Next Steps This document is drafted in response to the GWSA, which requires CT DEP, not later than July 1, 2010, to publish results of modeling scenarios concerning GHG emissions, including, but not limited to, an evaluation of the potential economic and environmental benefits and opportunities for economic growth based on such scenarios. At the same time NESCAUM developed this report, extensive energy sector analysis was being developed by Electric Distribution Companies (EDCs) in support of the Integrated Resource Plan (IRP). The IRP is a legislatively mandated energy planning process whereby the two largest EDCs in Connecticut jointly produce a plan which projects the electric energy resources required by the state over 3, 5 and 10 year planning horizons. The IRP planning process is supported by extensive energy system modeling and scenario analysis. The process also includes opportunities for public review and comment by the Connecticut Energy Advisory Board (CEAB) and then the Connecticut Department of Public Utility Control (CTDPUC). It would be an inefficient use of resources to duplicate the IRP modeling effort in this document; as such additional analysis will be completed upon finalization of the IRP. This document, therefore, represents the first step towards meeting this requirement and the subsequent requirement of developing a recommended list of strategies by July 1, 2011. The Stakeholder review and comment process will also be used to solicit additional data and information that will enable additional scenario analyses to be conducted as part of the recommendations due July 1, 2011.

CT Greenhouse Gas Emissions: Mitigation Options Overview and Reduction Estimates Page
8
The planning process to implement Public Act 08-98, An Act Concerning Connecticut Global Warming Solutions (GWSA) is:
• Identify mandated emission reduction targets (see 2009 Connecticut Greenhouse Gas Inventory);
• Identify potential emission reduction strategies that can meet these targets (this report - July 2010 effort identifying emission reductions achievable by 20201);
• Analyze select GHG emission reduction strategies (including economic analyses mandated under July 2010 requirement) and, after an opportunity for public comment, make recommendations on strategies that will achieve the GHG emission levels specified in GWSA (July 2011);
• Report to the Connecticut General Assembly committees on transportation, energy and the environment by Jan 1, 2012 and every three years thereafter, on the quantifiable emissions reductions achieved; a schedule of proposed regulations, policies and strategies designed to achieve mandated GHG limits; and an assessment of the latest scientific information and relevant data regarding global climate change and the status of GHG reduction efforts in other states and countries.
• Not later than July 1, 2012, and every three years thereafter, develop, with an opportunity for public comment, a schedule of recommended regulatory actions by relevant agencies, policies and other actions necessary to show reasonable further progress towards achieving the GHG emission levels specified in GWSA.
• Upon completion of 2020 plan, restart process for 2050 plan. This report represents technical support for the second step in the outlined process and will serve as a basis for collecting stakeholder feedback, additional technical information, and policy recommendations for subsequent scenario analysis prior to developing strategy recommendations. The CT DEP will publish a schedule for review and comment on this document and instructions for how to provide additional input to this process through the Governors’ Steering Committee on Climate Change website. See www.ctclimatechange.com or www.ct.gov/dep/climatechange. The following technical analyses provide greater detail on the individual measures being considered to date and the methodology for quantifying the GHG emission reduction potential for each.
1 Due to numerous policy uncertainties, a discussion and analysis of strategies intended to meet longer term (i.e., 2050) GHG reduction targets should precede the recommendation of strategies to meet 2020 targets as the strategies ultimately selected to meet the 2020 target will greatly affect the emission reduction planning requirements for the 2050 target.
CT Greenhouse Gas Emissions: Mitigation Options Overview and Reduction Estimates Page
9
2. TECHNICAL ANALYSES
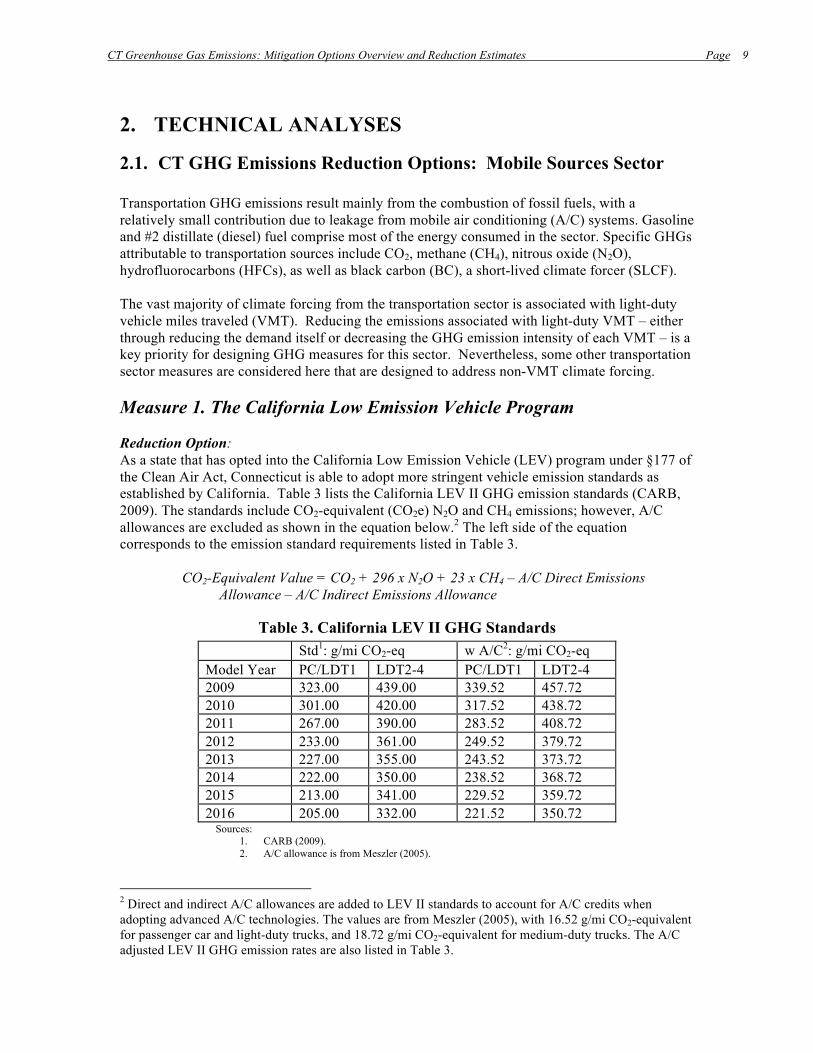
2.1. CT GHG Emissions Reduction Options: Mobile Sources Sector Transportation GHG emissions result mainly from the combustion of fossil fuels, with a relatively small contribution due to leakage from mobile air conditioning (A/C) systems. Gasoline and #2 distillate (diesel) fuel comprise most of the energy consumed in the sector. Specific GHGs attributable to transportation sources include CO2, methane (CH4), nitrous oxide (N2O), hydrofluorocarbons (HFCs), as well as black carbon (BC), a short-lived climate forcer (SLCF). The vast majority of climate forcing from the transportation sector is associated with light-duty vehicle miles traveled (VMT). Reducing the emissions associated with light-duty VMT – either through reducing the demand itself or decreasing the GHG emission intensity of each VMT – is a key priority for designing GHG measures for this sector. Nevertheless, some other transportation sector measures are considered here that are designed to address non-VMT climate forcing. Measure 1. The California Low Emission Vehicle Program Reduction Option: As a state that has opted into the California Low Emission Vehicle (LEV) program under §177 of the Clean Air Act, Connecticut is able to adopt more stringent vehicle emission standards as established by California. Table 3 lists the California LEV II GHG emission standards (CARB, 2009). The standards include CO2-equivalent (CO2e) N2O and CH4 emissions; however, A/C allowances are excluded as shown in the equation below.2 The left side of the equation corresponds to the emission standard requirements listed in Table 3.
CO2-Equivalent Value = CO2 + 296 x N2O + 23 x CH4 – A/C Direct Emissions Allowance – A/C Indirect Emissions Allowance
Table 3. California LEV II GHG Standards Std1: g/mi CO2-eq w A/C2: g/mi CO2-eq Model Year PC/LDT1 LDT2-4 PC/LDT1 LDT2-4 2009 323.00 439.00 339.52 457.72 2010 301.00 420.00 317.52 438.72 2011 267.00 390.00 283.52 408.72 2012 233.00 361.00 249.52 379.72 2013 227.00 355.00 243.52 373.72 2014 222.00 350.00 238.52 368.72 2015 213.00 341.00 229.52 359.72 2016 205.00 332.00 221.52 350.72
Sources: 1. CARB (2009). 2. A/C allowance is from Meszler (2005).
2 Direct and indirect A/C allowances are added to LEV II standards to account for A/C credits when adopting advanced A/C technologies. The values are from Meszler (2005), with 16.52 g/mi CO2-equivalent for passenger car and light-duty trucks, and 18.72 g/mi CO2-equivalent for medium-duty trucks. The A/C adjusted LEV II GHG emission rates are also listed in Table 3.

CT Greenhouse Gas Emissions: Mitigation Options Overview and Reduction Estimates Page
10
Connecticut’s adoption of the current LEV program along with potential extensions of this program in the future (a LEV III standard) represent significant GHG emission reduction opportunities, as quantified below. Technical Approach: In order to analyze the emission reduction benefits of adopting current – and potential future – CA LEV emission standards, the U.S. Environmental Protection Agency (U.S. EPA) Motor Vehicle Emission Simulator 2010 model (MOVES2010) was used with the default MOVES2010 input database (U.S. EPA, 2009a). This model tracks GHG emissions that include CO2, CH4, and N2O, with CH4 and N2O converted to their CO2-equivalent amounts. The GHG-emitting processes include running, start, and extended idle, with the latter coming from combination long-haul trucks only. The analysis in this report focuses on running exhaust because this is an area to which the regulations and policies apply. The LEV II GHG emission standards listed in Table 3 have already been adjusted to reflect in-use vehicle emission rates by assuming the LEV standard CO2 emissions are 85 percent of the in-use rates (Meszler, 2005). This allows for a direct comparison with reference case emissions estimates generated by MOVES.3 This adjustment is applied only to CO2 emissions, making the assumption that the CH4, N2O, and A/C allowances are not subject to in-use differences relative
3 On April 1, 2010, EPA and NHTSA announced a joint final rule establishing a national program that will dramatically reduce greenhouse gas emissions and improve fuel economy for new cars and trucks sold in the United States. Under this national program, automobile manufacturers will be able to build a single light-duty national fleet that satisfies all requirements under both the national program and the standards of California and other states, while ensuring that consumers still have a full range of vehicle choices. As announced by President Obama on May 21, 2010, EPA and NHTSA will now begin working on a second-phase joint rulemaking to establish national standards for light-duty vehicles for model years 2017 and beyond. As a result of the April 2010 final rule, nationwide light duty vehicle GHG emissions will be very close to emissions in CA LEV states. As a result, EPA will need to adjust its assumptions in MOVES to reflect the fact that the light duty GHG emissions in the federal program will be comparable with CA LEV states.
Figure 1. Baseline GHG emissions and VMT projections for light-duty and total onroad mobile source fleet in Connecticut.

CT Greenhouse Gas Emissions: Mitigation Options Overview and Reduction Estimates Page
11
to the standard. In addition to the LEV II GHG emission standard, additional reductions are quantified based on a potential LEV III GHG emission standard extending beyond 2016, by assuming that CO2 emission rates for LDVs are reduced 4 percent per year between 2016 and 2022, and then held constant from 2022 to 2050. Figure 1 plots the MOVES-projected GHG emissions and VMT for 13 vehicle types and for LDVs (with MOVES source type ID 21, 31, and 32), respectively. The emissions are listed in millions of metric tons (MMT), the convention used throughout this report. Baseline GHG emission increases are driven primarily by projected VMT increase over time.4 Figure 1 also demonstrates that LDVs comprise the majority of the Connecticut on-road fleet. Figure 2 plots the GHG emissions of LDVs for both the reference case and the CA LEV program as implemented in Connecticut per the emission standards listed in Table 3, with a potential extension between 2016 and 2022. The policy case was simulated by replacing the values in the MOVES reference case with new LDV emission factors for the regulated model years.
Potential Emissions Reductions: As demonstrated in Figure 2, the GHG emission reductions accumulate steadily after the adoption of LEV standards in 2009. The reduction is ~2 MMT in 2016, the end of the LEV II program. It 4 The impact of direct A/C emissions on MOVES baseline emissions is analyzed because they are not accounted for in MOVES energy consumption (U.S. EPA, 2005; Meszler, 2005). By applying a flat A/C direct emission of 8.84 g/mi CO2-equivalent to all vehicle types and model years, MOVES baseline GHG emissions are increased ~1.7% for each calendar year. However, due to the lack of more accurate data, the MOVES baseline emissions are not adjusted for A/C direct emission in this report. The implication is that the GHG emission reduction of control cases with direct A/C emission allowance is a little lower than it could be if the reference case was also adjusted for direct A/C emission.
Figure 2. Baseline and LEV II GHG emissions projections for CT LDV fleet.

CT Greenhouse Gas Emissions: Mitigation Options Overview and Reduction Estimates Page
12
reaches nearly 3.7 MMT by 2020 and more than 11.5 MMT per year in 2050. In percentage terms, LDV GHG emissions are reduced approximately 25 percent in 2020 relative to the baseline emissions assumption. 2. Light-Duty Feebate Program Reduction Option: A “feebate” program consists of two distinct parts – a fee, or excise tax, imposed on new purchases of relatively inefficient vehicles and a complementary rebate provided to purchasers of relatively efficient vehicles – that work together to incentivize the purchase of new efficient vehicles within a state. Technical Approach: The California Air Resources Board (CARB) has previously conducted an analysis of the emissions benefits of a feebate program in both the State of California as well as all other §177 states (CARB, 2010). One product of this analysis was a set of emission factor differentials (i.e., the difference between CARB “reference” emission factors and CARB “feebate” emission factors for §177 states). These differentials have been applied to the MOVES reference emission factors for the Connecticut light-duty fleet in order to derive emissions reduction estimates under a feebate program.
Table 4. CO2 Emission Rates for Three Different Feebate Programs (g/mi) Model Year CA footprint §177 footprint U.S. footprint
2011 291.80 288.18 284.09 2012 282.01 273.02 264.24 2013 268.77 260.53 249.66 2014 262.91 253.58 240.69 2015 257.68 248.38 234.66 2016 248.63 241.94 227.23 2017 240.26 232.73 215.84 2018 238.93 231.37 214.48 2019 237.65 230.66 213.94 2020 232.98 228.78 212.61 2021 226.96 225.36 210.81 2022 223.79 223.35 209.86 2023 220.10 220.39 208.98 2024 215.50 215.37 207.01 2025 211.01 211.13 205.61
Sources: B. Chen, CARB (personal communication). Table 4 lists the California feebate CO2 emission rates (B. Chen, CARB, personal communication). The CARB analysis includes both manufacturers’ response and changes in consumer behavior, but only the consumer behavior response is included here as no vehicle redesign is anticipated from a Connecticut-only program. The emission rates do not include N2O and CH4 emissions, while A/C emissions are included (CARB, 2010). Three feebate scenarios were analyzed, each with a different geographic coverage listed by column in Table 4. Specifically, the California footprint covers California only, the U.S. footprint covers the entire U.S., and the §177 footprint includes all U.S. states that have opted into the CA LEV program.
CT Greenhouse Gas Emissions: Mitigation Options Overview and Reduction Estimates Page
13
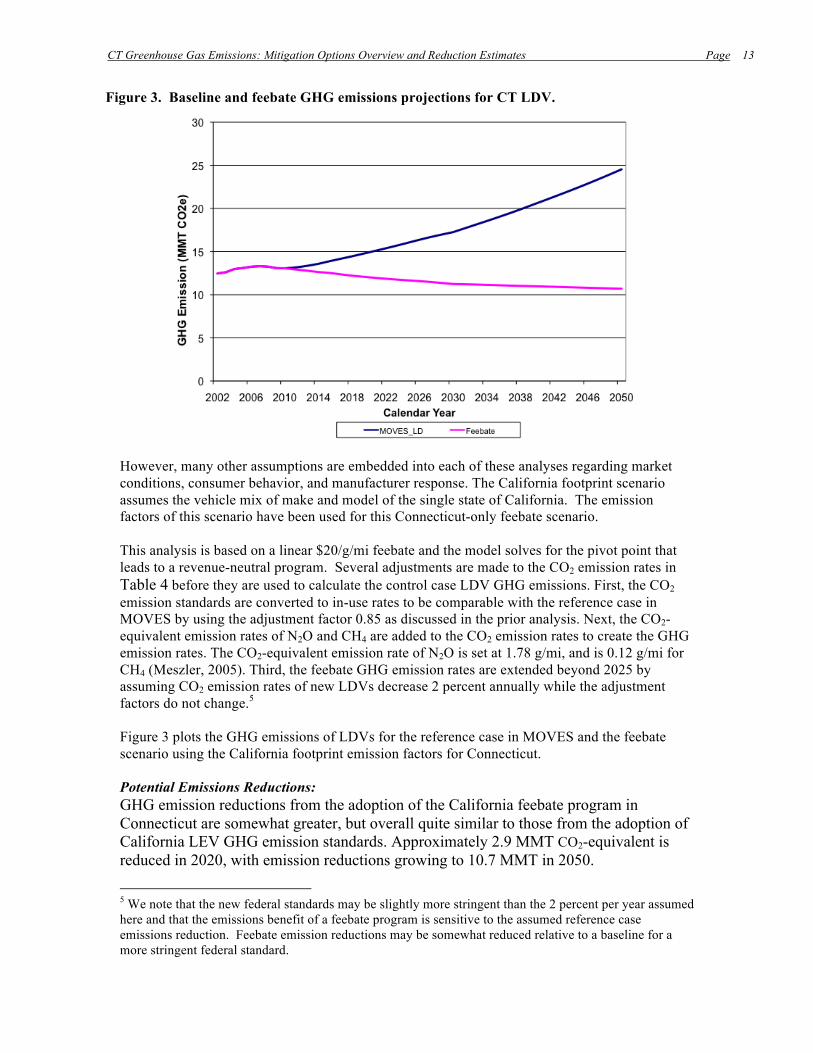
However, many other assumptions are embedded into each of these analyses regarding market conditions, consumer behavior, and manufacturer response. The California footprint scenario assumes the vehicle mix of make and model of the single state of California. The emission factors of this scenario have been used for this Connecticut-only feebate scenario. This analysis is based on a linear $20/g/mi feebate and the model solves for the pivot point that leads to a revenue-neutral program. Several adjustments are made to the CO2 emission rates in Table 4 before they are used to calculate the control case LDV GHG emissions. First, the CO2 emission standards are converted to in-use rates to be comparable with the reference case in MOVES by using the adjustment factor 0.85 as discussed in the prior analysis. Next, the CO2-equivalent emission rates of N2O and CH4 are added to the CO2 emission rates to create the GHG emission rates. The CO2-equivalent emission rate of N2O is set at 1.78 g/mi, and is 0.12 g/mi for CH4 (Meszler, 2005). Third, the feebate GHG emission rates are extended beyond 2025 by assuming CO2 emission rates of new LDVs decrease 2 percent annually while the adjustment factors do not change.5 Figure 3 plots the GHG emissions of LDVs for the reference case in MOVES and the feebate scenario using the California footprint emission factors for Connecticut. Potential Emissions Reductions: GHG emission reductions from the adoption of the California feebate program in Connecticut are somewhat greater, but overall quite similar to those from the adoption of California LEV GHG emission standards. Approximately 2.9 MMT CO2-equivalent is reduced in 2020, with emission reductions growing to 10.7 MMT in 2050.
5 We note that the new federal standards may be slightly more stringent than the 2 percent per year assumed here and that the emissions benefit of a feebate program is sensitive to the assumed reference case emissions reduction. Feebate emission reductions may be somewhat reduced relative to a baseline for a more stringent federal standard.
Figure 3. Baseline and feebate GHG emissions projections for CT LDV.

CT Greenhouse Gas Emissions: Mitigation Options Overview and Reduction Estimates Page
14
3. Low Carbon Fuels Program Reduction Option: Connecticut is 1 of 11 Northeast and Mid-Atlantic states are exploring a low carbon fuel standard (LCFS). An LCFS is a strategy to reduce the carbon intensity of the lifecycle emissions associated with gasoline and diesel used for transportation. The program envisions the replacement of petroleum-based fuels with fuels that have low lifecycle carbon emissions, such as advanced biofuels, biodiesel, compressed natural gas (CNG), and electricity for electric vehicles. California has an executively mandated LCFS with a reduction requirement of 10 percent by 2020. A number of compliance targets and timelines are currently being analyzed by the northeast/mid-Atlantic states, so for the purposes of this analysis, a 10 percent reduction over 10 years (2012-2022) will be assumed. Technical Approach: An LCFS addresses the lifecycle emissions of fuels, including feedstock production and transport, fuel production and distribution, and tailpipe emissions. A 10 percent reduction target refers to a 10 percent reduction in GHGs across the lifecycle of the fuel. For the purposes of this analysis, we provide the emissions reductions associated with Connecticut’s participation in the program based on a 10 percent reduction in 2007 fuel use as reported by the Energy Information Administration.6 The tailpipe emissions associated with a 10 percent reduction in lifecycle emissions are assumed to occur within Connecticut and are calculated using GREET model estimates of carbon intensity for each potential fuel type (Table 5). The GREET model is being used to determine life cycle carbon intensities for the LCFS program (U.S. DOE, 2010). There are several ways to reduce the carbon intensity of transportation fuels, but it should be noted that current discussions envision the LCFS as a performance-based standard designed to be technologically agnostic. Among the options for achieving the target intensity are: a shift to renewable biofuels, the use of CNG vehicles, and greater use of electricity for plug-in electric vehicles. Some combination of these three options is possible, but it is difficult to know the precise balance that will result from an open-ended regulation subject to market implementation.
Table 5. GREET lifecycle carbon intensities for various fuel types.
Notes:
6 Energy Information Administration. 2007 EIA State Energy Outlook: State Energy Consumption Estimates.
Total CI (gCO2e/MJ)
Tailpipe GHG Intensity (gCO2e/MJ)
Power Plant GHG Intensity (gCO2e/MJ)
Upstream GHG Intensity (gCO2e/MJ)
RBOB1 97 75 22 Diesel 94 76 18 CNG 73 58 16 Waste to Gas 0 58 -58 Electricity 38 37 1 Cellulosic Ethanol 39 73 -35 WTE Ethanol2 0 73 -73 FT Diesel3 38 73 -36 WTE Biodiesel4 0 73 -73
CT Greenhouse Gas Emissions: Mitigation Options Overview and Reduction Estimates Page
15
1. RBOB – Reformulated Blendstock for Oxygenate Blending – is the industry term for traditional gasoline.
2. Waste to Energy or WTE Ethanol refers to the production of ethanol from municipal solid waste usually via fermentation processes.
3. FT Diesel refers to Diesel produced through the Fischer-Tropsch process that involves high temperature, high pressure reaction of gaseous hydrocarbons.
4. WTE Biodiesel, like WTE Ethanol, involves the production of biodiesel from municipal solid waste. Unlike ethanol production, biodiesel production is achieved via esterification, a different chemical process.
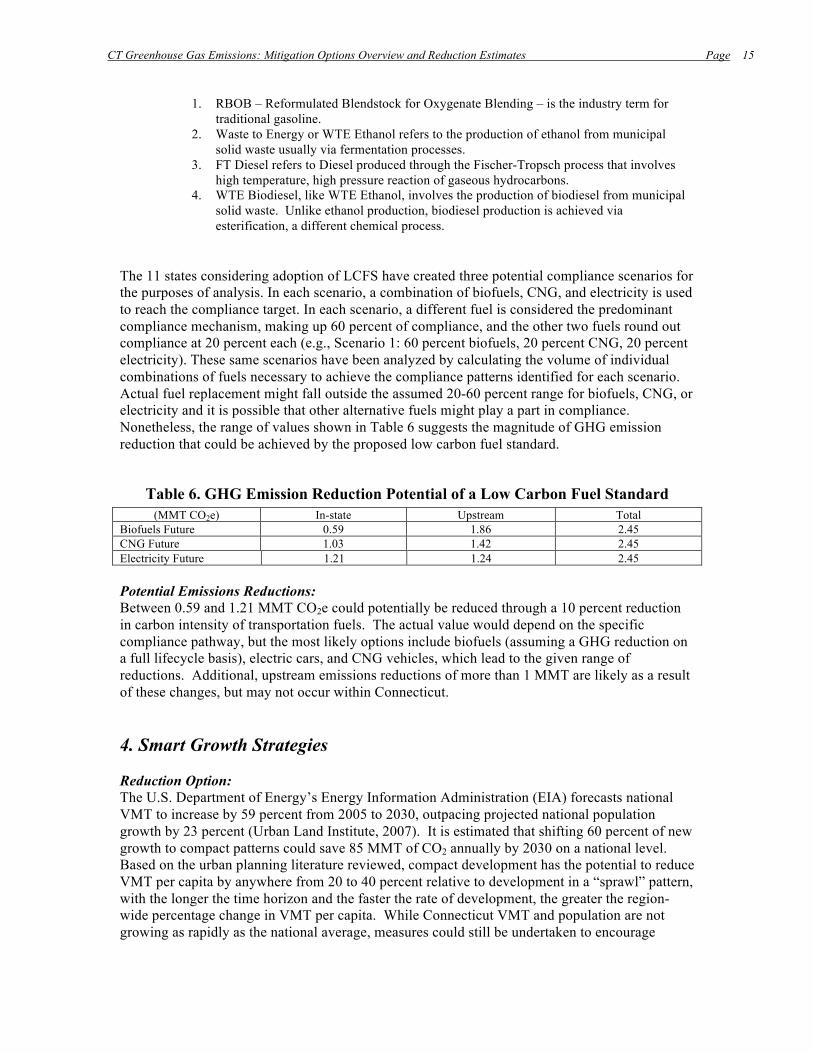
The 11 states considering adoption of LCFS have created three potential compliance scenarios for the purposes of analysis. In each scenario, a combination of biofuels, CNG, and electricity is used to reach the compliance target. In each scenario, a different fuel is considered the predominant compliance mechanism, making up 60 percent of compliance, and the other two fuels round out compliance at 20 percent each (e.g., Scenario 1: 60 percent biofuels, 20 percent CNG, 20 percent electricity). These same scenarios have been analyzed by calculating the volume of individual combinations of fuels necessary to achieve the compliance patterns identified for each scenario. Actual fuel replacement might fall outside the assumed 20-60 percent range for biofuels, CNG, or electricity and it is possible that other alternative fuels might play a part in compliance. Nonetheless, the range of values shown in Table 6 suggests the magnitude of GHG emission reduction that could be achieved by the proposed low carbon fuel standard.
Table 6. GHG Emission Reduction Potential of a Low Carbon Fuel Standard (MMT CO2e) In-state Upstream Total
Biofuels Future 0.59 1.86 2.45 CNG Future 1.03 1.42 2.45 Electricity Future 1.21 1.24 2.45 Potential Emissions Reductions: Between 0.59 and 1.21 MMT CO2e could potentially be reduced through a 10 percent reduction in carbon intensity of transportation fuels. The actual value would depend on the specific compliance pathway, but the most likely options include biofuels (assuming a GHG reduction on a full lifecycle basis), electric cars, and CNG vehicles, which lead to the given range of reductions. Additional, upstream emissions reductions of more than 1 MMT are likely as a result of these changes, but may not occur within Connecticut. 4. Smart Growth Strategies Reduction Option: The U.S. Department of Energy’s Energy Information Administration (EIA) forecasts national VMT to increase by 59 percent from 2005 to 2030, outpacing projected national population growth by 23 percent (Urban Land Institute, 2007). It is estimated that shifting 60 percent of new growth to compact patterns could save 85 MMT of CO2 annually by 2030 on a national level. Based on the urban planning literature reviewed, compact development has the potential to reduce VMT per capita by anywhere from 20 to 40 percent relative to development in a “sprawl” pattern, with the longer the time horizon and the faster the rate of development, the greater the region-wide percentage change in VMT per capita. While Connecticut VMT and population are not growing as rapidly as the national average, measures could still be undertaken to encourage

CT Greenhouse Gas Emissions: Mitigation Options Overview and Reduction Estimates Page
16
compact development over sprawl within Connecticut to achieve a share of these estimated national savings. Technical Approach: NESCAUM conducted a literature search of studies evaluating the potential VMT and GHG reductions that could be achieved through improved land use and smart growth strategies, as well as other non-motorized strategies. This study focuses on one area, increasing population density through compact development, which is seen as the most effective and empirically supported way to achieve desired reductions. Compact development is characterized by medium to high density communities, mixed uses, central development, interconnected streets, and pedestrian- and transit-friendly design. Per capita VMT and thus GHG emissions in densely populated areas are much lower than in “sprawl” areas (Urban Land Institute, 2007). Measures to achieve “smart growth” include: designing compact neighborhoods that incorporate residential, employment, and retail areas; reusing infill sites instead of building on “greenfield” locations; adopting urban growth boundaries; and enacting zoning and planning standards that support increased population densities. A literature review found that compact development could lead to GHG emissions reductions on a national basis of 4 MMT, 13 MMT, and 20 MMT by 2020, depending on the respective level of deployment (see Table 7). The level of deployment with respect to land use and smart growth strategies and other non-motorized strategies is described in Table 8.
Table 7. 2020 Annual Estimated National GHG Reductions by Strategy GHG Reduction Strategy
Expanded Current Practice Deployment GHG Reduction in Year 2020 (MMT)
Aggressive Deployment GHG Reduction in Year 2020 (MMT)
Maximum Deployment GHG Reduction in Year 2020 (MMT)
Land Use and Smart Growth Strategies/Non-Motorized Transportation Strategies Combined Land Use 1 7 12 Combined Pedestrian 2 5 6 Combined Bicycle 1 1 2 TOTAL 4 13 20
Source: Urban Land Institute (2007). Table 8 explains the various compact development strategies that could be implemented at three levels of deployment. The values in Table 7 correspond to the level of implementation of the strategies described in Table 8.
Table 8. GHG Emission Reduction Strategies at Three Deployment Levels GHG Reduction Strategy
A. Expanded Current Practice
B. More Aggressive C. Maximum Effort
Land Use and Smart Growth Strategies Combined Land Use Strategies
At least 43% of new urban development in compact, pedestrian- and bicycle-friendly neighborhoods with high quality transit.
At least 64% of new urban development in neighborhoods as described in Level A.
At least 90% of new urban development in neighborhoods as described in Level A.
CT Greenhouse Gas Emissions: Mitigation Options Overview and Reduction Estimates Page
17
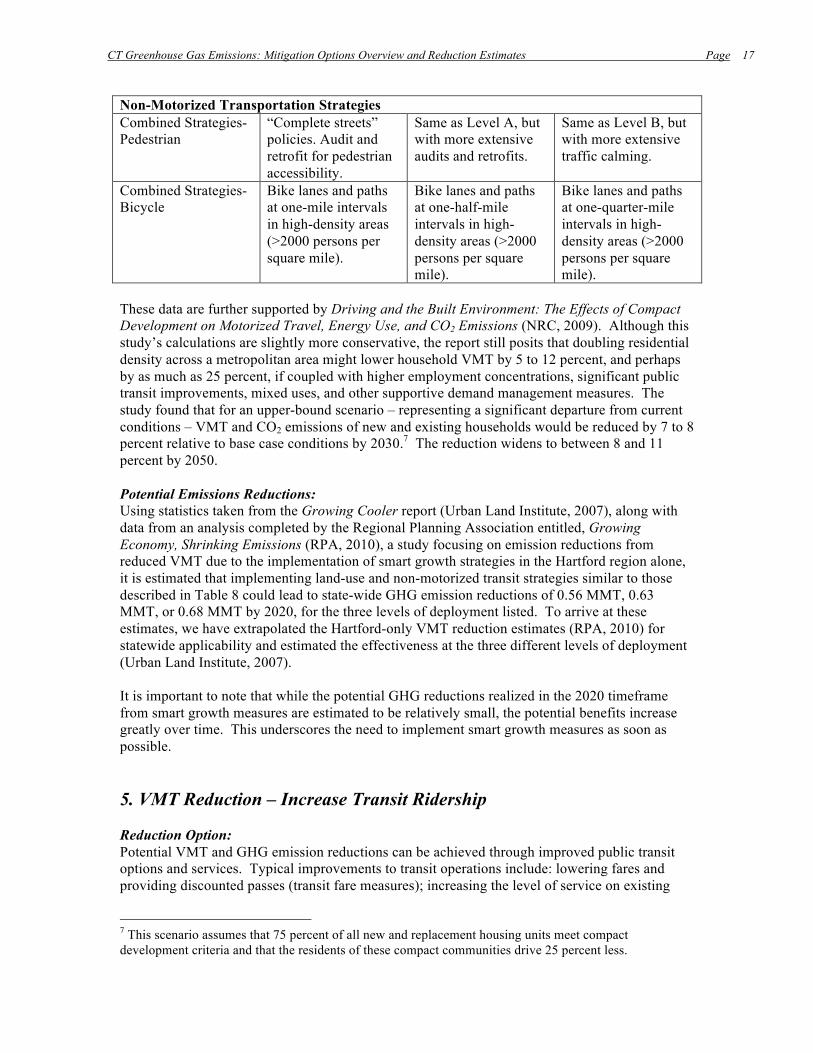
Non-Motorized Transportation Strategies Combined Strategies-Pedestrian
“Complete streets” policies. Audit and retrofit for pedestrian accessibility.
Same as Level A, but with more extensive audits and retrofits.
Same as Level B, but with more extensive traffic calming.
Combined Strategies-Bicycle
Bike lanes and paths at one-mile intervals in high-density areas (>2000 persons per square mile).
Bike lanes and paths at one-half-mile intervals in high-density areas (>2000 persons per square mile).
Bike lanes and paths at one-quarter-mile intervals in high-density areas (>2000 persons per square mile).
These data are further supported by Driving and the Built Environment: The Effects of Compact Development on Motorized Travel, Energy Use, and CO2 Emissions (NRC, 2009). Although this study’s calculations are slightly more conservative, the report still posits that doubling residential density across a metropolitan area might lower household VMT by 5 to 12 percent, and perhaps by as much as 25 percent, if coupled with higher employment concentrations, significant public transit improvements, mixed uses, and other supportive demand management measures. The study found that for an upper-bound scenario – representing a significant departure from current conditions – VMT and CO2 emissions of new and existing households would be reduced by 7 to 8 percent relative to base case conditions by 2030.7 The reduction widens to between 8 and 11 percent by 2050. Potential Emissions Reductions: Using statistics taken from the Growing Cooler report (Urban Land Institute, 2007), along with data from an analysis completed by the Regional Planning Association entitled, Growing Economy, Shrinking Emissions (RPA, 2010), a study focusing on emission reductions from reduced VMT due to the implementation of smart growth strategies in the Hartford region alone, it is estimated that implementing land-use and non-motorized transit strategies similar to those described in Table 8 could lead to state-wide GHG emission reductions of 0.56 MMT, 0.63 MMT, or 0.68 MMT by 2020, for the three levels of deployment listed. To arrive at these estimates, we have extrapolated the Hartford-only VMT reduction estimates (RPA, 2010) for statewide applicability and estimated the effectiveness at the three different levels of deployment (Urban Land Institute, 2007). It is important to note that while the potential GHG reductions realized in the 2020 timeframe from smart growth measures are estimated to be relatively small, the potential benefits increase greatly over time. This underscores the need to implement smart growth measures as soon as possible. 5. VMT Reduction – Increase Transit Ridership Reduction Option: Potential VMT and GHG emission reductions can be achieved through improved public transit options and services. Typical improvements to transit operations include: lowering fares and providing discounted passes (transit fare measures); increasing the level of service on existing
7 This scenario assumes that 75 percent of all new and replacement housing units meet compact development criteria and that the residents of these compact communities drive 25 percent less.
CT Greenhouse Gas Emissions: Mitigation Options Overview and Reduction Estimates Page
18
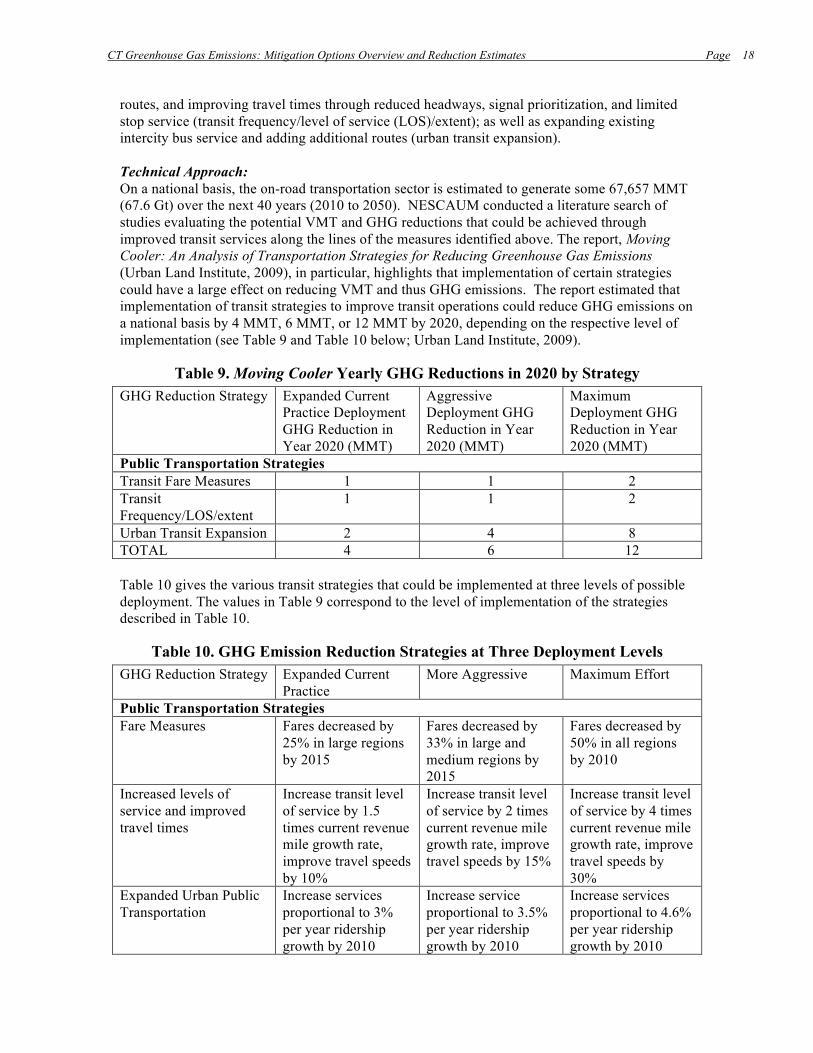
routes, and improving travel times through reduced headways, signal prioritization, and limited stop service (transit frequency/level of service (LOS)/extent); as well as expanding existing intercity bus service and adding additional routes (urban transit expansion). Technical Approach: On a national basis, the on-road transportation sector is estimated to generate some 67,657 MMT (67.6 Gt) over the next 40 years (2010 to 2050). NESCAUM conducted a literature search of studies evaluating the potential VMT and GHG reductions that could be achieved through improved transit services along the lines of the measures identified above. The report, Moving Cooler: An Analysis of Transportation Strategies for Reducing Greenhouse Gas Emissions (Urban Land Institute, 2009), in particular, highlights that implementation of certain strategies could have a large effect on reducing VMT and thus GHG emissions. The report estimated that implementation of transit strategies to improve transit operations could reduce GHG emissions on a national basis by 4 MMT, 6 MMT, or 12 MMT by 2020, depending on the respective level of implementation (see Table 9 and Table 10 below; Urban Land Institute, 2009).
Table 9. Moving Cooler Yearly GHG Reductions in 2020 by Strategy GHG Reduction Strategy Expanded Current
Practice Deployment GHG Reduction in Year 2020 (MMT)
Aggressive Deployment GHG Reduction in Year 2020 (MMT)
Maximum Deployment GHG Reduction in Year 2020 (MMT)
Public Transportation Strategies Transit Fare Measures 1 1 2 Transit Frequency/LOS/extent
1 1 2
Urban Transit Expansion 2 4 8 TOTAL 4 6 12 Table 10 gives the various transit strategies that could be implemented at three levels of possible deployment. The values in Table 9 correspond to the level of implementation of the strategies described in Table 10.
Table 10. GHG Emission Reduction Strategies at Three Deployment Levels GHG Reduction Strategy Expanded Current
Practice More Aggressive Maximum Effort
Public Transportation Strategies Fare Measures Fares decreased by
25% in large regions by 2015
Fares decreased by 33% in large and medium regions by 2015
Fares decreased by 50% in all regions by 2010
Increased levels of service and improved travel times
Increase transit level of service by 1.5 times current revenue mile growth rate, improve travel speeds by 10%
Increase transit level of service by 2 times current revenue mile growth rate, improve travel speeds by 15%
Increase transit level of service by 4 times current revenue mile growth rate, improve travel speeds by 30%
Expanded Urban Public Transportation
Increase services proportional to 3% per year ridership growth by 2010
Increase service proportional to 3.5% per year ridership growth by 2010
Increase services proportional to 4.6% per year ridership growth by 2010

CT Greenhouse Gas Emissions: Mitigation Options Overview and Reduction Estimates Page
19
Using the national level analysis contained in the report, NESCAUM has estimated the potential GHG reductions in Connecticut from implementing some of these strategies. The report finds that with capital investment in transit projects such as urban transit expansion, GHGs could be reduced by up to 1.1 percent from the study’s baseline emissions.8 Moreover, less capital intensive service expansion (e.g., increased frequency and level of service) would achieve more modest GHG reductions, at a relatively lower cost of implementation (Urban Land Institute, 2009). The Moving Cooler study is supported by a report entitled, Increasing Transit Ridership: Lessons from the Most Successful Transit Systems in the 1990s (Mineta Transportation Institute, 2002). This study analyzed 180 transit systems nationally to determine the effect that fare prices and levels of service have on ridership. The study found a correlation between reducing bus fares and increases in transit ridership, as well as a correlation between improving bus service and increases in transit ridership. With regard to bus fares, agencies at which the inflation-adjusted fare decreased by more than 5 percent saw ridership climb by 23.3 percent. With regard to improvements in bus service, the study found that, in general, when service frequency and coverage increased so did ridership. Among the 227 transit systems studied, only 17 percent of the transit systems that saw ridership increases had decreased service levels. As a result of this study it is evident that transit fare measures, increases in transit frequency/LOS/extent, and expansion of urban transit can all contribute as significant factors in increasing transit ridership and reducing VMT. Potential Emissions Reductions: By interpolating the Moving Cooler data for Connecticut, which constitutes approximately 1 percent of the national population (U.S. Census Bureau, 2006), it is estimated that implementing transit strategies similar to those described in Table 10 could lead to GHG emission reductions of 0.04 MMT, 0.06 MMT, or 0.12 MMT by 2020, roughly 1 percent of the national totals. 6. Speed Limits Reduction Option: Reducing highway speed limits is expected to improve the fuel efficiency of highway travel for that fraction of on-road highway VMT that would exceed proposed future speed limits. This is due to the geometric increase in frictional drag forces at highway speeds. Here, we analyze the potential GHG reductions associated with a reduction of Connecticut highway speed limits from 65 mph to 60 and 55 mph, respectively. Technical Approach: The 55 mph national speed limit was introduced on January 1, 1974 in response to the Arab oil embargo and subsequent energy crisis (U.S. EPA, 1995). In 1987, this was modified to allow increases up to 65 mph. The federal speed limits of 55/65 mph were eliminated in 1995. Many states have increased speed limits on limited-access highways since 1995.
8 The Moving Cooler baseline is based on an annual rate of vehicle and fuel technological change, consistent with forecasts of the U.S. Department of Transportation’s examination of alternative Corporate Average Fuel Economy (CAFE) limits. This baseline shows that innovations in vehicle and fuel technology will have a substantial impact on GHGs, but that these gains will largely be offset by increases in travel along with growth in the U.S. population. Consequently, the Moving Cooler baseline shows GHG emission remaining roughly at 2005 levels through 2050.

CT Greenhouse Gas Emissions: Mitigation Options Overview and Reduction Estimates Page
20
The impact of speed limits on air quality was assessed prior to the elimination of federal speed limits in 1995 (U.S. EPA, 1995; 1996; 1997). The 1995 U.S. EPA analysis indicated that carbon emissions would increase by 6-15 MMT CO2e per year on a national basis; however, there are considerable uncertainties in this estimate. In 1996, the U.S. EPA suggested that the “real-world” impact of eliminating the national speed limit will depend in large part on the actual increase in average traffic speeds on affected roadways, which is very difficult to estimate. In addition, the optimal fuel economy is different among vehicle types. This analysis uses prior U.S. EPA studies on the impact of speed limit increases to perform the reverse calculation (i.e. the impact of speed limit reductions) on GHG emissions. Only highway VMT (both light-duty as well as heavy-duty) is expected to be affected by these speed limit reductions.9 The highway GHG emissions are approximately 44 percent of total on-road transportation emissions in Connecticut, and have been relatively constant over the years as illustrated in Figure 4. Two separate national studies explore the relationship between emissions and speed limits (U.S. EPA, 2009a; Urban Land Institute, 2009). Based on these studies, we estimate an emission rate increase of 5 percent (of total highway emissions) for a 5 mph speed limit increase and 10 percent increase for a speed limit increase of 10 mph. These estimated rates are used to calculate GHG reduction of 5 percent of highway emissions for a reduction from 65 mph to 60 mph, and an additional 5 percent for a reduction from 60 mph to 55 mph. Potential Emissions Reductions: The corresponding GHG emission reductions within Connecticut are 0.45 MMT and 0.9 MMT in 2020 for a speed limit reduction of 5 mph and 10 mph, respectively.
9 It is possible that the average emission factor variation resulting from a simulated speed limit change will be different than estimates derived by EPA MOBILE or MOVES models due to the cycle-based emission factors in MOBILE (and MOVES), which include accelerations and decelerations. Also, each cycle includes some travel at speeds from zero to well above the average speed of that cycle.

CT Greenhouse Gas Emissions: Mitigation Options Overview and Reduction Estimates Page
21
7. Clean Diesels Reduction Options: Idle reduction (IR) measures for highway trucks could reduce both fuel consumption and black carbon (BC) emissions. Typical long-haul trucks idle between 4 and 8 hours per day to power cabin-comfort accessories (heating, cooling, lighting, etc.) while the driver is off-duty. Most of these trucks could be equipped with auxiliary power units (APUs), enabling drivers to run the required equipment without idling the truck’s large main engine. While most highway diesel engines on the road in 2020 will be factory-equipped with highly effective tailpipe particulate matter (PM) controls (required by the U.S. EPA starting in 2007), many nonroad diesel engines in use in 2020 will predate the advanced new engine standards scheduled to take effect between 2012 and 2015. These engines will represent another opportunity to reduce GHG emissions by controlling black carbon with advanced controls for diesel particulates and have been examined to provide a contrasting estimate of black carbon reduction potential that exists for Connecticut. This option examines the benefits of purchasing $550,000 of APUs for installation in long-haul fleets that pass through Connecticut and the benefits of retrofitting half of the existing nonroad fleet with diesel particulate filters (DPFs). Technical Approach: APUs are estimated to cost between $4,000 and $14,000 (Cascade Sierra Solutions, 2008). Assuming that the average unit costs $9,000, the purchase of roughly 60 APUs would cost $550,000. We further assume that:
• Each unit substitutes for 4 hours per day or roughly 1000 hours per year of engine idling (NESCCAF, 2009);
Figure 4. Baseline and highway GHG emissions projections for CT. Also plotted are projected highway GHG emissions assuming a 5 and 10 mph speed limit reduction.

CT Greenhouse Gas Emissions: Mitigation Options Overview and Reduction Estimates Page
22
• 2007 and newer engines emit 0.33 g/h PM at idle (U.S. EPA, 2004a); • APUs that are 11-hp meet the U.S. EPA’s Tier 4 nonroad emission standard of 0.0092
g/bhp-h (U.S. EPA, 2008) and operate with a load factor of 0.43 (U.S. EPA, 2004b); and • The elemental carbon (EC) to PM2.5 ratio is 0.64 for diesel engines under typical
operating conditions, and 0.17 for idling diesel engines (NESCAUM, 2007). To estimate the GHG reduction potential from installing particulate controls on nonroad diesel engines, we used the U.S. EPA NONROAD model to estimate that the total population of nonroad engines in Connecticut in 2020 will emit roughly 460 MT of PM2.5. We assumed that one-half of these emissions were from pre-Tier 4 engines and were thus eligible for advanced emission controls.10 We then calculated the GHG reduction potential, based on the global warming potential (GWP)11 of the black carbon in the total emitted PM2.5 that would accompany a 90 percent reduction in these eligible emissions resulting from the retrofit of advanced diesel particulate filters. Potential Emissions Reductions: The GHG emission reduction associated with a $550,000 investment in APUs for long-haul fleets is calculated as the difference between the emissions from 60 trucks idling 1000 hours and the emission from 60 APUs operating for the same duration. As illustrated in Table 11, we estimate that spending $550,000 on APUs would reduce annual black carbon emissions by 1630 grams per year, or 4.13 MT CO2e assuming a 20 year GWP, and 1.37 MT CO2e assuming a 100 year GWP. Table 12 shows that the fuel savings from the same project would reduce CO2 emissions by 547 MT annually.
Table 11. Potential CO2e emissions reduction due to black carbon reductions associated with the installation of 60 APUs on long-haul trucks
10 Draft assumption. A detailed scrappage analysis can provide a fleet-specific estimate of the portion of the Connecticut fleet in 2020 that would actually be eligible for retrofit emission controls. 11 20-year and 100-year global warming potentials (GWP) are taken from the Pew Center on Global Change report “Black Carbon: A Science/Policy Primer” (2009) (p. 25). These particular values were estimated by Jacobson (2007) and are on the same order of magnitude as those GWPs estimated by other researchers.

CT Greenhouse Gas Emissions: Mitigation Options Overview and Reduction Estimates Page
23
Table 12. Potential CO2 emissions reduction due to reduced fuel consumption associated with the installation of 60 APUs on long-haul trucks
The GHG reduction potential from installing particulate controls on nonroad diesel engines was estimated by using the PM2.5 estimates from the U.S. EPA NONROAD model and applying both the assumed DPF reduction factor and EC/PM2.5 ratio listed in Table 13. Controls on nonroad diesel engines in Connecticut in 2020 may lead to a reduction of 0.34 MMT CO2e and 0.11 MMT CO2e based on a 20-year and 100-year GWP, respectively.
Table 13. Calculation of CO2e reduction potential from DPF retrofit of nonroad diesel equipment.
Business As Usual PM2.5 (t/y) 500 Retrofit-Eligible Fraction 0.5 Eligible PM2.5 (MT/y) 230 EC/PM2.5 Ratio 0.64 Eligible EC (MT/y) 147.20 DPF Reduction factor 0.9 EC Reduction Potential (MT/y) 132.48 20-y CO2e (MMT/y) 0.34 100-y CO2e (MMT/y) 0.11

CT Greenhouse Gas Emissions: Mitigation Options Overview and Reduction Estimates Page
24
2.2. CT GHG Emissions Reduction Options: Electric Power Generation Sector Fossil fuel combustion is by far the largest contributor to GHG emissions in Connecticut. Electric power generation and industrial stationary source combustion contribute a significant percentage of these fossil fuel combustion GHGs, with electric power generation emissions exceeded only by those from the transportation sector. Most of these emissions are in the form of CO2; however fuel combustion produces N2O and CH4 emissions as well. Industrial processes like electronics manufacturing (e.g., fuel cells), substitution of ozone depleting substances (ODS), electric power transmission and distribution, and limestone/dolomite/soda ash usage contribute additional emissions of CO2 and N2O, HFCs, perfluorocarbons (PFCs), and sulfur hexafluoride (SF6). In order to estimate the emission benefits of power generation sector programs, the Northeast MARKet Allocation (NE-MARKAL) model was used to estimate GHG emissions reductions by comparing policy simulations to a future reference case reflecting current conditions and assumptions, absent the specific policy constraint being tested. NE-MARKAL is a least-cost optimized linear programming model that represents energy producing, transforming, and consuming technologies in each of 12 northeast states, including Connecticut. The model has a detailed characterization of the power generation sector, as well as the transportation and industrial sectors and residential and commercial buildings. Policies examined in this framework can generate insights on cross-sectoral implications and multi-pollutant tradeoffs. Reference case GHG emissions for Connecticut are shown in Figure 5. We note that the total NE-MARKAL estimated 2002 GHG emissions of 43.9 MMT correspond well to other estimates of Connecticut energy-related GHG emissions, including inventory estimates of 45 MMT for the
Figure 5. Simulated “Reference” and “RGGI” scenario total statewide GHG emissions projections through 2030.
CT Greenhouse Gas Emissions: Mitigation Options Overview and Reduction Estimates Page
25
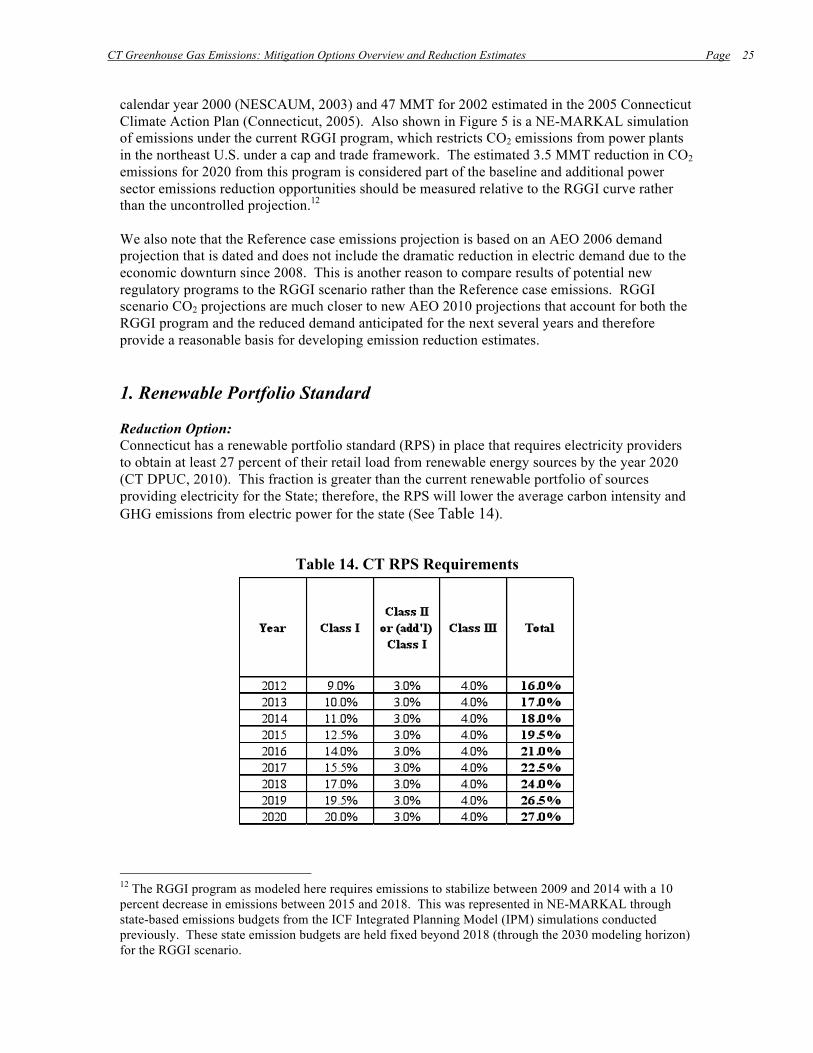
calendar year 2000 (NESCAUM, 2003) and 47 MMT for 2002 estimated in the 2005 Connecticut Climate Action Plan (Connecticut, 2005). Also shown in Figure 5 is a NE-MARKAL simulation of emissions under the current RGGI program, which restricts CO2 emissions from power plants in the northeast U.S. under a cap and trade framework. The estimated 3.5 MMT reduction in CO2 emissions for 2020 from this program is considered part of the baseline and additional power sector emissions reduction opportunities should be measured relative to the RGGI curve rather than the uncontrolled projection.12 We also note that the Reference case emissions projection is based on an AEO 2006 demand projection that is dated and does not include the dramatic reduction in electric demand due to the economic downturn since 2008. This is another reason to compare results of potential new regulatory programs to the RGGI scenario rather than the Reference case emissions. RGGI scenario CO2 projections are much closer to new AEO 2010 projections that account for both the RGGI program and the reduced demand anticipated for the next several years and therefore provide a reasonable basis for developing emission reduction estimates. 1. Renewable Portfolio Standard Reduction Option: Connecticut has a renewable portfolio standard (RPS) in place that requires electricity providers to obtain at least 27 percent of their retail load from renewable energy sources by the year 2020 (CT DPUC, 2010). This fraction is greater than the current renewable portfolio of sources providing electricity for the State; therefore, the RPS will lower the average carbon intensity and GHG emissions from electric power for the state (See Table 14).
Table 14. CT RPS Requirements
12 The RGGI program as modeled here requires emissions to stabilize between 2009 and 2014 with a 10 percent decrease in emissions between 2015 and 2018. This was represented in NE-MARKAL through state-based emissions budgets from the ICF Integrated Planning Model (IPM) simulations conducted previously. These state emission budgets are held fixed beyond 2018 (through the 2030 modeling horizon) for the RGGI scenario.

CT Greenhouse Gas Emissions: Mitigation Options Overview and Reduction Estimates Page
26
Technical Approach: Using the NE-MARKAL model, simulations of the Connecticut energy system were conducted to assess the least cost compliance pathway to achieve the RPS requirement in 2020. The fraction of renewable power is assumed to be held at 27 percent beyond 2020 through the end of the modeling horizon in 2030. Emission reductions were calculated relative to the RGGI scenario to provide an estimate of GHG reductions that would accrue above and beyond RGGI due to the RPS requirement alone. The plot of Figure 6 projects a reduction of 2.6 MMT CO2e in 2020 as a result of achieving the RPS target. The RPS policy scenario was developed through a constraint on the fraction of energy consumption that had to meet the definition of renewable according to the Connecticut requirements. This constraint was applied to all generation satisfying Connecticut demand, which includes some imports. The measure resulted in an increase of more than 54,000 GWh of renewable generation in the state over the next decade, reducing natural gas generation by more than 77,000 GWh relative to the the RGGI-constrained reference over the same time period. The capital investment to achieve this switch was approximately $4 billion in 2020, comprised mainly of solar and wind generation, but with fuel savings of $0.5 billion per year, future savings will continue to offset much of these investments. Initial modeling of this scenario saw the internally calculated cost of electricity in NE-MARKAL rise to unreasonably high levels, prompting a large movement in industrial electric demand toward onsite combined heat and power (CHP). We expect that cost-containment strategies and regulatory actions will limit actual price increases in electricity. Therefore, in the current simulation we have capped industrial sector CHP at 4 percent of total industrial demand, consistent with historical records. This has little effect on overall GHG emission reductions, but does provide more realistic projections for where the power will be generated.
Figure 6. Simulated “Reference”, “RGGI”, and “RPS” scenario GHG emissions projections for the CT power sector through 2030.
CT Greenhouse Gas Emissions: Mitigation Options Overview and Reduction Estimates Page
27
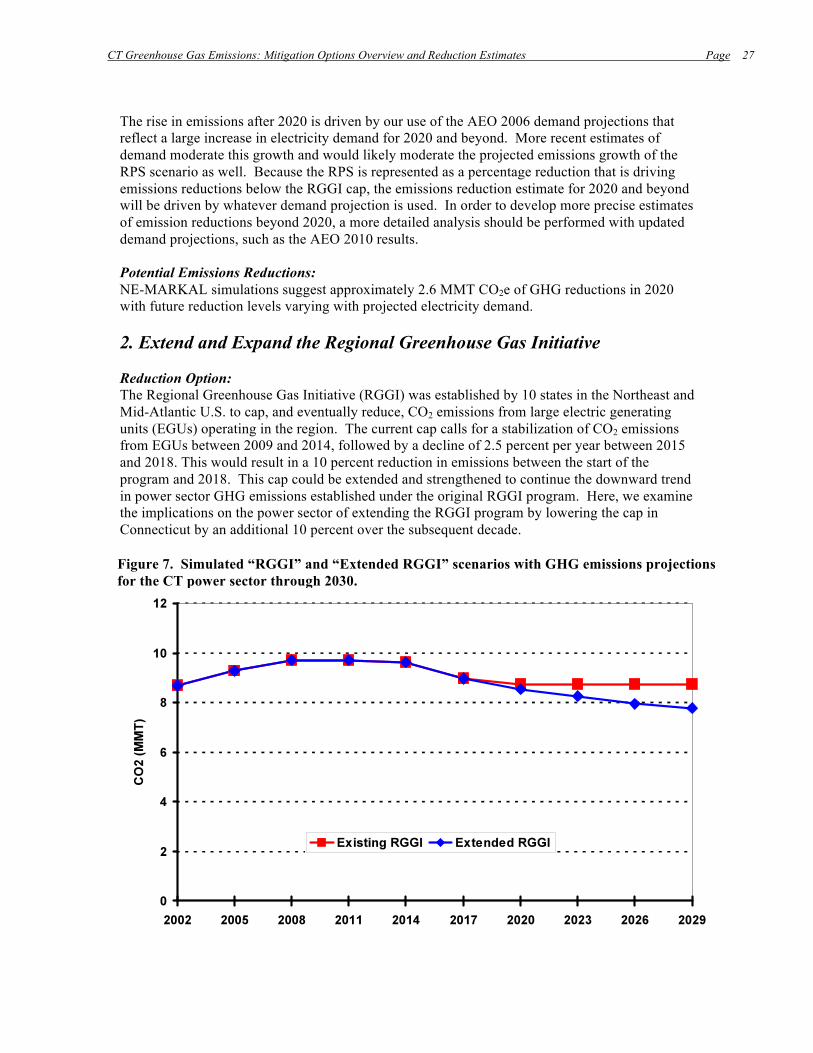
The rise in emissions after 2020 is driven by our use of the AEO 2006 demand projections that reflect a large increase in electricity demand for 2020 and beyond. More recent estimates of demand moderate this growth and would likely moderate the projected emissions growth of the RPS scenario as well. Because the RPS is represented as a percentage reduction that is driving emissions reductions below the RGGI cap, the emissions reduction estimate for 2020 and beyond will be driven by whatever demand projection is used. In order to develop more precise estimates of emission reductions beyond 2020, a more detailed analysis should be performed with updated demand projections, such as the AEO 2010 results. Potential Emissions Reductions: NE-MARKAL simulations suggest approximately 2.6 MMT CO2e of GHG reductions in 2020 with future reduction levels varying with projected electricity demand. 2. Extend and Expand the Regional Greenhouse Gas Initiative Reduction Option: The Regional Greenhouse Gas Initiative (RGGI) was established by 10 states in the Northeast and Mid-Atlantic U.S. to cap, and eventually reduce, CO2 emissions from large electric generating units (EGUs) operating in the region. The current cap calls for a stabilization of CO2 emissions from EGUs between 2009 and 2014, followed by a decline of 2.5 percent per year between 2015 and 2018. This would result in a 10 percent reduction in emissions between the start of the program and 2018. This cap could be extended and strengthened to continue the downward trend in power sector GHG emissions established under the original RGGI program. Here, we examine the implications on the power sector of extending the RGGI program by lowering the cap in Connecticut by an additional 10 percent over the subsequent decade.
Figure 7. Simulated “RGGI” and “Extended RGGI” scenarios with GHG emissions projections for the CT power sector through 2030.

CT Greenhouse Gas Emissions: Mitigation Options Overview and Reduction Estimates Page
28
A second scenario looked at the possibility of expanding this program to encompass additional source sectors. Specifically, industrial boilers in the region share similar features to EGUs and, in fact, many industrial boilers are dedicated exclusively to the onsite generation of electrical power for industrial purposes. A cap-and-trade approach that has successfully been used to reduce SO2 emissions, NOX emissions, and now CO2 emissions in the power generation sector could be a cost-effective and flexible way to address CO2 emissions from the industrial sector. To analyze a potentially expanded RGGI program, we assume that the CO2 cap covers smaller EGUs with capacities between 15 and 25 MW, as well as industrial boilers with heat capacity greater than 250 MMBtu/hr, and would require a 10 percent reduction in their emissions between 2014 and 2024. Technical Approach: We use the NE-MARKAL model to examine the potential implications of extending and strengthening the RGGI cap to achieve a further 10 percent emission reduction from existing RGGI-covered sources relative to 2009 levels by 2029. The simulations were generated by applying a CO2 constraint across all EGUs in the state that meet the current criterion for participation in RGGI. For this simulation, we only look at implementation in Connecticut. Figure 7 shows the CO2 emissions profiles for Connecticut’s power sector emissions relative to the original RGGI scenario.
Figure 8 shows CO2 emissions profiles for the original RGGI and an expanded program that requires a 10 percent emission reduction from all industrial boilers in the state with a heat input greater than 250 MMBtu/hr and all EGUs with capacities between 15 and 25 MW. Given the limited compliance targets for these programs and the limited scope of the strategy, permit prices for these reductions are anticipated to remain modest. Recent studies by MIT (2007) indicate that with allowance prices below $30 per ton of CO2, compliance with carbon programs are likely to come from investments in supply side efficiency, demand side efficiency, or fuel switching rather
Figure 8. Simulated “RGGI” and “expanded RGGI” scenarios with GHG emissions projections for the CT power sector through 2030.

CT Greenhouse Gas Emissions: Mitigation Options Overview and Reduction Estimates Page
29
than actual controls on facilities. Given this, we assume that the additional compliance increment coming from the inclusion of industrial boiler and small EGU sources would not be satisfied in the industrial sector. We have assumed that the small incremental reduction of the CO2 cap for industrial boilers would be satisfied in the power sector through demand reductions or energy efficiency and have modeled compliance in this way. The compliance date for these sources is set at 2017 for this scenario. Potential Emissions Reductions: Emissions reductions as a result of a second phase of RGGI start to accrue by 2020 (approximately 0.2 MMT per year), however, by 2030, we see reductions of approximately 1 MMT per year relative to the original RGGI program. An additional 0.147 MMT per year is projected by 2017 with the addition of an industrial boiler program. This result, however, should be verified through a more rigorous exercise that includes explicit treatment of the industrial sector compliance options and multi-state trading and/or participation. 3. Base-load EGU GHG Performance Standard Reduction Option: A performance standard guarantees that new power generation permitted for the state meets a minimum environmental performance. A level of minimum environmental performance allows the state to provide abundant new energy resources, yet ensure that the most environmentally damaging technologies are not able to enter the market. This is consistent with anticipated U.S. EPA New Source Performance Standards for CO2 emissions from stationary sources that may be issued on a fuel-specific basis. Current options for power generation span a wide range of CO2 emissions intensity from less than 1000 lb/MWh for natural gas combined cycle plants to more than 2000 lb/MWh for oil and coal plants. Establishing a maximum performance standard for new generation at a level of approximately 1500 lbs/MWh of CO2 based on gross output would ensure that relatively clean generation would continue to be available to provide power for the state. Future adoption of a level equivalent to the most stringent value set by EPA is a potential future control strategy. Technical Approach: A modeled simulation of a minimum performance constraint for CO2 emission intensity for new technologies is essentially equivalent to a ban on new technologies that fail to meet that criterion. Characterizations for new power plant technologies in NE-MARKAL come from the NEMS model. Integrated gasification combined cycle (IGCC) without sequestration lies just below this performance standard; however, oil and coal plants emit at rates above this maximum and likely would not meet a performance standard in the range of 1,500 lb/MWh of CO2. It is a straightforward exercise to implement a constraint on these two technology choices, but it is also unnecessary. Given that our reference scenario – against which we are comparing power sector simulations – includes the RGGI cap requirements, a performance standard that limits EGU CO2 emissions to the above-noted level has no effect on simulated projections as the model already does not allow new oil or coal units to enter the solution for other reasons. Potential Emissions Reductions: No net emissions reduction is achieved above and beyond the RGGI scenario. However, adoption of this measure is consistent with potential future action by U.S. EPA on performance standards for CO2 from stationary sources and allows for consideration of future regulations based on this approach.

CT Greenhouse Gas Emissions: Mitigation Options Overview and Reduction Estimates Page
30
2.3. CT GHG Emissions Reduction Options: Residential, Commercial, and Industrial Sectors
The main source of GHG emissions in the residential and commercial sectors is the combustion of fossil fuels for space heating, air conditioning, water heating, and use of home and office lighting and appliances. Fossil fuels include coal, natural gas, and petroleum-based fuels, such as distillate fuel, kerosene, and liquefied petroleum gas (LPG) for both sectors, as well as motor gasoline and residual fuel for the commercial sector. Wood used in fireplaces and woodstoves might also be considered in the residential and commercial emission categories.13 The amount of energy dedicated to space heating and air conditioning is closely related to the geographic location and physical characteristics of the unit, such as the thermal envelope and furnace efficiency. Electricity use for lighting and appliances correlates to the number of residents in a home14 and the type of company, number of employees, and the amount of time per day or year a business is in operation. Specific GHG emissions attributable to the residential and commercial sectors include CO2 and N2O from the combustion of fossil fuels, SF6 emissions from electricity transmission and distribution systems, and CH4 emissions from the inefficient combustion of wood. Here we divide potential measures into two categories for which there is some inevitable overlap. Several potential measures have been identified that are categorized as “mechanisms” in terms of their role in incentivizing energy efficiency and regulating residential, commercial, and industrial energy use and GHG emissions. These include the following items:
Expand funding for the Connecticut Energy Efficiency Fund; Expand funding for the Natural Gas Efficiency Fund; Expand funding for the Oil Conservation Fund; Implement appliance standards on specific high-energy use appliances; and Upgrade residential and commercial building codes to improve energy performance.
The remaining measures are categorized as “technology” options since they are more focused on utilizing the technical potential of a specific technology or set of technologies, such as:
Maximize energy efficiency potential as identified in state review by state survey (KEMA Associates, 2009);
Incentivize or otherwise expand deployment of ground-source heat pumps for residential and commercial space and water heating;
Incentivize or otherwise expand weatherization programs for residential and commercial buildings;
Expand commercial deployment of “smart meters” with differential pricing as a load management strategy;
Expanded recycling or control programs for high global warming potential gases; and Expanded district heating projects (Combined Heat and Power).
13 EPA’s State Inventory Tool assumes that biomass has net-zero carbon emission and therefore does not capture point carbon dioxide emissions from the combustion of wood. 14 Emrath, Paul, PhD and Helen Fei Lui, PhD. Residential Greenhouse Gas Emissions. Housing Economics. National Association of Home Builders. Special Studies. April 30, 2007.
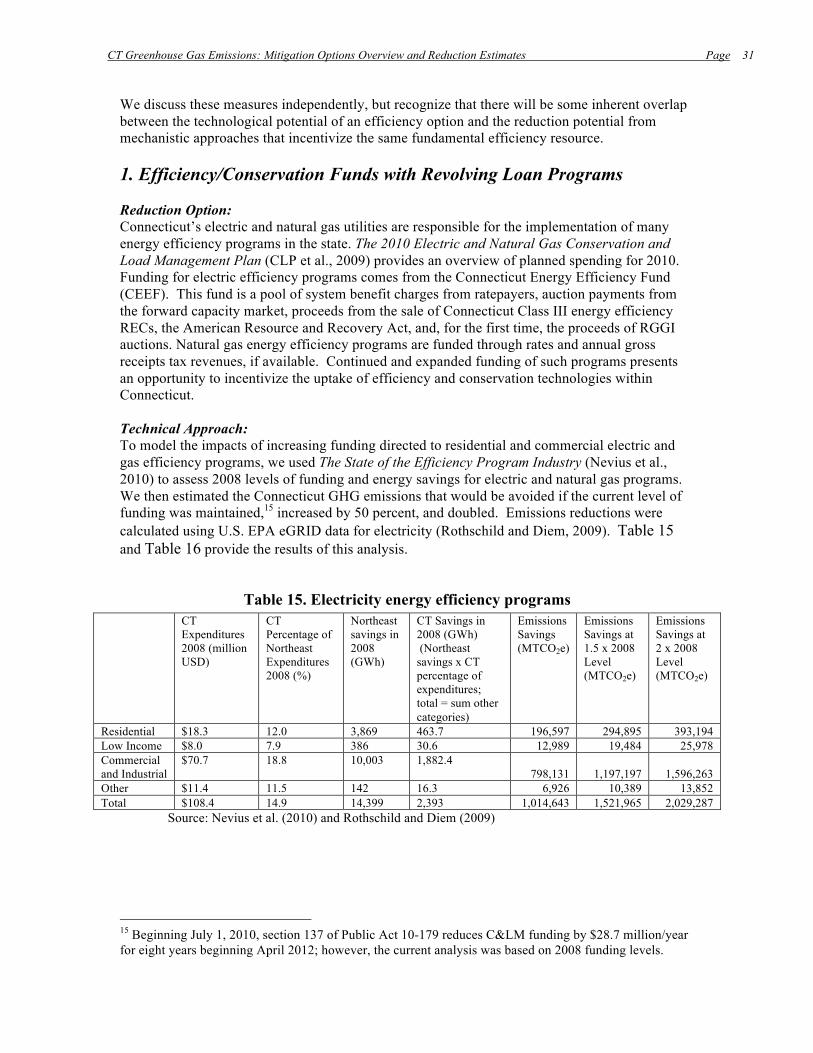
CT Greenhouse Gas Emissions: Mitigation Options Overview and Reduction Estimates Page
31
We discuss these measures independently, but recognize that there will be some inherent overlap between the technological potential of an efficiency option and the reduction potential from mechanistic approaches that incentivize the same fundamental efficiency resource. 1. Efficiency/Conservation Funds with Revolving Loan Programs Reduction Option: Connecticut’s electric and natural gas utilities are responsible for the implementation of many energy efficiency programs in the state. The 2010 Electric and Natural Gas Conservation and Load Management Plan (CLP et al., 2009) provides an overview of planned spending for 2010. Funding for electric efficiency programs comes from the Connecticut Energy Efficiency Fund (CEEF). This fund is a pool of system benefit charges from ratepayers, auction payments from the forward capacity market, proceeds from the sale of Connecticut Class III energy efficiency RECs, the American Resource and Recovery Act, and, for the first time, the proceeds of RGGI auctions. Natural gas energy efficiency programs are funded through rates and annual gross receipts tax revenues, if available. Continued and expanded funding of such programs presents an opportunity to incentivize the uptake of efficiency and conservation technologies within Connecticut. Technical Approach: To model the impacts of increasing funding directed to residential and commercial electric and gas efficiency programs, we used The State of the Efficiency Program Industry (Nevius et al., 2010) to assess 2008 levels of funding and energy savings for electric and natural gas programs. We then estimated the Connecticut GHG emissions that would be avoided if the current level of funding was maintained,15 increased by 50 percent, and doubled. Emissions reductions were calculated using U.S. EPA eGRID data for electricity (Rothschild and Diem, 2009). Table 15 and Table 16 provide the results of this analysis.
Table 15. Electricity energy efficiency programs CT
Expenditures 2008 (million USD)
CT Percentage of Northeast Expenditures 2008 (%)
Northeast savings in 2008 (GWh)
CT Savings in 2008 (GWh) (Northeast savings x CT percentage of expenditures; total = sum other categories)
Emissions Savings (MTCO2e)
Emissions Savings at 1.5 x 2008 Level (MTCO2e)
Emissions Savings at 2 x 2008 Level (MTCO2e)
Residential $18.3 12.0 3,869 463.7 196,597 294,895 393,194 Low Income $8.0 7.9 386 30.6 12,989 19,484 25,978 Commercial and Industrial
$70.7 18.8
10,003 1,882.4 798,131 1,197,197 1,596,263
Other $11.4 11.5 142 16.3 6,926 10,389 13,852 Total $108.4 14.9 14,399 2,393 1,014,643 1,521,965 2,029,287
Source: Nevius et al. (2010) and Rothschild and Diem (2009)
15 Beginning July 1, 2010, section 137 of Public Act 10-179 reduces C&LM funding by $28.7 million/year for eight years beginning April 2012; however, the current analysis was based on 2008 funding levels.
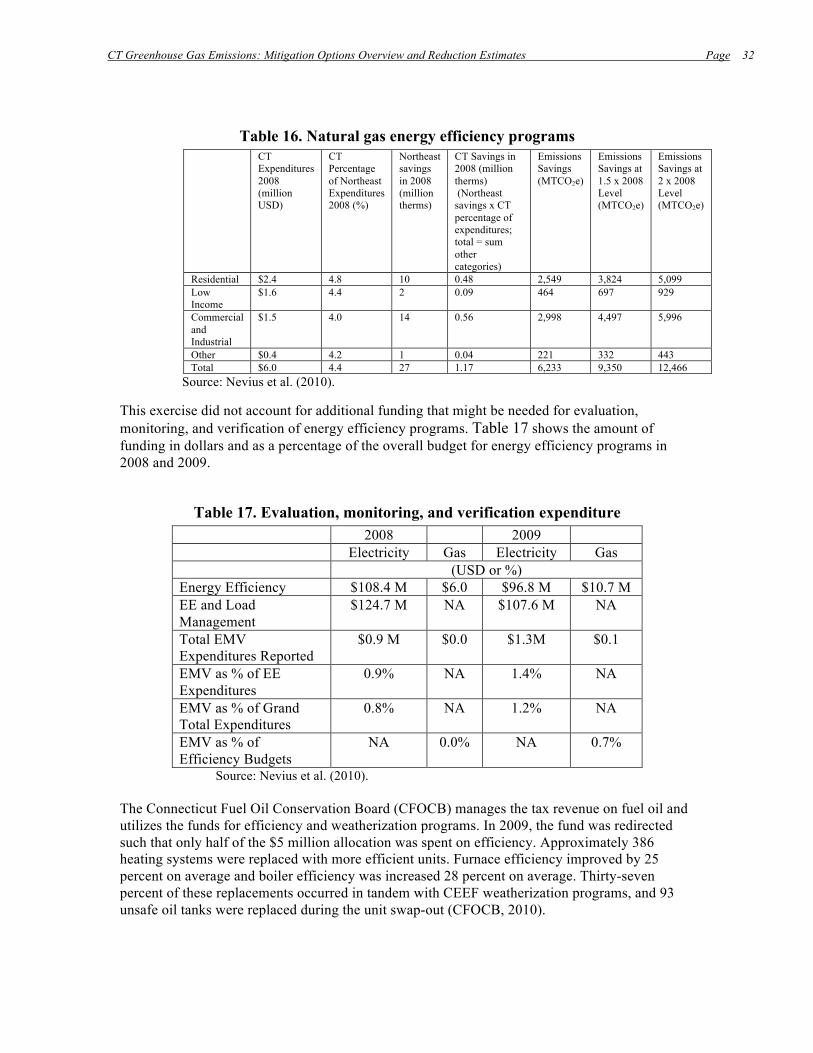
CT Greenhouse Gas Emissions: Mitigation Options Overview and Reduction Estimates Page
32
Table 16. Natural gas energy efficiency programs CT
Expenditures 2008 (million USD)
CT Percentage of Northeast Expenditures 2008 (%)
Northeast savings in 2008 (million therms)
CT Savings in 2008 (million therms) (Northeast savings x CT percentage of expenditures; total = sum other categories)
Emissions Savings (MTCO2e)
Emissions Savings at 1.5 x 2008 Level (MTCO2e)
Emissions Savings at 2 x 2008 Level (MTCO2e)
Residential $2.4 4.8 10 0.48 2,549 3,824 5,099 Low Income
$1.6 4.4 2 0.09 464 697 929
Commercial and Industrial
$1.5 4.0 14 0.56 2,998 4,497 5,996
Other $0.4 4.2 1 0.04 221 332 443 Total $6.0 4.4 27 1.17 6,233 9,350 12,466
Source: Nevius et al. (2010). This exercise did not account for additional funding that might be needed for evaluation, monitoring, and verification of energy efficiency programs. Table 17 shows the amount of funding in dollars and as a percentage of the overall budget for energy efficiency programs in 2008 and 2009.
Table 17. Evaluation, monitoring, and verification expenditure 2008 2009 Electricity Gas Electricity Gas (USD or %) Energy Efficiency $108.4 M $6.0 $96.8 M $10.7 M EE and Load Management
$124.7 M NA $107.6 M NA
Total EMV Expenditures Reported
$0.9 M $0.0 $1.3M $0.1
EMV as % of EE Expenditures
0.9% NA 1.4% NA
EMV as % of Grand Total Expenditures
0.8% NA 1.2% NA
EMV as % of Efficiency Budgets
NA 0.0% NA 0.7%
Source: Nevius et al. (2010). The Connecticut Fuel Oil Conservation Board (CFOCB) manages the tax revenue on fuel oil and utilizes the funds for efficiency and weatherization programs. In 2009, the fund was redirected such that only half of the $5 million allocation was spent on efficiency. Approximately 386 heating systems were replaced with more efficient units. Furnace efficiency improved by 25 percent on average and boiler efficiency was increased 28 percent on average. Thirty-seven percent of these replacements occurred in tandem with CEEF weatherization programs, and 93 unsafe oil tanks were replaced during the unit swap-out (CFOCB, 2010).
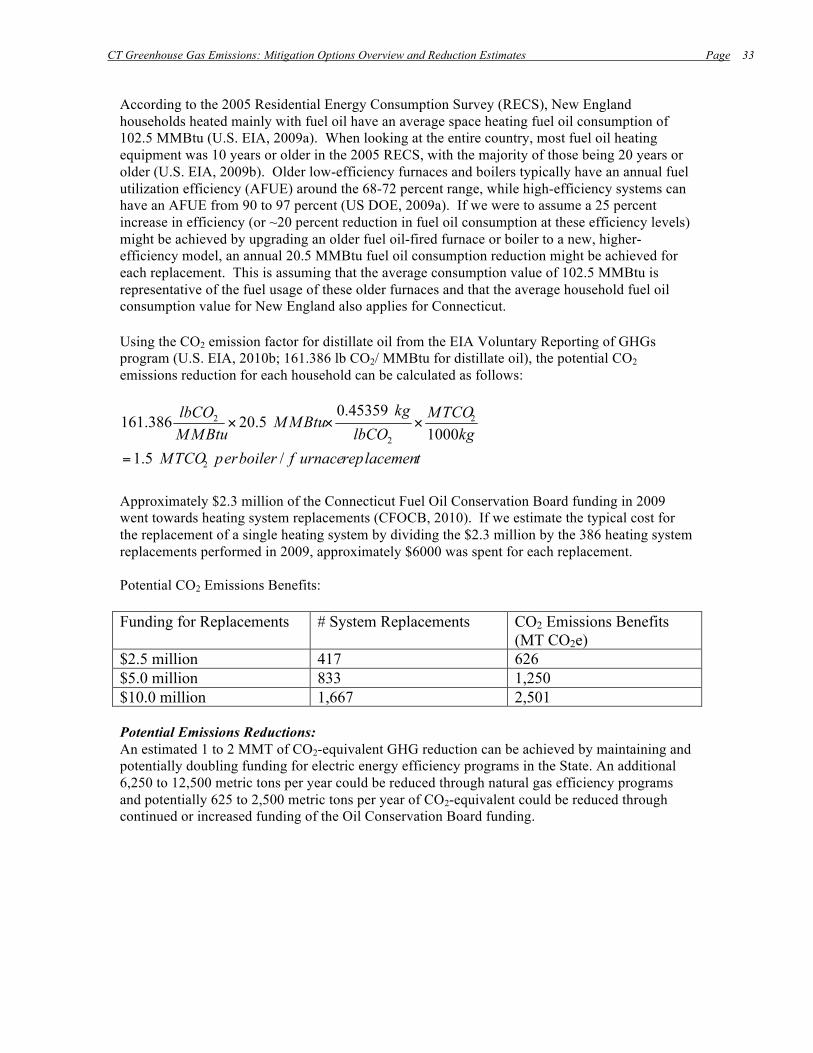
CT Greenhouse Gas Emissions: Mitigation Options Overview and Reduction Estimates Page
33
According to the 2005 Residential Energy Consumption Survey (RECS), New England households heated mainly with fuel oil have an average space heating fuel oil consumption of 102.5 MMBtu (U.S. EIA, 2009a). When looking at the entire country, most fuel oil heating equipment was 10 years or older in the 2005 RECS, with the majority of those being 20 years or older (U.S. EIA, 2009b). Older low-efficiency furnaces and boilers typically have an annual fuel utilization efficiency (AFUE) around the 68-72 percent range, while high-efficiency systems can have an AFUE from 90 to 97 percent (US DOE, 2009a). If we were to assume a 25 percent increase in efficiency (or ~20 percent reduction in fuel oil consumption at these efficiency levels) might be achieved by upgrading an older fuel oil-fired furnace or boiler to a new, higher-efficiency model, an annual 20.5 MMBtu fuel oil consumption reduction might be achieved for each replacement. This is assuming that the average consumption value of 102.5 MMBtu is representative of the fuel usage of these older furnaces and that the average household fuel oil consumption value for New England also applies for Connecticut. Using the CO2 emission factor for distillate oil from the EIA Voluntary Reporting of GHGs program (U.S. EIA, 2010b; 161.386 lb CO2/ MMBtu for distillate oil), the potential CO2 emissions reduction for each household can be calculated as follows:
Approximately $2.3 million of the Connecticut Fuel Oil Conservation Board funding in 2009 went towards heating system replacements (CFOCB, 2010). If we estimate the typical cost for the replacement of a single heating system by dividing the $2.3 million by the 386 heating system replacements performed in 2009, approximately $6000 was spent for each replacement. Potential CO2 Emissions Benefits: Funding for Replacements # System Replacements CO2 Emissions Benefits
(MT CO2e) $2.5 million 417 626 $5.0 million 833 1,250 $10.0 million 1,667 2,501 Potential Emissions Reductions: An estimated 1 to 2 MMT of CO2-equivalent GHG reduction can be achieved by maintaining and potentially doubling funding for electric energy efficiency programs in the State. An additional 6,250 to 12,500 metric tons per year could be reduced through natural gas efficiency programs and potentially 625 to 2,500 metric tons per year of CO2-equivalent could be reduced through continued or increased funding of the Oil Conservation Board funding.
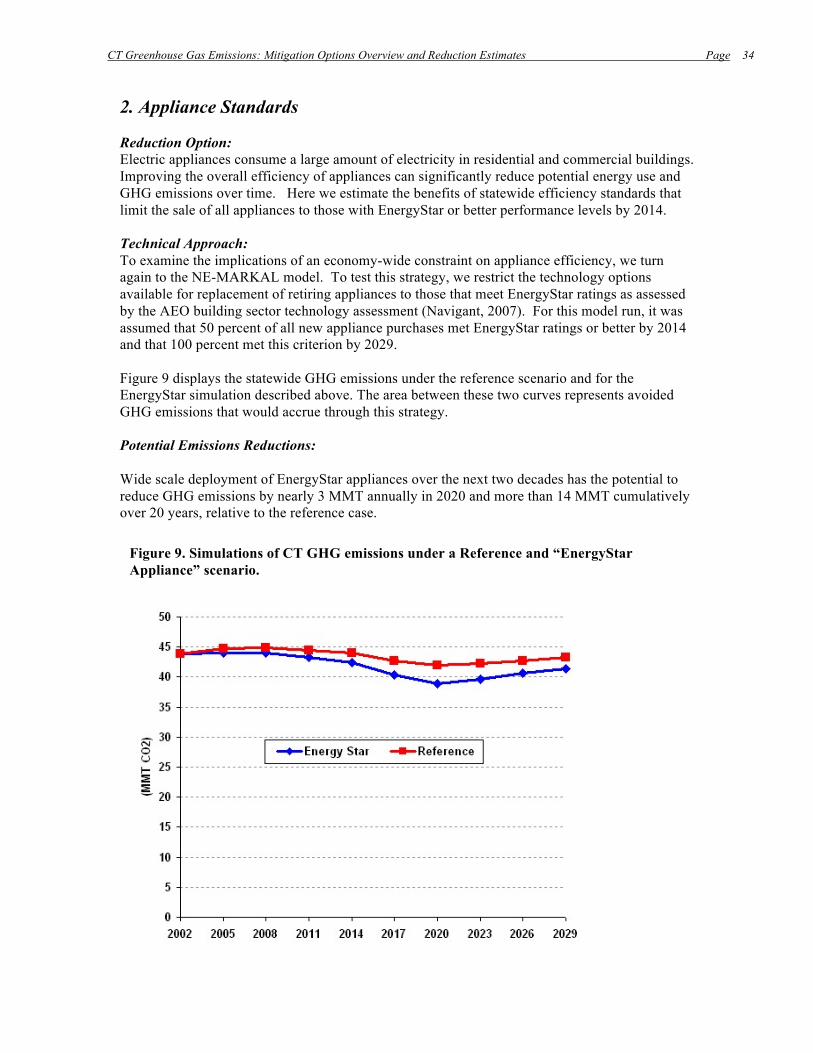
CT Greenhouse Gas Emissions: Mitigation Options Overview and Reduction Estimates Page
34
2. Appliance Standards Reduction Option: Electric appliances consume a large amount of electricity in residential and commercial buildings. Improving the overall efficiency of appliances can significantly reduce potential energy use and GHG emissions over time. Here we estimate the benefits of statewide efficiency standards that limit the sale of all appliances to those with EnergyStar or better performance levels by 2014. Technical Approach: To examine the implications of an economy-wide constraint on appliance efficiency, we turn again to the NE-MARKAL model. To test this strategy, we restrict the technology options available for replacement of retiring appliances to those that meet EnergyStar ratings as assessed by the AEO building sector technology assessment (Navigant, 2007). For this model run, it was assumed that 50 percent of all new appliance purchases met EnergyStar ratings or better by 2014 and that 100 percent met this criterion by 2029. Figure 9 displays the statewide GHG emissions under the reference scenario and for the EnergyStar simulation described above. The area between these two curves represents avoided GHG emissions that would accrue through this strategy. Potential Emissions Reductions: Wide scale deployment of EnergyStar appliances over the next two decades has the potential to reduce GHG emissions by nearly 3 MMT annually in 2020 and more than 14 MMT cumulatively over 20 years, relative to the reference case.
Figure 9. Simulations of CT GHG emissions under a Reference and “EnergyStar Appliance” scenario.
CT Greenhouse Gas Emissions: Mitigation Options Overview and Reduction Estimates Page
35
3. Building Codes Reduction Option: The Architecture 2030 Challenge, as supported by U.S. Council of Mayors, American Institute of Architects, U.S. Green Build Council, and numerous other organizations, sets aggressive targets for reducing and eliminating GHG emissions from the building sector. The challenge requires all new buildings and major renovations to meet a standard of 50 percent of the regional average fossil fuel use (or GHG emissions) for that building type. The target may be met with design strategies, on-site generation of renewable power, and purchasing renewable energy credits (to meet up to 20 percent of the target). The fossil fuel reduction standard for all new buildings and major renovations increases each year to:
• 60 percent in 2010 • 70 percent in 2015 • 80 percent in 2020 • 90 percent in 2025 • Carbon-neutral in 2030
Achieving these goals, however, must be accomplished at the local and municipal level rather than at the state level, as control of local building codes lies with local authorities. Here we assess the benefits of achieving these aggressive targets in cities and towns within Connecticut that comprise 10 percent of the total state population by 2020. Technical Approach: Data is necessary to further evaluate this option. DEP solicits any information or data on the percentage of new construction and major renovations as a fraction of total residential and commercial construction and renovation activity. Potential Emissions Reductions: An estimate is not available at this time. 4. “Top Twenty” Energy Efficiency Opportunities Reduction Option: Connecticut has already commissioned two studies analyzing the technical and economically achievable potential of energy efficiency measures that might be applied by in-state utilities (Schlegel, 2009). These studies point to the large technical potential available from the efficiency targets surveyed. Here, we summarize the potential energy savings and GHG reductions that correspond to just 20 measures in each of the residential, commercial, and industrial sectors as surveyed by KEMA Consulting and reported by Schlegel (2009). Technical Approach: Schlegel (2009) provides individual measures and potential energy savings for Connecticut. Table 18 presents a summary of the types of measures that were considered for the residential, commercial, and industrial sectors, as well as the technical potential and GHG savings by fuel type.
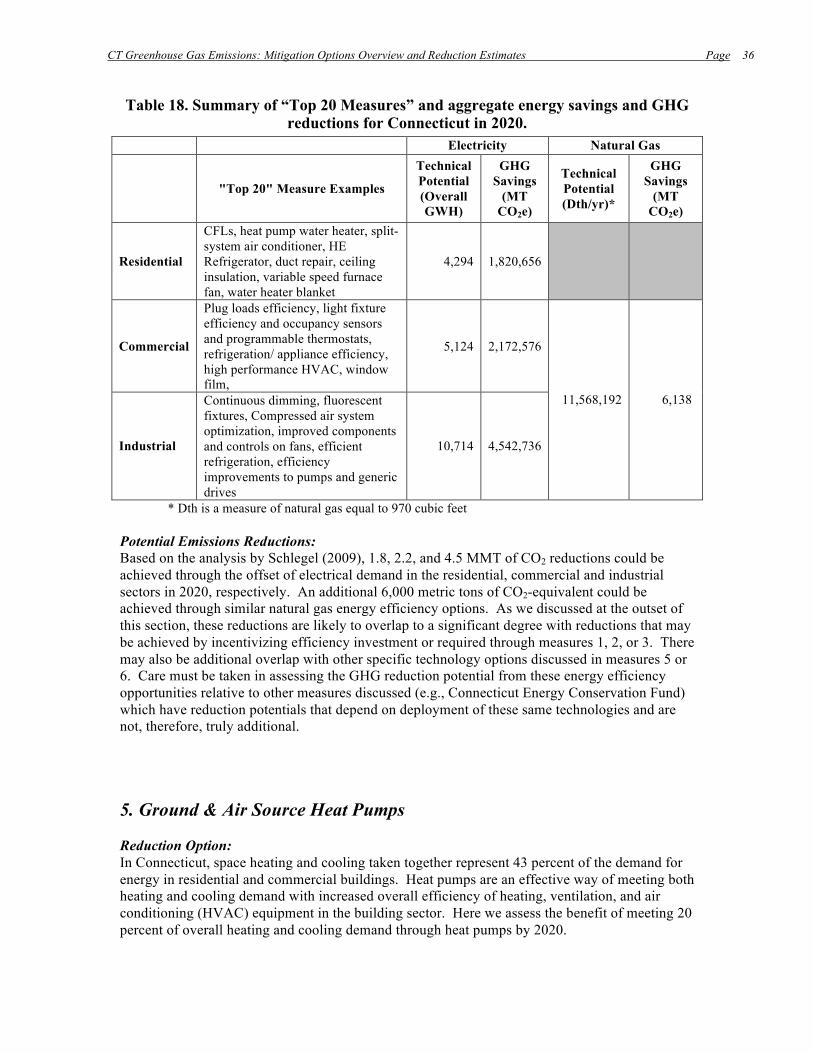
CT Greenhouse Gas Emissions: Mitigation Options Overview and Reduction Estimates Page
36
Table 18. Summary of “Top 20 Measures” and aggregate energy savings and GHG reductions for Connecticut in 2020.
Electricity Natural Gas
"Top 20" Measure Examples
Technical Potential (Overall GWH)
GHG Savings
(MT CO2e)
Technical Potential (Dth/yr)*
GHG Savings
(MT CO2e)
Residential
CFLs, heat pump water heater, split-system air conditioner, HE Refrigerator, duct repair, ceiling insulation, variable speed furnace fan, water heater blanket
4,294 1,820,656
Commercial
Plug loads efficiency, light fixture efficiency and occupancy sensors and programmable thermostats, refrigeration/ appliance efficiency, high performance HVAC, window film,
5,124 2,172,576
Industrial
Continuous dimming, fluorescent fixtures, Compressed air system optimization, improved components and controls on fans, efficient refrigeration, efficiency improvements to pumps and generic drives
10,714 4,542,736
11,568,192 6,138
* Dth is a measure of natural gas equal to 970 cubic feet Potential Emissions Reductions: Based on the analysis by Schlegel (2009), 1.8, 2.2, and 4.5 MMT of CO2 reductions could be achieved through the offset of electrical demand in the residential, commercial and industrial sectors in 2020, respectively. An additional 6,000 metric tons of CO2-equivalent could be achieved through similar natural gas energy efficiency options. As we discussed at the outset of this section, these reductions are likely to overlap to a significant degree with reductions that may be achieved by incentivizing efficiency investment or required through measures 1, 2, or 3. There may also be additional overlap with other specific technology options discussed in measures 5 or 6. Care must be taken in assessing the GHG reduction potential from these energy efficiency opportunities relative to other measures discussed (e.g., Connecticut Energy Conservation Fund) which have reduction potentials that depend on deployment of these same technologies and are not, therefore, truly additional. 5. Ground & Air Source Heat Pumps Reduction Option: In Connecticut, space heating and cooling taken together represent 43 percent of the demand for energy in residential and commercial buildings. Heat pumps are an effective way of meeting both heating and cooling demand with increased overall efficiency of heating, ventilation, and air conditioning (HVAC) equipment in the building sector. Here we assess the benefit of meeting 20 percent of overall heating and cooling demand through heat pumps by 2020.
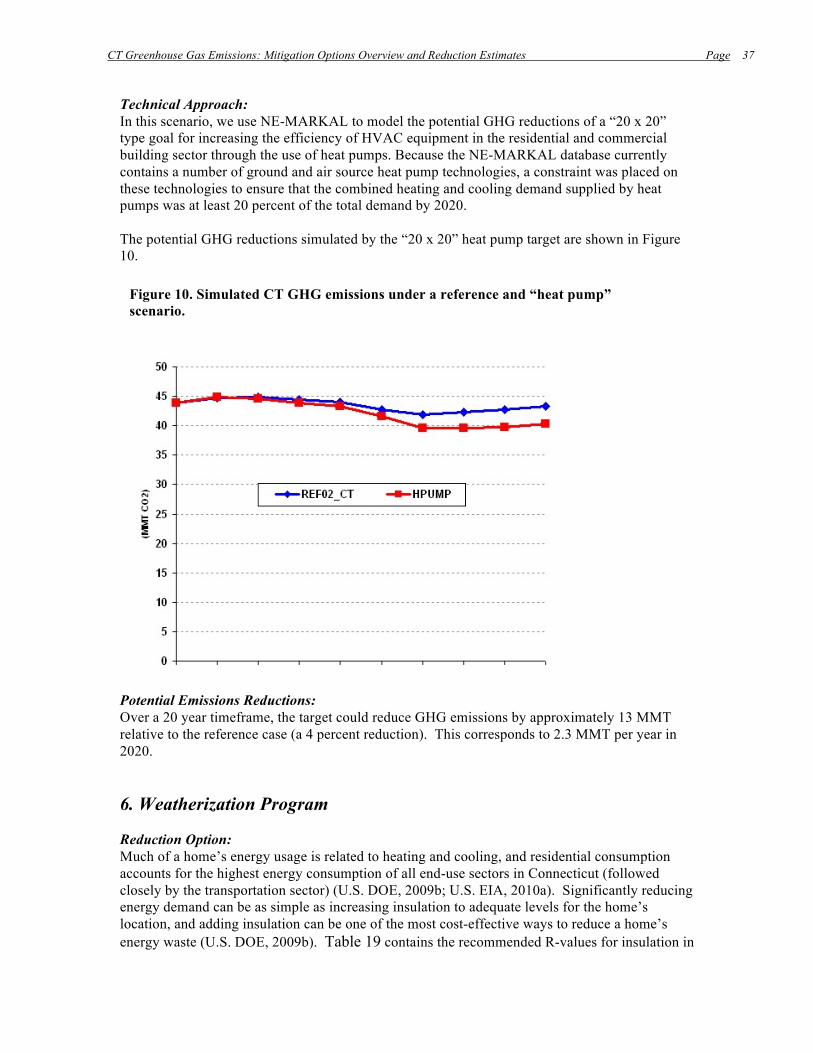
CT Greenhouse Gas Emissions: Mitigation Options Overview and Reduction Estimates Page
37
Technical Approach: In this scenario, we use NE-MARKAL to model the potential GHG reductions of a “20 x 20” type goal for increasing the efficiency of HVAC equipment in the residential and commercial building sector through the use of heat pumps. Because the NE-MARKAL database currently contains a number of ground and air source heat pump technologies, a constraint was placed on these technologies to ensure that the combined heating and cooling demand supplied by heat pumps was at least 20 percent of the total demand by 2020. The potential GHG reductions simulated by the “20 x 20” heat pump target are shown in Figure 10.
Potential Emissions Reductions: Over a 20 year timeframe, the target could reduce GHG emissions by approximately 13 MMT relative to the reference case (a 4 percent reduction). This corresponds to 2.3 MMT per year in 2020. 6. Weatherization Program Reduction Option: Much of a home’s energy usage is related to heating and cooling, and residential consumption accounts for the highest energy consumption of all end-use sectors in Connecticut (followed closely by the transportation sector) (U.S. DOE, 2009b; U.S. EIA, 2010a). Significantly reducing energy demand can be as simple as increasing insulation to adequate levels for the home’s location, and adding insulation can be one of the most cost-effective ways to reduce a home’s energy waste (U.S. DOE, 2009b). Table 19 contains the recommended R-values for insulation in
Figure 10. Simulated CT GHG emissions under a reference and “heat pump” scenario.

CT Greenhouse Gas Emissions: Mitigation Options Overview and Reduction Estimates Page
38
existing wood-framed homes in Hartford, CT (U.S. DOE, 2008a). In addition to upgrading insulation, other measures may be employed at home to lead to substantial energy savings. The replacement of single-pane with double-pane windows with low-emissivity (low-e) coatings and the re-adjustment of thermostat set points, even by just a degree, may also contribute significant energy savings (U.S. DOE, 2009b; U.S. EIA, 2000). Many options, such as infiltration reduction, window insulation and low-cost storm windows, are typically more cost-effective than full-window replacement, but are also case dependent and difficult to include in a state-wide analysis. Here we have assumed replacement windows for a conservative assessment of GHG savings.
Table 19. DOE-recommended insulation amounts for existing wood-framed homes in Hartford, CT, from the U.S. Department of Energy Zip-Code Insulation
Program. R-Values have units of F-ft2-h/Btu. An R-value is a rating of thermal resistance.
Insulation Location
R-Value Notes
Attic 49.0 - Wall cavity 13.0 Blow insulation into any uninsulated exterior wall cavity. Insulative sheathing on empty wall
5.0 Recommendation assumes that the exterior siding was removed for other purpose, i.e., does not include any consideration of the cost of removing and replacing the exterior siding.
Concrete or masonry wall 15.0 -
Floor 30.0 Over unheated, uninsulated space.
Insulation Location
R-Value Notes
Crawl space wall 25.0 Crawl space walls are only insulated if the crawl space is
unvented and the floor above the crawl space is uninsulated. Basement wall interior 11.0 -
Technical Approach A Windows-based building energy model called “eQUEST” calculates hourly energy consumption for a building over an entire year. The calculations are based on the user-specified building design and hourly weather data for the project location (U.S. DOE, 2009c). The eQUEST program is typically used to evaluate the energy usage for different design alternatives, and the program has been used here to generate a “delta” annual energy consumption between a baseline scenario and an alternative scenario (usually with enhanced weatherization options). The program includes an Energy Efficiency Measure Wizard to easily evaluate multiple design alternatives against the baseline simultaneously. We set up eQUEST for a 2-story 2500 ft2 single-family home, with attic and basement, located in Hartford, CT. The thermostat heating set point was 68 °F, and the windows were single pane windows (“Clr/Tint”). The baseline home was well-insulated. As most houses in Connecticut are heated by heating oil or natural gas furnaces as opposed to electric ones, the baseline house was simulated with a natural gas furnace. While eQUEST can simulate the difference in annual energy consumption between two alternatives, in order to estimate CO2 emissions impacts, an emission factor for electricity and natural gas usage
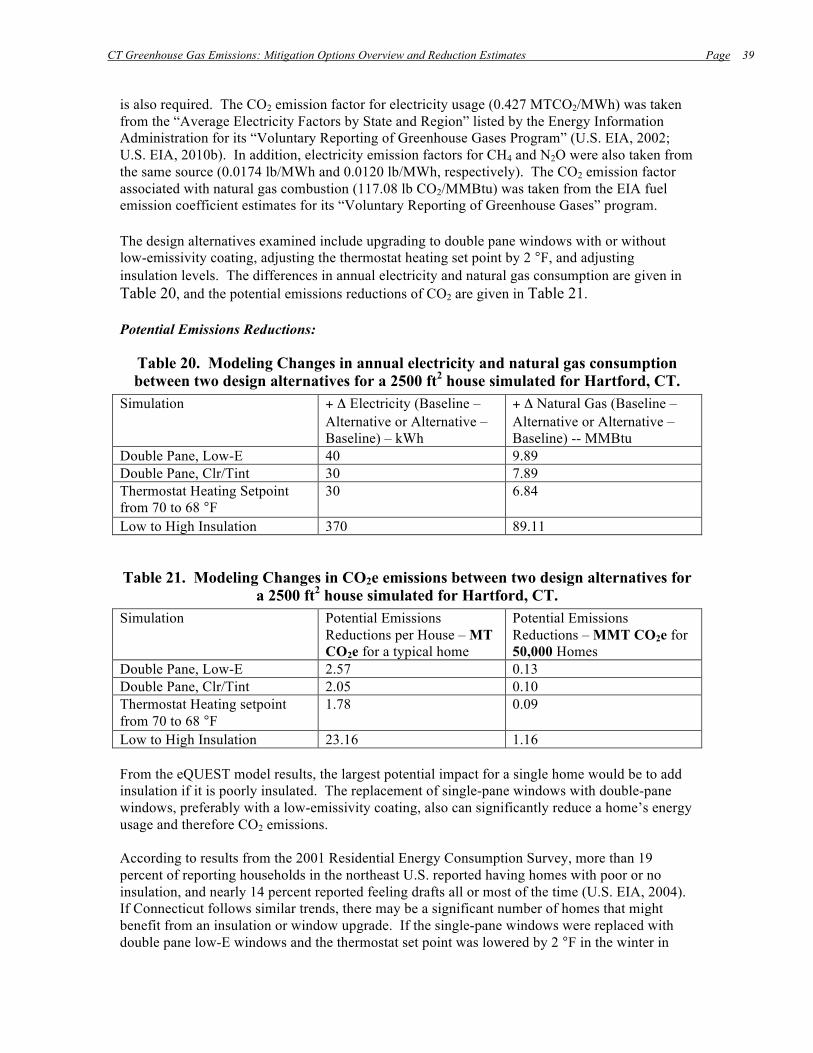
CT Greenhouse Gas Emissions: Mitigation Options Overview and Reduction Estimates Page
39
is also required. The CO2 emission factor for electricity usage (0.427 MTCO2/MWh) was taken from the “Average Electricity Factors by State and Region” listed by the Energy Information Administration for its “Voluntary Reporting of Greenhouse Gases Program” (U.S. EIA, 2002; U.S. EIA, 2010b). In addition, electricity emission factors for CH4 and N2O were also taken from the same source (0.0174 lb/MWh and 0.0120 lb/MWh, respectively). The CO2 emission factor associated with natural gas combustion (117.08 lb CO2/MMBtu) was taken from the EIA fuel emission coefficient estimates for its “Voluntary Reporting of Greenhouse Gases” program.
The design alternatives examined include upgrading to double pane windows with or without low-emissivity coating, adjusting the thermostat heating set point by 2 °F, and adjusting insulation levels. The differences in annual electricity and natural gas consumption are given in Table 20, and the potential emissions reductions of CO2 are given in Table 21.
Potential Emissions Reductions:
Table 20. Modeling Changes in annual electricity and natural gas consumption between two design alternatives for a 2500 ft2 house simulated for Hartford, CT.
Simulation + Δ Electricity (Baseline – Alternative or Alternative – Baseline) – kWh
+ Δ Natural Gas (Baseline – Alternative or Alternative – Baseline) -- MMBtu
Double Pane, Low-E 40 9.89 Double Pane, Clr/Tint 30 7.89 Thermostat Heating Setpoint from 70 to 68 °F
30 6.84
Low to High Insulation 370 89.11
Table 21. Modeling Changes in CO2e emissions between two design alternatives for a 2500 ft2 house simulated for Hartford, CT.
Simulation Potential Emissions Reductions per House – MT CO2e for a typical home
Potential Emissions Reductions – MMT CO2e for 50,000 Homes
Double Pane, Low-E 2.57 0.13 Double Pane, Clr/Tint 2.05 0.10 Thermostat Heating setpoint from 70 to 68 °F
1.78 0.09
Low to High Insulation 23.16 1.16 From the eQUEST model results, the largest potential impact for a single home would be to add insulation if it is poorly insulated. The replacement of single-pane windows with double-pane windows, preferably with a low-emissivity coating, also can significantly reduce a home’s energy usage and therefore CO2 emissions.
According to results from the 2001 Residential Energy Consumption Survey, more than 19 percent of reporting households in the northeast U.S. reported having homes with poor or no insulation, and nearly 14 percent reported feeling drafts all or most of the time (U.S. EIA, 2004). If Connecticut follows similar trends, there may be a significant number of homes that might benefit from an insulation or window upgrade. If the single-pane windows were replaced with double pane low-E windows and the thermostat set point was lowered by 2 °F in the winter in

CT Greenhouse Gas Emissions: Mitigation Options Overview and Reduction Estimates Page
40
50,000 homes, for example, the potential GHG reduction is on the order of 0.2 MMT CO2e. Adding insulation in 50,000 poorly-insulated homes would have an even larger impact and has the potential to contribute to an emissions reduction on the order of 1.2 MMT CO2e. 7. Smart Meters/Load Management Reduction Option: Smart grid technology refers to the application of advanced communications and control to the electric power infrastructure in order to improve grid efficiency and reliability (EPRI, 2008; U.S. DOE, 2008b). Smart grid includes measures like advanced metering infrastructure (AMI) involving two-way communication between utilities and “smart” meters and appliances. The expanded communications capabilities would improve utilities’ abilities to detect and respond to problems on their systems and help customers use electricity more efficiently. Through such smart devices, the utility would be able to communicate real-time prices to the consumer, which the consumer might then use to make better-informed choices on their energy usage (U.S. DOE, 2008b). A report by the Pacific Northwest National Laboratory (PNNL) indicated that smart grid technology might reduce direct CO2 emissions and energy consumption of the U.S. electric sector by 12 percent in 2030, assuming full penetration of smart grid technologies (PNNL, 2010). Measures that may lead to significant reductions in electricity consumption include the following:
• Conservation Effect of Demand Response Consumer Information: This refers to the impact of heightened consumer awareness of energy use by providing prompt, detailed energy feedback. PNNL estimates that this measure might lead to a 6 percent reduction in residential and small/medium commercial building sector electricity consumption. An analysis by EPRI assumed a lower-bound estimate of 5 percent reduction in residential energy usage with the deployment of smart grid direct feedback (EPRI, 2008).
• Smart Grid-Enabled Diagnostics in Residential and Small/Medium Commercial
Buildings: This refers to the use of real-time sensing and communication to profile systems in residential and small/medium commercial buildings to detect malfunctions and alert the consumer as malfunctions occur. These diagnostics might also be used to identify potential improvements in operation. Smart grid enabled diagnostics in residential and small/medium commercial buildings may result in a 15 percent reduction in residential electricity consumption from Heat Pumps and Air Conditioning and 20 percent reduction in small/medium commercial building electricity demand due to HVAC and lighting (PNNL, 2010).
• Conservation Voltage Reduction and Advanced Voltage Control: This refers to the use of
smart grid technologies to reduce end-user energy consumption and distribution system losses by optimally controlling the voltage seen by customers. Voltage optimization may reduce total electricity demand by 2 percent at 100 percent penetration (PNNL, 2010).
In Connecticut, Northeast Utilities plans to pilot a smart meter program focused on the conservation effect associated with increased consumer information. This program calls for 1000 smart meters to be place in homes so that they are able to judge the benefits of these devices in Connecticut specifically. Through legislative mandate, United Illuminating (UI) ran a pilot program of 1,000 residential and small business customers (all > 2,000 kWh consumers) to

CT Greenhouse Gas Emissions: Mitigation Options Overview and Reduction Estimates Page
41
analyze a time-of-day rate structure. A reduction in energy use during peak times of greater than 20 percent was observed (communication from Art Marcelynas, CT DPUC, 2010). Technical Approach: The Northeast U.S. Market Allocation model (NE-MARKAL) is a multi-sector energy model that seeks least-cost solutions to meeting future energy demand in the northeastern United States given a set of technological, economic, and environmental constraints (Goldstein et al., 2008). This model has been employed in the estimate of a number of the previous measures and we use the tool again here to give a first-order estimate of Connecticut’s electricity demand in 2020 (see Table 22). Residential and commercial sector electricity demand is required to estimate the potential GHG emissions benefits for two of the three measures examined here. MARKAL 2002 fuel consumption and electricity usage for the residential and commercial sectors were calibrated to match values reported in the EIA State Energy Data System (SEDS) (U.S. EIA, 2009d).
Table 22. Electricity demand for the residential and commercial sectors.
Electricity Demand (trillion Btu) End Use Sector 2002 2007 2020 Residential 42.6 45.6 59.4 Commercial 44.9 51.6 59.6
*2002 data come from EIA SEDS and MARKAL, 2007 data are from EIA SEDS (U.S. EIA, 2009d), and 2020 data are estimated from MARKAL.
The CO2, CH4, and N2O emission factors for electricity usage in Connecticut reported by the Energy Information Administration for its “Voluntary Reporting of Greenhouse Gases Program” (0.427 MTCO2/MWh, 0.0174 lb/MWh and 0.0120 lb/MWh, respectively) were used here (U.S. EIA, 2010b). Note that the carbon intensity of electricity generation will change if the distribution of energy sources (e.g., natural gas, nuclear, etc.) used to generate electricity in the state also changes. For this analysis, it is assumed that the current and future electricity emission factors are the same. Listed below are several useful conversion factors that are needed for the following calculations: 2.930711 x 10⁻⁴ kWh / Btu 0.45359 kg / lb 1000 kg / MT According to the 2003 Commercial Building Energy Consumption Survey, total electricity consumption for buildings with 100,000 or more square feet (large commercial buildings) accounted for just under half of the total (non-mall) commercial building consumption in the northeastern U.S. (U.S. EIA, 2008). As a result, small and medium commercial building electricity demand is estimated as half of the total commercial sector electricity demand in the following calculations. Conservation Effect of Demand Response Consumer Information Based on the PNNL and EPRI estimates, a 3 percent reduction in residential and small/medium commercial building electricity consumption is assumed at 50 percent penetration of energy feedback devices (this is far greater than Northeast Utilities’ proposed pilot program of 1000

CT Greenhouse Gas Emissions: Mitigation Options Overview and Reduction Estimates Page
42
meters distributed statewide). The 2020 baseline electricity consumption for residential and small/medium commercial buildings is 89.2 trillion Btus (i.e., [59.4 + (59.6/2)] trillion Btus). Combining this consumption estimate with the 3 percent reduction and CO2-equivalent emission factors for electricity demand in Connecticut, direct feedback devices are estimated to have a potential reduction of 0.34 MMT CO2e in 2020 at 50 percent penetration. Smart Grid-Enabled Diagnostics in Small/Medium Commercial Buildings While not specifically envisioned in the near-term, we consider the impact of this smart-grid measure on small and medium commercial buildings in the future. It is assumed that HVAC systems and lighting account for 65 percent of the total electricity consumption in small and medium commercial buildings (U.S. EIA, 2008). At 50 percent penetration, a 10 percent reduction in the small and medium commercial building HVAC electricity consumption may be achievable (PNNL, 2010). This would result in a potential CO2-equivalent reduction of 0.37 MMT CO2e. Conservation Voltage Reduction and Advanced Voltage Control At 50 percent penetration of a voltage optimization program, it is assumed that 1 percent of the total electricity consumption for all sectors could be reduced. MARKAL estimates that Connecticut’s total electricity demand in 2020 will be on the order of 138.83 tBtu. A 1 percent reduction in that electricity demand would result in a CO2-equivalent reduction of 0.17 MMT CO2e in 2020. Potential Emissions Reductions: Table 23 lists the estimated GHG reductions from smart grid opportunities if implemented at 50 percent penetration by 2020.
Table 23. Potential CO2e emissions reductions in 2020 with 50% of Smart-Grid Technology
Measure MMT CO2e Conservation Effect of Demand Response Consumer Information 0.34 Smart Grid-Enabled Diagnostics in Small/Medium Commercial Buildings 0.24 Conservation Voltage Reduction and Advanced Voltage Control 0.17 If these plus additional smart grid measures were implemented at 100 percent penetration in 2020 and the PNNL-estimated 12 percent reduction in total electricity consumption was met, smart grid technologies might achieve a total reduction of 2.1 MMT CO2e. 8. High GWP Gas Recycling Program Reduction Option: High global warming potential (GWP) gases may have hundreds or even thousands of times the climate impact of CO2. This class of gases includes HFCs, PFCs, and SF6. High GWP gases are typically used as refrigerants, aerosol propellants, solvents, fire suppressants, and in semiconductor manufacturing. Additionally they are emitted from electrical transmission systems and during aluminum, magnesium, and HCFC-22 production (U.S. EIA, 2009c; U.S. EPA, 2010b). Emissions of these gases have grown rapidly from low levels since 1990, in large part due to the use of HFCs as substitutes for chlorofluorocarbons (CFCs) and other ozone-depleting substances (ODS) phased-out under the Montreal Protocol and the federal Clean Air

CT Greenhouse Gas Emissions: Mitigation Options Overview and Reduction Estimates Page
43
Act. ODS not only destroy stratospheric ozone but are potent greenhouse gases as well (http://www.epa.gov/ozone/science/ods/ classone.html). High GWP gases accounted for 2.5 percent of U.S. GHG emissions in 2008 (U.S. EIA, 2009c). In the latest inventory of U.S. GHG emissions and sinks, refrigeration and air conditioning accounted for 90 percent of the emissions of ODS-substitutes (U.S. EPA, 2010b). These high GWP gases can be emitted during production, equipment operation and maintenance, and during equipment disposal. Without appropriate measures in place to recover these gases during maintenance and at refrigerator/air-conditioner end-of-life (e.g., recycling and recovery programs, system leak reduction, and conscientious maintenance procedures), significant amounts of potent GHGs may be emitted to the atmosphere. Technical Approach: The U.S. EPA State Inventory Tool (SIT) may be used to generate a top-down estimate of a state’s GHG emission inventory for past and future years for a number of processes and sectors (U.S. EPA, 2010a). ODS-substitute emissions for Connecticut are estimated in the SIT by apportioning national emissions based on population (ICF Consulting, 2010). National levels of ODS-substitute emissions have been estimated for the U.S. GHG inventory with the U.S. EPA Vintaging Model (U.S. EPA, 2010b). The Vintaging Model calculates ODS-substitute emissions from the existing equipment population based on estimates of the quantity of equipment and products sold each year containing ODS-substitutes and the amount of chemicals needed to manufacture and maintain the equipment over time (U.S. EPA, 2010b). It incorporates estimates for leakage and equipment retirement. According to the State Inventory Tool, Connecticut emissions of ODS-substitutes were 1.25 MMT CO2e in 2007, and these emissions are expected to grow over the next decade as ozone depleting substances continue to be phased out. While the SIT contains information to calculate recent emission levels of ODS-replacements, it does not include default information to generate a future projection of Connecticut emissions of ODS-substitutes in 2020. According to the Fifth Climate Action Report to the United Nations Framework Convention on Climate Change, national emissions of ODS-substitutes are expected to rise from 135 MMT CO2e in 2010 to 268 MMT CO2e in 2020 (U.S. Department of State, 2010). The ODS-substitute value reported for 2007 from the SIT is consistent with the Fifth Climate Action Report ODS emissions values (taken from Table 4 of that report and shown in Figure 11). This future projected national emissions level from the Climate Action Report was used along with projected 2020 national and state population estimates from the U.S. Census Bureau to estimate 2020 emissions of ODS-substitutes in Connecticut (U.S. Department of State, 2010; U.S. Census Bureau, 2005.
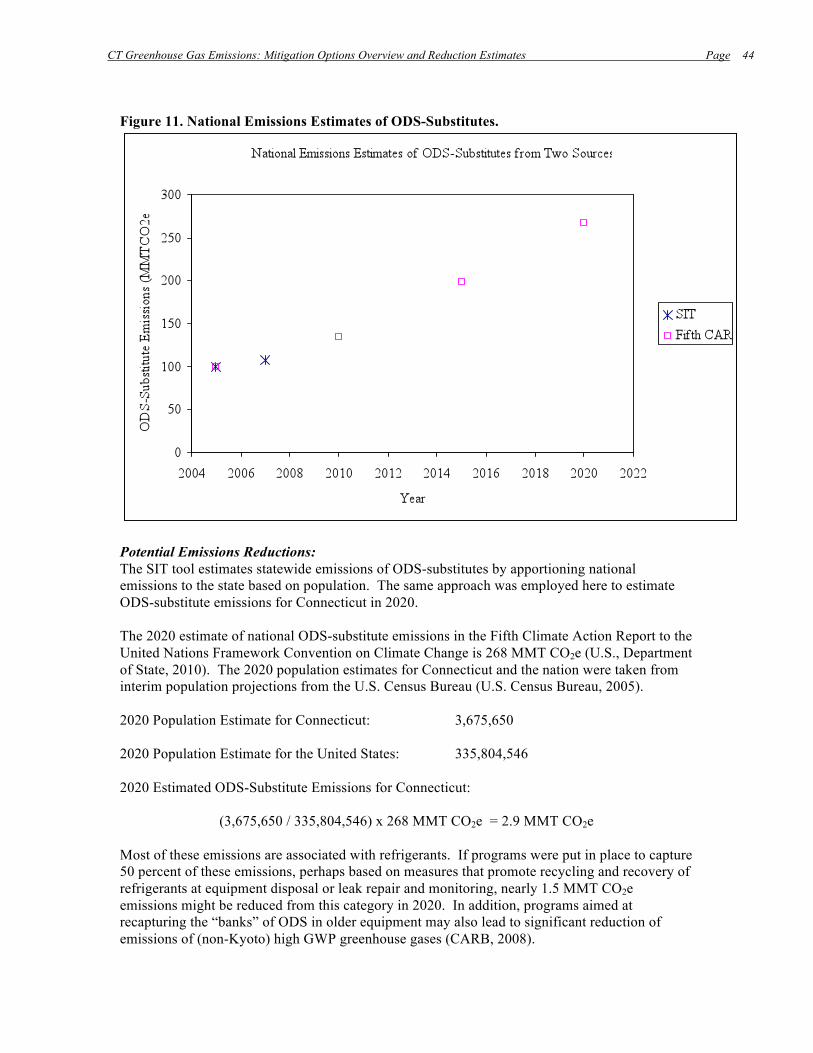
CT Greenhouse Gas Emissions: Mitigation Options Overview and Reduction Estimates Page
44
Figure 11. National Emissions Estimates of ODS-Substitutes.
Potential Emissions Reductions: The SIT tool estimates statewide emissions of ODS-substitutes by apportioning national emissions to the state based on population. The same approach was employed here to estimate ODS-substitute emissions for Connecticut in 2020. The 2020 estimate of national ODS-substitute emissions in the Fifth Climate Action Report to the United Nations Framework Convention on Climate Change is 268 MMT CO2e (U.S., Department of State, 2010). The 2020 population estimates for Connecticut and the nation were taken from interim population projections from the U.S. Census Bureau (U.S. Census Bureau, 2005). 2020 Population Estimate for Connecticut: 3,675,650 2020 Population Estimate for the United States: 335,804,546 2020 Estimated ODS-Substitute Emissions for Connecticut:
(3,675,650 / 335,804,546) x 268 MMT CO2e = 2.9 MMT CO2e Most of these emissions are associated with refrigerants. If programs were put in place to capture 50 percent of these emissions, perhaps based on measures that promote recycling and recovery of refrigerants at equipment disposal or leak repair and monitoring, nearly 1.5 MMT CO2e emissions might be reduced from this category in 2020. In addition, programs aimed at recapturing the “banks” of ODS in older equipment may also lead to significant reduction of emissions of (non-Kyoto) high GWP greenhouse gases (CARB, 2008).
CT Greenhouse Gas Emissions: Mitigation Options Overview and Reduction Estimates Page
45
9. Commercial District Heating Reduction Option: In 2006, 330 trillion BTUs of primary energy (i.e., energy content of fuels) was used to generate 100 trillion BTUs of final energy in the form of electricity (32,000 KWh) in Connecticut (CASE, 2009). The excess energy escaped in the form of waste heat into the air and water. District energy (heating and cooling) and combined heat and power (CHP) provide an opportunity to use the waste heat for space heating and cooling. This is of particular importance on peak summer days when the grid is strained to meet the state’s electricity-powered cooling demand. District heating and cooling is available in some Connecticut municipalities; these facilities generate steam, hot water, or chilled water using oil, natural, gas, or electricity, or a combination of the three, and may cogenerate power (e.g., Hartford Steam). In areas where an EGU and a district heating and cooling center are in close vicinity, existing infrastructure might allow utilization of waste heat and reduce fossil fuel use. In areas where there is no thermal distribution center but high population and business density, the necessary infrastructure investments might prevent the potential of district heat and power from being realized, particularly in lieu of constraints on long-term electricity purchase contracts. CHP requires less infrastructure investment as waste heat is delivered directly to a customer and not to a thermal distribution center. Examples of CHP are often cogeneration facilities that own both the EGU and the building or process using the waste heat (e.g., Yale University and University of Connecticut at Storrs). There are significant policy and economic considerations attached to CHP for an EGU and outside business. The Connecticut Academy of Science and Engineering (CASE) examined the potential for district heating and cooling and CHP, as well as waste heat applications including increasing electricity efficiency, industrial ecology parks, greenhouses, algae farms, and LNG vaporization (CASE, 2009). The initial findings from its study on the location of EGUs in high population density areas and central business areas has been used to make an initial estimate of the GHG emissions reduction potential of large commercial CHP and district heating and cooling in Connecticut. Technical Approach: CASE identified EGUs with greater than 65 MW capacity and overlaid them on maps with population density and businesses with more than 15 employees. EGUs from these maps in areas of high population density or a central business district are listed in Table 24.
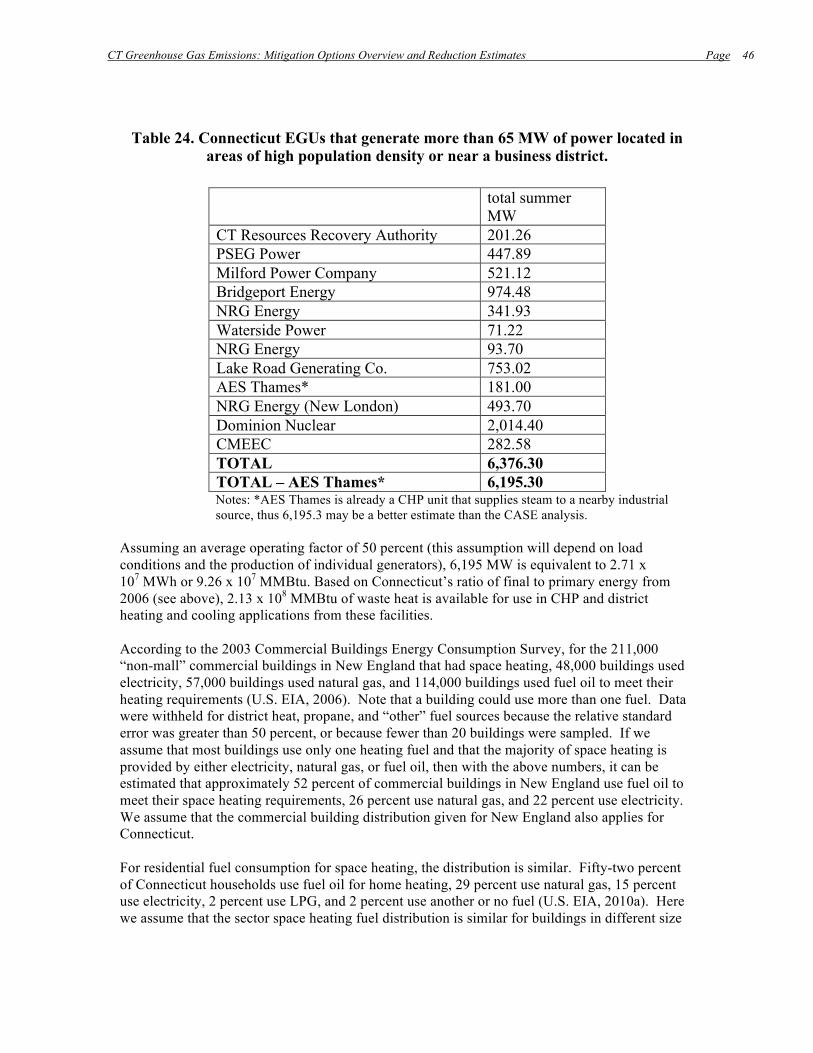
CT Greenhouse Gas Emissions: Mitigation Options Overview and Reduction Estimates Page
46
Table 24. Connecticut EGUs that generate more than 65 MW of power located in areas of high population density or near a business district.
total summer
MW CT Resources Recovery Authority 201.26 PSEG Power 447.89 Milford Power Company 521.12 Bridgeport Energy 974.48 NRG Energy 341.93 Waterside Power 71.22 NRG Energy 93.70 Lake Road Generating Co. 753.02 AES Thames* 181.00 NRG Energy (New London) 493.70 Dominion Nuclear 2,014.40 CMEEC 282.58 TOTAL 6,376.30 TOTAL – AES Thames* 6,195.30 Notes: *AES Thames is already a CHP unit that supplies steam to a nearby industrial source, thus 6,195.3 may be a better estimate than the CASE analysis.
Assuming an average operating factor of 50 percent (this assumption will depend on load conditions and the production of individual generators), 6,195 MW is equivalent to 2.71 x 10⁷ MWh or 9.26 x 10⁷ MMBtu. Based on Connecticut’s ratio of final to primary energy from 2006 (see above), 2.13 x 10⁸ MMBtu of waste heat is available for use in CHP and district heating and cooling applications from these facilities. According to the 2003 Commercial Buildings Energy Consumption Survey, for the 211,000 “non-mall” commercial buildings in New England that had space heating, 48,000 buildings used electricity, 57,000 buildings used natural gas, and 114,000 buildings used fuel oil to meet their heating requirements (U.S. EIA, 2006). Note that a building could use more than one fuel. Data were withheld for district heat, propane, and “other” fuel sources because the relative standard error was greater than 50 percent, or because fewer than 20 buildings were sampled. If we assume that most buildings use only one heating fuel and that the majority of space heating is provided by either electricity, natural gas, or fuel oil, then with the above numbers, it can be estimated that approximately 52 percent of commercial buildings in New England use fuel oil to meet their space heating requirements, 26 percent use natural gas, and 22 percent use electricity. We assume that the commercial building distribution given for New England also applies for Connecticut. For residential fuel consumption for space heating, the distribution is similar. Fifty-two percent of Connecticut households use fuel oil for home heating, 29 percent use natural gas, 15 percent use electricity, 2 percent use LPG, and 2 percent use another or no fuel (U.S. EIA, 2010a). Here we assume that the sector space heating fuel distribution is similar for buildings in different size

CT Greenhouse Gas Emissions: Mitigation Options Overview and Reduction Estimates Page
47
ranges and that the percentage households using a given fuel equals the percentage of sector space heating energy requirements met by that fuel. Several CO2 emission factors from U.S. EIA (2002) and from the EIA Voluntary Reporting of GHGs program (U.S. EIA, 2002; U.S. EIA, 2010b) have been used to estimate GHG reduction potentials. These include the following: 117.08 lb CO2/MMBtu for natural gas 161.386 lb CO2/MMBtu for distillate oil 139.039 lb CO2/MMBtu for LPG 0.427 MT CO2/MWh for electricity The following conversion factors have been used in the calculations to follow: 2.930711 x 10⁻⁴ kWh/Btu 0.45359 kg/lb An average CO2 emission factor for commercial heating (assuming all space heating comes from natural gas, distillate fuel, or electricity):
An average CO2 emission factor for residential heating is calculated as (assuming that the 2 percent households using “other” or no fuel do not contribute to CO2 emissions):
We recall that 2.13 x 10⁸ MMBtu escapes as waste heat and that 1 MWh = 3.412 MMBtu. Assuming that half of that waste heat can be used to replace the heating fuel consumption for residential and commercial buildings, and is equally split between residential and commercial customers, we can calculate the CO2 emissions reduction with the equation given below. Potential Emissions Reductions: The estimated CO2 emissions reduction from the capture and distribution of waste heat from approximately 11 large EGUs that are centrally located in Connecticut is calculated by using the equation below:
The potential CO2 emission reduction is approximately 8.1 MMT annually without the contribution of AES Thames which is already providing waste heat to nearby industrial facilities.
CT Greenhouse Gas Emissions: Mitigation Options Overview and Reduction Estimates Page
48
2.4. CT GHG Emissions Reduction Options: Land Use Change and Forestry Sector
Land Use Change and Forestry (LUCF) is the only sector that is capable of negative GHG emissions (it can be a GHG sink rather than a GHG source). In addition to GHG emissions from fertilizer use, tillage and composting, LUCF includes afforestation and other changes in land use that result in CO2 uptake and storage. The effect can be an overall net negative CO2 emissions rate for this sector. While the impact of this sector on statewide emissions has the potential to account for as much as 10 percent of the total CT GHG Inventory, the available data is of lower quality than comparable data on fuel consumption or industrial processes. The only currently available estimates of net GHG emissions from land use change and forestry (LUCF) in Connecticut come from the U.S. EPA’s State Inventory Tool (SIT). According to the most recent iteration of the SIT, the LUCF sector shifted from being a net “sink” of 4.2 million metric tons of CO2e in 1990 to an emissions source of nearly 4.5 MMT CO2e in 2007. This is a shift of nearly 9 MMT CO2e, which represents about one-quarter of Connecticut’s total annual 2007 CO2e emissions. CTDEP believes that changes in methodology and reporting between 1997 and 1999 created a significant change in the data, which result in the observed switch from net GHG sink to source for this source category.16 The sub-categories of land use change and forestry which accounted for the changes include forest carbon, soil organic carbon, and landfilled yard waste. With no known causal change in actual conditions to accompany it, the change from 1997 to 1999 (over 200 percent increase) is indicative of a change in source data or methodology as opposed to an actual increase in LUCF related GHG emissions. No event or series of events can explain the shift from a steady state of sequestration to a steady state of net emissions increase over such a short period of time. Urban trees increased carbon uptake moderately from 0.70 MMT CO2e in 1990 to 0.89 MMT CO2e in 2006. This increase was likely due to an expansion of urban area in Connecticut over that same time period. Other categories of LUCF included in the U.S. EPA SIT estimates—agricultural soil liming, non-CO2 emissions from forest fires, and N2O emissions from settlement soils—are estimated to have zero or negligible impact on Connecticut’s LUCF GHG inventory. 1. Implement State Waste Management Plan Reduction Option: In 2006, CT DEP released a Solid Waste Management Plan that covers the state’s management of solid waste for FY 2005 through FY 2024. The plan, which represents a comprehensive approach to solid waste management, outlines eight objectives and 75 strategies to achieve the plan’s three main goals. These goals are: (1) increased source reduction, reuse, and recycling; (2) “efficient, equitable and environmentally protective” management of solid waste that must be disposed; and (3) adoption of long-term funding mechanisms that provide state revenue while also providing incentives to reduce waste and increase diversion (CT DEP, 2006). The plan includes four projection scenarios for municipal solid waste (MSW) diversion rates in future years: (1) the current MSW diversion from disposal rate remains at 2005 levels (30 percent) through 2024; (2) the MSW diversion rate increases to 40 percent by 2015 and remains at that level through 2024;
16 Based in large part on this historical dichotomy, NESCAUM identified the Land Use and Forestry sector as an area where significant improvements to the SIT can be made as part of a State or Regional effort (NESCAUM, 2009).

CT Greenhouse Gas Emissions: Mitigation Options Overview and Reduction Estimates Page
49
(3) the MSW diversion rate increases to 49 percent by 2024; and (4) the MSW diversion rate increases to 58 percent by 2024. The fourth scenario is the plan’s target because it would eliminate the in-state disposal capacity shortfall by 2024. The shortfall is defined as the MSW disposed subtracted from the in-state disposal capacity. Connecticut has become increasingly dependent on out-of-state landfills. Eradication of the shortfall would reduce risk due to disposal cost fluctuations or availability. The potential reduction in CO2 emissions in 2020 for scenarios (2) – (4) relative to the scenario (1) baseline are estimated below. Technical Approach: In order to estimate the GHG benefits of different solid waste management scenarios, the U.S. EPA’s Waste Reduction Model (“WARM” version 10) (U.S. EPA, 2009b) was applied to the 2020 waste stream estimated for the four scenarios described above. WARM is a spreadsheet model that calculates GHG emissions for baseline and alternative waste management scenarios (U.S. EPA, 2009c). Tables J-1 through J-4 in Appendix J of the Solid Waste Management Plan contain annual totals of MSW generated, MSW diverted from disposal, in-state disposal capacity, and in-state disposal capacity shortfall (Table 25). The entries for 2020 in these tables were the basis of the total MSW tonnage generated and diverted used in WARM. WARM also requires information on the materials and the specific endpoints of the waste (i.e., tons recycled, combusted, composted, and landfilled). In order to estimate this distribution of the total waste stream, both in material and endpoint, we used the version 7 WARM analysis described in Appendix I-6 of the Connecticut Solid Waste Management Plan. The distribution of material in the total waste stream in 2005 (Table I-9 of Appendix I-6) was applied to the 2020 waste totals (Table 25) in order to estimate the distribution of waste materials in 2020 (Table 26).
Table 25. Future Solid Waste Management Scenario Totals from Tables J-1 – J-4 of CT Solid Waste Management Plan (CT DEP, 2006).
Fiscal Year MSW Generated (000 T/yr)
MSW Diverted from Disposal (000 T/yr)
In-state RRF Disposal Capacity (000 T/yr)
2005 3,805 1,133 2,344 2020 (30% diversion in 2020 and 2024) 4,879 1,464 2,209
2020 (40% diversion in 2020 and 2024) 4,879 1,951 2,209
2020 (45% diversion in 2020; 49% diversion in 2024)
4,879 2,185 2,209
2020 (52% diversion in 2020; 58% diversion in 2024)
4,879 2,537 2,209

CT Greenhouse Gas Emissions: Mitigation Options Overview and Reduction Estimates Page
50
Table 26. Distribution of waste by material category for 2005, 2020, and 2024. The 2020 and 2024 distributions are based on 2005 percentages, listed in the Solid Waste
Management Plan, Appendix I-6, applied to 2020 and 2024 waste totals (CT DEP, 2006).
Breakdown PERCENTAGE 2005 Tonnage 2020 Tonnage 2024 Tonnage Newspaper* 4.96 188,917.9 242,241.9 259,817.9 Corrugated Cardboard 7.17 272,818.5 349,824.3 375,206.1 Mixed Paper (General) 7.11 270,440.0 346,774.4 371,935.0 Office Paper 2.38 90,635.1 116,217.8 124,650.1 PET 1.02 38,814.8 49,770.7 53,381.8 HDPE 0.68 25,695.2 32,947.9 35,338.4 Mixed Plastics 10.80 411,115.0 527,156.4 565,404.7 Glass 3.25 123,662.5 158,567.5 170,072.5 Aluminum Cans 0.29 10,996.5 14,100.3 15,123.4 Mixed Metals 4.71 179,253.6 229,849.7 246,526.6 Yard Trimmings 3.40 129,370.0 165,886.0 177,922.0 Food Scraps 14.01 533,136.1 683,619.1 733,219.7 Personal Computers 2.00 76,100.0 97,580.0 104,660.0 Mixed Organics 13.09 497,915.1 638,456.7 684,780.4 Mixed Recyclables 18.64 709,263.4 909,460.2 975,446.9 Mixed MSW 6.49 246,866.1 316,546.6 339,513.9 Total 100.00 3,804,999.6 4,878,999.5 5,232,999.5 Notes: *While the newspaper waste levels are more likely to remain level or decrease in the future, we chose to scale each category of 2005 waste uniformly to match 2020 and 2024 solid waste totals given that we lack a basis for developing detailed sector-specific growth or control factors. The estimates of 2020 waste material endpoints are based on the 2005 distribution of waste stream endpoints (from Table I-9 of Appendix I-6 of the Connecticut Solid Waste Management Plan) but adjusted based on the increased total tons of waste in 2020 and limited by a future resource recovery facility (RRF) capacity of 2,209,000 tons. The “composted” category, which is small, was simply scaled up based on the increased total waste in 2020. The methodology for distributing the specific waste materials to recycling, composting, combusting, or landfilling endpoints is outlined below for the baseline scenario (Business As Usual = 30 percent diversion rate in 2020, the same diversion rate in 2005). (1) Those materials that were composted in 2005 (i.e., yard trimmings and food scraps) were scaled up to 2020 levels using 2005 and 2020 MSW generation totals and 2005 material composted (e.g., 2020 base case food scraps composted = (Tons Food Scraps Composted in 2005) / (Tons MSW Generated in 2005, 3805000 T/yr) x (Tons MSW Generated in 2020, 4,879,000 T/yr); (2) The amount of each material recycled in the 2020 base case was estimated by multiplying the total amount of all material recycled in 2020 (i.e., Total MSW Diverted in 2020 – Total MSW Composted in 2020) by the 2005 ratio of specific material recycled to total of all materials recycled; (3) Material combusted at RRFs in 2020 was estimated with the RRF capacity limitations in mind. The tonnage of a specific material combusted is calculated as the fraction of the total of that material landfilled or combusted in 2020 multiplied by the RRF capacity:
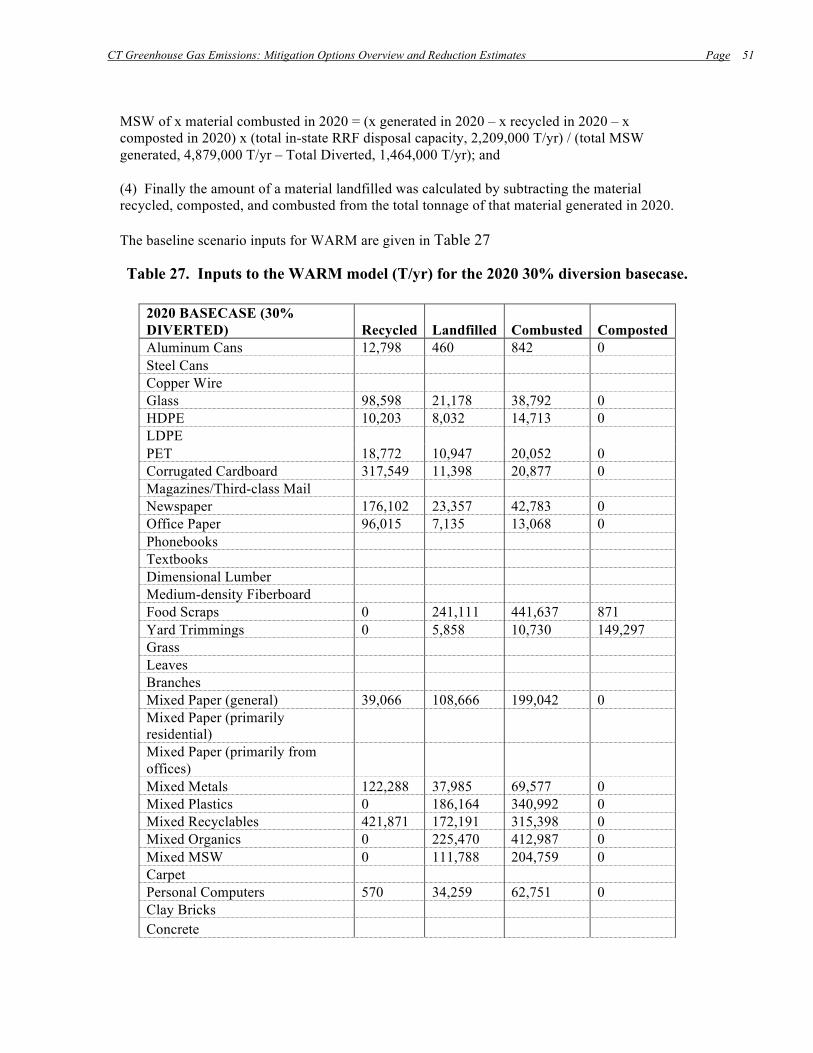
CT Greenhouse Gas Emissions: Mitigation Options Overview and Reduction Estimates Page
51
MSW of x material combusted in 2020 = (x generated in 2020 – x recycled in 2020 – x composted in 2020) x (total in-state RRF disposal capacity, 2,209,000 T/yr) / (total MSW generated, 4,879,000 T/yr – Total Diverted, 1,464,000 T/yr); and (4) Finally the amount of a material landfilled was calculated by subtracting the material recycled, composted, and combusted from the total tonnage of that material generated in 2020. The baseline scenario inputs for WARM are given in Table 27
Table 27. Inputs to the WARM model (T/yr) for the 2020 30% diversion basecase.
2020 BASECASE (30% DIVERTED) Recycled Landfilled Combusted Composted Aluminum Cans 12,798 460 842 0 Steel Cans Copper Wire Glass 98,598 21,178 38,792 0 HDPE 10,203 8,032 14,713 0 LDPE PET 18,772 10,947 20,052 0 Corrugated Cardboard 317,549 11,398 20,877 0 Magazines/Third-class Mail Newspaper 176,102 23,357 42,783 0 Office Paper 96,015 7,135 13,068 0 Phonebooks Textbooks Dimensional Lumber Medium-density Fiberboard Food Scraps 0 241,111 441,637 871 Yard Trimmings 0 5,858 10,730 149,297 Grass Leaves Branches Mixed Paper (general) 39,066 108,666 199,042 0 Mixed Paper (primarily residential) Mixed Paper (primarily from offices) Mixed Metals 122,288 37,985 69,577 0 Mixed Plastics 0 186,164 340,992 0 Mixed Recyclables 421,871 172,191 315,398 0 Mixed Organics 0 225,470 412,987 0 Mixed MSW 0 111,788 204,759 0 Carpet Personal Computers 570 34,259 62,751 0 Clay Bricks Concrete

CT Greenhouse Gas Emissions: Mitigation Options Overview and Reduction Estimates Page
52
Fly Ash Tires
In order to achieve the increased diversion rates of the three alternative scenarios, the categories chosen for analysis in Appendix I-6 of the Solid Waste Management Plan (i.e., increased recycling of Mixed Paper (General), Personal Computers, and Mixed Recyclables, along with increased composting of food scraps) were also used here. The categories were diverted by an equal percentage of the category total to achieve the total diversion rates required for each scenario. In order to achieve 40 percent, 45 percent, and 52 percent total diversion, 46.6 percent, 58.1 percent, and 75.4 percent, respectively, of the MSW generated for those four categories was recycled or composted. Table 29, Table 30, and Table 30 show the WARM inputs for scenarios 2-4 broken down by material type and disposal pathway.
Table 28. Inputs to the WARM model (T/yr) for the 2020 40% diversion scenario (40% diversion in 2024 scenario from CT DEP, 2006).
2020 SCENARIO 1 (40% DIVERTED) Recycled Landfilled Combusted Composted Aluminum Cans 12,798 320 982 0 Steel Cans Copper Wire Glass 98,598 14,726 45,244 0 HDPE 10,203 5,585 17,160 0 LDPE PET 18,772 7,612 23,387 0 Corrugated Cardboard 317,549 7,925 24,350 0 Magazines/Third-class Mail Newspaper 176,102 16,241 49,899 0 Office Paper 96,015 4,961 15,242 0 Phonebooks Textbooks Dimensional Lumber Medium-density Fiberboard Food Scraps 0 89,648 275,427 318,544 Yard Trimmings 0 4,073 12,515 149,297 Grass Leaves Branches Mixed Paper (general) 161,585 45,475 139,714 0 Mixed Paper (primarily residential) Mixed Paper (primarily from offices) Mixed Metals 122,288 26,413 81,149 0 Mixed Plastics 0 129,448 397,708 0 Mixed Recyclables 423,779 119,264 366,417 0
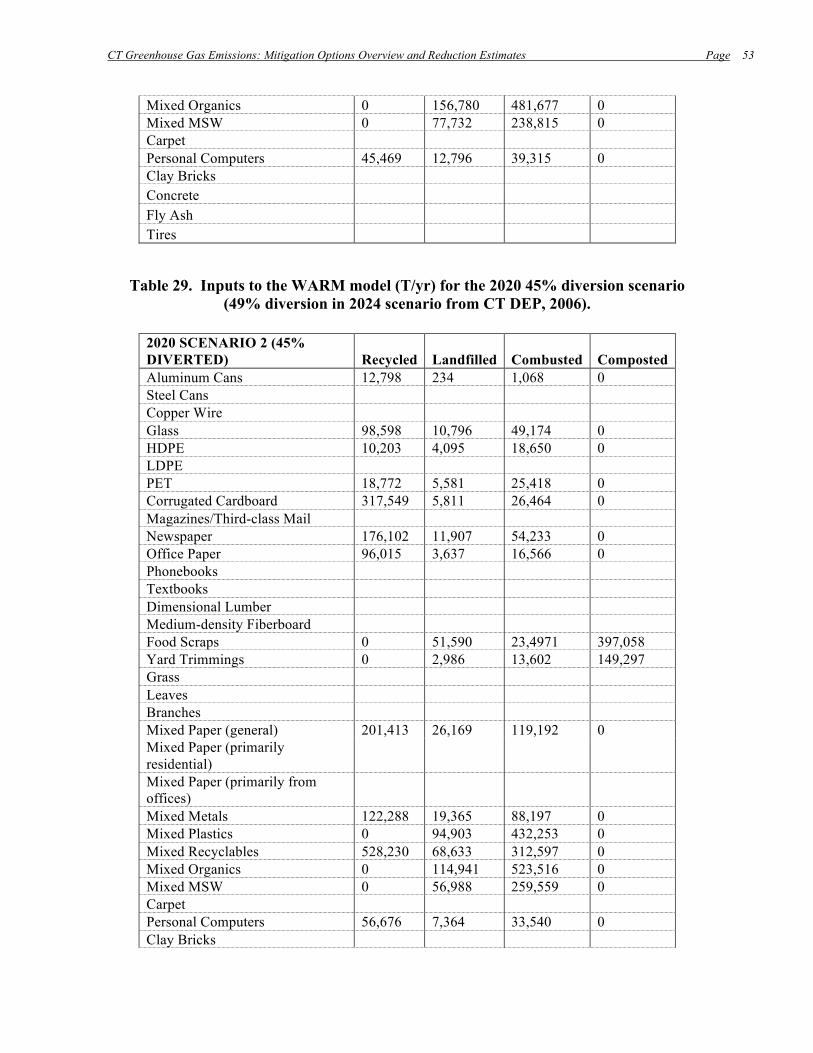
CT Greenhouse Gas Emissions: Mitigation Options Overview and Reduction Estimates Page
53
Mixed Organics 0 156,780 481,677 0 Mixed MSW 0 77,732 238,815 0 Carpet Personal Computers 45,469 12,796 39,315 0 Clay Bricks Concrete Fly Ash Tires
Table 29. Inputs to the WARM model (T/yr) for the 2020 45% diversion scenario (49% diversion in 2024 scenario from CT DEP, 2006).
2020 SCENARIO 2 (45% DIVERTED) Recycled Landfilled Combusted Composted Aluminum Cans 12,798 234 1,068 0 Steel Cans Copper Wire Glass 98,598 10,796 49,174 0 HDPE 10,203 4,095 18,650 0 LDPE PET 18,772 5,581 25,418 0 Corrugated Cardboard 317,549 5,811 26,464 0 Magazines/Third-class Mail Newspaper 176,102 11,907 54,233 0 Office Paper 96,015 3,637 16,566 0 Phonebooks Textbooks Dimensional Lumber Medium-density Fiberboard Food Scraps 0 51,590 23,4971 397,058 Yard Trimmings 0 2,986 13,602 149,297 Grass Leaves Branches Mixed Paper (general) 201,413 26,169 119,192 0 Mixed Paper (primarily residential) Mixed Paper (primarily from offices) Mixed Metals 122,288 19,365 88,197 0 Mixed Plastics 0 94,903 432,253 0 Mixed Recyclables 528,230 68,633 312,597 0 Mixed Organics 0 114,941 523,516 0 Mixed MSW 0 56,988 259,559 0 Carpet Personal Computers 56,676 7,364 33,540 0 Clay Bricks

CT Greenhouse Gas Emissions: Mitigation Options Overview and Reduction Estimates Page
54
Concrete Fly Ash Tires
Table 30. Inputs to the WARM model (T/yr) for the 2020 52% diversion scenario (58% diversion in 2024 scenario from CT DEP, 2006).
2020 SCENARIO 3 (52% DIVERTED) Recycled Landfilled Combusted Composted Aluminum Cans 12,798 74 1,228 0 Steel Cans Copper Wire Glass 98,598 3,406 56,564 0 HDPE 10,203 1,292 21,453 0 LDPE PET 18,772 1,761 29,238 0 Corrugated Cardboard 317,549 1,833 30,442 0 Magazines/Third-class Mail Newspaper 176,102 3,756 62,384 0 Office Paper 96,015 1,147 19,056 0 Phonebooks Textbooks Dimensional Lumber Medium-density Fiberboard Food Scraps 0 9,566 158,888 515,165 Yard Trimmings 0 942 15,647 149,296 Grass Leaves Branches Mixed Paper (general) 261,323 4,853 80,598 0 Mixed Paper (primarily residential) Mixed Paper (primarily from offices) Mixed Metals 122,288 6,109 101,453 0 Mixed Plastics 0 29,936 497,220 0 Mixed Recyclables 685,355 12,727 211,378 0 Mixed Organics 0 36,258 602,199 0 Mixed MSW 0 17,977 298,570 0 Carpet Personal Computers 73,534 1,366 22,680 0 Clay Bricks Concrete Fly Ash Tires
CT Greenhouse Gas Emissions: Mitigation Options Overview and Reduction Estimates Page
55
Potential Emissions Reductions: WARM version 10 was run with the inputs listed above in Table 28, Table 29, Table 30, and Table 30 and the following assumptions:
• All landfills have a landfill gas control system in place that flares landfill gas rather than recovering it for energy;
• Landfill gas control systems operate with 75 percent gas collection system efficiency; • Emissions that occur during transport of materials to the management facility were
updated from the default distances as described in Appendix I-6 of the Solid Waste Management Plan (CT DEP, 2006). For MSW being transported to out-of-state landfills, the average transportation distance is assumed to be 300 miles. For materials recycled, composted, or combusted, it is assumed that these are transported within the state of Connecticut with an average transportation distance of 50 miles.
WARM indicates that an increase from a 30 percent disposal diversion (scenario 1) to a 40 percent diversion (scenario 2) in 2020 leads to a GHG reduction of 0.6 MMT CO2e. Increasing the disposal diversion to 45 percent (scenario 3) will lead to a GHG reduction of 1.0 MMT CO2e. If Connecticut remains on track to reach its Solid Waste Management Plan target of 58 percent waste diversion by 2024 and reaches 52 percent diversion by 2020, this will lead to a GHG reduction of 1.6 MMT CO2e beyond a business-as-usual diversion rate of 30 percent in 2020. 2. Conserve and Enhance Carbon Sequestration Levels in CT’s Forests and Fields Reduction Option: Forests, grasslands, and agricultural lands are a potential carbon sinks. However based on EPA’s SIT, Connecticut’s land use sector is currently a GHG source17. This may, in part, be due to loss of forest and agricultural lands to development. With conservation efforts supplemented by improved management practices such as no-till agriculture and regular forest “thinning” or “re-stocking,” terrestrial ecosystems could potentially sequester more carbon and turn this source of GHG emissions into a sink. Technical Approach: In its report, Terrestrial Carbon Sequestration in the Northeast (TNC, 2007), The Nature Conservancy analyzed and summarized the potential for increased carbon sequestration through implementation of various land-use activities including tree planting, varied forest management strategies and agricultural management strategies across the Northeast region. This report estimates that the land use sector in Connecticut is currently a source of GHG emssions, with net emissions in Connecticut estimated at 66,000 tons CO2e annually. Total CO2e emissions (positive numbers) and sequestration (negative numbers) for Connecticut’s land use sector are provided in Table 31.
17 See discussion page 49, infra.

CT Greenhouse Gas Emissions: Mitigation Options Overview and Reduction Estimates Page
56
Table 31. Estimated sinks (-) and sources (+) of carbon
MMT CO2e
Land Use Change (soil only) -0.008 Conservation Tillage -0.038 Histosol Cultivation 0 Rural Forests 0.977 Urban Forests -0.0746 Wood Products -0.119 Total Net Emissions 0.066
Source: TNC (2007). The Nature Conservancy also analyzed the potential for cost effective land use management practices assuming “permanent contract” or long-term changes in the management of agricultural lands and forests. In Connecticut, based solely on the sequestration value of the vegetation, perennial vegetation is a greater carbon sink (and cheaper to obtain) than cultivated crops. However, this does not take into account the carbon benefits associated with growing food locally. With respect to forest lands, restocking under-stocked forests and extending forest rotation have the lowest average overall marginal cost. Table 32 provides some results of The Nature Conservancy’s analysis for Connecticut.
Table 32. Acreage, maximum technical sequestration potential, and economic sequestration potential through land-use measures in Connecticut.
Agricultural Land Forest
Land Area by Category (Acres)
381,712 (109,585 acres pasture, 110,927 acres cropland)
2,033,515
Management Strategy Afforest Cropland
Afforest Pasture
No-Till Non-cultivated
Crops
Restock Stands
Extend Rotation
Riparian Buffer
Maximum estimated sequestration – 20 years for agricultural land, permanently for forestland (MMTCO2e)
6.62 16.19 0.19 0.47 0.08 0.08
Potential estimated sequestration at marginal cost below $7/ton– 20 years for ag. land, permanently for forestland (MMTCO2e)
0.046
Source: TNC (2007) In reviewing the various cost-bins within the Connecticut-specific reduction opportunities, we find that the only reduction opportunity available at less than $7/ton within Connecticut is the restocking of poorly stocked forest land with a maximum potential of 0.046 MMT cumulatively over the life of the forest.
CT Greenhouse Gas Emissions: Mitigation Options Overview and Reduction Estimates Page
57
The Connecticut Department of Environmental Protection and the Department of Agriculture have already developed programs aimed at the long-term conservation of forest and agricultural lands. The lands included in these plans represent only a subset of the overall agricultural and forest land surveyed by The Nature Conservancy, yet they represent an important first step toward achieving the total technical potential available through land use management practices. The DEP plan, The Green Plan: Guiding Land Acquisition and Protection in Connecticut, 2007-2012, (CT DEP, 2007) is based on a statutory target to protect 21 percent of the Connecticut’s undeveloped, “open-space” land by 2023. This is equivalent to 673,210 acres under state ownership as well as private, NGO, or water utility ownership. If conserved through the DEP program, it is assumed that CT DEP would be able to advise land management practices for the entire 21 percent. The DEP is currently seeking additional input and data from stakeholders on the tracking of potentially conserved lands so that quantitative estimates of carbon storage can be developed for various assumed land management practices. The Connecticut Department of Agriculture has a similar goal to protect 130,000 acres of agricultural land (CT DOAG, 2009), including 85,000 acres of cropland. The goal of this voluntary program is to preserve an agricultural community in the state and provide access to locally-grown produce, so afforestation of this land was not considered as a state agricultural goal. Conversion of agricultural lands to perennial crops should be considered with this goal in mind (e.g. a decision to convert green bean crops to fruit trees would depend on the availability of sufficient local green bean cultivation). As with forest land, it is assumed that the CT DOAG would be able to prescribe land management practices for this land. A follow-up analysis with detailed acreage estimates of land-types available through these programs is needed before a quantitative estimate of GHG reduction potential can be calculated, but it is likely to be significantly less than the state-wide technical potential totals identified by TNC in Table 32. Potential Emissions Reductions: Based on The Nature Conservancy’s analysis, we estimate that Connecticut could reduce or sequester up to 0.046 MMT CO2e forest lands for less than $7 per ton of CO2e. At $20 per ton, additional forest and agricultural sequestration potential exists but should be considered in the context of current land preservation goals of the CT DEP and the CT DOAG.

CT Greenhouse Gas Emissions: Mitigation Options Overview and Reduction Estimates Page
58
References
Cascade Sierra Solutions (2008). Guide to Saving Fuel and Reducing Emissions. Available at: https://secure.cascadesierrasolutions.org/downloads/documents/CSS-Guide-Fall08-Web.pdf. CARB (California Air Resources Board) (2008). Climate Change Scoping Plan: A Framework for Change. California Air Resource Board, Sacramento, CA. Available at: http://www.arb.ca.gov/cc/scopingplan/document/adopted_scoping_plan.pdf. CARB (California Air Resources Board) (2009). The California Low-Emission Vehicle Regulations for Passenger Cars, Light-Duty Trucks and Medium-Duty Vehicles, California Air Resource Board, Sacramento, CA. CARB (California Air Resources Board) (2010). Analysis of Feebate Programs in California and §177 States: report forthcoming, California Air Resources Board, Sacramento, CA. CASE (Connecticut Academy of Science and Engineering) (2009). A Study of the Feasibility of Utilizing Waste Heat from Central Electric Power Generating Stations and Potential Applications. Available at: http://www.ctcase.org/reports/index.html. CFOCB (2010). 2009 Annual Report to the Energy and Technology and Environmental Committees of the Connecticut General Assembly. Connecticut Fuel Oil Conservation Board, Hartford, CT, Submitted for Review May 2010. CLP et al. (2009). The Connecticut Light and Power Company, The United Illuminating Company, Yankee Gas Services Company, Connecticut Natural Gas Corporation, and The Southern Connecticut Gas Company. 2010 Electric and Natural Gas Conservation and Load Management Plan. Docket No. 09-10-03/ Docket No. 08-10-02, October 1, 2009. Connecticut (2005). Connecticut Climate Action Plan, Governor’s Steering Committee on Climate Change and Climate Change Coordinating Committee, Hartford, CT. Available at: http://ctclimatechange.com/index.php/2005-connecticut-climate-action-plan/. CT DEP (Connecticut Department of Environmental Protection) (2006). State Solid Waste Management Plan: Changing the Balance. Available at: http://www.ct.gov/dep/swmp. CT DEP (Connecticut Department of Environmental Protection) (2007). The Green Plan: Guiding Land Acquisition and Protection in Connecticut, 2007-2012, Available at: http://www.ct.gov/dep/lib/dep/open_space/green_plan.pdf. CT DOAG (Connecticut Department of Agriculture) (2009). Farmland Preservation Program, 2009 Annual Summary Report, Available at: http://www.ct.gov/doag/lib/doag/farmland_preservation_/2009_annual_report_summary.pdf. CT DPUC (Connecticut Department of Public Utility Control) (2010). Connecticut Renewable Portfolio Standard Overview. Available at: http://www.ct.gov/dpuc/cwp/view.asp?a=3354&q=415186.

CT Greenhouse Gas Emissions: Mitigation Options Overview and Reduction Estimates Page
59
EPRI (Electric Power Research Institute) (2008). The Green Grid: Energy Savings and Carbon Emissions Reductions Enabled by a Smart Grid. 1016905. Goldstein, G.A., Goudarzi, L.A., Delaquil, P., and E. Wright (2008). NE-12 MARKAL Final Report: Structure, Data, and Calibration. Prepared by IRG for NESCCAF. Available at: http://www.nescaum.org/documents/ne12_final-model-documentation_v1-4-20080604.pdf/. ICF Consulting (2010). Draft User’s Guide for Estimating Carbon Dioxide, Nitrous Oxide, HFC, PFC, and SF6 Emissions from Industrial Processes Using the State Inventory Tool. Distributed with the SIT. Jacobson, M. Z. (2007). Testimony for the Hearing on Black Carbon and Arctic, House Committee on Oversight and Government Reform, U.S. House of Representatives (October 18, 2007). Meszler, D. (2005). California GHG Standards Impacts in the Northeastern U.S., Contract report to NESCAUM, Boston, MA. Mineta Transportation Institute (2002). Increasing Transit Ridership: Lessons Learned from the Most Successful Transit Systems. San Jose State University—College of Business. Available at: http://transweb.sjsu.edu/MTIportal/research/publications/documents/transitridership2/TransitRidership_7_16.htm#51036. MIT (Massachusetts Institute of Technology) (2007). The Future of Coal: An Interdisciplinary MIT Study, Massachusetts Institute of Technology, Cambridge, MA 02138. NRC (National Research Council) (2009). Driving and the Built Environment: The Effects of Compact Development on Motorized Travel, Energy Use, and CO2 Emissions, National Research Council, Washington, DC. Navigant Consulting (2007). Technology Forecast Updates – Residential and Commercial Building Technologies – Reference Case, Second Edition (Revised). Prepared for the U.S. Department of Energy, Energy Information Administration (September 2007). NESCAUM (2003). CT Greenhouse Gas Inventory, 1990-2003, NESCAUM, CT DEP, and CT Clean Energy Fund, Northeast States for Coordinated Air Use Management, Boston, MA. NESCAUM (2007). Assessment of Carbonaceous PM2.5 for New York and the Region, Volume II. Available at: http://www.nescaum.org/documents/assessment-of-carbonaceous-pm-2-5-for-new-york-and-the-region/carbonaceous_pm_2-5_volume_ii.pdf. NESCAUM (2009). Memorandum from NESCAUM to Connecticut Department of Environmental Protection providing a State GHG emissions inventory overview and recommendations, Northeast States for Coordinated Air Use Management, Boston, MA 02111, April 3, 2009. NESCCAF (2009). Reducing Heavy-Duty Fuel Consumption and Greenhouse Gas Emissions. Available at: http://www.nescaum.org/documents/reducing-heavy-duty-vehicle-fuel-consumption-and-greenhouse-gas-emissions/cooper-hdv-ghg-opportunities-em-200906.pdf.
CT Greenhouse Gas Emissions: Mitigation Options Overview and Reduction Estimates Page
60
Nevius, M., R. Eldridge and J. Krouk (2010). The State of the Efficiency Program Industry: Budgets, Expenditures, and Impacts for 2009. Consortium for Energy Efficiency, Hartford, CT. March 5, 2010. PNNL (Pacific Northwest National Laboratory) (2010). The Smart Grid: An Estimation of the Energy and CO2 Benefits. PNNL-19112, Revision 1. Available at: http://energyenvironment.pnl.gov/news/pdf/PNNL-19112_Revision_1_Final.pdf. Pew Center on Global Climate Change (2009). Black Carbon: A Science/Policy Primer. Prepared by Vision Air Consulting, LLC. Available at: http://www.pewclimate.org/docUploads/black-carbon-12-16-09.pdf. RPA (2010). Growing Economy, Shrinking Emissions: A Transit-Oriented Future for Connecticut’s Capital Region, Regional Plan Association, Stamford, CT, March 2010. Retrieved at: http://www.rpa.org/pdf/20100317-RPA-Report-Growing-Economy.pdf. Rothschild, S.S. and A. Diem (2009). Total, Non-baseload, eGRID Subregion, State?: Guidance on the Use of eGRID Output Emission Rates, Presented at the 18th Annual International Emission Inventory Conference in Baltimore, MD (April 2009). Available at: http://www.epa.gov/ttn/chief/conference/ei18/session5/rothschild.pdf. Schlegel, J. (2009). Energy Efficiency Potential: Results of Studies by ECMB. Presentation by Jeff Schlegel to CEAB on KEMA Consulting Analyses (September 4, 2009). TNC (The Nature Conservancy) (2007). Terrestrial Carbon Sequestration in the Northeast, Submitted by Murdock, Sarah, Sandra Brown, R. Neil Sampson, Bill Stanley to the US DOE-NETL under Cooperative Agreement DE-FC26-01NT41151, October, 2007. The Nature Conservancy, Washington DC. Available at: http://conserveonline.org/workspaces/necarbonproject. U.S. Census Bureau (2005). Interim State Population Projections. Table 6. Total Populations for Regions, Divisions, and States. Available at: http://www.census.gov/population/www/projections/projectionsagesex.html. U.S. Census Bureau (2006). Annual Estimates for Incorporated Places in Connecticut. Available at: http://www.census.gov/popest/cities/tables/SUB-EST2006-04-09.xls. U.S. DOE (2008a). ZIP-Code Insulation Program. Website hosted and maintained by the Oak Ridge National Laboratory. Available at: http://www.ornl.gov/~roofs/Zip/ZipHome.html. U.S. DOE (2008b). The Smart Grid: An Introduction. Prepared for the U.S. Department of Energy by Litos Strategic Communication under contract No. DE-AC26-04NT41817, Subtask 560.01.04. Available at: http://www.oe.energy.gov/DocumentsandMedia/DOE_SG_Book_Single_Pages%281%29.pdf. U.S. DOE (2009a). Energy Efficiency & Renewable Energy “Energy Savers” for the home: Furnaces & Boilers, U.S. Department of Energy. Available at: http://www.energysavers.gov/your_home/space_heating_cooling/index.cfm/mytopic=12530.

CT Greenhouse Gas Emissions: Mitigation Options Overview and Reduction Estimates Page
61
U.S. DOE (2009b). Energy Savers Booklet. Produced for the U.S. Department of Energy, Office of Energy Efficiency and Renewable Energy by the National Renewable Energy Laboratory. http://www1.eere.energy.gov/consumer/tips/pdfs/energy_savers.pdf. U.S. DOE (2009c). eQUEST Introductory Tutorial, version 3.63. U.S. DOE (2010). Argonne National Laboratory GREET Model documentation available at: http://www.transportation.anl.gov/modeling_simulation/GREET/index.html. U.S. Department of State (2010). Fifth Climate Action Report to the UN Framework Convention on Climate Change. http://www.state.gov/g/oes/rls/rpts/car5/index.htm. U.S. EIA (2000). Winter Energy Savings from Lower Thermostat Settings. http://www.eia.doe.gov/emeu/consumptionbriefs/recs/thermostat_settings/thermostat.html. U.S. EIA (2002). Updated State-and Regional-level Greenhouse Gas Emission Factors for Electricity. http://www.eia.doe.gov/pub/oiaf/1605/cdrom/pdg/e-supdoc.pdf. U.S. EIA (2004). Householder’s Perceptions of Insulation Adequacy and Drafts in the Home in 2001. http://www.eia.doe.gov/emeu/recs/recs2001/insulation/insulation.pdf. U.S. EIA (2006). 2003 Commercial Buildings Energy Consumption Survey. Detailed Tables. Table B26. U.S. EIA (2008). 2003 Commercial Buildings Energy Consumption Survey: 2003 CBECS Detailed Tables. http://www.eia.doe.gov/emeu/cbecs/cbecs2003/detailed_tables_2003/detailed_tables_2003.html. U.S. EIA (2009a). 2005 Residential Energy Consumption Survey. Detailed Tables. Table SH8. http://www.eia.doe.gov/emeu/recs/recs2005/c&e/detailed_tables2005c&e.html. U.S. EIA (2009b). 2005 Residential Energy Consumption Survey, Detailed Tables. Table SH2. http://www.eia.doe.gov/emeu/recs/recs2005/c&e/spaceheating/pdf/tablesh2.pdf. U.S. EIA (2009c). Emissions of Greenhouse Gases Report. DOE/EIA-0573(2008). http://www.eia.doe.gov/oiaf/1605/ggrpt/gwp_gases.html. U.S. EIA (2009d). State Energy Data System. Consumption, Prices and Expenditures for CT. http://www.eia.doe.gov/states/_seds.html. U.S. EIA (2010a). Connecticut State Energy Profile. http://www.eia.doe.gov/state/state_energy_profiles.cfm?sid=CT. U.S. EIA (2010b). Fuel and Energy Source Codes and Emission Coefficients, The Voluntary Reporting of Greenhouse Gases Program, http://www.eia.doe.gov/oiaf/1605/coefficients.html. U.S. EPA (1995). Impact of Speed Limit on Air Quality. Memorandum of the EPA Office of Policy, Planning, and Evaluation (OPPE), Environmental Protection Agency, Washington, DC.
CT Greenhouse Gas Emissions: Mitigation Options Overview and Reduction Estimates Page
62
U.S. EPA (1996). Emission Impact of Elimination of the National 55 mph Speed Limit, Information from the EPA Office of Mobile Sources (OMS), Environmental Protection Agency, Washington, DC. U.S. EPA (1997). The Effects of Raising Speed Limits on Motor Vehicle Emissions. Memorandum of the EPA Office of Policy, Planning, and Evaluation (OPPE), Environmental Protection Agency, Washington, DC. U.S. EPA (2004a). Guidance for Quantifying and Using Long Duration Truck Idling Emission Reductions in State Implementation Plans and Transportation Conformity. EPA420-B-04-001. http://www.epa.gov/otaq/smartway/documents/420b04001.pdf. U.S. EPA (2004b). Median Life, Annual Activity, and Load Factor Values for Nonroad Engine Emissions Modeling. 420-P-04-005 April 2004 NR-005c. U.S. EPA (2005). MOVES 2004 Energy and Emission Inputs, Draft Report, EPA-420-P-05-003, Environmental Protection Agency, Office of Transportation and Air Quality, Ann Arbor, MI. U.S. EPA (2008). NONROAD Model. http://www.epa.gov/OMS/nonrdmdl.htm. U.S. EPA (2009a). Draft Motor Vehicle Emission Simulator (MOVES) 2009, Software Design and Reference Manual, EPA-420-B-09-007, Office of Transportation and Air Quality (OTAQ), Ann Arbor, MI. U.S. EPA (2009b). WAste Reduction Model. http://www.epa.gov/climatechange/wycd/waste/calculators/Warm_home.html. U.S. EPA (2009c). WARM User’s Guide: Calculating Greenhouse Gas Emissions with the WAste Reduction Model. http://www.epa.gov/climatechange/wycd/waste/calculators/Warm_UsersGuide.html. U.S. EPA (2010a). State Inventory and Projection Tool. http://www.epa.gov/statelocalclimate/resources/tool.html. U.S. EPA (2010b). Inventory of U.S. Greenhouse Gas Emissions and Sinks: 1990-2008. 430-R-10-006. Urban Land Institute (2007). Growing Cooler: The Evidence on Urban Development and Climate Change, Urban Land Institute, Washington, DC. Urban Land Institute (2009). Moving Cooler: An Analysis of Transportation Strategies to Reduce Greenhouse Gas Emissions, Urban Land Institute with Cambridge Systematics, Inc., Washington, DC.
CT Greenhouse Gas Emissions: Mitigation Options Overview and Reduction Estimates Page
63
Appendix A: Summary of – and Response to – Comments Received on August 19 Draft Report
Summary of Comments Received Regarding NESCAUM’s “CT Greenhouse Gas Emissions: Mitigation Options Overview and Reduction Estimates”
Report
1. Overview In August 2010, NESCAUM completed a draft report titled “CT Greenhouse Gas Emissions: Mitigation Options Overview and Reduction Estimates” which described a process of review and prioritization of more than 150 potential GHG emission reduction opportunities in order to identify a few key measures in each sector and quantify their emissions reduction potential. A variety of tools, models, and methods were utilized in order to develop or improve state-‐wide estimates of GHG reduction benefits for each of these opportunities. A brief description of each potential measure, the tool or method used for quantification, and the resulting estimate of the GHG reduction potential is provided, grouped by sector. NESCAUM was provided with a list of over 150 measures that had been identified through a state-‐wide climate action planning process, subsequent stakeholder input and research by CT DEP. While almost every measure on this list represented a viable strategy to pursue emissions reductions, the measures spanned a wide range of reduction potentials, feasibility, and effectiveness. In addition, several measures appeared to be overlapping and redundant with other measures on the list. Already grouped by sector, NESCAUM undertook the task of further grouping the measures according to the 55 measures that were identified in the 2005 Connecticut Climate Action Plan (Connecticut, 2005). After similar measures had been grouped, NESCAUM identified several key measures in each sector that offered the combination of both large reduction potential and ease of quantification. The report focused directly on the technology and conservation options that could reduce GHG emissions directly. NESCAUM provided two public overviews of its draft findings:
• Aug. 12, 2010 to the Climate Change Coordinating Committee (including key stakeholders)
• Sept. 9, 2010 to SIPRAC A version of the current draft of NESCAUM’s report was posted on www.ctclimatechange.com on Sept. 19, 2010. Comments on the finding in the report were solicited, the comment period closed on Oct. 12, 2010. Fourteen people (identified in Appendix A) submitted comments on the report. The actual comments submitted can be found in Appendix B of this summary.

CT Greenhouse Gas Emissions: Mitigation Options Overview and Reduction Estimates Page
64
2. Summary of Comments by Analyzed Strategies In this section, the complete set of comments received (fully set forth in Appendix B) are parsed and summarized by strategy. The section numbers and titles that follow match those found in NESCAUM’s report. 2.1 Transportation and Land Use
8. Continued participation in the California Low Emission Vehicle Program, including the GHG emission standards for light-‐duty vehicles • No comments received.
9. Light-‐duty vehicle feebate program • No comments received.
10. Low carbon fuel standard • Given that the transportation sector is the largest source of state greenhouse gas
(GHG) emissions, transitioning to low carbon fuels (including electricity, natural gas, hydrogen, and advanced biofuels) and away from conventional fuels is critical. Commenter strongly endorses adoption of a Model Rule by Connecticut and the other signatories of the Low Carbon Fuel Standard (LCFS) MOU that would require a 10% reduction in the carbon content of transportation fuels. (Commenter 1)
• Commenter expresses serious concerns with a LCFS, including: o Depending on how upstream reductions are credited for crude oil, a LCFS
could force oil companies to change their supply partners, with whom they have long-‐standing supply agreements, contracts and relationships.
o Regarding upstream reductions for Electric Vehicles (EVs)/ Renewables/ CNG, calculations to determine the carbon intensity of any fuel should include both direct and indirect land-‐use emissions associated with the production of the fuel. They should not be limited to tailpipe emissions.
o Modeling, not assumptions, should be used to determine the value of emissions from land-‐use in any fuels. Presently, there is no consensus among scientists on life-‐cyle carbon analysis models; the U.S. DOE/ GREET model used as the basis of the NESCAUM analysis has significant flaws according to many experts. (Commenter 6)
• Response: For the purposes of this analysis, the assumptions used by NESCAUM are sufficient. The concerns raised by the commenter above are valid and should be addressed as the LCFS program is further developed through a separate open and transparent public process. Regarding EVs, Governor Rell’s Electric Vehicles Infrastructure Council final report (http://www.ct.gov/dpuc/lib/dpuc/ev/evfinal.pdf ) should be used as reference material on the subject.
11. Smart growth strategies
• Commenter suggests that while CT’s population constitutes approximately 1% of the total US population, it’s reasonable to assume that reductions from smart growth

CT Greenhouse Gas Emissions: Mitigation Options Overview and Reduction Estimates Page
65
alone would be less than 1% of the national total because Connecticut is growing more slowly than the national average. Commenter suggests a few alternate sources of information to consider for this strategy. (Commenter 5)
Response: NESCAUM will revise the final report to incorporate the Smart Growth measures as suggested by this commenter.
12. Vehicle Miles Traveled (VMT) reduction
• Commenter suggests that while CT’s population constitutes approximately 1% of the total US population, Connecticut could probably claim more than a 1% share of US emissions reductions due to expanded transit use due to its “urbanness” of its communities. (Commenter 5)
Response: For the purposes of this analysis, VMT assumptions used by NESCAUM are sufficient. The concerns raised by the commenter above are valid and should be addressed when future VMT control programs are further developed through a separate open and transparent public process.
13. Speed limits • No comments received.
14. Clean diesel programs • Installing auxiliary power units (APUs) for long-‐ haul trucks and retrofitting off road
diesels can result in significant reductions of diesel emissions. Commenter strongly supports including funding for APUs as a strategy and would also recommend adoption of a requirement that particulate controls be installed on construction equipment used in state funded projects. (Commenter 1)
Response: The report issued for public comment utilized limited assumptions for this potential strategy based on anticipated funding levels available through Supplemental Environmental Project (SEP) funds. The potential GHG reductions from additional installation of APUs could be increased by assuming future additional funding, thus current estimates are scalable.
Other Transportation and Land Use Comments
• Commenter suggests that it might be worth trying to quantify the GHG emission reduction potential of investments in freight rail and port infrastructure intended to shift freight shipments away from truck transport. I admit that I have no idea what proportion of transport-‐sector GHG emissions result from big rigs, but the advertisements for the freight railway companies always emphasize how much more efficient trains are than trucks. If shipping by rail is as efficient as some claim, then it seems plausible that investments in freight rail and port infrastructure might yield significant reductions in greenhouse gas emissions. (Commenter 8)
Response: According to the CT DOT, the key factor relates to the amount of truck traffic that may practically be diverted to rail. Rail freight can be improved, but it should be pursued as part of a multi-‐state effort. As such, no changes to NESCAUM’s current analysis are recommended. However, it should be noted that CT DEP will be developing
CT Greenhouse Gas Emissions: Mitigation Options Overview and Reduction Estimates Page
66
a freight movement strategy as part of a multi-‐pollutant reduction effort and plans to have the strategy developed by mid-‐2012.
2.2 Electric Power Generation
4. Implement and/or strengthen the Connecticut Renewable Portfolio Standard • Commenter strongly supports the continuation of the Class I Renewable Portfolio
Standard and asks NESCAUM to differentiate between emissions reductions attributed to Class I, II and III and to analyze the results of increasing the Class I standard to 25% by 2025 and 30% by 2030. (Commenter 2)
• Commenter supports increasing the percentage of the required RPS of category Class III sources to allow the market value and development of these types of resources to increase (currently flattened out at 4% through year 2020). (Commenter 4)
Response: These comments with respect to amending CT’s RPS commitments will be taken into consideration during the next phase of CT DEP’s efforts to implement the GWSA, strategy evaluation and recommendation. It should also be noted that the CT Energy Advisory Board is examining the RPS through a separate public process.
5. Expand and/or extend the Regional Greenhouse Gas Initiative (RGGI) • The established cap should be adjusted down significantly to accurately reflect
current emission levels. The proposed expansion of RGGI to include industrial boilers and smaller electric generating units or to include or link to additional states and Canadian provinces should be pursued. If comprehensive federal legislation controlling GHG emissions is not adopted, the RGGI framework should be used to expand to emission sectors beyond those modeled by NESCAUM. (Commenter 1)
• Boilers and smaller EGUs are not the only potential for improving the Regional Greenhouse Gas Initiative and commenter urges a broader look at how to strengthen this program, including requiring deeper reductions from power plants before 2020. (Commenter 2)
Response: The RGGI program evaluation will be completed within the timeframe established in the RGGI memorandum of understanding. Upon completion of the program evaluation, CTDEP will have a better understanding of modeling scenarios and additional GHG reduction potential to be incorporated into GWSA planning. As such, no changes to the current analysis are recommended.
6. Base-‐load carbon dioxide (CO2) performance standard • 1500lbs/MWh is far higher than what California and other states have adopted
(1100lbs/MWh) and likely to be higher than what EPA proposes. Any standard should be technology-‐forcing and ratchet down over time. (Commenter 2)
Response: Given CT’s current cap on total EGU GHG emissions, a performance standard is not likely to be among the first recommended strategies. As such, no changes to the current analysis are recommended.
Other Electric Power Generation Comments

CT Greenhouse Gas Emissions: Mitigation Options Overview and Reduction Estimates Page
67
• Commenter suggest also modeling the 2009 KEMA Long-‐Term Sustainable Solar Strategy report’s recommendations to create a self-‐sustaining solar PV industry by bringing it to a scale of 300MW of solar by 2020 which then can rapidly expand as solar becomes cheaper than conventional fuels. (Commenter 2)
Response: Renewable energy will play a significant role in helping the state meet its GHG reduction targets established under the GWSA. Given the magnitude of the necessary GHG reductions, the current analysis did not review every potential strategy at this suggested level of detail. As such, no changes to the current analysis are recommended.
2.3 Residential, Commercial, and Industrial Energy
10. Maximize energy efficiency potential from the Connecticut Energy Efficiency Fund, Natural Gas Efficiency Fund, and Fuel Oil Conservation Fund • Commenter strongly supports numerous proposals that would help maximize
efficiency investments and would urge investment beyond that modeled by NESAUM for electricity and natural gas as development of a significant commitment to achieve the enormous efficiency potential within the unregulated fuel sector – primarily heating oil and propane. (Commenter 1)
• While a doubling of the electric efficiency budget is appropriate, doing the same for natural gas and fuel oil, which have been funded far below their potential, is not appropriate. Commenter’s research of potential studies in the region found that capturing all cost effective efficiency for natural gas and heating oil in Connecticut would require annual efficiency program budgets of approximately $66 million and $108 million, respectively. The development of robust and ongoing oil (and propane) efficiency programs should be added to the options list and modeled. Analysis by commenter suggests that unregulated fuels efficiency measures could reduce Connecticut’s overall emissions by 5% per year. (Commenter 1)
• The residential, commercial and industrial recommendations have significant overlap. Commenter strongly support full analysis of reductions that would come from implementing our state’s existing law to achieve “all cost-‐effective efficiency” for electricity and natural gas and to also analyze the reduction potential for achieving this from heating oil and propane. (Commenter 2)
• In case NESCAUM doesn't already have this, these are some efficiency funding levels used by ENE-‐ they're conservative relative to the potential for oil measures: http://env-‐ne.org/public/resources/pdf/ENE_EE_ECON_CT_FINAL.pdf The efficiency section of this report really needs to be redone as it's not in line with what CT is actually doing or considering doing. (Commenter 2)
• Commenter supports maximizing energy efficiency potential from the Connecticut Energy Efficiency Fund, Natural Gas Efficiency Fund, and Fuel Oil Conservation Fund. Commenter utilizes these programs to help subsidize various energy efficiency programs such as lighting retrofits and retro-‐commissioning projects on its campuses. (Commenter 4)
Response: In the next phase of evaluation and analysis required by the GWSA, multiple energy efficiency measures will be bundled, thereby addressing overlap and potential GHG reduction accounting issues. Energy efficiency will play a major role in helping the

CT Greenhouse Gas Emissions: Mitigation Options Overview and Reduction Estimates Page
68
state meet its GHG reduction targets established under the GWSA. The next phase of analysis and evaluation will assist the CT DEP determine the level of energy efficiency necessary to assist CT in meeting the GHG reduction targets established in the GWSA.
11. Appliance standards • Commenter supports the adoption of the most recent appliance codes developed by
other jurisdiction and would support measures that incented Energy Star purchases and required state procurement of such but since the states are largely pre-‐empted by the federal government in this area we do not see how the degree of penetration modeled in the report could occur without some additional policy elements or drivers. Commenter believes that CT should collaborate with other states in the region to identify and implement new appliance standards. (Commenter 1)
Response: Appliance efficiency standards will play a role in helping the state meet its GHG reduction targets established under the GWSA. Given the magnitude of the necessary GHG reductions, the current analysis did not review every potential strategy at this suggested level of detail. As such, no changes to the current analysis are recommended.
12. Building codes
• Commenter suggests that further work in the area of building codes be directed toward modeling the anticipated 30% improvement in the 2012 commercial building code and a more stringent “beyond code” standard for residential buildings. Since all CT jurisdictions are covered by the same code we would suggest that another option worth modeling would be to enable towns to adopt a uniform residential “stretch code” developed by the state Codes and Standards Board that would require greater energy efficiency in any new construction under its jurisdiction. A quick calculation of the avoided emissions that could be captured if codes were in place a year sooner might be worth exploring. (Commenter 1)
• Commenter supports recommendation to upgrade building codes -‐ however it is difficult if not impossible to quantify the potential of all measures for every building type (other than the obvious, insulation values, etc). A whole building performance compliance path-‐based code similar to Oregon's code may be helpful. Also, incentivizing actual energy use will push the problem back to the design team on new projects and the occupants to operate efficiently. Any building in operation that meets the EPA Benchmark Target program for 1 year of reduced energy use should be incentivized. Also consider Massachusetts’ “stretch code” being developed. (Commenter 3)
• Commenter suggested a couple of potential data sources (US Census & CT DECD) to help evaluate potential reductions from updated building codes. (Commenter 7)
Response: CT DEP has recently become aware of a methodology utilized by the Alliance to Save Energy that might help us evaluate the 2012 International Energy Conservation Code (IECC) or stretch code standards for CT. This approach should be further reviewed and integrated, if applicable, into subsequent analysis.
13. Maximize energy efficiency potential as identified in a prior state survey
CT Greenhouse Gas Emissions: Mitigation Options Overview and Reduction Estimates Page
69
• Not all strategies work for all buildings -‐ the answers depend on building type, size, configuration, location, and occupant schedule. While this can be approximated by the use of energy models -‐ they are highly flawed. The only way to properly credit and incentivize energy efficiency in buildings is to base it on actual energy performance data. (Commenter 3)
Response: Improved building codes will play a significant role in helping the state meet its GHG reduction targets established under the GWSA. Given the magnitude of the necessary GHG reductions, the current analysis did not review every potential strategy. The commenter raises a valid observation that should be taken into consideration as specific programs are developed.
14. Heat pumps
• Commenter believes that this more energy-‐efficient method of heating and cooling with electricity be considered as part of comprehensive programs that address all cost-‐effective efficiency measures. It is also not clear that the modeling was only applied to ground-‐source heat pumps as the summary states, since the modeling details describe a mixture of ground-‐source and air-‐source heat pumps. Air-‐source heat pumps are typically somewhat less efficient, but are substantially less expensive and have far fewer site restrictions than ground-‐source heat pumps. Ductless “mini split” air-‐source heat pumps have potential for reducing electric load in apartments that currently use electric resistance heat. While the basic technology is the same, air-‐source and ground-‐source heat pumps are dramatically different end-‐use products that need to be evaluated separately. (Commenter 1)
• Commenter disagrees with projected GHG reductions and claims that residential heat pumps in our climate are not going to save energy in the big picture. Heat pumps use high grade electrical power (which has a 3 to 1 energy intensity compared to on-‐site produced heating from oil or gas). Ground source heat pumps only displace the load to the grid, which may get its power from renewables -‐ but more often may not. So whether ground source heat pumps make carbon sense depend on the electricity profile -‐ and they may if the mix is high in nuclear -‐ is that what we want to incentivize? This also puts residential homeowners at the mercy of the electricity company for basics such as heating. (Commenter 3)
• Heat pumps only make energy sense in this climate when used where cooling loads are constant (not heating) -‐ this is typically in larger commercial institutions with constant cooling loads. (Commenter 3)
Response: NESCAUM will incorporate the changes recommended in this comment to the ground source heat pump section in the final report.
15. Weatherization • This is duplicative of other categories, since weatherization is a part of
comprehensive efficiency programs. Cost-‐effective potential studies, such as the KEMA electric one for CT, which include the measures referenced, form the basis for comprehensive efficiency program development. Incentives for weatherization, including measures such as insulation and air sealing (and in specific instances when it is cost-‐effective, window replacement), are an integral part of efficiency programs. (Commenter 1)
CT Greenhouse Gas Emissions: Mitigation Options Overview and Reduction Estimates Page
70
• The weatherization recommendation seems to duplicate the first Efficiency Fund-‐related recommendation and it is bizarre to focus on non-‐cost-‐effective technologies such as replacement windows (i.e. instead of replacement windows, installing shades, curtains, repairing windows and installing interior/exterior storms are far more cost-‐effective.) (Commenter 2)
• Infiltration reduction, insulation and low cost storm windows should always come before full window replacements. A study on a typical older CT home would show where the real savings are. Again, since each case is different -‐ the proof is in the bills. Financing for these improvements will help greatly as energy costs are financed upfront. (Commenter 3)
Response: Improved weatherization will play a significant role in helping the state meet its GHG reduction targets established under the GWSA. Many options, such as those noted above, are typically more cost-‐effective than full-‐window replacements as assumed in the draft report. For purposes of the initial assessment, the conservative estimates utilized by NESCAUM are sufficient and should not be changed.
16. Smart meters • Commenter believes that the current pilots as well as other variations of it should
be fully evaluated in terms of a total cost effectiveness analysis before including this strategy as one to be included any targeted for reducing GHGs in the near term to meet 2020 targets. (Commenter 1)
• Commenter doesn’t think Smart meters will do a thing. Do people read their meters or bills now? The problem is not ignorance on energy use -‐ it is apathy. (Commenter 3)
Response: Smart meter/smart grid technology has the potential to more closely balance supply and demand for electrical power. Future implementation will depend on cost effectiveness and results of various pilot programs required by CT DPUC. Public education and outreach will be a fundamental element of many future programs necessary to meet the GHG reduction targets established in the GWSA.
17. High global warming potential (GWP) gases • Commenter recommends further analysis to determine the cost and feasibility of
requirements that would result in the suggested 50 % or greater capture of these high GWP gases in the state, and whether these gases should be incorporated into cap and trade programs such as RGGI. (Commenter 1)
Response: Addressing high GWP gases is a potential strategy that will be further evaluated to meet the targets established in the GWSA.
18. Expanded district heating
• Given the enormous potential reductions from utilizing waste heat, these options merit more analysis, specifically with regard to their cost effectiveness in relation to other strategies. In addition strategies could be developed for use when other actions or circumstances are present that would help defray costs, such as sewer installation, combined sewer replacement or major utility infrastructure investments or upgrades. (Commenter 1)

CT Greenhouse Gas Emissions: Mitigation Options Overview and Reduction Estimates Page
71
Response: For reasons noted above, district heating will continue to be evaluated as a strategy for meeting long-‐term GHG reduction targets established in the GWSA.
Other Residential, Commercial, and Industrial Energy Comments
• One technology worth investigating is the potential for solar hot water heating to displace heating by oil and electricity. It traditionally has received little attention by the Clean Energy Fund and Energy Efficiency Fund and could become significant over time. (Commenter 2)
• Where are the on-‐site renewables? Residential Solar Hot Water? District Wind? Incentives for low use -‐ block pricing, improvement incentives, high peak demand charges, etc? (Commenter 3)
Response: Comments and suggestions on additional GHG reduction strategies are appreciated and will be considered as part of a broader analysis of renewable energy policy and program options.
2.4 Agriculture, Forestry, and Waste Management
3. Implementation of the State’s Solid Waste Management Plan • Given concerns regarding the assumed carbon neutrality of biomass, trash
incineration, and biofuels, DEP should review the projected carbon impacts of Class II of the RPS (as it includes solid waste incineration), any reductions attributed to the state's solid waste management plan to ensure the proper accounting of trash incineration, and review the full lifecycle greenhouse gas impacts of proposed and existing state biofuels policy (including the possible 20% biodiesel heating oil mandate and low-‐carbon fuels standard). (Commenter 2)
Response: Federal GHG reporting requirements will assist CT DEP in assessing GHG emission levels from solid waste incinerators. As currently envisioned, Low Carbon Fuel Standards (LCFS) will look at lifecycle impacts.
4. Conserve and enhance carbon sequestration levels in Connecticut’s forests and fields
• Commenter believes that it is important that CT catalogues current sequestration amounts and that a calculation of the carbon impacts be required as a part of any significant land use changes or major development projects. In addition, new development can significantly increase emissions from forest removal and other land use changes, and policies should be considered that require developers to account for and offset any emissions they cause. (Commenter 1)
Response: Carbon sequestration will likely play a role in helping the state meet its GHG reduction targets established under the GWSA. The commenter raises a valid observation that should be taken into consideration as specific programs to implement smart growth principles are developed.
General Comments

CT Greenhouse Gas Emissions: Mitigation Options Overview and Reduction Estimates Page
72
• Expand home weatherization programs like the CT Energy Efficiency Fund's Home Energy Solutions program. Fully fund/expand programs that finance solar power and other renewable forms of energy for homes, municipalities and businesses. Increase mass transit. Not only do these steps reduce harmful emissions, but they also spur local job growth and economies, get us off of dwindling and increasingly expensive foreign fuels, and save energy dollars for all concerned. (Commenter 9)
• Commenters expressed general support for CT’s climate change strategies, with specific mention of support for expanding home weatherization programs, clean energy programs, and public transportation. (Commenter 10 & Commenter 11)
• Commenter listed a number of actions that individuals, businesses, governments and communities could/should take to help reduce GHG emissions. (Commenter 12)
• Commenter supports increasing public transportation, especially adding proposed rail lines with high speed trains, and researching solar hot water heating to replace oil heat and electrical heat. (Commenter 13)
• Commenter suggests: o Consumers should press industry to produce more energy efficient products
by refusing to buy inefficient ones. o Reducing the number of state and municipal buildings and vehicles by
reducing the number of State and Municipal Employees through consolidation and attrition. (Gradually consolidate State and Municipal functions into fewer buildings staffed by fewer people.)
o Getting oil producers to lower the carbon content of fuels combusted. o Lower utility rates and taxes for everyone so everyone can afford to replace
their cars, home heating systems and appliances with more efficient, green energy sources, thereby reducing emissions across the board. (Commenter 14)
Response: Comments and suggestions on additional GHG reduction strategies are appreciated and will be considered as part of a broader analysis where appropriate as implementation of the GWSA to meet GHG reduction targets continues.
CT Greenhouse Gas Emissions: Mitigation Options Overview and Reduction Estimates Page
73
Appendix A: List of Commenters 1. Jessie Stratton, Environment Northeast (ENE) 2. Roger Smith, Clean Water Action 3. Michele Helou, Sage Design & Consulting 4. Stephanie Marks, UConn Office of Environmental Policy 5. Amanda Kennedy, Regional Plan Association (RPA) 6. Steve Guyevan, CT Petroleum Council 7. Adam Dane 8. Brian Tang 9. Andy Bauer, Portland Clean Energy Task Force 10. Atid Kimelman 11. Godan Bates 12. Mariam Kurland 13. Gabriele Michels 14. Peter Veslocki
CT Greenhouse Gas Emissions: Mitigation Options Overview and Reduction Estimates Page
74
Appendix B: Submitted Comments Public Comments on NESCAUM September 2010 Analysis of GHG Strategies Nov 9, 2010 Complete Public Comments (reordered) ******************************************************************************************* 1) JESSIE STRATTON, ENE ENE is pleased to offer comments regarding the greenhouse gas GHG reduction options presented by NESCAUM to the Department. ENE was a primary advocate for PA 08-‐98 which requires the state to achieve a reduction in GHG emissions by 2020 and 80% reduction by 2015. Aggressive pursuit of several of the strategies in the NESCAUM report will be essential if the state is to meet the 2020 requirements and their successful implementation will require commitment and strong leadership at all levels of government. It will also be essential to adopt measures that hold entities accountable and provide transparent information about progress toward achieving the reductions modeled for each strategy. While full implementation of the priority strategies discussed below should enable the state to achieve the 2020 reduction levels we must be simultaneously focused on identifying and laying the groundwork for developing the additional strategies that will be required to achieve the far deeper reductions required by 2050. ENE has selected the following priority strategies that we believe are the best solutions, in terms of feasibility and cost-‐effectiveness, to achieve the necessary reductions. In commenting on these strategies we have also highlighted some of the policy and leadership needs implicit to successful implementation. ENE’s Priority Policy Recommendations: 2.1 GHG Reduction Option: Mobile Source Sector 3. Low Carbon Fuels The transportation sector is the largest source of state greenhouse gas (GHG) emissions and transitioning to low carbon fuels including electricity, natural gas, hydrogen, and advanced biofuels, and away from conventionally-‐made gasoline, high-‐carbon ethanol, and petroleum products derived from oil sands is critical. ENE strongly endorses adoption of a Model Rule by Connecticut and the other signatories of the Low Carbon Fuel Standard (LCFS) MOU that would require a 10% reduction in the carbon content of transportation fuels. While state’s can’t set fuel efficiency standards for vehicles, CT can assure that state fleets and policies require or incent the use of low carbon fuel vehicles or other highly efficient vehicles. Although it is difficult to reliably quantify emission reductions that might result from smart growth policies and increased mass transit the numerous benefits of pursuing these strategies mean that they should remain among the priority options – particularly as the Department of Transportation develops GHG reduction proposals as required by PA 08-‐98. 7. Clean Diesels
CT Greenhouse Gas Emissions: Mitigation Options Overview and Reduction Estimates Page
75
ENE created, in CT, the first statewide coalition in New England devoted to cleaning up the harmful emissions from diesel engines that jeopardize public health and contribute to global warming. Those efforts resulted in the retrofit of numerous school and transit buses, but the costs associated with installing auxiliary power units (APUs) for long-‐ haul trucks and retrofitting off road diesels prevented real progress on those fronts. ENE strongly supports including funding for APUs as a strategy and would also recommend adoption of a requirement that particulate controls be installed on construction equipment used in state funded projects. 2.2 CT GHG Reduction Option: Electric Power Generation Sector
2. Extend and Expand RGGI
RGGI’s success demonstrates that its extension and expansion would be a cost effective way to achieve further greenhouse gas reductions as required under the PA 08-‐98. To ensure the continued effectiveness of the current program and any extension of it improvements are needed. First, the established cap should be adjusted down significantly to accurately reflect current emission levels. Between 2008 and 2009 RGGI emissions decreased 9%, and total 2009, emissions fell 34% below the current RGGI cap. Emissions declines are primarily driven by low prices for natural gas, which emits less carbon dioxide (CO2) than other fossil fuels in electricity generation. This unanticipated increase in natural gas use (significantly displacing fuel oil generation as well as some coal) demonstrates that significant emission reductions can be delivered rapidly and cheaply using existing infrastructure and resources. In addition, non-‐fossil generation – such as hydroelectric, wind, and nuclear power – and also lower demand from efficiency program investments is also displacing high-‐CO2 generation from coal and oil, and increases in this non-‐emitting generation and reduced demand are likely to continue to reduce emissions in the years ahead. While the economic downturn has certainly contributed to reduced electricity consumption and emissions over the past two years, stable electricity demand during the preceding period of economic growth (2001-‐2007) suggests that the linkage between economic growth and emissions has weakened, and an economic rebound may not increase emissions significantly. The proposed expansion of RGGI to include industrial boilers and smaller electric generating units or to include or link to additional states and Canadian provinces should be pursued – recognizing that accomplishing the goal and its reductions will require the strong leadership and involvement of a new governor and DEP in working with the other RGGI states. It should also be noted that enactment of a federal cap and trade program would most likely pre-‐empt the current RGGI framework. In order to capture reductions greater than those required in a federal program it would be essential to preserve the states authority to further regulate GHG emissions. ENE also believes that if comprehensive federal legislation controlling GHG emissions is not adopted that the RGGI framework should be used to expand to emission sectors beyond those modeled by NESCAUM. 2.3 CT GHG Reduction Options: Residential, Commercial, and Industrial Sectors 1. Efficiency/Conservation Funds with Revolving Loan Fund 4. “Top Twenty” Energy Efficiency Opportunities 5. Ground Source Heat Pumps
CT Greenhouse Gas Emissions: Mitigation Options Overview and Reduction Estimates Page
76
The simplest, most cost-‐effective way to advance Connecticut’s human, environmental and economic health is to make our energy use as efficient as possible; energy efficiency is the lowest cost, cleanest energy resource we can buy; in addition it creates jobs and increases state economic productivity. Therefore ENE strongly supports numerous proposals that would help maximize efficiency investments and would urge investment beyond that modeled by NESAUM for electricity and natural gas as development of a significant commitment to achieve the enormous efficiency potential within the unregulated fuel sector – primarily heating oil and propane. The policies pursued should be done so using the existing energy efficiency structure in the state as coordinated by the Energy Conservation Management Board (ECMB). ENE believes that preserving and expanding electric energy efficiency investments beyond 2008 levels should top the options list for GHG reductions both because of the large reduction potential and the economic impact of pursuing this strategy is so positive. As a result of the state government’s recent action diverting a third of the funding level modeled by NESCAUM as well as the overlap of those programs with the ‘top twenty’ measures cited in the KEMA report and specific technologies such as heat pumps, ENE recommends that further NESCAUM modeling be done on the basis of significantly larger overall investments in both electric and natural gas efficiency rather than for specific measures since actual program development is in fact based on potential studies and better left to those with an expertise in program design and evaluation. ENE modeled an investment level of $259m per year based in part on the KEMA potential study and similar studies in other states. Similarly, the 2010 IRP developed by the utilities, modeled an investment level of $182m as the near-‐term level needed to meet the all cost-‐effective directive of Sec 16 a (3)(c). The state’s goal should be to maximize electric and natural gas efficiency measures incorporating both avoided energy and environmental costs and economic benefits in calculating their costs relative to other GHG reduction options. Despite references to the KEMA potential study, the NESCAUM modeling of expanded efficiency programs seems to be based on the expansion of existing budgets rather than actual potential. While a doubling of the electric efficiency budget is appropriate, doing the same for natural gas and fuel oil, which have been funded far below their potential, is not appropriate. ENE’s research of potential studies in the region found that capturing all cost effective efficiency for natural gas and heating oil in Connecticut would require annual efficiency program budgets of approximately $66 million and $108 million, respectively. NESCAUM has modeled budgets far below this, dramatically underestimating the level of emissions savings available. In addition, the modeling assumed the programs would simply be an expansion of existing ones, rather than comprehensive integrated programs design to capture all cost effective efficiency from all fuels. This has also underestimated the level of emissions savings available from heating oil efficiency. The development of robust and ongoing oil (and propane) efficiency programs should be added to the options list and modeled. ENE analysis suggests that unregulated fuels efficiency measures could reduce Connecticut’s overall emissions by 5% per year. With respect to increased use of ground source heat pumps, ENE again believes that this more energy-‐efficient method of heating and cooling with electricity be considered as part of comprehensive programs that address all cost-‐effective efficiency measures. It is also not clear that the modeling was only applied to ground-‐source heat pumps as the summary states, since

CT Greenhouse Gas Emissions: Mitigation Options Overview and Reduction Estimates Page
77
the modeling details describe a mixture of ground-‐source and air-‐source heat pumps. Air-‐source heat pumps are typically somewhat less efficient, but are substantially less expensive and have far fewer site restrictions than ground-‐source heat pumps. Recent efficiency program pilots in Connecticut and other states have shown that ductless “mini split” air-‐source heat pumps have potential for reducing electric load in apartments that currently use electric resistance heat. While the basic technology is the same, air-‐source and ground-‐source heat pumps are dramatically different end-‐use products that need to be evaluated separately. Although the cost-‐effectiveness, economics and large environmental benefits of pursuing efficiency for all fuels should make this strategy the state’s first priority, recent experience with electric efficiency makes it clear that achieving the GHG reductions through efficiency will require the concerted effort of many and most critically, strong leadership and direction from all levels of government: the DEP, the Governor and legislature.
2. Appliance Standards ENE has long advocated for adoption of the most recent appliance codes developed by
other jurisdiction and would support measures that incented Energy Star purchases and required state procurement of such but since the states are largely pre-‐empted by the federal government in this area we do not see how the degree of penetration modeled in the report could occur without some additional policy elements or drivers. ENE believes that CT should collaborate with other states in the region to identify and implement new appliance standards.
3. Building Codes
ENE would suggest that further work in the area of building codes be directed toward modeling the anticipated 30% improvement in the 2012 commercial building code and a more stringent “beyond code” standard for residential buildings. Since all CT jurisdictions are covered by the same code we would suggest that another option worth modeling would be to enable towns to adopt a uniform residential “stretch code” developed by the state Codes and Standards Board that would require greater energy efficiency in any new construction under its jurisdiction. Connecticut’s regulation adoption process significantly delays updating the state’s building code whereas other states and jurisdictions are able to adopt new codes essentially when they are promulgated by the IECC. A quick calculation of the avoided emissions that could be captured if codes were in place a year sooner might be worth exploring. 6. Weatherization Once again, this is duplicative of other categories, since weatherization is a part of comprehensive efficiency programs. Cost-‐effective potential studies, such as the KEMA electric one for CT, which include the measures referenced, form the basis for comprehensive efficiency program development. Incentives for weatherization, including measures such as insulation and air sealing (and in specific instances when it is cost-‐effective, window replacement), are an integral part of efficiency programs.
7. Smart Meters/Load Management

CT Greenhouse Gas Emissions: Mitigation Options Overview and Reduction Estimates Page
78
ENE believes that the current pilots as well as other variations of it should be fully evaluated in terms of a total cost effectiveness analysis before including this strategy as one to be included any targeted for reducing GHGs in the near term to meet 2020 targets. 8. High GWP Recycling Program ENE recommends further analysis to determine the cost and feasibility of requirements that would result in the suggested 50 % or greater capture of these high GWP gases in the state, and whether these gases should be incorporated into cap and trade programs such as RGGI. 9. Commercial District Heating Given the enormous potential reductions from utilizing waste heat, these options merit more analysis, specifically with regard to their cost effectiveness in relation to other strategies. In addition strategies could be developed for use when other actions or circumstances are present that would help defray costs, such as sewer installation, combined sewer replacement or major utility infrastructure investments or upgrades. 2.4 CT GHG Emission Reduction Options: Land Use Change and Forestry Sector 2. Conserve and Enhance Carbon Sequestration Levels in CT’s Forests and Fields While ENE agrees with NESCAUM’s conclusion that there is a fairly limited role for GHG reductions from CT land and forests; however we do believe it is important that we catalogue current sequestration amounts and that we a calculation of the carbon impacts be required as a part of any significant land use changes or major development projects. In addition, new development can significantly increase emissions from forest removal and other land use changes and policies should be considered that require developers to account for and offset any emissions they cause. ENE looks forward to conitnueing to work with DEP and other state agencies to implement and comply with PA 08-‐98. Please don’t hesitate to contact us if you have any questions related to these comments. Sincerely, Jessie Stratton Government Relations Director Environment Northeast (ENE) ******************************************************************************************* 2) ROGER SMITH, CWA Public Comment by Clean Water Action on NESCAUM GHG strategies October 6, 2010
CT Greenhouse Gas Emissions: Mitigation Options Overview and Reduction Estimates Page
79
Clean Water Action is a national environmental non-‐profit dedicated to protecting human health with 24,000 Connecticut members. We have worked on global warming-‐related issues in Connecticut since 2002 and coordinate the 90 group-‐strong “Connecticut Climate Coalition.” For the health and welfare of our members and supporters, we strongly support our state's leadership in reducing greenhouse gas pollution and transitioning to a post-‐carbon economy. We also have the choice of whether to continue to purchase fuels from outside of Connecticut and New England or choose to create jobs here by investing and supporting local technologies that decrease our use of conventional fossil fuels as we address climate change. We appreciate this opportunity to comment on draft climate mitigation strategies. First, we urge the Governor’s Steering Committee on Climate Change (GSC) and NESCAUM not to count reductions from federal programs and regulations towards our state limits. Most federal climate proposals are currently years away from implementation and have significant political and legal vulnerabilities. Connecticut state law stands whether or not the federal government has programs in place, so we should assume that we need to meet our targets through state action and plan accordingly. Regarding the NESCAUM strategies, we are concerned that too great a focus on the 2020 reduction target could put us on a trajectory that will get the needed short-‐term reductions but fail to position us for the deeper 80% reductions required by 2050. The GSC and NESCAUM need to also set deeper 2025 and 2030 targets for planning purposes to ensure we analyze (and implement) enough measures to meet the legal requirements of Public Act 08-‐98. Thirdly, we urge the prioritization of policies which have co-‐benefits that demonstrably improve the quality of life in Connecticut. Public transportation (including commuter and high-‐speed rail), end-‐user energy efficiency and renewable energy programs, and programs that also reduce conventional air pollutants such as diesel exhaust should be prioritized. Carbon Lifecycle Accounting questions Over the past few years, critical studies have been published regarding the assumed carbon neutrality of biomass, trash incineration, and biofuels more broadly. The recent Manomet biomass study in Massachusetts questioned the neutrality of even clean forest wood, pointing out issues with timing (releasing carbon into the air now to be reduced by growing trees over decades) and confirmed the need for strict guidelines to ensure that biomass harvesting is sustainable. Other studies have questioned the carbon neutrality of certain types of ethanol and biodiesel due to indirect land-‐use changes. Based on this new information, we ask the GSC and NESCAUM to, at a minimum, review the projected carbon impacts of Class II of the RPS (as it includes solid waste incineration), any reductions attributed to the state's solid waste management plan to ensure the proper accounting of trash incineration, and review the full lifecycle greenhouse gas impacts of proposed and existing state biofuels policy (including the possible 20% biodiesel heating oil mandate and low-‐carbon fuels standard). http://www.heatingoil.com/blog/ct-‐governor-‐signs-‐low-‐sulfur-‐and-‐biodiesel-‐heating-‐oil-‐mandates-‐into-‐law-‐0614/ Electricity-‐specific recommendations We strongly support the continuation of the Class I Renewable Portfolio Standard and ask

CT Greenhouse Gas Emissions: Mitigation Options Overview and Reduction Estimates Page
80
NESCAUM to differentiate between emissions reductions attributed to Class I, II and III and to analyze the results of increasing the Class I standard to 25% by 2025 and 30% by 2030. Secondly, boilers and smaller EGUs are not the only potential for improving the Regional Greenhouse Gas Initiative and we urge a broader look at how to strengthen this program, including requiring deeper reductions from power plants before 2020. For a baseload CO2 performance standard, 1500lbs/MWh is far higher than what California and other states have adopted (1100lbs/MWh) and likely to be higher than what EPA proposes. Any standard should be technology-‐forcing and ratchet down over time. We suggest also modeling the 2009 KEMA Long-‐Term Sustainable Solar Strategy report’s recommendations to create a self-‐sustaining solar PV industry by bringing it to a scale of 300MW of solar by 2020 which then can rapidly expand as solar becomes cheaper than conventional fuels. http://www.ctcleanenergy.com/Portals/0/sustainable%20Solar%20Strategy%20FINAL%20Report%204-‐8-‐09.pdf Heating Efficiency recommendations The residential, commercial and industrial recommendations have significant overlap. We strongly support full analysis of reductions that would come from implementing our state’s existing law to achieve “all cost-‐effective efficiency” for electricity and natural gas and to also analyze the reduction potential for achieving this from heating oil and propane. The weatherization recommendation seems to duplicate the first Efficiency Fund-‐related recommendation and it is bizarre to focus on non-‐cost-‐effective technologies such as replacement windows (i.e. instead of replacement windows, installing shades, curtains, repairing windows and installing interior/exterior storms are far more cost-‐effective.) One technology worth investigating is the potential for solar hot water heating to displace heating by oil and electricity. It traditionally has received little attention by the Clean Energy Fund and Energy Efficiency Fund and could become significant over time. Thank you for your consideration, Roger Smith New England Energy Program Director Clean Water Action Additional email from Roger: In case NESCAUM doesn't already have this, these are some efficiency funding levels used by ENE-‐ they're conservative relative to the potential for oil measures: http://env-‐ne.org/public/resources/pdf/ENE_EE_ECON_CT_FINAL.pdf The efficiency section of this report really needs to be redone as it's not in line with what CT is actually doing or considering doing. Roger
CT Greenhouse Gas Emissions: Mitigation Options Overview and Reduction Estimates Page
81
******************************************************************************************* 3) MICHELE HELOU, SAGE DESIGN & CONSULTING Comments on CT Greenhouse Gas Emissions: Mitigation Options Overview and Reduction Estimates 3. Building codes – Upgrading residential and commercial building codes to improve energy performance of buildings could yield a significant reduction; however, additional data are needed in order to quantify the potential of these measures. Yes, I am in total agreement to upgrade of building codes -‐ however it is difficult if not impossible to quantify the potential of all measures for every building type (other than the obvious, insulation values, etc). A whole building performance compliance path based code similar to Oregon's code may be helpful. Also, incentivizing actual energy use will push the problem back to the design team on new projects and the occupants to operate efficiently. Any building in operation that meets the EPA Benchmark Target program for 1 year of reduced energy use should be incentived. Also consider Massachusett's 'stretch code' being developed. 4. Maximize energy efficiency potential as identified in a prior state survey ... Not all strategies work for all buildings -‐ the answers depend on building type, size, configuration, location, and occupant schedule. While this can be approximated by the use of energy models -‐ they are highly flawed. The only way to properly credit and incentivize energy efficiency in buildings is to base it on actual energy performance data. 5. Heat pumps – A program to incentivize or otherwise expand deployment of ground-‐source heat pumps for residential and commercial space and water heating could achieve a reduction of 2.3 MMT, assuming 20 percent of heating and cooling demands could be met through these technologies. No, this is not correct. Residential Heat pumps in our climate are not going to save energy in the big picture. Heat pumps use high grade electrical power (which has a 3 to 1 energy intensity compared to on-‐site produced heating from oil or gas). Ground source heat pumps only displace the load to the grid, which may get it's power from renewables -‐ but more often may not. So whether ground source heat pumps make carbon sense depend on the electricity profile -‐ and they may if the mix is high in nuclear -‐ is that what we want to incentivize ? This also puts residential homeowners at the mercy of the electricity company for basics such as heating. Heat pumps only make energy sense in this climate when used where cooling loads are constant (not heating) -‐ this is typically in larger commercial institutions with constant cooling loads. 6 Weatherization – A program to incentivize or otherwise expand weatherization programs for residential and commercial buildings could achieve a reduction of 0.2 MMT through replacement windows and 1.2 MMT through insulation improvements. Infiltration reduction, insulation and low cost storm windows should always come before full window replacements. A study on a typical older CT home would show where the real savings are. Again, since each case is different -‐ the proof is in the bills. Financing for these improvements will help greatly -‐ you are financing energy costs upfront! 7. Smart meters -‐ it's nice that the electric company will keep busy but I don't think this will do

CT Greenhouse Gas Emissions: Mitigation Options Overview and Reduction Estimates Page
82
a thing. Do people read their meters now, their bills? The problem is not ignorance on energy use -‐ it is apathy. Where are the on-‐site renewables? Residential Solar Hot Water? District Wind? Incentives for low use -‐ block pricing, improvement incentizes, high peak demand charges, etc? Michele Helou, Associate AIA, LEED AP-‐BD+C Principal, Sage Design & Consulting ******************************************************************************************* 4) STEPHANIE MARKS, UCONN Please accept the following comments related to the Electric Power Generation section and the Residential, Commercial, and Industrial Energy section. On March 25, 2008, University of Connecticut President Hogan signed the American College and University Presidents Climate Commitment (ACUPCC), committing the university to developing an action plan to achieve carbon neutrality by 2050. The University’s Climate Action Plan (CAP) can be accessed through this link: http://www.ecohusky.uconn.edu/pcc/climateactionplan.html. The University of Connecticut strongly supports the following GHG Reduction Strategies researched by the Northeast States for Coordinated Air Use Management (NESCAUM), as they specifically support our goals for GHG reductions outlined in the CAP. Electric Power Generation
1. Implement and/or strengthen the Connecticut Renewable Portfolio Standard – The current Renewable Portfolio Standard mandates that 27 percent of all electricity consumed within Connecticut be generated by renewable resources by 2020. The University of Connecticut’s cogeneration facility qualifies as a Class III Renewable energy source. We support increasing the percentage of the required RPS of category Class III sources to allow the market value and development of these types of resources to increase (currently flattened out at 4% through year 2020). Twenty five percent of the Renewable Energy Credits (RECs) generated by UConn’s facility transfer into the Clean Energy Efficiency Fund (CEEF) to support energy efficiency related projects. Resources generated by the sale of the RECs help subsidize campus energy efficiency programs such as lighting retrofits and retro-‐commissioning projects.
Residential, Commercial, and Industrial
1. Maximize energy efficiency potential from the Connecticut Energy Efficiency Fund, Natural Gas Efficiency Fund, and Fuel Oil Conservation Fund. The University utilizes these programs to help subsidize various energy efficiency programs such as lighting retrofits and retro-‐commissioning projects on our campuses.
We appreciate this opportunity to comment. Stephanie Marks Environmental Compliance Analyst UConn Office of Environmental Policy

CT Greenhouse Gas Emissions: Mitigation Options Overview and Reduction Estimates Page
83
31 LeDoyt Road, Storrs, CT 06269 860-‐486-‐1031 www.envpolicy.uconn.edu ******************************************************************************************* 5) AMANDA KENNEDY, RPA As promised, I’ve put some thoughts together on NESCAUM’s report. For the meantime, I think basing assumptions off of the analysis done in Growing Cooler and Moving Cooler makes sense, but we can be a little more nuanced in estimating how smart growth and transit strategies might affect Connecticut VMT. Impact of Smart Growth Strategies: The report currently assumes that since CT is 1% of the US’s population, it can achieve 1% of the projected GHG reductions from smart growth policies. I think you need to look more closely at Connecticut’s growth rates compared to national averages. Because we are growing more slowly, it’s reasonable to assume that reductions from smart growth alone would be less than 1% of the national total. A good place to start would be by looking at the data compiled as the basis for this report by the Massachusetts Housing Partnership: http://www.mhp.net/vision/news.php?page_function=detail&mhp_news_id=250. I haven’t delved into Connecticut’s housing development rates, but our analysis of the Hartford region tells us that in the next twenty years, 18,000 additional households will exist and need to be accommodated by new housing -‐ a 6.5% increase in housing units for a 4% increase in population. Growing Cooler also cites a report that 6% of housing is replaced each decade, which would mean that the Hartford region would rebuild an additional 35,000 housing units, either in place or elsewhere in the region. A resource for past trends in Connecticut housing might be the databases published by DECD at http://www.ct.gov/ecd/cwp/view.asp?a=1106&q=250640 which contain info on number of housing units built by municipality as well as housing type (look at permit and construction reports). For the purposes of revising the current draft report, the above should be a good strategy, but you will also be interested in our work in the Hartford region, which assessed the impacts of smart growth development using the Toronto model we mentioned this morning. The report is posted here: http://www.rpa.org/2010/03/a-‐transit-‐oriented-‐future-‐for-‐connecticuts-‐capital-‐region.html To summarize briefly, we developed alternative growth scenarios for three corridors in the Hartford region and compared associated household VMT and emissions with those expected from development that would occur under current zoning regulations. Focusing growth in village centers and along transit resulted in a 4-‐18% decrease in emissions from projected amounts, while accommodating the development of thousands more housing units than currently accommodated. The Growing Cooler report estimates that compact development will generate 35% less VMT than comparison sites. Our Hartford study estimated that households in corridors under infill/transit-‐served scenarios would see average VMT per household drop by 13%-‐23%. This is a little bit apples and oranges, since the Growing Cooler report is quantifying only the VMT from
CT Greenhouse Gas Emissions: Mitigation Options Overview and Reduction Estimates Page
84
new development and we are averaging the behavior of new development with existing development. Our figures are directly comparable to the 3% drop in VMT targeted in the Climate Change Action Plan. Impact of Transit Strategies: In this case, I suspect that Connecticut will be able to enjoy a larger than 1% share of emissions reductions due to expanded transit use. I haven’t read through NESCAUM’s supporting documentation closely but there must be some way to compare CT’s ability to increase transit ridership more relative to other parts of the country because of our underlying density and historic centeredness we enjoy as a result of early growth patterns that depended on river transport, rail, and streetcars. My analysis shows that 64% of Connecticut residents live near an existing bus line. I’m not sure where to get a comparable national figure. There must be other ways to compare the relative “urbanness” of Connecticut communities, too. The general school of thought is that transit works at densities of 12 units to the acre or higher, and I’m sure that more people live at that density in CT than on average nationally. I hope this helps you as you fine-‐tune the report. Let me know if you have any questions or want some feedback. Thanks, Amanda Kennedy Associate Planner Regional Plan Association 203-‐356-‐0390 www.rpa.org ******************************************************************************************* 6) STEVE GUYEVAN, CT PETROLEUM COUNCIL Below are our comments regarding the Low-‐Carbon Fuel Standard (LCFS) proposal which is being considered as a possible strategy to reduce greenhouse gas emissions in Connecticut. Slide #10 in the presentation made at SIPRAC by NESCAUM said DEP is seeking comments by October 12th on “Upstream Reductions.” A full-‐fledged LCFS presentation or plan was not made at SIPRAC, so we can offer only limited comments based upon the snippet of the plan outlined at that meeting. Key questions still remaining, for example: (1) who are the obligated parties under a LCFS? (2) how will the success or failure of a LCFS be tracked or benchmarked? We can provide more substantial input once you provide further LCFS details. As you know, we have serious concerns about a LCFS; the LCFS rule in California is plagued with enormous difficulties, and CA is a state which has its own crude oil, refineries and other means of production which we do not have here in New England. We recommend caution moving forward, and encourage DEP to allow flexibility in any LCFS program design in case it needs to be changed. Crediting Upstream Reductions-‐-‐-‐-‐-‐Crude Oil

CT Greenhouse Gas Emissions: Mitigation Options Overview and Reduction Estimates Page
85
If “upstream” means oil exploration and production (which is what it means in the petroleum industry), then it suggests substituting oil from Oilfield A (heavier oil with a higher carbon intensity) for oil from Oilfield B, which has a lower carbon intensity. That would necessitate a shift from some of our most dependable suppliers (Canada, Mexico and Venezuela) to other countries that produce a lighter, sweeter crude oil (which is historically more expensive), thereby upsetting the balance of trade between the U.S. and its key oil trading partners. We have very strong objections to a LCFS forcing oil companies to change their supply partners, with whom they have long-‐standing supply agreements, contracts and relationships. Crediting Upstream Reductions-‐-‐-‐-‐-‐EV’s/ Renewables/ CNG If “upstream reductions” mean reductions from non-‐tailpipe emissions from EV’s/ Renewables/ CNG, then we have the following comments. Calculations to determine the carbon intensity of any fuel should include both direct and indirect land-‐use emissions associated with the production of the fuel. It should not be limited to tailpipe emissions. Government must study potential cross-‐media environmental impacts of widespread use of low-‐carbon fuels and address secondary impacts, including the impact on food supplies and the environment (air quality, land use and water resources). Standards to ensure the sustainable sourcing of renewable fuels should be considered. Given that U.S. policies can impact the global environment and global markets, these studies need to examine global effects as well as national. Modeling-‐-‐-‐and not assumptions-‐-‐-‐should be used for determining the value of emissions from land-‐use in any fuels, as it is significantly more defensible than a series of assumptions. At this time, however, there is no consensus among scientists on life-‐cyle carbon analysis models; the U.S. DOE/ GREET model used in Slide #10 as the basis of this plan has significant flaws according to many experts. Before a LCFS can move forward, a collaborative effort is needed to develop an agreed-‐upon model. Before life-‐cycle carbon analysis models are used by CT DEP/ NESCAUM to develop regulatory impact, “equivalence values” (values that relate a fuel’s life-‐cycle carbon impact to the carbon impact of gasoline), stakeholders must agree on the science behind them. The volume of renewable fuels required to meet GHG reduction targets under the RFS-‐2 (and by extension, Slide #10) may not be achievable, since the targets depend on technology that is unlikely to be commercial in the near term. EPA revised substantially downward the amount of cellulosic ethanol to be sold in the U.S. during 2010 because of supply unavailability, and we expect that to occur again in 2011. Production of other bio-‐fuels dropped very significantly this year when the $1.00 per gallon federal bio-‐fuel tax credit expired on December 31, 2009. Its renewal was voted down by Congress last month. Within the transportation sector, there should be equitable requirements placed upon both auto manufacturers and fuel suppliers to reduce greenhouse gas emissions. For example, vehicle manufacturers may use increased diesel sales to comply with a LCFS, however, that could increase GHG’s from refineries, and thus increase the stringency of a LCFS on the oil industry. The playing field for all fuels should be level: a LCFS should not pick and choose winners or certain technologies, and Slide #10 appears to capture that recommendation by allowing for bounding scenarios among EV/ Renewables/ CNG. Trading of emission credits generated by exceeding performance standards for either vehicles or fuels should be allowed between the two industries as long as equitable standards are established that avoid double-‐counting; that does not appear to be captured in Slide #10, but we strongly recommend it.

CT Greenhouse Gas Emissions: Mitigation Options Overview and Reduction Estimates Page
86
Finally, under no circumstances do we want to see differing or overlapping state-‐by-‐state LCFS rules. We will be able to offer substantially more input once we see an entire LCFS plan. Thank you for taking our comments. ******************************************************************************************* 7) ADAM DANE I am writing in response to the solicitation for data on construction and renovation activity in Connecticut mentioned on page 35 of the NESCAUM Analysis of Potential Greenhouse Gas Reduction Strategies. I'm interested in knowing more detail about the specific data needed, but the following links to the Census Bureau and CT DECD seem a good starting point: http://www.census.gov/const/www/permitsindex.html http://www.ct.gov/ecd/cwp/view.asp?a=1106&q=250640 Please let me know if I can be of any assistance. Best Regards, Adam Dane [email protected] ******************************************************************************************* 8) BRIAN TANG I was wondering if it might be possible to try to quantify the greenhouse gas emission reduction potential of investments in freight rail and port infrastructure intended to shift freight shipments away from truck transport. I admit that I have no idea what proportion of transport-‐sector GHG emissions result from big rigs, but the advertisements for the freight railway companies always emphasize how much more efficient trains are than trucks. If shipping by rail is as efficient as the ads say, then it at least seems plausible that investments in freight rail and port infrastructure might yield significant reductions in greenhouse gas emissions. More generally, thanks for all the worthwhile work! And thanks for listening to my recommendations on how to organize the report! It is worlds easier to comprehend than the original table. It has even helped me to learn things I never knew before. For example, I had no idea how much more of a GHG emission reduction could result from improved vehicle efficiency than from VMT reduction! It strikes me as quite counterintuitive, but I guess I'll have to trust your models, as I don't have any of my own. Finally, I still hunger for a few good infographics to visualize the tables and tie everything together. Have you considered perhaps issuing some sort of call for submissions from graphic
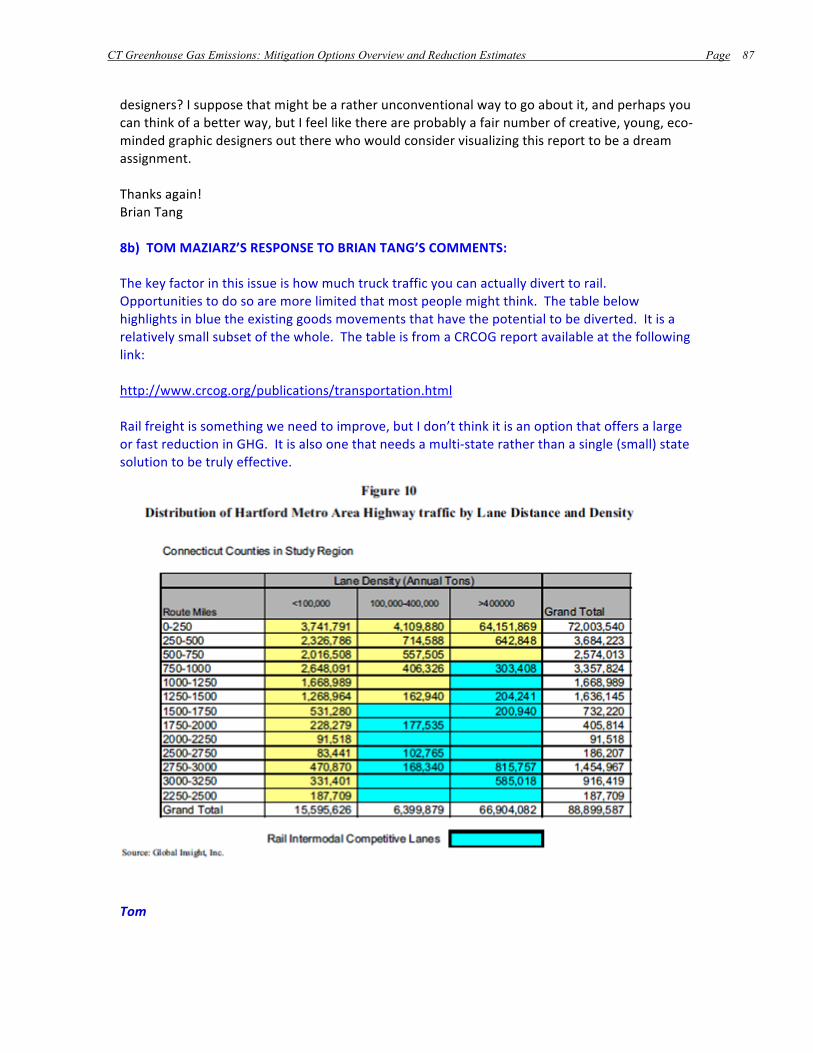
CT Greenhouse Gas Emissions: Mitigation Options Overview and Reduction Estimates Page
87
designers? I suppose that might be a rather unconventional way to go about it, and perhaps you can think of a better way, but I feel like there are probably a fair number of creative, young, eco-‐minded graphic designers out there who would consider visualizing this report to be a dream assignment. Thanks again! Brian Tang 8b) TOM MAZIARZ’S RESPONSE TO BRIAN TANG’S COMMENTS: The key factor in this issue is how much truck traffic you can actually divert to rail. Opportunities to do so are more limited that most people might think. The table below highlights in blue the existing goods movements that have the potential to be diverted. It is a relatively small subset of the whole. The table is from a CRCOG report available at the following link: http://www.crcog.org/publications/transportation.html Rail freight is something we need to improve, but I don’t think it is an option that offers a large or fast reduction in GHG. It is also one that needs a multi-‐state rather than a single (small) state solution to be truly effective.
Tom

CT Greenhouse Gas Emissions: Mitigation Options Overview and Reduction Estimates Page
88
Thomas J. Maziarz Bureau Chief Bureau of Policy and Planning Connecticut Department of Transportation [email protected] (860) 594-‐2001 ******************************************************************************************* 9) ANDY BAUER, PORTLAND CE TASK FORCE Climate Change, unabated, having the capability to negatively effect the globe in a myriad of ways, requires action on local, state, national and international levels. Let's do what we can. Expand home weatherization programs like the CT Energy Efficiency Fund's Home Energy Solutions program. Fully fund/expand programs that finance solar power and other renewable forms of energy for homes, municipalities and businesses. Increase mass transit. Not only does these steps reduce harmful emissions, but they also spur local job growth and economies, get us off of dwindling and increasingly expensive foreign fuels, and save energy dollars for all concerned. Andy Bauer Portland Clean Energy Task Force Chairman ******************************************************************************************* 10) ATID KIMELMAN I strongly support Connecticut moving ahead on dealing with climate change. I support Connecticut's State Climate Strategy and in particular I support policies which will benefit large numbers of people, such as expanding home weatherization programs, clean energy programs, and public transportation. Thank you, Atid Kimelman ******************************************************************************************* 11) GORDAN BATES Having reviewed the report, I have no technical comments to make. I would, however, like to express my gratitude for the work done and all the indicators of progress made to date. I would also register my pride that New England is helping to lead the way to a more eco-‐friendly world. When I consider the current ecological threats to the planet in the light of our grandchildrens' future, I despair at times over the problems we are generating for them by our immoral misuse and squandering of earth's resources. This Report gives me hope that working together some of the damage already done can be repaired or reduced, and hope restored for the generations yet to come.

CT Greenhouse Gas Emissions: Mitigation Options Overview and Reduction Estimates Page
89
Gordon Bates 50 Huckleberry Road East Hartford, CT 06118 ******************************************************************************************* 12) MIRIAM KURLAND I was told that you are asking for strategies to stop global warming and I would like to offer some ideas I have been discussing. My older daughter is a social worker and my younger daughter had just received her Masters Degree in Environmental Science and Policy at Clark University's outstanding International Community Development Institute and my family have discussed at length problems and solutions that can be put forth to stop global warming if there was leadership and motivation to do so. Many of Tara's and Jayme's ideas have been absolutely inspiring and innovative. The following would be included in those that I can remember at this moment: 1. We must cut down are our over reliance on an economy based on items that add little value to the survival of life on Earth. Each of us needs to cut down on our consumption of energy through simple steps such as shutting off lights when leaving a room, shutting off and unplugging (if possible) appliances when not in use, traveling in smaller and more efficient vehicles, biking and walking when possible, carpooling, stop faucets from wasteful running of water, using energy efficient technology when possible, getting energy audits to fix and improve energy consumption in our houses, use non fossil/non nuclear energy systems when affordable alternatives are available, buy local, reduce consumption of animal products and other products that require toxic elements to be used in their production or finished form, recycle goods and compost foods, reduce factory farmed products, and support environmentally and socially responsible small businesses and farms. 2. Our state government can support the above efforts by providing tax incentives for businesses that develop environmentally and socially responsible products, production and services; provide strong penalties for businesses that abuse their workers, consumers, and/or the environment; provide incentives for cooperative businesses owned by workers and/or consumers who have a stake in their local communities; provide incentives for small, local businesses; fund research, development and production for new, efficient, effective and innovative technologies that are renewable, safe, clean and result in little or no toxic wastes; empower and fund communities to support local citizen groups to solve environmental and social problems they identify; fund and develop small, local solar and wind energy systems owned by consumers; provide incentives for local, organic farming; retrain our workforce to change our economy from weaponry to socially and environmentally responsible career choices; invest in effective public education, by providing children with small classes that focus on hands on learning and develops analytical and innovative thinking for creativity and questioning, rather than memorization, rote thinking and automatized testing; provide tax incentives for businesses that hire and employ within the state and provide penalties to those that relocate out of our country; provide incentives for businesses that are socially, culturally and environmentally knowledgeable, respectful and responsible in any work with other countries; and more.

CT Greenhouse Gas Emissions: Mitigation Options Overview and Reduction Estimates Page
90
There were many more ideas that I learned and have been inspired to think about from my discussions with my daughters, but at least this is a list for our state to begin implementing, if we ever hope to stop global warming. I hope it helps. thanks, Miriam Kurland ******************************************************************************************* 13) GABRIELE MICHELS I understand you are looking for comments on proposed global warming strategies. I have two that may help the state: increase public transportation, especially adding proposed rail lines with high speed trains; and research solar hot water heating to replace oil heat and electrical heat. Sincerely, Gabriele Michels 165 Long Hill Drive Glastonbury, CT 06033 ******************************************************************************************* 14) PETER VESLOCKI The public is hung on the horns of a delima: We can't readily change anythng. 1. We can't afford to replace our autos and home heating systems with more effecient, clean energy ones ones until the old ones wear out. 2. The rate of return, financially on doing so is miniscule because new technology and financing is so extremely expensive and solar itself is extremely ineffecient. 3. Most extisting automobiles, home heating systems, major appliances etc are unajustible from an emissions point of view. 4. We've already have maxed out concerving energy useage as much as we comfortibly can. 5. Utility rates, the cost of gasoline, diesel fuel, property taxes, multiple layers of taxes, the negeative compound effect of taxes overall on the cost of everything is constantly going up to where no one can afford to or want to make huge investments in going green, replacing their cars or upgrading their homes in a declining real estate market. 5. Effecient cattle car mass transit has proven to be socially un-‐acceptible. And working at home has accountibikity problems and incurrs more personal expences in heating and cooling ones home with no tax relief.

CT Greenhouse Gas Emissions: Mitigation Options Overview and Reduction Estimates Page
91
6. And this extended recession only perpetuates our inability to change things. 7. Plus tax incentives for uogrades are mitigated by un-‐realistic ongoing ever increasing property tax appraisals. Basically, the average person is screwed. And woser yet we can't sell our homes to leave Connecticut without incurring huge financial losses. The only immediate viable alternative I see are: 1. Press industry to priduce more energyveffecient products by refusing to buy ineffecient ones. 2. Is to reduce the number of state and muninciple buildings and vehicles we tax payers oay to operate by reducing the number of State and Muninciple Employees through consolidation and attrition. And that makes them sacrificial lambs creating a huge hardship for that group of people. The only interm solution I see is to: 1. Try to get oil producers to lower the carbon content of fuels te burn. 2. Gradually condolidate state snd muninciple functions into fewer buildings staffed by fewer peopl. 3. Lower utility rates and taxes for everyone so everyone can afford to replace their cars, home heating systems and appliances with more effecient, green energy sources reducing emissions across the board. Long term we have to press industry and government now to develop sustainable clean, effecient energy source industries to replace our polluting fossel fuel sources. Thank you for reading my letter. Sincerely, Pete Veslocki 860-‐930-‐5136 ******************************************************************************************* OTHER INFO TO CONSIDER:
FOR IMMEDIATE RELEASE CONTACT: Elinor Hargreaves 860-‐291-‐8832 [email protected] October 6, 2010
CT Greenhouse Gas Emissions: Mitigation Options Overview and Reduction Estimates Page
92
CCAT Expands Local and State Partnership Building Program
The Connecticut Center for Advanced Technology, Inc. (CCAT) of East Hartford, CT, today announced an expansion of its "Local and State Partnership Building Program" which is funded by the U.S. Department of Energy (DOE). The expanded "Roadmap" program will provide specific guidance to states throughout New England, New York, and New Jersey to facilitate the implementation of hydrogen and fuel cell technologies. CCAT will implement the "Roadmap" in conjunction with another new program sponsored by the U.S. Small Business Administration (SBA) to enhance and expand an emerging electrochemical energy storage cluster centered in the Northeast United States.
The hydrogen and fuel cell industry in the region has been recognized as a world leader in the research, design, and manufacture of hydrogen and fuel cell related technology. The region is currently home to a diverse supply chain of over 170 companies and organizations. The development of guidance documents or "roadmaps" will assess market conditions for fuel cell and hydrogen technology; examine solutions to promote hydrogen and fuel cell deployment in each of the states; and assess strategies to enhance domestic production of hydrogen and fuel cell technology for increased employment and economic development.
"Through this grant expansion, CCAT will be leveraging resources to better serve the hydrogen and fuel cell industry in the Northeast. Creating "market pull" through roadmap activities coupled with providing support services to small businesses in this industry cluster provides a comprehensive formula for business creation and job growth." commented Elliot A. Ginsberg, President and CEO of CCAT.
It has been estimated that the global fuel cell/hydrogen market, when mature, could exceed $43 billion annually, and require an employment base of tens of thousands. This global demand for the fuel cells is based on a market demand for clean and efficient energy utilization for transportation and power markets.
"This technology is primarily developed and manufactured here in the region as a product for global export," Joel Rinebold, Director of Energy Programs at CCAT said. "The investment of resources to support the hydrogen and fuel cell industry is appropriate and justified for economic growth, job creation, energy management, and enhanced environmental performance."
******************************************************************************************* At the end of my talk today, one stakeholder mentioned to Paul and I that some congressional committee (maybe house energy) has a new report out that might be useful. EE, I think. Might be worth tracking down. Gary Kleiman Northeast States for Coordinated Air Use Management TEL: 617-‐909-‐7092 FAX: 617-‐742-‐9162

CT Greenhouse Gas Emissions: Mitigation Options Overview and Reduction Estimates Page
93
******************************************************************************************* Governor’s Electric Vehicles Infrastructure Council Report http://www.ct.gov/dpuc/lib/dpuc/ev/evfinal.pdf