connecticut extended producer responsibility program ... · pdf fileconnecticut extended...
TRANSCRIPT
Connecticut Extended Producer Responsibility Program Evaluation: Summary and Recommendations
October 21, 2016
Prepared by the Product Stewardship Institute, Inc.
Connecticut Extended Producer Responsibility Program Evaluation: Summary and Recommendations i Report to CT DEEP by the Product Stewardship Institute – October 21, 2016
The Product Stewardship Institute
The Product Stewardship Institute (PSI) is a national, membership-based nonprofit
committed to reducing the health, safety, and environmental impacts of consumer
products across their lifecycle with a strong focus on sustainable end-of-life
management. Headquartered in Boston, Mass., PSI takes a unique product stewardship
approach to solving waste management problems by encouraging product design
changes and mediating stakeholder dialogues. With 47 state environmental agency
members, along with hundreds of local government members from coast-to-coast, and
110 corporate, business, academic, non-U.S. government, and organizational partners,
we work to design, implement, evaluate, strengthen, and promote both legislative and
voluntary product stewardship initiatives across North America
Acknowledgements
PSI prepared this report for the Connecticut Department of Energy and Environmental
Protection (CT DEEP). We would like to thank CT DEEP’s Tom Metzner and Sherill
Baldwin for their leadership in initiating this research and providing input on the
development of the report. We would also like to thank PaintCare, the Mattress
Recycling Council, the Thermostat Recycling Corporation, and Connecticut’s Covered
Electronics Recyclers for providing data and input for this report. PSI’s Sydney Hausman-
Cohen and Resa Dimino are the primary authors.
Project Contact
For more information, please contact Scott Cassel, PSI Chief Executive Officer and
Founder, at [email protected], or (617) 236-4822.
Connecticut Extended Producer Responsibility Program Evaluation: Summary and Recommendations ii Report to CT DEEP by the Product Stewardship Institute – October 21, 2016
TABLE OF CONTENTS
I. Executive Summary .......................................................................................................................... 1
II. Electronics ....................................................................................................................................... 1
III. Mercury Thermostats....................................................................................................................... 4
IV. Paint ................................................................................................................................................ 6
V. Mattresses ....................................................................................................................................... 8
VI. Recommendations ......................................................................................................................... 10
VII. Appendix A: Summary Chart - Electronics ....................................................................................... 12
VIII. Appendix B: Summary Chart – Mercury Thermostats ..................................................................... 14
IX. Appendix C: Summary Chart – Paint ............................................................................................... 16
X. Appendix D: Summary Chart – Mattresses ..................................................................................... 19
Connecticut Extended Producer Responsibility Program Evaluation: Summary and Recommendations 1 Report to CT DEEP by the Product Stewardship Institute – October 21, 2016
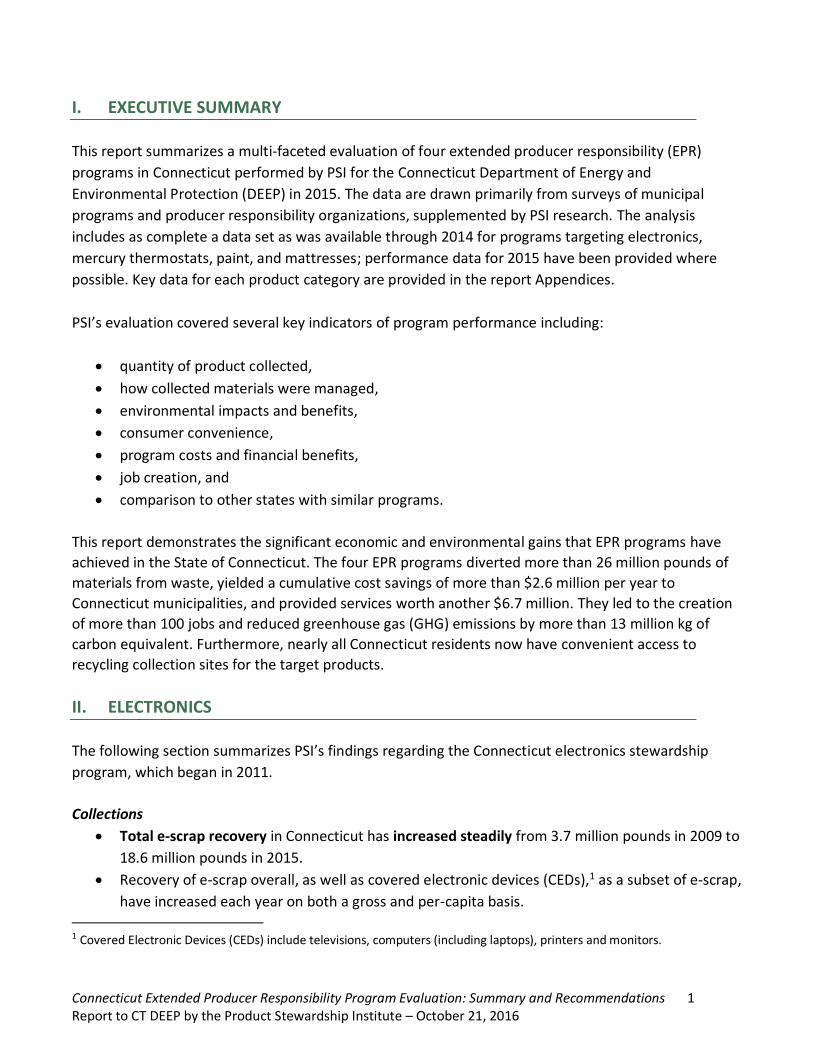
I. EXECUTIVE SUMMARY
This report summarizes a multi-faceted evaluation of four extended producer responsibility (EPR)
programs in Connecticut performed by PSI for the Connecticut Department of Energy and
Environmental Protection (DEEP) in 2015. The data are drawn primarily from surveys of municipal
programs and producer responsibility organizations, supplemented by PSI research. The analysis
includes as complete a data set as was available through 2014 for programs targeting electronics,
mercury thermostats, paint, and mattresses; performance data for 2015 have been provided where
possible. Key data for each product category are provided in the report Appendices.
PSI’s evaluation covered several key indicators of program performance including:
quantity of product collected,
how collected materials were managed,
environmental impacts and benefits,
consumer convenience,
program costs and financial benefits,
job creation, and
comparison to other states with similar programs.
This report demonstrates the significant economic and environmental gains that EPR programs have
achieved in the State of Connecticut. The four EPR programs diverted more than 26 million pounds of
materials from waste, yielded a cumulative cost savings of more than $2.6 million per year to
Connecticut municipalities, and provided services worth another $6.7 million. They led to the creation
of more than 100 jobs and reduced greenhouse gas (GHG) emissions by more than 13 million kg of
carbon equivalent. Furthermore, nearly all Connecticut residents now have convenient access to
recycling collection sites for the target products.
II. ELECTRONICS
The following section summarizes PSI’s findings regarding the Connecticut electronics stewardship
program, which began in 2011.
Collections
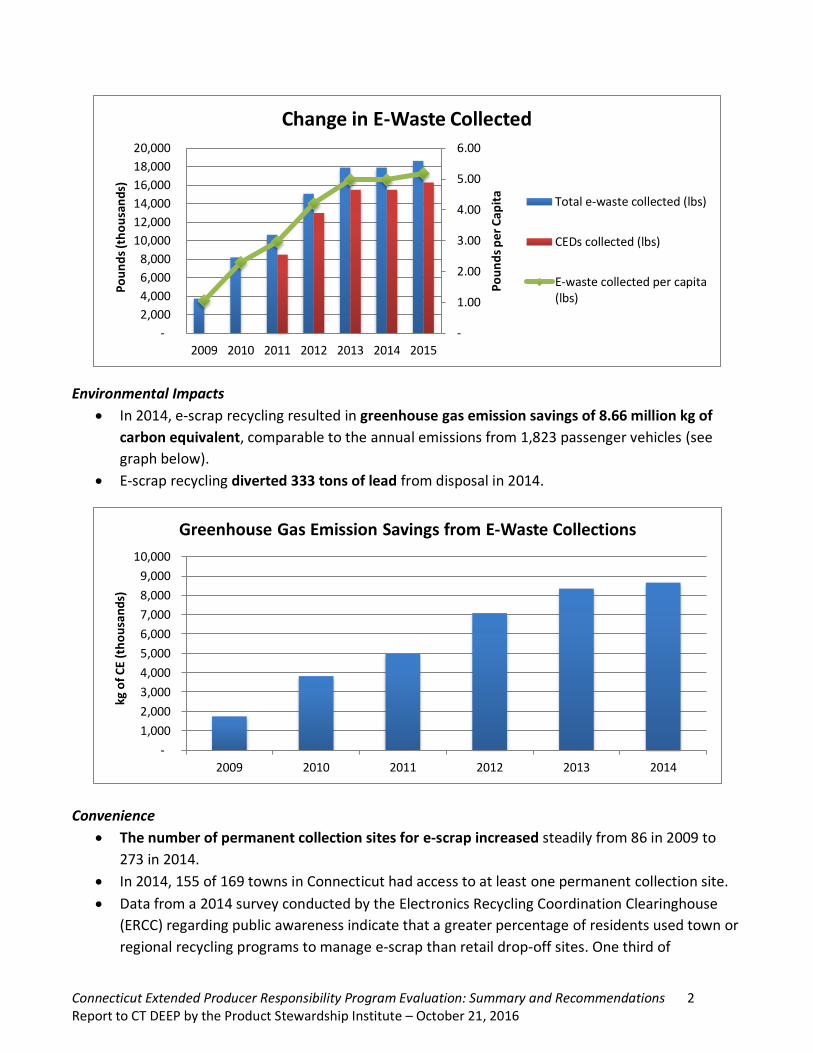
Total e-scrap recovery in Connecticut has increased steadily from 3.7 million pounds in 2009 to
18.6 million pounds in 2015.
Recovery of e-scrap overall, as well as covered electronic devices (CEDs),1 as a subset of e-scrap,
have increased each year on both a gross and per-capita basis. 1 Covered Electronic Devices (CEDs) include televisions, computers (including laptops), printers and monitors.
Connecticut Extended Producer Responsibility Program Evaluation: Summary and Recommendations 2 Report to CT DEEP by the Product Stewardship Institute – October 21, 2016
Environmental Impacts
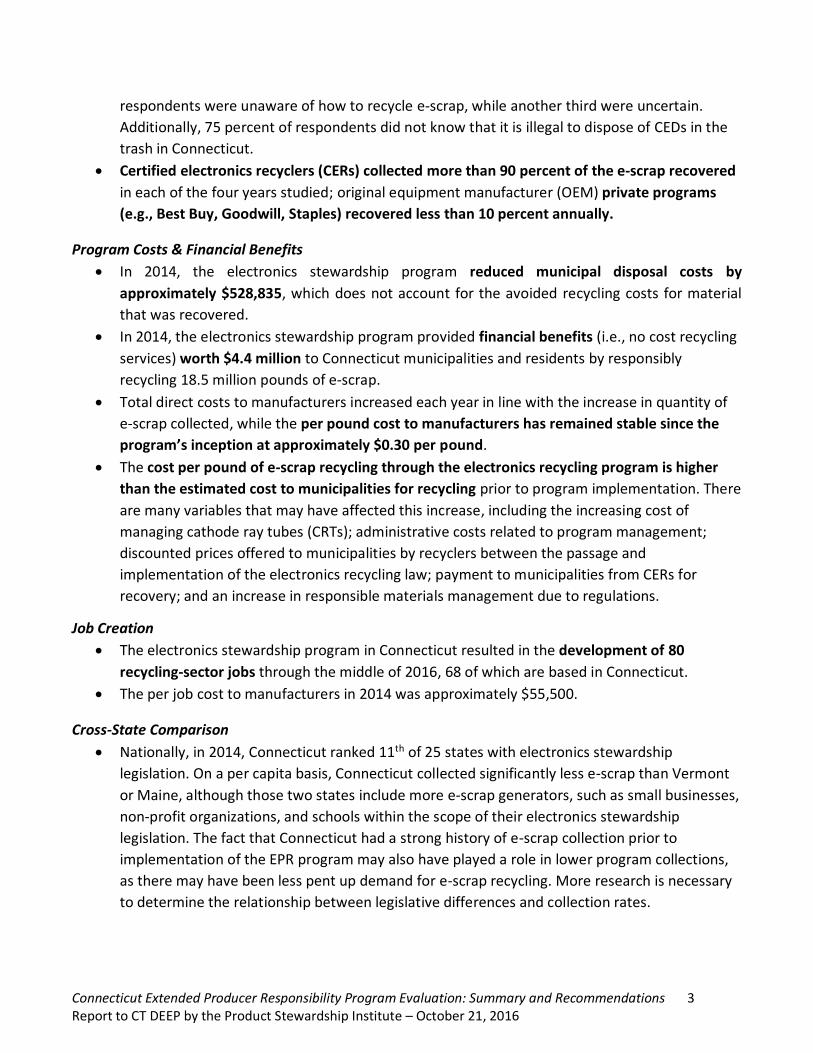
In 2014, e-scrap recycling resulted in greenhouse gas emission savings of 8.66 million kg of
carbon equivalent, comparable to the annual emissions from 1,823 passenger vehicles (see
graph below).
E-scrap recycling diverted 333 tons of lead from disposal in 2014.
Convenience
The number of permanent collection sites for e-scrap increased steadily from 86 in 2009 to
273 in 2014.
In 2014, 155 of 169 towns in Connecticut had access to at least one permanent collection site.
Data from a 2014 survey conducted by the Electronics Recycling Coordination Clearinghouse
(ERCC) regarding public awareness indicate that a greater percentage of residents used town or
regional recycling programs to manage e-scrap than retail drop-off sites. One third of
-
1.00
2.00
3.00
4.00
5.00
6.00
-
2,000
4,000
6,000
8,000
10,000
12,000
14,000
16,000
18,000
20,000
2009 2010 2011 2012 2013 2014 2015
Po
un
ds
pe
r C
apit
a
Po
un
ds
(th
ou
san
ds)
Change in E-Waste Collected
Total e-waste collected (lbs)
CEDs collected (lbs)
E-waste collected per capita(lbs)
-
1,000
2,000
3,000
4,000
5,000
6,000
7,000
8,000
9,000
10,000
2009 2010 2011 2012 2013 2014
kg o
f C
E (t
ho
usa
nd
s)
Greenhouse Gas Emission Savings from E-Waste Collections
Connecticut Extended Producer Responsibility Program Evaluation: Summary and Recommendations 3 Report to CT DEEP by the Product Stewardship Institute – October 21, 2016
respondents were unaware of how to recycle e-scrap, while another third were uncertain.
Additionally, 75 percent of respondents did not know that it is illegal to dispose of CEDs in the
trash in Connecticut.
Certified electronics recyclers (CERs) collected more than 90 percent of the e-scrap recovered
in each of the four years studied; original equipment manufacturer (OEM) private programs
(e.g., Best Buy, Goodwill, Staples) recovered less than 10 percent annually.
Program Costs & Financial Benefits
In 2014, the electronics stewardship program reduced municipal disposal costs by
approximately $528,835, which does not account for the avoided recycling costs for material
that was recovered.
In 2014, the electronics stewardship program provided financial benefits (i.e., no cost recycling
services) worth $4.4 million to Connecticut municipalities and residents by responsibly
recycling 18.5 million pounds of e-scrap.
Total direct costs to manufacturers increased each year in line with the increase in quantity of
e-scrap collected, while the per pound cost to manufacturers has remained stable since the
program’s inception at approximately $0.30 per pound.
The cost per pound of e-scrap recycling through the electronics recycling program is higher
than the estimated cost to municipalities for recycling prior to program implementation. There
are many variables that may have affected this increase, including the increasing cost of
managing cathode ray tubes (CRTs); administrative costs related to program management;
discounted prices offered to municipalities by recyclers between the passage and
implementation of the electronics recycling law; payment to municipalities from CERs for
recovery; and an increase in responsible materials management due to regulations.
Job Creation
The electronics stewardship program in Connecticut resulted in the development of 80
recycling-sector jobs through the middle of 2016, 68 of which are based in Connecticut.
The per job cost to manufacturers in 2014 was approximately $55,500.
Cross-State Comparison
Nationally, in 2014, Connecticut ranked 11th of 25 states with electronics stewardship
legislation. On a per capita basis, Connecticut collected significantly less e-scrap than Vermont
or Maine, although those two states include more e-scrap generators, such as small businesses,
non-profit organizations, and schools within the scope of their electronics stewardship
legislation. The fact that Connecticut had a strong history of e-scrap collection prior to
implementation of the EPR program may also have played a role in lower program collections,
as there may have been less pent up demand for e-scrap recycling. More research is necessary
to determine the relationship between legislative differences and collection rates.
Connecticut Extended Producer Responsibility Program Evaluation: Summary and Recommendations 4 Report to CT DEEP by the Product Stewardship Institute – October 21, 2016
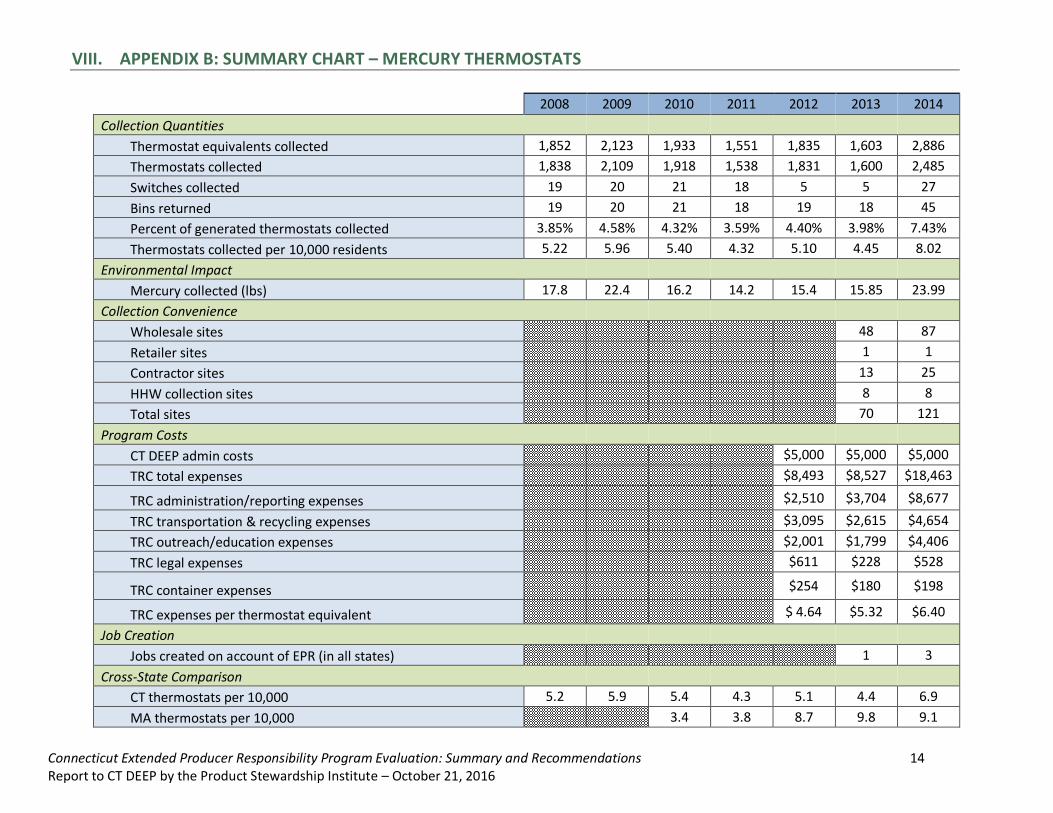
III. MERCURY THERMOSTATS
The following section summarizes PSI’s findings regarding the Connecticut mercury thermostat
stewardship program, which began in 2013.
Collections
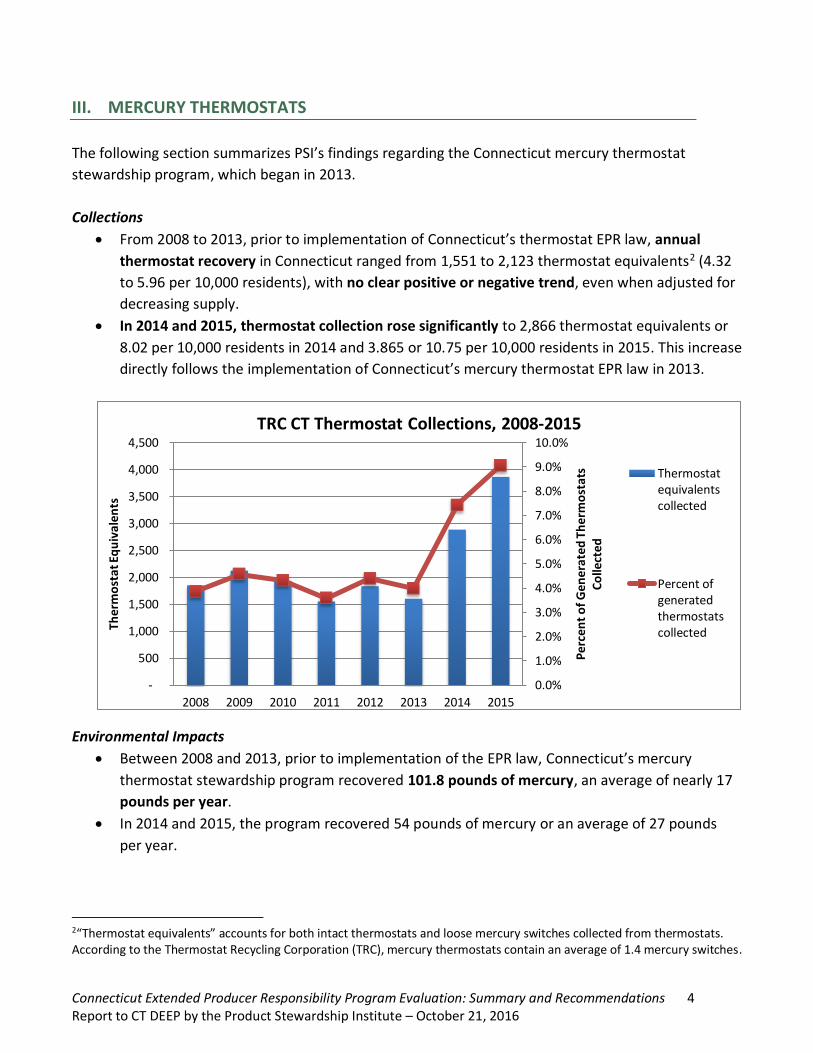
From 2008 to 2013, prior to implementation of Connecticut’s thermostat EPR law, annual
thermostat recovery in Connecticut ranged from 1,551 to 2,123 thermostat equivalents2 (4.32
to 5.96 per 10,000 residents), with no clear positive or negative trend, even when adjusted for
decreasing supply.
In 2014 and 2015, thermostat collection rose significantly to 2,866 thermostat equivalents or
8.02 per 10,000 residents in 2014 and 3.865 or 10.75 per 10,000 residents in 2015. This increase
directly follows the implementation of Connecticut’s mercury thermostat EPR law in 2013.
Environmental Impacts
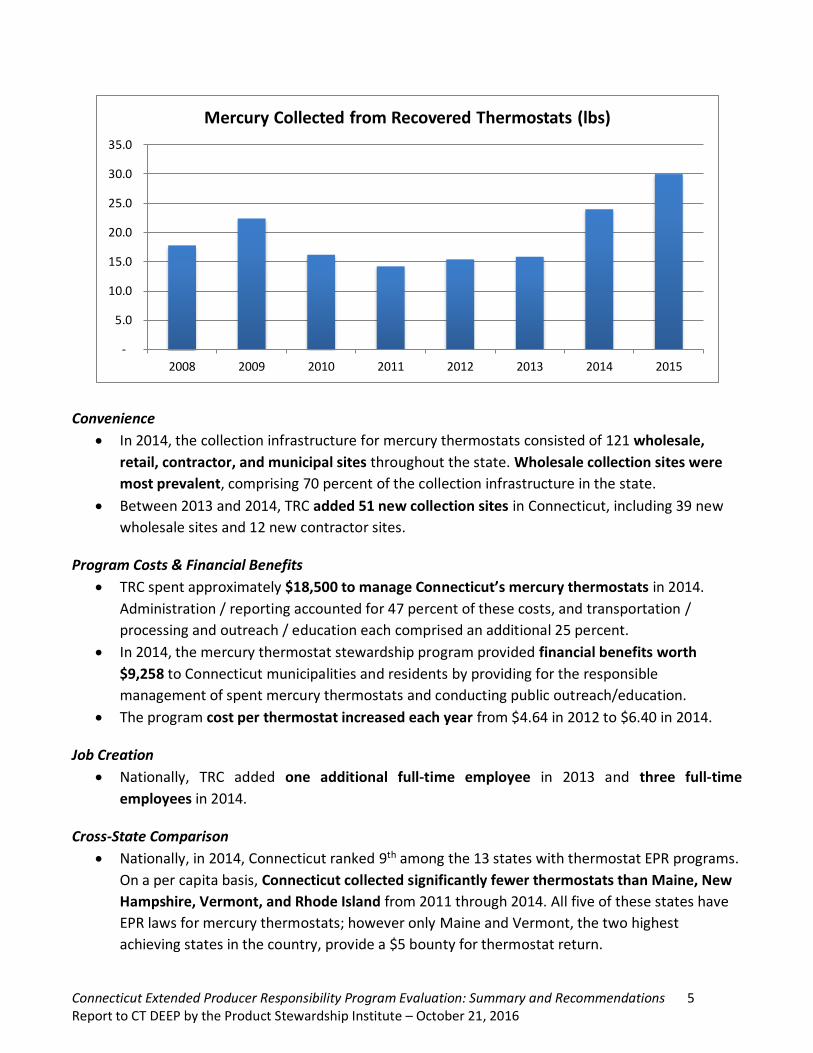
Between 2008 and 2013, prior to implementation of the EPR law, Connecticut’s mercury
thermostat stewardship program recovered 101.8 pounds of mercury, an average of nearly 17
pounds per year.
In 2014 and 2015, the program recovered 54 pounds of mercury or an average of 27 pounds
per year.
2“Thermostat equivalents” accounts for both intact thermostats and loose mercury switches collected from thermostats. According to the Thermostat Recycling Corporation (TRC), mercury thermostats contain an average of 1.4 mercury switches.
0.0%
1.0%
2.0%
3.0%
4.0%
5.0%
6.0%
7.0%
8.0%
9.0%
10.0%
-
500
1,000
1,500
2,000
2,500
3,000
3,500
4,000
4,500
2008 2009 2010 2011 2012 2013 2014 2015
Per
cen
t o
f G
ener
ate
d T
her
mo
stat
s C
olle
cted
Ther
mo
stat
Eq
uiv
alen
ts
TRC CT Thermostat Collections, 2008-2015
Thermostatequivalentscollected
Percent ofgeneratedthermostatscollected
Connecticut Extended Producer Responsibility Program Evaluation: Summary and Recommendations 5 Report to CT DEEP by the Product Stewardship Institute – October 21, 2016
Convenience
In 2014, the collection infrastructure for mercury thermostats consisted of 121 wholesale,
retail, contractor, and municipal sites throughout the state. Wholesale collection sites were
most prevalent, comprising 70 percent of the collection infrastructure in the state.
Between 2013 and 2014, TRC added 51 new collection sites in Connecticut, including 39 new
wholesale sites and 12 new contractor sites.
Program Costs & Financial Benefits
TRC spent approximately $18,500 to manage Connecticut’s mercury thermostats in 2014.
Administration / reporting accounted for 47 percent of these costs, and transportation /
processing and outreach / education each comprised an additional 25 percent.
In 2014, the mercury thermostat stewardship program provided financial benefits worth
$9,258 to Connecticut municipalities and residents by providing for the responsible
management of spent mercury thermostats and conducting public outreach/education.
The program cost per thermostat increased each year from $4.64 in 2012 to $6.40 in 2014.
Job Creation
Nationally, TRC added one additional full-time employee in 2013 and three full-time
employees in 2014.
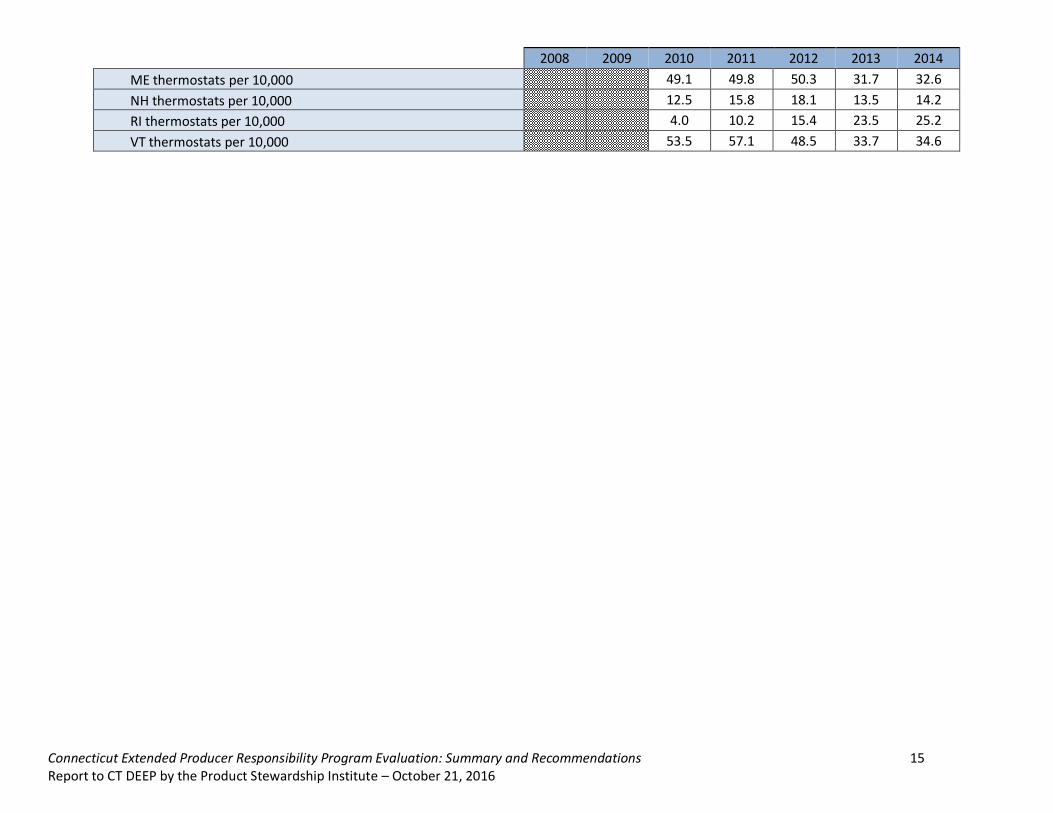
Cross-State Comparison
Nationally, in 2014, Connecticut ranked 9th among the 13 states with thermostat EPR programs.
On a per capita basis, Connecticut collected significantly fewer thermostats than Maine, New
Hampshire, Vermont, and Rhode Island from 2011 through 2014. All five of these states have
EPR laws for mercury thermostats; however only Maine and Vermont, the two highest
achieving states in the country, provide a $5 bounty for thermostat return.
-
5.0
10.0
15.0
20.0
25.0
30.0
35.0
2008 2009 2010 2011 2012 2013 2014 2015
Mercury Collected from Recovered Thermostats (lbs)
Connecticut Extended Producer Responsibility Program Evaluation: Summary and Recommendations 6 Report to CT DEEP by the Product Stewardship Institute – October 21, 2016
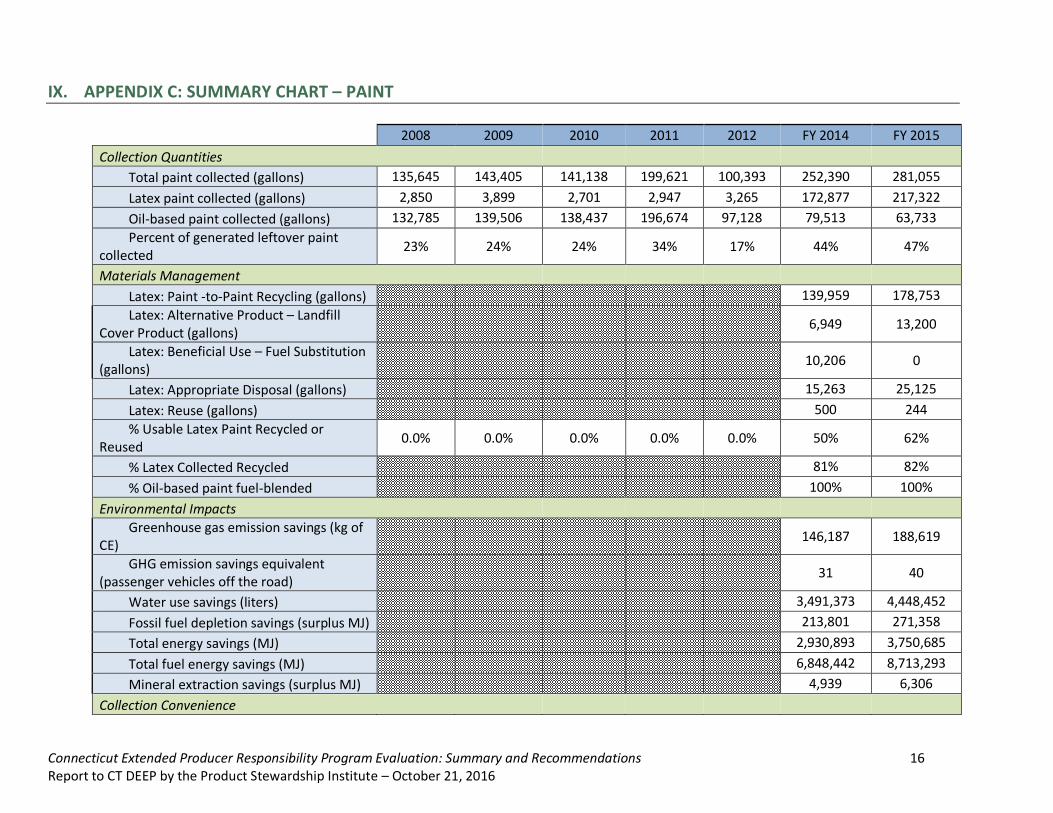
IV. PAINT
The following section summarizes PSI’s findings regarding the Connecticut paint stewardship program, which began in 2013. Collections
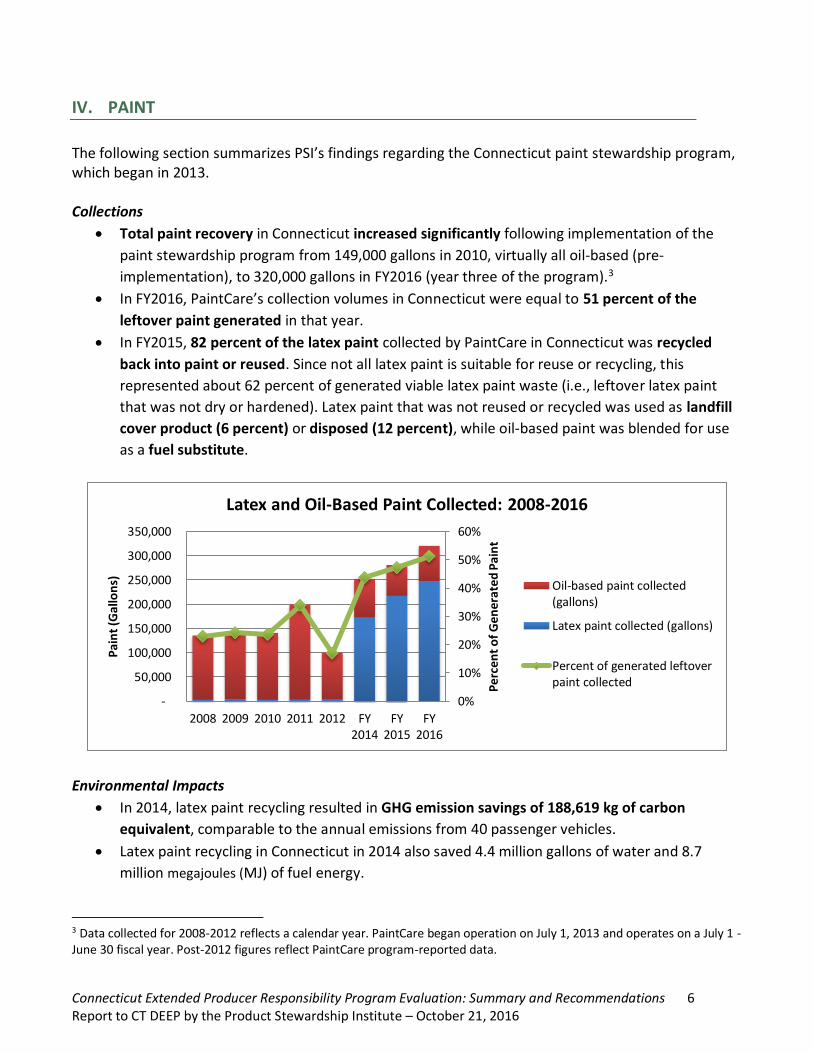
Total paint recovery in Connecticut increased significantly following implementation of the
paint stewardship program from 149,000 gallons in 2010, virtually all oil-based (pre-
implementation), to 320,000 gallons in FY2016 (year three of the program).3
In FY2016, PaintCare’s collection volumes in Connecticut were equal to 51 percent of the
leftover paint generated in that year.
In FY2015, 82 percent of the latex paint collected by PaintCare in Connecticut was recycled
back into paint or reused. Since not all latex paint is suitable for reuse or recycling, this
represented about 62 percent of generated viable latex paint waste (i.e., leftover latex paint
that was not dry or hardened). Latex paint that was not reused or recycled was used as landfill
cover product (6 percent) or disposed (12 percent), while oil-based paint was blended for use
as a fuel substitute.
Environmental Impacts
In 2014, latex paint recycling resulted in GHG emission savings of 188,619 kg of carbon
equivalent, comparable to the annual emissions from 40 passenger vehicles.
Latex paint recycling in Connecticut in 2014 also saved 4.4 million gallons of water and 8.7
million megajoules (MJ) of fuel energy.
3 Data collected for 2008-2012 reflects a calendar year. PaintCare began operation on July 1, 2013 and operates on a July 1 - June 30 fiscal year. Post-2012 figures reflect PaintCare program-reported data.
0%
10%
20%
30%
40%
50%
60%
-
50,000
100,000
150,000
200,000
250,000
300,000
350,000
2008 2009 2010 2011 2012 FY2014
FY2015
FY2016
Per
cen
t o
f G
ener
ate
d P
ain
t
Pai
nt
(Gal
lon
s)
Latex and Oil-Based Paint Collected: 2008-2016
Oil-based paint collected(gallons)
Latex paint collected (gallons)
Percent of generated leftoverpaint collected
Connecticut Extended Producer Responsibility Program Evaluation: Summary and Recommendations 7 Report to CT DEEP by the Product Stewardship Institute – October 21, 2016
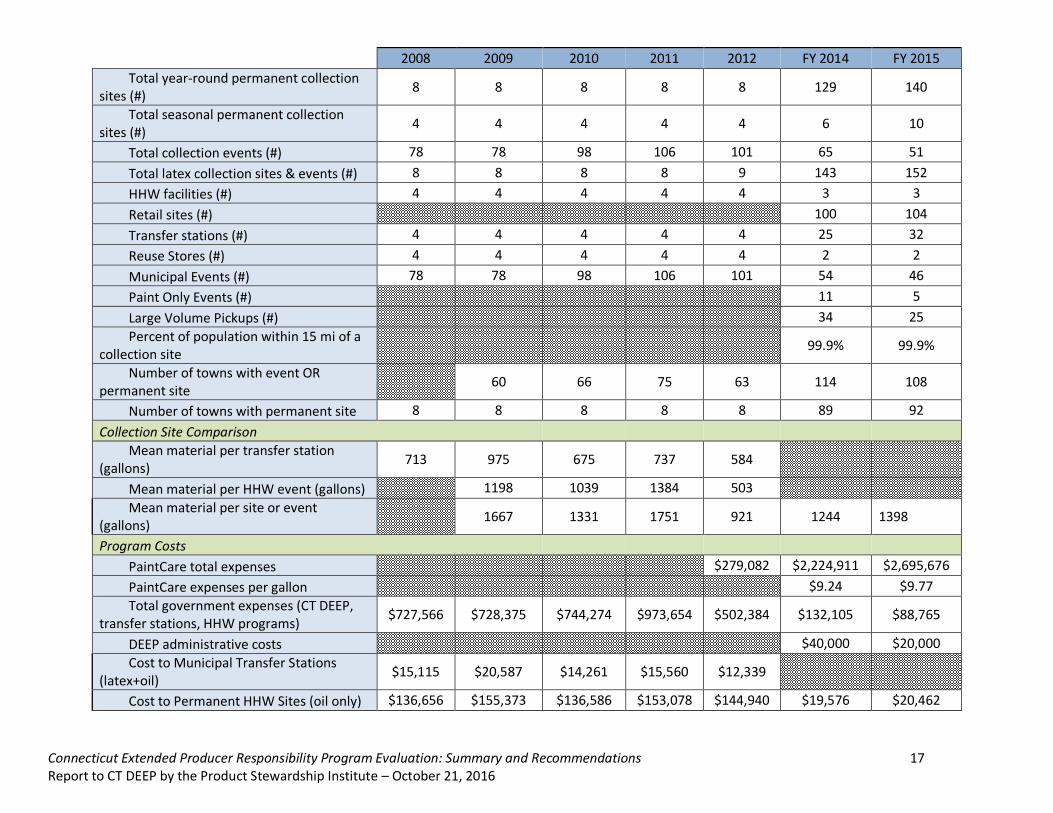
Convenience
The number of permanent collection sites for paint increased from 8 locations in 2011 (pre-
implementation) to 140 locations in FY2015 (year two of the program). The number of
collection events decreased in conjunction with the addition of permanent collection sites.
The number of towns with at least one collection site or event increased from 75 in 2011 (pre-
implementation) to 108 in FY2015 (year two of the program). In 2013 and 2014, 99.9 percent of
the Connecticut population lived within 15 miles of a PaintCare collection site.
Program Costs & Financial Benefits
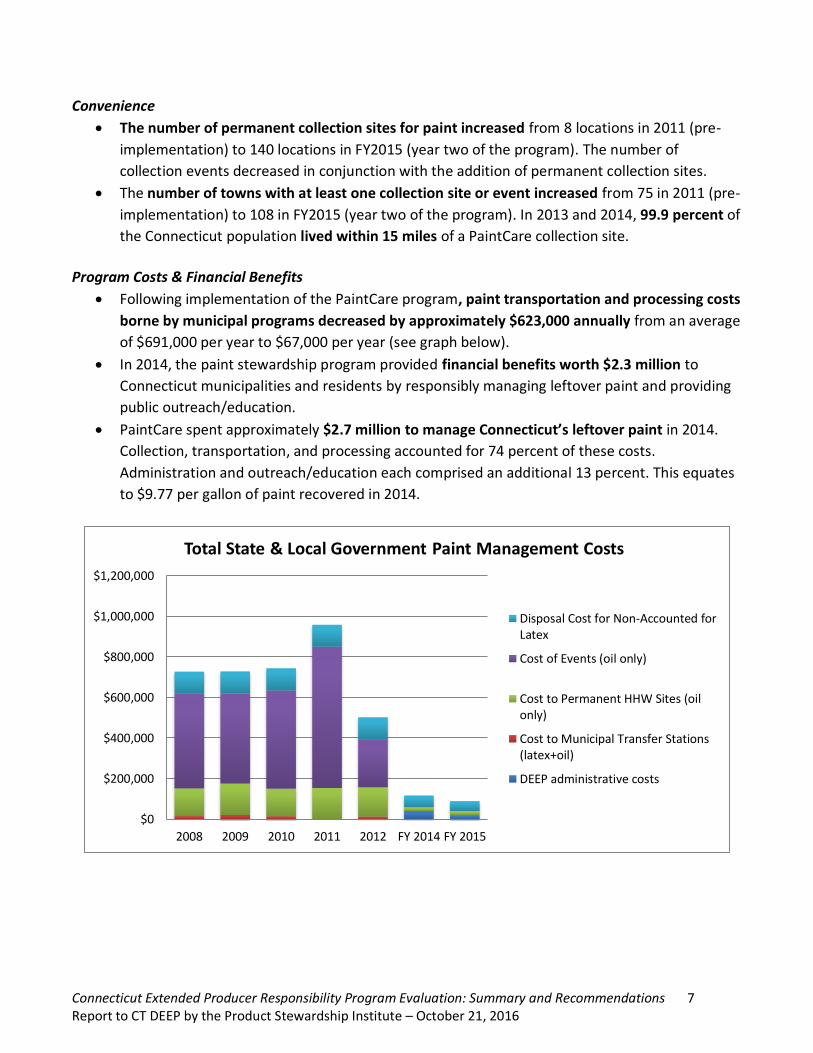
Following implementation of the PaintCare program, paint transportation and processing costs
borne by municipal programs decreased by approximately $623,000 annually from an average
of $691,000 per year to $67,000 per year (see graph below).
In 2014, the paint stewardship program provided financial benefits worth $2.3 million to
Connecticut municipalities and residents by responsibly managing leftover paint and providing
public outreach/education.
PaintCare spent approximately $2.7 million to manage Connecticut’s leftover paint in 2014.
Collection, transportation, and processing accounted for 74 percent of these costs.
Administration and outreach/education each comprised an additional 13 percent. This equates
to $9.77 per gallon of paint recovered in 2014.
$0
$200,000
$400,000
$600,000
$800,000
$1,000,000
$1,200,000
2008 2009 2010 2011 2012 FY 2014 FY 2015
Total State & Local Government Paint Management Costs
Disposal Cost for Non-Accounted forLatex
Cost of Events (oil only)
Cost to Permanent HHW Sites (oilonly)
Cost to Municipal Transfer Stations(latex+oil)
DEEP administrative costs
Connecticut Extended Producer Responsibility Program Evaluation: Summary and Recommendations 8 Report to CT DEEP by the Product Stewardship Institute – October 21, 2016
Job Creation
The paint stewardship program in Connecticut has resulted in the development of 21 recycling-
sector jobs. Processors project that an additional 18 jobs will be created by the end of 2015.
Two of these jobs are based in Connecticut.
Cross-State Comparison
On a per capita basis, Connecticut collected more paint than California and Rhode Island, and
less paint than Oregon and Vermont. The laws for all five states are very similar; therefore,
differences in recovery are likely to be related to pre-program collection infrastructure and
geographic influences.
V. MATTRESSES
The following section summarizes PSI’s findings regarding the Connecticut mattress stewardship
program, which began in 2015.
Collections
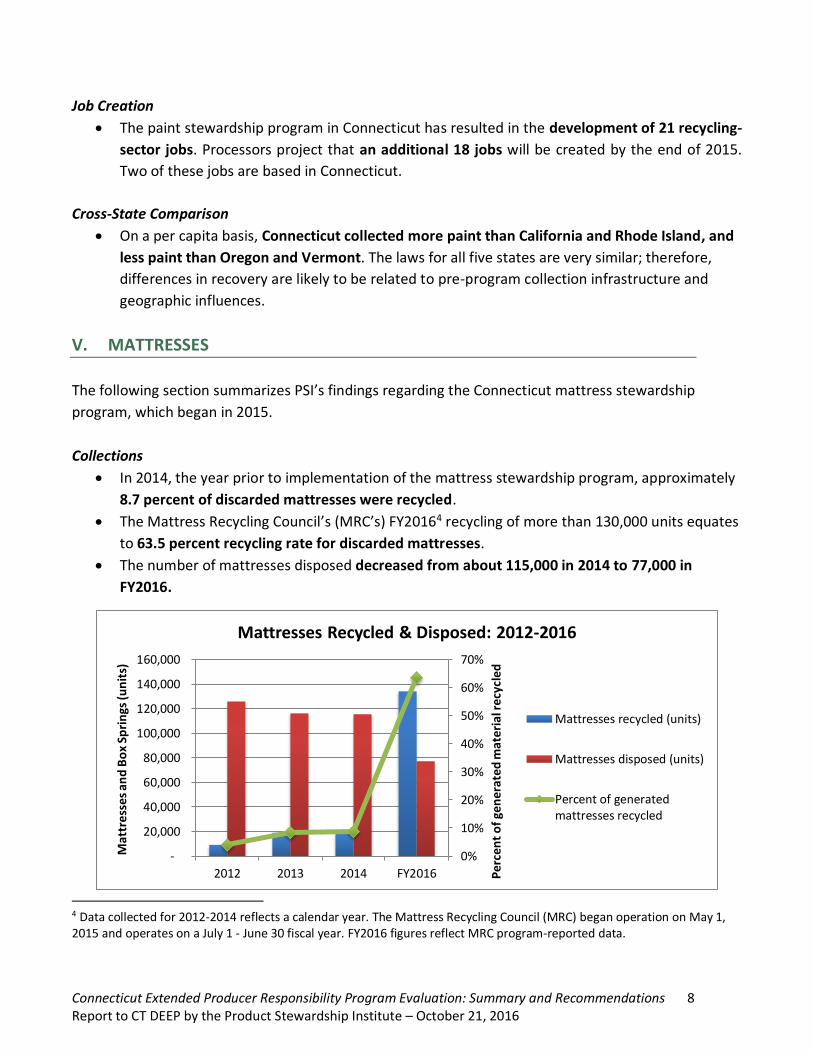
In 2014, the year prior to implementation of the mattress stewardship program, approximately
8.7 percent of discarded mattresses were recycled.
The Mattress Recycling Council’s (MRC’s) FY20164 recycling of more than 130,000 units equates
to 63.5 percent recycling rate for discarded mattresses.
The number of mattresses disposed decreased from about 115,000 in 2014 to 77,000 in
FY2016.
4 Data collected for 2012-2014 reflects a calendar year. The Mattress Recycling Council (MRC) began operation on May 1, 2015 and operates on a July 1 - June 30 fiscal year. FY2016 figures reflect MRC program-reported data.
0%
10%
20%
30%
40%
50%
60%
70%
-
20,000
40,000
60,000
80,000
100,000
120,000
140,000
160,000
2012 2013 2014 FY2016 Per
cen
t o
f ge
ner
ate
d m
ater
ial r
ecy
cled
Mat
tre
sse
s an
d B
ox
Spri
ngs
(un
its)
Mattresses Recycled & Disposed: 2012-2016
Mattresses recycled (units)
Mattresses disposed (units)
Percent of generatedmattresses recycled
Connecticut Extended Producer Responsibility Program Evaluation: Summary and Recommendations 9 Report to CT DEEP by the Product Stewardship Institute – October 21, 2016
Environmental Impacts
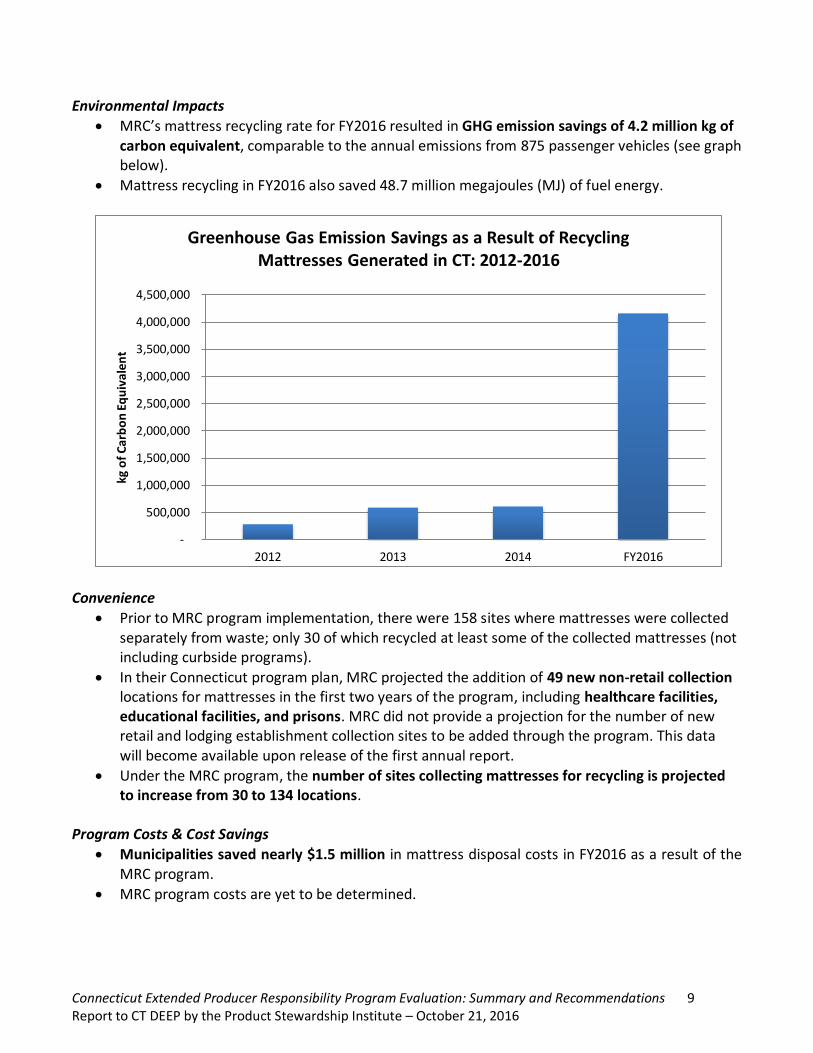
MRC’s mattress recycling rate for FY2016 resulted in GHG emission savings of 4.2 million kg of carbon equivalent, comparable to the annual emissions from 875 passenger vehicles (see graph below).
Mattress recycling in FY2016 also saved 48.7 million megajoules (MJ) of fuel energy.
Convenience
Prior to MRC program implementation, there were 158 sites where mattresses were collected separately from waste; only 30 of which recycled at least some of the collected mattresses (not including curbside programs).
In their Connecticut program plan, MRC projected the addition of 49 new non-retail collection locations for mattresses in the first two years of the program, including healthcare facilities, educational facilities, and prisons. MRC did not provide a projection for the number of new retail and lodging establishment collection sites to be added through the program. This data will become available upon release of the first annual report.
Under the MRC program, the number of sites collecting mattresses for recycling is projected to increase from 30 to 134 locations.
Program Costs & Cost Savings
Municipalities saved nearly $1.5 million in mattress disposal costs in FY2016 as a result of the MRC program.
MRC program costs are yet to be determined.
-
500,000
1,000,000
1,500,000
2,000,000
2,500,000
3,000,000
3,500,000
4,000,000
4,500,000
2012 2013 2014 FY2016
kg o
f C
arb
on
Eq
uiv
ale
nt
Greenhouse Gas Emission Savings as a Result of Recycling Mattresses Generated in CT: 2012-2016
Connecticut Extended Producer Responsibility Program Evaluation: Summary and Recommendations 10 Report to CT DEEP by the Product Stewardship Institute – October 21, 2016
VI. RECOMMENDATIONS
Based on the results of this multi-program evaluation, PSI recommends the following actions to
increase the effectiveness of stewardship programs in Connecticut:
Evaluate stewardship program reporting requirements to ensure that critical data are
obtained. For example, current CER reports do not require electronics recyclers to distinguish
between flat panel and CRT TVs and monitors. These data are critical to determining the
environmental and economic impacts of the stewardship program. Similarly, while TRC provides
a lengthy list of collection sites for the state on its website and in public education materials, it
does not highlight key convenience metrics, such as total number of collection sites in the state,
within the body of the report.
Encourage greater municipal reporting for all products. Municipal data on recovery rates and
recycling/disposal costs prior to implementation of product stewardship programs were limited
for all four product categories. Even when PSI reached out directly to municipalities, few were
able to supply the requested information. Encouraging or requiring annual reporting and
recordkeeping from municipalities on costs and collection volumes by product, including
products that do not yet have stewardship legislation, would provide a valuable source of
baseline information for assessing the impact of future product stewardship programs and
identifying opportunities to improve their performance. Using a simple, unified recordkeeping
and reporting format would help streamline the process of comparing and compiling municipal
data.
Require stewardship programs to conduct education and outreach. Under Connecticut’s
electronics stewardship law, manufacturers are not required to conduct any outreach or
education about electronics recycling. Unfortunately, this has translated into limited public
awareness: in ERCC’s 2014 survey, only 36 percent of residents knew for certain what to do
with their e-scrap, and 68 percent did not know whether it was legal or illegal to dispose of e-
scrap in the trash. Requiring product stewardship programs to conduct outreach to residents
can increase collection rates and, for many products, reduce the risk of illegal dumping.
Determine factors contributing to the high performance of EPR programs in other states.
Despite legislative similarities, Rhode Island and New Hampshire outperformed Connecticut in
per capita thermostat recovery, while Oregon and Vermont each collected a greater volume of
paint per capita. Evaluating successful elements of these higher-performing programs may
illuminate opportunities for Connecticut to improve its collection rates as its stewardship
programs mature.
Connecticut Extended Producer Responsibility Program Evaluation: Summary and Recommendations 11 Report to CT DEEP by the Product Stewardship Institute – October 21, 2016
Consider expanding entities covered by stewardship legislation. In the past several years, per
capita e-scrap recovery in Maine, Washington, and Vermont has surpassed recovery in
Connecticut. Legislation in these three states requires manufacturer programs to collect e-scrap
from schools, small businesses, and nonprofit organizations among “covered entities,” and
Washington State covers small governments as well. By contrast, Connecticut’s law only covers
e-scrap collected from households. Connecticut may consider adding schools, non-profits, and
small businesses to their electronics legislation in order to increase e-scrap recovery and
recycling. Effective EPR legislation for any product should take into account the wide range of
generators and consider opportunities to include them in the program.
Evaluate extent to which electronics recovery rates are lower in more mature programs due
to product lightweighting. It is possible that early in its implementation an electronics
stewardship program is more likely to collect older, heavier products due to stockpiling prior to
program implementation. Evaluating the total weight of products collected in various states in
comparison with the number of years since program implementation would help identify
whether this variable should be accounted for when determining program achievements.
Connecticut Extended Producer Responsibility Program Evaluation: Summary and Recommendations 12 Report to CT DEEP by the Product Stewardship Institute – October 21, 2016
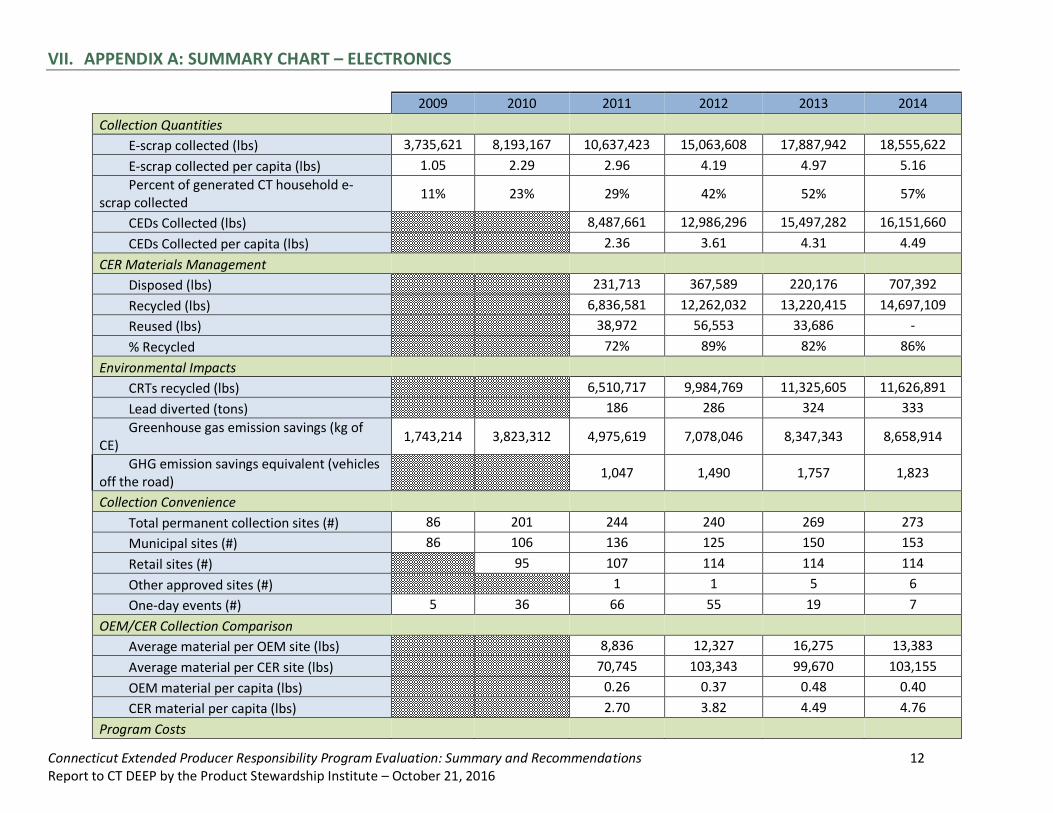
VII. APPENDIX A: SUMMARY CHART – ELECTRONICS
2009 2010 2011 2012 2013 2014
Collection Quantities
E-scrap collected (lbs) 3,735,621 8,193,167 10,637,423 15,063,608 17,887,942 18,555,622
E-scrap collected per capita (lbs) 1.05 2.29 2.96 4.19 4.97 5.16
Percent of generated CT household e-scrap collected
11% 23% 29% 42% 52% 57%
CEDs Collected (lbs)
8,487,661 12,986,296 15,497,282 16,151,660
CEDs Collected per capita (lbs)
2.36 3.61 4.31 4.49
CER Materials Management
Disposed (lbs)
231,713 367,589 220,176 707,392
Recycled (lbs)
6,836,581 12,262,032 13,220,415 14,697,109
Reused (lbs)
38,972 56,553 33,686 -
% Recycled
72% 89% 82% 86%
Environmental Impacts
CRTs recycled (lbs)
6,510,717 9,984,769 11,325,605 11,626,891
Lead diverted (tons)
186 286 324 333
Greenhouse gas emission savings (kg of CE)
1,743,214 3,823,312 4,975,619 7,078,046 8,347,343 8,658,914
GHG emission savings equivalent (vehicles off the road)
1,047 1,490 1,757 1,823
Collection Convenience
Total permanent collection sites (#) 86 201 244 240 269 273
Municipal sites (#) 86 106 136 125 150 153
Retail sites (#)
95 107 114 114 114
Other approved sites (#)
1 1 5 6
One-day events (#) 5 36 66 55 19 7
OEM/CER Collection Comparison
Average material per OEM site (lbs)
8,836 12,327 16,275 13,383
Average material per CER site (lbs)
70,745 103,343 99,670 103,155
OEM material per capita (lbs)
0.26 0.37 0.48 0.40
CER material per capita (lbs)
2.70 3.82 4.49 4.76
Program Costs
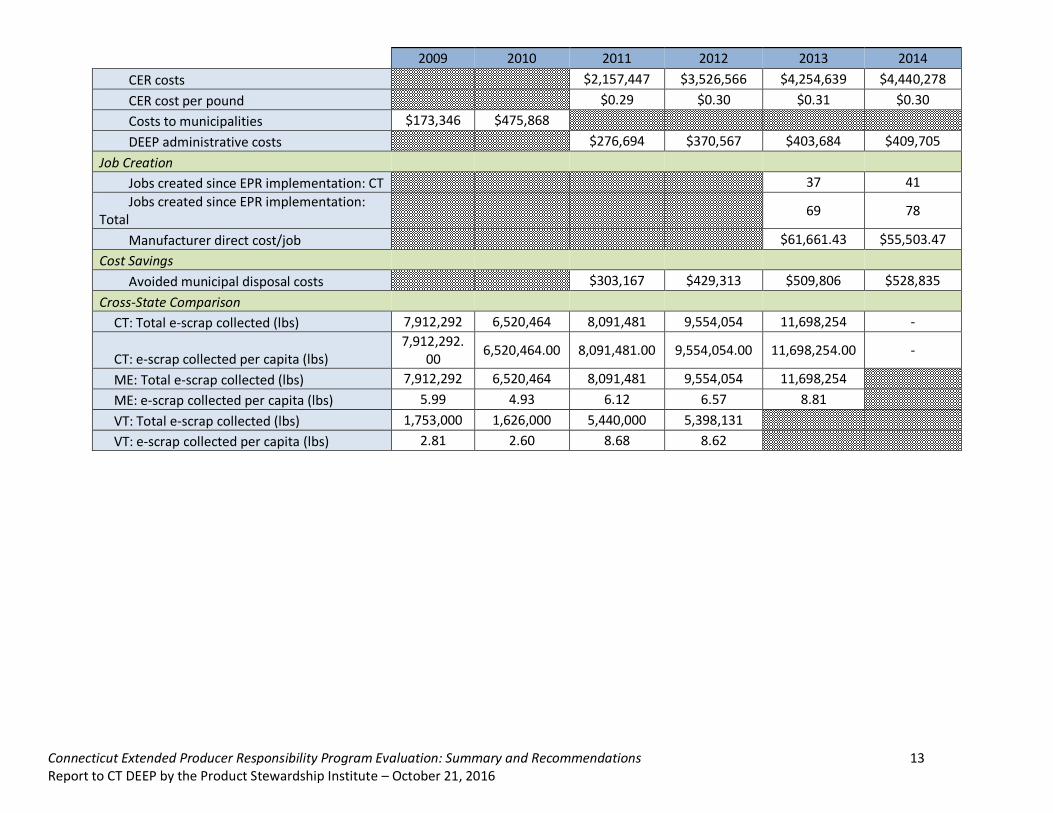
Connecticut Extended Producer Responsibility Program Evaluation: Summary and Recommendations 13 Report to CT DEEP by the Product Stewardship Institute – October 21, 2016
2009 2010 2011 2012 2013 2014
CER costs
$2,157,447 $3,526,566 $4,254,639 $4,440,278
CER cost per pound
$0.29 $0.30 $0.31 $0.30
Costs to municipalities $173,346 $475,868
DEEP administrative costs
$276,694 $370,567 $403,684 $409,705
Job Creation
Jobs created since EPR implementation: CT
37 41
Jobs created since EPR implementation: Total
69 78
Manufacturer direct cost/job
$61,661.43 $55,503.47
Cost Savings
Avoided municipal disposal costs
$303,167 $429,313 $509,806 $528,835
Cross-State Comparison
CT: Total e-scrap collected (lbs) 7,912,292 6,520,464 8,091,481 9,554,054 11,698,254 -
CT: e-scrap collected per capita (lbs) 7,912,292.
00 6,520,464.00 8,091,481.00 9,554,054.00 11,698,254.00 -
ME: Total e-scrap collected (lbs) 7,912,292 6,520,464 8,091,481 9,554,054 11,698,254
ME: e-scrap collected per capita (lbs) 5.99 4.93 6.12 6.57 8.81
VT: Total e-scrap collected (lbs) 1,753,000 1,626,000 5,440,000 5,398,131
VT: e-scrap collected per capita (lbs) 2.81 2.60 8.68 8.62
Connecticut Extended Producer Responsibility Program Evaluation: Summary and Recommendations 14 Report to CT DEEP by the Product Stewardship Institute – October 21, 2016
VIII. APPENDIX B: SUMMARY CHART – MERCURY THERMOSTATS
2008 2009 2010 2011 2012 2013 2014
Collection Quantities
Thermostat equivalents collected 1,852 2,123 1,933 1,551 1,835 1,603 2,886
Thermostats collected 1,838 2,109 1,918 1,538 1,831 1,600 2,485
Switches collected 19 20 21 18 5 5 27
Bins returned 19 20 21 18 19 18 45
Percent of generated thermostats collected 3.85% 4.58% 4.32% 3.59% 4.40% 3.98% 7.43%
Thermostats collected per 10,000 residents 5.22 5.96 5.40 4.32 5.10 4.45 8.02
Environmental Impact
Mercury collected (lbs) 17.8 22.4 16.2 14.2 15.4 15.85 23.99
Collection Convenience
Wholesale sites 48 87
Retailer sites 1 1
Contractor sites 13 25
HHW collection sites 8 8
Total sites 70 121
Program Costs
CT DEEP admin costs $5,000 $5,000 $5,000
TRC total expenses $8,493 $8,527 $18,463
TRC administration/reporting expenses $2,510 $3,704 $8,677
TRC transportation & recycling expenses $3,095 $2,615 $4,654
TRC outreach/education expenses $2,001 $1,799 $4,406
TRC legal expenses $611 $228 $528
TRC container expenses $254 $180 $198
TRC expenses per thermostat equivalent $ 4.64 $5.32 $6.40
Job Creation
Jobs created on account of EPR (in all states) 1 3
Cross-State Comparison
CT thermostats per 10,000 5.2 5.9 5.4 4.3 5.1 4.4 6.9
MA thermostats per 10,000 3.4 3.8 8.7 9.8 9.1
Connecticut Extended Producer Responsibility Program Evaluation: Summary and Recommendations 15 Report to CT DEEP by the Product Stewardship Institute – October 21, 2016
2008 2009 2010 2011 2012 2013 2014
ME thermostats per 10,000 49.1 49.8 50.3 31.7 32.6
NH thermostats per 10,000 12.5 15.8 18.1 13.5 14.2
RI thermostats per 10,000 4.0 10.2 15.4 23.5 25.2
VT thermostats per 10,000 53.5 57.1 48.5 33.7 34.6
Connecticut Extended Producer Responsibility Program Evaluation: Summary and Recommendations 16 Report to CT DEEP by the Product Stewardship Institute – October 21, 2016
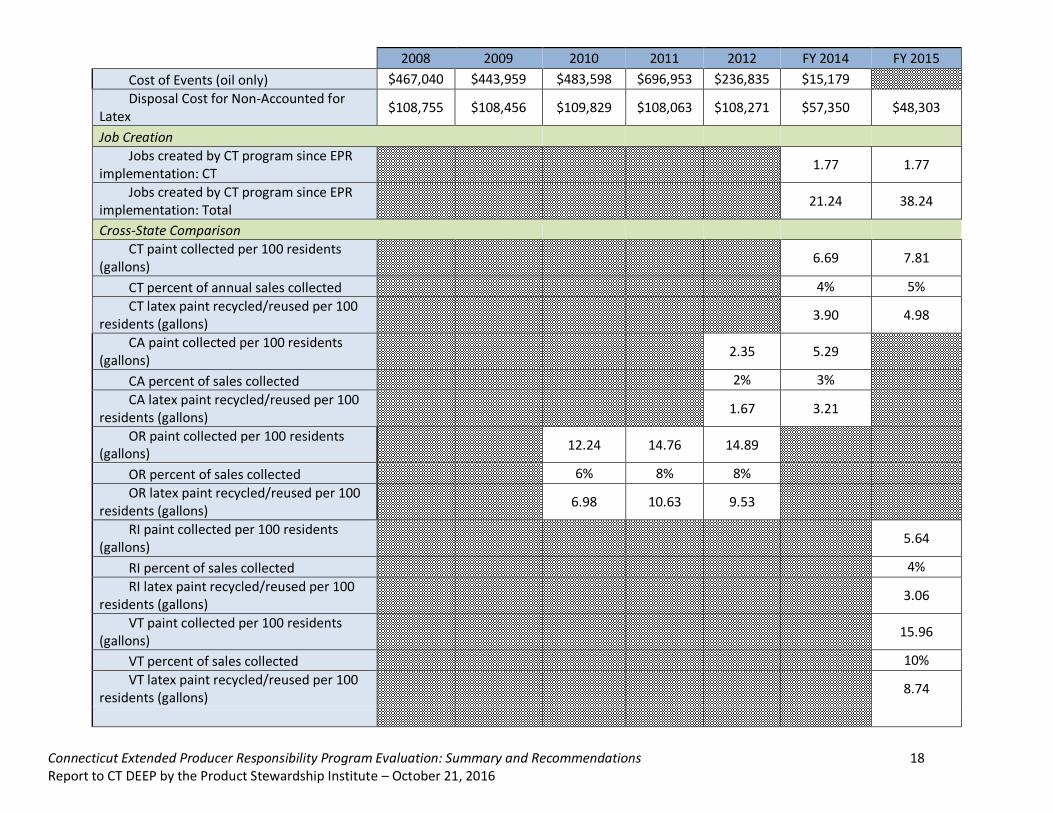
IX. APPENDIX C: SUMMARY CHART – PAINT
2008 2009 2010 2011 2012 FY 2014 FY 2015
Collection Quantities
Total paint collected (gallons) 135,645 143,405 141,138 199,621 100,393 252,390 281,055
Latex paint collected (gallons) 2,850 3,899 2,701 2,947 3,265 172,877 217,322
Oil-based paint collected (gallons) 132,785 139,506 138,437 196,674 97,128 79,513 63,733
Percent of generated leftover paint collected
23% 24% 24% 34% 17% 44% 47%
Materials Management
Latex: Paint -to-Paint Recycling (gallons) 139,959 178,753
Latex: Alternative Product – Landfill Cover Product (gallons)
6,949 13,200
Latex: Beneficial Use – Fuel Substitution (gallons)
10,206 0
Latex: Appropriate Disposal (gallons) 15,263 25,125
Latex: Reuse (gallons) 500 244
% Usable Latex Paint Recycled or Reused
0.0% 0.0% 0.0% 0.0% 0.0% 50% 62%
% Latex Collected Recycled 81% 82%
% Oil-based paint fuel-blended 100% 100%
Environmental Impacts
Greenhouse gas emission savings (kg of CE)
146,187 188,619
GHG emission savings equivalent (passenger vehicles off the road)
31 40
Water use savings (liters) 3,491,373 4,448,452
Fossil fuel depletion savings (surplus MJ) 213,801 271,358
Total energy savings (MJ) 2,930,893 3,750,685
Total fuel energy savings (MJ) 6,848,442 8,713,293
Mineral extraction savings (surplus MJ) 4,939 6,306
Collection Convenience
Connecticut Extended Producer Responsibility Program Evaluation: Summary and Recommendations 17 Report to CT DEEP by the Product Stewardship Institute – October 21, 2016
2008 2009 2010 2011 2012 FY 2014 FY 2015
Total year-round permanent collection sites (#)
8 8 8 8 8 129 140
Total seasonal permanent collection sites (#)
4 4 4 4 4 6 10
Total collection events (#) 78 78 98 106 101 65 51
Total latex collection sites & events (#) 8 8 8 8 9 143 152
HHW facilities (#) 4 4 4 4 4 3 3
Retail sites (#)
100 104
Transfer stations (#) 4 4 4 4 4 25 32
Reuse Stores (#) 4 4 4 4 4 2 2
Municipal Events (#) 78 78 98 106 101 54 46
Paint Only Events (#) 11 5
Large Volume Pickups (#) 34 25
Percent of population within 15 mi of a collection site
99.9% 99.9%
Number of towns with event OR permanent site
60 66 75 63 114 108
Number of towns with permanent site 8 8 8 8 8 89 92
Collection Site Comparison
Mean material per transfer station (gallons)
713 975 675 737 584
Mean material per HHW event (gallons)
1198 1039 1384 503
Mean material per site or event (gallons)
1667 1331 1751 921 1244 1398
Program Costs
PaintCare total expenses $279,082 $2,224,911 $2,695,676
PaintCare expenses per gallon $9.24 $9.77
Total government expenses (CT DEEP, transfer stations, HHW programs)
$727,566 $728,375 $744,274 $973,654 $502,384 $132,105 $88,765
DEEP administrative costs $40,000 $20,000
Cost to Municipal Transfer Stations (latex+oil)
$15,115 $20,587 $14,261 $15,560 $12,339
Cost to Permanent HHW Sites (oil only) $136,656 $155,373 $136,586 $153,078 $144,940 $19,576 $20,462
Connecticut Extended Producer Responsibility Program Evaluation: Summary and Recommendations 18 Report to CT DEEP by the Product Stewardship Institute – October 21, 2016
2008 2009 2010 2011 2012 FY 2014 FY 2015
Cost of Events (oil only) $467,040 $443,959 $483,598 $696,953 $236,835 $15,179
Disposal Cost for Non-Accounted for Latex
$108,755 $108,456 $109,829 $108,063 $108,271 $57,350 $48,303
Job Creation
Jobs created by CT program since EPR implementation: CT
1.77 1.77
Jobs created by CT program since EPR implementation: Total
21.24 38.24
Cross-State Comparison
CT paint collected per 100 residents (gallons)
6.69 7.81
CT percent of annual sales collected 4% 5%
CT latex paint recycled/reused per 100 residents (gallons)
3.90 4.98
CA paint collected per 100 residents (gallons)
2.35 5.29
CA percent of sales collected 2% 3%
CA latex paint recycled/reused per 100 residents (gallons)
1.67 3.21
OR paint collected per 100 residents (gallons)
12.24 14.76 14.89
OR percent of sales collected 6% 8% 8%
OR latex paint recycled/reused per 100 residents (gallons)
6.98 10.63 9.53
RI paint collected per 100 residents (gallons)
5.64
RI percent of sales collected 4%
RI latex paint recycled/reused per 100 residents (gallons)
3.06
VT paint collected per 100 residents (gallons)
15.96
VT percent of sales collected 10%
VT latex paint recycled/reused per 100 residents (gallons)
8.74
Connecticut Extended Producer Responsibility Program Evaluation: Summary and Recommendations 19 Report to CT DEEP by the Product Stewardship Institute – October 21, 2016
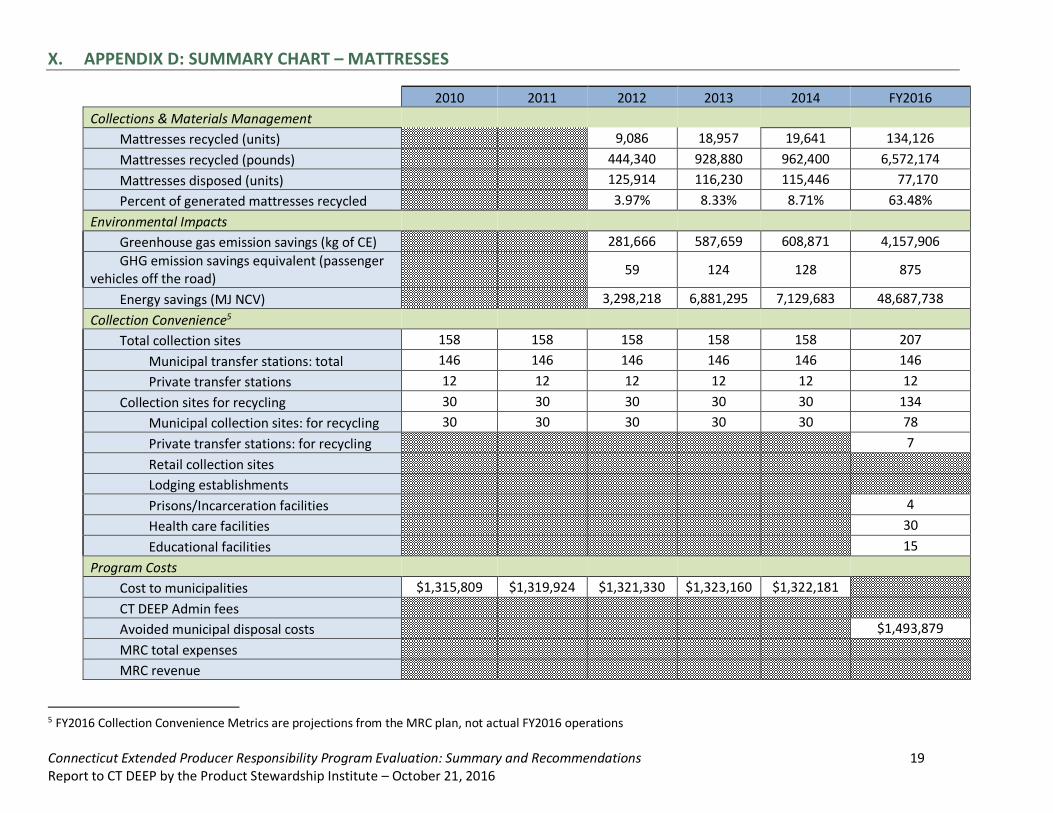
X. APPENDIX D: SUMMARY CHART – MATTRESSES
2010 2011 2012 2013 2014 FY2016
Collections & Materials Management
Mattresses recycled (units) 9,086 18,957 19,641 134,126
Mattresses recycled (pounds) 444,340 928,880 962,400 6,572,174
Mattresses disposed (units) 125,914 116,230 115,446 77,170
Percent of generated mattresses recycled 3.97% 8.33% 8.71% 63.48%
Environmental Impacts
Greenhouse gas emission savings (kg of CE) 281,666 587,659 608,871 4,157,906
GHG emission savings equivalent (passenger vehicles off the road)
59 124 128 875
Energy savings (MJ NCV) 3,298,218 6,881,295 7,129,683 48,687,738
Collection Convenience5 Total collection sites 158 158 158 158 158 207
Municipal transfer stations: total 146 146 146 146 146 146
Private transfer stations 12 12 12 12 12 12
Collection sites for recycling 30 30 30 30 30 134
Municipal collection sites: for recycling 30 30 30 30 30 78
Private transfer stations: for recycling 7
Retail collection sites
Lodging establishments
Prisons/Incarceration facilities 4
Health care facilities 30
Educational facilities 15
Program Costs
Cost to municipalities $1,315,809 $1,319,924 $1,321,330 $1,323,160 $1,322,181
CT DEEP Admin fees
Avoided municipal disposal costs $1,493,879
MRC total expenses
MRC revenue
5 FY2016 Collection Convenience Metrics are projections from the MRC plan, not actual FY2016 operations