conducting school surveys on drug abuse - united … toolkit module 3 englis… · the content of...
TRANSCRIPT
Conducting School
Surveys on
Drug Abuse
Global Assessment Programmeon Drug Abuse (GAP)
Toolkit Module 3
Conducting SchoolSurveys onDrug Abuse

UNITED NATIONS OFFICE ON DRUGS AND CRIME
Vienna
Conducting SchoolSurveys on Drug Abuse
Global Assessment Programme on Drug Abuse
Toolkit Module 3
UNITED NATIONSNew York, 2003
The content of GAP Toolkit Module 3: Conducting School Surveys on Drug Abuse was pro-
duced by the United Nations Office on Drugs and Crime as part of the activities con-
ducted under the Global Assessment Programme on Drug Abuse (GAP). Other GAP
activities include providing technical and financial support for the establishment of drug
information systems and supporting and coordinating global data collection activities.
For further information, visit the GAP web site at www.unodc.org, e-mail [email protected],
or contact the Demand Reduction Section, UNODC, P.O. Box 500, A-1400 Vienna, Austria.
United Nations Office on Drugs and Crime
Printed in Austria, 2003
UNITED NATIONS PUBLICATIONSales No. E.03.XI.18ISBN 92-1-148171-6
Preface
The Global Assessment Programme on Drug Abuse Toolkit Module 3: Conducting
School Surveys on Drug Abuse, has been prepared with the support of the United
Nations Office on Drugs and Crime under the Global Assessment Programme on
Drug Abuse (GAP). The main objective of GAP is to assist countries in collecting
reliable and internationally comparable drug abuse data, in building capacity at the
local level to collect data that can guide demand reduction activities and in improv-
ing cross-national, regional and global reporting on drug trends. To support that
process, the GAP Toolkit Module 3 has been produced to assist States Members of
the United Nations to develop culturally appropriate systems, relevant to the coun-
tries concerned, for collecting drug information, to support existing drug informa-
tion systems by promoting their conformity with internationally recognized standards
of good practice and to focus on the harmonization of drug abuse indicators.
GAP Toolkit Module 3 forms one component of a compendium of methodological
guides on drug abuse epidemiology that have been developed to support data col-
lection activities. Other modules provide support in the following areas: developing
an integrated drug information system, prevalence estimation, data interpretation
and management for policy formation, basic data analysis, qualitative research and
focused assessments, and ethical guidelines.
The purpose of the Toolkit is to provide a practical and accessible guide to imple-
menting data collection in core areas of drug epidemiology. The Toolkit modules are
designed to provide a starting point for the development of specific activities, refer-
ring the reader to detailed information sources on specific issues, rather than being
end resources themselves. They are based on principles of data collection that have
been agreed upon by an international panel of experts and endorsed by States
Members of the United Nations. Although the models are based on existing work-
ing models that have been found effective, a key principle is that approaches have
to be adapted to meet local needs and conditions.
iii
Acknowledgements
GAP Toolkit Module 3: Conducting School Surveys on Drug Abuse was produced with
the support of the United Nations Office on Drugs and Crime under the Global
Assessment Programme on Drug Abuse (GAP). The Office would like to thank the
distinguished members of the Expert Group whose articles comprise this publica-
tion. The Group included skilled researchers with wide experience of conducting
school surveys at an international as well as a national level in different parts of
the world. The members met to discuss the draft content, the areas to be covered
and the structure of Toolkit Module 3. The various chapters were written by mem-
bers of the Group and subsequently circulated to other members of the Group, who
provided valuable comments. Particular thanks are due to Björn Hibell, who con-
tributed articles as well as editing the publication. Toolkit Module 3 was compiled
by Riku Lehtovuori (GAP drug abuse epidemiologist at the United Nations Office
on Drugs and Crime) and Paul Griffiths (programme coordinator at the European
Monitoring Centre for Drugs and Drug Addiction since October 2002).
The Expert Group comprised the following members:
Björn Hibell (Editor), Swedish Council for Information on Alcohol and Other Drugs;
Edward M. Adlaf, Centre for Addiction and Mental Health, Canada;
Barbro Andersson, Swedish Council for Information on Alcohol and Other Drugs;
Thoroddur Bjarnason, Department of Sociology, University at Albany, State
University of New York, United States of America;
Catherine Delapenha, National Drug Council, Cayman Islands;
Julia Hasbun, Consejo Nacional de Drogas, Dominican Republic;
Lloyd D. Johnston, Institute for Social Research, University of Michigan, United
States;
Ramanathan Sathianathan, Madras, India.
The Office would like to express its gratitude to all those institutions and expert
networks which kindly provided examples of methods, tools and related material
and assistance for the compiling of Toolkit Module 3. In particular, thanks are due
to the Caribbean Drug Information Network (CARIDIN); the European School Survey
Project on Alcohol and Other Drugs (ESPAD); the Monitoring the Future study of
the University of Michigan, United States; the Ontario Student Drug Use Survey,
Centre for Addiction and Mental Health, Canada; The PACARDO (Panama, Central
America and República Dominica) study of the Inter-American Uniform Drug Use
Data System under the Inter-American Drug Abuse Control Commission of the
Organization of American States; the Pompidou Group of the Council of Europe;
and the Swedish Council for Information on Alcohol and Other Drugs.
The Office would like to acknowledge the support of the Governments of Austria,
Germany, Italy, the Netherlands and Sweden, whose financial contributions made
the publication of Toolkit Module 3 possible.
v
Contents
Preface . . . . . . . . . . . . . . . . . . . . . . . . . . . . . . . . . . . . . . . . . . . . . . . . . . . . . . . . . . . . . . iii
Acknowledgements . . . . . . . . . . . . . . . . . . . . . . . . . . . . . . . . . . . . . . . . . . . . . . . . . . . . v
INTRODUCTION . . . . . . . . . . . . . . . . . . . . . . . . . . . . . . . . . . . . . . . . . . . . . . . . . . . . . . . 1
Background . . . . . . . . . . . . . . . . . . . . . . . . . . . . . . . . . . . . . . . . . . . . . . . . . . . . . . 1
Structure of Toolkit Module 3 . . . . . . . . . . . . . . . . . . . . . . . . . . . . . . . . . . . . . . 2
I. THE USE OF SCHOOL SURVEYS . . . . . . . . . . . . . . . . . . . . . . . . . . . . . . . . . . . . . 5
Barbro Andersson
II. EXAMPLES OF ONGOING LARGE-SCALE SCHOOL SURVEYS . . . . . . . . . . . . . . 9
The European School Survey Project on Alcohol and Other Drugs . . . . . . . 9
Björn Hibell and Barbro AnderssonThe Monitoring the Future study . . . . . . . . . . . . . . . . . . . . . . . . . . . . . . . . . . . 13
Lloyd D. JohnstonSchool Surveys in the Inter-American System of Uniform Drug-Use Data 17
Julia HasbunReferences . . . . . . . . . . . . . . . . . . . . . . . . . . . . . . . . . . . . . . . . . . . . . . . . . . . . . . . 19
III. PLANNING, ADMINISTRATION AND COSTS . . . . . . . . . . . . . . . . . . . . . . . . . . . 21
Lloyd D. JohnstonPersonnel . . . . . . . . . . . . . . . . . . . . . . . . . . . . . . . . . . . . . . . . . . . . . . . . . . . . . . . . 22
Budgeting . . . . . . . . . . . . . . . . . . . . . . . . . . . . . . . . . . . . . . . . . . . . . . . . . . . . . . . 25
Scheduling . . . . . . . . . . . . . . . . . . . . . . . . . . . . . . . . . . . . . . . . . . . . . . . . . . . . . . 26
Ethical considerations . . . . . . . . . . . . . . . . . . . . . . . . . . . . . . . . . . . . . . . . . . . . . 28
References . . . . . . . . . . . . . . . . . . . . . . . . . . . . . . . . . . . . . . . . . . . . . . . . . . . . . . . 29
IV. OVERVIEW OF METHODOLOGICAL ISSUES . . . . . . . . . . . . . . . . . . . . . . . . . . . . 31
Björn HibellRepresentativeness . . . . . . . . . . . . . . . . . . . . . . . . . . . . . . . . . . . . . . . . . . . . . . . . 31
Reliability . . . . . . . . . . . . . . . . . . . . . . . . . . . . . . . . . . . . . . . . . . . . . . . . . . . . . . . 34
Validity . . . . . . . . . . . . . . . . . . . . . . . . . . . . . . . . . . . . . . . . . . . . . . . . . . . . . . . . . 35
Checklist for survey methodology . . . . . . . . . . . . . . . . . . . . . . . . . . . . . . . . . . . 39
References . . . . . . . . . . . . . . . . . . . . . . . . . . . . . . . . . . . . . . . . . . . . . . . . . . . . . . . 39
V. SAMPLING ISSUES IN SCHOOL SURVEYS OF ADOLESCENT SUBSTANCE USE 41
Thoroddur BjarnasonTarget population . . . . . . . . . . . . . . . . . . . . . . . . . . . . . . . . . . . . . . . . . . . . . . . . 42
Sampling frame . . . . . . . . . . . . . . . . . . . . . . . . . . . . . . . . . . . . . . . . . . . . . . . . . . 44
Sample size . . . . . . . . . . . . . . . . . . . . . . . . . . . . . . . . . . . . . . . . . . . . . . . . . . . . . . 45
Sampling method . . . . . . . . . . . . . . . . . . . . . . . . . . . . . . . . . . . . . . . . . . . . . . . . . 46
Checklist for sampling . . . . . . . . . . . . . . . . . . . . . . . . . . . . . . . . . . . . . . . . . . . . 49
Further reading . . . . . . . . . . . . . . . . . . . . . . . . . . . . . . . . . . . . . . . . . . . . . . . . . . 51
vii
VI. QUESTIONNAIRE DEVELOPMENT . . . . . . . . . . . . . . . . . . . . . . . . . . . . . . . . . . . . 53
Lloyd D. JohnstonPriorities given to questions . . . . . . . . . . . . . . . . . . . . . . . . . . . . . . . . . . . . . . . 53
Elements in the questionnaire . . . . . . . . . . . . . . . . . . . . . . . . . . . . . . . . . . . . . . 54
Selecting drugs to include . . . . . . . . . . . . . . . . . . . . . . . . . . . . . . . . . . . . . . . . . 55
Defining drugs for the respondents . . . . . . . . . . . . . . . . . . . . . . . . . . . . . . . . . 56
Format of the drug use questions . . . . . . . . . . . . . . . . . . . . . . . . . . . . . . . . . . 56
Use of "skip" questions . . . . . . . . . . . . . . . . . . . . . . . . . . . . . . . . . . . . . . . . . . . . 58
Other references . . . . . . . . . . . . . . . . . . . . . . . . . . . . . . . . . . . . . . . . . . . . . . . . . 58
Pre-testing the questionnaire . . . . . . . . . . . . . . . . . . . . . . . . . . . . . . . . . . . . . . 58
Pilot testing the questionnaire . . . . . . . . . . . . . . . . . . . . . . . . . . . . . . . . . . . . . 59
Finalizing and printing the questionnaire . . . . . . . . . . . . . . . . . . . . . . . . . . . . 60
References . . . . . . . . . . . . . . . . . . . . . . . . . . . . . . . . . . . . . . . . . . . . . . . . . . . . . . . 60
VII. DATA COLLECTION PROCEDURE . . . . . . . . . . . . . . . . . . . . . . . . . . . . . . . . . . . . . 63
Björn HibellGeneral remarks . . . . . . . . . . . . . . . . . . . . . . . . . . . . . . . . . . . . . . . . . . . . . . . . . . 63
Timing of the data collection . . . . . . . . . . . . . . . . . . . . . . . . . . . . . . . . . . . . . . 64
Survey leader . . . . . . . . . . . . . . . . . . . . . . . . . . . . . . . . . . . . . . . . . . . . . . . . . . . . 64
Students not belonging to the target population . . . . . . . . . . . . . . . . . . . . . 65
Absent students . . . . . . . . . . . . . . . . . . . . . . . . . . . . . . . . . . . . . . . . . . . . . . . . . . 66
Contact with selected schools . . . . . . . . . . . . . . . . . . . . . . . . . . . . . . . . . . . . . . 66
Informing the teachers . . . . . . . . . . . . . . . . . . . . . . . . . . . . . . . . . . . . . . . . . . . . 67
Parental permission . . . . . . . . . . . . . . . . . . . . . . . . . . . . . . . . . . . . . . . . . . . . . . . 67
Transportation of material . . . . . . . . . . . . . . . . . . . . . . . . . . . . . . . . . . . . . . . . . 68
Survey administration . . . . . . . . . . . . . . . . . . . . . . . . . . . . . . . . . . . . . . . . . . . . . 68
Checklist for data collection . . . . . . . . . . . . . . . . . . . . . . . . . . . . . . . . . . . . . . . 70
Reference . . . . . . . . . . . . . . . . . . . . . . . . . . . . . . . . . . . . . . . . . . . . . . . . . . . . . . . 70
VIII. PREPARING, ANALYSING AND REPORTING THE DATA . . . . . . . . . . . . . . . . . . 71
Edward M. AdlafPreparing the data . . . . . . . . . . . . . . . . . . . . . . . . . . . . . . . . . . . . . . . . . . . . . . . 71
Analysing the data . . . . . . . . . . . . . . . . . . . . . . . . . . . . . . . . . . . . . . . . . . . . . . . 71
Reporting the data . . . . . . . . . . . . . . . . . . . . . . . . . . . . . . . . . . . . . . . . . . . . . . . 78
Other points to consider . . . . . . . . . . . . . . . . . . . . . . . . . . . . . . . . . . . . . . . . . . 78
Checklist for preparing, analysing and reporting the data . . . . . . . . . . . . . . 79
Further reading . . . . . . . . . . . . . . . . . . . . . . . . . . . . . . . . . . . . . . . . . . . . . . . . . . 80
ANNEXES
I. Model student questionnaire . . . . . . . . . . . . . . . . . . . . . . . . . . . . . . . . . . . . . . . 81
II. Classroom report . . . . . . . . . . . . . . . . . . . . . . . . . . . . . . . . . . . . . . . . . . . . . . . . . 91
III. Instructions for survey leaders . . . . . . . . . . . . . . . . . . . . . . . . . . . . . . . . . . . . . 93
TableBudget outline . . . . . . . . . . . . . . . . . . . . . . . . . . . . . . . . . . . . . . . . . . . . . . . . . . . 25
FigureFlow chart of activities for the conduct of a school survey . . . . . . . . . . . . 26
viii
1
Introduction
Background
In 1998, the General Assembly of the United Nations, at its twenti-
eth special session, devoted to countering the world drug problem
together, adopted a Political Declaration (resolution S-20/2, annex)
calling for the elimination or significant reduction of the supply of
and demand for illicit drugs by the year 2008. That was the first time
that the international community had agreed on such specific drug
control objectives. However, the systematic data needed to monitor
and evaluate progress towards those goals are not yet available. For
that reason, the General Assembly requested the United Nations
Office on Drugs and Crime to provide Member States with the assis-
tance needed to compile comparable data. The Office was asked to
collect and analyse the data and to report thereon to the Commission
on Narcotic Drugs. In response to those requests, the United Nations
Office on Drugs and Crime launched the Global Assessment
Programme on Drug Abuse (GAP). GAP has been designed:
(a) To support Member States in building the systems needed to
collect reliable data to inform policy and action;
(b) To encourage regional partnerships for the sharing of experiences
and technical developments; and
(c) To facilitate a better understanding of global patterns and trends
in drug abuse by encouraging the adoption of sound methods of
collecting comparable data.
Those aims reflect the challenge posed in the Declaration on the
Guiding Principles of Drug Demand Reduction adopted by the General
Assembly at its twentieth special session (resolution S-20/3, annex),
which states the following:
"Demand reduction programmes should be based on a regular
assessment of the nature and magnitude of drug use and drug-
related problems in the population … Assessments should be
undertaken in a comprehensive, systematic and periodic manner,
drawing on results of relevant studies, allowing for geographical
considerations and using similar definitions, indicators and pro-
cedures to assess the drug situation."
The main objective of GAP is to assist Member States in building the capacity to col-
lect internationally comparable drug abuse data and to assess the magnitude and pat-
terns of drug abuse at country, regional and global levels. The development of national
and regional information systems should not only contribute to the building of capac-
ity at the local level to collect data that can guide demand reduction activities, but
also improve cross-national, regional and global reporting on drug trends.
Estimates of drug abuse among the youth population form an integral part of all
drug information systems. Data collected through school surveys play an important
role as an indicator of youth population exposure for the purposes of international
comparisons and trend analysis. GAP Toolkit Module 3: Conducting School Surveys
on Drug Abuse reflects the considerable progress that has been made through the
development and implementation of comprehensive, long-term school surveys using
standardized methodology. However, the majority of countries, in particular those in
the developing regions, lack the expertise and resources necessary to monitor trends
in drug abuse among student populations in order to support policy-relevant and
efficient drug demand reduction responses. The United Nations Office on Drugs and
Crime has produced the present Toolkit Module 3 as a practical planning guide to
assist States Members of the United Nations in collecting drug abuse data in school
settings.
Structure of Toolkit Module 3
Chapter I: General issues relating to different survey methods are addressed.
In particular, rationales for conducting school surveys are explored
through a discussion of the advantages and disadvantages of this
type of epidemiological survey.
Chapter II: An overview is provided of three large-scale school surveys, togeth-
er with their background, purpose, research design and practical
examples of sampling, data collection and reporting.
Chapter III: The overall process of conducting a school survey, from budgeting
and selecting survey personnel to reporting, is discussed. Streams of
several simultaneous study activities are outlined and ethical con-
siderations involved in the selected methods are addressed.
Chapter IV: Key methodological issues, in particular those related to the repre-
sentativeness of the sample and the reliability and validity of the
measures taken, are summarized and means of improving these cru-
cial preconditions for data analysis to produce comparable and
meaningful information are described.
Chapter V: Sampling is discussed in chapter V. The target population is defined,
taking into account relevant differences between national school sys-
tems. The connections between the soundness of the sampling
frame, the definition of the sample size and the choice of a suitable
sampling method are illustrated and a selection of additional refer-
ence material is provided.
2
GAP Toolkit Module 3 Conducting School Surveys on Drug Abuse
Chapter VI: Questionnaire development is described, using elements of the
model student questionnaire provided in annex I as points of ref-
erence. Testing procedures for refinement of the final questionnaire
are summarized.
Chapter VII: The data collection procedure is detailed, focusing on the timing of
data collection, the handling of absentees, the selection of survey
leaders, contact with schools and parents and survey administration
in schools.
Chapter VIII: An overview of the main preliminary tasks and activities to prepare
data for analysis and reporting is provided. The instructions, includ-
ing visual scanning of questionnaires and creating a data codebook,
are illustrated by practical examples and followed by a description
of the final procedures, such as screening for missing values, skewed
distributions and logical consistency in reporting before data are
analysed and reported. Potential problems that a researcher may
encounter in the final stages of school survey implementation are
described.
3
Introduction


The use of school surveysBarbro Andersson
Chapter I
5
The prevalence rates of alcohol, tobacco and other drug use are mat-
ters of concern to policymakers in most countries, since they are
important factors affecting the health and welfare of the population.
Information on alcohol and drug use prevalence rates is usually gath-
ered through epidemiological surveys. Such surveys of the general pop-
ulation are carried out in many countries and often include questions
on alcohol and other drugs.
There are several methods that can be used to survey populations
such as face-to-face or telephone interviews and self-administered
questionnaires. In addition to the traditional methods, new tech-
nologies have made available computer-assisted interviewing, which
replaces paper and pencil forms with electronic forms accessed via
personal computer or a computer terminal. However, these technolo-
gies are, as yet, expensive and not commonly available.
In recent years, researchers have experimented with the use of the
Internet for surveys. However, this methodology has several serious
shortcomings that have not yet been adequately overcome, including
variations in levels of ownership of personal computers, of access to
the Internet and of frequency of Internet use. It has also proven dif-
ficult to establish a reliable sampling frame for Internet surveys, lead-
ing to doubts as to the representativeness of the results.
When household surveys are performed, a wide segment of the pop-
ulation is targeted, usually those between 16 and 75 years old. The
topics covered are not only alcohol and drug use, but also health
behaviour in general. As the youngest respondents comprise only a
small part of the target population, the resulting samples usually con-
tain too few young people for analysis to be meaningful.
For collecting data on alcohol, tobacco and drug use prevalence among
young populations, the most efficient and frequently used method is
to conduct school surveys; the advantage of school surveys is that
they are cost-effective and relatively easy to conduct. Appropriate
schools and classes are usually easily selected and students are avail-
able in the classroom during the school day. Instead of contacting
randomly selected individuals, it is possible to reach a large number of students in
one session. Additionally, in many countries young people feel more comfortable
admitting to illegal or socially disapproved behaviours such as drug use in the school
rather than the home setting. There is evidence from several studies that youth are
less likely to disclose drug use at home than at school, whether in a household face-
to-face interview or over the telephone. Students appear to consider the data col-
lection situation in school more confidential than answering a questionnaire or being
interviewed at home, where, perhaps the parents are present or in the next room.
The mode of data collection is relatively easy to standardize and control in school sur-
veys. If the students trust the school staff, which in many countries they do, teachers
or other members of staff, such as the school nurses, can administer the question-
naires to the students and return them to the research institute (see chapter VII).
Another rationale for using school surveys to study alcohol and drug use is that stu-
dents represent age groups in which the onset of different substance use is likely
to occur. It is considered important to monitor the prevalence rates of such use over
time.
The response rate in school surveys is usually high. In fact, the response rate in
most studies is equal to the number of students present in class on the day of data
collection; refusals are uncommon in most surveys. It is therefore not uncommon
for school surveys to have a response rate of over 90 per cent, while other forms of
epidemiological survey often have a response rate of 70 per cent or less.
There are, of course, some disadvantages associated with school surveys. One of the
most obvious has to do with the target population. A school survey is, by defini-
tion, a study of young people enrolled in the educational system of a particular coun-
try. Countries differ in terms of the age span for which school is compulsory, but
it usually ends at around 15-16 years of age.
The proportion of an age cohort outside the compulsory school system may there-
fore differ substantially between countries. There is also reason to suspect that
dropouts from school engage in alcohol and drug use to a greater extent than those
inside the school system.
There are also substantial differences among countries as to the extent to which
young people continue their education after completing compulsory school. Groups
outside the secondary school system can be expected to differ from students, not
only in terms of prevalence rates of alcohol and drug use, but also in terms of social
and economic status.
Thus, the youth that are not reached are those not attending school and those absent
on the day of data collection. In both groups, a higher proportion of individuals tak-
ing drugs or drinking a lot of alcohol is likely to be found. However, these people
are equally likely to be among those missing from household surveys.
6
GAP Toolkit Module 3 Conducting School Surveys on Drug Abuse
7
Chapter I The use of school surveys
When a series of surveys is planned (for example, annually) the response rate for
each survey is of particular interest. However, in countries with an ongoing series
of school surveys, the response rates tend to be of about the same magnitude year
after year. This means that the trends that emerge from these series are relatively
unaffected by dropout rates.
The results of school surveys are sometimes used for evaluation purposes. When pre-
vention strategies and campaigns are planned, an evaluation of their effects is
required. However, it is important to use some caution when using school surveys
for such purposes.
The first task is to decide what are the possible effects of variables. It is generally
thought that measures of prevention regarding alcohol and drug use are likely to
affect usage rates. However, when an evaluation is needed, thought should be given
to the kind of effect expected. For example, if the preventive efforts were made at
a cognitive level, no effects might be found at the behavioural level, but some found
at the attitudinal level. It is also important to consider whether the target popula-
tion of a campaign is the same as the school classes surveyed. Ideally, an evalua-
tion should include a control group, for example, classes in a similar city or region
where no preventive intervention was made. In addition, surveys should only form
one part of the evaluation process.
Another important factor that may lower the quality of data relates to the frequen-
cy with which school surveys are conducted. If students are exposed to too many
questionnaires, their willingness to cooperate could decrease, which could lead to a
higher degree of missing or invalid data.
When asked about their alcohol and drug use, adults tend to underestimate their
consumption. There are many reasons for this, one of which is social desirability or
the tendency of respondents to give answers that they think are either consistent
with researchers' expectations or that will make them look better in the eyes of the
researchers. By contrast, young people may overestimate their drinking habits, for
example, if they feel that drinking is associated with adult behaviour or is expect-
ed by their friends. The risk of receiving inaccurate responses is probably higher if
the data collection setting is less formal, that is, if the student thinks that class-
mates might be able to see their responses. There is strong evidence from many
studies, however, that data collected through school surveys have a high level of reli-
ability and validity (see chapter IV).
To sum up, school surveys constitute the most important method of collecting data
on alcohol and drug use among young people. They are relatively inexpensive and
easy to administer and many studies have shown that they yield good quality data.
This is, of course, dependent upon the use of a sound methodological procedure.
These matters are considered in detail in other parts of Toolkit Module 3.

Examples of ongoinglarge-scale school surveys
Chapter II
9
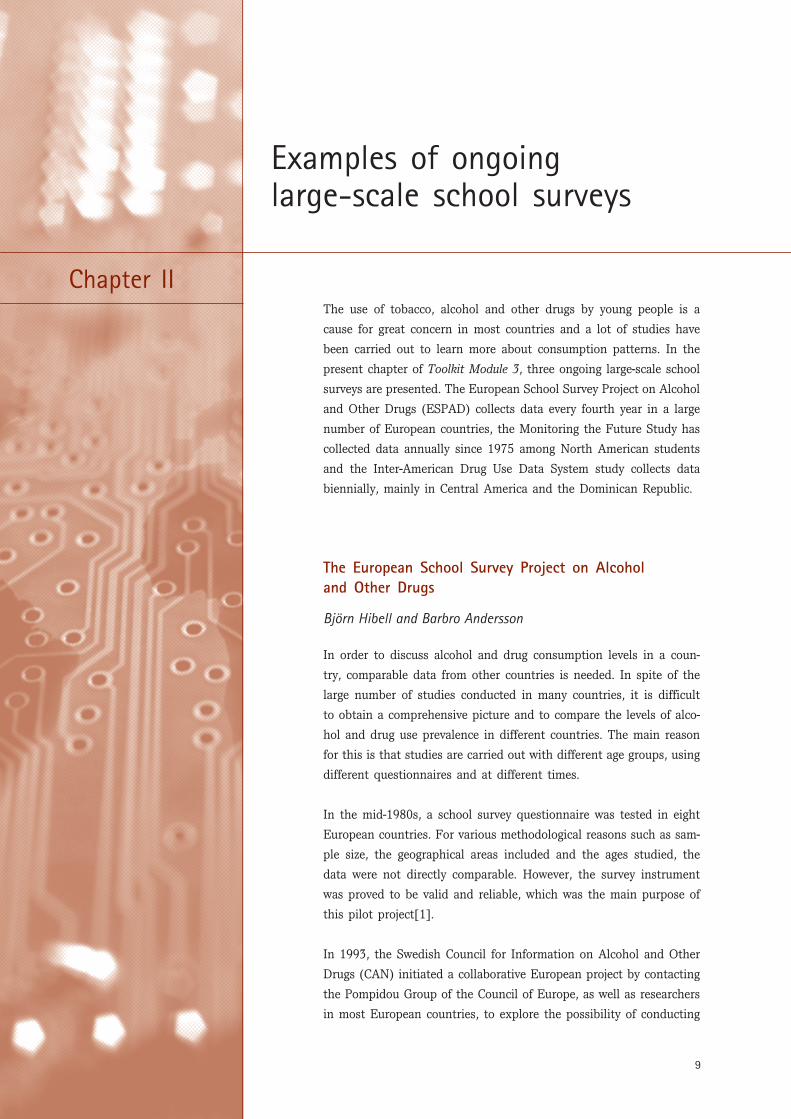
The use of tobacco, alcohol and other drugs by young people is a
cause for great concern in most countries and a lot of studies have
been carried out to learn more about consumption patterns. In the
present chapter of Toolkit Module 3, three ongoing large-scale school
surveys are presented. The European School Survey Project on Alcohol
and Other Drugs (ESPAD) collects data every fourth year in a large
number of European countries, the Monitoring the Future Study has
collected data annually since 1975 among North American students
and the Inter-American Drug Use Data System study collects data
biennially, mainly in Central America and the Dominican Republic.
The European School Survey Project on Alcoholand Other Drugs
Björn Hibell and Barbro Andersson
In order to discuss alcohol and drug consumption levels in a coun-
try, comparable data from other countries is needed. In spite of the
large number of studies conducted in many countries, it is difficult
to obtain a comprehensive picture and to compare the levels of alco-
hol and drug use prevalence in different countries. The main reason
for this is that studies are carried out with different age groups, using
different questionnaires and at different times.
In the mid-1980s, a school survey questionnaire was tested in eight
European countries. For various methodological reasons such as sam-
ple size, the geographical areas included and the ages studied, the
data were not directly comparable. However, the survey instrument
was proved to be valid and reliable, which was the main purpose of
this pilot project[1].
In 1993, the Swedish Council for Information on Alcohol and Other
Drugs (CAN) initiated a collaborative European project by contacting
the Pompidou Group of the Council of Europe, as well as researchers
in most European countries, to explore the possibility of conducting
simultaneous school surveys on drug, alcohol and tobacco consumption. The result
was ESPAD, the first survey of which was conducted in 1995, the second in 1999
and the third in 2003.
The key to obtaining data that are as comparable as possible is standardization.
This includes the target population, national project plans, the sampling, the field
procedure, the questionnaire and the reporting of major results. The ESPAD plan
contains a lot of practical information on how to conduct a survey in each partici-
pating country[2].
Purpose, national project plans and regional seminars
The main purpose of ESPAD is to collect comparable data on drug, alcohol and
tobacco use among students in as many European countries as possible.
Another long-term goal is to monitor trends in alcohol and drug habits among stu-
dents in Europe and to compare trends in different countries. Changes in one part
of Europe can then be used to improve understanding of trend patterns and to
enhance readiness for prevention strategies in other countries.
An additional goal is to provide data that can be used as a part of the evaluation
of the European Union Action Plan to Combat Drugs (2002-2004) and the
Declaration on Young People and Alcohol, adopted at the World Health Organization
European Ministerial Conference on Young People and Alcohol, held in Stockholm,
19-21 February 2001.
It is planned to repeat the surveys every fourth year in order to provide data on
where and when changes in alcohol and drug consumption occur. All European coun-
tries can participate.
Each country is responsible for writing a national project plan according to a stan-
dardized format. The project plans are then discussed in detail at regional seminars,
where researchers from participating countries endeavour to solve any problems
encountered and dispense advice. After the seminars, rewritten national project plans
are sent to the project coordinators.
Target population and sampling
The target population of ESPAD is students who are 15-16 years old at the time of
data collection. In the three surveys of 1995, 1999 and 2003, that meant students
born in 1979, 1983 and 1987 respectively. One reason for choosing this age group
is that, in most European countries, young people at this age are likely to be found
within the compulsory school system. The target population is limited to students
who are present in class on the day of data collection. Consequently, data from pos-
sible follow-up studies on absent students are not included in the international
10
GAP Toolkit Module 3 Conducting School Surveys on Drug Abuse
11
Chapter II Examples of ongoing large-scale school surveys
ESPAD reports. The target population does not include students who are unable to
understand or for other reasons cannot answer the questionnaire without assistance,
such as retarded, mentally disturbed or severely disabled students.
Students of 15-16 years of age are the compulsory target group in the ESPAD study.
If a country wishes to add an additional age group, it is recommended that 17-18
year-old students are chosen, so that students born in 1977, 1981 and 1985 respec-
tively could participate in the data collections of 1995, 1999 and 2003.
The nationally representative sample should be drawn as a cluster sample, in which
the sample units are classes. The ESPAD researchers can choose from several sam-
pling models, including total population sampling, simple cluster sampling, two-stage
cluster sampling or stratified cluster sampling. Detailed information on sampling
procedures is given in Guidelines for Sampling Procedure in the School Survey Project
on Alcohol and Other Drugs[3].
It is recommended that the number of participating students be above 2,400. One
reason for this is that it allows breakdowns to be made in tables by sex and anoth-
er variable. The attainment of 2,400 participants in practice means a larger sample
is required. It can be expected that some of the selected classes will not be able to
participate and that about 10-15 per cent of the students will be absent when the
data is collected. Thus, to obtain the recommended minimum number of answers,
the sample should include not less than 2,800 students belonging to the target pop-
ulation. If a complementary goal of a country's participation in ESPAD is to com-
pare subgroups, for example different regions, the sample will need to be larger than
2,800 students. If students in the target population are in two or more grades, class-
es from all the relevant grades should be sampled.
Data collection instrument and field procedures questions
The ESPAD questionnaire contains core questions, as well as module and optional
ones. The core questions should be used by all countries. They include some back-
ground variables, nearly all the alcohol-, tobacco- and drug-related questions, as well
as some methodological questions. The questionnaire also contains module ques-
tions and three optional questions.
A module is a set of questions focusing on a specific theme. The ESPAD 2003 ques-
tionnaire contains four modules, entitled "Integration", "Mainstream", "Psychosocial
measures" and "Deviance". Countries are encouraged to use one or two modules in
their entirety, although some countries have even selected questions from all four
modules.
A country may supplement the core, module and optional questions with questions
of special interest, that is, country-specific questions. However, the special interest
questions must not overload the questionnaire or in any other way jeopardize the
students' willingness to answer honestly.
12
GAP Toolkit Module 3 Conducting School Surveys on Drug Abuse
Field-testing of the questionnaire is highly recommended for countries joining the
project. A field test is also recommended if a country adds questions that were not
used in earlier studies.
The ESPAD standard questionnaire is written in English. In each country the final
version of the questionnaire must be translated into each language and then trans-
lated back into English by another translator, in order to prevent any divergence
from the original text.
The head teachers of selected schools should be contacted and informed of the
planned study. He or she should be asked to inform the teacher(s) of the chosen
class(es), but not to inform the students in order to avoid discussions among them
that could lead to biased data. The class teacher should be asked to schedule the
survey for one class period, following the same procedure as for a written test.
Even if the data collection is administered by someone from outside the school, it
is important that teachers affected by the survey are informed about it. Data col-
lection should take place during a week not preceded by any holiday, in order to
ensure that the students refer to a "normal" week when answering the questions.
Schools unable to conduct the survey during the assigned week may postpone it
until the following week.
Whenever possible, it is preferable that the data collection in a school is carried out
at the same time in all participating classes. The main reason for this is to avoid
discussions in the breaks that might influence the answers of those students who
have not yet taken part in the study.
It is of great importance to use a survey leader trusted by the students. It is there-
fore left to each ESPAD researcher to decide whether teachers or research assistants
should be responsible for data collection in his or her country.
The questionnaires should be answered anonymously, that is, they should not con-
tain any identification numbers and the students should not write their names on
them. In order to enhance the perception of anonymity, each student should be pro-
vided with a blank envelope in which to seal his or her completed questionnaire.
ESPAD provides the survey leader with written instructions on the manner in which
the questionnaire should be completed in the classroom. The survey leader should
complete a standardized classroom report while the students answer the question-
naire.
Reporting and further information
After each data collection, data from each country are presented in a standardized
national report, called a "country report", which is sent to the coordinators to be
used as a basis for the international ESPAD report. Besides standard tables, coun-
13
Chapter II Examples of ongoing large-scale school surveys
try reports contain a description of the sampling frame, the sampling procedure and
how the data were collected, as well as the number of absent students, the reasons
for their absence and so forth.
The objective of the international report is mainly descriptive, that is, to compare
students' alcohol and drug use in participating countries and to study changes in
habits. The common descriptive report is by no means supposed to be the only
international report. On the contrary, the available data will be sufficient for many
reports, including analysis of the four modules.
In 1995, data were collected in 26 countries. When the second ESPAD study was
conducted, in 1999, 31 countries provided data[4]. At the time of writing, about 35
countries are expected to participate in the 2003 data collection.
The following countries and territories participated in the 1999 survey: Belarus,
Bulgaria, Croatia, Cyprus, Czech Republic, Denmark, Estonia, the Faroe Islands
(Denmark), Finland, France, Greece, Greenland (Denmark), Hungary, Iceland,
Ireland, Italy, Latvia, Lithuania, Malta, the Netherlands, Norway, Poland, Portugal,
Romania, Russian Federation, Slovakia, Slovenia, Sweden, the former Yugoslav
Republic of Macedonia, Ukraine and the United Kingdom of Great Britain and
Northern Ireland.
Further information about ESPAD project can be found in the ESPAD reports and on
the ESPAD web site at www.espad.org. Additional information can also be obtained
from the coordinators, Björn Hibell ([email protected]) and Barbro Andersson (bar-
[email protected]) at the Swedish Council for Information on Alcohol and Other
Drugs (CAN) ([email protected]), P.O. Box 70412, S-107 25 Stockholm, Sweden; telephone
+(46) (8) 412-4600; facsimile +(46) (8) 104-641; web site www.can.se.
The Monitoring the Future study
Lloyd D. Johnston
The Monitoring the Future study is an ongoing nationwide study of substance use
among adolescents, college students and adult high-school graduates in the United
States. Initiated by a team of social scientists at the University of Michigan in the
mid-1970s, it has consisted of a series of annual in-school surveys of national sam-
ples of secondary school students. In addition, representative samples of secondary
school graduates are followed up using self-administered mail surveys for many years
after they finish secondary school, in what is called a cohort-sequential design. The
earliest cohort is about to be re-surveyed at age 45.
Support for this long-term study has come from the National Institute on Drug
Abuse, one of the National Institutes of Health. It comes in the form of a series of
five-year, renewable, investigator-initiated, competing research grants.
14
GAP Toolkit Module 3 Conducting School Surveys on Drug Abuse
Purposes
The Monitoring the Future study has quite a number of research purposes. Of most
relevance to Toolkit Module 3 is the purpose of quantifying and monitoring changes
in the use of a host of licit and illicit drugs by adolescents, college students, young
adults generally and adults up to middle age. Because of the cohort-sequential design,
it has the additional purpose of trying to distinguish among three different types of
change that may be occurring: period effects (changes across years common to all
cohorts and ages), age effects (changes with age common to all cohorts) and cohort
effects (differences among cohorts that last across much or all of the life cycle). A
third purpose is to determine and monitor changes in many of the risk and pro-
tective factors for drug use. Among the most important of these have proven to be
certain attitudes and beliefs about drugs; in particular, the perceived risk associat-
ed with using a particular drug and the level of personal disapproval of use of each
drug.
Finally, the panel feature of the study allows the examination of potential causes
and consequences of various types of substance use by examining relationships
among variables across time on the same individuals. Among the most important
determinants examined are transitions in major environments, such as college or
military service, and roles, such as marriage, parenthood and divorce. A more detailed
description of the full set of objectives and findings generated relevant to each of
them may be found in Johnston and others (2001)[5].
Among the substances under study are tobacco, alcohol, inhalants, a large number
of illicit drugs (for example, marijuana, cocaine, methylenedioxymethamphetamine
(Ecstasy), hallucinogens and heroin), psychotherapeutic drugs used outside of med-
ical direction (amphetamines, sedatives, tranquillizers and various narcotics), certain
drugs that can be sold without prescriptions (diet and stay-awake drugs and sleep-
aid pills), and anabolic steroids.
Target populations and sampling
Large independent samples are surveyed each year at grades 8, 10 and 12. In recent
years, approximately 45,000-50,000 students per year, in some 430 secondary schools
have been surveyed. The eighth, tenth and twelfth grades correspond closely to ages
13-14, 15-16 and 17-18 respectively. The twelfth grade surveys started in 1975, while
the lower two grades were added to the annual surveys in 1991.
Because school attendance is mandatory until the age of 16, loss rates at the eighth
grade due to students dropping out of school are negligible, and at the tenth grade
they are quite small, perhaps 5 per cent. Twelfth grade is the last year of universal
public education in the United States, and some 85 per cent of each birth cohort
finish twelfth grade, according to data from the United States Census Bureau.
15
Chapter II Examples of ongoing large-scale school surveys
A multi-stage, random sampling procedure is used to select the student sample at
each of the three grade levels. Stage 1 is the selection of specific geographical areas
(often counties) from around the country that, collectively, should contain a repre-
sentative national sample of the entire general population. These areas are selected
from census frames with stratification on such variables as region and population
density in order to ensure proportional representation of these variables each time
the study is conducted. The second stage is to select one or more schools from each
of these areas, with their probability of selection set to be proportional to the size
of the school, as measured by the estimated number of students in the grade in
question. In this way, schools come into the sample in proportion to the number of
students they serve, which prevents the sample from over-representing small schools.
The third stage is the selection of students within the school in the grade level under
study. In larger schools (with more than 350 eligible students), a random set of
classrooms is selected. In smaller schools, all students are usually surveyed. The
weighting of the resulting data corrects for unequal probabilities of being selected
into the sample. Final weights are normalized to average 1.0 so that the weighted
number of cases equals the actual number, making the presentation of results less
complicated.
More information on the design of the Monitoring the Future study and its findings
may be found in the three monographs published annually by the study team[6-8].
These and all other publications from the study cited here may be found on the
Monitoring the Future web site at www.monitoringthefuture.org.
Once the students selected into the samples for each grade have been surveyed in
school, a randomly selected sub-sample of 2,400 of the twelfth-grade participants
from each year is chosen to constitute a panel that will be followed up in future
years. They are surveyed biannually by mail until the age of 30 and then every five
years until the age of 45 and perhaps beyond.
Data collection instruments and field procedures
Self-administered questionnaires are used in all the Monitoring the Future surveys.
Because of the large samples, it is possible to divide the instrumentation across mul-
tiple forms, making it feasible to cover much more substance. Four such forms are
used in the eighth and tenth grades and six forms are used in the twelfth grade.
All forms have two sections in common with all the other forms used in that grade:
the family background and demographics section and the self-reported substance use
section. In that way, the key dependent variables (regarding drug use) and the key
control variables (background and demographic measures) are available in all forms.
While there have been revisions in the instrumentation over the years in response
to changing realities (such as new drugs and new containment efforts), the investi-
gators have made a particular effort to hold constant both the wording of the ques-
16
GAP Toolkit Module 3 Conducting School Surveys on Drug Abuse
tions and answers, and the context in which the question is asked. The purpose of
this constancy is to ensure that any changes in substance use that might be observed
over the years reflect real changes in the underlying phenomenon and do not just
result from changed methods. Because of this carefulness in the handling of changes
in methods, the Monitoring the Future study is generally viewed as the most reli-
able source of information on drug trends among young people in the United States.
Considerable evidence has been gathered over the years about the reliability and
validity of the drug measures used in the study, which have been adopted by oth-
ers both inside the United States and in other countries. Perhaps the best infor-
mation on reliability comes from an analysis of three waves of panel data[9]. The
various other types of evidence are summarized in chapter 3 of Johnston, O'Malley
and Bachman (2002b)[7] or in any prior volume in that series.
The questionnaires are administered by University of Michigan personnel, who trav-
el to each school in the sample. Travel costs are minimal because the University has
a national staff of interviewers scattered around the country available to conduct
national surveys of various sorts. Staff at the central office approach the schools to
secure their participation, select and contact replacement schools for those that
decline to participate, arrange by post and telephone the timing and details of the
administration, and assign the field interviewers to the relevant schools. Further
details about these and the study's other procedures may be found in Bachman,
Johnston and O'Malley (2001)[10].
The questionnaires currently given to eighth- and tenth-grade students are anony-
mous, while those given to twelfth-grade students are confidential, since the names
and addresses of the students are needed for the follow-up surveys of the subset of
them who will comprise the panel. A careful examination of the effects of changing
the questionnaires in the lower grades from confidential to anonymous suggests that
there was no difference at the tenth grade as a function of the mode of adminis-
tration, and only a very small difference, if any, at the eighth grade[11]. That find-
ing may not hold in all cultures, however. The completed questionnaires are optically
scanned by contract with a company that specializes in such work.
Reporting and further information
As might be expected, given the scale and duration of the Monitoring the Future
study, it has given rise to a large literature. All its publications are cited on the
study's web site; some can be viewed in their entirety and the abstracts of others
can be viewed. The primary method for disseminating the major epidemiological find-
ings from the study is the series of three monographs published annually[6-8].
Complete descriptive results from all of the twelfth-grade surveys are presented in a
series of hard-bound volumes. There is a series of occasional papers that now num-
ber nearly 60 and many articles and chapters.
17
Chapter II Examples of ongoing large-scale school surveys
The study has been used extensively to guide government policy and the investiga-
tors have been asked to advise various administrations and to testify before the
United States Congress more than a dozen times. The national trend results are
released to the media each year in the form of two carefully prepared press releas-
es, one dealing with cigarette use by young people and the other with their use of
illicit drugs and alcohol. These press releases can be viewed on the study's web site,
which also contains information on how to contact the study staff and provides links
to a number of other sources.
School Surveys in the Inter-American Systemof Uniform Drug-Use Data
Julia Hasbun
The use of legal and illegal drugs by young people has been an area of study for all
the States members of the Organization of American States. In 2000, the PACAR-
DO study, conducted in Central America and the Dominican Republic, directed atten-
tion to secondary school students in those countries. The results indicated that drug
use was a common practice among secondary school students and that the age of
first use was becoming younger than pre-studies had indicated. This raised aware-
ness that drug use prevalence and patterns should be analysed and recognized as a
priority research topic for all States members. The Inter-American System of Uniform
Drug-Use Data (SIDUC) under the Inter-American Drug Abuse Control Commission
(CICAD) offered a solution by including such measures in their school surveys.
The SIDUC cooperation has shown that, if countries jointly create a standard method-
ology, it is possible to make comparisons between countries and draw strategies for
regions and groups of countries. In 1987, a school survey questionnaire was tested
in Central America and the Dominican Republic. Based on that survey and the PAC-
ARDO study, researchers created a short questionnaire to measure the prevalence
and patterns of drug use and abuse among secondary students.
Purpose and planning procedures
The main purposes of SIDUC school surveys are:
To monitor trends on drug use and abuse through the years;
To collect comparable data on drug use among secondary students in different
countries;
To develop and use comparable methodologies in order to overcome the diffi-
culties of and obstacles to conducting drug surveys;
To provide low-cost procedures and tools for research in participating coun-
tries.
18
GAP Toolkit Module 3 Conducting School Surveys on Drug Abuse
SIDUC school surveys are conducted every two years, but States have the option of
conducting surveys annually.
In order to standardize procedures, researchers held a large number of seminars to
discuss the definition of the target populations to be studied, sampling procedures,
field procedures and, most important of all, the questionnaire to be used. During
this process, more countries joined SIDUC.
Each country is responsible for writing its national report in a standardized format.
Meetings and workshops for national researchers from the various States are planned,
for the purpose of identifying and improving common strategies.
Target population and sampling
The target population of SIDUC school surveys is secondary students in private and
public schools in the eighth, tenth and twelfth years of study leading to a diploma.
That is a population of students attaining the age of 13, 15 or 17 during the year
data is collected. Targeting these groups of ages provides an overview of the situa-
tion among adolescents and avoids the need to target all secondary school grades.
The sampling process takes place in two stages. First, schools are selected from lists
of official, private and public schools; in some countries, the lists and numbers of
students currently in the grades must be confirmed during this stage. Secondly,
school grades and classrooms (sample units) are chosen. All students in a chosen
classroom are included in the sample. Students absent from class on the day of data
collection are considered non-respondents.
The minimum geographical area recommended for sampling schools is the metro-
politan area; States may conduct national sampling if desired. Other grades may be
included if it is deemed necessary, provided the pre-established grades are included.
The participating States are responsible for obtaining the sampling frame.
Approximately 2,000 students are included in each national sample.
Data collection instrument and field procedures
The SIDUC school questionnaire contains a minimum core set of variables that all
participating States must include and must address in a standardized way. These
sets of questions are already closed and pre-coded; that is, a fixed set of answer cat-
egories is provided for each one. States are welcome to include other variables.
The questionnaire is self-administered and respondents are not asked to give their
names. States are required to test the questionnaire in a pilot study before begin-
ning the data collection process. The questionnaire is available in both Spanish and
English. Most participating States are Spanish-speaking.
19
Chapter II Examples of ongoing large-scale school surveys
Interviewers contact head and classroom teachers of the selected schools and agree
on the day, time and schedule for the administering of the survey. While students
complete the questionnaire, teachers are asked to be absent from the classrooms.
The interviewers are responsible for discipline during the administration of the ques-
tionnaire. It is recommended that the interviewers be young, with a profile similar
to the respondents. A written manual helps the participating States maintain stan-
dard procedures.
Reporting and further information
CICAD analyses the collected data and presents the results for each country in region-
al reports. However, each country is also responsible for producing its own report
addressing its particular issues and needs. In addition to descriptive statistics, the
results of bivariate and multivariate analyses are presented. The results are presented
in written reports and are also available on the web sites of all the participating
institutions. Some of the indicators of the National Drug Observatory, the common
drug reporting system developed for SIDUC countries, are obtained from this study.
The standardized process started in 2002 in some of the States. It is expected that
all States members of SIDUC will join and conduct the school survey in 2003. The
States participating in SIDUC include Belize, Canada, Chile, Colombia, Costa Rica,
Dominican Republic, Ecuador, El Salvador, Guatemala, Honduras, Mexico, Nicaragua,
Panama, Paraguay, Peru, United States, Uruguay and Venezuela. Further informa-
tion may be obtained from the CICAD web site at www.cicad.oas.org.
References
1. L. D. Johnston, F. Driessen and A. Kokkevi, Surveying Student Drug Misuse: A Six-
Country Pilot Study (Strasbourg, Council of Europe, 1994).
2. B. Hibell and B. Andersson, European School Survey Project on Alcohol and Other Drugs
(ESPAD 03): Project Plan (Stockholm, Swedish Council for Information on Alcohol and
Other Drugs, 2002).
3. T. Bjarnason and M. Morgan, Guidelines for Sampling Procedures in the School Survey
Project on Alcohol and Other Drugs (Stockholm, Swedish Council for Information on
Alcohol and Other Drugs, 2002).
4. B. Hibell, B. Andersson, S. Ahlström, O. Balakireva, T. Bjarnason, A. Kokkevi and
M. Morgan, The 1999 ESPAD Report: Alcohol and Other Drug Use Among Students in
30 European Countries (Stockhom, Swedish Council for Information on Alcohol and
Other Drugs, 2000).
5. L. D. Johnston, P. M. O'Malley, J. Schulenberg and J. G. Bachman, "The aims and objec-
tives of the Monitoring the Future study and progress toward fulfilling them", third ed.,
Monitoring the Future occasional paper No. 52 (Ann Arbor, Michigan, Institute for
Social Research, 2001).
20
GAP Toolkit Module 3 Conducting School Surveys on Drug Abuse
6. L. D. Johnston, P. M. O'Malley and J. G. Bachman, Monitoring the Future National
Survey Results on Adolescent Drug Use: Overview of Key Findings, 2001, National
Institutes of Health publication No. 02-5105 (Bethesda, Maryland, National Institute on
Drug Abuse, 2002).
7. L. D. Johnston, P. M. O'Malley and J. G. Bachman, Monitoring the Future National
Survey Results on Drug Use, 1975-2001: Volume I: Secondary School Students, National
Institutes of Health publication No. 02-5106 (Bethesda, Maryland, National Institute on
Drug Abuse, 2002).
8. L. D. Johnston, P. M. O'Malley and J. G. Bachman, Monitoring the Future National
Survey Results on Drug Use, 1975-2000: Volume II: College Students and Adults Ages
19-40, National Institutes of Health publication No. 02-5107 (Bethesda, Maryland,
National Institute on Drug Abuse, 2002).
9. P. M. O'Malley, J. G. Bachman and L. D. Johnston, "Reliability and consistency of self-
reports of drug use", International Journal of the Addictions, vol. 18, No. 6 (1983), pp.
805-824.
10. J. G. Bachman, L. D. Johnston and P. M. O'Malley, "The Monitoring the Future proj-
ect after 27 years: design and procedures", Monitoring the Future occasional paper No.
54 (Ann Arbor, Michigan, Institute for Social Research, 2001).
11. P. M. O'Malley, L. D. Johnston, J. G. Bachman and J. Schulenberg, "A comparison of
confidential versus anonymous survey procedures: effects on reporting of drug use and
related attitudes and beliefs in a national study of students", Journal of Drug Issues,
vol. 30, No. 1 (2000), pp. 35-54.

Planning, administrationand costsLloyd D. Johnston
Chapter III
21
An overview of the entire process involved in conducting a school sur-
vey is useful in order to save time, avoid mistakes and control costs.
A flow chart of the process is provided (see figure) to indicate some
of the milestones and major categories of activity and to indicate
which ones can move in parallel with others (saving time and costs)
and which ones must await the completion of others.
The early planning process involves taking a decision on whether and
how to proceed with a school survey. Many of the relevant consider-
ations for making such a decision are presented in other chapters of
this Toolkit Module 3. The initiative for undertaking such a survey
may originate from any of a number of organizations or individuals,
which makes the exact starting point for the planning process some-
what imprecise. However, once the decision to conduct a survey has
been made, a source or multiple sources of funding must be found.
Decisions must then be made about who will direct the research, what
types of expert and staff support will be needed and what timetable
will be realistic for the overall endeavour, as well as for the major
components shown in the flow chart. While a rough preliminary budg-
et estimate may be used in the initial decision of whether to proceed
with such a survey, it is advisable to have the lead investigators pre-
pare a more specific budget once they have had an opportunity to
review carefully the various activities in the research plan and to esti-
mate the cost of each of them.
In some countries, an advisory team may be established to oversee
the undertaking and to select the lead investigators. In others, the
initiating organization may simply recruit one or more individuals to
run the project and allow them a fair amount of latitude as to how
to proceed. Alternatively, individual researchers may take the initia-
tive to conduct such a survey. There are advantages and disadvan-
tages to each approach. For example, the advisory committee
approach can help to engage people or organizations needed to fund,
conduct or make use of the research. However, having such a com-
mittee may result in differences of opinion or the involvement of polit-
ical considerations in the process. If it is decided to have an advisory
22
GAP Toolkit Module 3 Conducting School Surveys on Drug Abuse
committee, it is generally best if it deals with the broad policy and financial issues
of the work and leaves scientific decisions to the scientists.
The research design has multiple elements, some of which are discussed at length
in the present Toolkit Module 3, including: deciding on the purposes of the research,
defining the group of people to whom the results should be generalized, designing
a sampling plan for representing that group with an acceptable degree of accuracy,
developing a research protocol for gathering data from that sample of respondents
and developing an analysis and reporting plan. Each of these elements has an impact
on planning, staffing and costs. The following section deals with the issue of the
type and number of personnel that are likely to be required to carry out a large-
scale study of substance use among students in a country.
Personnel
Various types of personnel are needed for the conduct of a school survey, for vary-
ing lengths of time. Selecting, training and supervising them are all critical elements
in the conduct of a survey. In smaller countries, the same individuals may play mul-
tiple roles in such projects and it may be possible to involve experts in the project
that do not require monetary compensation.
Lead investigators
The lead investigator(s) ideally will participate in the activity from start to finish
and will supply the elements of planning and integration needed to be sure that the
end product matches the needs and objectives that gave rise to the research in the
first place. Ideally, they would be trained social scientists with some experience in
survey research techniques, including design, instrument development, sampling and
analysis. However, sometimes it is not practical to find such individuals, in which
case the person chosen to be lead investigator will be more dependent on the advice
of experts and consultants to ensure that the scientific principles underlying this
field of survey research are being followed.
Core staff
It is also desirable that several key support personnel stay with the study for its
duration, participating in several different activities and making sure that they are
carried out according to plan. They should be well educated and preferably have
some experience with research activities. They may supervise various components of
the study, under the general direction of the lead investigator(s). If they are trained
in running data analysis computer programs they can play an essential role in car-
rying out the data analyses towards the end of the process.
23
Chapter III Planning, administration and costs
Data collection staff
Whether or not to employ personnel from outside the school to collect the data is
an important decision that affects the budget, staff size and possibly the validity of
the data collected. If it is decided that the children will trust the teachers in their
schools to protect their confidentiality, then the teachers can collect the data from
the students. If it is decided that the students are not likely to answer honestly if
their own teachers are supervising the collection of the sensitive data contained in
surveys of drug use, then staff members must be hired, and usually compensated,
for collecting the data in the field. In one country, trained psychologists were hired
for this purpose for a national school survey, in another, trained field interviewers
from a survey research organization, and in a third, school nurses. In some coun-
tries, university students may be willing to take part in such a survey for the sake
of obtaining valuable training and perhaps a small monetary compensation.
However, such high levels of skill are not necessary for this work. The ability to
follow directions and to communicate effectively both orally and in writing are suf-
ficient. (More information regarding data collection staff is provided in chapter VII.)
If a field staff member is to be hired, trained and supervised, then those steps must
be built into the plan of activities and reflected in the budgetary planning. Such staff
members are usually hired only for the period of time over which data are being col-
lected (plus some prior interval for their training). Lengthening the data collection
period may reduce the number of such people that need to be hired and trained, since
each one can cover more schools, but it may also lengthen the period over which the
core staff and the lead investigator(s) must be paid. An over-long data collection peri-
od can give rise to problems of seasonal fluctuations in substance use being con-
founded with other variables, such as region of the country.
Thus, a part of the planning process is to decide whether outside data collection
personnel are needed, and if they are, to decide how many to hire and for what
period of time. (More should be hired than are actually needed in the field, since
some will leave and the contracts of others may have to be terminated on the
grounds of poor performance.) If the country covers a very large geographical area,
making travel costs a significant consideration, thought should be given to hiring
people living in different regions of the country to collect data in their own areas.
Investigators in a number of countries have concluded that they can elicit accurate
responses from students using teachers to collect the data, usually with some spe-
cific procedures for the teachers to follow that would reassure the students about
their privacy. (See, for example, Bjarnason (1995) who compared the two methods
in one country and found no differences in reported drug use[1].) There are obvi-
ously considerable monetary and logistic advantages to having teachers handle the
administration of the questionnaire, but if, as a result, the data retrieved from the
students is worthless, it is a very costly saving. Clearly, this is a judgement call that
must be made in each cultural setting and that could be informed by a short pre-
test using both methods.
24
GAP Toolkit Module 3 Conducting School Surveys on Drug Abuse
Consultants
While the present Toolkit Module 3 provides practical help, a large, rigorous school
survey would benefit from direct technical assistance at various stages, depending
of course on the areas of expertise of the lead investigators. If the lead investiga-
tors are new to this area of research, they may want to consider a short-term con-
sultation with an experienced expert at the initial planning stage, again at the
analysis-planning stage and perhaps also at the interpretation stage. Such an expert
may reside within the country or may be brought in from elsewhere, perhaps with
the assistance and support of one of the international organizations that deal with
the control of drug abuse.
Sampling is a technical area and the design for drawing adequate samples of clus-
tered respondents (which is what schools represent) is a specialization within that
area. Of course, the starting point is to read the chapter in the present volume on
sampling (chapter V). However, consultation with a sampling statistician is likely to
be helpful, again at an early point in the planning effort, since the sampling design
affects so many other parts of the effort and, in particular, costs. (A more detailed
discussion of the sampling resources needed, as well as other administrative con-
siderations, may be found in Johnston (2000[2].)
If neither a general consultant from the substance abuse field nor a statistician is
available to assist with data analyses, an alternative is to seek an expert on statis-
tical analyses. Such an expert does not usually conduct the analyses; rather, he or
she advises on the choice of analyses and appropriate computer programs for con-
ducting them. A number of the most important analyses from a policy point of view
can be done quite simply.
At an early stage of the planning process a budget must be developed in order to
secure the commitment of sufficient funding to conduct the survey properly (see
table). The issue of personnel was discussed above, before budgeting, because per-
sonnel costs are usually the single largest component of the costs of conducting a
school survey and therefore greatly influence the overall budget. In fact, it is not
possible to provide a cost estimate of a "typical school survey" because the budget
is affected so dramatically by such factors as labour costs in the country, whether
it is necessary to use data collection staff from outside the schools, the use of opti-
cal scanners versus manual data entry and the need for technical assistance. Also,
the size of the sample needed and the size of the country across which that sam-
ple will be spread influence both staff and travel costs, particularly if outside data
collectors are to be sent to the schools. Moreover, it is often the case that many of
the personnel assigned to plan and conduct the school survey are already on the
payroll of a participating agency. In that case, funding may not be needed to cover
their time if the agency is willing to reassign them to the research effort. When this
is the case, the additional funds that must be raised to conduct the research may
be reduced sharply.
25
Chapter III Planning, administration and costs
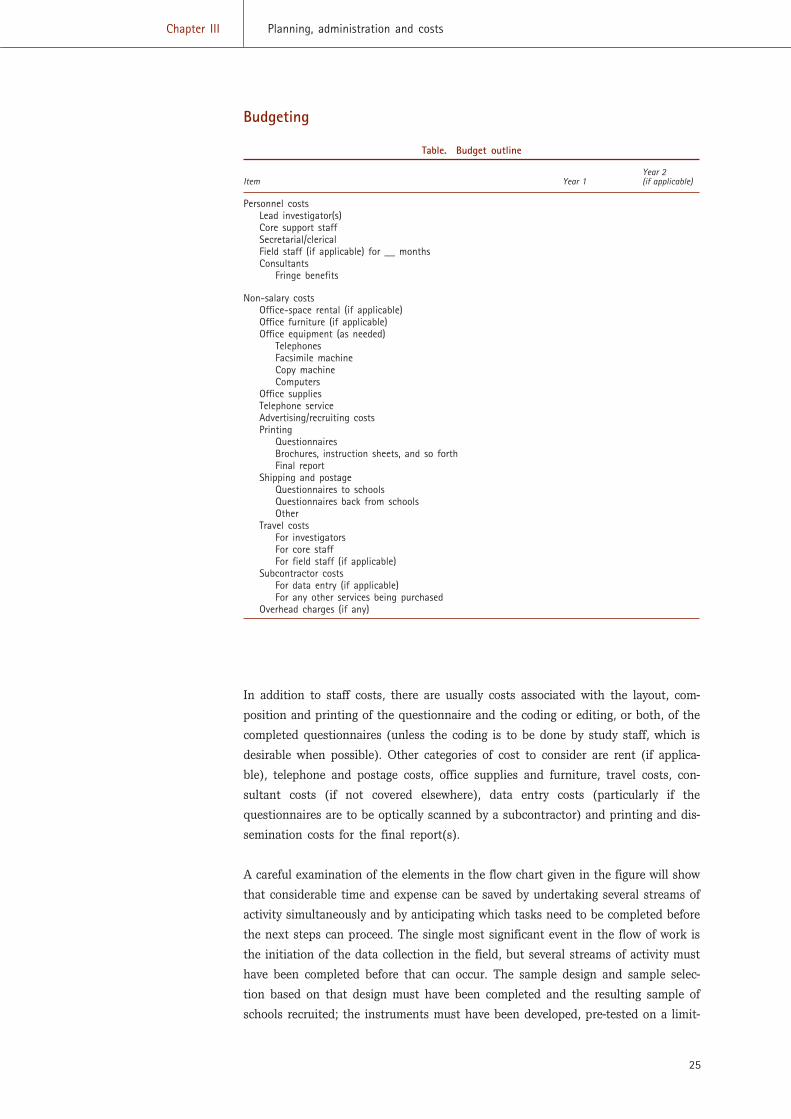
Budgeting
Table. Budget outline
Year 2Item Year 1 (if applicable)
Personnel costsLead investigator(s)Core support staffSecretarial/clericalField staff (if applicable) for __ monthsConsultants
Fringe benefits
Non-salary costsOffice-space rental (if applicable)Office furniture (if applicable)Office equipment (as needed)
TelephonesFacsimile machineCopy machineComputers
Office suppliesTelephone serviceAdvertising/recruiting costsPrinting
QuestionnairesBrochures, instruction sheets, and so forthFinal report
Shipping and postageQuestionnaires to schools Questionnaires back from schoolsOther
Travel costsFor investigatorsFor core staffFor field staff (if applicable)
Subcontractor costsFor data entry (if applicable)For any other services being purchased
Overhead charges (if any)
In addition to staff costs, there are usually costs associated with the layout, com-
position and printing of the questionnaire and the coding or editing, or both, of the
completed questionnaires (unless the coding is to be done by study staff, which is
desirable when possible). Other categories of cost to consider are rent (if applica-
ble), telephone and postage costs, office supplies and furniture, travel costs, con-
sultant costs (if not covered elsewhere), data entry costs (particularly if the
questionnaires are to be optically scanned by a subcontractor) and printing and dis-
semination costs for the final report(s).
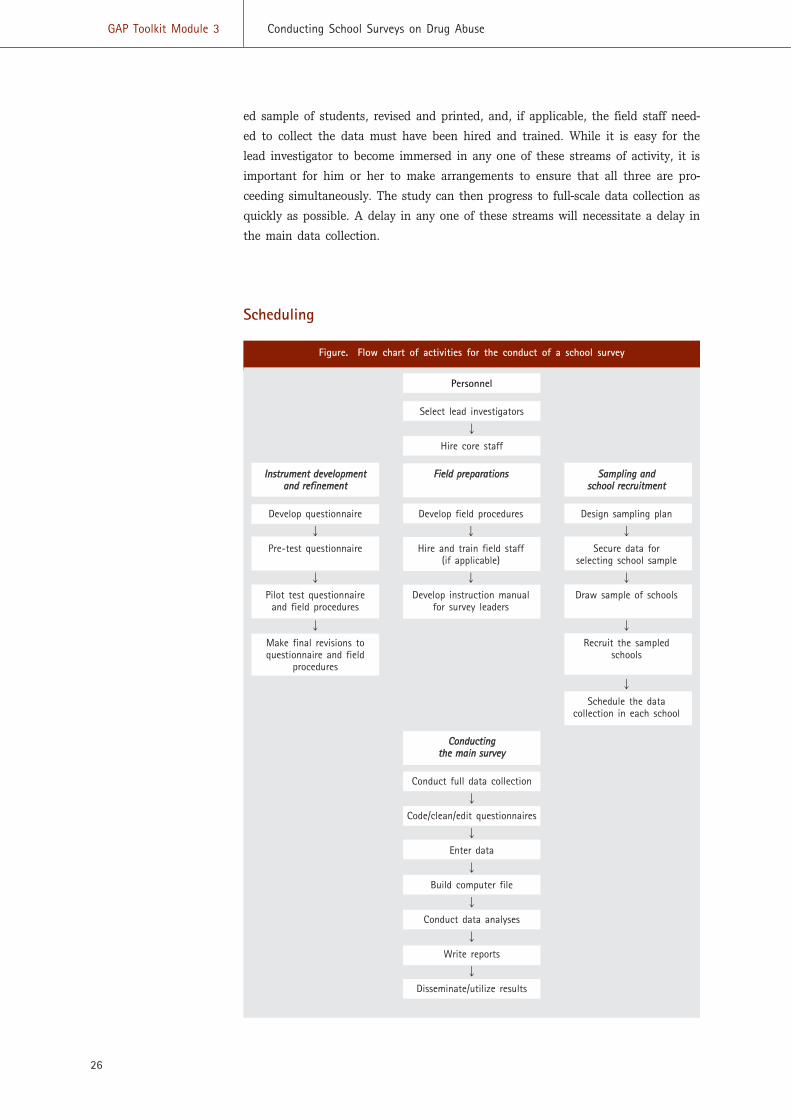
A careful examination of the elements in the flow chart given in the figure will show
that considerable time and expense can be saved by undertaking several streams of
activity simultaneously and by anticipating which tasks need to be completed before
the next steps can proceed. The single most significant event in the flow of work is
the initiation of the data collection in the field, but several streams of activity must
have been completed before that can occur. The sample design and sample selec-
tion based on that design must have been completed and the resulting sample of
schools recruited; the instruments must have been developed, pre-tested on a limit-
GAP Toolkit Module 3 Conducting School Surveys on Drug Abuse
ed sample of students, revised and printed, and, if applicable, the field staff need-
ed to collect the data must have been hired and trained. While it is easy for the
lead investigator to become immersed in any one of these streams of activity, it is
important for him or her to make arrangements to ensure that all three are pro-
ceeding simultaneously. The study can then progress to full-scale data collection as
quickly as possible. A delay in any one of these streams will necessitate a delay in
the main data collection.
Scheduling
Figure. Flow chart of activities for the conduct of a school survey
Personnel
Select lead investigators
�
Hire core staff
IInnssttrruummeenntt ddeevveellooppmmeenntt FFiieelldd pprreeppaarraattiioonnss SSaammpplliinngg aannddaanndd rreeffiinneemmeenntt sscchhooooll rreeccrruuiittmmeenntt
Develop questionnaire Develop field procedures Design sampling plan
� � �
Pre-test questionnaire Hire and train field staff Secure data for(if applicable) selecting school sample
� � �
Pilot test questionnaire Develop instruction manual Draw sample of schoolsand field procedures for survey leaders
� �
Make final revisions to Recruit the sampledquestionnaire and field schools
procedures
�
Schedule the datacollection in each school
CCoonndduuccttiinnggtthhee mmaaiinn ssuurrvveeyy
Conduct full data collection
�
Code/clean/edit questionnaires
�
Enter data
�
Build computer file
�
Conduct data analyses
�
Write reports
�
Disseminate/utilize results
26
27
Chapter III Planning, administration and costs
However, the schedule should not be too abbreviated, since unexpected develop-
ments are bound to arise and cause a delay in the completion of one or another of
these streams of activity. For example, the sampling assistance may take longer than
expected or the instrument may have to be heavily revised after the pre-test. If a
field staff member is being hired, he or she should not be promised work too far in
advance of the date at which the investigators expect to proceed with the data col-
lection, since that will increase costs. Therefore, an effort should be made to make
realistic estimates of the time necessary to complete each of the three streams of
activity. One factor that could have a substantial influence on the preparatory time
necessary is the nature of the school recruitment that must be undertaken.
School recruitment
One item in the right-hand column, "Sampling and school recruitment", of the fig-
ure is the recruiting of the schools chosen to comprise the representative sample. If
their participation is decided by central edict, by, for example, the ministry of edu-
cation, then the process may be fairly rapid. In fact, in such cases it would be ideal
if that central decision-making body were involved from an early stage in the plan-
ning for the survey, so that their willingness to cooperate could be assured. If the
individual schools or school districts have the authority to decline cooperation, how-
ever, then the process of securing school cooperation can be complex and time-con-
suming. The investigator(s) may have to write to each school principal or head
teacher inviting participation, conduct a follow-up call (or possibly a series of calls)
to urge the school's participation and answer questions and may even have to com-
municate with higher authorities at the school district or state or province level if
their approval is also required.
It is often a good idea to ask the principal to assign a contact person who will coor-
dinate the data collection procedure with the research team. Once agreement to
cooperate is obtained, arrangements for the administration of the questionnaires at
the school can be made in a later call to the school. Because the school-recruiting
process can take considerable time, it is advisable to give it due consideration in
the planning of the study's calendar. In addition, time must be allowed for staff to
make the necessary arrangements for the administration of the questionnaires at a
mutually agreed date, and to organize the timely arrival of the questionnaires and,
if necessary, the staff at the school.
Data collection
Once the main data collection is proceeding, the investigators responsible should be
carefully monitoring the quality of the data being collected to ensure that those col-
lecting the data in the field are following instructions and to identify as early as
possible any problems that might need to be rectified. Planning for the coding and
editing of the data coming back can also be put in motion, to deal with any infor-
28
GAP Toolkit Module 3 Conducting School Surveys on Drug Abuse
mation being gathered that is not already in numerical form and to ensure that prob-
lem data are cleaned up in advance of being entered in the computer. If time per-
mits, the investigators can begin planning the analyses that they would like to
conduct at the completion of data collection and data cleaning (see chapter VIII for
further details).
Analysis and reporting
Analysing the data that result from the survey and writing the report(s) based on
those analyses are important elements in conducting a survey and they are often
not accorded the attention they deserve because not enough time and resources were
set aside for them at the outset of the study. Sufficient time should be allowed for
the analysis, interpretation and reporting of results. For this stage of the survey,
only the lead investigator(s) and an analyst or two are normally needed on the study
staff, with perhaps the addition of a secretary. The costs of this stage of the survey
are therefore considerably lower than those of the earlier stages.
Dissemination and utilization activities
Once the report has been completed, arrangements should be made to bring it to
the notice of people likely to be influenced by its results. In addition, the lead inves-
tigators may wish to arrange meetings with certain groups or make presentations to
particular audiences to whom the work has relevance. Again, time should be allowed
for this final stage of the survey process.
Ethical considerations
In addition to the practical issues that have been discussed up to this point, there
are several ethical considerations involved in this type of research that can have
implications for some of the methods used. Nearly all school surveys of student sub-
stance use promise the respondents (and sometimes their parents and schools) that
their student data will remain completely confidential or completely anonymous.
Investigators have a responsibility to keep that promise and to do so requires a num-
ber of steps. If the data are completely anonymous, that is, there is no identifying
information on a student's questionnaire, then the main effort to protect student
confidentiality should be directed at the individuals collecting the data in the school.
Teachers, for example, would be able to identify an individual in the class by look-
ing at the pattern of answers to various factual questions, such as gender, age, eth-
nicity, parental characteristics, and so forth. That makes it imperative that a
procedure be put in place to prevent teachers from being able to look through the
questionnaires, even if they appear to be anonymous. In many countries, for exam-
ple, the students are provided with an "anonymity envelope", inside which they can
seal the questionnaire upon completion (see chapter VII for further details).
29
Chapter III Planning, administration and costs
If information identifying the respondent is recorded on the questionnaire, such as
the name, address and so forth, then arrangements to ensure confidentiality should
be built in at all stages of the handling of the questionnaires. Whenever possible,
at the earliest possible stage the identifying information should be stored separate-
ly from the answers to the rest of the questionnaire, with some type of link system
used if there is a compelling reason to retain that information.
Schools may also be promised that their data will not be released publicly or to
higher authorities. In that case, investigators also have a responsibility to keep that
promise. Even if no such assurance has been given in advance, publicly identifying
individual schools may attract criticism of the institutions that facilitated the com-
pletion of the research project. Investigators should therefore reflect carefully before
proceeding with any such plan to release information. Creating difficulties for the
participating schools may make it more difficult to obtain cooperation in the future
for a similar survey.
Finally, in some cultures the school is given authority to act on behalf of the par-
ents in relation to decisions affecting their children, such as their participating in a
drug survey. In other cultures, the parents retain these rights, such that the ques-
tion of parental notification and consent arises. Two means are commonly used to
accomplish parental notification and obtain consent. Most common is the procedure
called passive parental consent, although it could just as appropriately be called
active parental dissent, in which the parents are notified of the research and given
the opportunity to reply to the school only if they object. The other procedure is
called active parental consent whereby a signed, written note conveying permission
must be returned to the school or investigator by the parent (see chapter VII for
further discussion of this issue).
References
1. T. Bjarnason, "Administration mode bias in a school survey on alcohol, tobacco, and
illicit drug use", Addiction, vol. 90, No. 4 (April 1995), pp. 555-560.
2. L. D. Johnston, "General population surveys of drug abuse", in Guide to Drug Abuse
Epidemiology (Geneva, World Health Organization, 2000).

Overview of methodologicalissuesBjörn Hibell
Chapter IV
31
Conducting a survey is a way of collecting data that would otherwise
be difficult or impossible to collect. A critical question in all surveys
is, of course, whether the answers obtained really reflect the true sit-
uation.
All surveys encounter methodological problems, which have to be con-
sidered when analysing the results. The methodological issues that
will be discussed in the present chapter are representativeness, relia-
bility and validity, issues that are of vital importance to the inter-
pretation of the results. If a survey is not representative of the target
population, its results cannot be used to draw conclusions about that
population. Similarly, measures that are unreliable or invalid will not
provide meaningful information.
Representativeness
The representativeness of a sample refers to the extent to which a
sample mirrors the population of interest. Several factors influence
representativeness of the results. The way in which the samples are
drawn, the size of the samples and the number of schools, classes
and students that agree to participate in the survey are among the
issues that determine the representativeness of a sample.
The target group in a school survey can either be defined as students
born in a specific year or years (birth cohorts) or as students in one
or more specific grade(s). The advantages and disadvantages of the
various ways of defining the target population are discussed in chap-
ter V. It should, however, be stressed that comparisons with data from
other countries are usually easier to make if the target population is
defined by year(s) of birth rather than school grade(s). When students
in a birth cohort are distributed over more than one grade, it is im-
portant that all, or nearly all, relevant grades are represented in the
sample.
32
GAP Toolkit Module 3 Conducting School Surveys on Drug Abuse
The target population in a school survey is, by definition, young people who are still
at school and does not include individuals of the same age who are no longer in
school. It should therefore be kept in mind that student populations do not con-
stitute the entire birth cohort(s). The fact that young people who drop out of school
are likely to use substances at higher rates indicates that the lower the proportion
of young people to be found within the school system, the larger the difference
between the student population and the national population of that age.
Statements about drug use within a country can be useful as long as possible dis-
crepancies in drug habits between students and non-students of the same age are
kept in mind. However, big differences in school attendance between countries may
make it difficult or impossible to make meaningful international comparisons.
Substance-use habits of the student populations of two or more countries may be
compared, even if the proportion of birth cohorts still in school is different in each
country. However, such comparisons become less meaningful as the differences in
school attendance become greater. Hence, if one of the goals of a national school
survey is to make comparisons with data from other countries, it is important to
define a target population where a large majority of the birth cohort(s) can still be
found in school.
For international comparisons, it is important that the age groups compared are the
same and that data are collected at the same time of year. In many international
school surveys, data are collected in spring, often in March or April. If the same
birth cohort is studied in October or November, the students will be about six
months older, which might influence their experience with alcohol or drugs since
the habits of young people can change significantly during a six-month period. If
data in different school surveys are collected at different times of the year, this fac-
tor must be taken into consideration when the results are interpreted.
Random sampling is fundamental to obtaining a sample that is representative of the
population (see chapter V). In most school surveys, the sampling unit is classes.
Sampling students individually in a nationwide sample is usually complicated and
asking only some students in a class to go to a special room to answer a question-
naire will probably have a negative effect on their willingness to answer honestly.
It should be noted that cluster samples of school classes demand special procedures
when confidence intervals and statistical tests are calculated. Although cluster sam-
pling should not affect estimates of how many adolescents have used different sub-
stances (point estimates), it will, in most cases, influence the precision of such
estimates. Hence, it is of vital importance that calculations of confidence intervals
and the measuring of significant differences are done correctly.
To be able to draw conclusions about the national level of substance use or make
international comparisons, the number of sampled classes must be of sufficient size.
The size of the sample is discussed in chapter V and includes considerations about
possible analysis of drug habits in different subgroups. It is important that the num-
33
Chapter IV Overview of methodological issues
ber of students sampled is sufficiently high to permit data to be analysed separate-
ly for boys and girls.
Furthermore, the response rate must be sufficiently high to enable representative
data to be obtained. In school surveys, there are two categories of response rate:
one relates to school or class cooperation and the other to the proportion of par-
ticipating students.
It is important that as many of the sampled schools and classes as possible take
part in the survey. The risk of non-participation can be minimized in various ways,
including giving the head teacher, via telephone calls and letters, clear information
about the study and the sampling and the data collection procedures. (Further infor-
mation on this topic can be found in chapter VII.)
Experiences from large-scale international school surveys such as ESPAD[1] and
Monitoring the Future[2] indicate that the non-participation of schools and classes
is not usually a major problem. However, the rise in the number of school surveys
in some countries has made schools somewhat reluctant to take time off from school-
work to participate in such surveys. Although this has mainly occurred in countries
with a long tradition of school surveys, it highlights the necessity of approaching
sampled schools in a way that makes them feel that they are part of an important
study. If a significant number of schools or classes refuses to take part in the sur-
vey, the representativeness of the sample will suffer. One solution if schools decline
to participate is to seek replacement schools that match them in terms of major
demographic characteristics, preferably from the same general area. (If this is to be
considered, the advice of an experienced survey researcher should be sought.)
Student participation in school surveys should always be voluntary and all ques-
tionnaires should be treated confidentially. In many countries, researchers are
required by law to protect survey participants and for ethical reasons such protec-
tion should be guaranteed regardless of legal requirements. Such guarantees also
increase students' willingness to participate in the survey and answer questions hon-
estly. Means to achieve this include omitting from the questionnaires any require-
ment for names or other kinds of identification to be given, guaranteeing confidential
treatment of questionnaires and data, promising not to report data on individual
students or single classes and supplying each student with an envelope, without any
identifying detail, in which the questionnaire may be sealed after completion (see
chapter VII for further details).
In most school surveys, it is not common for students in school when the data are
collected to refuse to answer the questionnaire. However, it may be expected that,
on average, at least 10 per cent of students will be absent from class due to sick-
ness or other reasons.
In order to be able to interpret the quality of the data collection, it is necessary to
know the proportion of non-participating students. One way of measuring this is to
use a classroom report such as that given in annex II.
34
GAP Toolkit Module 3 Conducting School Surveys on Drug Abuse
Students with poor attendance records are more likely to be involved in substance
use than students who attend school regularly. A follow-up study of students in
Sweden has shown that students with poor attendance records were more involved
in drugs. However, because of the relatively small proportion of such students, the
figures for the population as a whole were unchanged or changed by only one per-
centage point if students absent at the time of the survey were included. In the
Monitoring the Future study in the United States, the corresponding figure was esti-
mated to be two percentage points or less.
If a large number of schools or classes refuses to participate or if the proportion of
participating students is below 80-85 per cent, it is essential to analyse the reasons
carefully. If the non-participating schools or classes seem to be randomly distributed
over the target population, the loss may not have caused any major problems. If,
however, systematic errors can be suspected, for example, that non-participating
schools or classes can be expected to include students that are more likely to have
used drugs or that students refusing to participate come from areas where drug con-
sumption is known to be high, interpretation might be difficult and international
comparisons may be jeopardized.
Reliability
Reliability, which is a necessary condition for validity, is the extent to which repeat-
ed measurements used under the same conditions produce the same result. One way
of measuring the reliability of surveys is to conduct repeated studies. It might also
be possible to assess reliability by using data from different questions within a ques-
tionnaire.
In the ESPAD methodological study in seven countries in 1998, students were asked
questions twice about their use of alcohol and drugs[3]. The interval between the
data collection was 3-5 days. No significant differences in consumption patterns were
found between the two data collections in any of the countries. This was true for
alcohol consumption as well as for drug use prevalence, which indicated that the
reliability was very high in all the participating countries. Similar results with no
significant differences have also been reported from two repeated school surveys con-
ducted in Hungary and Iceland[4], as well as in the United States[2] and in sever-
al countries in Europe and the United States and Canada[5].
Many school survey questionnaires contain more than one question on the same aspect
of drug use, even though the questions are put there for other reasons. An example
can be found in the student questionnaire in annex I. In question 15 the students
indicate at what age (if ever) they smoked a cigarette, drank alcohol or used different
kinds of drugs for the first time. Students who have ticked a box to indicate use of a
substance must have used it at least once in their lifetime. The same kind of infor-
mation is asked for in question 7 on cigarettes, question 9 on alcohol and question
13 on different kinds of drugs and solvents. A high rate of inconsistency between any
35
Chapter IV Overview of methodological issues
of these answers might indicate a lower level of reliability.
Possible reliability problems are obviously a complicating factor when the results are
interpreted at the national level, as well as when they are compared with data from
other countries.
Validity
In all surveys, the question of the validity of the answers arises; of whether those
answers are accurate representations of the underlying reality that they are intend-
ed to measure.
Validity is the extent to which a test correctly measures what it is designed to meas-
ure. In the context of a school survey, the validity could be said to be the degree
to which the questionnaire (including how data are collected) measures the aspects
of students' drug consumption that it was intended to measure. The issue of valid-
ity is of particular importance when sensitive behaviours like drug use are studied.
As in most studies dealing with such behaviours, there is no direct, totally objective
tool for validation.
The European Monitoring Centre for Drugs and Drug Addiction, in a review of drug
use studies, concluded that there were indications that self-report methods for sub-
stance use were as reliable and valid as for most other forms of behaviour[6].
Harrison (1997) concluded that self-administered questionnaires (which is the kind
of data collection method used in school surveys) tended to produce more valid data
than interviews[7].
In a discussion on the validity of the Monitoring the Future school surveys in the
United States, Johnston and O'Malley (1985) concluded that a considerable amount
of inferential evidence from the study of twelfth-grade students suggested that self-
report questions produced largely valid data[8].
In the ESPAD methodological study conducted in 1998, students in seven countries
took part in two data collections, carried out at 3-5 day intervals[3]. The second
questionnaire included questions on how truthfully the students had answered the
first time and how truthfully they thought their classmates had answered. The study
also included a short questionnaire to be answered by the survey leaders. The main
conclusion was that the validity was very high in all seven countries. It can be con-
cluded that, if standard methodological procedures are used, school surveys should
yield valid data.
If there is reason to doubt the validity of a school survey, international comparisons
should be made with considerable caution. However, if it is believed that any bias
due to errors is stable across groups in the survey or across different years, it may
still be possible to obtain useful information from the survey. For example, if there
36
GAP Toolkit Module 3 Conducting School Surveys on Drug Abuse
is reason to assume that the validity problems within a single country are roughly
of the same kind over time, it might be possible to study the trends across surveys,
bearing in mind that the validity of the actual figures (point estimates) might be
doubtful. The same argument can also be used to allow for comparisons between
subgroups within a single study.
To ensure the validity of school surveys it is essential that the studies guarantee the
anonymity and confidentiality of the respondents. There are various ways of mak-
ing students feel comfortable in responding, one of which is to use a data collec-
tion leader trusted by the students. In the survey leader introduction, as well as on
the front page of the questionnaire, the students' anonymity should be stressed.
Another way of making the students feel comfortable is to provide an envelope in
which each student can seal their completed questionnaire. Most importantly, no
names or other identification marks should be on the questionnaire or the envelope
(more details can be found in chapter VII and annex I).
The following validity aspects should be considered: the students' willingness to coop-
erate, student comprehension, missing data rates, logical consistency, reported will-
ingness to answer honestly, exaggerated drug use, construct validity and the cultural
context in which a survey is conducted. Many of these aspects can be measured; for
example, a non-existent drug can be included to measure possible exaggeration of
drug use.
A necessary condition for obtaining valid data, of course, is that the students in the
selected classes receive the questionnaires and are willing to respond to them. They
will not receive the questionnaires if the school or the teacher refuses to cooperate.
The students must also have enough time to answer the questionnaire, they must
understand the questions and must be willing to answer them honestly.
As stated earlier, participation in school surveys must be voluntary. However, experi-
ence from past school surveys indicates that very few students refuse to participate.
It is important to inspect the questionnaires before data are entered and to check
for unrealistic answers (see chapter VIII). The number of eliminated questionnaires
is important information that should be included in the survey report.
Information about student cooperation may also be collected in the classroom report.
The example provided in annex II includes questions about disturbances and the
survey leader's opinion of whether the students showed an interest in the study and
whether their response was serious.
In order to encourage students to complete the questionnaire, it is important that
it is not too long (see chapter VI). One means of checking whether a questionnaire
is too long and time-consuming is to conduct a pre-test. In addition, the time taken
to answer the final questionnaire should be recorded; this can be done in the class-
room report (annex II).
37
Chapter IV Overview of methodological issues
A large proportion of unanswered questions may indicate validity problems. Hence,
it is important to count and report the proportion of questions not answered by the
students.
Logical consistency is closely related to the inconsistency measures discussed in the
reliability section. In school surveys, this might be relevant for drug questions meas-
uring the prevalence for the three time periods of "lifetime", "last 12 months" and
"last 30 days". Logically, frequency or prevalence of the last 12 months cannot exceed
the lifetime frequency or prevalence. The same is true for the last 30 days compared
with the last 12 months and lifetime prevalence. Whenever relevant, logical consis-
tency should be measured and reported.
In school surveys about drugs, the question of validity includes concern about the
students' willingness to give true answers to the questions asked. Social desirabili-
ty is an important methodological problem in all surveys, that is, the desire to give
the kind of answers that the respondents think the researcher wants to hear or that
gives a good impression, even if some of the answers are not correct. It seems rea-
sonable to assume that the less socially acceptable a behaviour is, the higher is the
motivation to deny it. Thus, the use of anonymous questionnaires and individual
envelopes is mainly motivated by a desire to minimize the social desirability effect.
One way of measuring the students' willingness to report drug use that has been
used in some surveys is asking the hypothetical question, "If you had ever used mar-
ijuana or hashish (a similar question for heroin or other drugs can be added), do
you think that you would have said so in this questionnaire?" with the response cat-
egories "I have already said that I have used it", "Definitely yes", "Probably yes",
"Probably not" and "Definitely not". Despite the difficulties of interpretation, such a
question might be useful for the purpose of checking validity.
In surveys, there is always a risk of respondents not answering honestly. It is usu-
ally assumed that this might lead to underreporting ("faking good"). However, in
school surveys one cannot rule out overreporting ("faking bad"), that is, that stu-
dents report that they have used a drug even if they have not. To test for this, the
name of a non-existent drug can be included in the list of drugs in the question-
naire. In the suggested questionnaire provided in annex I the non-existent drug
Relevin is included in questions 11-16. If reported use of the non-existent drug is
low, it indicates that students do not exaggerate their drug use.
Using existing theories, the results of earlier studies and common sense, the rela-
tion of variables to each other can be inferred (construct validity). In the six-coun-
try pilot study initiated by the Pompidou Group of the Council of Europe, construct
validity was discussed extensively[5]. The report on the study concluded that there
was considerable evidence of construct validity in the school surveys under study.
During the ESPAD study, conducted in 1995, construct validity was measured by
comparing the proportion of students in a country who had used a drug with the
38
GAP Toolkit Module 3 Conducting School Surveys on Drug Abuse
proportion reporting drug use among friends. For lysergic acid diethylamide (LSD),
as well as for cannabis and alcohol, the relationship was very high[4].
To make the results of a national school survey as comparable as possible with data
from other countries, it is important that the survey protocols, including the target
population, the representativeness of the sample, the data collection procedure and
the questionnaire are standardized as much as possible. However, it is not possible
to standardize every detail. This holds true also for the cultural context in which the
students have given their answers. One example is the way that questions are under-
stood by students in different cultural settings. In conducting comparative research
of populations using different languages, it is important to use one language for the
standard questionnaire. For example, if English is used for the standard question-
naire, it should be translated into each of the other languages and then the translat-
ed questionnaire should be translated back into English by a different translator. The
original English version and the "double-translated" English versions can then be com-
pared to check for any translation problems. It is also important that the questions
are culturally or locally appropriate: for example, the appropriate "street names" or
"nicknames" used for different drugs should be employed.
Another aspect of the cultural context is the extent to which the willingness to give
valid answers differs among countries. The willingness to admit to drug use may be
influenced by the attitudes towards drugs in a given society. Data show that per-
ceived risk of substance use and disapproval of different kinds of substance use dif-
fer among countries. The same is true of the availability of different drugs. Taken
together, these results indicate that the social desirability may also vary between
countries. Thus, in a country with low availability and negative attitudes towards
drugs, a student might be less willing to admit drug use than a student in a coun-
try with high availability and positive attitudes towards drugs.
Similar aspects may also be relevant when considering that, in some countries, drugs
and drug use are often mentioned in mass media and discussed at school, while the
situation may be the opposite in other countries.
Finally, some countries have a long tradition of school surveys while others have no
such tradition. Students in countries where such surveys are less common may feel
less comfortable answering questions about sensitive behaviours. If that is the case,
the willingness to answer honestly may differ among countries.
To conclude, experiences from ESPAD, from the ESPAD methodological study and
from the six-country study initiated by the Pompidou Group all indicate that the
influence of the cultural context should not be overestimated. However, possible dif-
ferences in the cultural context and other methodological differences can make it
difficult to draw firm conclusions about significant differences between countries if
the differences in prevalence figures are small. If the importance of the cultural con-
text and other methodological aspects is assessed to be large, even large differences
in prevalence figures between countries must be treated very carefully.
39
Chapter IV Overview of methodological issues
Checklist for survey methodology
(a) Representativeness:
(i) Define target population;
(ii) Assess importance of non-students in same age groups as target
population;
(iii) Decide proper time for data collection (if international compar-
isons planned);
(iv) Assess importance of non-participating schools or classes;
(v) Assess importance of non-participating students;
(b) Reliability:
Assess reliability (whenever possible, by using data from different
questions);
(c) Validity:
(i) Ensure anonymous and confidential data collection;
(ii) Measure and report:
a. Number of eliminated questionnaires;
b. Information provided by the survey leader (in the classroom
report);
c. Time taken to answer the questionnaire;
d. Proportion of unanswered questions;
e. Logical consistency;
f. Construct validity;
(iii) Consider use of:
a. A "willingness question";
b. A non-existent drug;
(d) Assess role of cultural context.
References
1. B. Hibell, B. Andersson, S. Ahlström, O. Balakireva, T. Bjarnason, A. Kokkevi and
M. Morgan, The 1999 ESPAD Report: Alcohol and Other Drug Use Among Students in
30 European Countries (Stockholm, Swedish Council for Information on Alcohol and
Other Drugs, 2001).
2. L. D. Johnston, P. M. O'Malley and J. G. Bachman, Monitoring the Future National
Survey Results on Drug Use, 1975-2001: Volume I: Secondary School Students, National
Institutes of Health publication No. 02-5106 (Bethesda, Maryland, National Institute on
Drug Abuse, 2002).
3. B. Hibell, B. Andersson, O. Balakireva, A. Davidaviciene, R. Muscat, A. Nociar, S. Sabroe
and K. Veresies, "Do they tell the truth? A methodological study in seven countries
about the validity in school surveys", manuscript (2000).
4. B. Hibell, B. Andersson, T. Bjarnason, A. Kokkevi, M. Morgan and A. Narusk, The 1995
ESPAD Report: Alcohol and Other Drug Use Among Students in 26 European Countries
(Stockholm, Swedish Council for Information on Alcohol and Other Drugs, 1997).
5. L. D. Johnston, F. Driessen and A. Kokkevi, Surveying Student Drug Misuse: A Six-
Country Pilot Study (Strasbourg, Council of Europe, 1994).
6. European Monitoring Centre for Drugs and Drug Addiction, Evaluation Instruments Bank:
Prevention (Lisbon, EMCDDA, 1997) (available at http://eibdata.emcdda.eu.int/
databases_eib.shtml).
7. L. Harrison, "The validity of self-reported drug use in survey research: an overview and
critique of research methods", in L. Harrison and A. Hughes, eds., The Validity of Self-
Reported Drug Use: Improving the Accuracy of Survey Estimates, National Institute on
Drug Abuse research monograph No. 167 (Rockville, Maryland, United States, National
Institute on Drug Abuse, 1997).
8. L. D. Johnston and P. O'Malley, "Issues of validity and population coverage in student
surveys of drug use", in B. Rouse, N. Kozel and L. Richards, eds., Self-Report Methods
of Estimating Drug Use: Meeting Current Challenges to Validity (Washington, D.C.,
National Institute on Drug Abuse research monograph No. 57, 1985).
40
GAP Toolkit Module 3 Conducting School Surveys on Drug Abuse

Sampling issues in schoolsurveys of adolescentsubstance useThoroddur BjarnasonChapter V
41
A correctly drawn sample of students can provide a fairly accurate
estimate of substance use and other behaviours in a given school pop-
ulation, although such estimates will rarely coincide exactly with the
actual prevalence in the population. The difference between the
responses obtained from any given sample and the responses that
would have been obtained if the entire population had been surveyed
is known as sampling error. Sampling error can be generated by ran-
dom fluctuations in the sample drawn or by a systematic bias in the
way the sample is drawn. Estimates based on smaller samples will,
in general, fluctuate more from the population parameters and are
therefore less precise than estimates based on larger samples.
Increasing the sample size will therefore, to some extent, increase the
precision of population estimates. However, increased sample size can-
not compensate for the systematic bias of a sample that does not
accurately reflect the population under study. In other words, an incor-
rectly drawn sample will produce biased estimates of behaviours in
the population, regardless of the size of the sample or the quality of
other aspects of the survey project.
Obtaining unbiased and precise estimates is a crucial aspect of any
survey project and requires the careful planning and implementation
of a sound sampling strategy. Different types of survey require spe-
cialized sampling strategies and expertise in one type of survey does
not necessarily translate directly to other types of survey. A brief
overview of school survey sampling is given below. This overview
should not be considered sufficiently detailed to serve as a sampling
manual for a first-time school survey researcher. A more comprehen-
sive treatment of these issues can be obtained from various sources,
including from the reference material listed at the end of the present
chapter. Researchers who do not have prior experience of school sur-
vey sampling should therefore consult with colleagues with special-
ized expertise in the area when developing a sampling strategy for
such surveys.
42
GAP Toolkit Module 3 Conducting School Surveys on Drug Abuse
Target population
The first step in sampling should be to generate a clear definition of the population
of interest. In school surveys, it is particularly important to draw a distinction
between the population of students in a given age group and the total population
of individuals in that age group. School-age adolescents may, for a variety of rea-
sons, not be attending compulsory school. They may be suffering from severe men-
tal or physical illnesses or disabilities, or they may be compelled to leave school for
various social or economic reasons. They may also have left school as a result of
substance use problems or other problem behaviours. In the case of adolescents
beyond the age of compulsory school, substantial numbers may have completed their
studies and may therefore fall outside the target population of students.
The pattern of substance use in each of these groups may differ significantly from
the school population and research among such groups should be encouraged. Non-
students should, however, be excluded from the definition of the target population
in school surveys. In other words, the population under study should be defined as
the population of students in the target age group, not the national population of
individuals in that age group. Furthermore, the definition of the target population
must clearly indicate the school systems covered, the age group included and the
time of year during which the population is defined.
Restricting the target population to students implies that the results obtained can
only be representative of this group and considerable caution should be exercised
in generalizing findings to the age group as a whole. However, if the majority of ado-
lescents in a given age group are to be found in schools, tentative conclusions can,
for policy purposes, be drawn about the age group as a whole. For example, con-
sider a school system where 90 per cent of those born in a given year are enrolled
in school, the level of daily smoking among students is 30 per cent and the level of
daily smoking among non-students is 60 per cent. In this case, responses from stu-
dents can clearly not be generalized to non-students. However, given the small size
of the non-student group, smoking among students (30 per cent) will be close to
the level of smoking in the age group as a whole (33 per cent).
School systems
The target population must be defined in terms of the national school system in
each country. On the national level, schools may be divided into several distinct
school systems, such as public schools, secular or religious private schools, schools
based on ethnicity or language, vocational or academic schools or schools for the
disabled. In some countries, different categories of student may also attend school
at different times of day. The bulk of students may, for example, attend classes dur-
ing the day, while non-traditional students in the target age group may be enrolled
in evening classes. In some cases, researchers may not have the resources or per-
mission to include all school systems in their survey. In such cases, the target pop-
43
Chapter V Sampling issues in school surveys of adolescent substance use
ulation must be redefined accordingly. Such restrictions reduce the generalizability
of findings, but do not reduce the reliability or validity of estimates for the target
population.
Age groups
The definition of the target population for a school survey should clearly identify
which groups within the school are included in this population. In some school sys-
tems, students are assigned to grades according to their year of birth; in other sys-
tems, they are assigned to grades according to their age on their last birthday.
Furthermore, some school systems assign students to grades by performance rather
than age, or allow students to choose classes irrespective of age group. The choice
of groups to be included in the study dictates the conclusions that can be drawn
from its results.
In some cases, researchers may want to define their target population on the basis
of system-specific definitions of cohort or grade. However, using year of birth as a
definition of the target population has several advantages. First, birth cohort is inde-
pendent of school performance, which may be strongly related to substance use and
other risk behaviours. Second, estimates of substance use in a given birth cohort
may help future research identify the same target population at later stages of life.
Finally, year of birth provides a clear definition that is independent of school sys-
tems and such a definition therefore greatly facilitates cross-national comparisons.
Time of year
The target population should be defined at a specific time of the school year. The
school population changes somewhat over the school year, as students move between
school districts or drop out of school altogether. Furthermore, students in a specif-
ic grade or cohort are almost a year older at the end of the school year than they
were at the beginning of the year and their substance use will, in general, increase
with age. Results from a study conducted at the beginning of a school year are thus
not strictly comparable over time or across countries to results from a study con-
ducted at the end of a school year.
Within the school year, there may also be certain periods that are unsuitable for
school surveys. Researchers should, in particular, avoid conducting surveys on sub-
stance use immediately following major holidays or at other times that may be char-
acterized by increased substance use among adolescents in any particular country.
For instance, school surveys should not be conducted in the first two weeks of the
calendar year if substance use associated with New Year celebrations is expected to
inflate students' estimates of their overall patterns of substance use. It is also advis-
able to avoid conducting school surveys immediately before national examination
periods. In such periods, school administrators, teachers and students may be less
44
GAP Toolkit Module 3 Conducting School Surveys on Drug Abuse
cooperative than during regular periods and substance use may be temporarily lower
than during regular periods.
The best time of year to conduct school surveys may therefore differ among coun-
tries. However, several large-scale international school survey projects take place in
March or April. Defining the target population at this time will therefore facilitate
international comparisons with national survey projects.
Sampling frame
The sampling frame of school surveys refers to all students who have a known (non-
zero) probability of being included in the sample. It should correspond as closely as
possible to the conceptual definition of the target population. The level of detail
available to generate a sampling frame can vary significantly between countries and
the methods of sampling will depend in part on the sampling frame that can be
generated. A comprehensive sampling frame would include a roster of students with-
in each class in each school in each school district within each school system of a
given country, as well as relevant information about each of these units. In reality,
such a comprehensive sampling frame is rarely available and generating such a frame
may be prohibitively difficult and expensive. Representative samples can neverthe-
less be drawn from less complete sampling frames.
The information available to construct a sampling frame will, in part, depend upon
the centralization of school systems, the level of detailed information they collect on
schools and the availability of such information to researchers. In some cases, all
the information necessary for a national sampling frame will be available from a sin-
gle source. In other cases, this information must be gathered from different inde-
pendent school systems or regional offices. In extreme cases, the information needed
can only be obtained directly from each school. The feasibility of gathering infor-
mation on each level will depend upon the size and complexity of the school sys-
tems, as well as the resources available to researchers. In some cases, the sampling
frames available for different school systems within a single country may be differ-
ent and may require different sampling methods within each system. This will com-
plicate the sampling frame considerably, but will not necessarily diminish the quality
of the sample.
Available sampling frames will frequently include students who do not fall within
the targeted age groups. If instructional groups are not strictly based on age, it will
be necessary to sample from a list of all classes where the target age group can be
found. In systems where students are grouped by year of birth, there may also be
some students who are older or younger than the definition of the target popula-
tion. It is therefore sometimes necessary to sample a considerable number of indi-
viduals who do not belong to the target population. In such cases, the sample size
must be increased by the proportion of students outside of the target age group that
45
Chapter V Sampling issues in school surveys of adolescent substance use
the research team expects to encounter in the sample. Once the data has been col-
lected, individuals who do not belong to the target population should be dropped
from the sample or treated as a separate population.
The target population should be defined as students at the time of the survey.
However, the information available to construct the sampling frame is frequently
generated at the beginning of the semester or the beginning of the school year. In
most cases such figures are sufficient to generate a robust sampling frame. However,
in order to calculate correct rates of non-response, updated information should be
collected at the school level in the process of sampling or during data collection (see
chapter VIII).
Sample size
The sample size needed in school surveys depends upon the precision of estimates
desired. It should be emphasized that the precision of estimates is, in general, not
related to the size of the target population. Regardless of population size, a correctly
drawn sample of 2,000-3,000 students will yield rather precise estimates of substance
use in a target population. A larger sample will increase the precision of these esti-
mates for the population as a whole, but such precision grows successively slower
as the sample size increases. For example, consider a simple random sample from
a target population where 15 per cent of the students have used cannabis. Regardless
of the size of the target population, a correctly drawn sample of 100 students could
be expected (with 95 per cent probability) to yield a population estimate of the
prevalence of cannabis use between 8.0 per cent and 22.0 per cent. Increasing the
sample size would increase the precision of the estimate as follows: 1,000 students,
by between 12.8 and 17.2 per cent; 2,000 students, by between 13.4 and 16.6 per
cent; 4,000 students, by between 14.9 and 16.1 per cent; 10,000 students, by between
14.3 and 15.7 per cent. Cluster samples will almost always be less precise than sim-
ple random samples of the same size. The difference in precision can, however, only
be determined empirically and may differ between samples and between different
measures of substance use. Increasing the sample size can, however, allow more pre-
cise estimates for subgroups of gender, region, ethnicity or other distinctions of inter-
est. As discussed below, such increased precision for specific groups can, in some
cases, be obtained at a lower cost by the use of disproportionate stratified sampling.
Researchers may consider increasing the size of their sample to counteract the loss
of precision caused by the sampling method. Each of the methods discussed below
will, in general, yield less precise estimates than a simple random sample of indi-
viduals. A proportionate stratified sample of classes may prove to be more precise
than a simple random sample of classes, but sample size should not be reduced for
the sake of such expected benefits. This loss of precision will become greater as
individuals are more homogeneous within sampling units than across sampling units.
Increasing sample size can compensate for this problem, but the extent of the prob-
46
GAP Toolkit Module 3 Conducting School Surveys on Drug Abuse
lem cannot be predicted, although earlier school surveys in the country may give
some indication. Research teams should, in particular, consider increasing their sam-
ple size if they will be employing two-stage cluster sampling.
Sampling method
A robust sample can be drawn from a wide variety of sampling frames, and, if cor-
rectly implemented, different sampling methods will yield equally unbiased estimates.
Each sampling method must, however, involve a known probability of selection for
each unit in the sampling frame and the sampling units must be randomly chosen.
The choice of sampling method will depend, in part, on the nature of the sampling
frame that can be generated, and in part on the resources available for the project.
Each sampling method will produce a different data structure, which will influence
the ways in which the data can be analysed.
The school class as a sampling unit
From a statistical standpoint, the smaller the unit of sampling (the closer to direct-
ly sampling individual students), the more precise will be the estimate generated.
Randomly selecting entire classes for participation in a school survey is known as
cluster sampling. This procedure will yield statistically less precise estimates than
randomly selecting individuals. This loss of precision can be calculated by the extent
to which students within each class tend to have similar patterns of substance use.
However, there are important practical and methodological advantages to sampling
classes rather than students. In school surveys, it is easier to obtain a list of class-
es than a list of students. Similarly, approaching an entire class of students, sitting
at their desks, pencil in hand, is much easier than tracking down individuals and
administering the questionnaire to each one of them. From the perspective of the
school, sampling classes also involves far less disruption of the normal operations
of the school than individual-level sampling of students. Furthermore, selecting an
entire class rather than individuals from the class contributes to a greater sense of
anonymity. Finally, sampling entire classes allows researchers to estimate the extent
to which the substance use of individuals is affected by their classmates as a group.
Using classes as the final sampling unit is therefore the preferred sampling method
in most school surveys. Such sampling of classes can be done in a variety of ways,
including random sampling, two-stage random sampling, stratified random sampling
and total population sampling. In addition, these different methods can be combined
in a variety of ways within a single sampling strategy. Regardless of the type of sam-
pling employed, it is crucial that the classes be randomly selected within each school.
In particular, researchers should be alert to the risk of school administrators want-
ing to choose a "good" class to represent their school in the sample.
47
Chapter V Sampling issues in school surveys of adolescent substance use
The number of classes to be sampled depends upon the desired sample size and the
average number of students in each class. For example, a sample of 125 classes
would be required to sample approximately 3,000 students in a school system where
the average class size is 24 students.
Random sampling of classes
If an exhaustive list of all classes in the sampling frame is available, classes can be
randomly sampled from this list. In the more complex sampling designs discussed
below, the final step involves such a random sampling of classes. It is important to
ensure that the same students are not sampled multiple times in different classes.
This can be particularly problematic in schools where students are congregated in
different instructional groups for different study subjects. In such cases, it may be
necessary to sample classes within a single class period.
Cluster sampling of classes can be achieved either by simple random sampling or
systematic random sampling. A simple random sample can be drawn from a com-
plete list of classes by the use of random number tables or the pseudo-random num-
ber generator available in most statistical software packages. A systematic random
sample only requires the first class in the list to be randomly selected, while sub-
sequent classes are chosen at fixed intervals after the first class. The interval between
classes sampled in a systematic random sample is determined by the total number
of classes and the desired number of classes to be sampled. For example, to sam-
ple 125 classes from a list of 1,000 classes, the researcher would randomly choose
one of the first eight classes on the list and then systematically sample every eighth
class on the remaining list. Simple random samples and systematic random samples
can, for all practical purposes, be treated as having the same sampling properties.
The systematic random sample is somewhat simpler to draw, but researchers should
be alert to cyclical patterns in the list of classes that would lead one type of class
to be systematically more frequently drawn than other types of classes.
Random class samples can also be drawn in cases where only the approximate num-
ber of classes in each school is known. In such a case, the sampling list would con-
tain proxy names for each class. On site, an alphabetically ordered class list would
then be obtained and the class corresponding to the proxy number would be chosen.
It should be noted that a random sampling of classes will lead to an overrepresen-
tation of students in small classes, as they individually have a larger probability of
selection than students in large classes. In most cases, this will only cause a very
minor bias in results. If classes vary substantially in size within schools, researchers
should consider sampling proportional to class size, or weighing the responses by
class size in the statistical analysis. This will depend upon the distribution of class
sizes within the sampling frame. However, researchers should consider taking class
size into account if the standard deviation is more than one half of the mean class
size (see chapter VIII).
48
GAP Toolkit Module 3 Conducting School Surveys on Drug Abuse
Two-stage random sampling of classes
In some cases, the research team may be forced to reduce the number of schools
included in the sample because of wide geographical dispersion or limited resources.
Although it would be possible to use schools as the final sampling unit (sampling
all the students in a chosen school), this is not advisable given the substantial loss
of precision involved. In these cases, it is preferable to draw a random sample of
schools and then randomly sample classes within the schools chosen. This will yield
less precise estimates than randomly sampling classes, but the estimates will be
more precise than if entire schools were sampled. The greater the number of schools
sampled at the first stage, the greater the precision of the estimates will become.
The loss of precision in two-stage sampling will depend upon the distribution in the
sample. However, as a tentative rule of thumb, researchers should aim to sample no
more than two classes per school.
If a simple random sample of schools is drawn at the first stage, the probability of
any given student being included in such a sample will vary inversely with the size
of the school. In other words, each student in a large school will have a smaller
chance of being included in the sample than a student in a small school. If schools
vary substantially in size, this must be taken into account in sampling. Similar to
class size, this will depend upon the distribution of school sizes within the sampling
frame. Again, researchers employing two-stage random sampling of classes should
consider taking school size into account if the standard deviation is more than one
half of the mean school size. This can, for example, be achieved by sampling schools
proportionate to school size or by stratifying schools by size and then sampling
schools within each stratum (see section on stratified random sampling below).
Stratified random sampling of classes
In some cases, researchers may wish to draw several samples of schools or classes
within clearly defined categories of shared characteristics. Such shared characteris-
tics could involve belonging to distinct school systems, belonging to a specific geo-
graphical region, being situated in urban or rural areas, school size or other clearly
defined characteristics. Such stratification, in effect, involves drawing separate sam-
ples from a sampling frame of each category of school or class. In proportionate
stratified samples, the proportion of schools or classes drawn within certain cate-
gories is equal to their proportion in the target population. In disproportionate strat-
ified samples, the proportion of schools or classes drawn within certain categories
is greater than their proportion in the target population.
In the case of proportionate stratified sampling, the final sample will accurately
reflect the target population. Such a stratified sampling of classes will not yield less
precise estimates than randomly sampling from a list of classes. On the contrary,
such a stratified random sample can be shown to yield more precise results than a
simple random sample, to the extent that there is less variation in substance use
49
Chapter V Sampling issues in school surveys of adolescent substance use
or other behaviours of interest within each category than in the population as a
whole.
Disproportionate stratified sampling allows researchers to generate more precise esti-
mates for a specific subpopulation of interest by drawing a larger sample from this
category. For instance, a minority group that only constitutes 5 per cent of the pop-
ulation would, on average, only yield 100 individuals in a random sample of 2,000
students. In order to generate precise estimates of such a minority group, researchers
may choose to draw a disproportionately large sample from schools where this group
is concentrated. In such a case, it is essential to weight the results so that they
reflect the actual composition of the population (see chapter VIII).
Disproportionate stratified random sampling may lead to more precise or less pre-
cise estimates for the population as a whole than a sample of classes, depending
upon the distribution within and across categories. As the calculation of weights can
also be quite complicated, there should be compelling substantive reasons for con-
sidering disproportionate stratified random sampling and the research team must
have the means to correctly calculate the sampling weights.
Total population sampling
Total population sampling refers to a special situation that arises in school surveys
in small nations or small geographical areas. When the target population of students
is small, the organizational complexities and cost of sampling may become greater
than surveying the entire target population. Researchers may thus choose to survey
the entire population. This will eliminate sampling errors entirely, but does not affect
response errors or errors due to systematic attrition. Such sampling should be seri-
ously considered when the target population is small (for example, 10,000 students
or less) or when the intended sample constitutes 20 per cent or more of the target
population.
Checklist for sampling
(a) Defining the target population:
(i) School systems, types of schools and types of class to be includ-
ed;
(ii) Age groups or grades to be included;
(iii) Time of year to be chosen for the survey to be conducted;
(b) Generating a sampling frame:
(i) School system information:
a. Types of school system (for example, public, private, reli-
gious);
50
GAP Toolkit Module 3 Conducting School Surveys on Drug Abuse
b. Geographical divisions within each system (districts or other
divisions);
c. Types of school within each system (for example, academic,
vocational, special education);
(ii) School information:
a. Contact information (school name, name of principal or other
contact, address, phone number);
b. Type of school (for example, academic, vocational, special edu-
cation);
c. Number and types of class within school (for example, aca-
demic, vocational, special education);
(iii) Class information:
a. Class identifier;
b. Type of class (for example, academic, vocational, special edu-
cation);
c. Number of students in class;
(c) Some sampling strategies:
(i) Random sampling of classes (sampling classes from a list of all
classes in country):
a. Consider whether class-level information is available;
b. Consider whether geographical dispersion of classes is not
problematic;
(ii) Two-stage sampling of classes (sampling schools, then classes
within those schools):
a. Consider whether class-level information is not available;
b. Consider whether geographical dispersion of classes is prob-
lematic;
(iii) Proportionate stratified sampling of classes (sampling classes with-
in groups of similar schools or classes):
a. Consider whether class-level information is available;
b. Consider whether schools can be clearly divided into sub-
stantively different categories;
(iv) Disproportionate stratified sampling of classes (oversampling cer-
tain types of schools or classes):
a. Consider whether precise estimates are needed for minority
groups within the population;
b. Consider whether expertise in calculating weights is present;
(v) Total population sampling (sampling every student in a given age
group):
a. Consider whether total population in target age group is
10,000 or fewer students;
b. Consider whether the proposed sample is one fifth or more
of the total population in the target age group.
51
Chapter V Sampling issues in school surveys of adolescent substance use
Further reading
T. Bjarnason and M. Morgan, Guidelines for Sampling Procedures in the School Survey Project
on Alcohol and Other Drugs (Stockholm, Swedish Council for Information on Alcohol
and Other Drugs, 2002).
F. J. Fowler, Survey Research Methods (Newbury Park, California, Sage, 1993).
R. M. Groves, Survey Errors and Survey Costs (New York, John Wiley, 1989).
L. Hantrais and S. Mangen, eds., Cross-National Research Methods in the Social Sciences
(London, Pinter).
T. E. Hedrick, L. Bickman and D. J. Rog, Applied Research Design (Newbury Park, California,
Sage, 1993).
G. T. Henry, Practical Sampling (Newbury Park, California, Sage, 1990).
B. Hibell, B. Andersson, S. Ahlström, O. Balakireva, T. Bjarnason, A. Kokkevi and M. Morgan,
The 1999 ESPAD Report: Alcohol and Other Drug Use Among Students in 30 European
Countries (Stockholm, Swedish Council for Information on Alcohol and Other Drugs,
2000).
R. M. Jaeger, Sampling in Education and the Social Sciences (London, Longman, 1984).
G. Kalton, Introduction to Survey Sampling (Beverly Hills, California, Sage, 1983).
P. H. Rossi, J. D. Wright and A. B. Anderson, eds., Handbook of Survey Research (New York,
Academic Press, 1983).
S. Sudman, Applied Sampling (New York, Academic Press, 1976).


Questionnaire developmentLloyd D. Johnston
Chapter VI
53
One of the three major lines of activity involved in conducting a school
survey of substance use among students is the development and
refinement of the questionnaire (see the flow chart of activities in the
figure, chapter III). The data collection instrument, in this case a ques-
tionnaire, is a key tool in any survey study. It reflects the concepts
that have been chosen as important to measure for answering the
research questions that gave rise to the study in the first place and
it will determine how accurately and unambiguously those concepts
are measured. A great deal of effort can go into developing the meas-
urement instrument, whether it is an interview or a self-administered
questionnaire, but much effort can be saved by the use of a careful-
ly tested model instrument, since others will already have completed
the work of developing and validating it.
While there are various methods available for gathering data on sub-
stance use by adolescents, such as telephone interviews, household
interviews, reports of informants and self-administered questionnaires
given in schools, the one that has proven most successful at eliciting
honest responses about these socially sanctioned behaviours is the
self-administered questionnaire used in a classroom setting[1]. The
self-administered questionnaire is therefore recommended in the pres-
ent volume and a model questionnaire is provided in annex I. This
model questionnaire has been used successfully in many countries
and has provided data that are sufficiently comparable across coun-
tries to enable many international comparisons to be made[2-5]. The
questionnaire that served as the source of the model questionnaire
provided in annex I was tested and refined at length and the validi-
ty of the resulting information within a wide range of cultures has
been demonstrated[3-4].
Priorities given to questions
Rather than provide a single, one-size-fits-all questionnaire, the pres-
ent Toolkit Module 3 chooses to offer various elements from which
individual research teams may wish to select, in order to be able to adapt the ques-
tionnaire to suit their purposes, the abilities of their student respondents and the
questionnaire space available for the survey content. The model questionnaire pre-
sented in annex I is comprised of questions that have been assigned one of three
levels of priority for inclusion: highly recommended, recommended and optional.
The highly recommended questions measure variables that are likely to be impor-
tant to almost any epidemiological study of substance use and measures of the under-
lying concepts, such as gender of the respondent or his or her use of alcohol, have
been included in most such studies. The recommended questions should also be
given very serious consideration and are suggested for inclusion in most studies by
the expert committee, if space permits. The optional questions are so listed either
because they may not measure a concept of vital interest in every study, or because
they may not be relevant to or measured the same way in all cultures or because
they are not considered quite as vital as the other questions. All the questions, how-
ever, are recommended for inclusion by the expert committee, if space and time per-
mit. One of the purposes of assigning these priorities was to enable international
comparability in the measurement of key variables, such as drug use. The ability to
compare results, either within a country or among countries, has proven valuable.
The length of the questionnaire is the primary constraint on measurement content
and is limited by the willingness of respondents to stay with the task of complet-
ing a questionnaire and by the amount of time the school can afford to make avail-
able. Often, a single class period is the optimal length of time for in-school surveys,
since it causes the least disruption to the normal school schedule. In addition, the
investigators may have other subjects that they wish to include in the questionnaire
because agencies with interests other than substance abuse are helping to fund the
survey or because they are interested in other factors or issues within the substance
abuse area. Given the constraints on length, investigators usually have to make trade-
offs in deciding which of the variables they would like to measure can be fitted into
the space and time available. Also, the complexity of the questionnaire should not
exceed the capabilities of the respondent population. In this way, having flexibility
in choosing the extent to which the questionnaire parallels the model questionnaire
provides the opportunity to find the best combination of length and topics to meet
the research objectives.
Elements in the questionnaire
The sequence of elements in the questionnaire is as follows: introduction, back-
ground and demographic characteristics, use of cigarettes and alcohol, familiarity
with the various controlled substances, use of the various controlled substances, age
at first use of all of the substances, personal disapproval of use of all of the sub-
stances, perceived risk of using all of the substances and perceived availability of all
of the substances. Because there are so many abusable substances about which to
54
GAP Toolkit Module 3 Conducting School Surveys on Drug Abuse
55
Chapter VI Questionnaire development
ask, or at least consider asking, many of these sections are comprised of a long list
of parallel questions asked individually for each of the substances.
The sequence of these elements has not been the same in all studies. For example,
in the Monitoring the Future study conducted in the United States, the segments on
personal disapproval and perceived risk are presented before the segment on use of
the substances, based on the assumption that stating attitudes first is less likely to
affect the answers to factual questions like frequency of use of a drug than is stating
usage levels first likely to influence the reported attitudes. In the ESPAD study in var-
ious European countries, this was not deemed to be a significant issue, so the usage
questions were placed first because they were believed to be more straightforward and
because they were judged to be the single most important set of measures.
Similarly, the demographic and background characteristics are placed after the drug
use segment in the Monitoring the Future studies, on the assumption that students
might be more likely to report illicit behaviours if they felt less "identified", and that
they would feel less identified if they had not yet provided a great deal of factual
information about themselves. In the ESPAD study, questions about sex and age
were asked at the beginning of the questionnaire to increase response rates on those
crucial demographic questions. Questions on such issues as family structure, parental
education and how well off the family was perceived to be were placed at the end
of the questionnaire. As systematic research to establish whether one sequencing is
better than another has not been undertaken, the sequencing of segments has
remained a choice to be made locally. It could be that the effect of the sequence, if
any, would vary among cultures.
Certain elements should appear in a particular sequence, however. It is useful to ask
about familiarity with the various drugs before asking specific questions about them,
such as use, disapproval, perceived risk or age at first use. And within the segment
asking about use of the various drugs, it is widely accepted that working from the
least illicit behaviours (which in most Western cultures would include smoking and
drinking, followed by marijuana use) to the most illicit ones facilitates truthful report-
ing of the latter.
Selecting drugs to include
Not all of the drug classes listed in the model questionnaire will be relevant in all
cultural settings, so the investigators should remove ones that they are sure are not
present in their society. If in doubt, however, they probably should include them,
so as to be able to determine empirically if their assumptions are correct. In some
cases, it may even be useful to demonstrate the non-existence of certain drugs to
provide a baseline for possible future changes. The investigators should also con-
sider adding some that are not on the list, if there are additional psychoactive sub-
stances that are known to be a problem in the country (khat, for example).
56
GAP Toolkit Module 3 Conducting School Surveys on Drug Abuse
Defining drugs for the respondents
In addition, one needs to review the names and descriptions of the drugs as stated
in the questionnaire to see if they, or a literal translation of them, are appropriate
in the cultural setting in which the questionnaire will be administered. The formal
names, brand names, where applicable, and street names may be quite different in
different countries, in which case the questions throughout the questionnaire deal-
ing with those drugs should be amended to be appropriate and understandable in
the cultural setting. The underlying principle is to use names that accurately com-
municate to respondents which substance(s) should be included in what they report,
as well as which substances should not.
To take an oversimplified example of a bad definition, a question that asked about
"coke" use (coke is a street word for cocaine in some places) might cause some
respondents to confuse the definition with Coca-Cola, leading to a serious overre-
porting of cocaine use. To determine a list of appropriate slang or street names for
various drugs, the investigators may want to speak with treatment professionals and
known drug users in the age group under study. If the survey is to be taken in a
large geographical area such as a country, it is important to have common street
names, not just ones that have only localized meanings. It may be necessary to have
a longer question stem to clarify the definition for the respondents.
Since some of the drug classes are legally prescribed by doctors or other health work-
ers to treat various conditions, the respondents may well have used them under a legit-
imate medical regimen. It is important that the respondents understand what occasions
of use they should and should not report in answering the questions about their own
non-medically supervised use of them. The intention usually is to quantify use that is
occurring without the instructions of a health professional. Exactly how that is stat-
ed may vary with cultural conditions, but the phrase included in the model ques-
tionnaire, "… without a doctor or medical worker telling you to do so", provides a good
starting point. This issue may arise with drugs such as tranquillizers, amphetamines
(particularly Ritalin), sedatives and some of the opiate-type drugs other than heroin.
One of the drugs referred to in the questionnaire, Relevin, is a non-existent drug.
The purpose of including it is to check for overreporting of drug use. It is possible
that the word Relevin may be too similar to a real word or drug used in a specific
culture, in which case another plausible but non-existent drug name might be cho-
sen to replace it. Usually the prevalence of reported use of this "drug" is low, which
gives some assurance that exaggeration of drug use is not a serious problem.
Format of the drug use questions
Without doubt, the most important segment of the questionnaire is that which deals
with the drug-using behaviours of the students. In addition to listing accurately the
57
Chapter VI Questionnaire development
drugs likely to be used by the students and giving clear definitions of each one in
the questionnaire, there is the question of how much information to seek about the
prevalence and frequency of use of each of them. (Prevalence refers to the propor-
tion of respondents who have used a drug at least once during a particular period,
while frequency refers to how many times he or she used the drug during that peri-
od.) If frequency of use is asked about, the prevalence rate can be inferred from the
answers; but if prevalence is asked about, frequency of use cannot be inferred. It is
therefore more useful to ascertain frequency of use, provided that obtaining that
information does not cause the questionnaire to become too long and too burden-
some to the respondents.
There are three standard time intervals about which prevalence or frequency, or
both, are usually asked: lifetime, 12 months and past 30 days. These generate the
lifetime, annual and monthly (or "current") prevalence or frequency rates, or both.
The model questionnaire uses these three intervals and offers a version of the ques-
tions that secure frequency of use in each. However, if completing that much infor-
mation is judged to be undesirable for whatever reason, the Expert Group
recommends at least asking about the frequency of use in the past 30 days, so that,
among current users, those who are currently lighter users can be distinguished from
those who are more involved. There is also a strong case to be made for asking
about lifetime frequency because very often a large proportion of the "users" have
used a drug only once or twice. Clearly they are of less importance from a public
health point of view than those who go on to become more involved users at some
point in their life. Also, if the prevalence rates for a drug are quite low, one may
only be able to distinguish different levels of users on the lifetime measure.
Even those questions listed as "optional" have a good case to be made for them. It
has been found that attitudes and beliefs, such as perceived risk and disapproval,
influence drug-using behaviour. In fact, perceived risk has even been shown to be a
leading indicator of changes in use[5]; and, in the aggregate, disapproval is indica-
tive of peer norms about use. Also, if one or more repeat surveys occur at later
times, then having these factors measured may help to identify possible changes in
these correlates of drug use.
Whether or not youngsters have even heard of many of these drugs is also a valu-
able thing to ascertain. It allows them at the outset to tell you that they do not
know anything about some of them, making it easier for them to answer later ques-
tions.
Perhaps the most difficult of the optional question sets is the one on problems relat-
ed to drug use. It is difficult because it contains a long list of possible problems
and two classes of drug (alcohol and other drugs) about which to ask that list of
questions. While the question set could be formatted as shown in the model ques-
tionnaire, it takes some sophistication on the part of respondents to use it, although
it has been used successfully in the ESPAD study of 15-16-year old students in over
30 European countries[3]. However, in another cultural setting or in a survey involv-
ing younger age groups, or both, one might consider using other strategies. One
would be to ask about each drug separately as a list of yes/no questions, for exam-
ple, asking first about alcohol and then about "drugs". Another would be to choose
only one class of drug about which to ask these questions. Either of these approach-
es would present respondents with an easier task. If the investigators are unsure
about students' ability to handle a given format, then pre-testing or pilot testing the
question may answer the question empirically.
Use of "skip questions"
The model questionnaire is intentionally designed to minimize the use of "skip" pat-
terns, in which the respondent would skip one or more subsequent questions if he
or she gave a particular answer to a prior question. (For example, if a student said
he or she was unfamiliar with a drug, they could be routed around any further ques-
tions about that drug.) Such skip patterns are more difficult for respondents to fol-
low correctly than a simple, uninterrupted series of questions; there is, therefore, a
risk of losing vital information from respondents who skip incorrectly. Therefore,
while there may be a few occasions on which you wish to use skip patterns, it is
recommended that they be kept to a minimum.
Other references
There are several books in the literature on survey research that contain more
detailed discussions of the various methodological issues involved in the design of
survey instruments than it is possible to provide. If time and resources permit, two
that might be considered are Dillman (2000)[6] and Salant and Dillman (1994)[7].
A number of the variables that might be considered for inclusion in a drug survey,
many of which have been included in the model student questionnaire provided in
annex I, are discussed at greater length in Johnston (2000)[8].
Pre-testing the questionnaire
Once the first draft of the questionnaire has been completed, the investigators may
want to have several colleagues read through it in order to see if they can identify
problems of any sort. This may lead to some obvious revisions. At that point, the
questionnaire would be ready for some empirical refinement in the form of pre-test-
ing and pilot testing. Because the model questionnaire has been carefully developed
and refined in a number of surveys, it seems likely that any revisions resulting from
these steps would be limited. Nevertheless, they are well worth pursuing.
58
GAP Toolkit Module 3 Conducting School Surveys on Drug Abuse
59
Chapter VI Questionnaire development
The investigators should start with a limited number of respondents of the age of
the intended sample, perhaps 10 or fewer. These respondents do not have to be sys-
tematically sampled in any way, but it might help to get some variability in their
general academic ability, include both genders and include some members of any
major minority groups that may exist in the society. They can be asked to complete
a questionnaire, perhaps individually, but with privacy assured.
They should then be asked individually whether they had found the instructions
clear and whether they had had difficulty in understanding or using any of the ques-
tions or answers. While it might be best to avoid looking at their answers, they
could be asked, question by question, what they had understood the question to
mean and what they had understood the answer sets to mean. It might also be use-
ful to attempt to ascertain if they had understood each class of drug covered in the
questionnaire by asking them to say what they thought it was. It might also be a
good idea to keep track of how much time it had taken them to complete the ques-
tionnaire initially. This informal pre-test may reveal problems that need resolving
and questions or definitions that need amending.
Pilot testing the questionnaire
The next step involves the selection of classrooms in which to administer the revised
questionnaire. This is, in a sense, a dress rehearsal for the full-scale data collection.
The pilot test provides an opportunity (a) to test the administration procedures in
the classroom, (b) to test how long the students take to finish the questionnaire
and (c) to identify remaining problems in the content and clarity of the question-
naire. The revised questionnaire could be administered as planned for the main
study, during a single class period, to students in three or four classrooms in two
different schools. The schools selected as pilot schools should be those which are
unlikely to number among the final sample, but if that proves difficult, they could
simply be deleted from the final sampling list.
The students can be told that the questionnaire represents the final pilot test for a
national survey and that their input will be important. They should be encouraged
to write comments against any question that they have difficulty in answering and
should be told that, once all the questionnaires have been completed, they will be
interviewed individually about the questionnaire. Their written comments may help
to identify any problems with questions that they are reluctant to mention in the
post-questionnaire interview.
In order to estimate the length of time needed for the completion of the question-
naire, a space can be provided at the end of it for the students to record their fin-
ishing time. This information enables an assessment to be made of the
appropriateness of the length of the questionnaire and whether additional questions
could be added. The students can subsequently be asked in the debriefing discus-
60
GAP Toolkit Module 3 Conducting School Surveys on Drug Abuse
sion whether there were questions or answers that they did not understand and be
invited to suggest ways in which the questionnaire could be improved. The result-
ing data can be kept and examined to check for any problems encountered in stu-
dents' following directions or answering questions correctly.
Finalizing and printing the questionnaire
Once the process of pre-testing and pilot testing the questionnaire is finished, the
final version of the questionnaire can be drafted. The layout should be clean and
clear. If optical scanning of the questionnaires is planned (see chapter VIII), the for-
matting should be arranged accordingly. If the data is to be entered in the computer
by hand, it is useful to work with the people responsible for data entry, in order to
ensure that the questionnaire is annotated in a way that facilitates accurate data
entry at that later stage in the process.
Once finalized, checked and re-checked, the questionnaires should be printed in suf-
ficient quantities to cover the intended sample size, plus extra copies (perhaps 20
per cent). Extra copies should be printed because it may not be known in advance
exactly how many students will be surveyed in a particular school, so extra ques-
tionnaires should be sent to each school. Another reason is that copies of the ques-
tionnaire are likely to be shared with other interested parties over the life of the
study.
Finally, a system should be established for documenting from which schools and
classes questionnaires are returned. This is discussed in chapter VII.
References
1. L. Kann, N. D. Brener, C. W. Warren, J. L. Collins and G. A. Giovino, "An assessment
of the effect of data collection setting on the prevalence of health risk behaviors among
adolescents", Journal of Adolescent Health, vol. 31, No. 4 (October 2002), pp. 327-335.
2. E. M. Adlaf and A. Paglia, Drug Use Among Ontario Students: Findings from the Ontario
Student Drug Use Survey, 1977-2001, Centre for Addiction and Mental Health research
document series No. 10 (Toronto, Centre for Addiction and Mental Health, 2001).
3. B. Hibell, B. Andersson, S. Ahlström, O. Balakireva, T. Bjarnason, A. Kokkevi and
M. Morgan, The 1999 ESPAD Report: Alcohol and Other Drug Use Among Students in
30 European Countries (Stockholm, Swedish Council for Information on Alcohol and
Other Drugs, 2001).
4. L. D. Johnston, F. Driessen and A. Kokkevi, Surveying Student Drug Misuse: A Six-
Country Pilot Study (Strasbourg, Council of Europe, 1994).
61
Chapter VI Questionnaire development
5. L. D. Johnston, P. M. O'Malley and J. G. Bachman, Monitoring the Future National
Survey Results on Drug Use, 1975-2001: Volume I: Secondary School Students, National
Institutes of Health publication No. 02-5106 (Bethesda, Maryland, National Institute on
Drug Abuse, 2002).
6. D. A. Dillman, Mail and Internet Surveys: The Tailored Design Method, 2nd ed. (New
York, John Wiley, 2000).
7. P. Salant and D. A. Dillman, How to Conduct Your Own Survey (New York, John Wiley,
1994).
8. L. D. Johnston, "Selecting variables and measures for drug surveys", in Guide to Drug
Abuse Epidemiology (Geneva, World Health Organization, 2000), pp. 171-204.


Data collection procedureBjörn Hibell
Chapter VII
63
Data collection is a long process, necessitating much planning if it is
to run smoothly. It is important to plan all steps well in advance in
order to avoid problems that may jeopardize the whole study.
Many decisions have to be made about the data collection procedure,
including when to collect data, how to treat absentees, how to select
survey leaders, how to contact the schools chosen for the sample,
whether to contact parents, what information should be given to
teachers, how to distribute material to the schools and how to con-
duct the survey administration.
General remarks
The questionnaires should be answered anonymously, that is, they
should not bear any identification numbers and the students should
not be required to write their names. To stress this and to convince
the students that their responses are anonymous, it is recommended
to provide an envelope, in which each student can to seal his or her
completed questionnaire. The envelope should be of a type that can-
not be opened and resealed.
The data collection leader should be asked to stress that the anonymi-
ty of the respondents will be protected and to refrain from walking
around the classroom while the forms are being completed. If teach-
ers are present in the room as a complement to the survey leader,
they should also be instructed not to walk around during the admin-
istration of the questionnaire.
It is very important for the processing of the data that, when the
envelopes are returned to the research institutes, the researcher knows
from which class the envelopes come. Therefore, each class in the
sample should be given a unique number identifying the class and
school and all the contents of the classroom packages (questionnaires,
envelopes, survey leader instructions and classroom reports) should
be marked with this number. If, in order to assure the students of
64
GAP Toolkit Module 3 Conducting School Surveys on Drug Abuse
confidentiality, identifying information has not been printed on the questionnaires,
the people gathering the questionnaires in the school may record the source of the
answers before returning the questionnaires to the research site. They might place
the school and classroom names on the envelopes or boxes in which the question-
naires are to be shipped back to the research centre (or code numbers might be
assigned to represent schools and classrooms). Another option would be to label
large envelopes or boxes in advance with a code identifying the school and class
and have the data collectors take them into the classes. Once returned to the research
centre, by whatever means, this information should be transferred in some form
onto each of the questionnaires to prevent them becoming lost among the piles of
unidentified questionnaires.
Since classes should be sampled randomly (see chapter V), a selected class in a school
cannot be substituted by another class in that school. It is essential to ensure that
school officials do not replace a sampled class with a class they may think is "better"
(that is, one that they believe gives a more favourable impression of their school).
Timing of the data collection
When deciding the timing of the data collection, it is important to choose a period
not preceded by a holiday, in order to ensure that the students refer to a "normal"
week or month when answering the questionnaire. A survey conducted in the week
following a school holiday may find significantly higher rates of alcohol and other
drug use, deriving in particular from answers to questions asking about such use in
the previous week or 30 days. Schools that cannot conduct the survey during an
assigned week may do so during the week immediately following.
If more than one class in a school is included in the sample, it is preferable to
administer the data collection during the same period in all classes. When this is
not possible, the time between the first and the last class should be as short as
possible. The main reason for this is to minimize the opportunities for discussion
of the contents of the questionnaire among students who have already completed
the survey and those who have not yet done so.
When the results of a school survey are to be compared with results from other
countries, the timing of the data collection must be as similar as possible. Since the
use of alcohol and other drugs increases rapidly during adolescence, a difference in
the timing of the data collection of, for example, six months, could lead to signifi-
cant differences in exposure to different drugs. In many international school sur-
veys, data are collected in March and April (see chapter V).
Survey leader
Data should be collected by using group-administered questionnaires, answered
under the supervision of a survey leader. This person could either be a teacher (or
65
Chapter VII Data collection procedure
other member of the school staff, such as a school nurse) or a research assistant.
The cheapest option is, of course, to have the teachers undertake this task, since
they are already in the school, they know the school and are familiar with school
routines. Another advantage of this option is that it is usually the least expensive
way of conducting a school survey. However, in some countries, the students may
not feel comfortable with the presence of teachers and it may therefore be neces-
sary to choose another person to be responsible for the data collection.
In a methodological study conducted in Iceland, Bjarnason (1995) found that there
were no significant differences between teachers and researchers conducting the
administration[1]. These findings suggest that, at least in some countries, the effect
of the mode of administration is negligible.
This decision should be made on a country-by-country basis, taking into account the
specific conditions of each country. However, it is important is to use a survey leader
who can be trusted by the students. Although less expensive, teacher administra-
tion should not be used if there are reasons to doubt the confidence students have
in their teachers. If the students do not trust the data collection leader, the whole
study may be jeopardized.
If it is decided that the survey leader is to be a research assistant, the researchers
must decide whether the teacher should be present in the classroom during the admin-
istration. If there are doubts concerning the ability of outside researchers to maintain
discipline in the classroom, it may be preferable to have the teacher present during
the data collection, in which case the teacher should stay at the front of the class and
should not help with the actual administration. Under no circumstances should the
teacher be allowed to see any of the questionnaires during the administration.
If a teacher is present as a complement to the regular survey leader, the teacher
should be asked to fill in the classroom report (see the section on survey adminis-
tration below and the section on data collection staff in chapter III).
Students not belonging to the target population
The target population can be defined in two ways: the research may target students
in one or more school grades or students belonging to a specific age cohort, that is,
students born in one or more specific years. In the latter case, participating classes
may include students born in years that are not targeted (see chapter V). The
researchers must decide if these students should participate in the data collection.
There are several reasons why all students in the classroom might be asked to fill
in the questionnaire, regardless of their birth cohort. It could be argued that all stu-
dents in a selected class should be treated equally. Thus, excluding some students
might be perceived as unfair. Furthermore, it might also be of interest to analyse
data on "grade level", even if the target population is a specific age cohort. Finally,
excluding some students from participation may reduce the students' perception of
anonymity and give rise to disturbances in the classroom.
66
GAP Toolkit Module 3 Conducting School Surveys on Drug Abuse
However, there are also some disadvantages to surveying individuals who are not
included in the target population. First, it involves the cost of producing and pro-
cessing questionnaires that will not be used. Second, such a process demands that
the researchers screen out useless questionnaires and if these questionnaires cannot
be reliably identified, the resulting data will be biased. Finally, there are some eth-
ical considerations involved in asking students to take the time to answer a ques-
tionnaire when their responses will be discarded.
In many cases, it is nevertheless preferable to ask all students in the classroom to
fill out a questionnaire. When students who do not belong to the target cohort are
not asked to participate, they should be asked to stay in the classroom and work
on something else during the administration of the questionnaire. If this is not pos-
sible for some reason, these students should be asked to leave the room so that
they do not become bored and start disturbing the data collection.
Absent students
In most school surveys, students who are absent on the day of administration are
defined as non-responding. However, in some cases researchers may follow up on
the survey at a later date, asking absent students to fill out a questionnaire when
they return to school.
Follow-up studies of absent students are complicated to administer. Hence, such
studies are usually performed as special methodological projects to compare present
and absent students. Such follow-up studies are typically not part of a regular school
survey data collection.
It is important for absent students to be treated in the same way in all participat-
ing schools. Furthermore, if the survey is part of an international project, it is impor-
tant that all countries treat absent students in the same way.
Experience from many school surveys suggests that the proportion of absent stu-
dents usually does not vary much over time. Hence, if the main goal is to study
time trends in substance use, absent students are not usually a major problem. It
can generally be assumed that, from one year to the next, absent students are sim-
ilar, that is, influencing the results in the same way every year. (A further discus-
sion about absent students can be found in chapter IV.)
Contact with selected schools
The selected schools should be contacted well in advance of the survey date and
informed of the planned study. A first step could be an introductory letter to the
head teacher, informing him or her of the study and its purposes. When appropri-
67
Chapter VII Data collection procedure
ate, such a letter, or a separate letter, could be signed by a minister, a representa-
tive from a teacher's organization, a physician or some other person who might
encourage the school to participate.
The head teacher should be asked to inform the teacher(s) of the chosen class(es),
but not to inform the students in order to avoid discussions among them, which
could lead to biased data. It is important to stress that a selected class cannot be
replaced by another. The survey should be scheduled for one class period. The sur-
vey leader should be asked to follow similar procedures as in written tests, with the
important exception of not looking at the questionnaires being filled out.
It is also advisable to contact the head teacher by telephone to confirm that every-
thing is in order. If the school is taking primary responsibility for the administra-
tion of the survey, it is advisable to confirm that the head teacher or some specific
member of the school staff will be responsible for the procedure. When all the
envelopes are collected, the person responsible must ensure that they are returned
to the research centre. Experience from some studies has shown that ensuring a
safe mode of transportation is important (see the section below on transportation
of material).
If the survey leader is to be a person from outside the school, it might also be an
advantage for him or her to visit the school in advance in order to become familiar
with the layout of the school and to inform the teachers about the study.
When calling or visiting the school, the researcher should confirm that the selected
class is or are unchanged. It is also advisable to confirm that no other conflicting
events have been scheduled for the same day. (Some more aspects about contacts
with selected schools are discussed in chapter III.)
Informing the teachers
Even if the data collection is administered by someone from outside the school, it
is important for teachers affected by the survey to be informed about it. One way
of doing this is to include information addressed to the teachers in the letter sent
to the head teacher. If the school is visited by a research assistant before the data
collection, he or she can inform the teachers. However, it is probably advantageous
also to ask the head teacher to contact the teachers who will be affected by the data
collection and to provide them with the relevant information.
Parental permission
In some countries, regions or schools, parental consent is required before it is pos-
sible to ask the students to participate in a school survey. In other countries, the
school may serve as the decision maker in lieu of the parents. There are two kinds
of parental permission: passive consent and active consent. Passive consent means
that parents or guardians receive a letter signed by the head teacher notifying them
68
GAP Toolkit Module 3 Conducting School Surveys on Drug Abuse
of the upcoming survey, perhaps accompanied by a pamphlet about the study. If the
parents or guardians do not wish their child to participate, they are asked to sign
a form and return it to the school's contact person.
Active consent requires the school to obtain a signed permission card or slip before
any given student can be allowed to participate. Obtaining active consent can be
complicated and may require a considerable investment of time and money. Students
may fail to bring the matter to the attention of their parents and parents may be
slow to respond. This may be particularly problematic in the case of parents who
are not actively involved in their children's lives, which in turn may be related to
the student's use of alcohol and other drugs. From an ethical point of view, it is
recommended that these letters are mailed to the parents, since students often for-
get to give them information from school. However, the forms indicating that the
parents do not give consent may be carried back to school by the students.
In most cases, surveys that require active parental consent will suffer from lower
response rates than surveys that require no parental consent or passive parental con-
sent. Therefore, when parental consent is required, researchers should stress the
importance of requesting passive rather than active consent.
Transportation of material
It is extremely important that the questionnaires and other kinds of material are
transported safely from the research institute to the schools and back. If a research
assistant administers the data collection, he or she should transport this material
to and from the school.
This might be a little more complicated if the data collection leader is a teacher or
other member of the school staff. It is important, however, to make sure that the
postal service is reliable and that packages do not get lost in transit. If this is uncer-
tain, it is essential to find some other way to transport the material. In some cases,
the researchers may ask the schools to use a particular delivery company, which will
then bill the research institute. In other cases, the research team may ask for the coop-
eration of the school district office in collecting the material. If the study is limited
to a manageable geographical area, the research team may also consider collecting the
material from the schools themselves in the days following the administration of the
survey. Lost survey material will not only affect the response rate of the survey, but
may seriously undermine the credibility of the researchers in future surveys.
Survey administration
Whenever possible, the data collection should be conducted in the same class peri-
od in all participating classes. The main reason for this is to avoid discussions in
69
Chapter VII Data collection procedure
the breaks that might influence the answers of those students who have not yet
taken part in the study.
It is essential that anonymity and confidentiality are assured when the question-
naires are answered. Hence, the data collection should take place under the same
conditions as a written test.
The instructions to the students should be easily understood and should emphasize
the importance of participation. They can be written on the front page of the ques-
tionnaire and should include information on the purpose of the study, the random
selection of classes and the anonymity and confidentiality of the study, as well as
instructions on how to fill out the questionnaire. An example of a questionnaire
front page is given in annex I.
In addition, the data collection leader should address the class as a whole, provid-
ing brief instructions and stressing the most important elements, in particular the
issues of anonymity and confidentiality. Some basic aspects to include in the verbal
presentation are included in the instructions for survey leaders given in annex III.
To prevent the students from feeling uncomfortable, the survey leader should not
walk around the classroom. Therefore, students who have questions should go to
the survey leader. Answers to student questions should be as neutral as possible.
To facilitate this, it might be advantageous for the teacher to have an unanswered
questionnaire.
In order to collect information about absent students, a classroom report should be
completed by the survey leader while the students answer the questionnaire. This
form includes information on how many boys and girls are absent and the reasons
for their absence (see annex II). In some countries, it may be difficult to obtain
information about the reasons for the absence in the class. In such cases, the sec-
tion dealing with this issue may be excluded from the classroom report.
If the study focuses on a particular age cohort, but data are collected from all stu-
dents in a class, the survey leader should, if possible, answer two forms, one for stu-
dents belonging to the target group and one for students not belonging to the group.
In cases where the information necessary for this distinction to be made is not read-
ily available, one form should be filled out for the entire class.
To make the students feel comfortable and to stress the confidentiality of the survey,
it is highly recommended that each student receives an individual envelope into which
he or she can place the completed questionnaire before sealing it. If this is not pos-
sible, it is important to find another way to collect the questionnaires and still make
the students feel secure in the anonymity of their responses. For example, the
researchers might provide a sealed box into which each student can put his or her
questionnaire. Alternatively, a large class envelope might be provided, into which each
student can put the questionnaire. In that case it is important that the class envelope
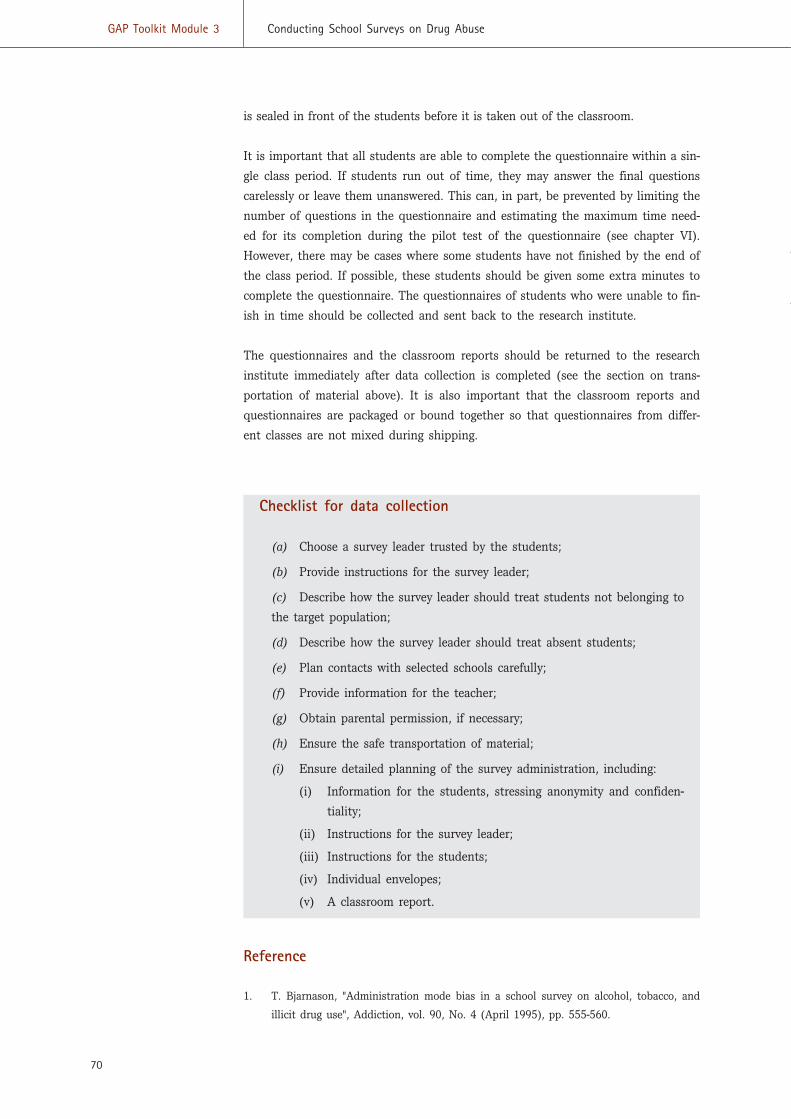
70
GAP Toolkit Module 3 Conducting School Surveys on Drug Abuse
is sealed in front of the students before it is taken out of the classroom.
It is important that all students are able to complete the questionnaire within a sin-
gle class period. If students run out of time, they may answer the final questions
carelessly or leave them unanswered. This can, in part, be prevented by limiting the
number of questions in the questionnaire and estimating the maximum time need-
ed for its completion during the pilot test of the questionnaire (see chapter VI).
However, there may be cases where some students have not finished by the end of
the class period. If possible, these students should be given some extra minutes to
complete the questionnaire. The questionnaires of students who were unable to fin-
ish in time should be collected and sent back to the research institute.
The questionnaires and the classroom reports should be returned to the research
institute immediately after data collection is completed (see the section on trans-
portation of material above). It is also important that the classroom reports and
questionnaires are packaged or bound together so that questionnaires from differ-
ent classes are not mixed during shipping.
Checklist for data collection
(a) Choose a survey leader trusted by the students;
(b) Provide instructions for the survey leader;
(c) Describe how the survey leader should treat students not belonging to
the target population;
(d) Describe how the survey leader should treat absent students;
(e) Plan contacts with selected schools carefully;
(f) Provide information for the teacher;
(g) Obtain parental permission, if necessary;
(h) Ensure the safe transportation of material;
(i) Ensure detailed planning of the survey administration, including:
(i) Information for the students, stressing anonymity and confiden-
tiality;
(ii) Instructions for the survey leader;
(iii) Instructions for the students;
(iv) Individual envelopes;
(v) A classroom report.
Reference
1. T. Bjarnason, "Administration mode bias in a school survey on alcohol, tobacco, and
illicit drug use", Addiction, vol. 90, No. 4 (April 1995), pp. 555-560.

Preparing, analysing andreporting the dataEdward M. Adlaf
Chapter VIII
71
The present chapter briefly describes the tasks and activities neces-
sary to prepare data for analysis and reporting. These preliminary
steps are important and the more time spent assessing and prepar-
ing data for analysis, the fewer the problems that will occur later.
Preparing the data
Pre-entry screening and editing
The first stage of data preparation begins prior to data entry. At this
stage, the questionnaires should be gone through, and, if necessary,
coding should be added. The questionnaires should be examined for
response patterns that suggest poor data quality, such as the ques-
tionnaire not being taken seriously by the respondent (that is, lack
of responses or childish comments written on the questionnaire) or
a majority of the questions not being answered (for example, over half
the questions are unanswered), "in-line" responding (in which the
respondent appears to be giving the same answer to all questions) or
other patterned responses (for example, zig-zag responses, which fol-
low a particular pattern, such as "always", "sometimes"; "always",
"sometimes", throughout the questionnaire), or that no valid response
has been given for sex and age. The questionnaires should also be
scanned for extreme responses (for example, reporting the use of all
drugs frequently). Some researchers visually scan all pages, and in
particular the last few pages to ensure that students completed the
questionnaire. It is recommended that problematic questionnaires be
removed prior to data entry; however, excluding questionnaires from
data entry should be done minimally and cautiously to ensure a qual-
ity sample. The key imperative here is to clearly document the num-
ber and reasons for any exclusions. In general, it is expected that no
more than 1 per cent and preferably less than one half of 1 per cent
of questionnaires would be excluded.
The next activity, which could occur simultaneously, is to complete
any necessary editing of the questionnaire prior to data entry.
72
GAP Toolkit Module 3 Conducting School Surveys on Drug Abuse
However, before this, a data codebook should be created: for each question, the
process by which the questionnaire item is encoded into the data file should be
described in the codebook. First, important design factors that need to be attached
to the questionnaire but were not asked directly of students must be identified.
Examples of these might include school identification number or name, region
code, school type, classroom identification number and date of survey administra-
tion. These variables will be necessary during the data analysis stage. It is also
important to attach a unique identification number for each student. After design
variables are attached to the questionnaire, for each question a coding scheme
should be created to describe how the questionnaire item responses will be entered
(encoded) into the data file. Student responses should be examined to ensure that
all appropriate responses are unambiguously answered. If multiple response items
(for example, with the instruction "check all that apply") were included in the
questionnaire, it is recommended that each category is entered as a yes/no ques-
tion, as this will make analysis easier. If open-ended questions (although these are
not generally recommended) were included in the questionnaire, they would need
to be coded prior to data entry. Most self-administered questionnaires do not have
an explicit code for refusal, so a code to use to represent those who failed to
answer a question would need to be decided upon. One common practice is to
assign a value of "9" for categories less than 9, "99" for two-digit items such as
age, and so forth.
Depending on the method of data entry, at some point a decision should be made
on how to define the variable list. Two practices are common: one labels the vari-
ables in the data files according to their question number (for example, Q1, Q2),
the other uses character labels according to the meaning of the question (for exam-
ple, age, sex, region, alc1, alc2, and so forth). The researcher may choose the one
to be used depending on the size and complexity of the questionnaire. If the sur-
vey is to be conducted in multiple sites or countries, it is important that the same
variable names and coding schemes are used. Finally, it should be remembered that
most statistical software can analyse only numerical variables, so it is preferable to
code most variables as numerical and not as "string" variables, that is, variables
saved as characters rather than as numbers (for example, "male" should be coded
as "1", not as "m").
To sum up, the more careful the attention paid to pre-entry screening and variable
coding of the questionnaire, the less time data entry will take. These records should
also be regularly updated and stored in a safe and secure place.
Data entry
Once the questionnaires have been screened and edited, they are ready for data
entry. It is assumed that data analysis will be done by computer and thus the data
must be entered in a machine-readable format. The two major choices here are opti-
73
Chapter VIII Preparing, analysing and reporting the data
cal scanning methods and direct manual entry methods. The choice of optical scan-
ning may depend on availability and cost. If it is decided to use this approach, it is
crucial to begin to work early to identify skilled professionals with scanning experi-
ence. It will also be necessary to develop a precisely formatted questionnaire in order
for the scanning process to proceed smoothly.
The most widely used method is still the manual entry of data. This can occur
through computer-assisted data entry, dedicated data entry software and manual
computer data entry, that is, direct entry from the questionnaire into a spreadsheet
(for example, Excel) format. Thus, data entry can be as straightforward as manual-
ly entering questionnaire responses into a spreadsheet, with columns represented by
questionnaire items and rows represented by students or more complicated data
entry screens with programmed checks. There are several decisions and tasks in this
regard.
First, computer software must be chosen. A package that allows data to be entered,
cleaned and verified, statistical analysis to be performed and graphs for the report
to be prepared should be considered. Some of the widely used commercially avail-
able programs include SPSS (details available at www.spss.com) and SAS (details
available at www.sas.com). In addition, the Centers for Disease and Prevention
Control in the United States makes available free of charge software called Epi Info,
which includes data entry, statistical analysis and graphics capabilities. Information
on downloading the software can be found at www.cdc.gov/epiinfo. Important con-
siderations include cost, the availability of skilled users and the need to share data
with others. Another consideration is the need for statistical methods for complex
survey designs (see the section on complex analysis below). Whichever statistical
software is chosen, the data file should also be kept in a format such as American
Standard Code for Information Interchange (ASCII) or Excel because these file for-
mats make it easier to transfer data files to other software packages.
It is important to ensure that the data are verified for accuracy. Ideally, it is best
to verify 100 per cent of all entered questionnaires by entering the data twice, prefer-
ably by a different person each time. This increases the time needed and the cost.
If funds are limited, a minimum of 10 to 20 per cent of entered questionnaires
should be verified in order to check that the error rate is acceptably low. Verification
is usually not necessary after optical scanning.
Post-entry screening
After the data have been entered, the data will need to be screened again, but this
time using the computer. First, the frequencies of all the entered data should be
printed and the following items should be assessed: that all the questionnaire items
are present; that the variable labels and category value labels are correct; and that
the value ranges match the questionnaire.
74
GAP Toolkit Module 3 Conducting School Surveys on Drug Abuse
Once it has been determined that the data are complete, aspects of data quality
should be assessed and issues that may pose difficulties at the stage of analysis
should be identified. This would include such things as assessing the rates of miss-
ing values, the presence of highly skewed distributions and consistency in reporting.
Fortunately, many drug use school surveys have item-missing values under 5 per
cent, so this problem may not be substantial. If rates of missing values exceed 30
per cent, the use of this variable should be reconsidered or advice should be sought
from a professional survey researcher.
Highly skewed distributions can also be problematic when almost all students give
the same response (for example, all students report no heroin use). For some types
of analysis, these variables may be of limited use, but for descriptive analyses, such
as describing how widespread heroin use is, they are fine. Finally, it is recommended
that researchers conduct contingency checking on their data. A primary example in
drug use surveys is to assess the consistency in logical reporting between drug use
periods, for example, lifetime versus past year use or past year versus past 30-day
use. For example, all those who report using a drug within the past 30 days should
also report using it in the past year. Indicators of reporting consistency will give the
researcher a sense of the data quality and may be important in interpreting the
results (see chapter IV).
After the screening process has been completed, it should be decided which cases
will comprise the final sample for analysis. Each of these cases is referred to as a
"minimally complete case" because it defines the minimal requirements for a valid
analysis case. Some or all of the following criteria may be considered in determin-
ing which cases are chosen as final analysis cases: (a) did not report the use of a
fictitious drug (see chapters IV and VI); (b) completed majority of questionnaire; (c)
no evidence of exaggerated reporting (for example, reporting frequent use of all
drugs); (d) did not have multiple questions answered inconsistently; and (e) pro-
vided valid data for key variables (for example, sex and age). There is no consen-
sus among researchers on which or how many of these criteria are appropriate to
use. Thus, each investigator should determine which criteria are the most appropri-
ate in his or her situation.
Multiple inconsistencies can be checked by examining the answers to pairs of ques-
tions that should be answered in a certain way to be logically consistent: for exam-
ple, frequency of 30-day use of a drug cannot logically exceed frequency of use in
the past 12 months or frequency of use of that same drug in the respondent's life-
time. Logical tests can be conducted for each drug and if the answers given by a
respondent show more than a couple of inconsistencies, consideration should be
given to eliminating the case. These decisions, however, may depend on the char-
acter and nature of the criteria items, such as, whether the researchers judge that
the students have mistaken the non-existent drug for a real one.
75
Chapter VIII Preparing, analysing and reporting the data
Analysis preparation
One of the final steps in preparing the data file is to prepare "derived" variables that
is variables that are created or computed and are not original to the questionnaire.
Examples would include calculating age (if the year of birth was asked about in the
questionnaire) and the number of drugs used (based on several drug use questions).
Another category of derived variables is those that will be frequently employed in a
different form, such as deriving age categories based on age of respondents.
Frequency of alcohol use may also be asked about in the questionnaire, but deriv-
ing a new variable to allow prevalence analysis is often necessary. In cases like this,
work may be saved later by recording these key variables and saving them as derived
variables (in addition to the original question).
When new variables are being created, the original data should never be changed and
new names should be created for new variables. Any computations should be double-
checked for accuracy. It should always be assumed that there is potential for error.
Data weighting
A detailed discussion of survey analysis weighting is well beyond the scope of the
present chapter. Whether data needs to be "weighted" in the analysis depends upon
the sample design. For example, a census survey (that is, a survey of all individu-
als in the target population) would not require weighting and neither would "self-
weighted" designs (those in which the probability of a student being selected is equal
to the overall sampling fraction). However, if the probability of a student being select-
ed in the sample differs from his or her population representation, weighting is nec-
essary to ensure representativeness in estimates. One common example is a design
that is stratified by region. It is not unusual for sample designs to use equal allo-
cation within each geographical area to ensure equal precision in each region. But
if regions differ significantly in their population, as is frequently the case, percent-
ages based on unweighted data would not reflect the true population representation.
Thus, the need for weighting should be obvious.
Another possible reason for weighting would be to correct for the sample to pop-
ulation distribution, often referred to as "post-stratification" weights. For example,
if the male to female ratio were 50:50 and the sample were 40:60, an adjustment
could be made to make the sample more representative of the population. Again,
this is an issue that should be discussed with a survey statistician. It is impor-
tant to note that such adjustments do not completely resolve the problem of a
"bad" sample.
As the creation of weights can be highly technical a survey researcher should be
consulted. Fortunately, once weights are calculated, applying them in analysis is
quite straightforward in statistical packages.
76
GAP Toolkit Module 3 Conducting School Surveys on Drug Abuse
Sample evaluation
Once the data has been prepared for analysis, the sample should be compared to
population information, if possible. For example, the gender and grade level distri-
bution could be compared to school enrolment statistics in order to evaluate how
well the sample matches the population and thus address some issues of non-
response bias.
The objective of this preliminary work is to ensure that researchers know their data
well, its strengths, and its weaknesses, before they embark upon analysis. Indeed,
many researchers are carried away by their enthusiasm upon receiving a data file
and proceed prematurely to data analysis, only to find that problems later result in
redoing weeks or months of work.
Analysing the data
Once the data has been thoroughly prepared statistical analysis can begin. Before
statistical analysis is begun, it is useful to create a detailed outline of the report,
including "mock" or empty tables. This often provides a clear direction as to what
material is needed.
It should be decided, and later reported, how the missing values in the estimates
were handled. The most common practice is that percentages (and other estimates
such as means) are calculated from those who provided a valid response, that is,
excluding those who did not provide an answer. It should be recognized, however,
that excluding those who failed to respond means that the potential bias is implic-
itly ignored.
In practice, most epidemiological reports are descriptive in nature. The focus is on
providing population estimates for the total sample and subgroups, such as those
defined by gender, region, population density or age. Thus, most descriptive reports
do not go beyond relating two variables at a time. For each estimate, the percent-
age (or other estimate) should be requested. If possible, it is also advisable to report
the 95 per cent confidence interval from the output. However, since nearly all school
surveys use cluster sampling (that is, the sampling unit is classes and not students)
this requires special software packages (as described in the following section on com-
plex analysis).
The 95 per cent confidence interval is important in evaluating the estimate because
it reflects the degree of uncertainty. It is also important to recognize that each per-
centage estimate may have a different confidence interval. For group variables, such
as sex, age group and region, a chi-square test should also be requested to deter-
mine whether rates of drug use differ significantly. Again, if researchers are unfa-
miliar with such statistical methods, the advice of a local researcher should be sought.
77
Chapter VIII Preparing, analysing and reporting the data
Complex analysis
If the sample is based on a complete census of all students, a simple random sam-
ple of students, or a self-weighted sample, the analysis should be straightforward
because it may not require weighting. However, many school surveys include design
features such as weighting (due to unequal probabilities of selection) and, in par-
ticular, clustering, that cause estimates of variance such as standard errors and con-
fidence intervals to be underestimated, sometimes significantly.
There are two general issues in this regard. First, many weights that are calculated
for surveys are expansion weights; that is, the resulting size of the sample would be
the projected population size, not the number of students surveyed. The difficulty
here is that when tests of significance, such as chi-square, are calculated, they are
based on an inflated sample size because most programs cannot distinguish between
unweighted and weighted data. Consequently, most analyses based on expansion
weights would greatly overestimate significance levels due to the inflated sample size.
Some attempt to resolve the problem of the software believing that the sample size
is much larger than the actual number of students surveyed by "downweighting" the
weights by a constant to ensure that the weighted sample size is equal to the
unweighted sample size. For percentage estimates, these "relative" weights are used
in the analysis. However, this method would still not resolve the other estimation
issues concerning complex samples, such as clustering.
The second issue regards the problem of clustering. Schools are a natural unit of
selection because the creation of sampling frames is relatively easy and surveying
many students per school is cost-efficient. However, a statistical problem is caused
by this clustering because the statistical assumption of independence is violated in
that, typically, students in the same school share many similar characteristics. In a
sense then, because of overlap in characteristics, there is less information per stu-
dent compared to a simple random sample. Because standard statistical software
ignores this clustering effect, such results tend to underestimate variances.
The consequence of this is that tests of significance would be overstated, generally
it would falsely be concluded that a significant difference or association existed when
it did not. Most standard statistical packages would not properly estimate variance
from such designs. Fortunately, there are software packages that can correctly esti-
mate variances in such designs (such as Stata, SUDAAN and WesVar). However, the
use of such software generally requires a person with an advanced statistical back-
ground, so it would be important to consult a statistician for advice. If the sample
design is clustered and it is not possible to calculate the proper variance, readers
should be informed and warned that the estimates of sampling error are understat-
ed (see chapter V).
Regarding the process of statistical computing, it is recommended that "syntax" files,
files that retain the computer commands given, are used for computing, rather than
"click-and-point" methods. Using syntax files ensures that results can be replicated
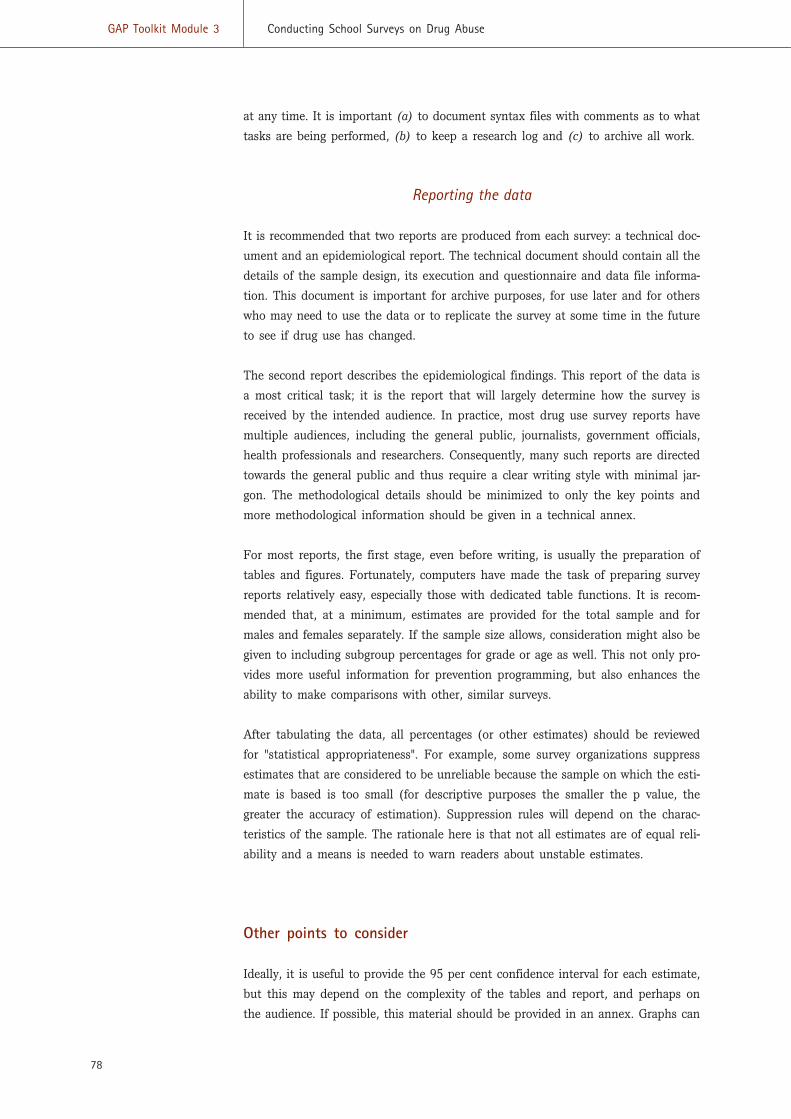
78
GAP Toolkit Module 3 Conducting School Surveys on Drug Abuse
at any time. It is important (a) to document syntax files with comments as to what
tasks are being performed, (b) to keep a research log and (c) to archive all work.
Reporting the data
It is recommended that two reports are produced from each survey: a technical doc-
ument and an epidemiological report. The technical document should contain all the
details of the sample design, its execution and questionnaire and data file informa-
tion. This document is important for archive purposes, for use later and for others
who may need to use the data or to replicate the survey at some time in the future
to see if drug use has changed.
The second report describes the epidemiological findings. This report of the data is
a most critical task; it is the report that will largely determine how the survey is
received by the intended audience. In practice, most drug use survey reports have
multiple audiences, including the general public, journalists, government officials,
health professionals and researchers. Consequently, many such reports are directed
towards the general public and thus require a clear writing style with minimal jar-
gon. The methodological details should be minimized to only the key points and
more methodological information should be given in a technical annex.
For most reports, the first stage, even before writing, is usually the preparation of
tables and figures. Fortunately, computers have made the task of preparing survey
reports relatively easy, especially those with dedicated table functions. It is recom-
mended that, at a minimum, estimates are provided for the total sample and for
males and females separately. If the sample size allows, consideration might also be
given to including subgroup percentages for grade or age as well. This not only pro-
vides more useful information for prevention programming, but also enhances the
ability to make comparisons with other, similar surveys.
After tabulating the data, all percentages (or other estimates) should be reviewed
for "statistical appropriateness". For example, some survey organizations suppress
estimates that are considered to be unreliable because the sample on which the esti-
mate is based is too small (for descriptive purposes the smaller the p value, the
greater the accuracy of estimation). Suppression rules will depend on the charac-
teristics of the sample. The rationale here is that not all estimates are of equal reli-
ability and a means is needed to warn readers about unstable estimates.
Other points to consider
Ideally, it is useful to provide the 95 per cent confidence interval for each estimate,
but this may depend on the complexity of the tables and report, and perhaps on
the audience. If possible, this material should be provided in an annex. Graphs can
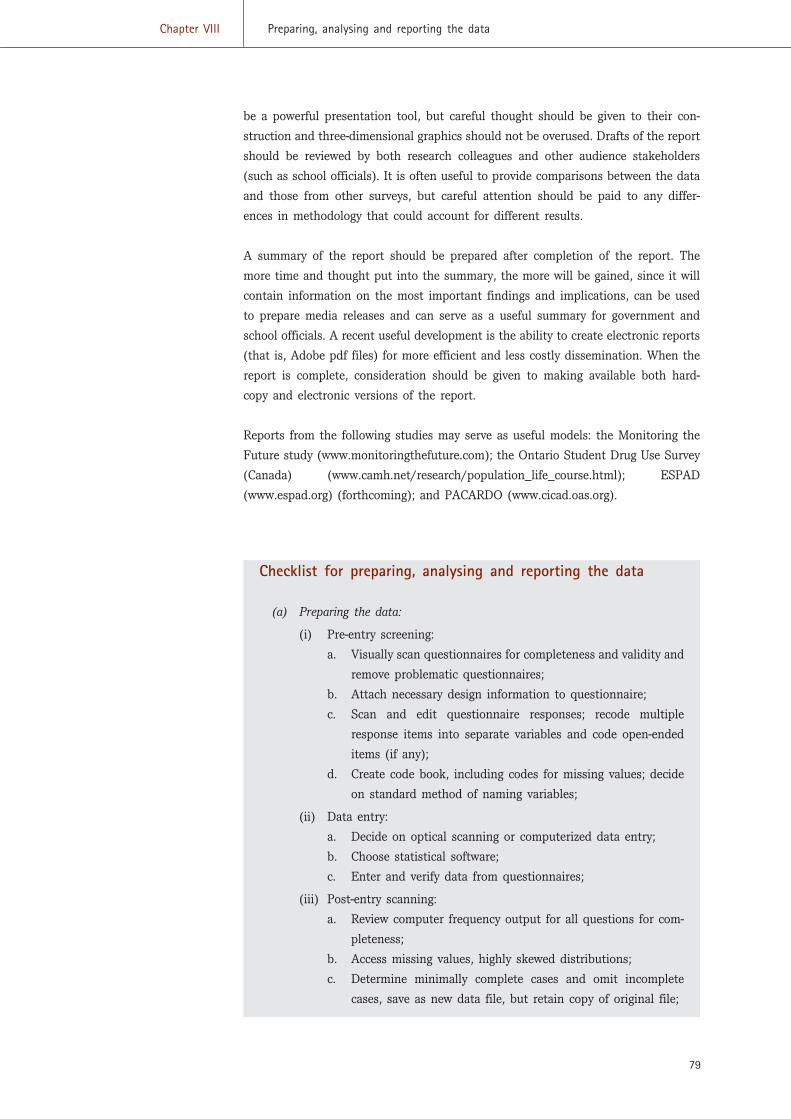
79
Chapter VIII Preparing, analysing and reporting the data
be a powerful presentation tool, but careful thought should be given to their con-
struction and three-dimensional graphics should not be overused. Drafts of the report
should be reviewed by both research colleagues and other audience stakeholders
(such as school officials). It is often useful to provide comparisons between the data
and those from other surveys, but careful attention should be paid to any differ-
ences in methodology that could account for different results.
A summary of the report should be prepared after completion of the report. The
more time and thought put into the summary, the more will be gained, since it will
contain information on the most important findings and implications, can be used
to prepare media releases and can serve as a useful summary for government and
school officials. A recent useful development is the ability to create electronic reports
(that is, Adobe pdf files) for more efficient and less costly dissemination. When the
report is complete, consideration should be given to making available both hard-
copy and electronic versions of the report.
Reports from the following studies may serve as useful models: the Monitoring the
Future study (www.monitoringthefuture.com); the Ontario Student Drug Use Survey
(Canada) (www.camh.net/research/population_life_course.html); ESPAD
(www.espad.org) (forthcoming); and PACARDO (www.cicad.oas.org).
Checklist for preparing, analysing and reporting the data
(a) Preparing the data:
(i) Pre-entry screening:
a. Visually scan questionnaires for completeness and validity and
remove problematic questionnaires;
b. Attach necessary design information to questionnaire;
c. Scan and edit questionnaire responses; recode multiple
response items into separate variables and code open-ended
items (if any);
d. Create code book, including codes for missing values; decide
on standard method of naming variables;
(ii) Data entry:
a. Decide on optical scanning or computerized data entry;
b. Choose statistical software;
c. Enter and verify data from questionnaires;
(iii) Post-entry scanning:
a. Review computer frequency output for all questions for com-
pleteness;
b. Access missing values, highly skewed distributions;
c. Determine minimally complete cases and omit incomplete
cases, save as new data file, but retain copy of original file;
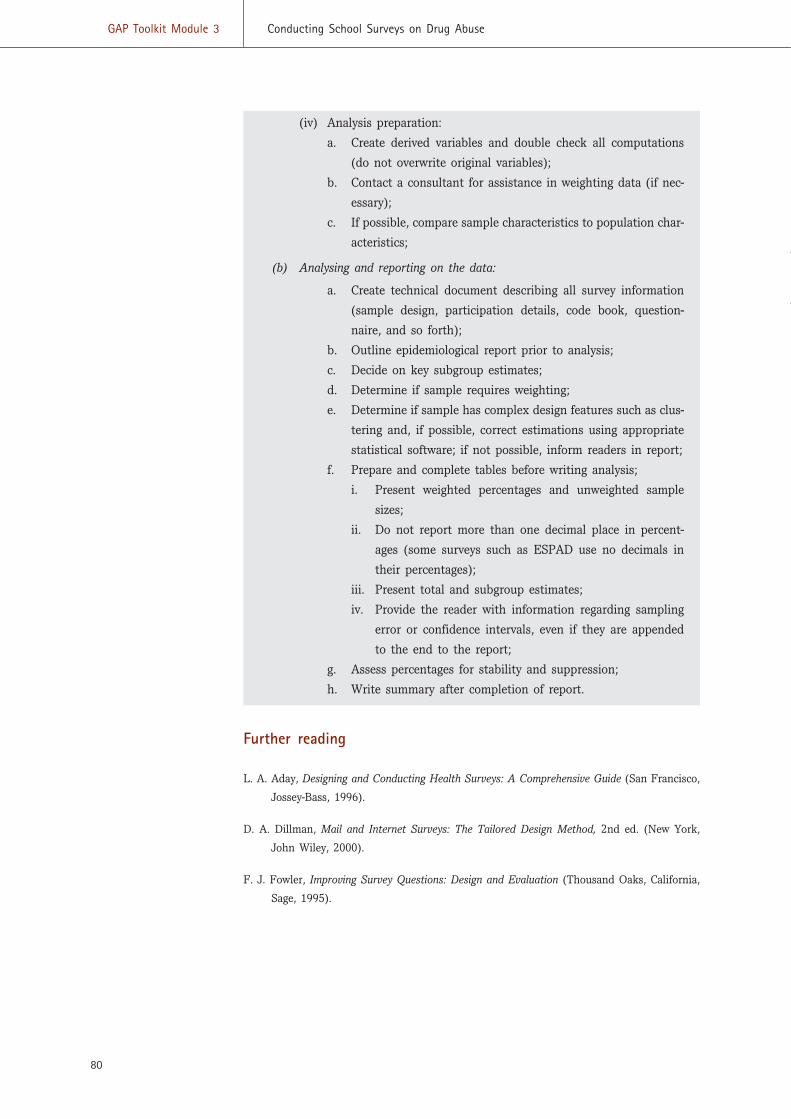
80
GAP Toolkit Module 3 Conducting School Surveys on Drug Abuse
(iv) Analysis preparation:
a. Create derived variables and double check all computations
(do not overwrite original variables);
b. Contact a consultant for assistance in weighting data (if nec-
essary);
c. If possible, compare sample characteristics to population char-
acteristics;
(b) Analysing and reporting on the data:
a. Create technical document describing all survey information
(sample design, participation details, code book, question-
naire, and so forth);
b. Outline epidemiological report prior to analysis;
c. Decide on key subgroup estimates;
d. Determine if sample requires weighting;
e. Determine if sample has complex design features such as clus-
tering and, if possible, correct estimations using appropriate
statistical software; if not possible, inform readers in report;
f. Prepare and complete tables before writing analysis;
i. Present weighted percentages and unweighted sample
sizes;
ii. Do not report more than one decimal place in percent-
ages (some surveys such as ESPAD use no decimals in
their percentages);
iii. Present total and subgroup estimates;
iv. Provide the reader with information regarding sampling
error or confidence intervals, even if they are appended
to the end to the report;
g. Assess percentages for stability and suppression;
h. Write summary after completion of report.
Further reading
L. A. Aday, Designing and Conducting Health Surveys: A Comprehensive Guide (San Francisco,
Jossey-Bass, 1996).
D. A. Dillman, Mail and Internet Surveys: The Tailored Design Method, 2nd ed. (New York,
John Wiley, 2000).
F. J. Fowler, Improving Survey Questions: Design and Evaluation (Thousand Oaks, California,
Sage, 1995).

Model student questionnaire
Annex I
81
General information
This is a suggested student questionnaire. It is discussed in detail in chapter VII.
It is recommended that all questions are used. However, for cases where that is
not possible, the questions have been divided into the following three categories:
Highly recommended: indicated in the questionnaire with three stars (***)
Recommended: indicated in the questionnaire with two stars (**)
Optional: indicated in the questionnaire with one star (*)
Please note that if one or more questions are taken out of the questionnaire,
the suggested introductions may need to be rewritten accordingly.
If questions are added to the questionnaire, it is recommended that they are
inserted after the suggested alcohol and drug questions. The main reason for
this is to retain the order of appearance of the questions in order to make
the results as comparable as possible with other studies using the suggested
questionnaire.
If questions are added, it is important that the number is restricted to avoid
overloading the questionnaire.
It is suggested that the logo of the research institute or project under the
auspices of which the survey is being conducted is printed at the top of the
front page of the questionnaire.
The questionnaire should be translated into the desired language and then
translated back again into English. Departures from the original may then be
discovered and corrected.
Throughout the questionnaire, drugs are exemplified with street names
and/or pharmaceutical names. It is important that all these names are amend-
ed to ensure that they are appropriate and understandable in the cultural set-
ting. Use terms that young people will understand.
Some drug-related questions include the non-existent drug "Relevin". It is
included as a "validity check" to ensure that students do not overestimate
their drug use.
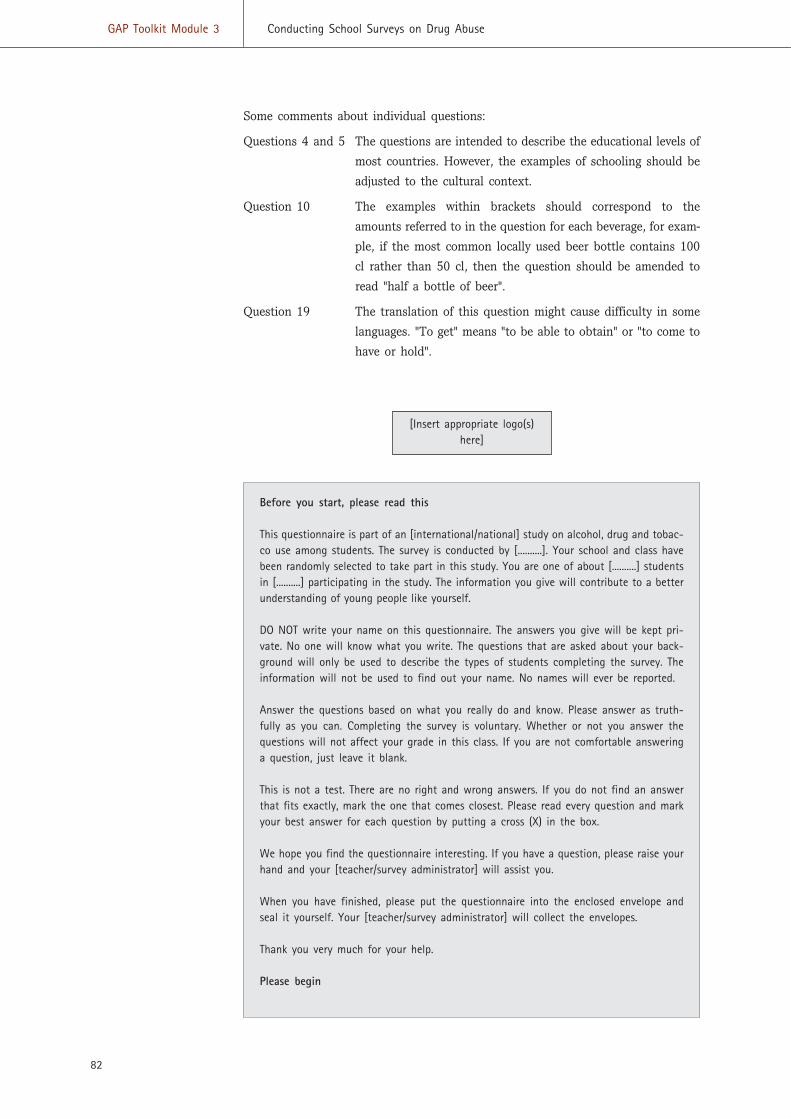
82
GAP Toolkit Module 3 Conducting School Surveys on Drug Abuse
Some comments about individual questions:
Questions 4 and 5 The questions are intended to describe the educational levels of
most countries. However, the examples of schooling should be
adjusted to the cultural context.
Question 10 The examples within brackets should correspond to the
amounts referred to in the question for each beverage, for exam-
ple, if the most common locally used beer bottle contains 100
cl rather than 50 cl, then the question should be amended to
read "half a bottle of beer".
Question 19 The translation of this question might cause difficulty in some
languages. "To get" means "to be able to obtain" or "to come to
have or hold".
[Insert appropriate logo(s)here]
Before you start, please read this
This questionnaire is part of an [international/national] study on alcohol, drug and tobac-co use among students. The survey is conducted by [..........]. Your school and class havebeen randomly selected to take part in this study. You are one of about [..........] studentsin [..........] participating in the study. The information you give will contribute to a betterunderstanding of young people like yourself.
DO NOT write your name on this questionnaire. The answers you give will be kept pri-vate. No one will know what you write. The questions that are asked about your back-ground will only be used to describe the types of students completing the survey. Theinformation will not be used to find out your name. No names will ever be reported.
Answer the questions based on what you really do and know. Please answer as truth-fully as you can. Completing the survey is voluntary. Whether or not you answer thequestions will not affect your grade in this class. If you are not comfortable answeringa question, just leave it blank.
This is not a test. There are no right and wrong answers. If you do not find an answerthat fits exactly, mark the one that comes closest. Please read every question and markyour best answer for each question by putting a cross (X) in the box.
We hope you find the questionnaire interesting. If you have a question, please raise yourhand and your [teacher/survey administrator] will assist you.
When you have finished, please put the questionnaire into the enclosed envelope andseal it yourself. Your [teacher/survey administrator] will collect the envelopes.
Thank you very much for your help.
Please begin
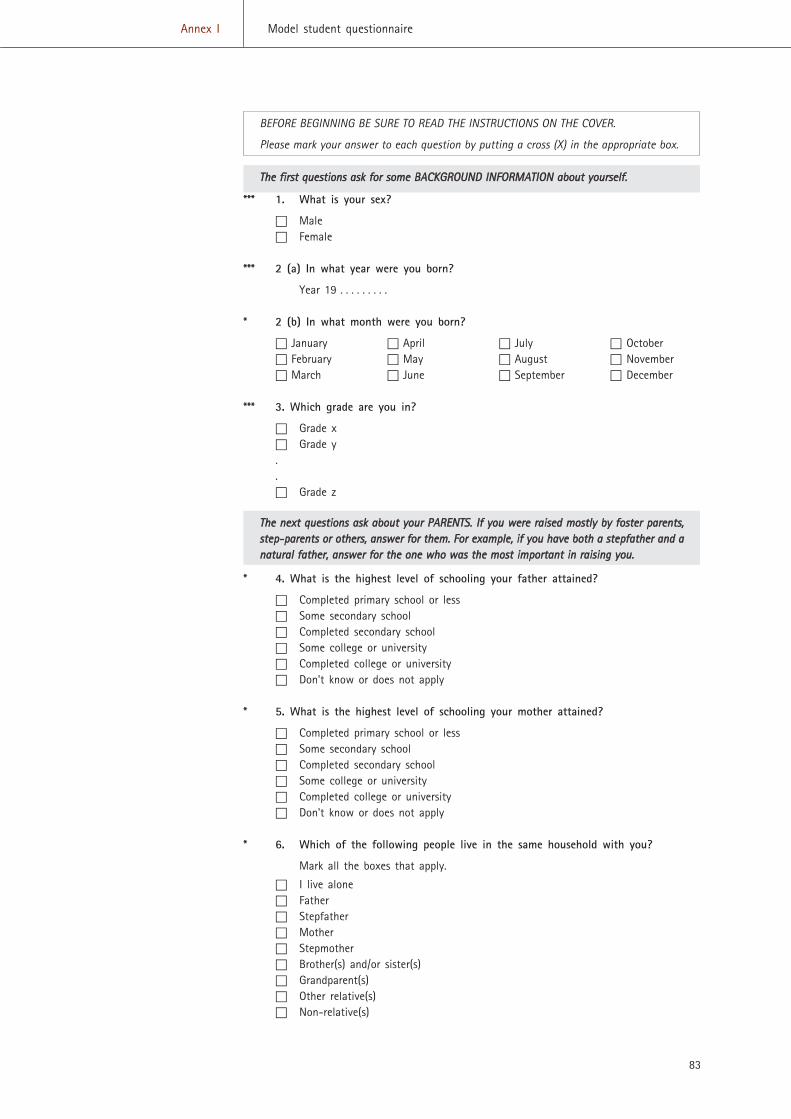
83
Annex I Model student questionnaire
*** 1. What is your sex?
� Male� Female
*** 2 (a) In what year were you born?
Year 19 . . . . . . . . .
* 2 (b) In what month were you born?
� January � April � July � October� February � May � August � November� March � June � September � December
*** 3. Which grade are you in?
� Grade x� Grade y..� Grade z
BEFORE BEGINNING BE SURE TO READ THE INSTRUCTIONS ON THE COVER.
Please mark your answer to each question by putting a cross (X) in the appropriate box.
TThhee ffiirrsstt qquueessttiioonnss aasskk ffoorr ssoommee BBAACCKKGGRROOUUNNDD IINNFFOORRMMAATTIIOONN aabboouutt yyoouurrsseellff..
TThhee nneexxtt qquueessttiioonnss aasskk aabboouutt yyoouurr PPAARREENNTTSS.. IIff yyoouu wweerree rraaiisseedd mmoossttllyy bbyy ffoosstteerr ppaarreennttss,,sstteepp--ppaarreennttss oorr ootthheerrss,, aannsswweerr ffoorr tthheemm.. FFoorr eexxaammppllee,, iiff yyoouu hhaavvee bbootthh aa sstteeppffaatthheerr aanndd aannaattuurraall ffaatthheerr,, aannsswweerr ffoorr tthhee oonnee wwhhoo wwaass tthhee mmoosstt iimmppoorrttaanntt iinn rraaiissiinngg yyoouu..
* 4. What is the highest level of schooling your father attained?
� Completed primary school or less� Some secondary school� Completed secondary school� Some college or university� Completed college or university� Don't know or does not apply
* 5. What is the highest level of schooling your mother attained?
� Completed primary school or less� Some secondary school� Completed secondary school� Some college or university� Completed college or university� Don't know or does not apply
* 6. Which of the following people live in the same household with you?
Mark all the boxes that apply.
� I live alone� Father� Stepfather� Mother� Stepmother� Brother(s) and/or sister(s)� Grandparent(s)� Other relative(s)� Non-relative(s)
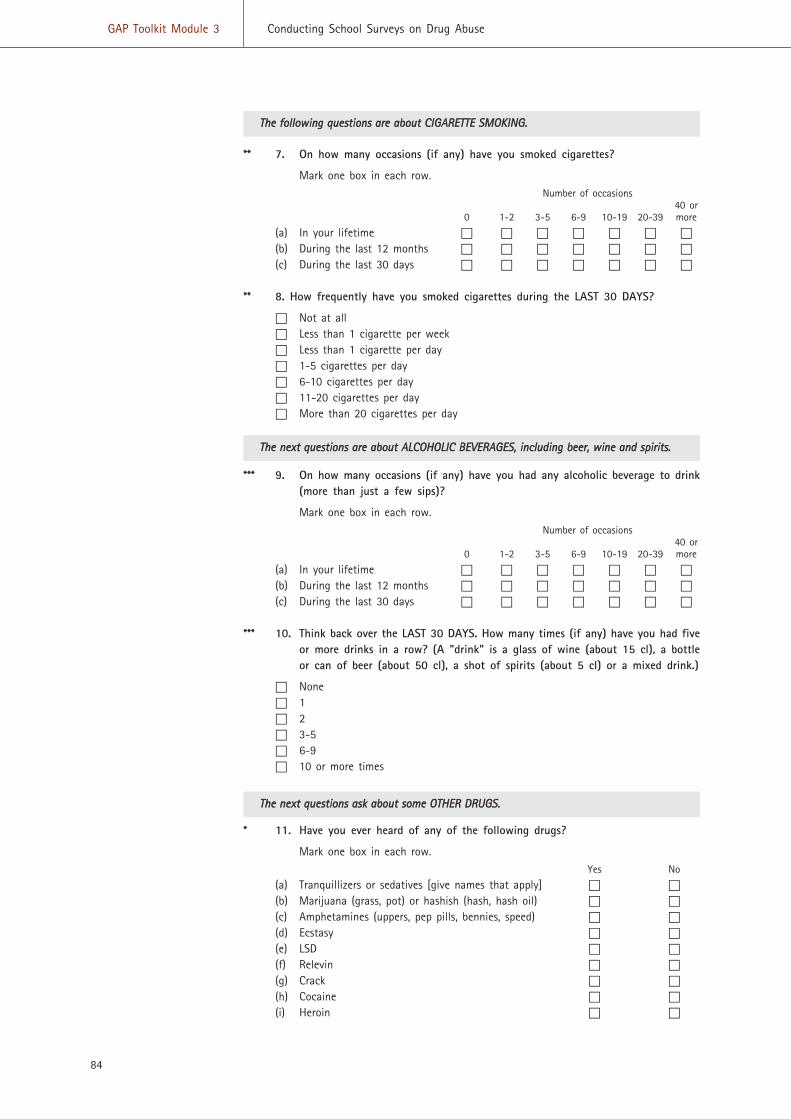
84
GAP Toolkit Module 3 Conducting School Surveys on Drug Abuse
** 7. On how many occasions (if any) have you smoked cigarettes?
Mark one box in each row.Number of occasions
40 or0 1-2 3-5 6-9 10-19 20-39 more
(a) In your lifetime � � � � � � �(b) During the last 12 months � � � � � � �(c) During the last 30 days � � � � � � �
** 8. How frequently have you smoked cigarettes during the LAST 30 DAYS?
� Not at all� Less than 1 cigarette per week� Less than 1 cigarette per day� 1-5 cigarettes per day� 6-10 cigarettes per day� 11-20 cigarettes per day� More than 20 cigarettes per day
TThhee ffoolllloowwiinngg qquueessttiioonnss aarree aabboouutt CCIIGGAARREETTTTEE SSMMOOKKIINNGG..
TThhee nneexxtt qquueessttiioonnss aarree aabboouutt AALLCCOOHHOOLLIICC BBEEVVEERRAAGGEESS,, iinncclluuddiinngg bbeeeerr,, wwiinnee aanndd ssppiirriittss..
*** 9. On how many occasions (if any) have you had any alcoholic beverage to drink(more than just a few sips)?
Mark one box in each row.Number of occasions
40 or0 1-2 3-5 6-9 10-19 20-39 more
(a) In your lifetime � � � � � � �(b) During the last 12 months � � � � � � �(c) During the last 30 days � � � � � � �
*** 10. Think back over the LAST 30 DAYS. How many times (if any) have you had fiveor more drinks in a row? (A "drink" is a glass of wine (about 15 cl), a bottleor can of beer (about 50 cl), a shot of spirits (about 5 cl) or a mixed drink.)
� None� 1� 2� 3-5� 6-9 � 10 or more times
TThhee nneexxtt qquueessttiioonnss aasskk aabboouutt ssoommee OOTTHHEERR DDRRUUGGSS..
* 11. Have you ever heard of any of the following drugs?
Mark one box in each row.Yes No
(a) Tranquillizers or sedatives [give names that apply] � �(b) Marijuana (grass, pot) or hashish (hash, hash oil) � �(c) Amphetamines (uppers, pep pills, bennies, speed) � �(d) Ecstasy � �(e) LSD � �(f) Relevin � �(g) Crack � �(h) Cocaine � �(i) Heroin � �
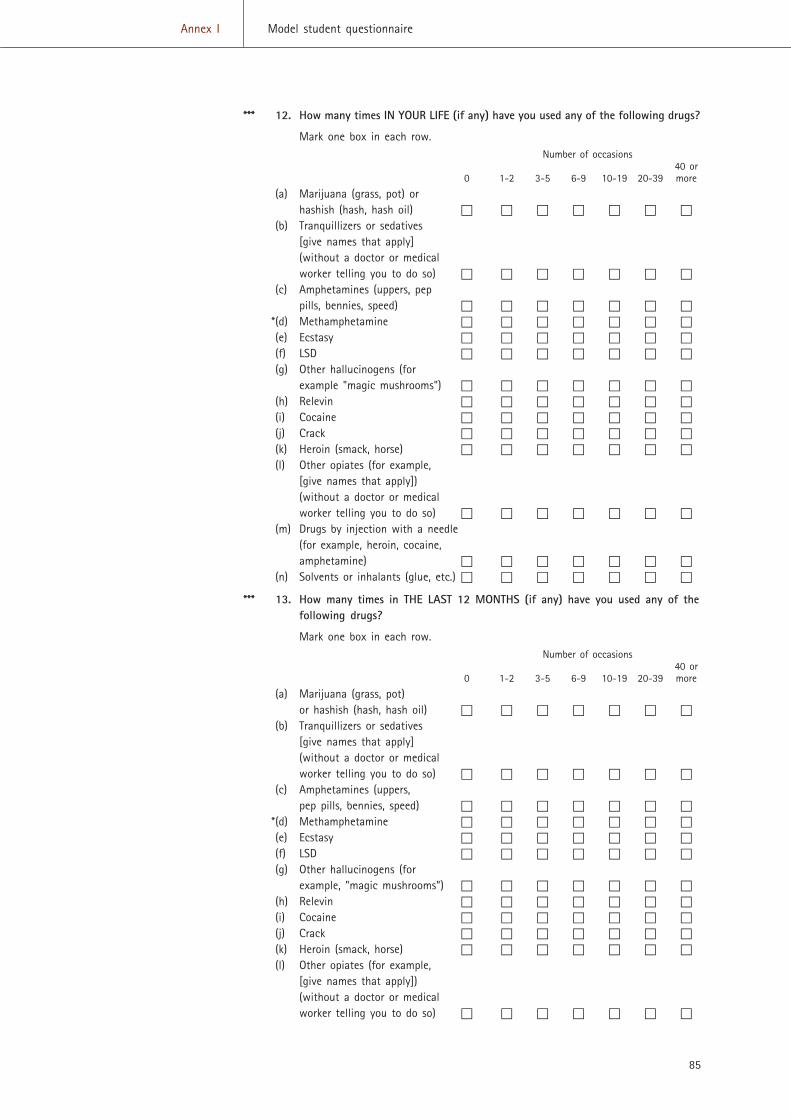
85
Annex I Model student questionnaire
*** 12. How many times IN YOUR LIFE (if any) have you used any of the following drugs?
Mark one box in each row.Number of occasions
40 or0 1-2 3-5 6-9 10-19 20-39 more
(a) Marijuana (grass, pot) orhashish (hash, hash oil) � � � � � � �
(b) Tranquillizers or sedatives[give names that apply](without a doctor or medicalworker telling you to do so) � � � � � � �
(c) Amphetamines (uppers, peppills, bennies, speed) � � � � � � �
*(d) Methamphetamine � � � � � � �(e) Ecstasy � � � � � � �(f) LSD � � � � � � �(g) Other hallucinogens (for
example "magic mushrooms") � � � � � � �(h) Relevin � � � � � � �(i) Cocaine � � � � � � �(j) Crack � � � � � � �(k) Heroin (smack, horse) � � � � � � �(l) Other opiates (for example,
[give names that apply])(without a doctor or medicalworker telling you to do so) � � � � � � �
(m) Drugs by injection with a needle(for example, heroin, cocaine,amphetamine) � � � � � � �
(n) Solvents or inhalants (glue, etc.) � � � � � � �
*** 13. How many times in THE LAST 12 MONTHS (if any) have you used any of thefollowing drugs?
Mark one box in each row.Number of occasions
40 or0 1-2 3-5 6-9 10-19 20-39 more
(a) Marijuana (grass, pot)or hashish (hash, hash oil) � � � � � � �
(b) Tranquillizers or sedatives[give names that apply](without a doctor or medicalworker telling you to do so) � � � � � � �
(c) Amphetamines (uppers,pep pills, bennies, speed) � � � � � � �
*(d) Methamphetamine � � � � � � �(e) Ecstasy � � � � � � �(f) LSD � � � � � � �(g) Other hallucinogens (for
example, "magic mushrooms") � � � � � � �(h) Relevin � � � � � � �(i) Cocaine � � � � � � �(j) Crack � � � � � � �(k) Heroin (smack, horse) � � � � � � �(l) Other opiates (for example,
[give names that apply])(without a doctor or medicalworker telling you to do so) � � � � � � �
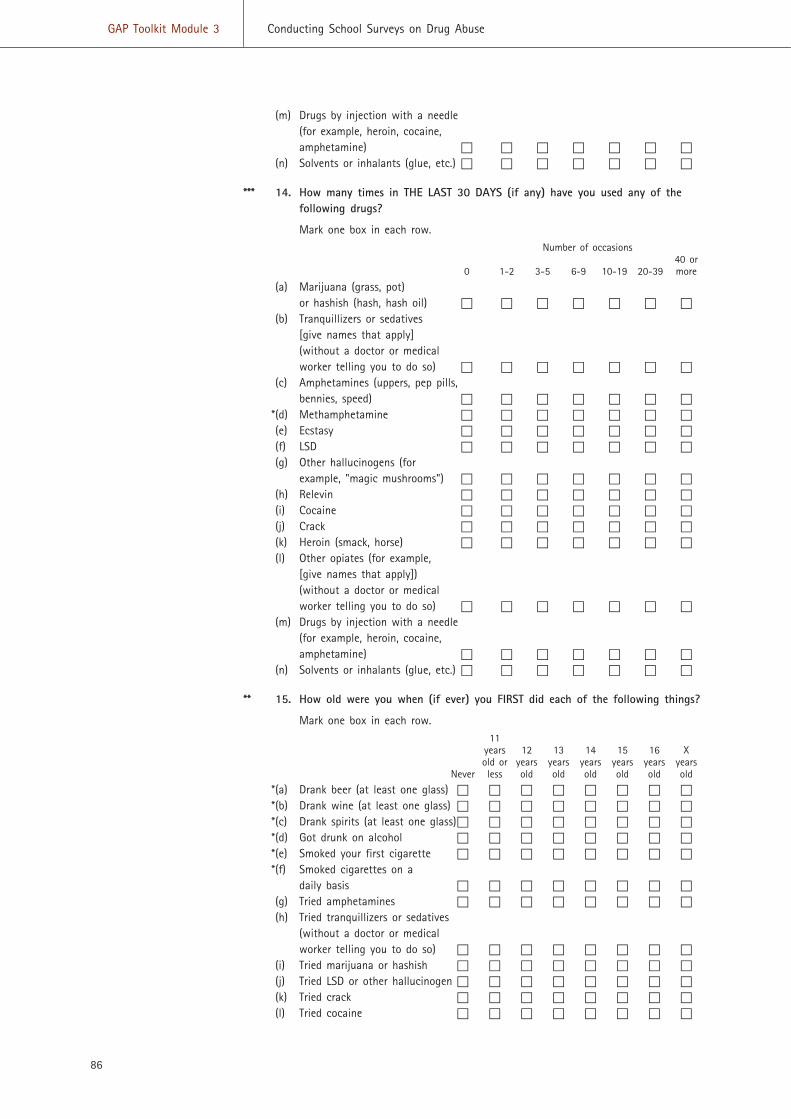
86
GAP Toolkit Module 3 Conducting School Surveys on Drug Abuse
(m) Drugs by injection with a needle(for example, heroin, cocaine,amphetamine) � � � � � � �
(n) Solvents or inhalants (glue, etc.) � � � � � � �
*** 14. How many times in THE LAST 30 DAYS (if any) have you used any of thefollowing drugs?
Mark one box in each row.Number of occasions
40 or0 1-2 3-5 6-9 10-19 20-39 more
(a) Marijuana (grass, pot)or hashish (hash, hash oil) � � � � � � �
(b) Tranquillizers or sedatives[give names that apply](without a doctor or medicalworker telling you to do so) � � � � � � �
(c) Amphetamines (uppers, pep pills,bennies, speed) � � � � � � �
*(d) Methamphetamine � � � � � � �(e) Ecstasy � � � � � � �(f) LSD � � � � � � �(g) Other hallucinogens (for
example, "magic mushrooms") � � � � � � �(h) Relevin � � � � � � �(i) Cocaine � � � � � � �(j) Crack � � � � � � �(k) Heroin (smack, horse) � � � � � � �(l) Other opiates (for example,
[give names that apply])(without a doctor or medicalworker telling you to do so) � � � � � � �
(m) Drugs by injection with a needle(for example, heroin, cocaine,amphetamine) � � � � � � �
(n) Solvents or inhalants (glue, etc.) � � � � � � �
** 15. How old were you when (if ever) you FIRST did each of the following things?
Mark one box in each row.11
years 12 13 14 15 16 Xold or years years years years years years
Never less old old old old old old
*(a) Drank beer (at least one glass) � � � � � � � �*(b) Drank wine (at least one glass) � � � � � � � �*(c) Drank spirits (at least one glass)� � � � � � � �*(d) Got drunk on alcohol � � � � � � � �*(e) Smoked your first cigarette � � � � � � � �*(f) Smoked cigarettes on a
daily basis � � � � � � � �(g) Tried amphetamines � � � � � � � �(h) Tried tranquillizers or sedatives
(without a doctor or medicalworker telling you to do so) � � � � � � � �
(i) Tried marijuana or hashish � � � � � � � �(j) Tried LSD or other hallucinogen � � � � � � � �(k) Tried crack � � � � � � � �(l) Tried cocaine � � � � � � � �
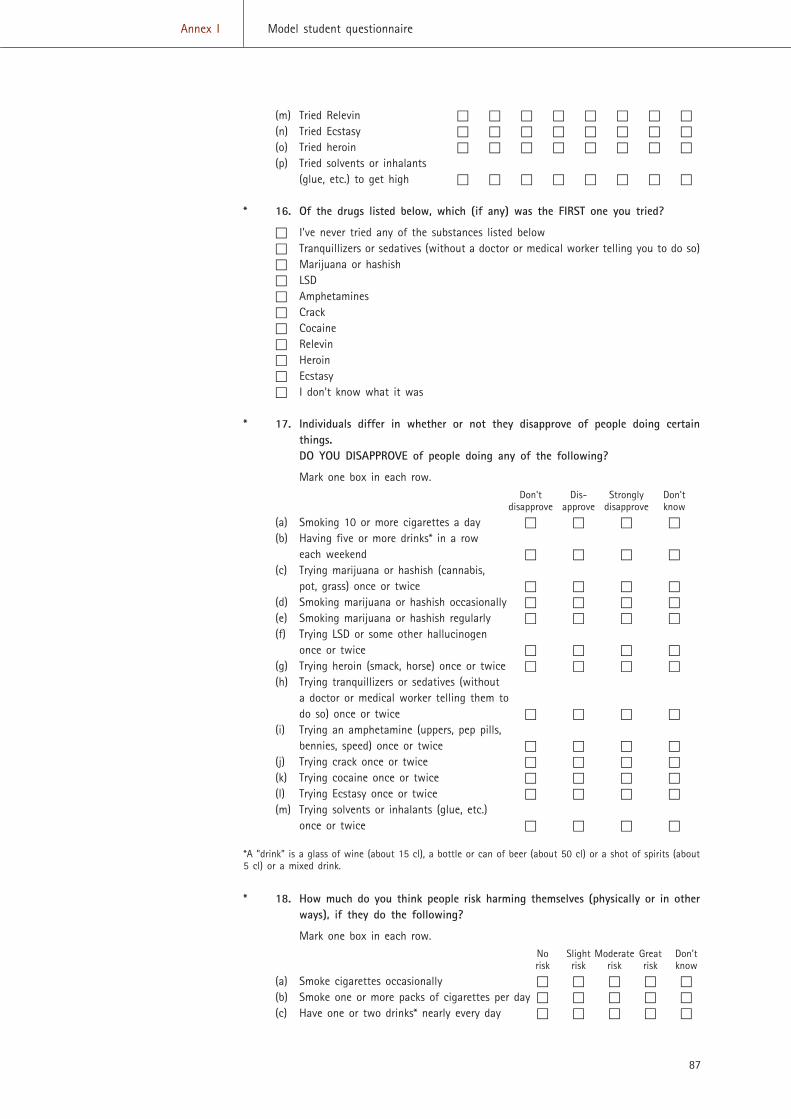
87
Annex I Model student questionnaire
(m) Tried Relevin � � � � � � � �(n) Tried Ecstasy � � � � � � � �(o) Tried heroin � � � � � � � �(p) Tried solvents or inhalants
(glue, etc.) to get high � � � � � � � �
* 16. Of the drugs listed below, which (if any) was the FIRST one you tried?
� I've never tried any of the substances listed below� Tranquillizers or sedatives (without a doctor or medical worker telling you to do so)� Marijuana or hashish� LSD� Amphetamines� Crack� Cocaine� Relevin� Heroin� Ecstasy� I don't know what it was
* 17. Individuals differ in whether or not they disapprove of people doing certainthings.DO YOU DISAPPROVE of people doing any of the following?
Mark one box in each row.Don't Dis- Strongly Don't
disapprove approve disapprove know
(a) Smoking 10 or more cigarettes a day � � � �(b) Having five or more drinks* in a row
each weekend � � � �(c) Trying marijuana or hashish (cannabis,
pot, grass) once or twice � � � �(d) Smoking marijuana or hashish occasionally � � � �(e) Smoking marijuana or hashish regularly � � � �(f) Trying LSD or some other hallucinogen
once or twice � � � �(g) Trying heroin (smack, horse) once or twice � � � �(h) Trying tranquillizers or sedatives (without
a doctor or medical worker telling them todo so) once or twice � � � �
(i) Trying an amphetamine (uppers, pep pills,bennies, speed) once or twice � � � �
(j) Trying crack once or twice � � � �(k) Trying cocaine once or twice � � � �(l) Trying Ecstasy once or twice � � � �(m) Trying solvents or inhalants (glue, etc.)
once or twice � � � �
*A "drink" is a glass of wine (about 15 cl), a bottle or can of beer (about 50 cl) or a shot of spirits (about5 cl) or a mixed drink.
* 18. How much do you think people risk harming themselves (physically or in otherways), if they do the following?
Mark one box in each row.No Slight Moderate Great Don'trisk risk risk risk know
(a) Smoke cigarettes occasionally � � � � �(b) Smoke one or more packs of cigarettes per day � � � � �(c) Have one or two drinks* nearly every day � � � � �
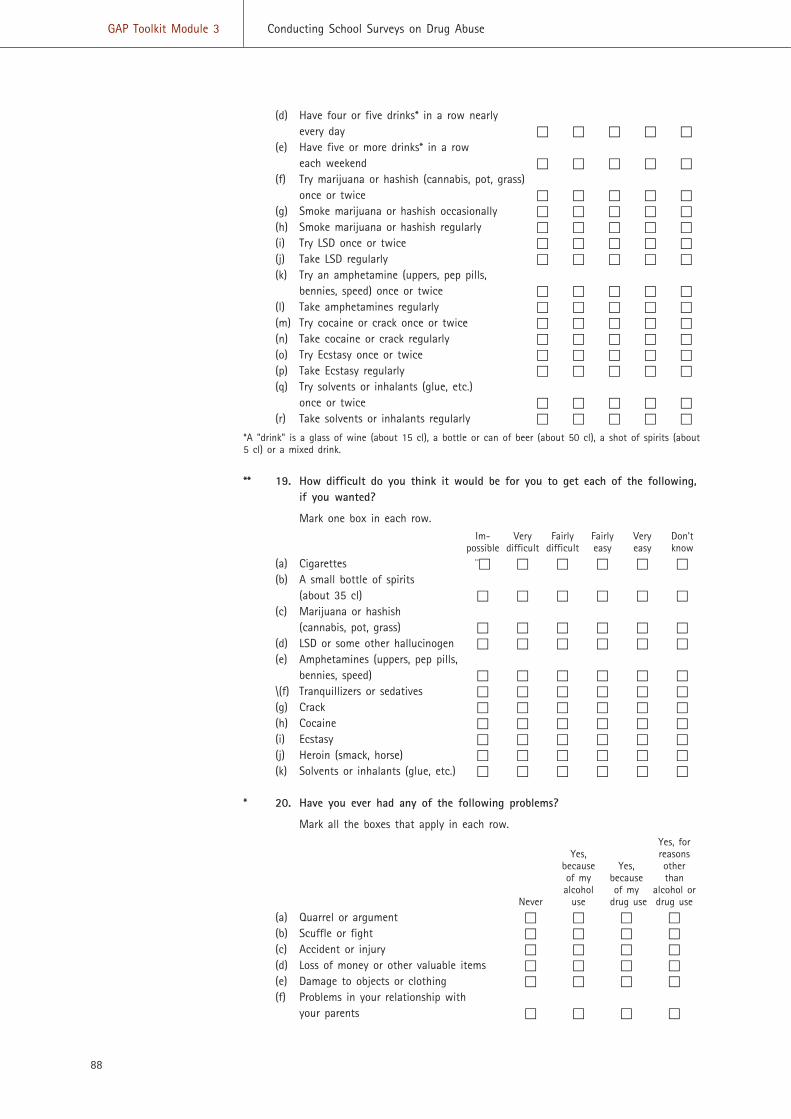
88
GAP Toolkit Module 3 Conducting School Surveys on Drug Abuse
(d) Have four or five drinks* in a row nearlyevery day � � � � �
(e) Have five or more drinks* in a roweach weekend � � � � �
(f) Try marijuana or hashish (cannabis, pot, grass)once or twice � � � � �
(g) Smoke marijuana or hashish occasionally � � � � �(h) Smoke marijuana or hashish regularly � � � � �(i) Try LSD once or twice � � � � �(j) Take LSD regularly � � � � �(k) Try an amphetamine (uppers, pep pills,
bennies, speed) once or twice � � � � �(l) Take amphetamines regularly � � � � �(m) Try cocaine or crack once or twice � � � � �(n) Take cocaine or crack regularly � � � � �(o) Try Ecstasy once or twice � � � � �(p) Take Ecstasy regularly � � � � �(q) Try solvents or inhalants (glue, etc.)
once or twice � � � � �(r) Take solvents or inhalants regularly � � � � �
*A "drink" is a glass of wine (about 15 cl), a bottle or can of beer (about 50 cl), a shot of spirits (about5 cl) or a mixed drink.
** 19. How difficult do you think it would be for you to get each of the following,if you wanted?
Mark one box in each row.Im- Very Fairly Fairly Very Don't
possible difficult difficult easy easy know
(a) Cigarettes ¨� � � � � �(b) A small bottle of spirits
(about 35 cl) � � � � � �(c) Marijuana or hashish
(cannabis, pot, grass) � � � � � �(d) LSD or some other hallucinogen � � � � � �(e) Amphetamines (uppers, pep pills,
bennies, speed) � � � � � �\(f) Tranquillizers or sedatives � � � � � �(g) Crack � � � � � �(h) Cocaine � � � � � �(i) Ecstasy � � � � � �(j) Heroin (smack, horse) � � � � � �(k) Solvents or inhalants (glue, etc.) � � � � � �
* 20. Have you ever had any of the following problems?
Mark all the boxes that apply in each row.Yes, for
Yes, reasonsbecause Yes, otherof my because thanalcohol of my alcohol or
Never use drug use drug use
(a) Quarrel or argument � � � �(b) Scuffle or fight � � � �(c) Accident or injury � � � �(d) Loss of money or other valuable items � � � �(e) Damage to objects or clothing � � � �(f) Problems in your relationship with
your parents � � � �
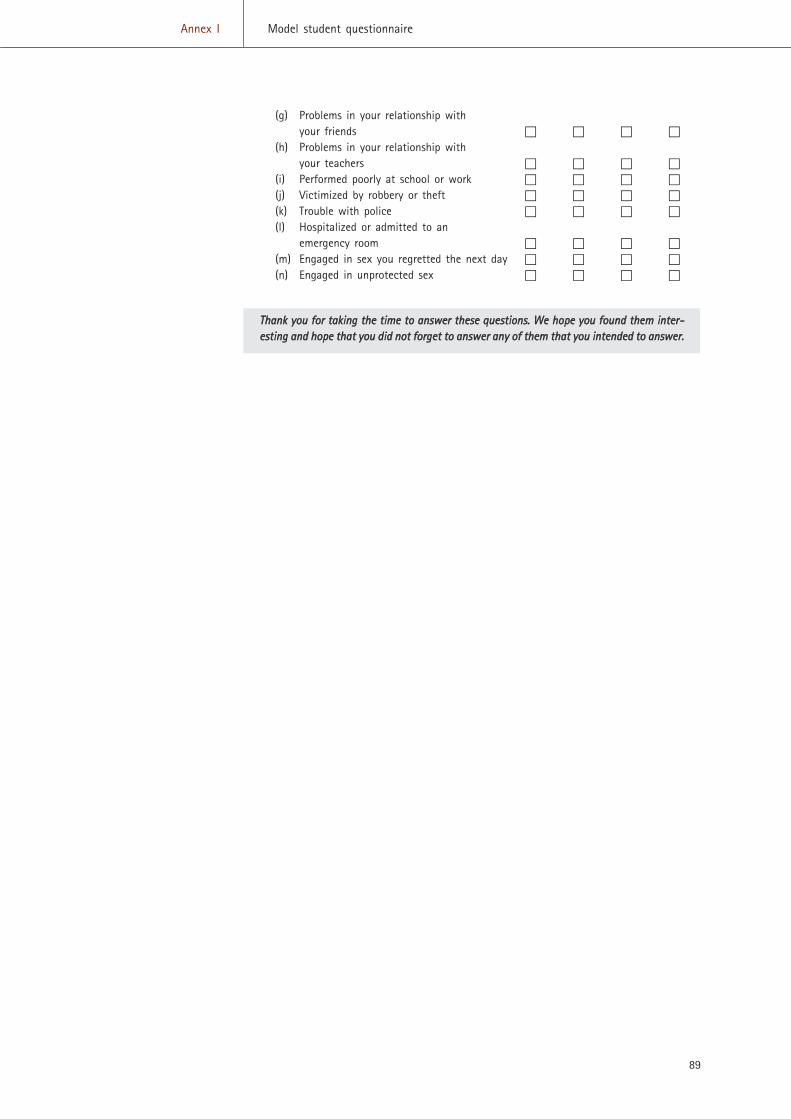
89
Annex I Model student questionnaire
(g) Problems in your relationship withyour friends � � � �
(h) Problems in your relationship withyour teachers � � � �
(i) Performed poorly at school or work � � � �(j) Victimized by robbery or theft � � � �(k) Trouble with police � � � �(l) Hospitalized or admitted to an
emergency room � � � �(m) Engaged in sex you regretted the next day � � � �(n) Engaged in unprotected sex � � � �
TThhaannkk yyoouu ffoorr ttaakkiinngg tthhee ttiimmee ttoo aannsswweerr tthheessee qquueessttiioonnss.. WWee hhooppee yyoouu ffoouunndd tthheemm iinntteerr--eessttiinngg aanndd hhooppee tthhaatt yyoouu ddiidd nnoott ffoorrggeett ttoo aannsswweerr aannyy ooff tthheemm tthhaatt yyoouu iinntteennddeedd ttoo aannsswweerr..


Annex II
91
CLASSROOM REPORT(Please return with the completed questionnaires)
[Name of project]
Name of school: ________________________________________________
Name of class: _____________________ Date of survey: _____________
City/municipality: ___________________ County: ____________________
Boys (Number) Girls (Number)
Willing to participate in the survey __________ __________
Refusing to participate in the survey __________ __________
Absent __________ __________
Total __________ __________
Reason for absence Boys (Number) Girls (Number)
Illness __________ __________
Absent with permission __________ __________
Absent without permission __________ __________
Other reason __________ __________
Not known __________ __________
Total __________ __________
Please answer the following questions:
1. Did you notice any disturbances during completion of the question-naires?
� No.� Yes, among a few students.� Yes, among less than half of the students.� Yes, among about half of the students.� Yes, among more than half of the students.
If you answered "yes" to the above question, please describe the disturbance(s):
� Giggles or eye contact with classmates.� Loud comments. Please provide an example: _________________
_____________________________________________________� Other kind of disturbance. Please describe: __________________
_____________________________________________________
2. Do you think the students were interested in the survey?
� Yes, all of them.� Almost all of them.� Most of them.� About half of them.� Less than half of them.� Almost none of them.� None of them.
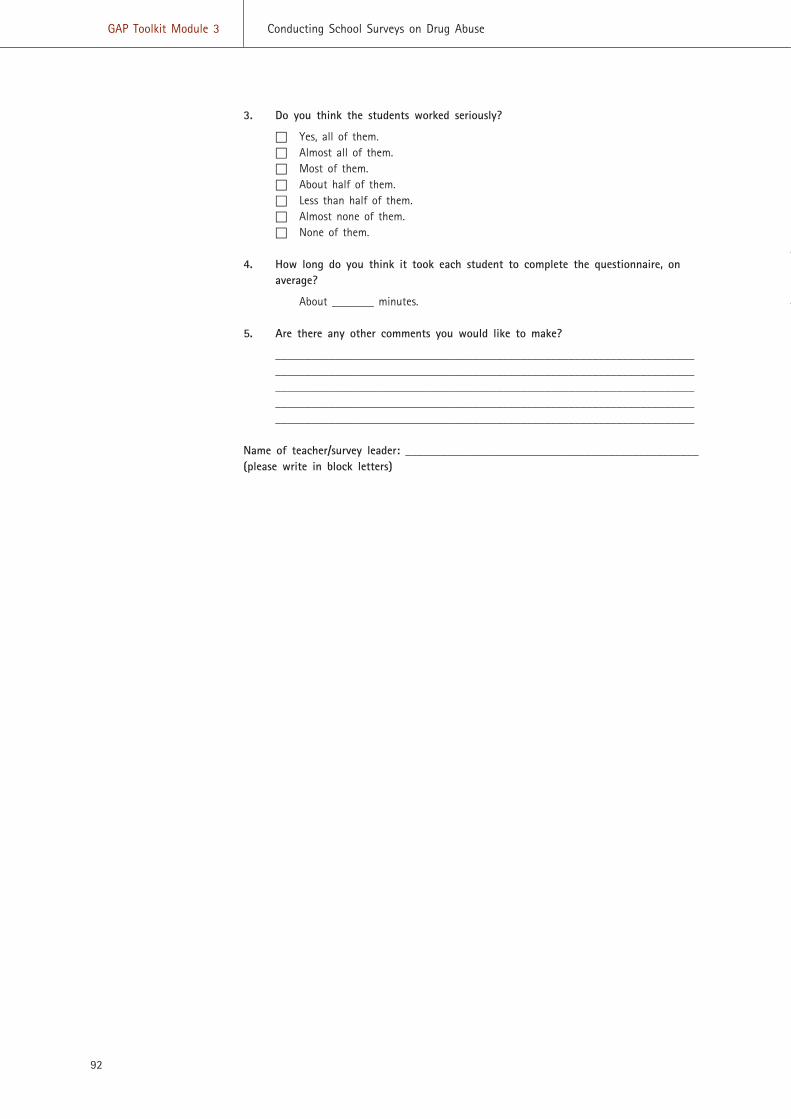
92
GAP Toolkit Module 3 Conducting School Surveys on Drug Abuse
3. Do you think the students worked seriously?
� Yes, all of them.� Almost all of them.� Most of them.� About half of them.� Less than half of them.� Almost none of them.� None of them.
4. How long do you think it took each student to complete the questionnaire, onaverage?
About _______ minutes.
5. Are there any other comments you would like to make?
______________________________________________________________________________________________________________________________________________________________________________________________________________________________________________________________________________________________________________________________________________________________
Name of teacher/survey leader: _________________________________________________(please write in block letters)
Annex III
93
Instructions for survey leaders
Background
In many countries, alcohol, tobacco and drug use surveys are performed in
schools. Such studies are important not only because they provide knowledge
about the extent to which students are exposed to and have experienced var-
ious drugs, but also because they provide an opportunity to monitor changes
over time in alcohol and other drug habits among young people.
Sample
All school classes participating in this survey have been randomly selected
and constitute a representative sample of all grade [xx] students in this coun-
try. It is therefore very important that all students in a selected class have
the opportunity to participate. A selected class may not be substituted by
another.
Anonymity
Anonymity must be guaranteed for all students. Each completed form should
be put in an envelope and sealed by the student himself or herself. No names
should be written on the forms or on the envelopes. Results will be presented
only in tables and no results from any single class will be revealed.
The entire class is selected
It is important that all students in a class complete the questionnaire at the
same time in the classroom. If any student is engaged in other school activ-
ities at this time, it is recommended that he or she is asked to join the select-
ed class. However, the students must understand that their participation is
voluntary. If any student refuses to participate, he or she is entitled to do so.
94
GAP Toolkit Module 3 Conducting School Surveys on Drug Abuse
The survey shall be conducted during the week of [. . . . . . . . .]
Those who are absent at the time that the survey is conducted shall not answer the ques-
tionnaire afterwards. They are considered "drop-outs" from the study. However, the number
of absent students should be indicated on the enclosed classroom report.
If you have any questions regarding the survey, please feel free to telephone [name] on [tele-
phone number].
Suggested procedure
1. Please give the following information to the class:
[The information about this survey to be given to students may contain the following:
(a) This year a survey on alcohol and other drug use is being conducted among [add
number] students like yourselves in [add number] schools. The information you give
will contribute to a better understanding of young people like yourself.
(b) Your class has been randomly selected to take part in this study.
(c) This is not a test. There are no right and wrong answers. Please answer as truth-
fully as you can.
(d) Please look through the questionnaire before you finish and make sure that you
have not left out any questions.
(e) When you have finished, please put the questionnaire into the enclosed envelope
and seal it yourself before handing it to [me].
(f) Please do not write your name on the questionnaire or the envelope. The answers
you give will be kept private and no one will know what you write. No results
from any single class will be reported.
2. Administration
Please distribute one questionnaire and one envelope to each student. Avoid discussions on
how to interpret the questions.
It is very important that the students answer the questions without communicating with their
classmates. Thus, forms should be answered under the same conditions as a written test. It
is recommended that the survey leader remain seated during the completion of the forms or
at least does not walk around in the classroom. If a student has a question, please do not
walk to his or her seat. Ask the student to come up to you and only give neutral answers to
their questions.
3. Classroom report
The classroom report may be completed while the students are answering the questionnaire.
Please return the classroom report together with all the questionnaires from the class.
95
Annex III Model student questionnaire
4. Collection
Please wait until all the students have finished their questionnaires before collecting the
envelopes. If a student has difficulty in answering the questions or has rather advanced drug
habits to declare, which may take some time to do, he or she may feel uncomfortable being
the last to finish.
Please remind the students once more not to write their name on the questionnaire or the
envelope before handing it in.
5. Returning the envelopes
The envelopes should be returned, together with the classroom report, in the large envelope
provided to the research institution responsible for the survey. If more than one class in a
school participates, the questionnaires from each class should be separated before being
returned.
Thank you for your cooperation.
Printed in AustriaV.03-83681—December 2003—1,150
United Nations publicationSales No. E.03.XI.18ISBN 92-1-148171-6

Conducting School
Surveys on
Drug Abuse
Global Assessment Programmeon Drug Abuse (GAP)
Toolkit Module 3
Conducting SchoolSurveys onDrug Abuse