concrete pavement preservation contractor … pavement preservation...concrete pavement preservation...
TRANSCRIPT

CONCRETE PAVEMENT PRESERVATION
Performance of a Test Section with Various Test Cells of Unique Joint Sealant and
Contractor-Established Joints
By
Bernard Igbafen Izevbekhai, P.E., Ph.D.
Minnesota Department of Transportation
1400 Gervais Avenue Maplewood MN 55109
E-mail: [email protected]
Phone: 651 3665454 Fax: 6513665461
Eddie Johnson, M.S., P.E.
Minnesota Department of Transportation
1400 Gervais Avenue Maplewood MN 55109
E-mail: [email protected]: 651 3665454 Fax: 6513665461
Steven Olson
Minnesota Department of Transportation
1400 Gervais Avenue Maplewood MN 55109
E-mail: [email protected]: 651 3665454 Fax: 6513665461

Background
In 2003 the MnDOT concrete engineering unit maintained an approved product list that included
a variety of joint sealants. Performance of some of the sealants was not very salutary. This
necessitated an abrogation of the approved list of joint sealants, whereupon, many manufacturers
were informed about a process which seemed feasible to use at that time for readmission into the
list. This was the NTPEP program that was looking into the performance of joint sealants. In
consequence an unbonded overlay project on US Highway 10 between Motley and Staples,
Minnesota was chosen as a test site. The contractor was to provide typical unsealed joints while
the various sealant manufacturers were to provide all their prescribed joints and seal them. The
NTPEP program provided a protocol for evaluation of the joints and a scoring criterion primarily
for the condition of the sealers.
The NTPEP monitoring was done for 7 years but at this stage the condition of the joints was
reported as merely the performance of the joint sealers, evident in adhesion failure, cohesion
failure or lack of these. Consequently at the eighth year MnDOT concrete research unit got
involved in these test sections and the effect of these joint preparations and conditions were
measured in terms of pavement ride quality and other deterministic variables.
During the NTPEP evalutation MnDOT coordinated traffic control activities, established all
staging and installation areas, coordinated the installation activity for each of the
supplier/installer teams, and conducted annual evaluations, material testing and data analysis.
PROJECT DETAILS
Eastbound US 10 – Unbonded PCC Overlay, 7” reinforced concrete, placed on 1.5”
Permeable Asphalt Stabilized Stress Release Course 33’wide, HMA shoulders, 14’ driving
lane, 13 passing lane. 15’ Contraction joint spacing. Concrete was poured on September 8,
2003.Widening Saw Cut -September 10, 2003. Detail B depth was modified to 1 ¼” to allow
use of ½” backer rod for Hot-Pour Sealants. All hot-pour products use the same
configuration. Widths were sawed to ½”. Minimal spalling was seen after sawing.
Detail "E” of the MnDOT concrete joint specification was used for the silicone sealants.
Final saw cut was done to 3/8” x 1 ¼”. All products were installed with backer rod. Each
joint was sandblasted and blown out beginning at 7:00 am on the day of sealing. Heat
lancing is not standard procedure on concrete, but because of the rain experienced the day

before the heat lance was used to dry out the joints. The test sections were assigned to
various product manufacturers as shown in table 1 and table 2.
According to NTPEP guidelines, the host state scheduled installation dates and times with
the sealant suppliers and coordinated scheduling and layout of test sections. A MnDOT
inspector was assigned to each supplier.
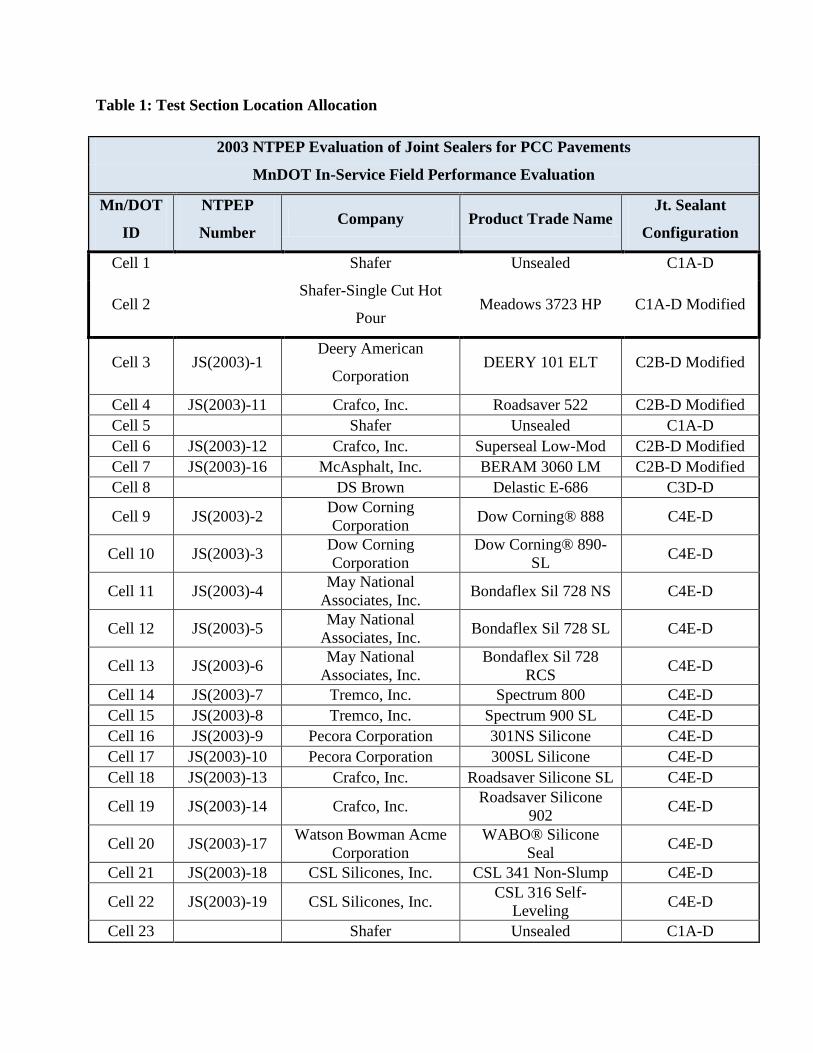
Table 1: Test Section Location Allocation
2003 NTPEP Evaluation of Joint Sealers for PCC Pavements
MnDOT In-Service Field Performance Evaluation
Mn/DOT
ID
NTPEP
Number Company Product Trade Name
Jt. Sealant
Configuration
Cell 1 Shafer Unsealed C1A-D
Cell 2 Shafer-Single Cut Hot
Pour Meadows 3723 HP C1A-D Modified
Cell 3 JS(2003)-1 Deery American
Corporation DEERY 101 ELT C2B-D Modified
Cell 4 JS(2003)-11 Crafco, Inc. Roadsaver 522 C2B-D Modified
Cell 5 Shafer Unsealed C1A-D
Cell 6 JS(2003)-12 Crafco, Inc. Superseal Low-Mod C2B-D Modified
Cell 7 JS(2003)-16 McAsphalt, Inc. BERAM 3060 LM C2B-D Modified
Cell 8 DS Brown Delastic E-686 C3D-D
Cell 9 JS(2003)-2 Dow Corning
Corporation Dow Corning® 888 C4E-D
Cell 10 JS(2003)-3 Dow Corning
Corporation
Dow Corning® 890-
SL C4E-D
Cell 11 JS(2003)-4 May National
Associates, Inc. Bondaflex Sil 728 NS C4E-D
Cell 12 JS(2003)-5 May National
Associates, Inc. Bondaflex Sil 728 SL C4E-D
Cell 13 JS(2003)-6 May National
Associates, Inc.
Bondaflex Sil 728
RCS C4E-D
Cell 14 JS(2003)-7 Tremco, Inc. Spectrum 800 C4E-D
Cell 15 JS(2003)-8 Tremco, Inc. Spectrum 900 SL C4E-D
Cell 16 JS(2003)-9 Pecora Corporation 301NS Silicone C4E-D
Cell 17 JS(2003)-10 Pecora Corporation 300SL Silicone C4E-D
Cell 18 JS(2003)-13 Crafco, Inc. Roadsaver Silicone SL C4E-D
Cell 19 JS(2003)-14 Crafco, Inc. Roadsaver Silicone
902 C4E-D
Cell 20 JS(2003)-17 Watson Bowman Acme
Corporation
WABO® Silicone
Seal C4E-D
Cell 21 JS(2003)-18 CSL Silicones, Inc. CSL 341 Non-Slump C4E-D
Cell 22 JS(2003)-19 CSL Silicones, Inc. CSL 316 Self-
Leveling C4E-D
Cell 23 Shafer Unsealed C1A-D
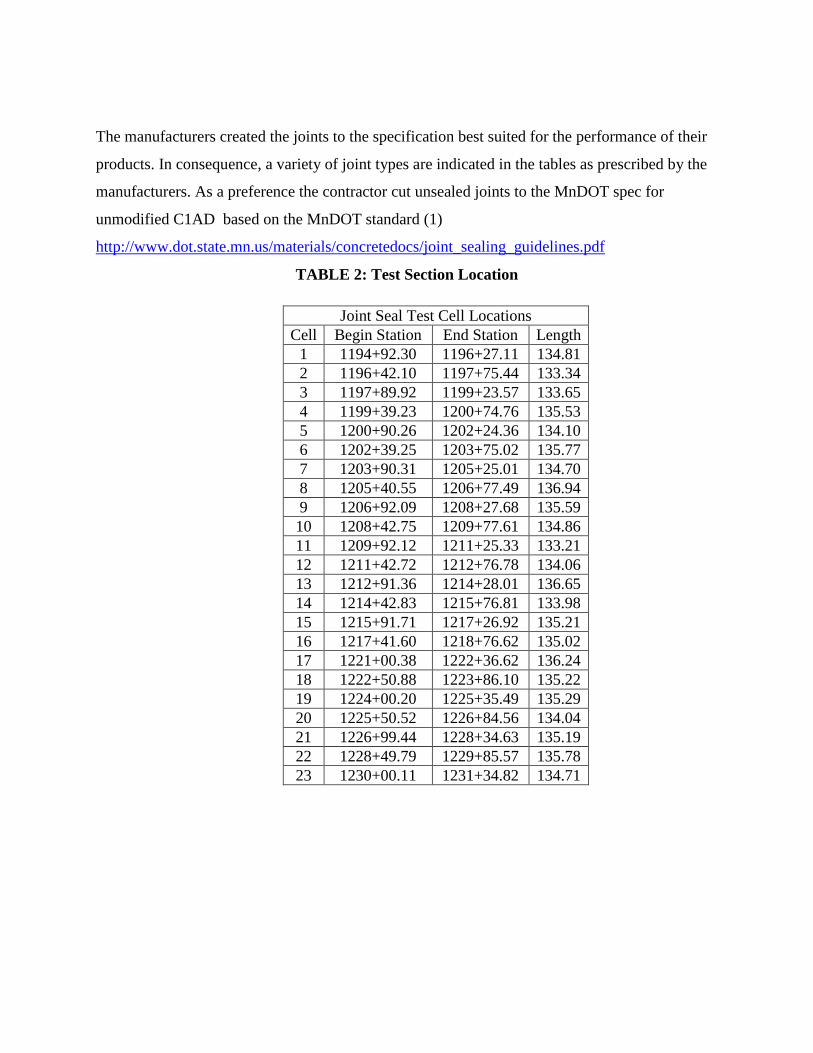
The manufacturers created the joints to the specification best suited for the performance of their
products. In consequence, a variety of joint types are indicated in the tables as prescribed by the
manufacturers. As a preference the contractor cut unsealed joints to the MnDOT spec for
unmodified C1AD based on the MnDOT standard (1)
http://www.dot.state.mn.us/materials/concretedocs/joint_sealing_guidelines.pdf
TABLE 2: Test Section Location
Joint Seal Test Cell Locations
Cell Begin Station End Station Length
1 1194+92.30 1196+27.11 134.81
2 1196+42.10 1197+75.44 133.34
3 1197+89.92 1199+23.57 133.65
4 1199+39.23 1200+74.76 135.53
5 1200+90.26 1202+24.36 134.10
6 1202+39.25 1203+75.02 135.77
7 1203+90.31 1205+25.01 134.70
8 1205+40.55 1206+77.49 136.94
9 1206+92.09 1208+27.68 135.59
10 1208+42.75 1209+77.61 134.86
11 1209+92.12 1211+25.33 133.21
12 1211+42.72 1212+76.78 134.06
13 1212+91.36 1214+28.01 136.65
14 1214+42.83 1215+76.81 133.98
15 1215+91.71 1217+26.92 135.21
16 1217+41.60 1218+76.62 135.02
17 1221+00.38 1222+36.62 136.24
18 1222+50.88 1223+86.10 135.22
19 1224+00.20 1225+35.49 135.29
20 1225+50.52 1226+84.56 134.04
21 1226+99.44 1228+34.63 135.19
22 1228+49.79 1229+85.57 135.78
23 1230+00.11 1231+34.82 134.71

Figure 1: Construction layout showing test section limits.
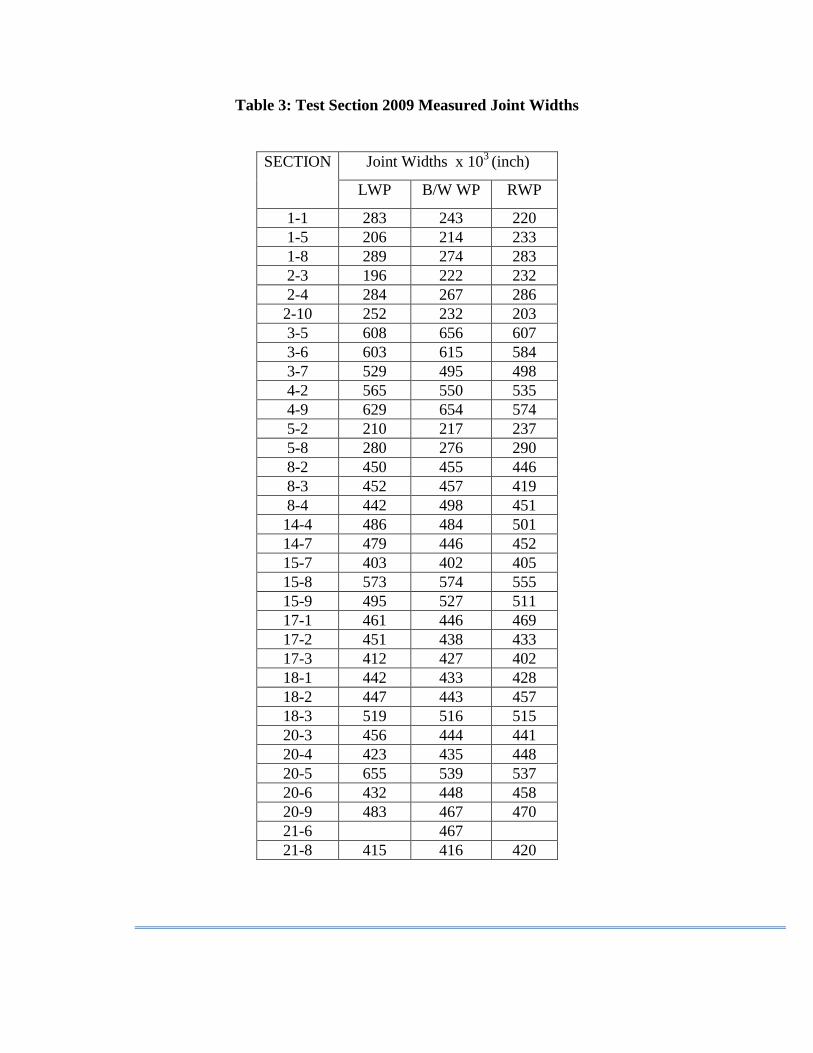
Table 3: Test Section 2009 Measured Joint Widths
SECTION Joint Widths x 103 (inch)
LWP B/W WP RWP
1-1 283 243 220
1-5 206 214 233
1-8 289 274 283
2-3 196 222 232
2-4 284 267 286
2-10 252 232 203
3-5 608 656 607
3-6 603 615 584
3-7 529 495 498
4-2 565 550 535
4-9 629 654 574
5-2 210 217 237
5-8 280 276 290
8-2 450 455 446
8-3 452 457 419
8-4 442 498 451
14-4 486 484 501
14-7 479 446 452
15-7 403 402 405
15-8 573 574 555
15-9 495 527 511
17-1 461 446 469
17-2 451 438 433
17-3 412 427 402
18-1 442 433 428
18-2 447 443 457
18-3 519 516 515
20-3 456 444 441
20-4 423 435 448
20-5 655 539 537
20-6 432 448 458
20-9 483 467 470
21-6 467
21-8 415 416 420

EARLIER MONITORING CRITERIA
Earlier monitoring protocol was based on the NTPEP schedule and process for evaluating joint
sealants. Before installation, GPS or Reference Point stationing of test sections were
documented, each joint in the test section labeled and each joint photographed. Joints were
labeled by test section and joint number. For example the first joint in the Test Section 4 was
labeled 4-1. A pavement condition survey done according to SHRP criteria and a detailed sketch
of the joints including the location of each sealant were done. The sketch included slope of the
pavement, joint spacing, joint width and any special condition of the joints. The joint spacing for
each test section was reported. Three joints were pinned with PK nails or pins on each side of the
joints for each test section. These pins were used to monitor joint movement during the course of
the evaluation. The annual average daily traffic and the closest weather data station was also
reported. Manufacturers supplied performance characteristics such as the amount of joint
movement the sealant is capable of withstanding or the sealant working range, the recommended
joint preparation and sealant installation procedures, and when the area can be reopened to
traffic. These conditions were applied if they did not conflict with the agency’s construction
practices. Assigned inspectors directed the suppliers and installers to their designated test
sections from the staging area. The joint preparation and sealant installation techniques used
during the installation were recorded. Any deviation from the manufacturer’s recommendations
was noted. Additionally, the manufacturer's representatives were allowed to provide comments
on the joint preparation and sealant installation. If the manufacturer's representative did provide
such comments, they were included with the installation report. Once product installation was
completed the suppliers removed leftover material and trash from the test deck. Digital
photographs were taken of each finished sealed joint. These initial photographs were used for
comparison to the photos taken at evaluation intervals.
Field observations: Field evaluation observations were taken each year from the date of
installation or at a time in which the sealant is in its greatest extension. The NTPEP evaluation
lasted for three years. It was mandatory that no maintenance work be done on the test sections
for those three years. Before any reading was taken, sand and debris was removed from the test
deck using a gas operated leaf blower. The Individual Joint Field Evaluation Worksheets were
used to track field observation over the course of the 3 year evaluation. It was helpful to use a

different color of ink for documenting sealant performance for each yearly evaluation. The
NTPEP JS/CS Photographic Reference Guide was used as a guide to rate sealant distresses.
Water Infiltration: Water infiltration was measured as the percentage of the overall joint length
where water can bypass the sealant and enter the joint either through complete adhesion or
cohesion failure. Adhesion and cohesion failures were determined through the SHRP Visual
Inspection Method. All joints in the driving lane were inspected to determine the percent
allowing water infiltration. Any visual cracks, splits or openings in the sealant or between the
sealant and PCC were examined to determine the depth of the opening. Instruments such as a
dull knife or a thin blade spatula were used in the evaluation. The percentages of joints that allow
water infiltration were determined by the equation:
%L = (Lf/ Ltot)* 100 (1)
where:
%L = Percent length of the joint allowing water infiltration
Lf = Total length of the joint sealant field test section allowing the infiltration of water
(inches)
Ltot = Total length of the joint sealant field test section (inches)
Each joint is then rated into a level of severity. The ratings were as follows:
1) No Water
2) Infiltration: %L = 0% < %L < 1%
3) Low Severity Water Infiltration: 1% < %L < 10%
4) Medium Severity Water Infiltration: 10% < %L < 30%
5) High Severity Water infiltration: %L > 30%
Debris or Stone Retention Severity Rating: No Debris Retention: No stones or debris were
stuck to the top of the sealant or embedded on the Surface of the sealant/ PCC interface.
Low Severity: Occasional stones and/or debris were stuck to the top of the sealant, or debris
embedded on the surface of the sealant/PCC interface.

Medium Severity: Stones or debris were stuck to the sealant and some debris is deeply
embedded in the sealant or material embedded between the sealant and the joint face but not
entering the joint below the sealant.
High Severity: A large amount of stones and debris were stuck to and deeply embedded in the
sealant or filling the joint, or a considerable amount of debris is embedded between the sealant
and the joint face and entering the joint below the sealant.
Seal Condition Number (SCN): The water infiltration and stone retention severity ratings were
used to calculate a Sealant Condition Number.
"Sealant Condition Number" (SCN) was assigned to the sealant once a year for three years.
Each distress type was rated as having no distress, low, medium, or high severity distress. The
results of the two severity distress ratings were inserted into the following equation to provide
the SCN.
SCN = 1(L) + 2(M) + 3(H) (2)
Where
SCN = Sealant Condition Number
L = the number of low severity sealant conditions
M = the number of medium severity sealant conditions
H = the number of high severity sealant conditions
If the sealant material has no defects, then the SCN is defined as 0, the best possible rating. A
SCN of 6, the worst possible rating, is obtained when both the debris retention and water
infiltration were rated as high severity.
Spalling: This is the length of any jointing, breaking, chipping or fraying of joint edges. The
length and severity of spalling was measured along each joint. Spalled areas were not counted as
adhesion failure.
Joint Movement: Longitudinal and transverse joint movements were measured by installing
pins or nails on both sides of three transverse joints. A drill was used to make a pilot hole for the
installation of the pins. Pins were place far enough away from the joints so as not to cause further
deterioration in the pin installation process. At each evaluation, joint movement was measured as
the distance between the pins measured by a caliper minus the spacing between the pins at
installation. Vertical movements at the joints or ruts were measured by the Georgia Fault meter
or a straightedge, wedge and caliper. Both joint movement measurements were an average of
nine measurements per test section.
Joint Spacing: The average joint spacing along with the spacing standard deviation was
reported. This information is acquired from the joint map done prior to installation of products.
Photo Log: Photographs of each joint for each test section per evaluation cycle was taken and
included in the report.
Tracking: Tracking of sealant by traffic was measured as linear distance in inches that the
sealant tracks from the sealed joint in the direction of traffic. The distance of tracking and
photographs may be used to determine levels of severity. Annual Average Daily Traffic, Deicing
Chemicals Used and Weather Data Annual average daily traffic in terms of total vehicle and
commercial vehicles were reported. Tons of salt per lane mile, tons of salt/sand mixture per lane
mile and gallons of salt brine per lane miles used were reported each year. Monthly daily high
temperature, monthly daily low temperature, number of days per month below freezing and total
monthly precipitation was reported from the nearest weather station. Additional information
such as the pavement condition, environmental conditions, secondary cracking and traffic
conditions will also be recorded.
Summary of NTPEP Evaluation: The original reports about this test section are contained
in the following reports:
Current NTPEP Reports
http://www.ntpep.org/Pages/JSReports.aspx (2) and (3)
NTPEP Report 16001.2 - Two Year Report of Field and Laboratory Evaluations of Joint
Sealant Materials for Portland Cement Concrete (2003 Minnesota Test Deck)
NTPEP Report 16001.3 - Three Year Report of Field and Laboratory Evaluations of Joint
Sealant Materials for Portland Cement Concrete (2003 Minnesota Test Deck)
CURRENT EVALUATION
The Evaluation procedure is based more on the effect of the joints on pavement roughness and
pavement condition. Table of measurements of joint width is shown in table 2. The following
discusses the IRI in each of the test sections while ascertaining the degree to which the joints
affect IRI. The pavement condition number is plotted against IRI in each sample to evaluate the
effect and ascertain if the joint conditions explain the IRI.
Joint Performance History (Visual Observation)
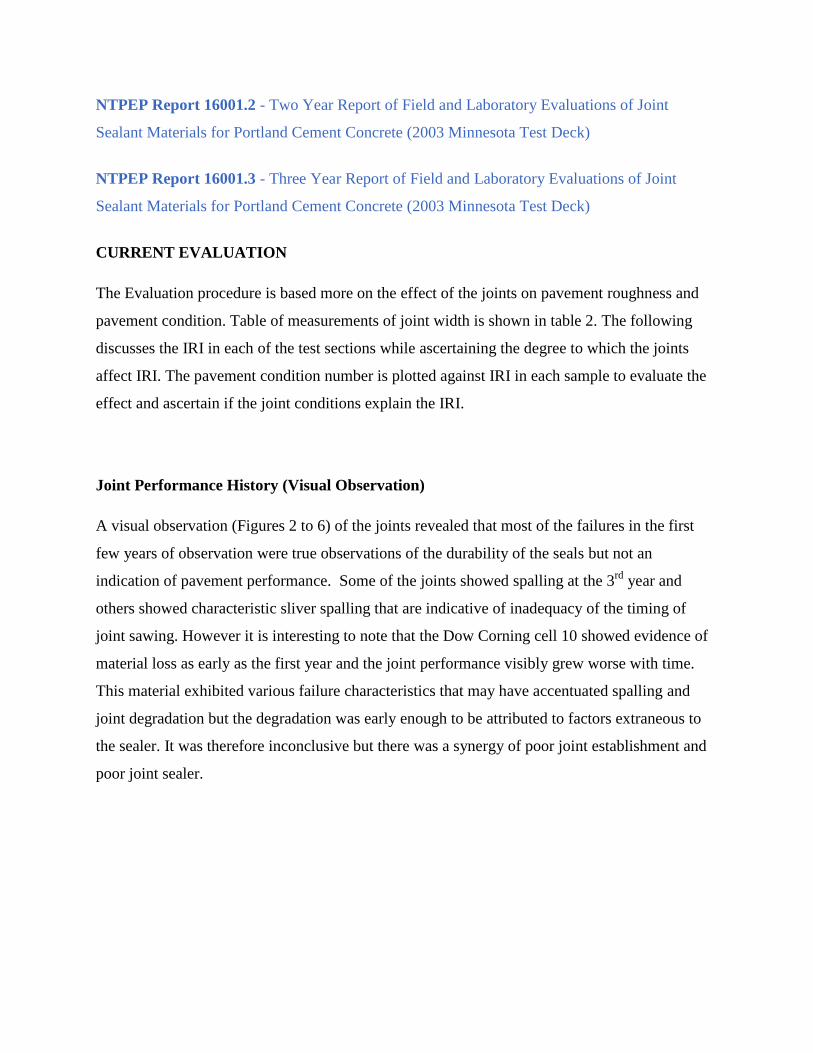
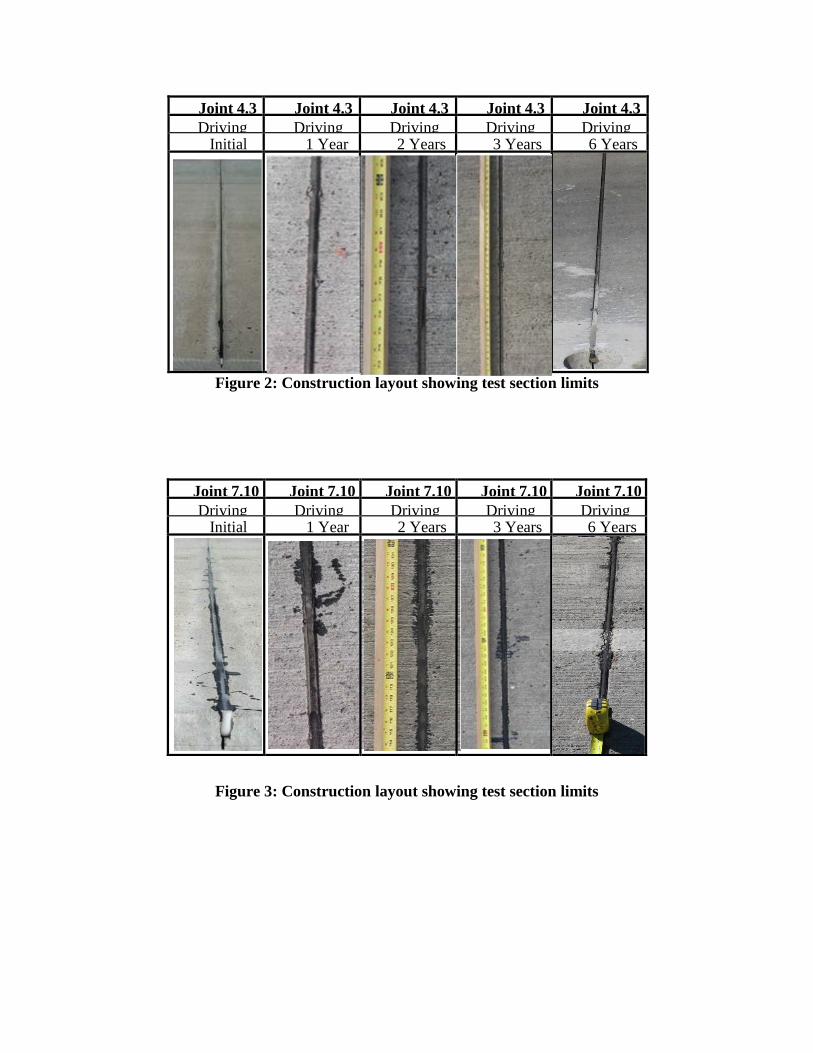
A visual observation (Figures 2 to 6) of the joints revealed that most of the failures in the first
few years of observation were true observations of the durability of the seals but not an
indication of pavement performance. Some of the joints showed spalling at the 3rd
year and
others showed characteristic sliver spalling that are indicative of inadequacy of the timing of
joint sawing. However it is interesting to note that the Dow Corning cell 10 showed evidence of
material loss as early as the first year and the joint performance visibly grew worse with time.
This material exhibited various failure characteristics that may have accentuated spalling and
joint degradation but the degradation was early enough to be attributed to factors extraneous to
the sealer. It was therefore inconclusive but there was a synergy of poor joint establishment and
poor joint sealer.
Joint 4.3 Joint 4.3 Joint 4.3 Joint 4.3 Joint 4.3
Driving
Lane
Driving
Lane
Driving
Lane
Driving
Lane
Driving
Lane Initial
‘03
1 Year
‘04
2 Years
‘05
3 Years
‘06
6 Years
‘09
Figure 2: Construction layout showing test section limits
Figure 3: Construction layout showing test section limits
Joint 7.10 Joint 7.10 Joint 7.10 Joint 7.10 Joint 7.10
Driving
Lane
Driving
Lane
Driving
Lane
Driving
Lane
Driving
Lane Initial
‘03
1 Year
‘04
2 Years
‘05
3 Years
‘06
6 Years
‘09
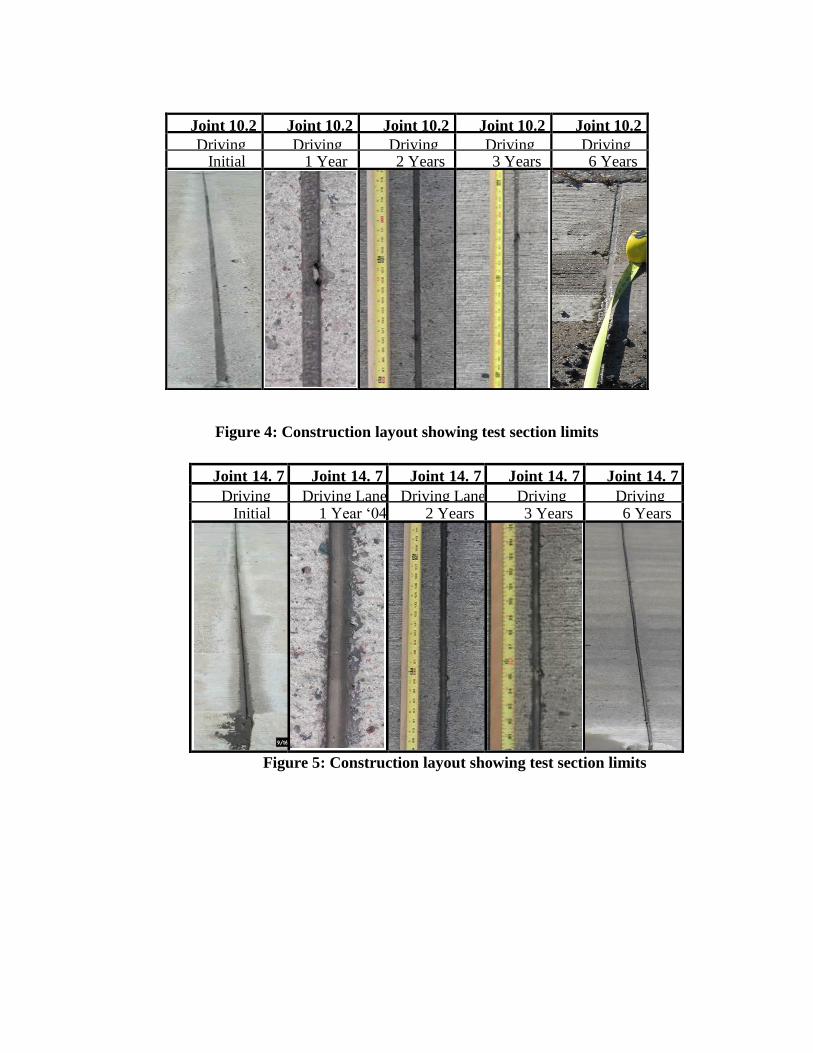
Figure 4: Construction layout showing test section limits
Joint 14. 7 Joint 14. 7 Joint 14. 7 Joint 14. 7 Joint 14. 7
Driving
Lane
Driving Lane Driving Lane Driving
Lane
Driving
Lane Initial
‘03
1 Year ‘04 2 Years
‘05
3 Years
‘06
6 Years
‘09
Figure 5: Construction layout showing test section limits
Joint 10.2 Joint 10.2 Joint 10.2 Joint 10.2 Joint 10.2
Driving
Lane
Driving
Lane
Driving
Lane
Driving
Lane
Driving
Lane Initial
‘03
1 Year
‘04
2 Years
‘05
3 Years
‘06
6 Years
‘09

Joint 21.6 Joint 21.6 Joint 21.6 Joint 21.6 Joint 21.6
Driving
Lane
Driving Lane Driving Lane Driving
Lane
Driving
Lane Initial
‘03
1 Year ‘04 2 Years
‘05
3 Years
‘06
6 Years
‘09
Figure 6: Construction layout showing test section limits
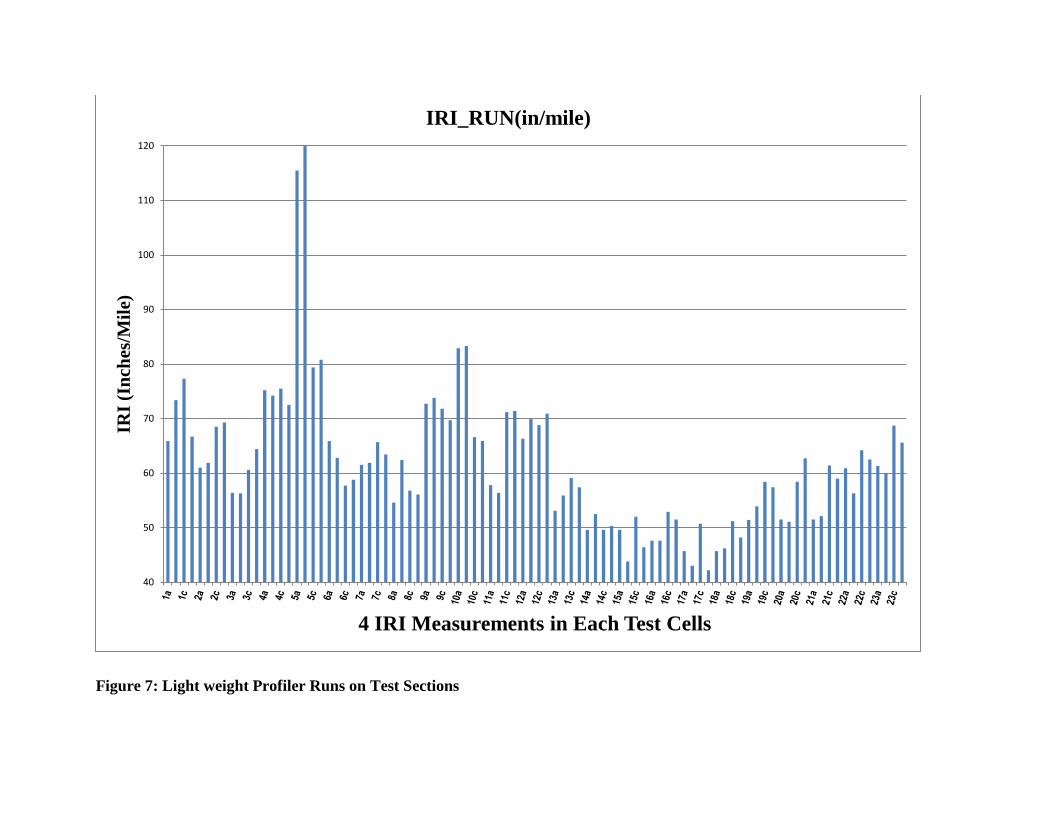
Figure 7: Light weight Profiler Runs on Test Sections
40
50
60
70
80
90
100
110
120
IRI
(In
ches
/Mil
e)
4 IRI Measurements in Each Test Cells
IRI_RUN(in/mile)

Pavement Smoothness Analysis
In 2009 ride measurements were conducted using the MnDOT Lightweight profiler to generate
the international roughness index. Figure 10 shows a continuously measured IRI that was
cropped in each test section. IRI ranged from 43 inches per mile to 120 inches per mile
indicating the overall test section generally has a good ride quality for a 7 year old pavement. In
individual test sections the joint conditions were reflected by the IRI. It was ascertained that of
the sealed joints the Dow Corning Joints in cell 10 was the worst performing. It is evident from
figure 7 that of the sealed joints the highest IRI of 83 inches per mile was recorded in cell 10
which was the test cell with the Dow Corning joint sealant. Additionally, the unsealed joints
registered the highest overall IRI of 120 inches per mile and most of the others were between 63
and 83 inches per mile, which is good but generally higher that IRI measured in sealed joints.
Some authors have attributed measurable effects of joints on IRI... Izevbekhai (4) shows that
proportionate increases in faulting in all panels lead to corresponding increases in IRI. To further
ascertain if joints are causative at least in part to the spiked IRI in cell 5, a power spectrum
density analysis was conducted. The PSD showed spikes at a wavelength of 15ft, and harmonics
at 7.5ft and 3.75ft, indicating that we cannot rule out joints (15 ft interval) as a major contributor
to the IRI in that test section. Figure 8 shows that detail.
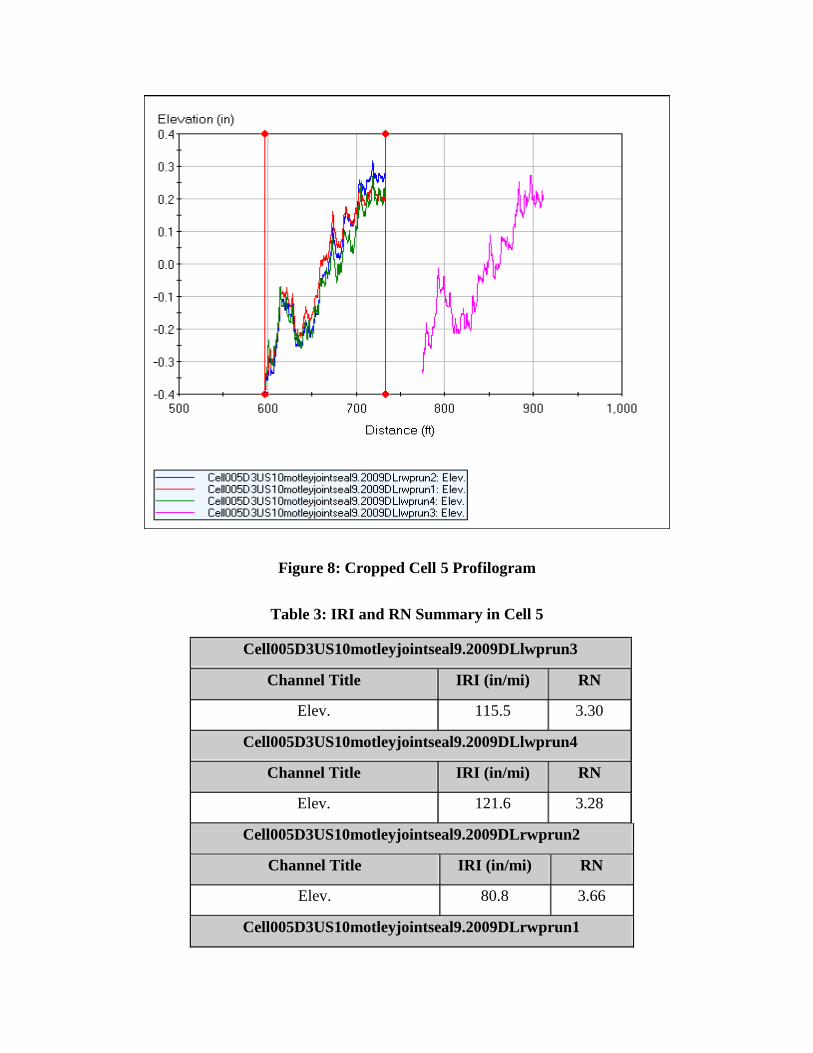
Figure 8: Cropped Cell 5 Profilogram
Table 3: IRI and RN Summary in Cell 5
Cell005D3US10motleyjointseal9.2009DLlwprun3
Channel Title IRI (in/mi) RN
Elev. 115.5 3.30
Cell005D3US10motleyjointseal9.2009DLlwprun4
Channel Title IRI (in/mi) RN
Elev. 121.6 3.28
Cell005D3US10motleyjointseal9.2009DLrwprun2
Channel Title IRI (in/mi) RN
Elev. 80.8 3.66
Cell005D3US10motleyjointseal9.2009DLrwprun1

Channel Title IRI (in/mi) RN
Elev. 79.4 3.67
Figure 9: Analysis - Power Spectral Density in Cell 5
Input Value Unit
PSD Calculation Slope
Use Point Reset No
Frequency Averaging No
Constant Frequency Interval 0.003048 cycle/ft
Pre-Processor Filter None
CONCLUSION
It is interesting to observe that within 7 years, the performance of the joints already affect the
performance of the joints and consequently the performance of the sealants. At this point in the
ongoing study there is strong evidence against the practice of leaving joints unsealed. The worst
performances by far were observed in the unsealed joints.
ACKNOWLEDEMENTS
Jim McGraw (Minnesota Department of Transportation) provided very useful background
information and John Pantelis (Minnesota Department of Transportation) assisted with current
measurements.
CAVEAT LECTOR
This report represents the opinion of the authors from research conducted by the authors and not
the Minnesota Department of transportation or any agency/institution. It does not constitute a
standard and does not purport to do so. Any appearance of similitude to a standard or
representation thereto exists only in the imagination of the reader.
REFERENCES
1) Minnesota Department of Transportation (2005) Standard for Joint Sealants URL
http://www.dot.state.mn.us/materials/concretedocs/joint_sealing_guidelines.pdf
Assessed 08-10-2012
2) NTPEP NTPEP Report 16001.2 - Two Year Report of Field and Laboratory
Evaluations of Joint Sealant Materials for Portland Cement Concrete (2003 Minnesota
Test Deck) URL http://www.ntpep.org/Pages/JSReports.aspx Assessed 08-12-2012.

3) NTPEP NTPEP Report 16001.3 - Three Year Report of Field and Laboratory
Evaluations of Joint Sealant Materials for Portland Cement Concrete (2003 Minnesota
Test Deck) URL http://www.ntpep.org/Pages/JSReports.aspx Assessed 08-12-2012.
4) Izevbekhai, B.I. (2012) Tire Pavement Interaction Noise of Concrete Pavements. Thesis
in Partial Fulfillment of Requirements for Doctor of Philosophy. University of
Minnesota.