concentration, soil-to-plant transfer factor and soil … · concentration, soil-to-plant transfer...
TRANSCRIPT
WM2009 Conference, March 1-5, 2009, Phoenix, AZ
Concentration, Soil-to-Plant Transfer Factor and Soil-Soil Solution Distribution Coefficient of Selenium in the Surface Environment -9106
Shigeo Uchida, Keiko Tagami, Nao Ishikawa
Office of Biospheric Assessment for Waste Disposal, National Institute of Radiological Sciences,
Anagawa 4-9-1, Inage-ku, Chiba 263-8555, Japan
ABSTRACT
Of the major radioactive selenium isotopes, Se-79, a beta emitter with a half-life of about 1.1 million years, is of special interest because it is one of the most important radionuclides for the long-term dose assessment of radioactive waste disposal. This radionuclide can reach human beings through several transfer paths in the environment. To predict Se-79 behavior from the environment to human beings, it would be useful to obtain the following information: stable Se concentration in environmental samples; soil–soil solution distribution coefficient (Kd); and soil-to-plant transfer factor (TF). In the present study, stable Se concentrations in river water, soil and crop samples collected in Japan, Kds and TFs were obtained. The results showed that geometric mean (GM) concentrations of river water, soil and crops were 0.057 µg/L (range: <D.L.-1.17 µg/L), 0.43 mg/kg (range: 0.068-1.56 mg/kg-dry), and 0.015 mg/kg-dry (range: <D.L.-0.24 mg/kg-dry), respectively. GMs of Kds for paddy field soil and upland field soil samples were 116 and 67, respectively, whereas GMs of TFs for brown rice and upland field crops were 0.066 and 0.024, respectively. Probably due to longer growing period and different water management in the paddy fields for brown rice compared to those for upland field crops, the TF would be high in brown rice.
INTRODUCTION
Selenium is an essential nutrient for animals; however, at high concentrations the element becomes toxic to animals. Of the major radioactive selenium isotopes, Se-79, a beta emitter with a half-life of about 1.1 million years, is of special interest because it is one of the most important radionuclides for the assessment of radioactive waste disposal in deep underground sites [1, 2]. This radionuclide can reach human beings through several transfer paths in the environment. The principal mechanism for the dispersion of radionuclides from radioactive wastes disposed underground is dissolution of the radionuclides into the ground water. The groundwater would transfer radionuclides to the surface environment, such as river water, where the water would be used as irrigation water for crops and drinking water for human beings and animals. In this way, Se-79 could be taken into the human body by ingestion of food and water.
To predict Se-79 transfer behavior from the environment to human beings, it would be useful to obtain following three information: (1) concentration of stable Se in environmental sample as natural analogue of Se-79; (2) soil–soil solution distribution coefficient (Kd); and (3) soil-to-plant transfer factors (TF). Se abundance in the natural environment has been reported [3-7]. Average crustal abundance of Se is 0.05 mg/kg, and its concentration in coal and other organic rich deposits can be high. Se concentrations in soil are typically in the range of 0.01-2 mg/kg with a world average of 0.4 mg/kg [3]. In natural waters, the data on Se concentrations are scarce. The concentration in river water is estimated to be 0.07 µg/L [4] and that in atmospheric precipitations is 0.04-1.4 µg/L [5]. For plant samples, the average concentration in various crop types collected in the USA ranged from 0.015-0.407 mg/kg dry weight [3] and was 0.02
WM2009 Conference, March 1-5, 2009, Phoenix, AZ
mg/kg dry weight in a reference plant [6]. Most plants contain around 0.025 mg/kg [7]. However, knowledge on mobility in soil and plant uptake behavior of Se in agricultural fields is still limited. In the present study, stable Se concentrations in river water, soil and crop samples collected in Japan, TFs of stable Se and Kd s of Se-75 were reported.
EXPERIMENTAL
River Water Samples
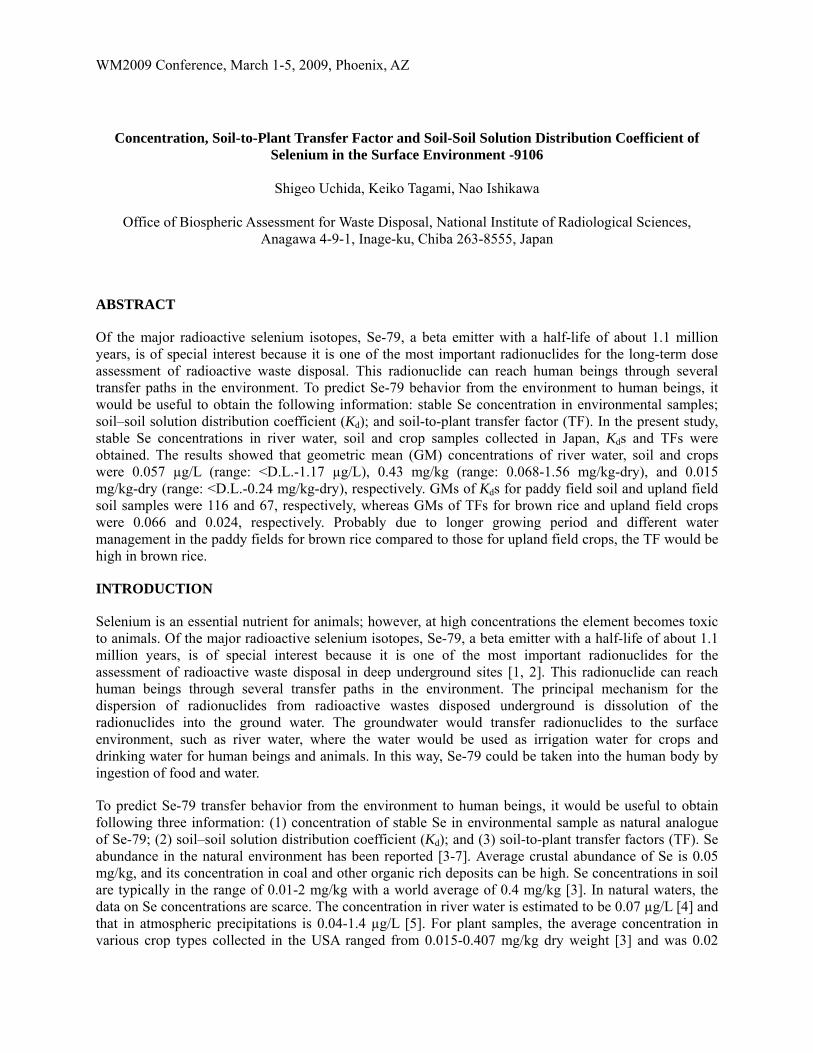
Sample collection We selected 45 major Japanese rivers as shown in Fig.1. Only 2-3 days were spent in collection at any one river, because river conditions can be affected by the weather and the season. Ten samples per river were collected from the upper stream to the river mouth. If it rained heavily within 3-5 days before the intended sampling dates, then the sampling was rescheduled to avoid a dilution effect from the rain. However if the water flow did not dramatically increase because only a small amount of rain fell, then we collected samples. Even if it rained on sampling dates, we also collected the samples if the water was not apparently different from its typical condition.
Fig.1. Forty-five major Japanese rivers. The uppermost limit of the upstream river section was selected as being where a car was able to could go and the lowermost limit of the upstream river section was selected as 5 to 10 km from the river estuary. Ten sampling points were selected by dividing the distance between the uppermost and lowermost limits into nine equal parts and then finding suitable bridges not far from the selected points. However we avoided sampling of muddy flows, places where another stream or river joined the sampled river and places near drainpipes. At places where a tributary flowed into the river, samples were taken downstream
WM2009 Conference, March 1-5, 2009, Phoenix, AZ
where river water was well-mixed (at a distance equal to ten times the river width). And when there were several parallel flows, samples were collected in the largest flow. In principle, collection points were selected in the center of the river width and samples were taken from bridges. If a suitable bridge was not found near the collection point, the river water was directly collected while standing on the riverbank. Analytical methods Polypropylene bottles, 500 mL and 100 mL, were used for sampling and storage to avoid sorption of elements on the bottle wall. All bottles were cleanly washed with nitric acid, rinsed with Milli-Q quality water (>18 MΩ) and finally dried under clean air conditions. The water temperature, pH, and electric conductivity (EC, µS/cm) were measured on-site. River water samples were collected in the clean-washed 100 mL polypropylene bottles. Each 100 mL bottle was filled with pretreated river water which was later directly used for laboratory measurements of Se by inductively coupled plasma mass spectrometry (ICP-MS). The pretreatment was done on-site as follows. About 150 mL of a collected river water sample were filtered using a disposable filter unit with a 0.45 µm pore size membrane filter. A small portion of the filtrate was used to wash the sample storage bottle, then the rest of the filtrate, ca 100 mL (weighed sample), was transferred into this washed bottle and 1 mL of concentrated nitric acid (Tama Chemical Industries., TAMAPURE AA-100) was added. After completing the pretreatment, these samples were also transported to our institute under cool condition (5˚C). At the laboratory, dissolved amounts of Se were determined by ICP-MS (Yokogawa, Agilent 7500c). Each measurement was made twice on different days and the average value was taken as a quantitative value. We used 2-3 multi-element standard solutions (SPEX, XSTC) and single element standard solutions (Merck, CertiPrep series); they were mixed and diluted with 2% HNO3 accordingly to measure target elements. Accuracy of the measurements was confirmed as needed by using standard samples purchased from National Institute of Standards and Technology (NIST) and National Institute for Environmental Studies.
Soil and Crop Samples
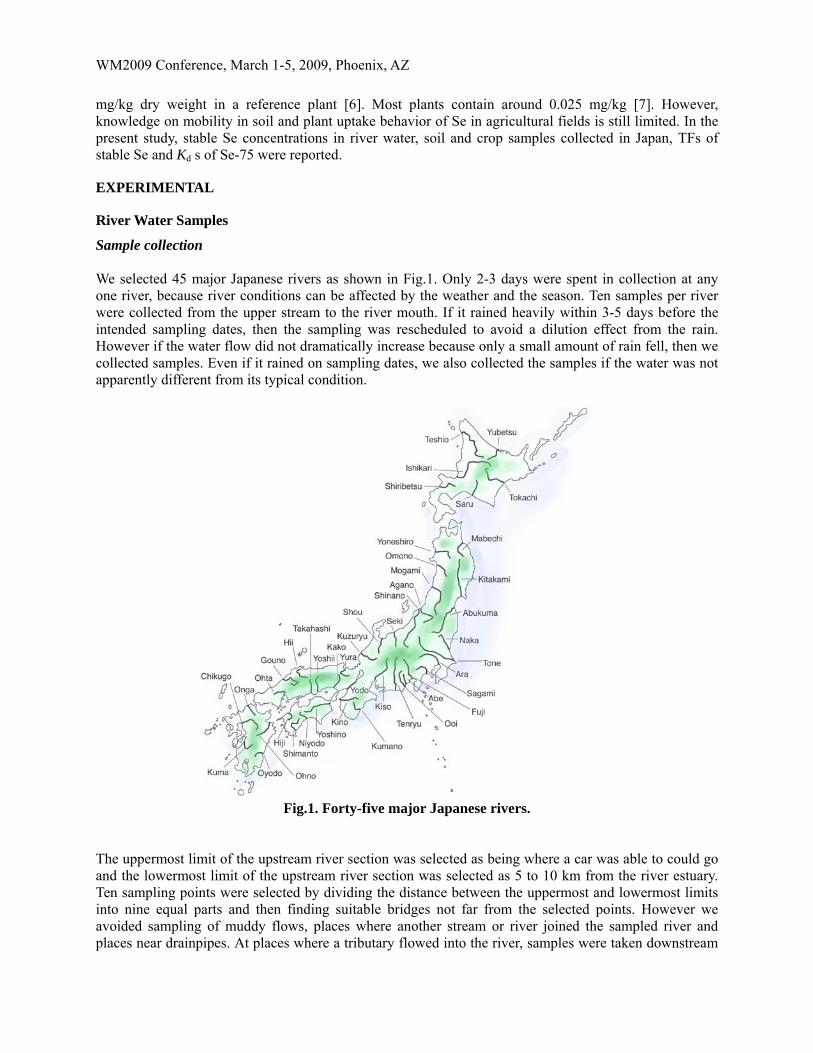
Sample collection and pretreatment Seventy-nine upland field and 63 paddy field soil samples (plowed soil layer: up to ca. 20 cm depth), were collected nationwide in 2002-2006 as shown in Fig.2. From one sampling field, 5 sub-samples, approximately 1 kg on fresh weight basis each, were collected in the harvesting season and these sub-samples were mixed well. About 15 kg amounts (on a fresh weight basis) of edible parts of crops were also collected. Crops were 63 brown rice samples (hulled rice), 18 green vegetable samples (cabbage, Chinese cabbage, spinach, lettuce and so on), 11 tuber samples (potato, sweet potato and taro), 12 allium samples (leek and onion), 7 legume samples (bean and pea), 18 fruit vegetable samples (cucumber, tomato, sweet pepper and so on), 10 root vegetable samples (carrot and Japanese radish) and 9 cereal samples (wheat and barley). Three kg of the soil samples were air-dried and passed through a 2-mm mesh sieve. For crop samples, edible parts were washed with deionized water at least 3 times, and the removal of dust and soil particles was completed. The washed parts were paper-towel dried, chopped and freeze-dried. For leek, green and white parts were separated. Leaves of carrot and Japanese radish are also edible so that roots and leaves were separated and elemental compositions of both of them were measured. Finally, samples of 142 soil samples and 148 crop parts were obtained and they were separately and thoroughly ground into fine powders. The powders were transferred into glass vials and stored at room temperature.
WM2009 Conference, March 1-5, 2009, Phoenix, AZ
Fig.2. Soil and crop sampling sites. Green: paddy fields, Orange: upland fields.
Measurements The pH (H2O) of the soils was measured at a soil:water ratio of 1:2.5. Cation exchange capacity was determined by the semi-micro Schollenberger’s method [8] using 1 mol/L of neutral ammonium acetate. The contents of total carbon were analyzed with CHN analyzer (Euro Vector, EuroEA3000) using 1-1.5 mg of crop samples and 10 mg of soil samples. Electric conductivity (EC) was measured at a soil:water ratio of 1:5. Soil particle size distribution was also analyzed. For the measurement of Se, samples were prepared as follows. The soil samples, 100 mg each, were digested with mineral acids (a mixture of HNO3, HF and HClO4) using a microwave digester (CEM, Mars 5). For crop samples, 500 mg amounts were used. To them were added 10 mL HNO3 and 4 mL HF. The mixtures were heated for 10 h at 80˚C to decompose organic matter. After that, microwave digestion was carried out. Following their digestion, both soil and crop samples were evaporated to near dryness at 140˚C. The residue was dissolved with 1 mL of conc. HNO3 and 0.5 mL of H2O2 and evaporated again. Finally, the residue was dissolved with 1 mL of 40% HNO3 and diluted with deionized water. The digestion samples were made in duplicate. All the acids used were ultra-pure analytical grade (Tama Chemicals, AA-100). Water (>18.1MΩ) which was treated using a Milli-Q water system (Millipore Co.) was used throughout the work. After diluting the acid solutions to a suitable concentration, elements in both crop and soil samples were measured using ICP-MS. Standard reference materials, such as SRM-1573a (NIST, tomato leaves), GBW-07603 (Institute of Geophysical and Geochemical Exploration, bush twigs and leaves), JB-3 (Geological Survey of Japan, igneous rock) were also analyzed together with the samples to check the accuracy of the method.
WM2009 Conference, March 1-5, 2009, Phoenix, AZ
Batch Sorption Test for Kd The Kd values of Se were obtained by means of separate batch sorption tests using Se-75 (half-life: 119.8d) as a tracer. Each soil sample and deionized water (solid/liquid ratio, 1 g dry weight per 10 mL or 3g dry weight per 30 mL) [9, 10] were mixed in a plastic bottle, and initially shaken for 24 h at 23˚C. A carrier free Se-75 solution (chemical form: selenite) was added to the well-mixed solution. Previously, we had confirmed that sorption equilibrium was reached within 7 days [9]. Thus, all samples were collected after shaking the mixture for 7 days. The suspension was centrifuged at 3000 rpm (Hitachi, Himac CT5L) for 10 min, and the supernatant was filtered through a 0.45-µm membrane filter (Millex-LH). Radioactivity of the radionuclide in the filtrate was measured with an NaI scintillation counter (Aloka, ARC-380).
RESULTS AND DISCUSSION
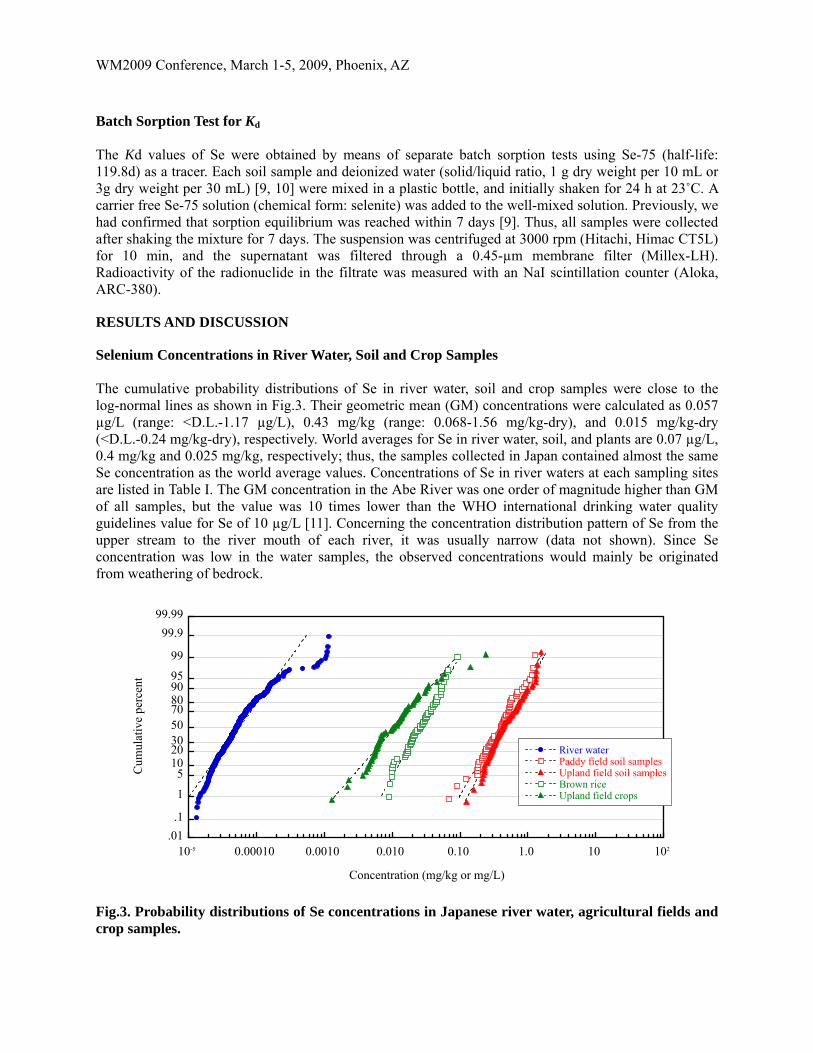
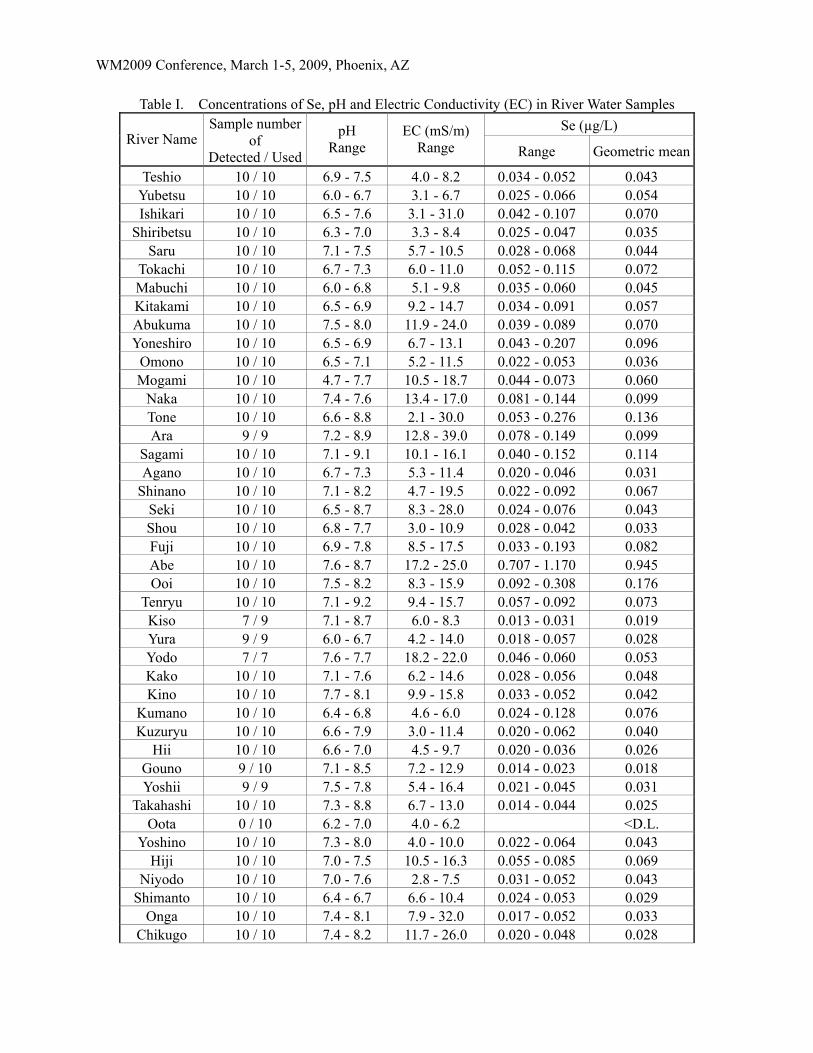
Selenium Concentrations in River Water, Soil and Crop Samples The cumulative probability distributions of Se in river water, soil and crop samples were close to the log-normal lines as shown in Fig.3. Their geometric mean (GM) concentrations were calculated as 0.057 µg/L (range: <D.L.-1.17 µg/L), 0.43 mg/kg (range: 0.068-1.56 mg/kg-dry), and 0.015 mg/kg-dry (<D.L.-0.24 mg/kg-dry), respectively. World averages for Se in river water, soil, and plants are 0.07 µg/L, 0.4 mg/kg and 0.025 mg/kg, respectively; thus, the samples collected in Japan contained almost the same Se concentration as the world average values. Concentrations of Se in river waters at each sampling sites are listed in Table I. The GM concentration in the Abe River was one order of magnitude higher than GM of all samples, but the value was 10 times lower than the WHO international drinking water quality guidelines value for Se of 10 µg/L [11]. Concerning the concentration distribution pattern of Se from the upper stream to the river mouth of each river, it was usually narrow (data not shown). Since Se concentration was low in the water samples, the observed concentrations would mainly be originated from weathering of bedrock.
10-5 0.00010 0.0010 0.010 0.10 1.0 10 102
.01
.1
1
51020305070809095
99
99.9
99.99
River waterPaddy field soil samplesUpland field soil samplesBrown riceUpland field crops
Concentration (mg/kg or mg/L)
Cum
ulat
ive
perc
ent
Fig.3. Probability distributions of Se concentrations in Japanese river water, agricultural fields and crop samples.
WM2009 Conference, March 1-5, 2009, Phoenix, AZ
Table I. Concentrations of Se, pH and Electric Conductivity (EC) in River Water Samples
Se (µg/L) River Name
Sample number of
Detected / Used
pH Range
EC (mS/m) Range Range Geometric mean
Teshio 10 / 10 6.9 - 7.5 4.0 - 8.2 0.034 - 0.052 0.043 Yubetsu 10 / 10 6.0 - 6.7 3.1 - 6.7 0.025 - 0.066 0.054 Ishikari 10 / 10 6.5 - 7.6 3.1 - 31.0 0.042 - 0.107 0.070
Shiribetsu 10 / 10 6.3 - 7.0 3.3 - 8.4 0.025 - 0.047 0.035 Saru 10 / 10 7.1 - 7.5 5.7 - 10.5 0.028 - 0.068 0.044
Tokachi 10 / 10 6.7 - 7.3 6.0 - 11.0 0.052 - 0.115 0.072 Mabuchi 10 / 10 6.0 - 6.8 5.1 - 9.8 0.035 - 0.060 0.045 Kitakami 10 / 10 6.5 - 6.9 9.2 - 14.7 0.034 - 0.091 0.057 Abukuma 10 / 10 7.5 - 8.0 11.9 - 24.0 0.039 - 0.089 0.070 Yoneshiro 10 / 10 6.5 - 6.9 6.7 - 13.1 0.043 - 0.207 0.096
Omono 10 / 10 6.5 - 7.1 5.2 - 11.5 0.022 - 0.053 0.036 Mogami 10 / 10 4.7 - 7.7 10.5 - 18.7 0.044 - 0.073 0.060
Naka 10 / 10 7.4 - 7.6 13.4 - 17.0 0.081 - 0.144 0.099 Tone 10 / 10 6.6 - 8.8 2.1 - 30.0 0.053 - 0.276 0.136 Ara 9 / 9 7.2 - 8.9 12.8 - 39.0 0.078 - 0.149 0.099
Sagami 10 / 10 7.1 - 9.1 10.1 - 16.1 0.040 - 0.152 0.114 Agano 10 / 10 6.7 - 7.3 5.3 - 11.4 0.020 - 0.046 0.031
Shinano 10 / 10 7.1 - 8.2 4.7 - 19.5 0.022 - 0.092 0.067 Seki 10 / 10 6.5 - 8.7 8.3 - 28.0 0.024 - 0.076 0.043 Shou 10 / 10 6.8 - 7.7 3.0 - 10.9 0.028 - 0.042 0.033 Fuji 10 / 10 6.9 - 7.8 8.5 - 17.5 0.033 - 0.193 0.082 Abe 10 / 10 7.6 - 8.7 17.2 - 25.0 0.707 - 1.170 0.945 Ooi 10 / 10 7.5 - 8.2 8.3 - 15.9 0.092 - 0.308 0.176
Tenryu 10 / 10 7.1 - 9.2 9.4 - 15.7 0.057 - 0.092 0.073 Kiso 7 / 9 7.1 - 8.7 6.0 - 8.3 0.013 - 0.031 0.019 Yura 9 / 9 6.0 - 6.7 4.2 - 14.0 0.018 - 0.057 0.028 Yodo 7 / 7 7.6 - 7.7 18.2 - 22.0 0.046 - 0.060 0.053 Kako 10 / 10 7.1 - 7.6 6.2 - 14.6 0.028 - 0.056 0.048 Kino 10 / 10 7.7 - 8.1 9.9 - 15.8 0.033 - 0.052 0.042
Kumano 10 / 10 6.4 - 6.8 4.6 - 6.0 0.024 - 0.128 0.076 Kuzuryu 10 / 10 6.6 - 7.9 3.0 - 11.4 0.020 - 0.062 0.040
Hii 10 / 10 6.6 - 7.0 4.5 - 9.7 0.020 - 0.036 0.026 Gouno 9 / 10 7.1 - 8.5 7.2 - 12.9 0.014 - 0.023 0.018 Yoshii 9 / 9 7.5 - 7.8 5.4 - 16.4 0.021 - 0.045 0.031
Takahashi 10 / 10 7.3 - 8.8 6.7 - 13.0 0.014 - 0.044 0.025 Oota 0 / 10 6.2 - 7.0 4.0 - 6.2 <D.L.
Yoshino 10 / 10 7.3 - 8.0 4.0 - 10.0 0.022 - 0.064 0.043 Hiji 10 / 10 7.0 - 7.5 10.5 - 16.3 0.055 - 0.085 0.069
Niyodo 10 / 10 7.0 - 7.6 2.8 - 7.5 0.031 - 0.052 0.043 Shimanto 10 / 10 6.4 - 6.7 6.6 - 10.4 0.024 - 0.053 0.029
Onga 10 / 10 7.4 - 8.1 7.9 - 32.0 0.017 - 0.052 0.033 Chikugo 10 / 10 7.4 - 8.2 11.7 - 26.0 0.020 - 0.048 0.028
WM2009 Conference, March 1-5, 2009, Phoenix, AZ
Kuma 10 / 10 6.2 - 6.9 6.2 - 11.4 0.034 - 0.062 0.048 Ohno 10 / 10 6.3 - 6.9 3.1 - 21.0 0.036 - 0.300 0.144
Ooyodo 10 / 10 6.8 - 8.6 12.9 - 21.0 0.134 - 0.479 0.176 All 430/ 443 4.7 - 9.2 2.1 - 39.0 0.013 - 1.170 0.057
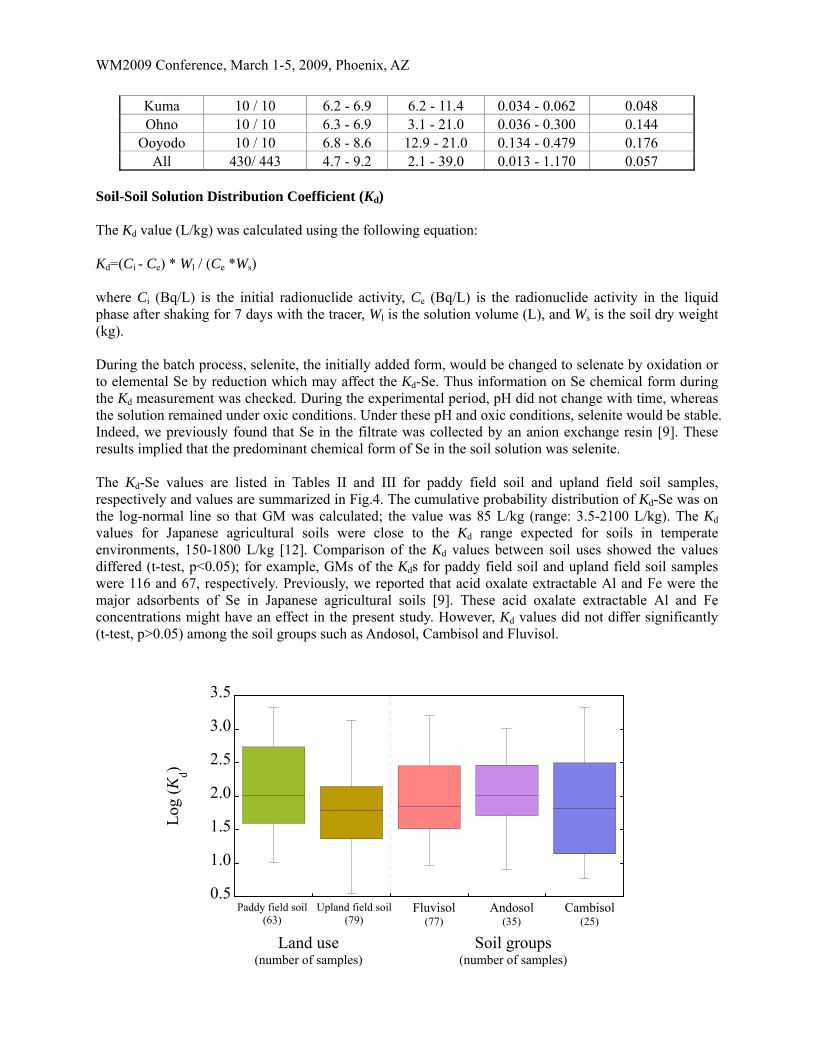
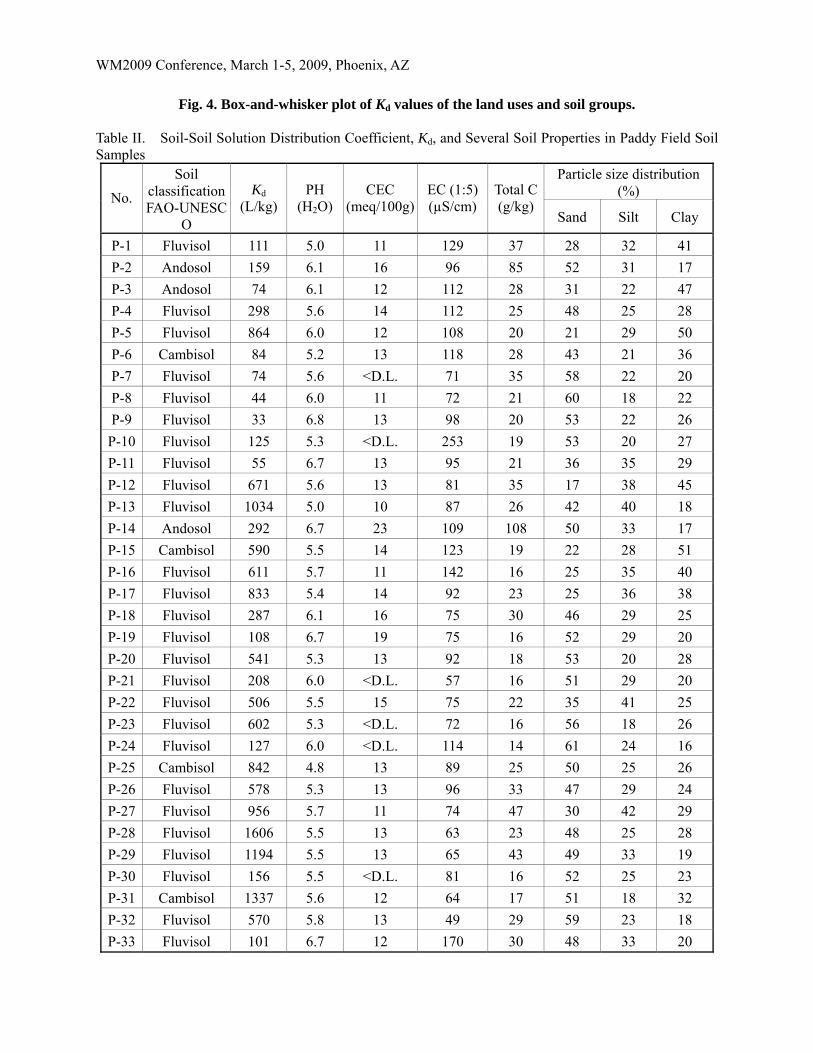
Soil-Soil Solution Distribution Coefficient (Kd) The Kd value (L/kg) was calculated using the following equation: Kd=(Ci - Ce) * Wl / (Ce *Ws) where Ci (Bq/L) is the initial radionuclide activity, Ce (Bq/L) is the radionuclide activity in the liquid phase after shaking for 7 days with the tracer, Wl is the solution volume (L), and Ws is the soil dry weight (kg). During the batch process, selenite, the initially added form, would be changed to selenate by oxidation or to elemental Se by reduction which may affect the Kd-Se. Thus information on Se chemical form during the Kd measurement was checked. During the experimental period, pH did not change with time, whereas the solution remained under oxic conditions. Under these pH and oxic conditions, selenite would be stable. Indeed, we previously found that Se in the filtrate was collected by an anion exchange resin [9]. These results implied that the predominant chemical form of Se in the soil solution was selenite. The Kd-Se values are listed in Tables II and III for paddy field soil and upland field soil samples, respectively and values are summarized in Fig.4. The cumulative probability distribution of Kd-Se was on the log-normal line so that GM was calculated; the value was 85 L/kg (range: 3.5-2100 L/kg). The Kd values for Japanese agricultural soils were close to the Kd range expected for soils in temperate environments, 150-1800 L/kg [12]. Comparison of the Kd values between soil uses showed the values differed (t-test, p<0.05); for example, GMs of the Kds for paddy field soil and upland field soil samples were 116 and 67, respectively. Previously, we reported that acid oxalate extractable Al and Fe were the major adsorbents of Se in Japanese agricultural soils [9]. These acid oxalate extractable Al and Fe concentrations might have an effect in the present study. However, Kd values did not differ significantly (t-test, p>0.05) among the soil groups such as Andosol, Cambisol and Fluvisol.
0.5
1.0
1.5
2.0
2.5
3.0
3.5
Paddy field soil(63)
Upland field soil(79)
Fluvisol(77)
Andosol(35)
Cambisol(25)
Log
(K
d)
Land use
(number of samples)Soil groups
(number of samples)
WM2009 Conference, March 1-5, 2009, Phoenix, AZ
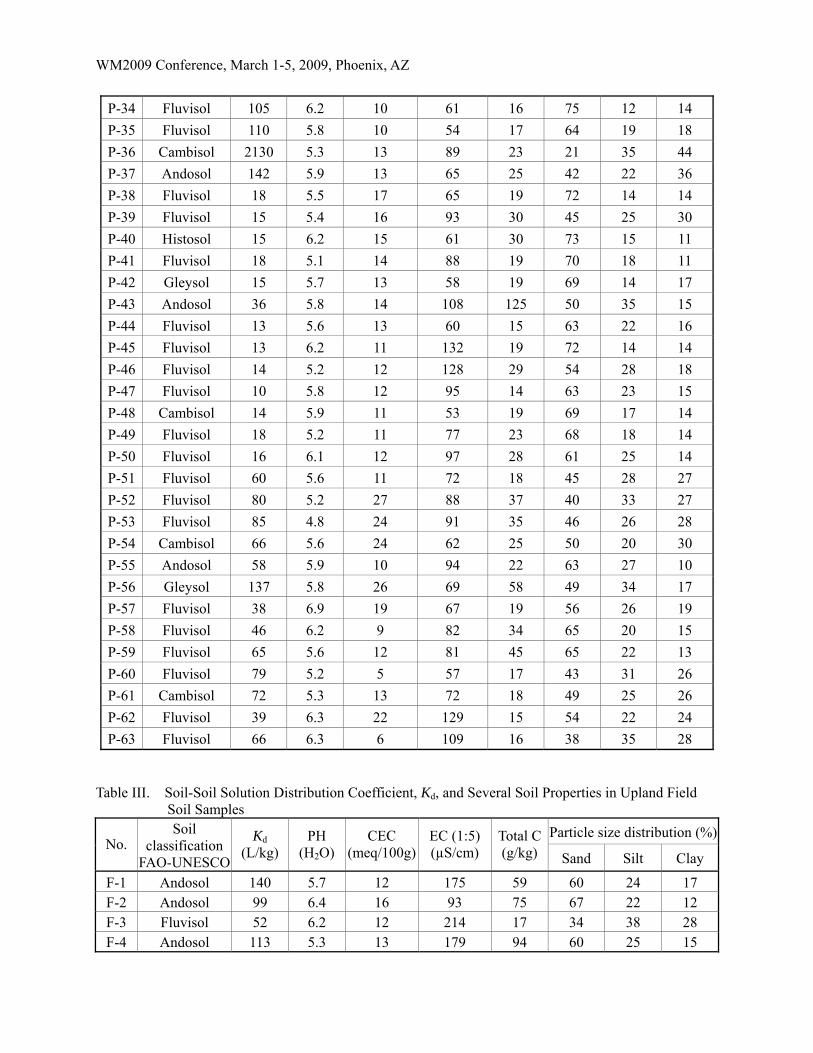
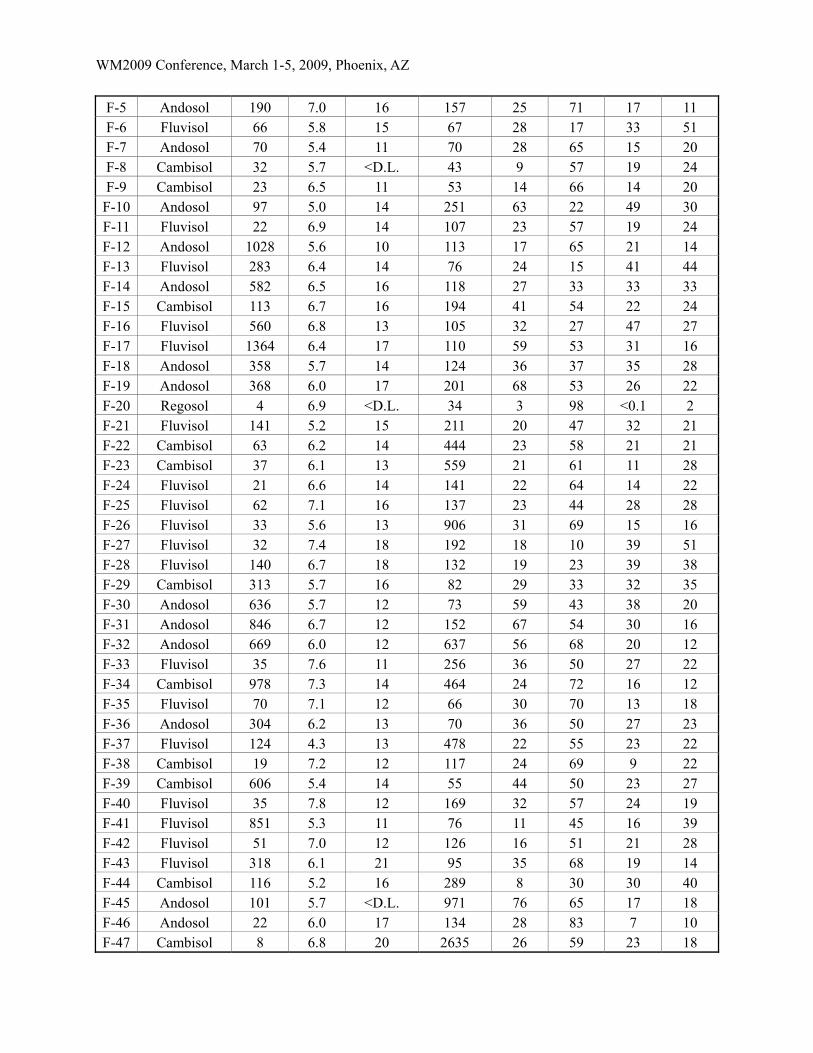
Fig. 4. Box-and-whisker plot of Kd values of the land uses and soil groups. Table II. Soil-Soil Solution Distribution Coefficient, Kd, and Several Soil Properties in Paddy Field Soil Samples
Particle size distribution (%) No.
Soil classification FAO-UNESC
O
Kd (L/kg)
PH (H2O)
CEC (meq/100g)
EC (1:5) (µS/cm)
Total C(g/kg)
Sand Silt Clay
P-1 Fluvisol 111 5.0 11 129 37 28 32 41
P-2 Andosol 159 6.1 16 96 85 52 31 17
P-3 Andosol 74 6.1 12 112 28 31 22 47
P-4 Fluvisol 298 5.6 14 112 25 48 25 28
P-5 Fluvisol 864 6.0 12 108 20 21 29 50
P-6 Cambisol 84 5.2 13 118 28 43 21 36
P-7 Fluvisol 74 5.6 <D.L. 71 35 58 22 20
P-8 Fluvisol 44 6.0 11 72 21 60 18 22
P-9 Fluvisol 33 6.8 13 98 20 53 22 26
P-10 Fluvisol 125 5.3 <D.L. 253 19 53 20 27
P-11 Fluvisol 55 6.7 13 95 21 36 35 29
P-12 Fluvisol 671 5.6 13 81 35 17 38 45
P-13 Fluvisol 1034 5.0 10 87 26 42 40 18
P-14 Andosol 292 6.7 23 109 108 50 33 17
P-15 Cambisol 590 5.5 14 123 19 22 28 51
P-16 Fluvisol 611 5.7 11 142 16 25 35 40
P-17 Fluvisol 833 5.4 14 92 23 25 36 38
P-18 Fluvisol 287 6.1 16 75 30 46 29 25
P-19 Fluvisol 108 6.7 19 75 16 52 29 20
P-20 Fluvisol 541 5.3 13 92 18 53 20 28
P-21 Fluvisol 208 6.0 <D.L. 57 16 51 29 20
P-22 Fluvisol 506 5.5 15 75 22 35 41 25
P-23 Fluvisol 602 5.3 <D.L. 72 16 56 18 26
P-24 Fluvisol 127 6.0 <D.L. 114 14 61 24 16
P-25 Cambisol 842 4.8 13 89 25 50 25 26
P-26 Fluvisol 578 5.3 13 96 33 47 29 24
P-27 Fluvisol 956 5.7 11 74 47 30 42 29
P-28 Fluvisol 1606 5.5 13 63 23 48 25 28
P-29 Fluvisol 1194 5.5 13 65 43 49 33 19
P-30 Fluvisol 156 5.5 <D.L. 81 16 52 25 23
P-31 Cambisol 1337 5.6 12 64 17 51 18 32
P-32 Fluvisol 570 5.8 13 49 29 59 23 18
P-33 Fluvisol 101 6.7 12 170 30 48 33 20
WM2009 Conference, March 1-5, 2009, Phoenix, AZ
P-34 Fluvisol 105 6.2 10 61 16 75 12 14
P-35 Fluvisol 110 5.8 10 54 17 64 19 18
P-36 Cambisol 2130 5.3 13 89 23 21 35 44
P-37 Andosol 142 5.9 13 65 25 42 22 36
P-38 Fluvisol 18 5.5 17 65 19 72 14 14
P-39 Fluvisol 15 5.4 16 93 30 45 25 30
P-40 Histosol 15 6.2 15 61 30 73 15 11
P-41 Fluvisol 18 5.1 14 88 19 70 18 11
P-42 Gleysol 15 5.7 13 58 19 69 14 17
P-43 Andosol 36 5.8 14 108 125 50 35 15
P-44 Fluvisol 13 5.6 13 60 15 63 22 16
P-45 Fluvisol 13 6.2 11 132 19 72 14 14
P-46 Fluvisol 14 5.2 12 128 29 54 28 18
P-47 Fluvisol 10 5.8 12 95 14 63 23 15
P-48 Cambisol 14 5.9 11 53 19 69 17 14
P-49 Fluvisol 18 5.2 11 77 23 68 18 14
P-50 Fluvisol 16 6.1 12 97 28 61 25 14
P-51 Fluvisol 60 5.6 11 72 18 45 28 27
P-52 Fluvisol 80 5.2 27 88 37 40 33 27
P-53 Fluvisol 85 4.8 24 91 35 46 26 28
P-54 Cambisol 66 5.6 24 62 25 50 20 30
P-55 Andosol 58 5.9 10 94 22 63 27 10
P-56 Gleysol 137 5.8 26 69 58 49 34 17
P-57 Fluvisol 38 6.9 19 67 19 56 26 19
P-58 Fluvisol 46 6.2 9 82 34 65 20 15
P-59 Fluvisol 65 5.6 12 81 45 65 22 13
P-60 Fluvisol 79 5.2 5 57 17 43 31 26
P-61 Cambisol 72 5.3 13 72 18 49 25 26
P-62 Fluvisol 39 6.3 22 129 15 54 22 24
P-63 Fluvisol 66 6.3 6 109 16 38 35 28 Table III. Soil-Soil Solution Distribution Coefficient, Kd, and Several Soil Properties in Upland Field
Soil Samples
Particle size distribution (%)No.
Soil classification
FAO-UNESCO
Kd (L/kg)
PH (H2O)
CEC (meq/100g)
EC (1:5) (µS/cm)
Total C (g/kg) Sand Silt Clay
F-1 Andosol 140 5.7 12 175 59 60 24 17 F-2 Andosol 99 6.4 16 93 75 67 22 12 F-3 Fluvisol 52 6.2 12 214 17 34 38 28 F-4 Andosol 113 5.3 13 179 94 60 25 15
WM2009 Conference, March 1-5, 2009, Phoenix, AZ
F-5 Andosol 190 7.0 16 157 25 71 17 11 F-6 Fluvisol 66 5.8 15 67 28 17 33 51 F-7 Andosol 70 5.4 11 70 28 65 15 20 F-8 Cambisol 32 5.7 <D.L. 43 9 57 19 24 F-9 Cambisol 23 6.5 11 53 14 66 14 20
F-10 Andosol 97 5.0 14 251 63 22 49 30 F-11 Fluvisol 22 6.9 14 107 23 57 19 24 F-12 Andosol 1028 5.6 10 113 17 65 21 14 F-13 Fluvisol 283 6.4 14 76 24 15 41 44 F-14 Andosol 582 6.5 16 118 27 33 33 33 F-15 Cambisol 113 6.7 16 194 41 54 22 24 F-16 Fluvisol 560 6.8 13 105 32 27 47 27 F-17 Fluvisol 1364 6.4 17 110 59 53 31 16 F-18 Andosol 358 5.7 14 124 36 37 35 28 F-19 Andosol 368 6.0 17 201 68 53 26 22 F-20 Regosol 4 6.9 <D.L. 34 3 98 <0.1 2 F-21 Fluvisol 141 5.2 15 211 20 47 32 21 F-22 Cambisol 63 6.2 14 444 23 58 21 21 F-23 Cambisol 37 6.1 13 559 21 61 11 28 F-24 Fluvisol 21 6.6 14 141 22 64 14 22 F-25 Fluvisol 62 7.1 16 137 23 44 28 28 F-26 Fluvisol 33 5.6 13 906 31 69 15 16 F-27 Fluvisol 32 7.4 18 192 18 10 39 51 F-28 Fluvisol 140 6.7 18 132 19 23 39 38 F-29 Cambisol 313 5.7 16 82 29 33 32 35 F-30 Andosol 636 5.7 12 73 59 43 38 20 F-31 Andosol 846 6.7 12 152 67 54 30 16 F-32 Andosol 669 6.0 12 637 56 68 20 12 F-33 Fluvisol 35 7.6 11 256 36 50 27 22 F-34 Cambisol 978 7.3 14 464 24 72 16 12 F-35 Fluvisol 70 7.1 12 66 30 70 13 18 F-36 Andosol 304 6.2 13 70 36 50 27 23 F-37 Fluvisol 124 4.3 13 478 22 55 23 22 F-38 Cambisol 19 7.2 12 117 24 69 9 22 F-39 Cambisol 606 5.4 14 55 44 50 23 27 F-40 Fluvisol 35 7.8 12 169 32 57 24 19 F-41 Fluvisol 851 5.3 11 76 11 45 16 39 F-42 Fluvisol 51 7.0 12 126 16 51 21 28 F-43 Fluvisol 318 6.1 21 95 35 68 19 14 F-44 Cambisol 116 5.2 16 289 8 30 30 40 F-45 Andosol 101 5.7 <D.L. 971 76 65 17 18 F-46 Andosol 22 6.0 17 134 28 83 7 10 F-47 Cambisol 8 6.8 20 2635 26 59 23 18
WM2009 Conference, March 1-5, 2009, Phoenix, AZ
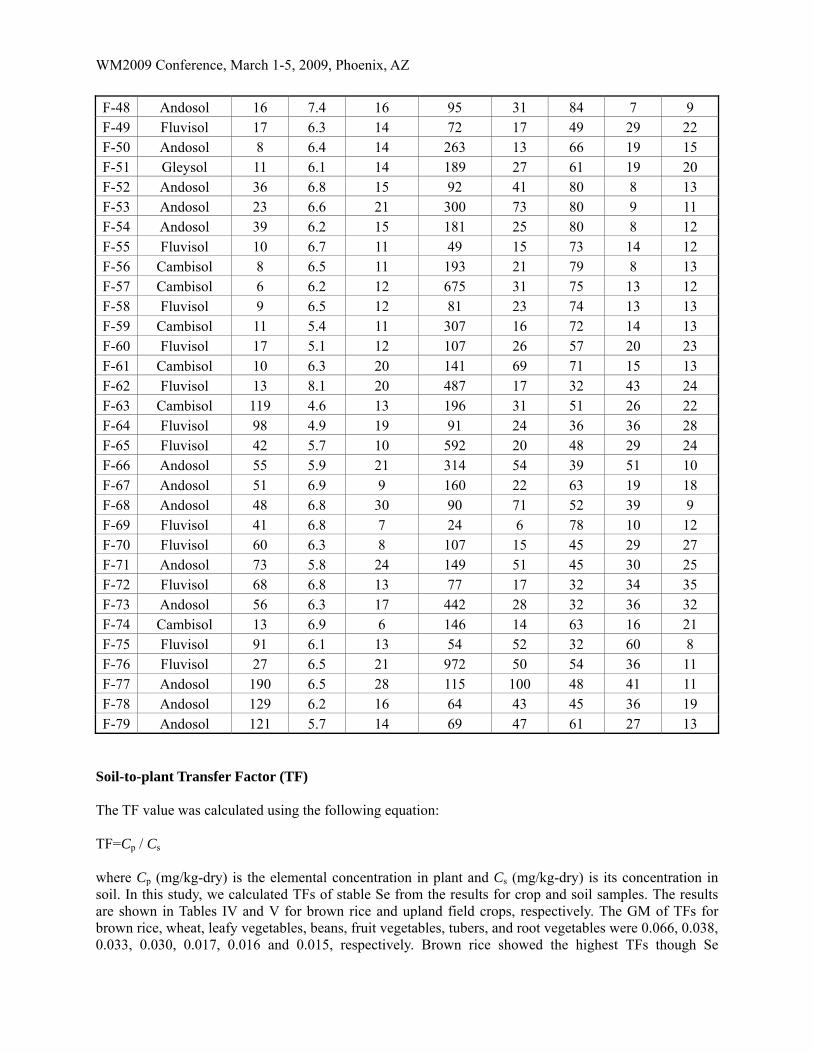
F-48 Andosol 16 7.4 16 95 31 84 7 9 F-49 Fluvisol 17 6.3 14 72 17 49 29 22 F-50 Andosol 8 6.4 14 263 13 66 19 15 F-51 Gleysol 11 6.1 14 189 27 61 19 20 F-52 Andosol 36 6.8 15 92 41 80 8 13 F-53 Andosol 23 6.6 21 300 73 80 9 11 F-54 Andosol 39 6.2 15 181 25 80 8 12 F-55 Fluvisol 10 6.7 11 49 15 73 14 12 F-56 Cambisol 8 6.5 11 193 21 79 8 13 F-57 Cambisol 6 6.2 12 675 31 75 13 12 F-58 Fluvisol 9 6.5 12 81 23 74 13 13 F-59 Cambisol 11 5.4 11 307 16 72 14 13 F-60 Fluvisol 17 5.1 12 107 26 57 20 23 F-61 Cambisol 10 6.3 20 141 69 71 15 13 F-62 Fluvisol 13 8.1 20 487 17 32 43 24 F-63 Cambisol 119 4.6 13 196 31 51 26 22 F-64 Fluvisol 98 4.9 19 91 24 36 36 28 F-65 Fluvisol 42 5.7 10 592 20 48 29 24 F-66 Andosol 55 5.9 21 314 54 39 51 10 F-67 Andosol 51 6.9 9 160 22 63 19 18 F-68 Andosol 48 6.8 30 90 71 52 39 9 F-69 Fluvisol 41 6.8 7 24 6 78 10 12 F-70 Fluvisol 60 6.3 8 107 15 45 29 27 F-71 Andosol 73 5.8 24 149 51 45 30 25 F-72 Fluvisol 68 6.8 13 77 17 32 34 35 F-73 Andosol 56 6.3 17 442 28 32 36 32 F-74 Cambisol 13 6.9 6 146 14 63 16 21 F-75 Fluvisol 91 6.1 13 54 52 32 60 8 F-76 Fluvisol 27 6.5 21 972 50 54 36 11 F-77 Andosol 190 6.5 28 115 100 48 41 11 F-78 Andosol 129 6.2 16 64 43 45 36 19 F-79 Andosol 121 5.7 14 69 47 61 27 13
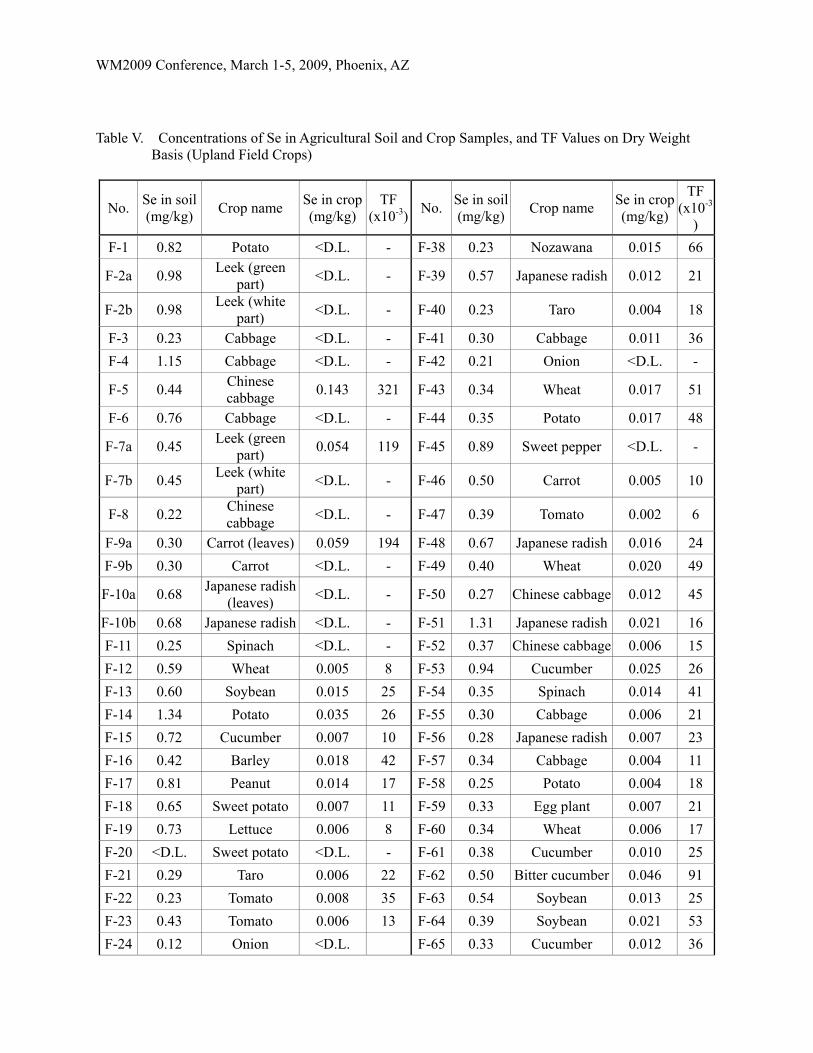
Soil-to-plant Transfer Factor (TF) The TF value was calculated using the following equation: TF=Cp / Cs where Cp (mg/kg-dry) is the elemental concentration in plant and Cs (mg/kg-dry) is its concentration in soil. In this study, we calculated TFs of stable Se from the results for crop and soil samples. The results are shown in Tables IV and V for brown rice and upland field crops, respectively. The GM of TFs for brown rice, wheat, leafy vegetables, beans, fruit vegetables, tubers, and root vegetables were 0.066, 0.038, 0.033, 0.030, 0.017, 0.016 and 0.015, respectively. Brown rice showed the highest TFs though Se
WM2009 Conference, March 1-5, 2009, Phoenix, AZ
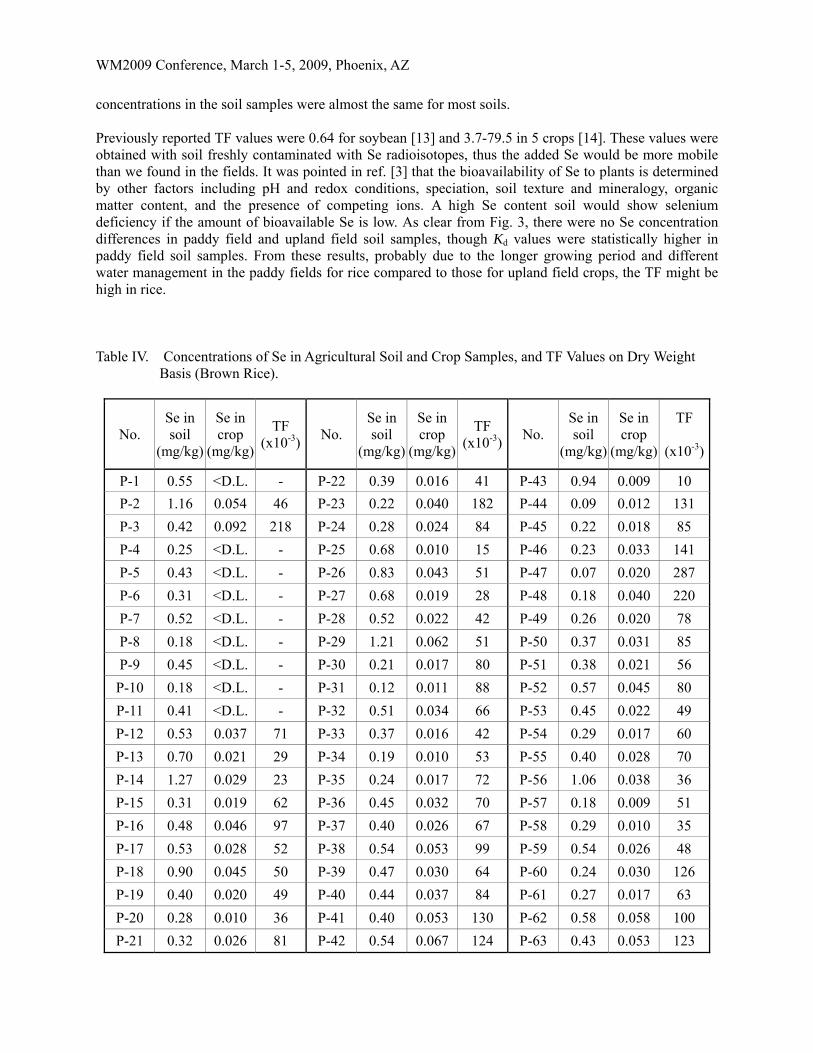
concentrations in the soil samples were almost the same for most soils. Previously reported TF values were 0.64 for soybean [13] and 3.7-79.5 in 5 crops [14]. These values were obtained with soil freshly contaminated with Se radioisotopes, thus the added Se would be more mobile than we found in the fields. It was pointed in ref. [3] that the bioavailability of Se to plants is determined by other factors including pH and redox conditions, speciation, soil texture and mineralogy, organic matter content, and the presence of competing ions. A high Se content soil would show selenium deficiency if the amount of bioavailable Se is low. As clear from Fig. 3, there were no Se concentration differences in paddy field and upland field soil samples, though Kd values were statistically higher in paddy field soil samples. From these results, probably due to the longer growing period and different water management in the paddy fields for rice compared to those for upland field crops, the TF might be high in rice. Table IV. Concentrations of Se in Agricultural Soil and Crop Samples, and TF Values on Dry Weight
Basis (Brown Rice).
No. Se in soil
(mg/kg)
Se in crop
(mg/kg)
TF (x10-3)
No. Se in soil
(mg/kg)
Se in crop
(mg/kg)
TF (x10-3)
No. Se in soil
(mg/kg)
Se in crop
(mg/kg)
TF
(x10-3)
P-1 0.55 <D.L. - P-22 0.39 0.016 41 P-43 0.94 0.009 10
P-2 1.16 0.054 46 P-23 0.22 0.040 182 P-44 0.09 0.012 131
P-3 0.42 0.092 218 P-24 0.28 0.024 84 P-45 0.22 0.018 85
P-4 0.25 <D.L. - P-25 0.68 0.010 15 P-46 0.23 0.033 141
P-5 0.43 <D.L. - P-26 0.83 0.043 51 P-47 0.07 0.020 287
P-6 0.31 <D.L. - P-27 0.68 0.019 28 P-48 0.18 0.040 220
P-7 0.52 <D.L. - P-28 0.52 0.022 42 P-49 0.26 0.020 78
P-8 0.18 <D.L. - P-29 1.21 0.062 51 P-50 0.37 0.031 85
P-9 0.45 <D.L. - P-30 0.21 0.017 80 P-51 0.38 0.021 56
P-10 0.18 <D.L. - P-31 0.12 0.011 88 P-52 0.57 0.045 80
P-11 0.41 <D.L. - P-32 0.51 0.034 66 P-53 0.45 0.022 49
P-12 0.53 0.037 71 P-33 0.37 0.016 42 P-54 0.29 0.017 60
P-13 0.70 0.021 29 P-34 0.19 0.010 53 P-55 0.40 0.028 70
P-14 1.27 0.029 23 P-35 0.24 0.017 72 P-56 1.06 0.038 36
P-15 0.31 0.019 62 P-36 0.45 0.032 70 P-57 0.18 0.009 51
P-16 0.48 0.046 97 P-37 0.40 0.026 67 P-58 0.29 0.010 35
P-17 0.53 0.028 52 P-38 0.54 0.053 99 P-59 0.54 0.026 48
P-18 0.90 0.045 50 P-39 0.47 0.030 64 P-60 0.24 0.030 126
P-19 0.40 0.020 49 P-40 0.44 0.037 84 P-61 0.27 0.017 63
P-20 0.28 0.010 36 P-41 0.40 0.053 130 P-62 0.58 0.058 100
P-21 0.32 0.026 81 P-42 0.54 0.067 124 P-63 0.43 0.053 123
WM2009 Conference, March 1-5, 2009, Phoenix, AZ
Table V. Concentrations of Se in Agricultural Soil and Crop Samples, and TF Values on Dry Weight
Basis (Upland Field Crops)
No. Se in soil (mg/kg)
Crop name Se in crop(mg/kg)
TF (x10-3)
No. Se in soil(mg/kg)
Crop name Se in crop(mg/kg)
TF (x10-3
)
F-1 0.82 Potato <D.L. - F-38 0.23 Nozawana 0.015 66
F-2a 0.98 Leek (green
part) <D.L. - F-39 0.57 Japanese radish 0.012 21
F-2b 0.98 Leek (white
part) <D.L. - F-40 0.23 Taro 0.004 18
F-3 0.23 Cabbage <D.L. - F-41 0.30 Cabbage 0.011 36
F-4 1.15 Cabbage <D.L. - F-42 0.21 Onion <D.L. -
F-5 0.44 Chinese cabbage
0.143 321 F-43 0.34 Wheat 0.017 51
F-6 0.76 Cabbage <D.L. - F-44 0.35 Potato 0.017 48
F-7a 0.45 Leek (green
part) 0.054 119 F-45 0.89 Sweet pepper <D.L. -
F-7b 0.45 Leek (white
part) <D.L. - F-46 0.50 Carrot 0.005 10
F-8 0.22 Chinese cabbage
<D.L. - F-47 0.39 Tomato 0.002 6
F-9a 0.30 Carrot (leaves) 0.059 194 F-48 0.67 Japanese radish 0.016 24
F-9b 0.30 Carrot <D.L. - F-49 0.40 Wheat 0.020 49
F-10a 0.68 Japanese radish
(leaves) <D.L. - F-50 0.27 Chinese cabbage 0.012 45
F-10b 0.68 Japanese radish <D.L. - F-51 1.31 Japanese radish 0.021 16
F-11 0.25 Spinach <D.L. - F-52 0.37 Chinese cabbage 0.006 15
F-12 0.59 Wheat 0.005 8 F-53 0.94 Cucumber 0.025 26
F-13 0.60 Soybean 0.015 25 F-54 0.35 Spinach 0.014 41
F-14 1.34 Potato 0.035 26 F-55 0.30 Cabbage 0.006 21
F-15 0.72 Cucumber 0.007 10 F-56 0.28 Japanese radish 0.007 23
F-16 0.42 Barley 0.018 42 F-57 0.34 Cabbage 0.004 11
F-17 0.81 Peanut 0.014 17 F-58 0.25 Potato 0.004 18
F-18 0.65 Sweet potato 0.007 11 F-59 0.33 Egg plant 0.007 21
F-19 0.73 Lettuce 0.006 8 F-60 0.34 Wheat 0.006 17
F-20 <D.L. Sweet potato <D.L. - F-61 0.38 Cucumber 0.010 25
F-21 0.29 Taro 0.006 22 F-62 0.50 Bitter cucumber 0.046 91
F-22 0.23 Tomato 0.008 35 F-63 0.54 Soybean 0.013 25
F-23 0.43 Tomato 0.006 13 F-64 0.39 Soybean 0.021 53
F-24 0.12 Onion <D.L. F-65 0.33 Cucumber 0.012 36
WM2009 Conference, March 1-5, 2009, Phoenix, AZ
F-25 0.32 Potato 0.007 21 F-66 0.59 Tomato 0.007 11
F-26 0.27 Lettuce 0.004 17 F-67 0.41 Wheat 0.024 58
F-27 0.29 Onion 0.005 18 F-68 0.88 Japanese radish 0.030 34
F-28 0.31 Barley 0.013 42 F-69 0.22 Egg plant 0.006 27
F-29 0.84 Potato 0.010 12 F-70 0.37 Wheat 0.013 35
F-30 1.38 Japanese radish 0.014 10 F-71 1.18 Tomato 0.010 8
F-31 1.56 Wheat 0.240 154 F-72 0.36 Soybean 0.031 88
F-32 1.30 Sweet pepper 0.007 5 F-73 0.36 Tomato 0.006 17
F-33 0.43 Cabbage 0.005 13 F-74 0.16 Onion 0.002 14
F-34 0.52 Egg plant 0.012 23 F-75 0.67 Soybean 0.010 15
F-35a 0.44 Leek (green
part) 0.024 55 F-76 0.55 Egg plant 0.005 9
F-35b 0.44 Leek (white
part) 0.008 18 F-77 1.33 Carrot 0.006 5
F-36a 0.73 Leek (green
part) 0.033 46 F-78 0.53 Soybean 0.015 28
F-36b 0.73 Leek (white
part) 0.022 30 F-79 0.47 Sweet potato 0.001 3
F-37 0.26 Egg plant <D.L. -
ACKNOWLEDGEMENTS
We thank Mr. T. Takamure and Ms. I. Hirai (Tokyo Nuclear Co., Ltd.) for their technical support. This work was partially supported by the Agency for Natural Resources and Energy, the Ministry of Economy, Trade and Industry (METI), Japan.
REFERENCES
1. JAPAN NUCLEAR CYCLE DEVELOPMENT INSTITUTE, “H12: Project to Establish the Scientific and Technical Basis for HLW Disposal in Japan, Supporting Report 3”, JNC TN1400 99-020, Japan Nuclear Cycle Development Institute (1999).
2. THE FEDERATION OF ELECTRIC POWER COMPANIES OF JAPAN and JAPAN NUCLEAR CYCLE DEVELOPMENT INSTITUTE, “Second Progress Report on Research and Development for TRU Waste Disposal in Japan -Design, Safety Assessment and Means of Implementation in the Generic Phase-“, The Federation of Electric Power Companies of Japan (2005). [in Japanese] (English version is in press).
3. J. A. PLANT, D. G. KINNIBURGH, P. L. SMEDLEY, F. M. FORDYCE, and B. A. KLINCK, “Arsenic and selenium”, In “Treatise on Geochemistry” (H. D. Holland, K. K. Turekian Eds.), Elsevier, Amsterdam. 9: 17-66 (2005).
4. J. GAILLARDET, J. VIERS and B. DUPRE, “Trace elements in river waters”, In “Treatise on Geochemistry” (H. D. Holland, K. K. Turekian Eds.), Elsevier, Amsterdam. 5: 225-272 (2004).
5. Y. HASHIMOTO and J. W. WINCHESTER, “Selenium in the atmosphere,” Environ. Sci. Technol. 1, 338-340 (1967).
6. B. MARKERT, “Instrumental Element and multi-element analysis of plant samples”, John Wiley & Sons, Chichester (1996).
WM2009 Conference, March 1-5, 2009, Phoenix, AZ
7. A. KABATA-PENDIAS and A. B. MUKHERJEE, “Trace elements from soil to human”, Springer, Berlin (2007).
8. C. J. SCHOLLENBERGER and R. H. SIMON, “Determination of exchangeable capacity and exchangeable bases in soils”, Soil Sci. 59, 13-24 (1945).
9. Y. NAKAMARU, K. TAGAMI and S. UCHIDA, “Distribution coefficient of selenium in Japanese agricultural soils”, Chemosphere 58, 1347-1354 (2005).
10. N. K. ISHIKAWA, S. UCHIDA and K. TAGAMI, “Soil-soil solution distribution coefficient for radionuclides in Japanese agricultural soils”, In “Proceedings of 16th Pacific Basin Nuclear Conference”, Aomori, Paper ID P161123. (2008).
11. WORLD HEALTH ORGANIZATION, “Guidelines for Drinking-water Quality: incorporation first addendum to third edition, Volume 1 Recommendations”, WHO, Geneva (2006).
12. INTERNATIONAL ATOMIC ENERGY AGENCY, “Handbook of Parameter Values for the Prediction of Radionuclide Transfer in Temperate Environments”, Technical Report Series No.364, IAEA, Vienna (1994).
13. S. AMBE, Y. OHKUBO, Y. KOBAYASHI, M. IWAMOTO, H. MAEDA and M. YANOKURA, “Multitracer study on transport and distribution of metal ions in plants”, J. Radioanal. Nucl. Chem., 195, 305-313 (1995).
14. C. MUNIER-LAMY, S. DENEUX-MUSTIN, C. MUSTIN, D. MERLET, J. BERTHELIN and C. LEYVAL, “Selenium bioavailability and uptake as affected by four different plants in a loamy clay soil with particular attention to mycorrhizae inoculated ryegrass”, J. Environ. Radioactiv. 97, 148-158 (2007).