computer controlled guitar player
DESCRIPTION
Senior design paperTRANSCRIPT
1
University of Massachusetts Dartmouth
Senior Design Team 7 Final Report
ECE 458 Senior Design II Dr. Fortier
Computer Controlled Guitar Player
Due: May 4, 2015
2
Signatures of Approval:
Electrical Engineer:
Julian Azevedo_______________________________
Mechanical Engineer:
Vinny Capone________________________________
Computer Engineer:
Matt Crossman_______________________________
Electrical Engineer/ Group Leader:
Caty Duncan________________________________
Mechanical Engineer:
Jose Robert_________________________________
Customer: Mark Whittaker ________________________
Advisor: Dr. Honggang Wang_______________________
3
Table of Contents 1. Introduction ........................................................................................................................................... 5
2. Requirements and Needs ....................................................................................................................... 5
2.1. Course Requirements .................................................................................................................... 6
2.2. Customer Requirements ................................................................................................................ 6
3. Task Statement (TS), Statement of Work (SOW), Work Breakdown Structure (WBS), Task Responsibility Matrix (TRM) and Team Process Guidelines ..................................................................... 10
3.1. Task Statement ............................................................................................................................ 10
3.2. Statement of Work ...................................................................................................................... 14
3.3. Work Breakdown Structure ........................................................................................................ 14
3.4. Task Responsibility Matrix ......................................................................................................... 16
3.5. Team Process Guidelines ............................................................................................................ 16
4. Technical Approach ............................................................................................................................ 17
4.1. Design 1 ...................................................................................................................................... 18
4.2. Design 2 ...................................................................................................................................... 19
4.3. Design 3 ...................................................................................................................................... 19
4.4. Final Design Selection ................................................................................................................ 20
4.5. Final Design Implementation ...................................................................................................... 22
4.6. Interface Requirements ............................................................................................................... 25
5. Schedule .............................................................................................................................................. 27
6. Budget ................................................................................................................................................. 30
7. Risk Analysis ...................................................................................................................................... 33
8. Earned Value Analysis ........................................................................................................................ 38
9. Acceptance Test Plan Results ............................................................................................................. 39
10. Conclusion and Current Status ........................................................................................................ 40
11. Appendix ......................................................................................................................................... 42
Table of Figures
Figure 1: Work Breakdown Structure ......................................................................................................... 15 Figure 2: Level 0 System Architecture for Design 1 .................................................................................. 18 Figure 3: Level 0 System Architecture for Design 2 .................................................................................. 19 Figure 4: Level 0 System Architecture for Design 3 .................................................................................. 20 Figure 5: Level 1 System Architecture for the Chosen Design .................................................................. 21 Figure 6: Final Design Sketch ...................................................................................................................... 21 Figure 7: Lead Screw Solid Works Design ................................................................................................... 22 Figure 8: Custom Carriages ......................................................................................................................... 23 Figure 9: Software Interface Flow Chart .................................................................................................... 25
4
Figure 10: Arduino Flow Chart ................................................................................................................... 26 Figure 11: Technical Performance Fever Chart ........................................................................................... 35 Figure 12: Updated Technical Performance Fever Chart ............................................................................ 35 Figure 13: Schedule Risk Fever Chart ........................................................................................................ 36 Figure 14: Updated Schedule Fever Chart .................................................................................................. 36 Figure 15: Budget Risk Fever Chart ........................................................................................................... 37 Figure 16: Updated Budget Risk Fever Chart .............................................................................................. 37 Figure 17: Complete Schedule .................................................................................................................... 61 Figure 18: Visual Scheduling Aid ................................................................................................................. 64
Table of Tables
Table 1: Engineering- Marketing Tradeoff Matrix ........................................................................................ 7 Table 2: Engineering-Engineering Tradeoff Matrix ....................................................................................... 8 Table 3: Task Statement Table .................................................................................................................... 10 Table 4: Summarized Task responsibility Matrix ........................................................................................ 16 Table 5: Team Process Guidelines .............................................................................................................. 16 Table 6: Design Comparison ....................................................................................................................... 20 Table 7: Initial Schedule .............................................................................................................................. 28 Table 8: Final Schedule ............................................................................................................................... 28 Table 9: Actual Cost Budget ........................................................................................................................ 30 Table 10: Production Cost Budget .............................................................................................................. 31 Table 11: Production Cost with Labor Budget ............................................................................................ 31 Table 12: Final Production Cost with Labor Budget .................................................................................... 32 Table 13: ATP Results .................................................................................................................................. 39
Acronyms
CRE Center for Rehabilitation Engineering
EVA Earned Value Analysis
GUI Graphical User Interface
SME Subject Matter Expert
SOW Statement of Work
TRM Task Responsibility Matrix
TS Task Statement
WBS Work Breakdown Structure
5
1. Introduction
This report details the work completed for the Computer Controlled Guitar Player senior design
project for the Center for Rehabilitation Engineering at the University of Massachusetts
Dartmouth. The scope of the project was to design, build and test a computer controlled musical
instrument device that would allow an individual with limited mobility to create, store and
playback music on a pluck-able string instrument. Musicians are undoubtedly some of the most
passionate people in the world but playing an instrument, such as a guitar, is not an easy task for
a musician with limited mobility. This device will open doors allowing a disabled individual to
surpass physical boundaries and create music without limitation.
This project is sponsored by the Center for Rehabilitation Engineering, a non-profit organization
which designs and manufactures tools to help disabled individuals complete everyday tasks.
2. Requirements and Needs
The requirements for this project can be broken down into two distinct categories. The first is the
course requirements. This includes all of the documentation and requirements for both ECE 457
and ECE 458. These requirements were determined by the respective professors and distributed
to each group at the beginning of the semester. The second category is the customer
requirements. The customer requirements were generated by discussing the project with the
customer, Mark Whittaker from the Center for Rehabilitation Engineering (CRE). The following
sections document both of the needs categories.
6
2.1. Course Requirements
The following list shows the course requirements as distributed by the course instructors.
a. “Resume” (Sept 9)
b. System Requirements Review (SRR) (Oct 14 and 16)
c. Project Plan (Nov 25)
d. Acceptance Test Plan (Dec 2)
e. Preliminary Design Review (PDR) (Dec 2 and 4)
f. Preliminary Bill of Materials (BoM)(Dec 2)
g. Project Notebooks (one per student) (Dec 4)
h. Critical Design Review (CDR) (Mar 10)
i. Project Final Report (May 4)
j. Final Design Presentation (May 6)
k. Project Notebooks (May 4)
2.2. Customer Requirements
The customer needs can be broken down into the following four categories, Musical Capability,
Playback Capability, Ease of Use, Ease of Maintenance.
Musical Capability includes having a minimum of two strings on the instrument, having a
minimum of five distinct notes that can be played, low noise from motors, and low sound
distortion.
7
Playback Capability means that the user should be able to selectively play back portions or entire
songs that they create, songs can be saved and loaded for later use, and the user should have
some musical control during song playback (pause, rewind, etc.).
Ease of Use includes having a mouse based and easy to use/intuitive interface.
Ease of Maintenance includes having some automated retuning capability for the strings and
ensuring that the design allows for easy string replacement.
Between the four main categories of customer requirements, the 3 most important ones are
Musical Capability, Playback Capability, and Ease of Use. The features included with Ease of
Maintenance should only be included in the final design if they do not cause any major conflicts
with the first three categories and if there is time and resources left after implementing the other
three categories first. The customer did not mention any special power, weight, thermal,
environmental or safety requirements. The overall budget for the project is not to exceed $750.
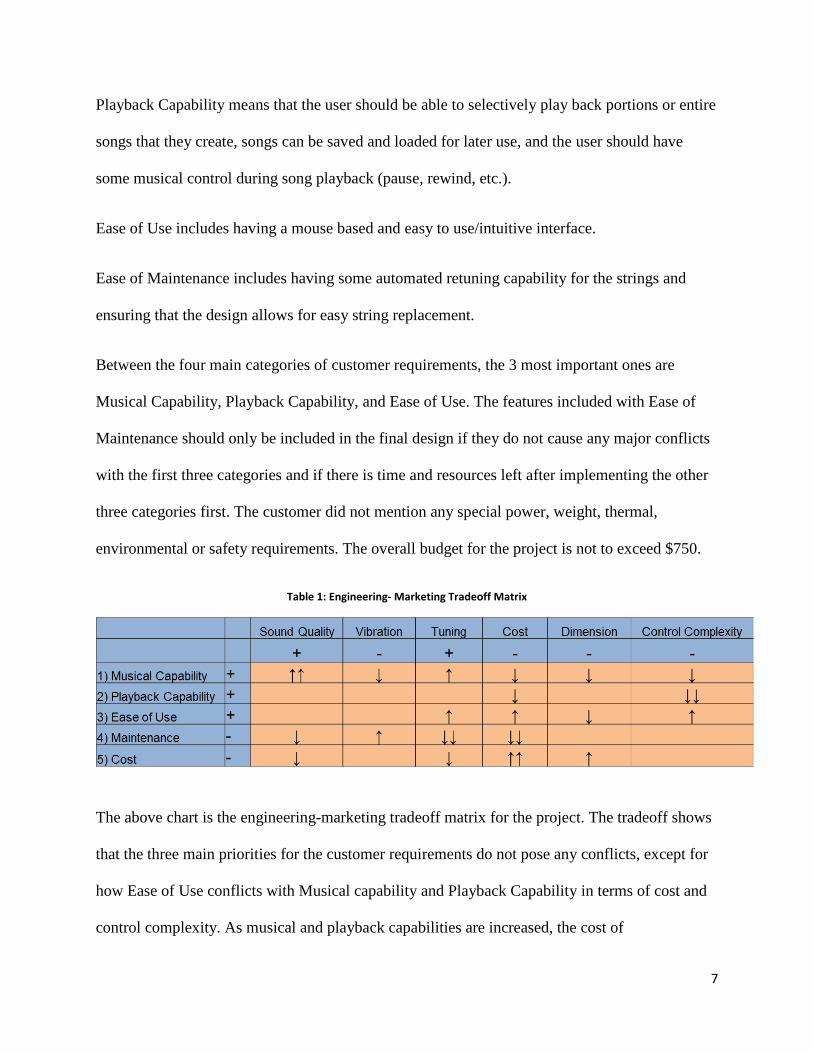
Table 1: Engineering- Marketing Tradeoff Matrix
The above chart is the engineering-marketing tradeoff matrix for the project. The tradeoff shows
that the three main priorities for the customer requirements do not pose any conflicts, except for
how Ease of Use conflicts with Musical capability and Playback Capability in terms of cost and
control complexity. As musical and playback capabilities are increased, the cost of
8
implementation as well as the amount of controls increases. In these two scenarios, musical and
playback capabilities will only be developed and added onto the system in order to achieve the
minimum customer requirements. Ease of use can therefore be viewed as a limited resource that
is “spent” on the design and implementation of musical and playback features, similar to how the
entire design must stay within the time and monetary restraints of the budget. Ease of Use will be
measured by the difficulty of learning the system, with the goal being that the user should be able
to navigate through every menu and find the appropriate control for their intended action within
the program. The only menu that the user should possibly need guidance for is the song creation
menu.
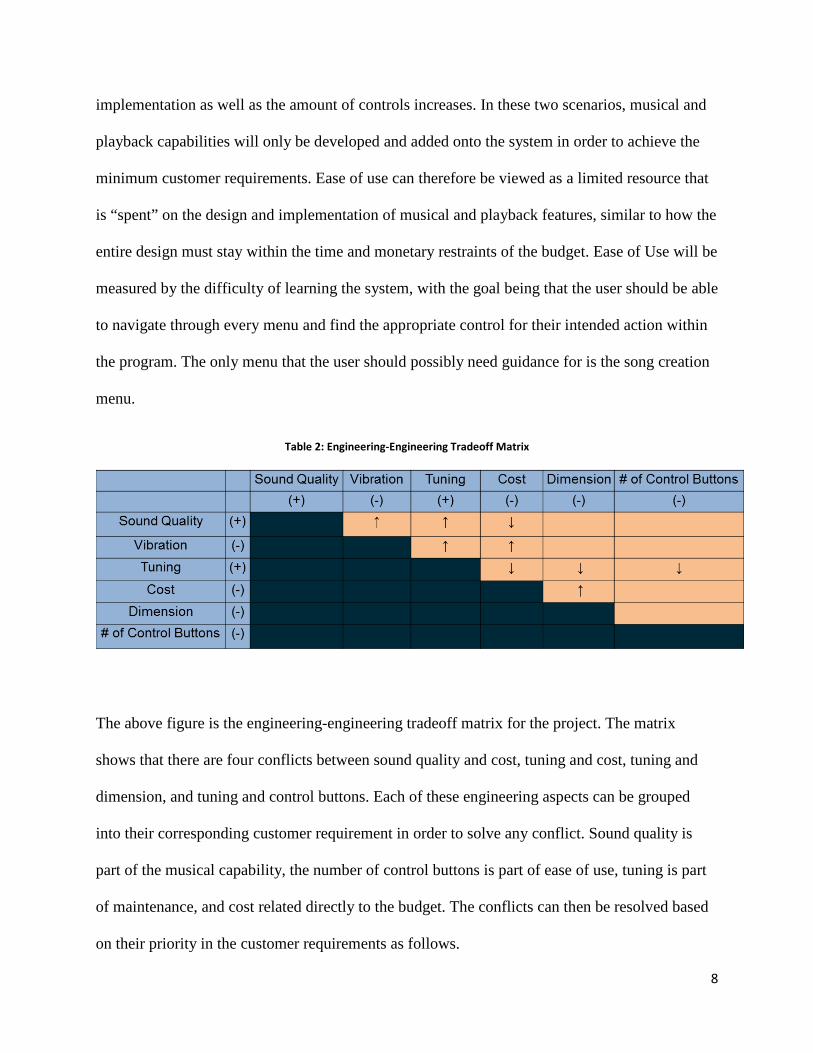
Table 2: Engineering-Engineering Tradeoff Matrix
The above figure is the engineering-engineering tradeoff matrix for the project. The matrix
shows that there are four conflicts between sound quality and cost, tuning and cost, tuning and
dimension, and tuning and control buttons. Each of these engineering aspects can be grouped
into their corresponding customer requirement in order to solve any conflict. Sound quality is
part of the musical capability, the number of control buttons is part of ease of use, tuning is part
of maintenance, and cost related directly to the budget. The conflicts can then be resolved based
on their priority in the customer requirements as follows.
9
Sound quality is a high priority in terms of musical capability, and therefore will take a larger
portion of the overall cost if that is what it takes to meet the customer requirements.
Cost will take a higher priority over tuning, as ease of maintenance is only to be included in the
design as long as there are resources left over after all other customer requirements are met.
Tuning will take a higher priority over dimension, as a small dimension was not required by the
customer.
Reducing the number of control buttons will take priority over tuning, as the ease of use is a
higher priority than ease of maintenance. Tuning may be included in the design, but only if it can
be implemented in a way that does not compromise a low number of control buttons (specifically
fewer than 16).
The design approach is to modify an existing guitar to allow string selection and strumming to be
completed mechanically. This approach will be able to attach to a standard guitar without
causing any damage to the guitar. This approach would also include the use of an Arduino in
order to control the hardware portion of the design. User input would be broken down through a
song building program on the user’s PC. The program would need to be able to handle all of the
software requirements from the customer, and the overall control of the entire instrument by
taking user input and turning it into output to the Arduino. High level commands from the user
would be broken down into smaller pieces and then distributed to the appropriate Arduino.

10
3. Task Statement (TS), Statement of Work (SOW), Work Breakdown Structure (WBS), Task Responsibility Matrix (TRM) and Team Process Guidelines
3.1. Task Statement
The following is the task Statement table complete with the item number, the task, and the task
description. Each task has been defined by the course instructor, customer or design team.
Table 3: Task Statement Table
Item # Task Name Description 1 System Requirements Review SRR presentation to illustrate overall project to class
and instructor 2 Meet with Customer Meet with customer to determine customer needs
and wants 3 Determine Requirements Determine final set of requirements based off of
customer and engineering requirements 4 Report and Presentation Assemble final report and prepare for presentation 5 Project Plan Project Plan to detail design process as required by
ECE 457 6 Requirements and Needs a. Customer needs and requirements (including
performance, accuracy, power, weight, thermal, environmental and safety requirements) as given are to be analyzed for conflicts and assigned priorities. Specifications will be developed for all requirements. b. Requirements derived from the design approach selected are to be included in this section. c. Both customer and derived requirements can be system requirements or project requirements. Both are to be addressed.
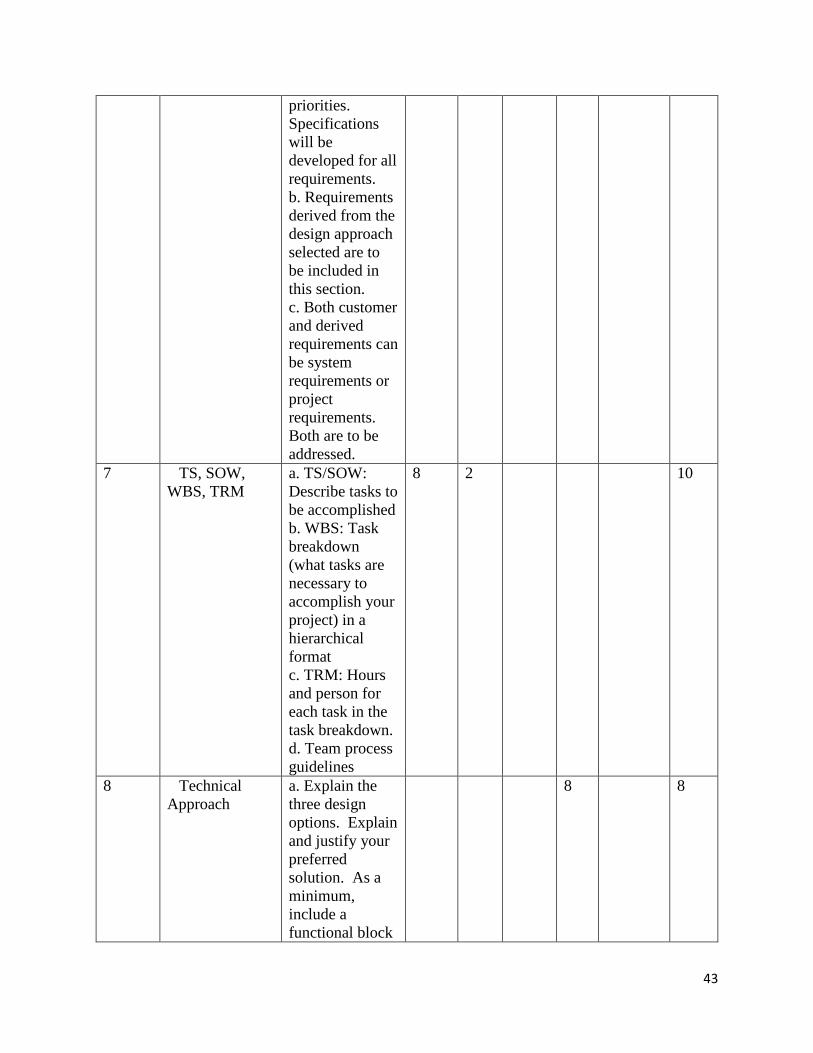
7 TS, SOW, WBS, TRM a. TS/SOW: Describe tasks to be accomplished b. WBS: Task breakdown (what tasks are necessary to accomplish your project) in a hierarchical format c. TRM: Hours and person for each task in the task breakdown. d. Team process guidelines
11
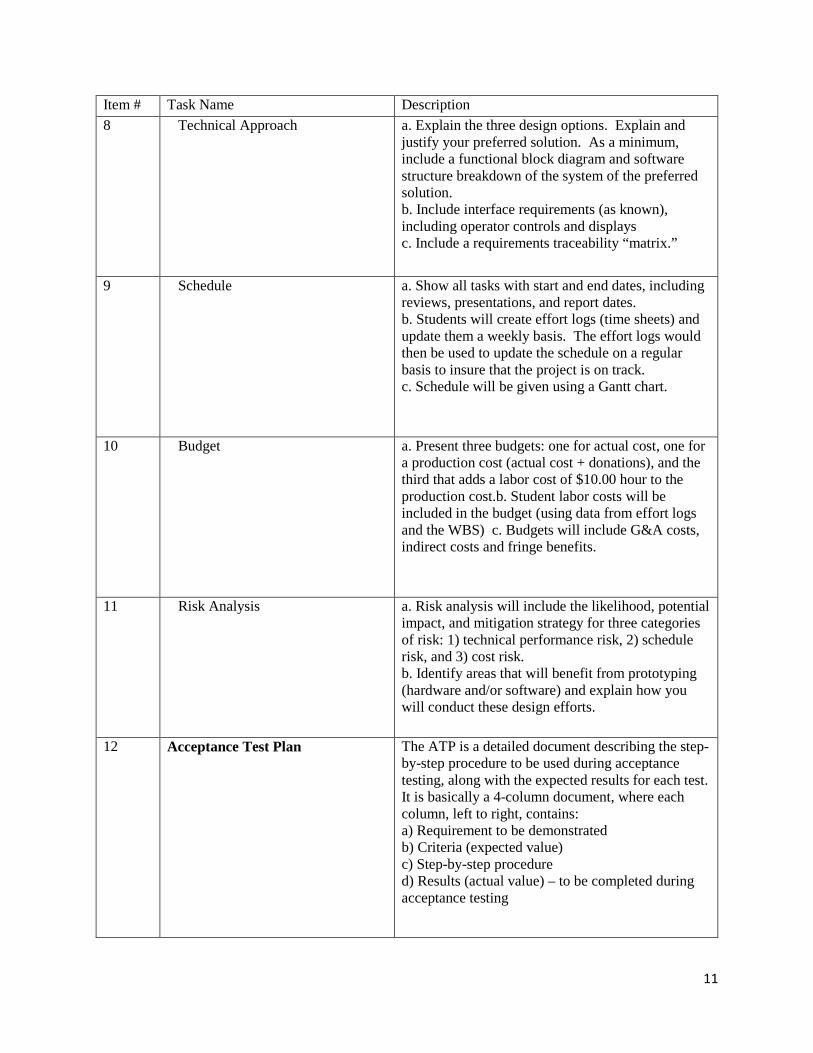
Item # Task Name Description 8 Technical Approach a. Explain the three design options. Explain and
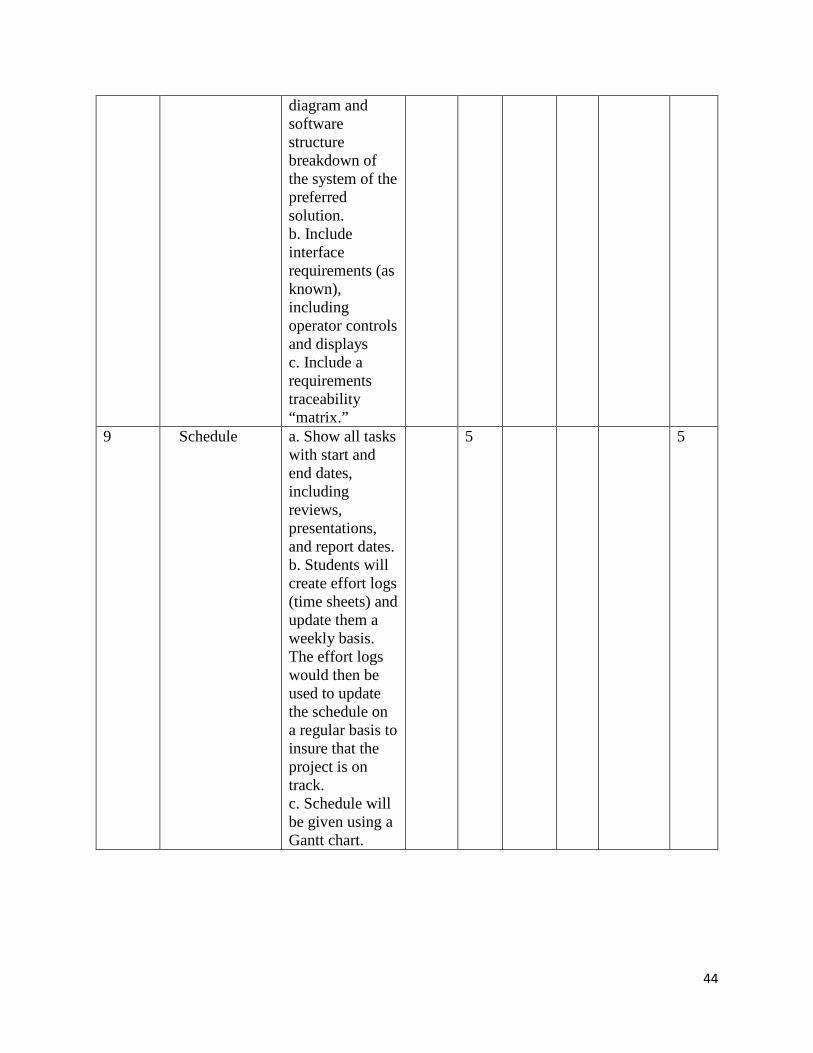
justify your preferred solution. As a minimum, include a functional block diagram and software structure breakdown of the system of the preferred solution. b. Include interface requirements (as known), including operator controls and displays c. Include a requirements traceability “matrix.”
9 Schedule a. Show all tasks with start and end dates, including reviews, presentations, and report dates. b. Students will create effort logs (time sheets) and update them a weekly basis. The effort logs would then be used to update the schedule on a regular basis to insure that the project is on track. c. Schedule will be given using a Gantt chart.
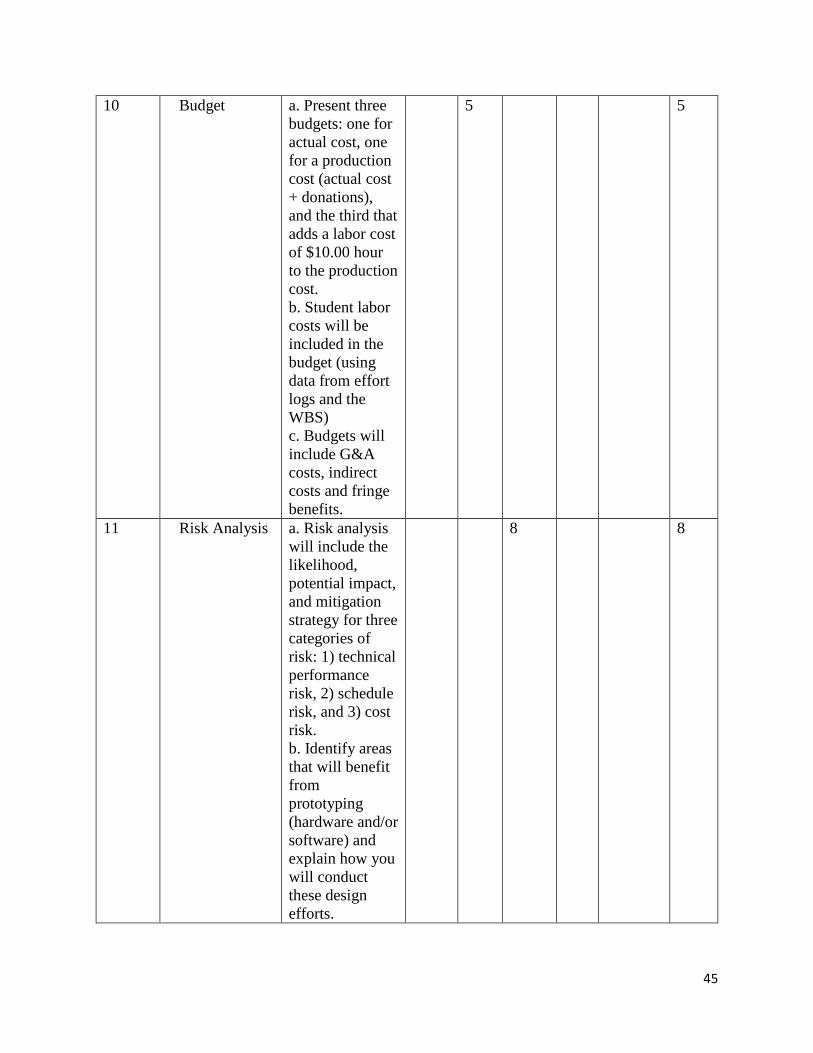
10 Budget a. Present three budgets: one for actual cost, one for a production cost (actual cost + donations), and the third that adds a labor cost of $10.00 hour to the production cost.b. Student labor costs will be included in the budget (using data from effort logs and the WBS) c. Budgets will include G&A costs, indirect costs and fringe benefits.
11 Risk Analysis a. Risk analysis will include the likelihood, potential impact, and mitigation strategy for three categories of risk: 1) technical performance risk, 2) schedule risk, and 3) cost risk. b. Identify areas that will benefit from prototyping (hardware and/or software) and explain how you will conduct these design efforts.
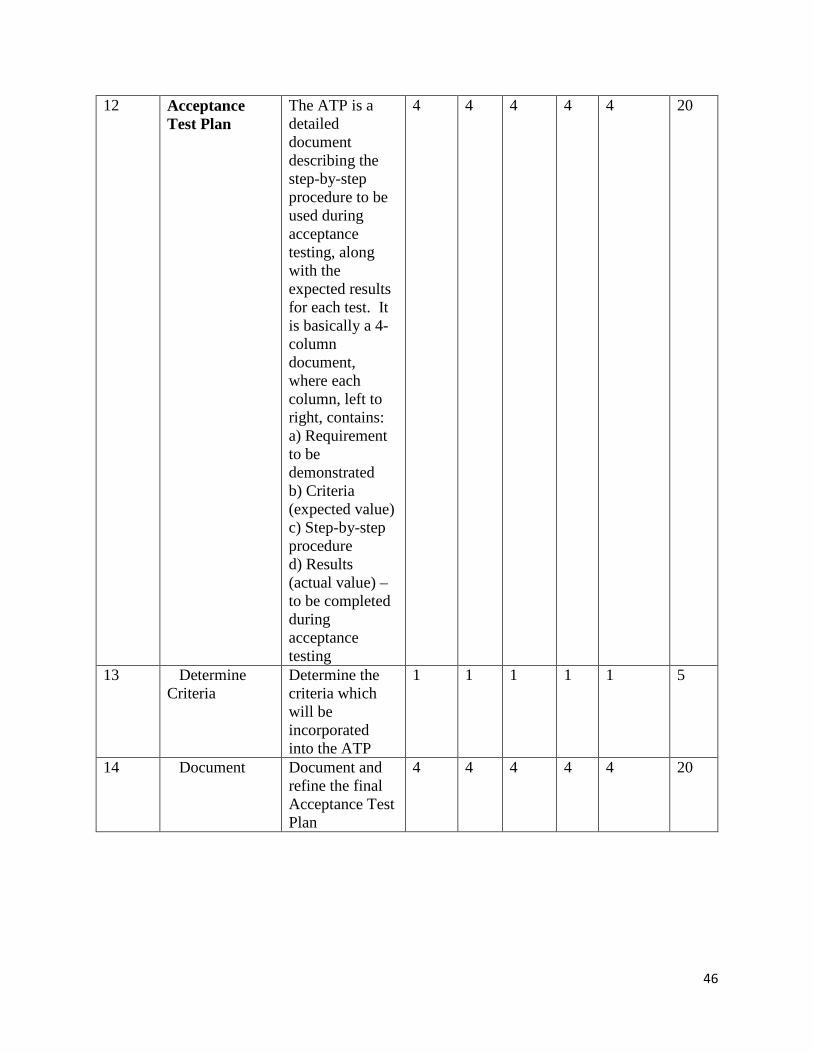
12 Acceptance Test Plan The ATP is a detailed document describing the step-by-step procedure to be used during acceptance testing, along with the expected results for each test. It is basically a 4-column document, where each column, left to right, contains: a) Requirement to be demonstrated b) Criteria (expected value) c) Step-by-step procedure d) Results (actual value) – to be completed during acceptance testing
12
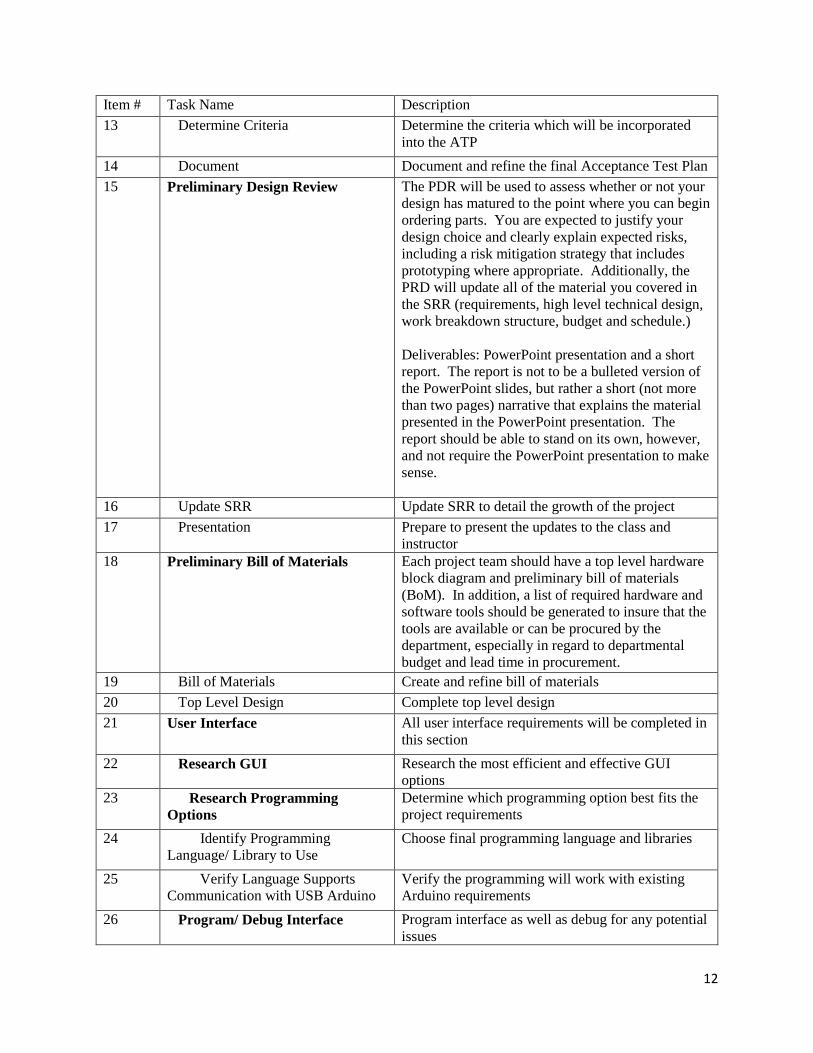
Item # Task Name Description 13 Determine Criteria Determine the criteria which will be incorporated
into the ATP 14 Document Document and refine the final Acceptance Test Plan 15 Preliminary Design Review The PDR will be used to assess whether or not your
design has matured to the point where you can begin ordering parts. You are expected to justify your design choice and clearly explain expected risks, including a risk mitigation strategy that includes prototyping where appropriate. Additionally, the PRD will update all of the material you covered in the SRR (requirements, high level technical design, work breakdown structure, budget and schedule.) Deliverables: PowerPoint presentation and a short report. The report is not to be a bulleted version of the PowerPoint slides, but rather a short (not more than two pages) narrative that explains the material presented in the PowerPoint presentation. The report should be able to stand on its own, however, and not require the PowerPoint presentation to make sense.
16 Update SRR Update SRR to detail the growth of the project 17 Presentation Prepare to present the updates to the class and
instructor 18 Preliminary Bill of Materials Each project team should have a top level hardware
block diagram and preliminary bill of materials (BoM). In addition, a list of required hardware and software tools should be generated to insure that the tools are available or can be procured by the department, especially in regard to departmental budget and lead time in procurement.
19 Bill of Materials Create and refine bill of materials 20 Top Level Design Complete top level design 21 User Interface All user interface requirements will be completed in
this section 22 Research GUI Research the most efficient and effective GUI
options 23 Research Programming
Options Determine which programming option best fits the project requirements
24 Identify Programming Language/ Library to Use
Choose final programming language and libraries
25 Verify Language Supports Communication with USB Arduino
Verify the programming will work with existing Arduino requirements
26 Program/ Debug Interface Program interface as well as debug for any potential issues
13
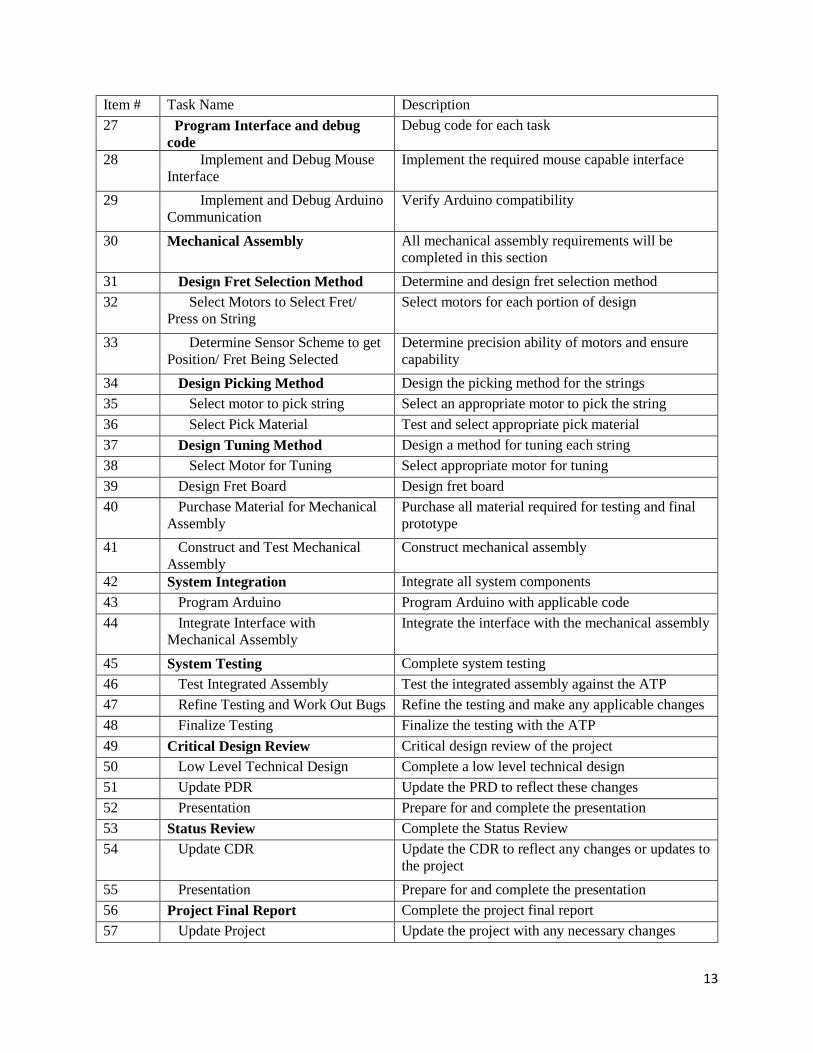
Item # Task Name Description 27 Program Interface and debug
code Debug code for each task
28 Implement and Debug Mouse Interface
Implement the required mouse capable interface
29 Implement and Debug Arduino Communication
Verify Arduino compatibility
30 Mechanical Assembly All mechanical assembly requirements will be completed in this section
31 Design Fret Selection Method Determine and design fret selection method 32 Select Motors to Select Fret/
Press on String Select motors for each portion of design
33 Determine Sensor Scheme to get Position/ Fret Being Selected
Determine precision ability of motors and ensure capability
34 Design Picking Method Design the picking method for the strings 35 Select motor to pick string Select an appropriate motor to pick the string 36 Select Pick Material Test and select appropriate pick material 37 Design Tuning Method Design a method for tuning each string 38 Select Motor for Tuning Select appropriate motor for tuning 39 Design Fret Board Design fret board 40 Purchase Material for Mechanical
Assembly Purchase all material required for testing and final prototype
41 Construct and Test Mechanical Assembly
Construct mechanical assembly
42 System Integration Integrate all system components 43 Program Arduino Program Arduino with applicable code 44 Integrate Interface with
Mechanical Assembly Integrate the interface with the mechanical assembly
45 System Testing Complete system testing 46 Test Integrated Assembly Test the integrated assembly against the ATP 47 Refine Testing and Work Out Bugs Refine the testing and make any applicable changes 48 Finalize Testing Finalize the testing with the ATP 49 Critical Design Review Critical design review of the project 50 Low Level Technical Design Complete a low level technical design 51 Update PDR Update the PRD to reflect these changes 52 Presentation Prepare for and complete the presentation 53 Status Review Complete the Status Review 54 Update CDR Update the CDR to reflect any changes or updates to
the project 55 Presentation Prepare for and complete the presentation 56 Project Final Report Complete the project final report 57 Update Project Update the project with any necessary changes
14
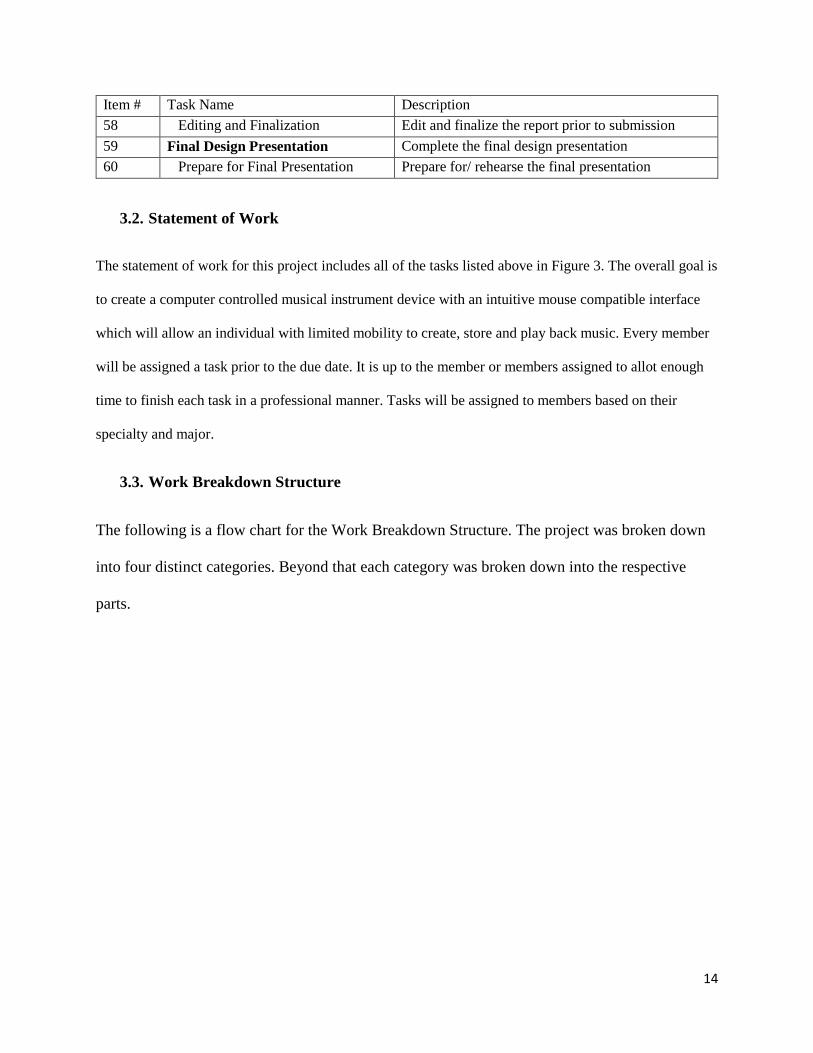
Item # Task Name Description 58 Editing and Finalization Edit and finalize the report prior to submission 59 Final Design Presentation Complete the final design presentation 60 Prepare for Final Presentation Prepare for/ rehearse the final presentation
3.2. Statement of Work
The statement of work for this project includes all of the tasks listed above in Figure 3. The overall goal is
to create a computer controlled musical instrument device with an intuitive mouse compatible interface
which will allow an individual with limited mobility to create, store and play back music. Every member
will be assigned a task prior to the due date. It is up to the member or members assigned to allot enough
time to finish each task in a professional manner. Tasks will be assigned to members based on their
specialty and major.
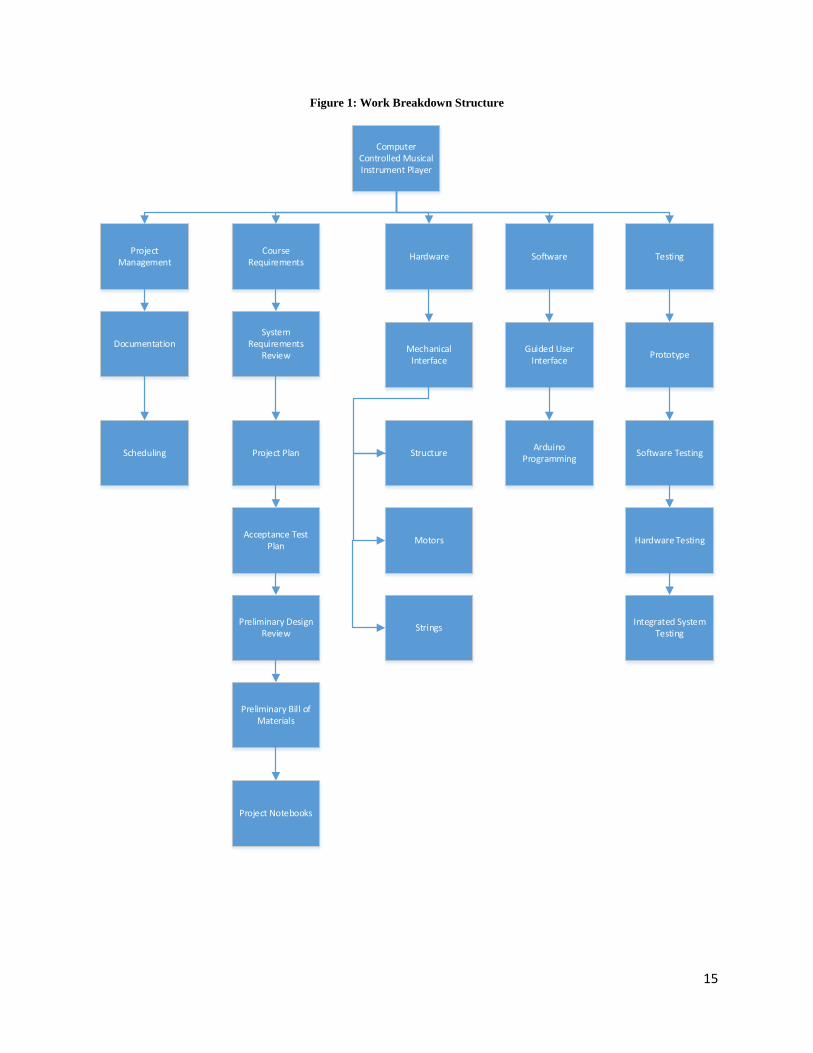
3.3. Work Breakdown Structure
The following is a flow chart for the Work Breakdown Structure. The project was broken down
into four distinct categories. Beyond that each category was broken down into the respective
parts.
15
Figure 1: Work Breakdown Structure
Computer Controlled Musical Instrument Player
Project Management
Documentation
Scheduling
System Requirements
Review
Project Plan
Course Requirements
Acceptance Test Plan
Preliminary Design Review
Preliminary Bill of Materials
Project Notebooks
Hardware Software Testing
Prototype
Software Testing
Hardware Testing
Integrated System Testing
Mechanical Interface
Structure
Motors
Strings
Guided User Interface
Arduino Programming
16
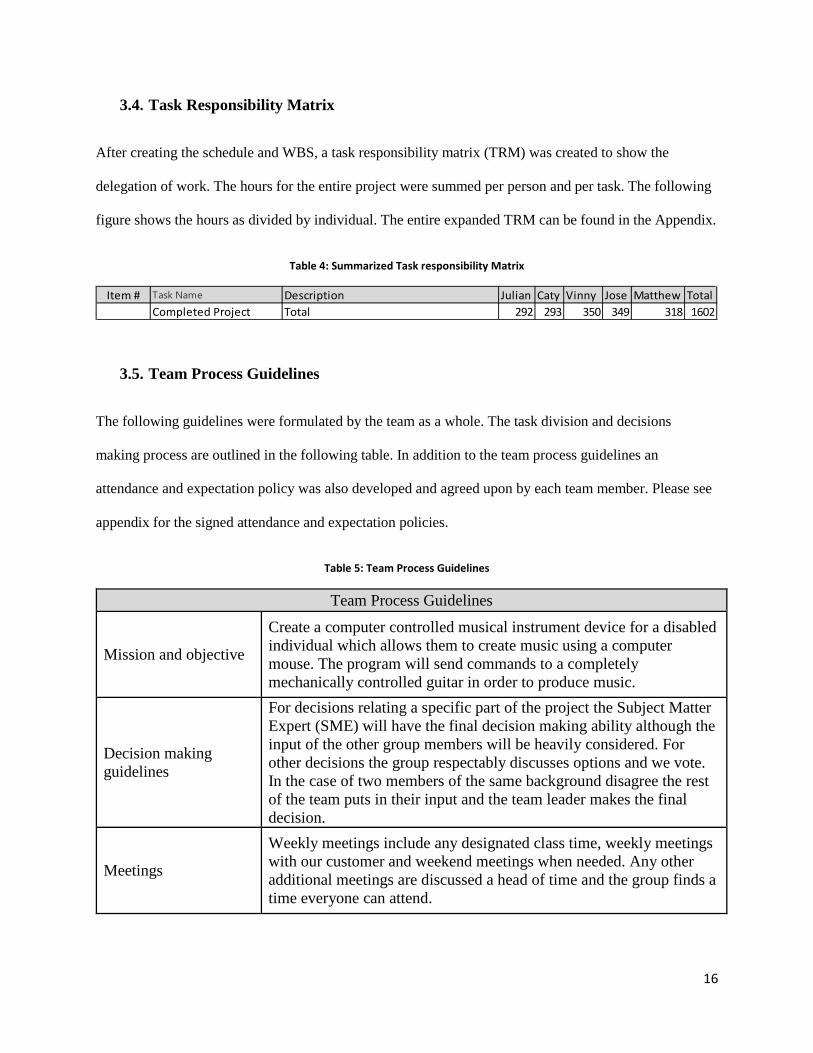
3.4. Task Responsibility Matrix
After creating the schedule and WBS, a task responsibility matrix (TRM) was created to show the
delegation of work. The hours for the entire project were summed per person and per task. The following
figure shows the hours as divided by individual. The entire expanded TRM can be found in the Appendix.
Table 4: Summarized Task responsibility Matrix
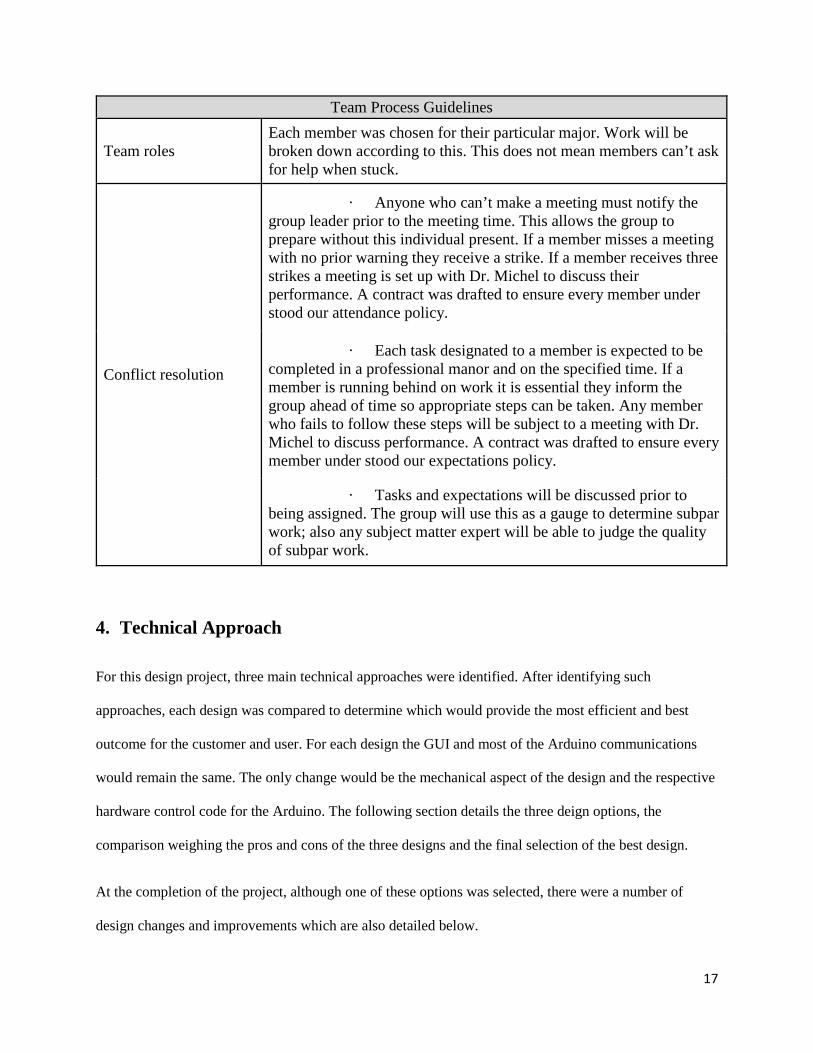
3.5. Team Process Guidelines
The following guidelines were formulated by the team as a whole. The task division and decisions
making process are outlined in the following table. In addition to the team process guidelines an
attendance and expectation policy was also developed and agreed upon by each team member. Please see
appendix for the signed attendance and expectation policies.
Table 5: Team Process Guidelines
Team Process Guidelines
Mission and objective
Create a computer controlled musical instrument device for a disabled individual which allows them to create music using a computer mouse. The program will send commands to a completely mechanically controlled guitar in order to produce music.
Decision making guidelines
For decisions relating a specific part of the project the Subject Matter Expert (SME) will have the final decision making ability although the input of the other group members will be heavily considered. For other decisions the group respectably discusses options and we vote. In the case of two members of the same background disagree the rest of the team puts in their input and the team leader makes the final decision.
Meetings
Weekly meetings include any designated class time, weekly meetings with our customer and weekend meetings when needed. Any other additional meetings are discussed a head of time and the group finds a time everyone can attend.
Item # Task Name Description Julian Caty Vinny Jose Matthew TotalCompleted Project Total 292 293 350 349 318 1602
17
Team Process Guidelines
Team roles Each member was chosen for their particular major. Work will be broken down according to this. This does not mean members can’t ask for help when stuck.
Conflict resolution
· Anyone who can’t make a meeting must notify the group leader prior to the meeting time. This allows the group to prepare without this individual present. If a member misses a meeting with no prior warning they receive a strike. If a member receives three strikes a meeting is set up with Dr. Michel to discuss their performance. A contract was drafted to ensure every member under stood our attendance policy.
· Each task designated to a member is expected to be completed in a professional manor and on the specified time. If a member is running behind on work it is essential they inform the group ahead of time so appropriate steps can be taken. Any member who fails to follow these steps will be subject to a meeting with Dr. Michel to discuss performance. A contract was drafted to ensure every member under stood our expectations policy.
· Tasks and expectations will be discussed prior to being assigned. The group will use this as a gauge to determine subpar work; also any subject matter expert will be able to judge the quality of subpar work.
4. Technical Approach
For this design project, three main technical approaches were identified. After identifying such
approaches, each design was compared to determine which would provide the most efficient and best
outcome for the customer and user. For each design the GUI and most of the Arduino communications
would remain the same. The only change would be the mechanical aspect of the design and the respective
hardware control code for the Arduino. The following section details the three deign options, the
comparison weighing the pros and cons of the three designs and the final selection of the best design.
At the completion of the project, although one of these options was selected, there were a number of
design changes and improvements which are also detailed below.
18
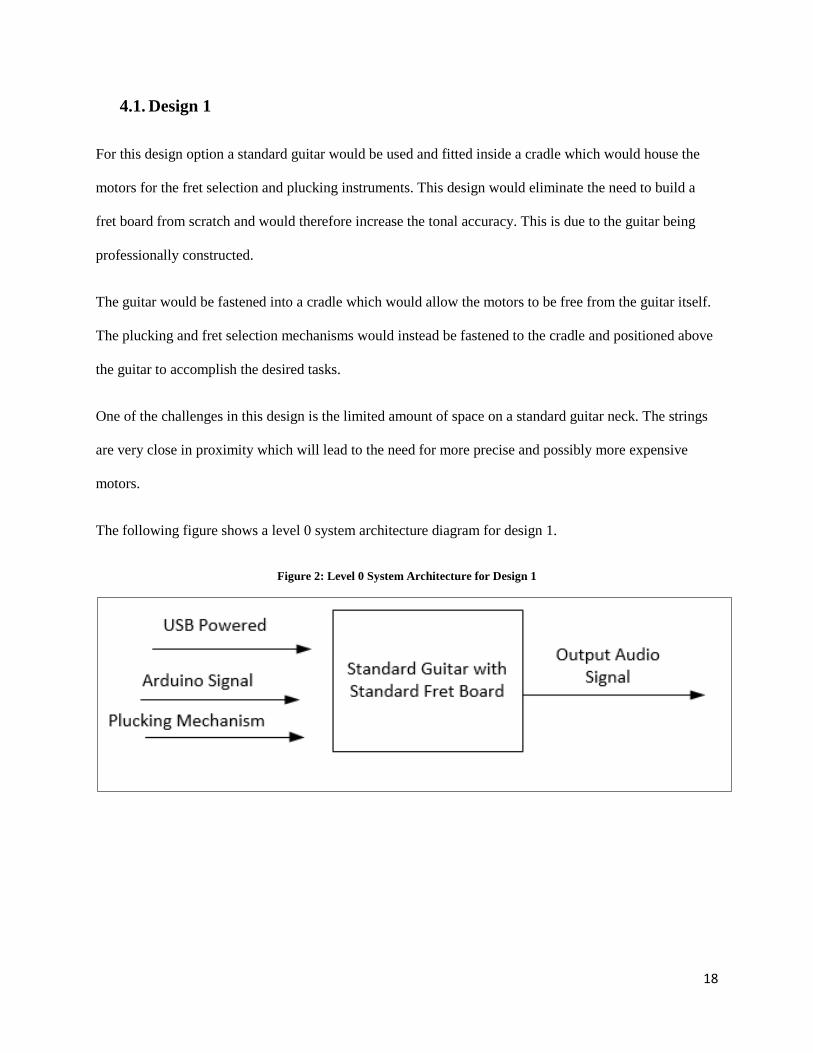
4.1. Design 1
For this design option a standard guitar would be used and fitted inside a cradle which would house the
motors for the fret selection and plucking instruments. This design would eliminate the need to build a
fret board from scratch and would therefore increase the tonal accuracy. This is due to the guitar being
professionally constructed.
The guitar would be fastened into a cradle which would allow the motors to be free from the guitar itself.
The plucking and fret selection mechanisms would instead be fastened to the cradle and positioned above
the guitar to accomplish the desired tasks.
One of the challenges in this design is the limited amount of space on a standard guitar neck. The strings
are very close in proximity which will lead to the need for more precise and possibly more expensive
motors.
The following figure shows a level 0 system architecture diagram for design 1.
Figure 2: Level 0 System Architecture for Design 1
19
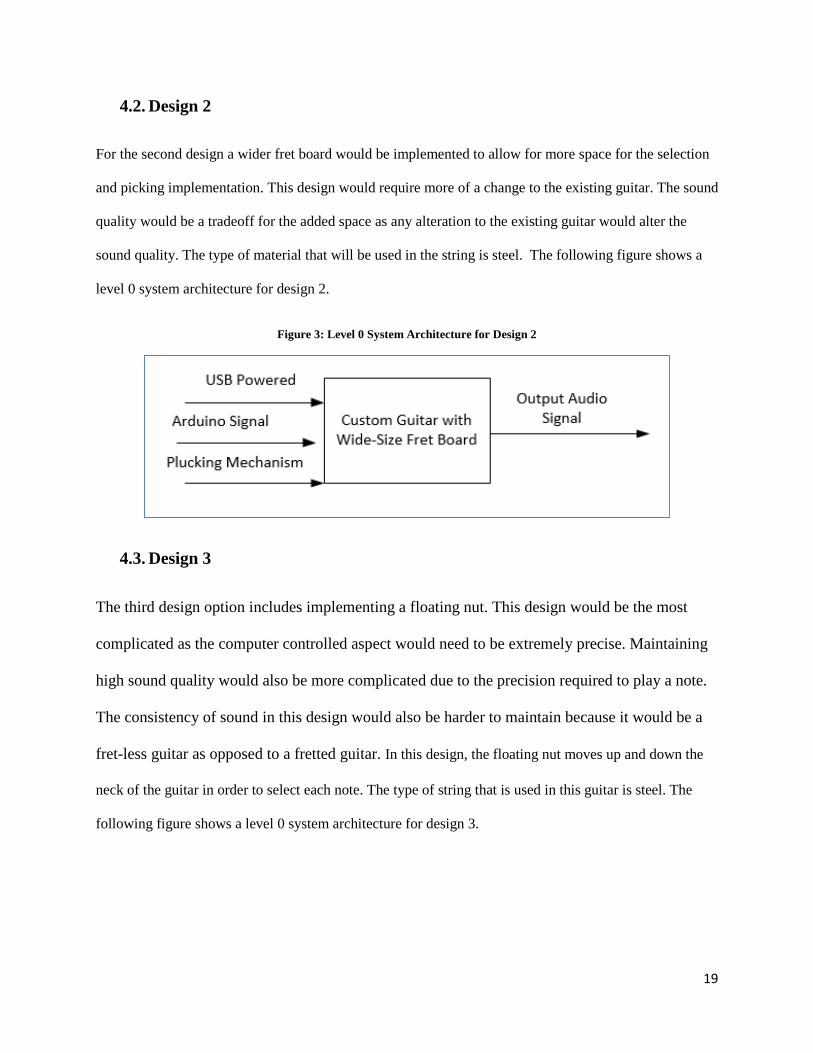
4.2. Design 2
For the second design a wider fret board would be implemented to allow for more space for the selection
and picking implementation. This design would require more of a change to the existing guitar. The sound
quality would be a tradeoff for the added space as any alteration to the existing guitar would alter the
sound quality. The type of material that will be used in the string is steel. The following figure shows a
level 0 system architecture for design 2.
Figure 3: Level 0 System Architecture for Design 2
4.3. Design 3
The third design option includes implementing a floating nut. This design would be the most
complicated as the computer controlled aspect would need to be extremely precise. Maintaining
high sound quality would also be more complicated due to the precision required to play a note.
The consistency of sound in this design would also be harder to maintain because it would be a
fret-less guitar as opposed to a fretted guitar. In this design, the floating nut moves up and down the
neck of the guitar in order to select each note. The type of string that is used in this guitar is steel. The
following figure shows a level 0 system architecture for design 3.
20
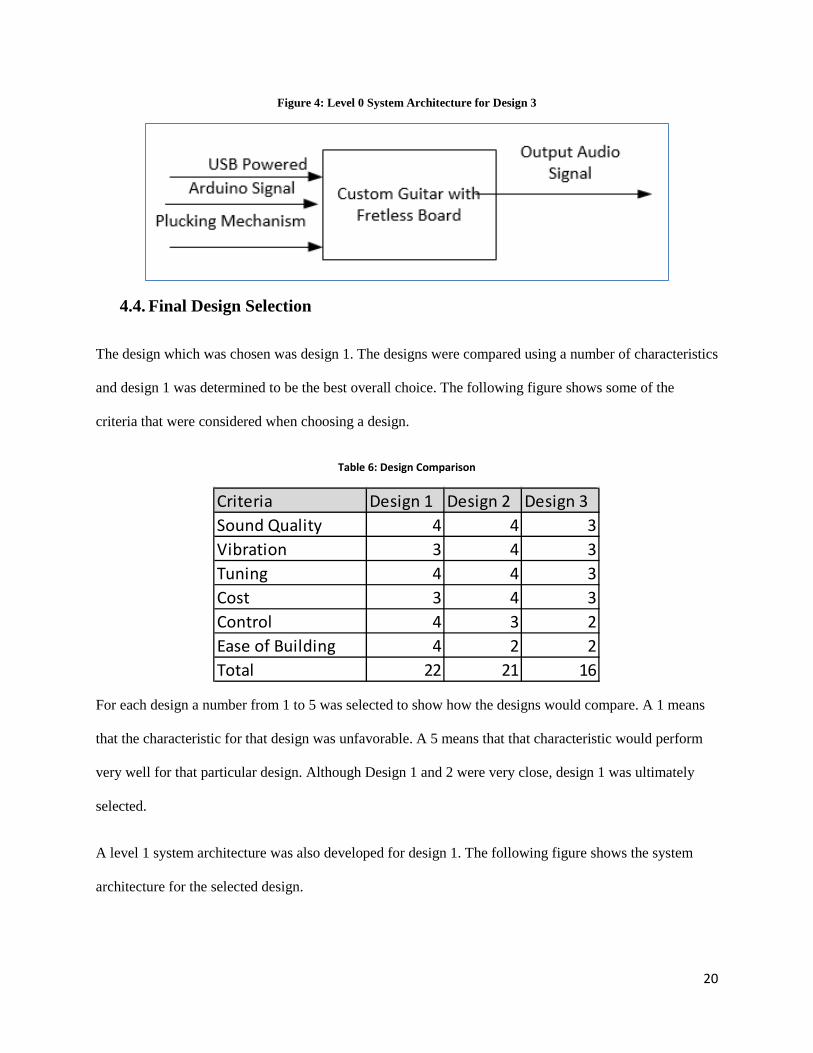
Figure 4: Level 0 System Architecture for Design 3
4.4. Final Design Selection
The design which was chosen was design 1. The designs were compared using a number of characteristics
and design 1 was determined to be the best overall choice. The following figure shows some of the
criteria that were considered when choosing a design.
Table 6: Design Comparison
For each design a number from 1 to 5 was selected to show how the designs would compare. A 1 means
that the characteristic for that design was unfavorable. A 5 means that that characteristic would perform
very well for that particular design. Although Design 1 and 2 were very close, design 1 was ultimately
selected.
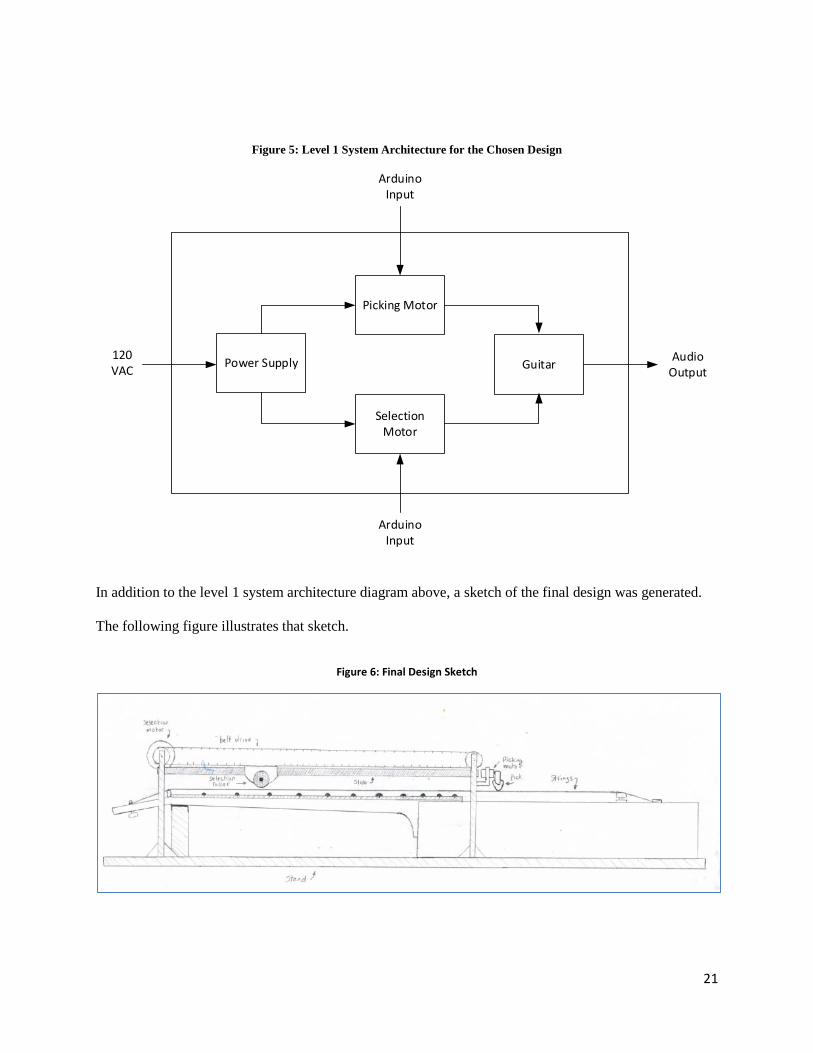
A level 1 system architecture was also developed for design 1. The following figure shows the system
architecture for the selected design.
Criteria Design 1 Design 2 Design 3Sound Quality 4 4 3Vibration 3 4 3Tuning 4 4 3Cost 3 4 3Control 4 3 2Ease of Building 4 2 2Total 22 21 16
21
Figure 5: Level 1 System Architecture for the Chosen Design
Picking Motor
Power Supply Guitar
Selection Motor
Arduino Input
120 VAC
Arduino Input
Audio Output
In addition to the level 1 system architecture diagram above, a sketch of the final design was generated.
The following figure illustrates that sketch.
Figure 6: Final Design Sketch

22
4.5. Final Design Implementation
Throughout the duration of this project there have been many design refinements. Shortly after
the completion of the fall semester a major design change took place in regards to the fret
selection method. Instead of using the belt method as detailed above, the team decided to use
lead screws to move carriages along the string. The following Solid Works figure details the new
design.
Figure 7: Lead Screw Solid Works Design
Additional Solid Works drawings can be found in Appendix B. In addition to the lead screws the
mechanical engineers designed custom carriages to travel along the lead screws and select the
desired notes. The following figure shows the customer 3D printed carriages before installation
on the lead screws.
23
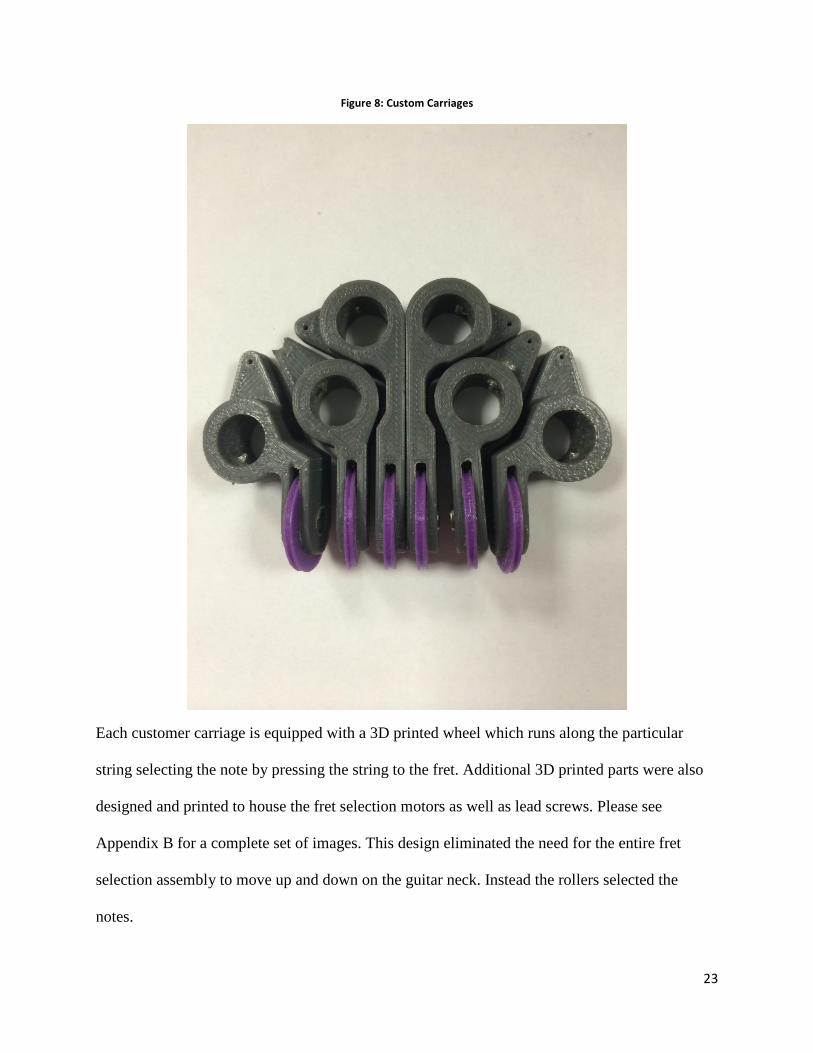
Figure 8: Custom Carriages
Each customer carriage is equipped with a 3D printed wheel which runs along the particular
string selecting the note by pressing the string to the fret. Additional 3D printed parts were also
designed and printed to house the fret selection motors as well as lead screws. Please see
Appendix B for a complete set of images. This design eliminated the need for the entire fret
selection assembly to move up and down on the guitar neck. Instead the rollers selected the
notes.
24
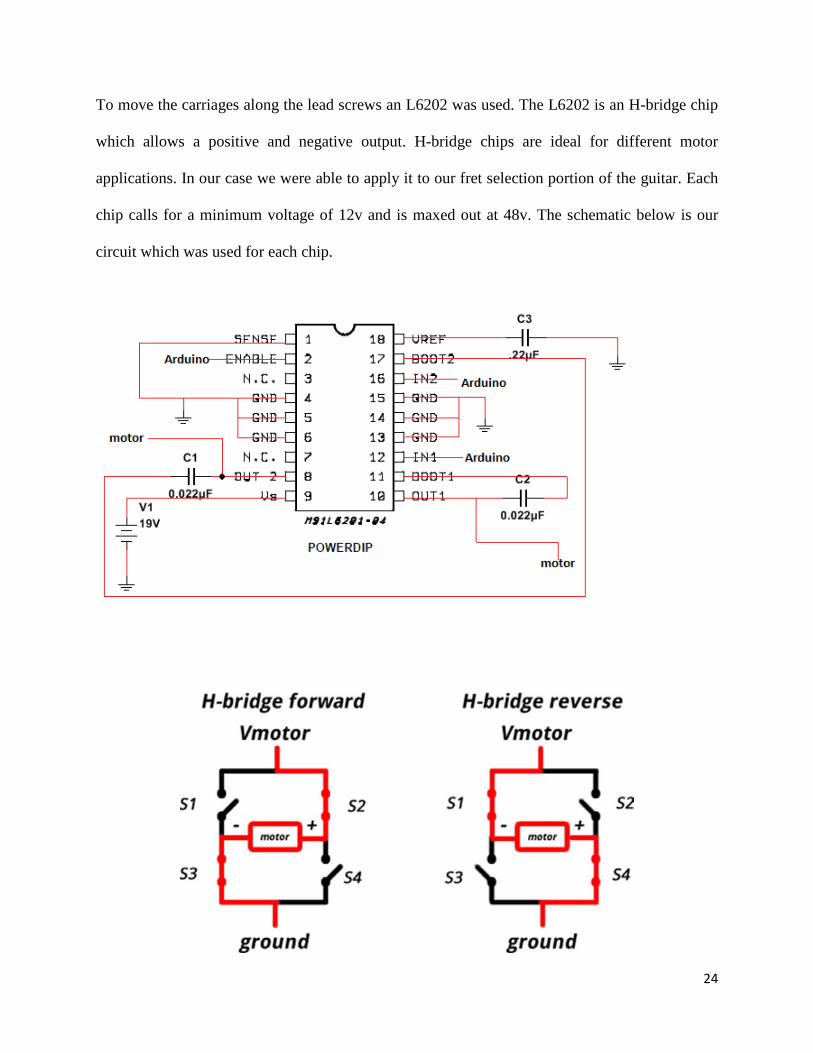
To move the carriages along the lead screws an L6202 was used. The L6202 is an H-bridge chip
which allows a positive and negative output. H-bridge chips are ideal for different motor
applications. In our case we were able to apply it to our fret selection portion of the guitar. Each
chip calls for a minimum voltage of 12v and is maxed out at 48v. The schematic below is our
circuit which was used for each chip.
25
4.6. Interface Requirements
The software used in this project runs on an Arduino (hardware control) and Window 8 (user
interface). The programming languages used for this project are C/C++ for the Arduino and
command line testing interface, and Java for the User Interface.
Figure 9: Software Interface Flow Chart
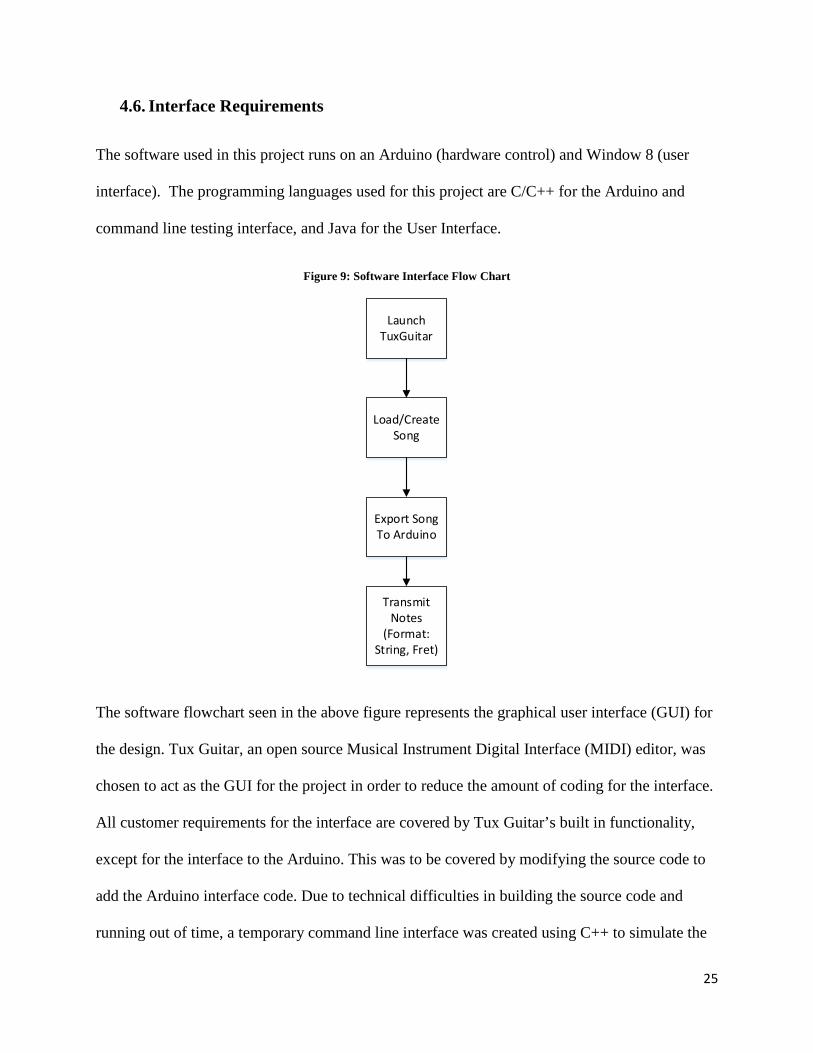
The software flowchart seen in the above figure represents the graphical user interface (GUI) for
the design. Tux Guitar, an open source Musical Instrument Digital Interface (MIDI) editor, was
chosen to act as the GUI for the project in order to reduce the amount of coding for the interface.
All customer requirements for the interface are covered by Tux Guitar’s built in functionality,
except for the interface to the Arduino. This was to be covered by modifying the source code to
add the Arduino interface code. Due to technical difficulties in building the source code and
running out of time, a temporary command line interface was created using C++ to simulate the
Launch TuxGuitar
Load/Create Song
Export Song To Arduino
Transmit Notes
(Format: String, Fret)
26
control signals so that the Arduino code could be tested. The command line interface is hard
coded to repeat the song “Mary Had A Little Lamb” over USB to the Arduino for test/demo
purposes.
Figure 10: Arduino Flow Chart
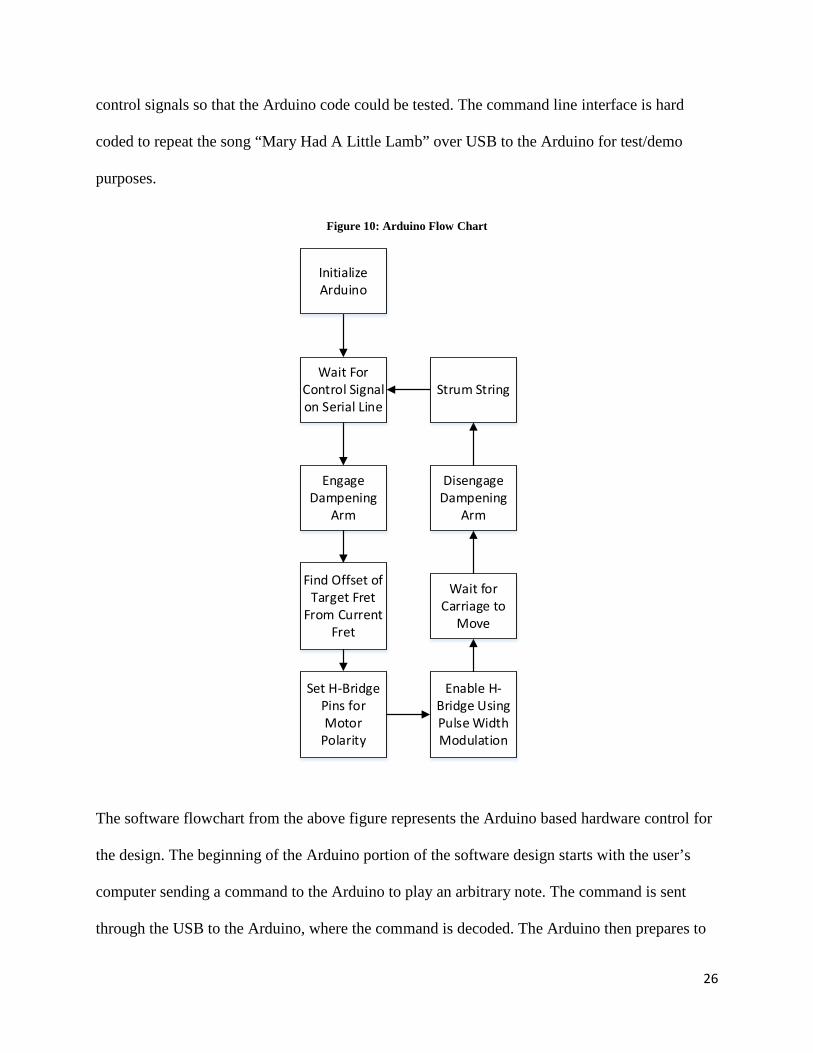
The software flowchart from the above figure represents the Arduino based hardware control for
the design. The beginning of the Arduino portion of the software design starts with the user’s
computer sending a command to the Arduino to play an arbitrary note. The command is sent
through the USB to the Arduino, where the command is decoded. The Arduino then prepares to
Engage Dampening
Arm
Find Offset of Target Fret
From Current Fret
Set H-Bridge Pins for Motor
Polarity
Enable H-Bridge Using Pulse Width Modulation
Wait for Carriage to
Move
Wait For Control Signal on Serial Line
Disengage Dampening
Arm
Strum String
Initialize Arduino
27
select and play the next note, performing actions such as enabling the dampening arm and setting
the fret selection motor polarity. The Arduino then uses pulse width modulation on the fret motor
enable pin, so that the motor voltage and therefore speed can be adjusted to a safe level. Once the
motor has moved into the correct position the Arduino will then begin the strumming routine.
During the strumming routine, the Arduino will check the current position of the strumming
motor, and then swing the motor to the opposite position in order to pluck the string. The
Arduino will then return to the idle state until a new note arrives on the serial line.
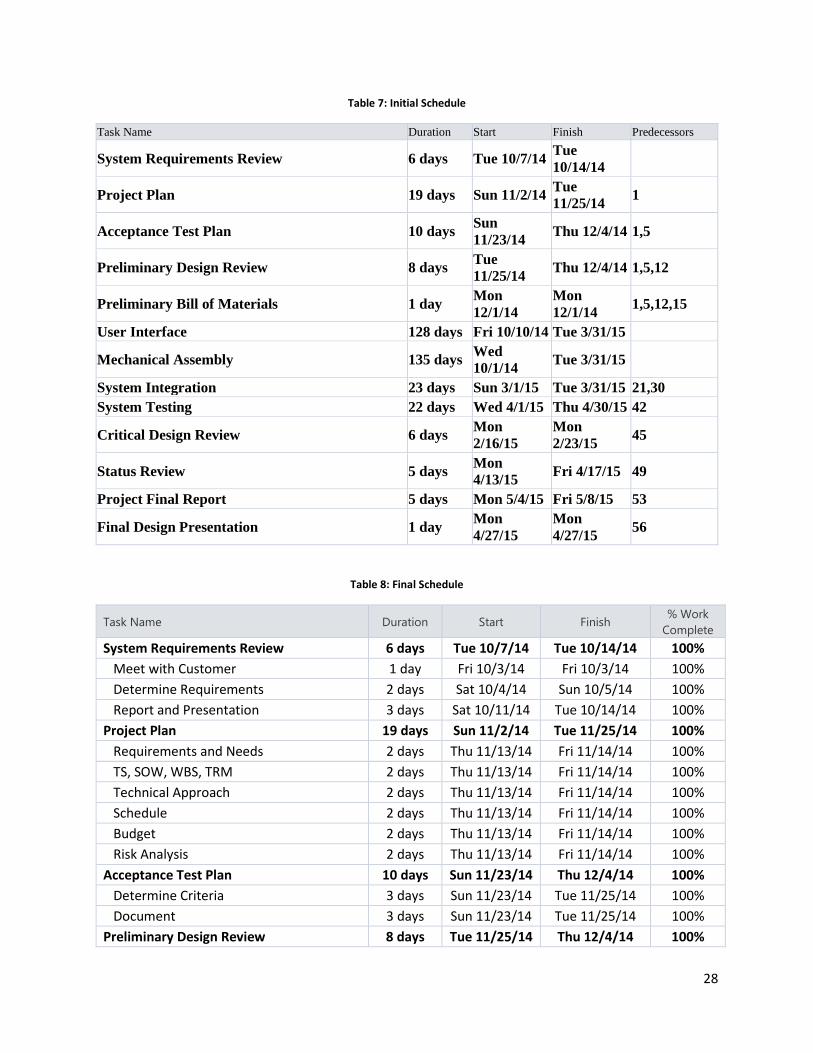
5. Schedule
The following is the compressed version of the overall project schedule. Each major task is listed
under Task Name. The task dates were determined by the group as a whole ensuring that each
member agreed to the given due date. Also included are the duration, the start and finish dates
and any applicable predecessors. The table below shows the initial generated schedule with
desired due dates. This represents what the team was aiming for during the project. The
following figure shows the actual final schedule with the date of completion of each task. This
shows the actual percentage of work complete to date. It is important to note that there are still a
number of tasks which have not reached 100% completion. At the completion of the project the
team was behind schedule for various reasons including availability of materials and failure to
allocate enough time for certain tasks. The final project presentation is also listed as To Be
Determined due to the fact that the presentation occurs after the due date of this report. For the
complete uncompressed schedule, please see Appendix D.
28
Table 7: Initial Schedule
Task Name Duration Start Finish Predecessors
System Requirements Review 6 days Tue 10/7/14 Tue 10/14/14
Project Plan 19 days Sun 11/2/14 Tue 11/25/14 1
Acceptance Test Plan 10 days Sun 11/23/14 Thu 12/4/14 1,5
Preliminary Design Review 8 days Tue 11/25/14 Thu 12/4/14 1,5,12
Preliminary Bill of Materials 1 day Mon 12/1/14
Mon 12/1/14 1,5,12,15
User Interface 128 days Fri 10/10/14 Tue 3/31/15
Mechanical Assembly 135 days Wed 10/1/14 Tue 3/31/15
System Integration 23 days Sun 3/1/15 Tue 3/31/15 21,30 System Testing 22 days Wed 4/1/15 Thu 4/30/15 42
Critical Design Review 6 days Mon 2/16/15
Mon 2/23/15 45
Status Review 5 days Mon 4/13/15 Fri 4/17/15 49
Project Final Report 5 days Mon 5/4/15 Fri 5/8/15 53
Final Design Presentation 1 day Mon 4/27/15
Mon 4/27/15 56
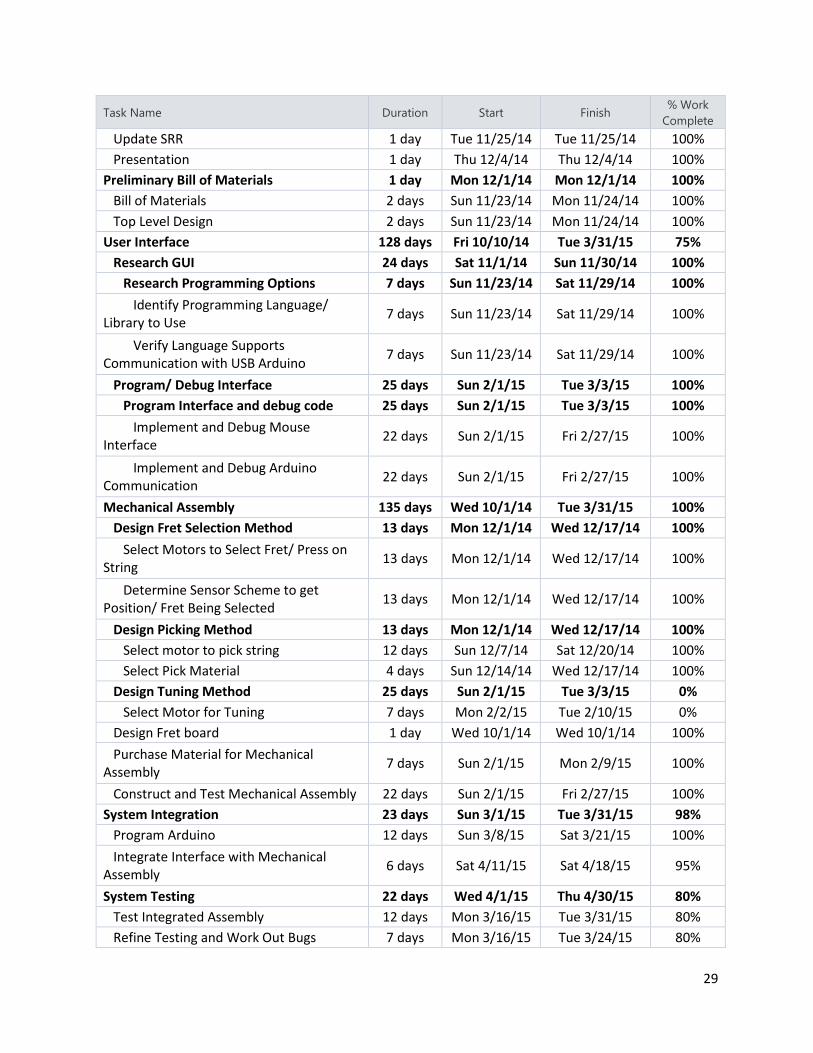
Table 8: Final Schedule
Task Name Duration Start Finish % Work
Complete System Requirements Review 6 days Tue 10/7/14 Tue 10/14/14 100% Meet with Customer 1 day Fri 10/3/14 Fri 10/3/14 100% Determine Requirements 2 days Sat 10/4/14 Sun 10/5/14 100% Report and Presentation 3 days Sat 10/11/14 Tue 10/14/14 100% Project Plan 19 days Sun 11/2/14 Tue 11/25/14 100% Requirements and Needs 2 days Thu 11/13/14 Fri 11/14/14 100% TS, SOW, WBS, TRM 2 days Thu 11/13/14 Fri 11/14/14 100% Technical Approach 2 days Thu 11/13/14 Fri 11/14/14 100% Schedule 2 days Thu 11/13/14 Fri 11/14/14 100% Budget 2 days Thu 11/13/14 Fri 11/14/14 100% Risk Analysis 2 days Thu 11/13/14 Fri 11/14/14 100% Acceptance Test Plan 10 days Sun 11/23/14 Thu 12/4/14 100% Determine Criteria 3 days Sun 11/23/14 Tue 11/25/14 100% Document 3 days Sun 11/23/14 Tue 11/25/14 100% Preliminary Design Review 8 days Tue 11/25/14 Thu 12/4/14 100%
29
Task Name Duration Start Finish % Work
Complete Update SRR 1 day Tue 11/25/14 Tue 11/25/14 100% Presentation 1 day Thu 12/4/14 Thu 12/4/14 100% Preliminary Bill of Materials 1 day Mon 12/1/14 Mon 12/1/14 100% Bill of Materials 2 days Sun 11/23/14 Mon 11/24/14 100% Top Level Design 2 days Sun 11/23/14 Mon 11/24/14 100% User Interface 128 days Fri 10/10/14 Tue 3/31/15 75% Research GUI 24 days Sat 11/1/14 Sun 11/30/14 100% Research Programming Options 7 days Sun 11/23/14 Sat 11/29/14 100% Identify Programming Language/ Library to Use 7 days Sun 11/23/14 Sat 11/29/14 100%
Verify Language Supports Communication with USB Arduino 7 days Sun 11/23/14 Sat 11/29/14 100%
Program/ Debug Interface 25 days Sun 2/1/15 Tue 3/3/15 100% Program Interface and debug code 25 days Sun 2/1/15 Tue 3/3/15 100% Implement and Debug Mouse Interface 22 days Sun 2/1/15 Fri 2/27/15 100%
Implement and Debug Arduino Communication 22 days Sun 2/1/15 Fri 2/27/15 100%
Mechanical Assembly 135 days Wed 10/1/14 Tue 3/31/15 100% Design Fret Selection Method 13 days Mon 12/1/14 Wed 12/17/14 100% Select Motors to Select Fret/ Press on String 13 days Mon 12/1/14 Wed 12/17/14 100%
Determine Sensor Scheme to get Position/ Fret Being Selected 13 days Mon 12/1/14 Wed 12/17/14 100%
Design Picking Method 13 days Mon 12/1/14 Wed 12/17/14 100% Select motor to pick string 12 days Sun 12/7/14 Sat 12/20/14 100% Select Pick Material 4 days Sun 12/14/14 Wed 12/17/14 100% Design Tuning Method 25 days Sun 2/1/15 Tue 3/3/15 0% Select Motor for Tuning 7 days Mon 2/2/15 Tue 2/10/15 0% Design Fret board 1 day Wed 10/1/14 Wed 10/1/14 100% Purchase Material for Mechanical Assembly 7 days Sun 2/1/15 Mon 2/9/15 100%
Construct and Test Mechanical Assembly 22 days Sun 2/1/15 Fri 2/27/15 100% System Integration 23 days Sun 3/1/15 Tue 3/31/15 98% Program Arduino 12 days Sun 3/8/15 Sat 3/21/15 100% Integrate Interface with Mechanical Assembly 6 days Sat 4/11/15 Sat 4/18/15 95%
System Testing 22 days Wed 4/1/15 Thu 4/30/15 80% Test Integrated Assembly 12 days Mon 3/16/15 Tue 3/31/15 80% Refine Testing and Work Out Bugs 7 days Mon 3/16/15 Tue 3/24/15 80%
30
Task Name Duration Start Finish % Work
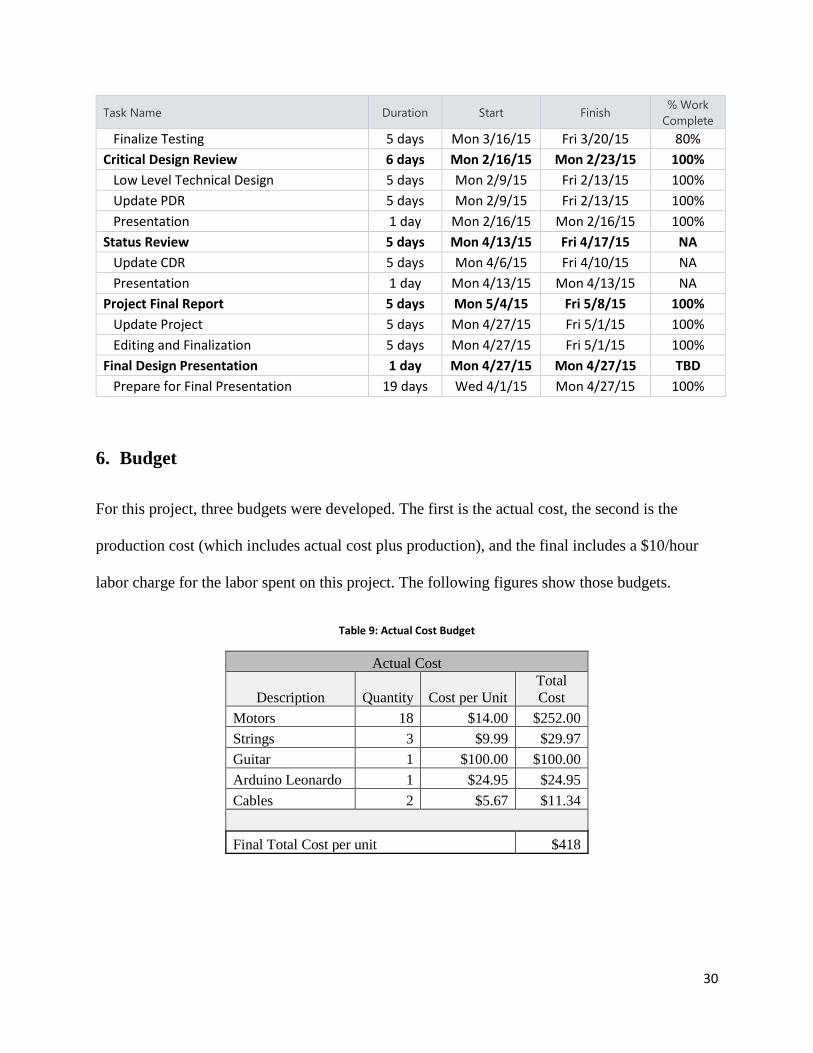
Complete Finalize Testing 5 days Mon 3/16/15 Fri 3/20/15 80% Critical Design Review 6 days Mon 2/16/15 Mon 2/23/15 100% Low Level Technical Design 5 days Mon 2/9/15 Fri 2/13/15 100% Update PDR 5 days Mon 2/9/15 Fri 2/13/15 100% Presentation 1 day Mon 2/16/15 Mon 2/16/15 100% Status Review 5 days Mon 4/13/15 Fri 4/17/15 NA Update CDR 5 days Mon 4/6/15 Fri 4/10/15 NA Presentation 1 day Mon 4/13/15 Mon 4/13/15 NA Project Final Report 5 days Mon 5/4/15 Fri 5/8/15 100% Update Project 5 days Mon 4/27/15 Fri 5/1/15 100% Editing and Finalization 5 days Mon 4/27/15 Fri 5/1/15 100% Final Design Presentation 1 day Mon 4/27/15 Mon 4/27/15 TBD Prepare for Final Presentation 19 days Wed 4/1/15 Mon 4/27/15 100%
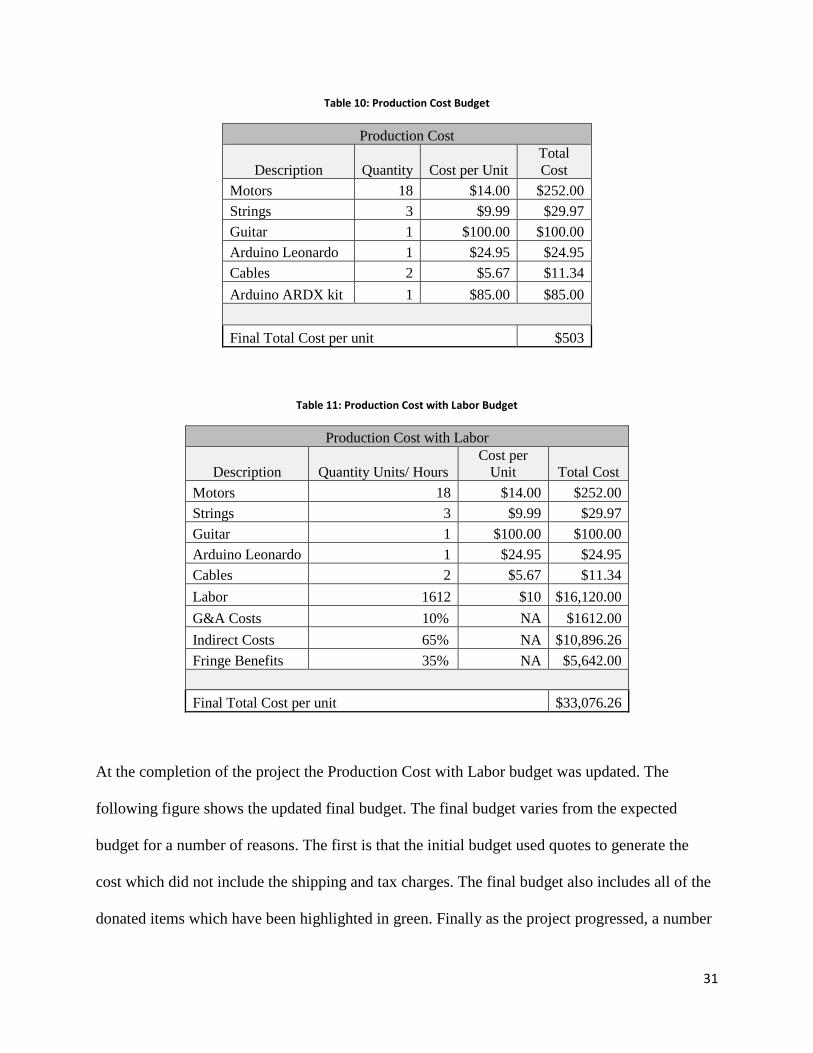
6. Budget
For this project, three budgets were developed. The first is the actual cost, the second is the
production cost (which includes actual cost plus production), and the final includes a $10/hour
labor charge for the labor spent on this project. The following figures show those budgets.
Table 9: Actual Cost Budget
Actual Cost
Description Quantity Cost per Unit Total Cost
Motors 18 $14.00 $252.00 Strings 3 $9.99 $29.97 Guitar 1 $100.00 $100.00 Arduino Leonardo 1 $24.95 $24.95 Cables 2 $5.67 $11.34 Final Total Cost per unit $418
31
Table 10: Production Cost Budget
Production Cost
Description Quantity Cost per Unit Total Cost
Motors 18 $14.00 $252.00 Strings 3 $9.99 $29.97 Guitar 1 $100.00 $100.00 Arduino Leonardo 1 $24.95 $24.95 Cables 2 $5.67 $11.34 Arduino ARDX kit 1 $85.00 $85.00 Final Total Cost per unit $503
Table 11: Production Cost with Labor Budget
Production Cost with Labor
Description Quantity Units/ Hours Cost per
Unit Total Cost Motors 18 $14.00 $252.00 Strings 3 $9.99 $29.97 Guitar 1 $100.00 $100.00 Arduino Leonardo 1 $24.95 $24.95 Cables 2 $5.67 $11.34 Labor 1612 $10 $16,120.00 G&A Costs 10% NA $1612.00 Indirect Costs 65% NA $10,896.26 Fringe Benefits 35% NA $5,642.00 Final Total Cost per unit $33,076.26
At the completion of the project the Production Cost with Labor budget was updated. The
following figure shows the updated final budget. The final budget varies from the expected
budget for a number of reasons. The first is that the initial budget used quotes to generate the
cost which did not include the shipping and tax charges. The final budget also includes all of the
donated items which have been highlighted in green. Finally as the project progressed, a number
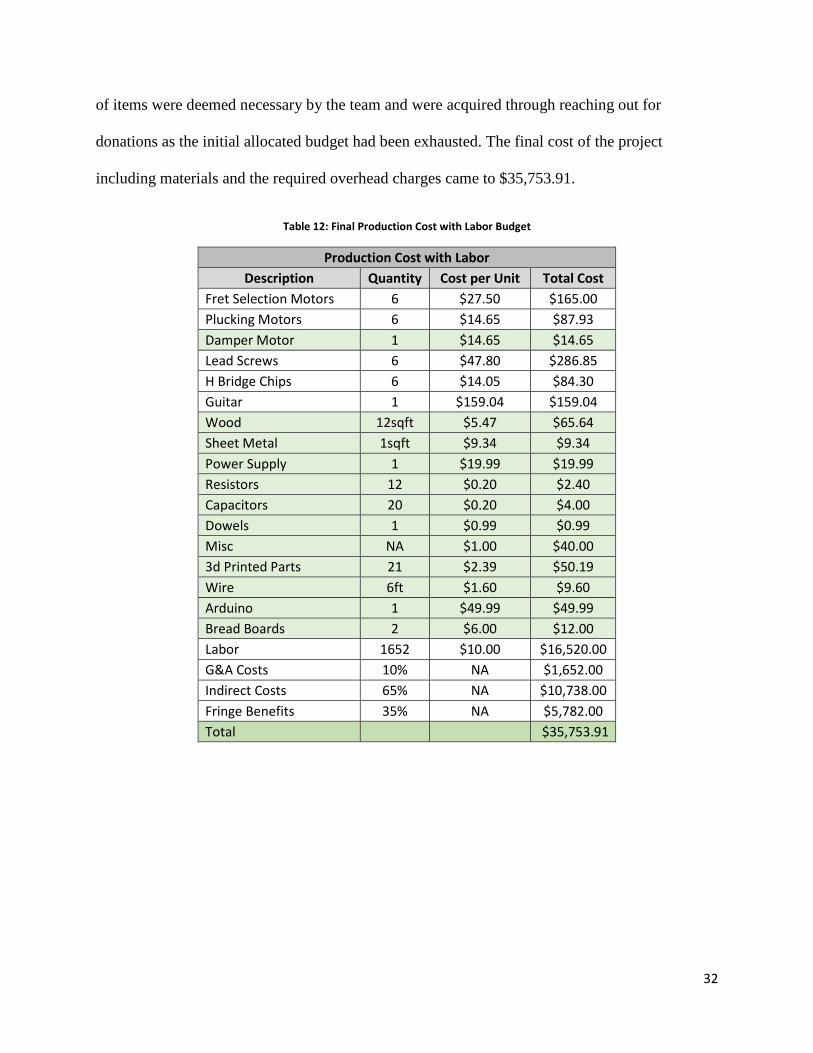
32
of items were deemed necessary by the team and were acquired through reaching out for
donations as the initial allocated budget had been exhausted. The final cost of the project
including materials and the required overhead charges came to $35,753.91.
Table 12: Final Production Cost with Labor Budget
Production Cost with Labor Description Quantity Cost per Unit Total Cost
Fret Selection Motors 6 $27.50 $165.00 Plucking Motors 6 $14.65 $87.93 Damper Motor 1 $14.65 $14.65 Lead Screws 6 $47.80 $286.85 H Bridge Chips 6 $14.05 $84.30 Guitar 1 $159.04 $159.04 Wood 12sqft $5.47 $65.64 Sheet Metal 1sqft $9.34 $9.34 Power Supply 1 $19.99 $19.99 Resistors 12 $0.20 $2.40 Capacitors 20 $0.20 $4.00 Dowels 1 $0.99 $0.99 Misc NA $1.00 $40.00 3d Printed Parts 21 $2.39 $50.19 Wire 6ft $1.60 $9.60 Arduino 1 $49.99 $49.99 Bread Boards 2 $6.00 $12.00 Labor 1652 $10.00 $16,520.00 G&A Costs 10% NA $1,652.00 Indirect Costs 65% NA $10,738.00 Fringe Benefits 35% NA $5,782.00 Total $35,753.91
33
7. Risk Analysis
The main risks involved in this project are as follows for each category.
For technical performance risk, the use of and quality of the mechanisms used to select notes and
play the guitar are unknown. The designs proposed so far should work in theory, but because
they have not been previously tested and documented, we don’t know if they will have the
capability to play the instrument to the quality level that we desire.
For schedule risk, we need to have a final product that can play, at a minimum, 5 notes across
two strings by the end of the spring 2015 semester. This is very reasonable and easy to
accomplish, however, we would like to improve the capability to a much greater tonal range
equal to that of an actual guitar. This is much more difficult to complete in a timely manner. For
the mechanical side, the scheduling risk involved is only pertaining to how much over the
requested amount that we can complete. For the software and control aspects, we need to have a
piece of software that allows a disabled user to control the instrument easily.
For cost risk, we have a budget of $750, excluding the cost of the computer used to program and
run the program and the cost of the accessibility hardware and software that the user would
already own to enable the use of the computer. The main use of this budget will go towards the
prototyping of the different mechanical systems, the construction of the final model, and the
control devices for the system. In total, the microcontrollers should cost no more than $100,
depending on the required amount. The final cost of the device should be no more than around
$500, including the actuators, the microcontrollers listed above, the control boards and
components, the materials required for the device itself, the required strings and tuning pegs, and
components to interface with the computer. This leaves us with approximately $250 to do testing
34
and prototyping, which should be adequate for a large number of prototypes. Therefore, the cost
risk is minimal and should not pose any issues for the construction of the device.
The hardware and software components will both depend heavily on prototyping and testing. We
are unsure of the most effective method to use to select the strings and play the notes, so we
would like to test our top 3-5 ideas in order to decide the most effective and efficient way to
associate the computer and the guitar. This can be done using any software (not required to be
handicap accessible) in order to determine how difficult each method would be to implement.
The software will need to be prototyped and tested for ease of use by a disabled individual and
for musical and maintenance capability of the instrument.
In order to simplify the fever charts, the risk analysis was broken up into three sections for
technical performance, schedule, and budget risks. The technical performance risk chart contains
risks pertaining to the device itself such as building and playback issues. The schedule risk chart
contains risks associated with the timing of the project and when each objective is completed.
The budget risk chart contains concerns that may arise should the design need to change in any
respect. Each of the potential risks were then assigned a position on the chart based on likelihood
and consequence of occurrence. A low risk will appear lower on the charts, indicating that the
likelihood of an occurrence is minimal. Conversely, a higher risk will appear higher on the chart,
indicating that it is likely for that issue to occur in the project. Similar to the risk, the
consequence of an occurrence can be seen horizontally on the chart with the leftmost portion of
the chart indicating that an occurrence will have little to no effect on the project and the
rightmost portion indicating that an occurrence will have a large effect and could potentially
hinder the completion of the project.
35
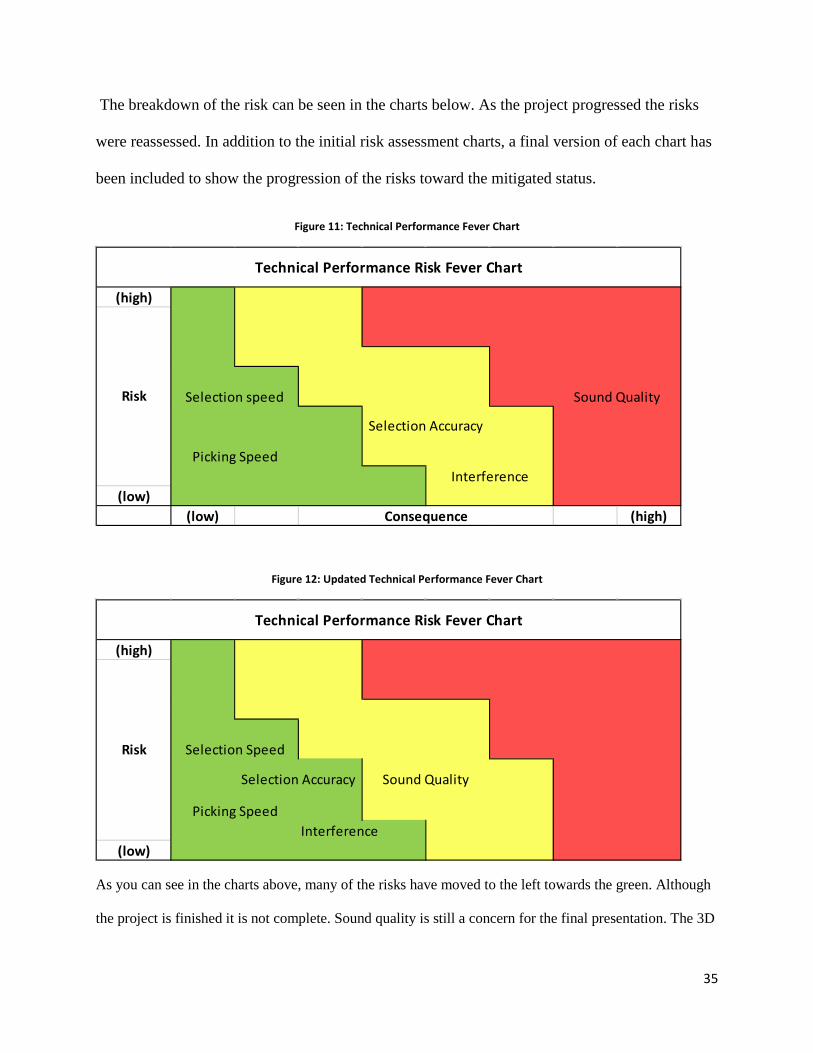
The breakdown of the risk can be seen in the charts below. As the project progressed the risks
were reassessed. In addition to the initial risk assessment charts, a final version of each chart has
been included to show the progression of the risks toward the mitigated status.
Figure 11: Technical Performance Fever Chart
Figure 12: Updated Technical Performance Fever Chart
As you can see in the charts above, many of the risks have moved to the left towards the green. Although
the project is finished it is not complete. Sound quality is still a concern for the final presentation. The 3D
(high)
(low)(low) (high)
Risk
Technical Performance Risk Fever Chart
Consequence
Sound QualitySelection speed
Picking Speed
Selection Accuracy
Interference
(high)
(low)
Risk
Technical Performance Risk Fever Chart
Selection Speed
Picking Speed
Sound QualitySelection Accuracy
Interference
36
printed wheels pose some sound concerns while moving up and down the strings. Each other task has
moved completely into the green because the speed, accuracy and interference have each been determined
and mitigated.
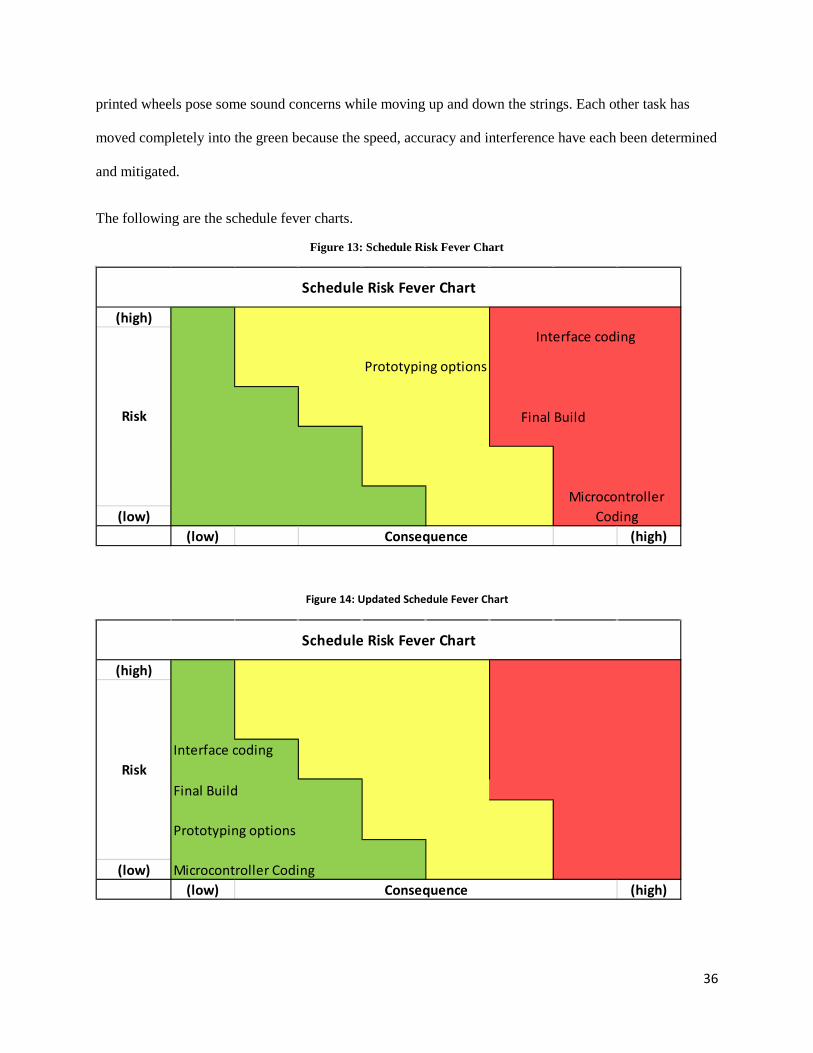
The following are the schedule fever charts.
Figure 13: Schedule Risk Fever Chart
Figure 14: Updated Schedule Fever Chart
(high)
(low)(low) (high)Consequence
Final Build
Interface coding
Microcontroller Coding
Prototyping options
Risk
Schedule Risk Fever Chart
(high)
Interface coding
Final Build
(low)(low) (high)
Schedule Risk Fever Chart
Consequence
Risk
Prototyping options
Microcontroller Coding
37
The semester has come to an end and the project is due. At this point any scheduling concern is overcome
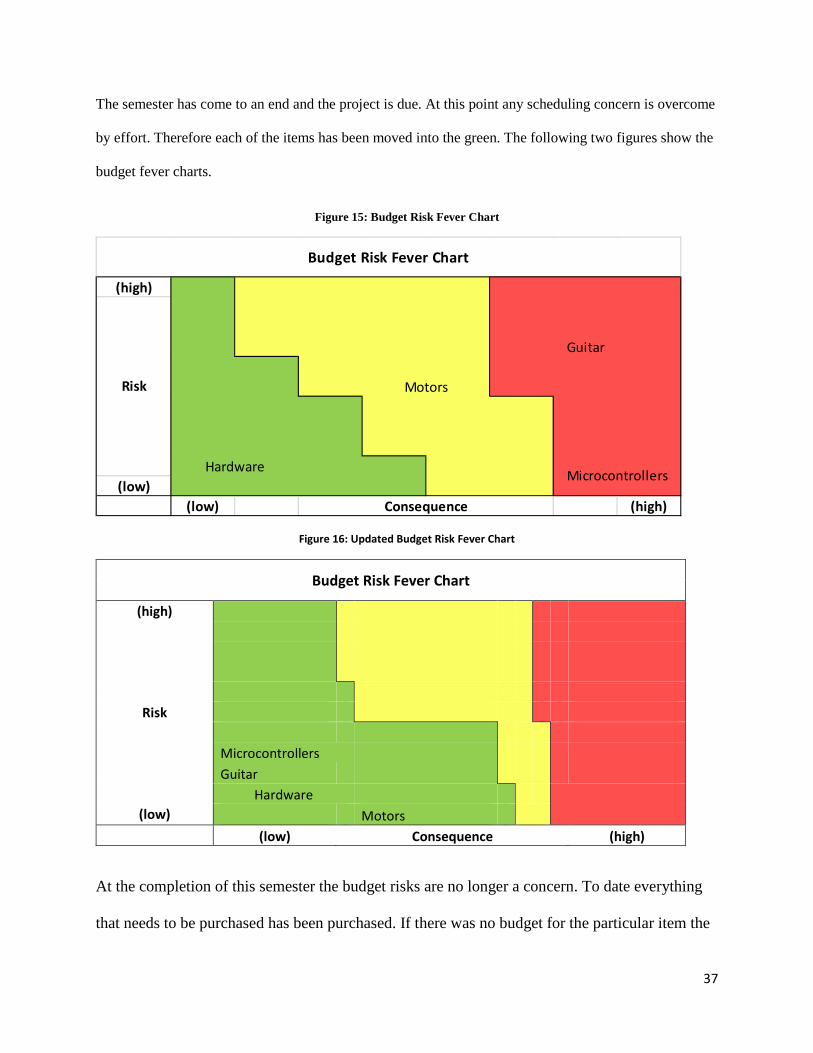
by effort. Therefore each of the items has been moved into the green. The following two figures show the
budget fever charts.
Figure 15: Budget Risk Fever Chart
Figure 16: Updated Budget Risk Fever Chart
Budget Risk Fever Chart
(high)
Risk
Microcontrollers Guitar
Hardware
(low) Motors (low) Consequence (high)
At the completion of this semester the budget risks are no longer a concern. To date everything
that needs to be purchased has been purchased. If there was no budget for the particular item the
(high)
Guitar
(low)(low) (high)Consequence
Microcontrollers
Motors
Hardware
Risk
Budget Risk Fever Chart
38
team secured donations to fulfill the need. After all materials were acquired the project the
budget concerns were considered mitigated and moved into the green.
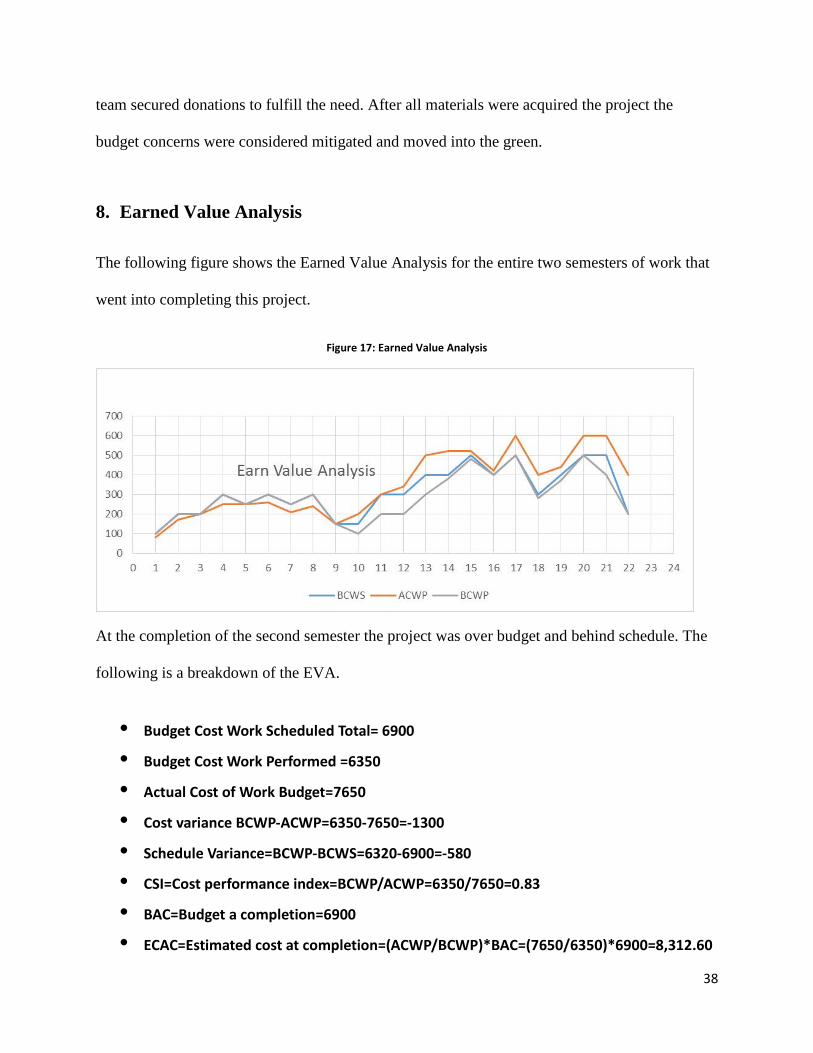
8. Earned Value Analysis
The following figure shows the Earned Value Analysis for the entire two semesters of work that
went into completing this project.
Figure 17: Earned Value Analysis
At the completion of the second semester the project was over budget and behind schedule. The
following is a breakdown of the EVA.
• Budget Cost Work Scheduled Total= 6900 • Budget Cost Work Performed =6350 • Actual Cost of Work Budget=7650 • Cost variance BCWP-ACWP=6350-7650=-1300 • Schedule Variance=BCWP-BCWS=6320-6900=-580 • CSI=Cost performance index=BCWP/ACWP=6350/7650=0.83 • BAC=Budget a completion=6900 • ECAC=Estimated cost at completion=(ACWP/BCWP)*BAC=(7650/6350)*6900=8,312.60
39
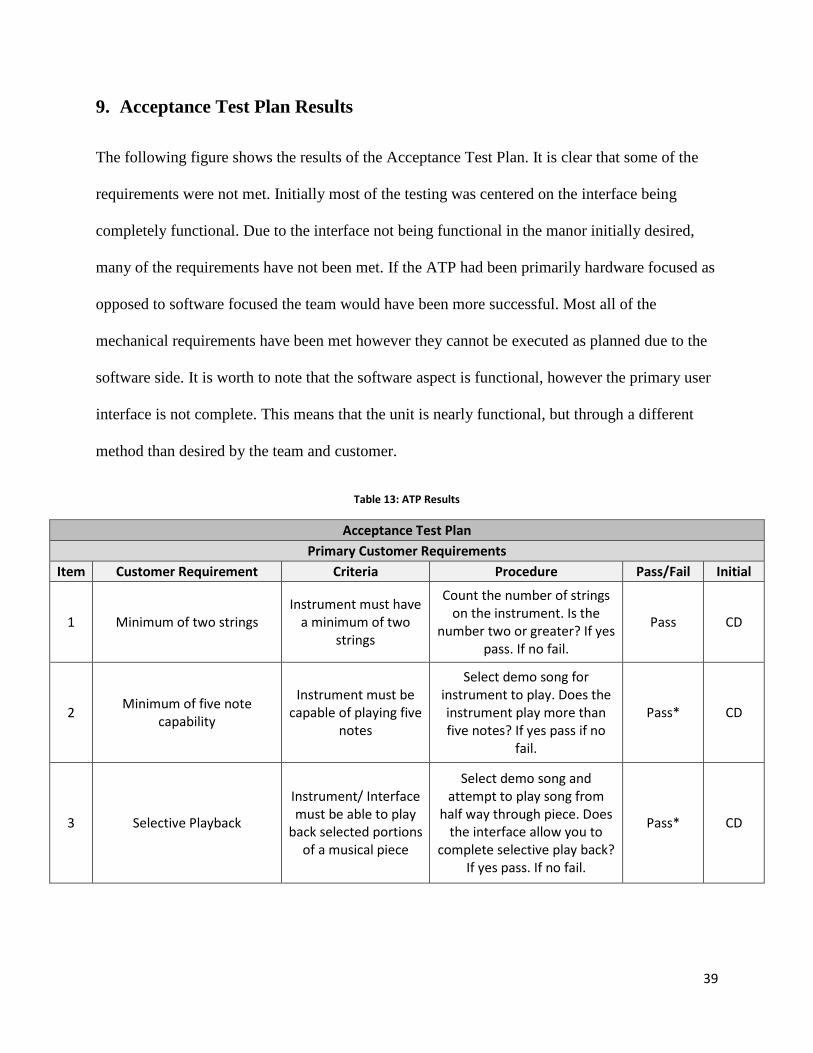
9. Acceptance Test Plan Results
The following figure shows the results of the Acceptance Test Plan. It is clear that some of the
requirements were not met. Initially most of the testing was centered on the interface being
completely functional. Due to the interface not being functional in the manor initially desired,
many of the requirements have not been met. If the ATP had been primarily hardware focused as
opposed to software focused the team would have been more successful. Most all of the
mechanical requirements have been met however they cannot be executed as planned due to the
software side. It is worth to note that the software aspect is functional, however the primary user
interface is not complete. This means that the unit is nearly functional, but through a different
method than desired by the team and customer.
Table 13: ATP Results
Acceptance Test Plan Primary Customer Requirements
Item Customer Requirement Criteria Procedure Pass/Fail Initial
1 Minimum of two strings Instrument must have
a minimum of two strings
Count the number of strings on the instrument. Is the
number two or greater? If yes pass. If no fail.
Pass CD
2 Minimum of five note capability
Instrument must be capable of playing five
notes
Select demo song for instrument to play. Does the instrument play more than five notes? If yes pass if no
fail.
Pass* CD
3 Selective Playback
Instrument/ Interface must be able to play
back selected portions of a musical piece
Select demo song and attempt to play song from
half way through piece. Does the interface allow you to
complete selective play back? If yes pass. If no fail.
Pass* CD
40
4 Store and recall pieces
Instrument/ interface must be able to store
and recall musical pieces
Create a simple musical piece. Save this piece and exit
the program. Restart the program. Are you able to recall the piece that you
previously created? If yes pass. If no fail.
Pass* CD
5 Mouse control Interface must be
controlled using only mouse capability
Open the interface and select a song to play. Are you able to complete this action with only the use of a mouse? If
yes pass. If no fail.
Fail CD
Secondary Customer Requirements
6 String replacement Guitar strings must be
accessible for replacement
Unfasten the guitar from the cradle using the included
instructions. Are you able to remove the guitar from the
cradle so that the strings are easily accessible for
replacement? If yes pass. If no fail.
Pass CD
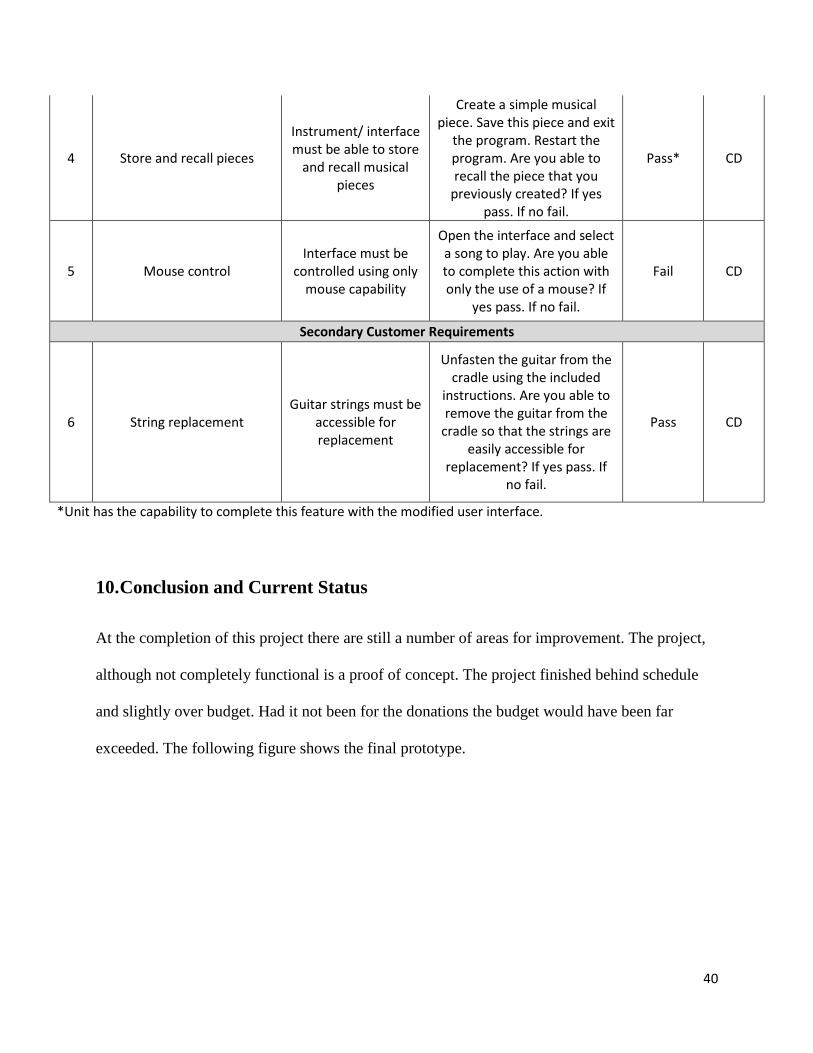
*Unit has the capability to complete this feature with the modified user interface.
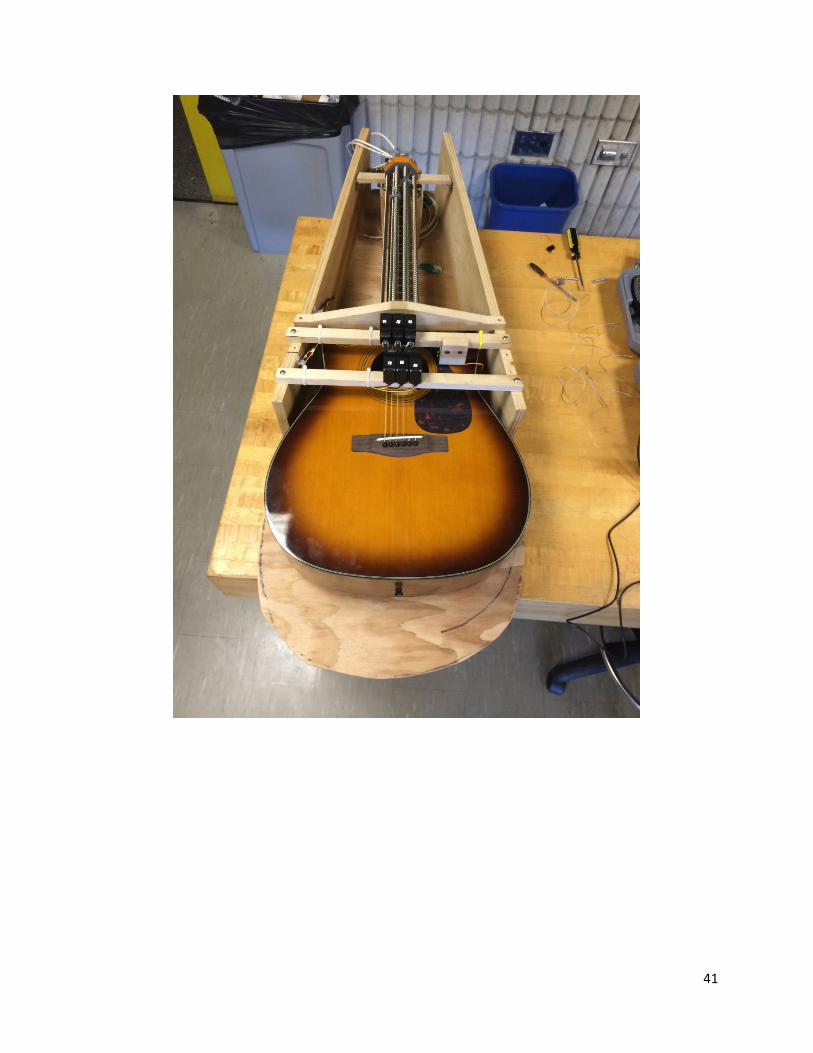
10. Conclusion and Current Status
At the completion of this project there are still a number of areas for improvement. The project,
although not completely functional is a proof of concept. The project finished behind schedule
and slightly over budget. Had it not been for the donations the budget would have been far
exceeded. The following figure shows the final prototype.
41
42
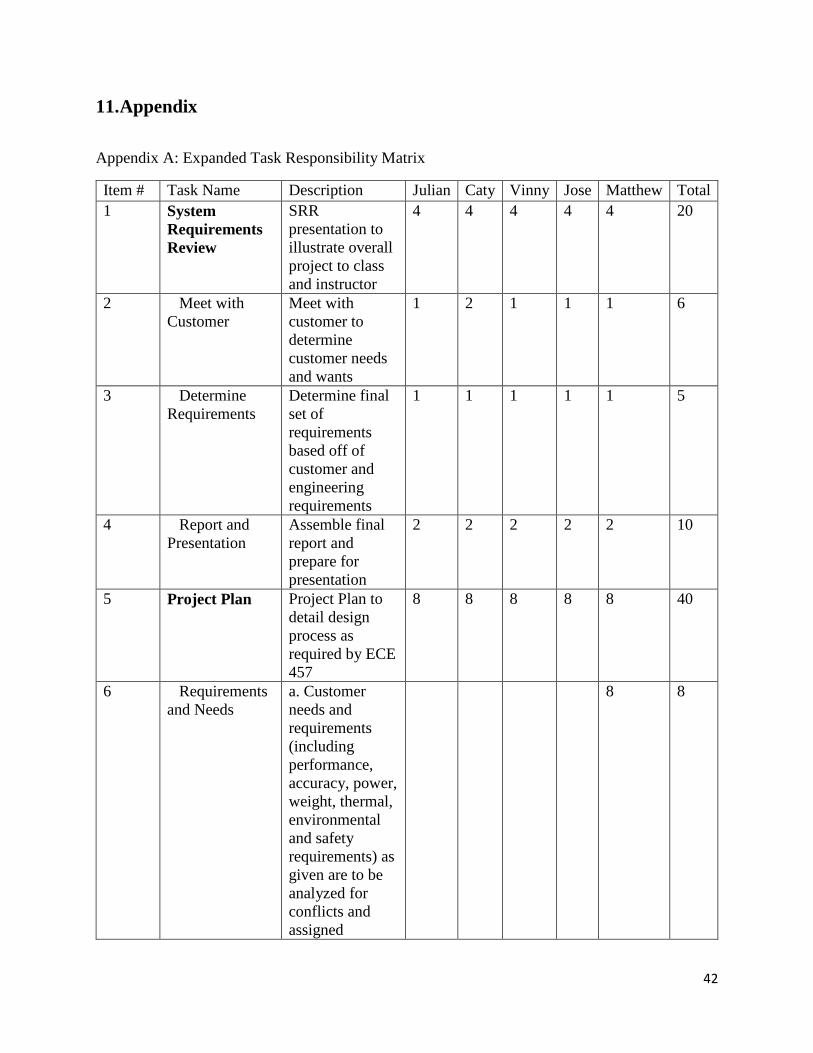
11. Appendix
Appendix A: Expanded Task Responsibility Matrix
Item # Task Name Description Julian Caty Vinny Jose Matthew Total 1 System
Requirements Review
SRR presentation to illustrate overall project to class and instructor
4 4 4 4 4 20
2 Meet with Customer
Meet with customer to determine customer needs and wants
1 2 1 1 1 6
3 Determine Requirements
Determine final set of requirements based off of customer and engineering requirements
1 1 1 1 1 5
4 Report and Presentation
Assemble final report and prepare for presentation
2 2 2 2 2 10
5 Project Plan Project Plan to detail design process as required by ECE 457
8 8 8 8 8 40
6 Requirements and Needs
a. Customer needs and requirements (including performance, accuracy, power, weight, thermal, environmental and safety requirements) as given are to be analyzed for conflicts and assigned
8 8
43
priorities. Specifications will be developed for all requirements. b. Requirements derived from the design approach selected are to be included in this section. c. Both customer and derived requirements can be system requirements or project requirements. Both are to be addressed.
7 TS, SOW, WBS, TRM
a. TS/SOW: Describe tasks to be accomplished b. WBS: Task breakdown (what tasks are necessary to accomplish your project) in a hierarchical format c. TRM: Hours and person for each task in the task breakdown. d. Team process guidelines
8 2 10
8 Technical Approach
a. Explain the three design options. Explain and justify your preferred solution. As a minimum, include a functional block
8 8
44
diagram and software structure breakdown of the system of the preferred solution. b. Include interface requirements (as known), including operator controls and displays c. Include a requirements traceability “matrix.”
9 Schedule a. Show all tasks with start and end dates, including reviews, presentations, and report dates. b. Students will create effort logs (time sheets) and update them a weekly basis. The effort logs would then be used to update the schedule on a regular basis to insure that the project is on track. c. Schedule will be given using a Gantt chart.
5 5
45
10 Budget a. Present three budgets: one for actual cost, one for a production cost (actual cost + donations), and the third that adds a labor cost of $10.00 hour to the production cost. b. Student labor costs will be included in the budget (using data from effort logs and the WBS) c. Budgets will include G&A costs, indirect costs and fringe benefits.
5 5
11 Risk Analysis a. Risk analysis will include the likelihood, potential impact, and mitigation strategy for three categories of risk: 1) technical performance risk, 2) schedule risk, and 3) cost risk. b. Identify areas that will benefit from prototyping (hardware and/or software) and explain how you will conduct these design efforts.
8 8
46
12 Acceptance Test Plan
The ATP is a detailed document describing the step-by-step procedure to be used during acceptance testing, along with the expected results for each test. It is basically a 4-column document, where each column, left to right, contains: a) Requirement to be demonstrated b) Criteria (expected value) c) Step-by-step procedure d) Results (actual value) – to be completed during acceptance testing
4 4 4 4 4 20
13 Determine Criteria
Determine the criteria which will be incorporated into the ATP
1 1 1 1 1 5
14 Document Document and refine the final Acceptance Test Plan
4 4 4 4 4 20
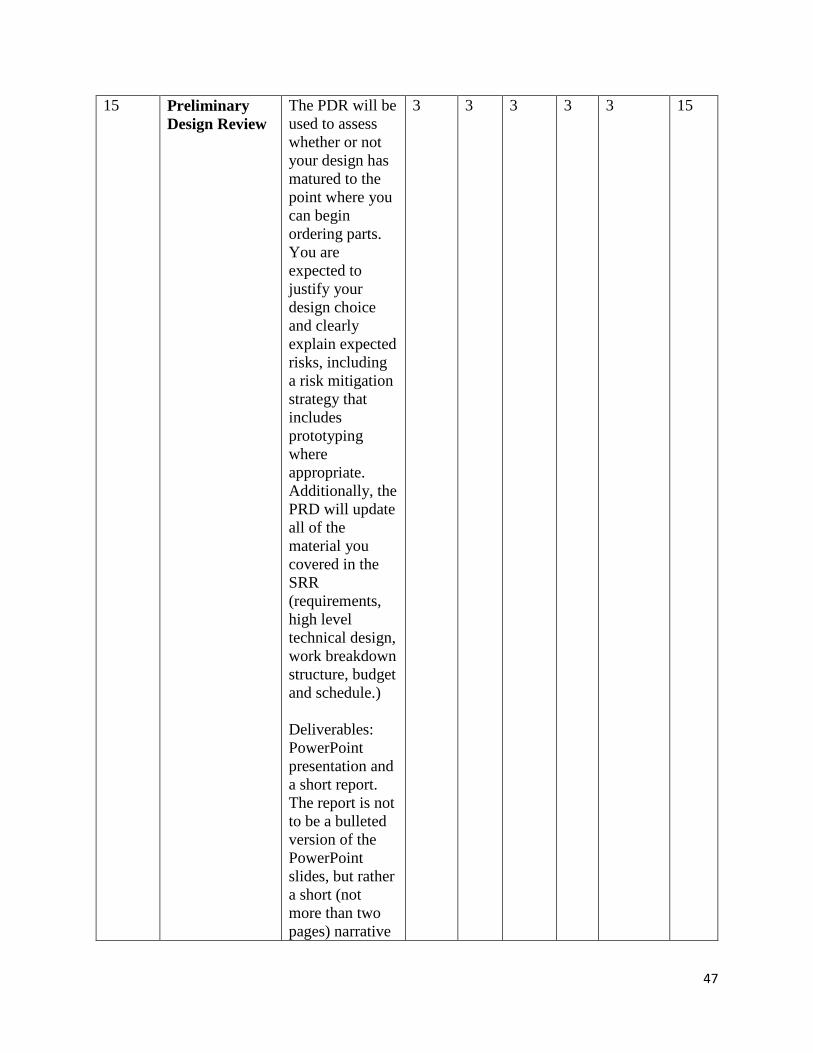
47
15 Preliminary Design Review
The PDR will be used to assess whether or not your design has matured to the point where you can begin ordering parts. You are expected to justify your design choice and clearly explain expected risks, including a risk mitigation strategy that includes prototyping where appropriate. Additionally, the PRD will update all of the material you covered in the SRR (requirements, high level technical design, work breakdown structure, budget and schedule.) Deliverables: PowerPoint presentation and a short report. The report is not to be a bulleted version of the PowerPoint slides, but rather a short (not more than two pages) narrative
3 3 3 3 3 15
48
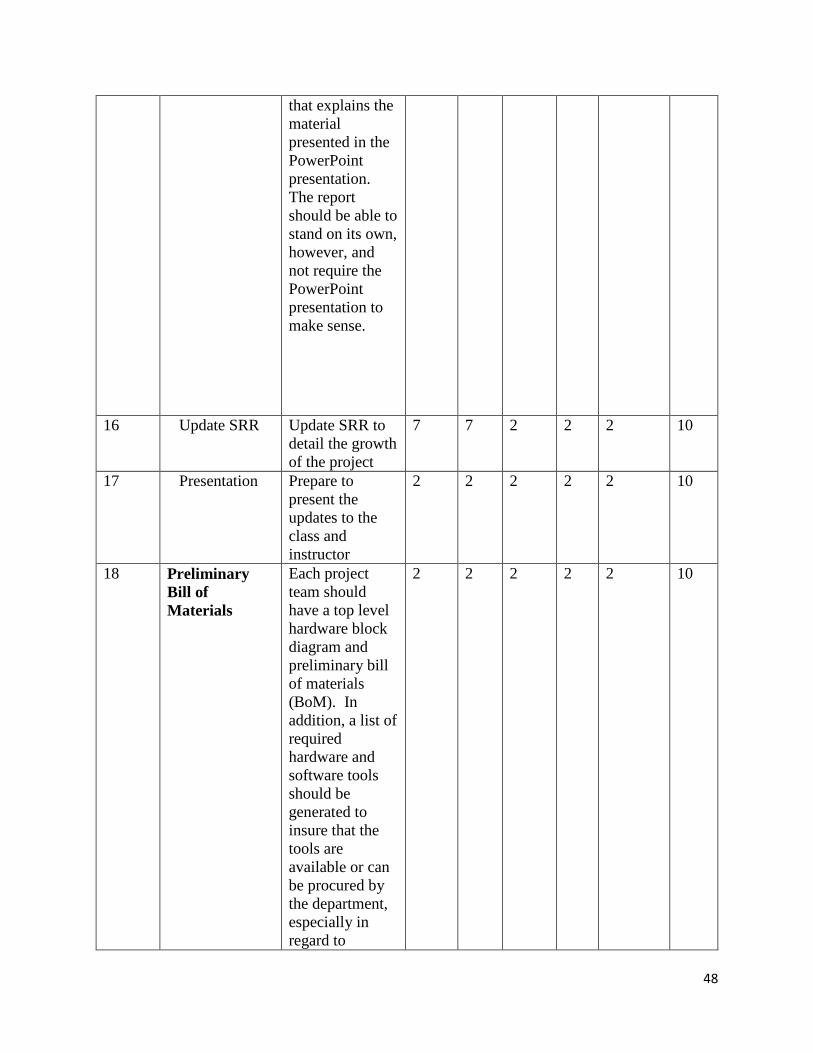
that explains the material presented in the PowerPoint presentation. The report should be able to stand on its own, however, and not require the PowerPoint presentation to make sense.
16 Update SRR Update SRR to detail the growth of the project
7 7 2 2 2 10
17 Presentation Prepare to present the updates to the class and instructor
2 2 2 2 2 10
18 Preliminary Bill of Materials
Each project team should have a top level hardware block diagram and preliminary bill of materials (BoM). In addition, a list of required hardware and software tools should be generated to insure that the tools are available or can be procured by the department, especially in regard to
2 2 2 2 2 10
49
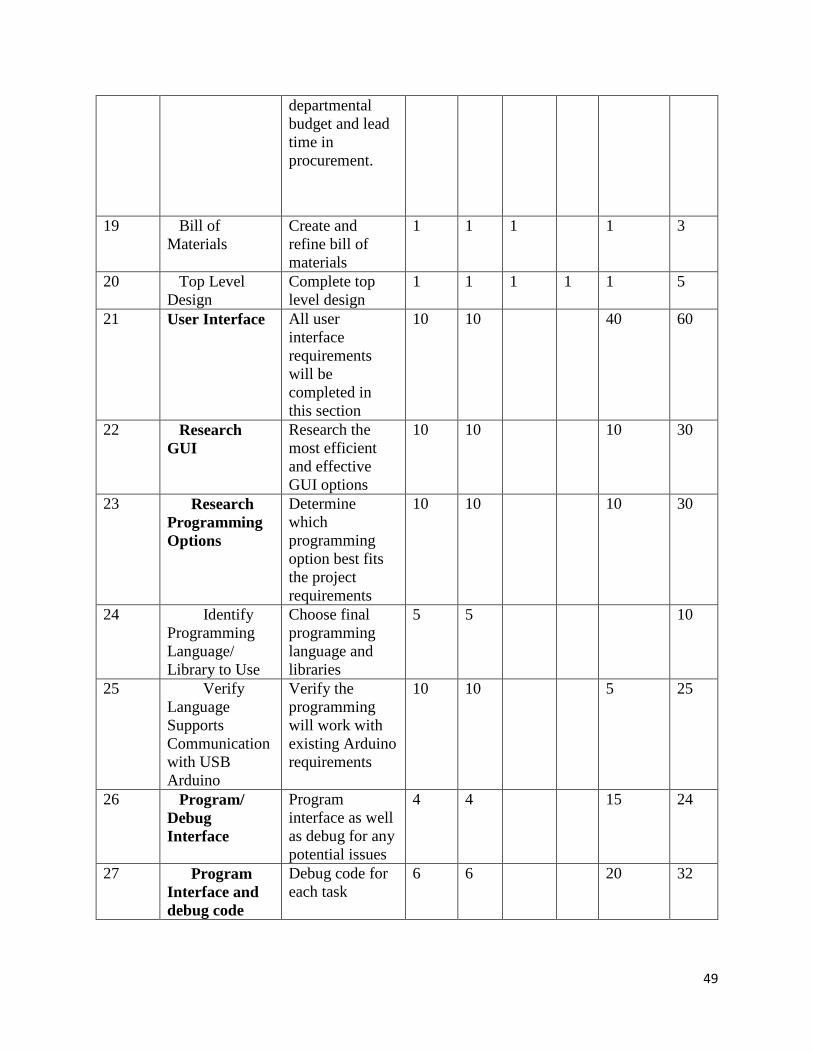
departmental budget and lead time in procurement.
19 Bill of Materials
Create and refine bill of materials
1 1 1 1 3
20 Top Level Design
Complete top level design
1 1 1 1 1 5
21 User Interface All user interface requirements will be completed in this section
10 10 40 60
22 Research GUI
Research the most efficient and effective GUI options
10 10 10 30
23 Research Programming Options
Determine which programming option best fits the project requirements
10 10 10 30
24 Identify Programming Language/ Library to Use
Choose final programming language and libraries
5 5 10
25 Verify Language Supports Communication with USB Arduino
Verify the programming will work with existing Arduino requirements
10 10 5 25
26 Program/ Debug Interface
Program interface as well as debug for any potential issues
4 4 15 24
27 Program Interface and debug code
Debug code for each task
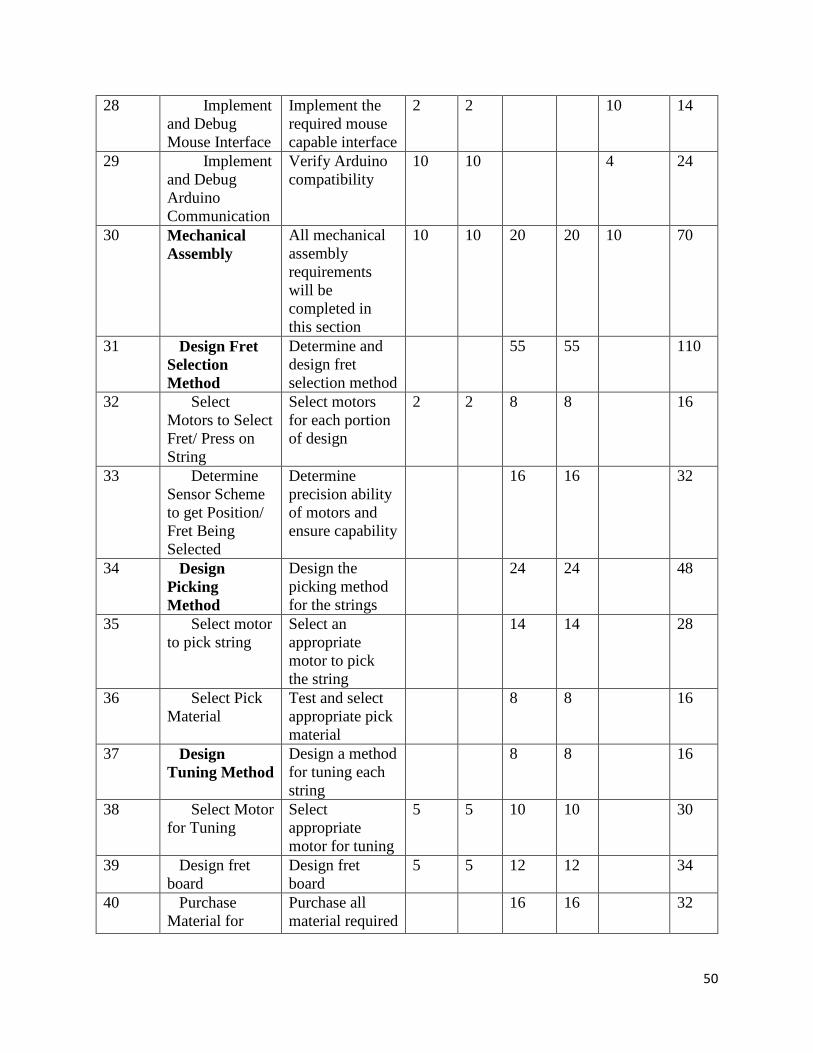
6 6 20 32
50
28 Implement and Debug Mouse Interface
Implement the required mouse capable interface
2 2 10 14
29 Implement and Debug Arduino Communication
Verify Arduino compatibility
10 10 4 24
30 Mechanical Assembly
All mechanical assembly requirements will be completed in this section
10 10 20 20 10 70
31 Design Fret Selection Method
Determine and design fret selection method
55 55 110
32 Select Motors to Select Fret/ Press on String
Select motors for each portion of design
2 2 8 8 16
33 Determine Sensor Scheme to get Position/ Fret Being Selected
Determine precision ability of motors and ensure capability
16 16 32
34 Design Picking Method
Design the picking method for the strings
24 24 48
35 Select motor to pick string
Select an appropriate motor to pick the string
14 14 28
36 Select Pick Material
Test and select appropriate pick material
8 8 16
37 Design Tuning Method
Design a method for tuning each string
8 8 16
38 Select Motor for Tuning
Select appropriate motor for tuning
5 5 10 10 30
39 Design fret board
Design fret board
5 5 12 12 34
40 Purchase Material for
Purchase all material required
16 16 32
51
Mechanical Assembly
for testing and final prototype
41 Construct and Test Mechanical Assembly
Construct mechanical assembly
20 20 40
42 System Integration
Integrate all system components
4 4 4 4 4 20
43 Program Arduino
Program Arduino with applicable code
20 20 10 50
44 Integrate Interface with Mechanical Assembly
Integrate the interface with the mechanical assembly
5 5 5 5 10 30
45 System Testing Complete system testing
10 10 10 10 10 50
46 Test Integrated Assembly
Test the integrated assembly against the ATP
10 10 20 40
47 Refine Testing and Work Out Bugs
Refine the testing and make any applicable changes
10 10 20 40
48 Finalize Testing
Finalize the testing with the ATP
5 5 5 5 5 25
49 Critical Design Review
Critical design review of the project
4 4 4 4 4 20
50 Low Level Technical Design
Complete a low level technical design
5 5 5 5 5 25
51 Update PDR Update the PRD to reflect these changes
8 4 4 4 4 20
52 Presentation Prepare for and complete the presentation
10 10 10 10 10 50
53 Status Review Complete the Status Review
3 3 3 3 3 15
54 Update CDR Update the CDR to reflect any changes or
10 10 10 10 10 50
52
updates to the project
55 Presentation Prepare for and complete the presentation
10 10 5 5 5 25
56 Project Final Report
Complete the project final report
30 30 20 20 20 100
57 Update Project Update the project with any necessary changes
3 3 3 3 3 15
58 Editing and Finalization
Edit and finalize the report prior to submission
3 3 3 3 3 15
59 Final Design Presentation
Complete the final design presentation
1 1 1 1 1 5
60 Prepare for Final Presentation
Prepare for/ rehearse the final presentation
3 3 3 3 3 15
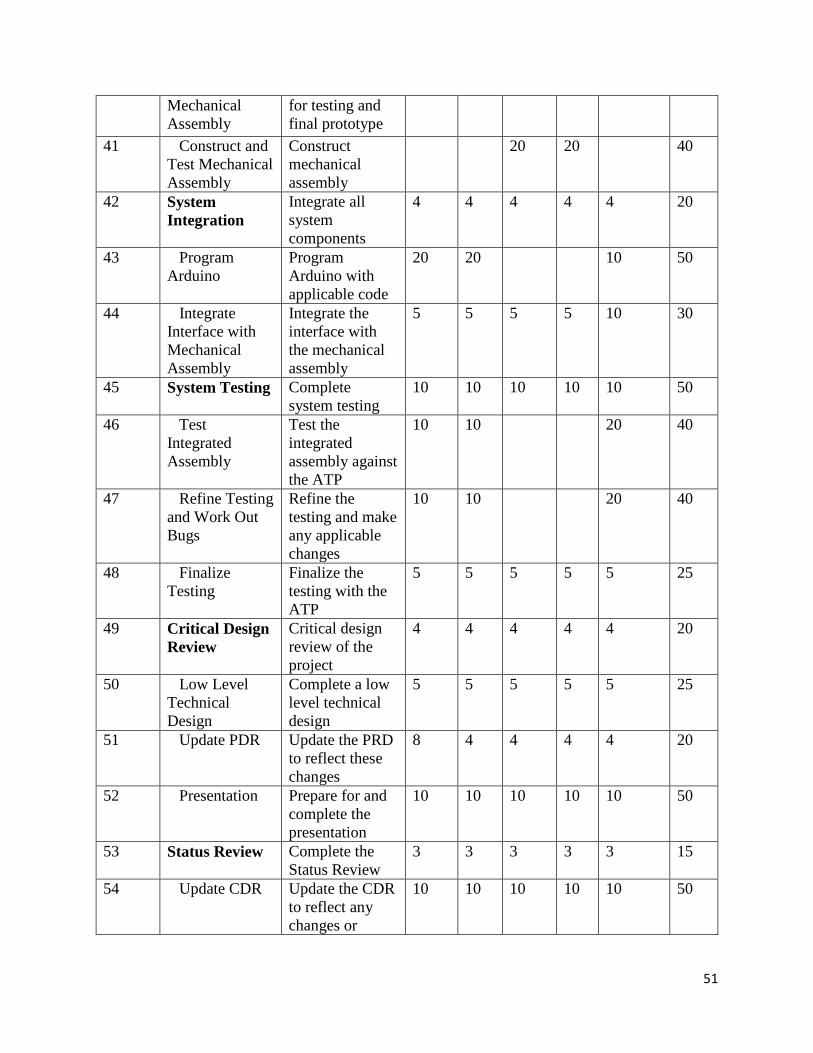
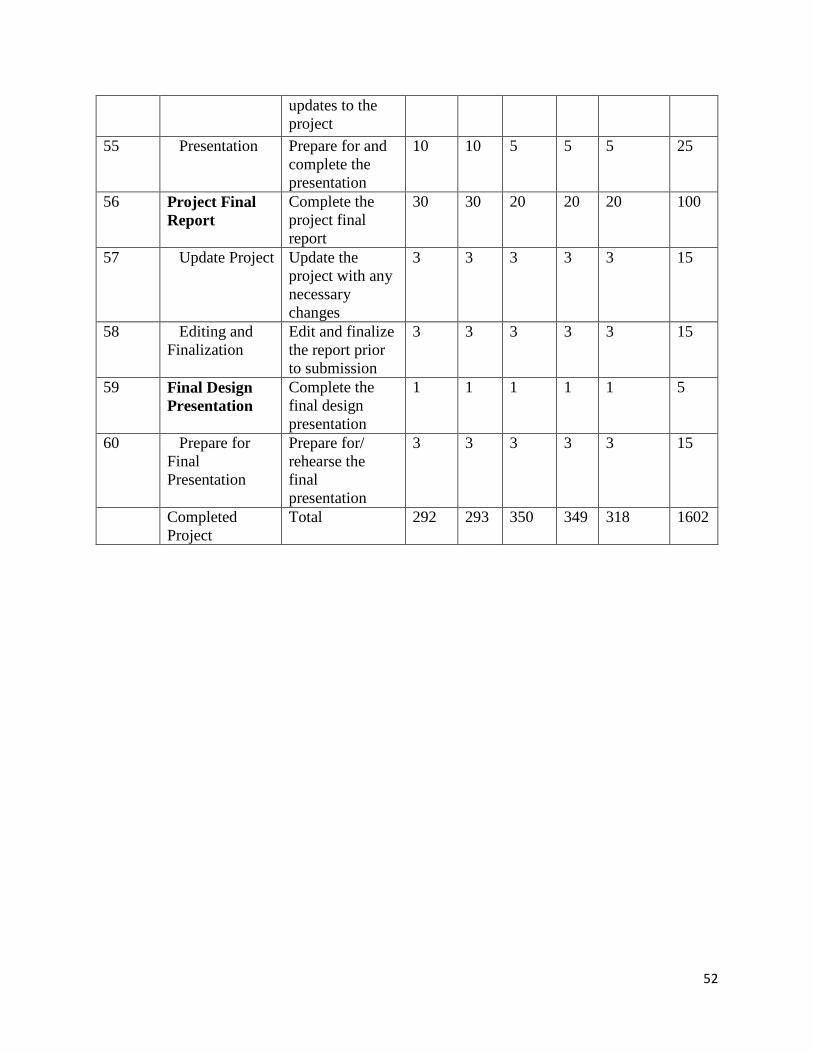
Completed Project
Total 292 293 350 349 318 1602
53
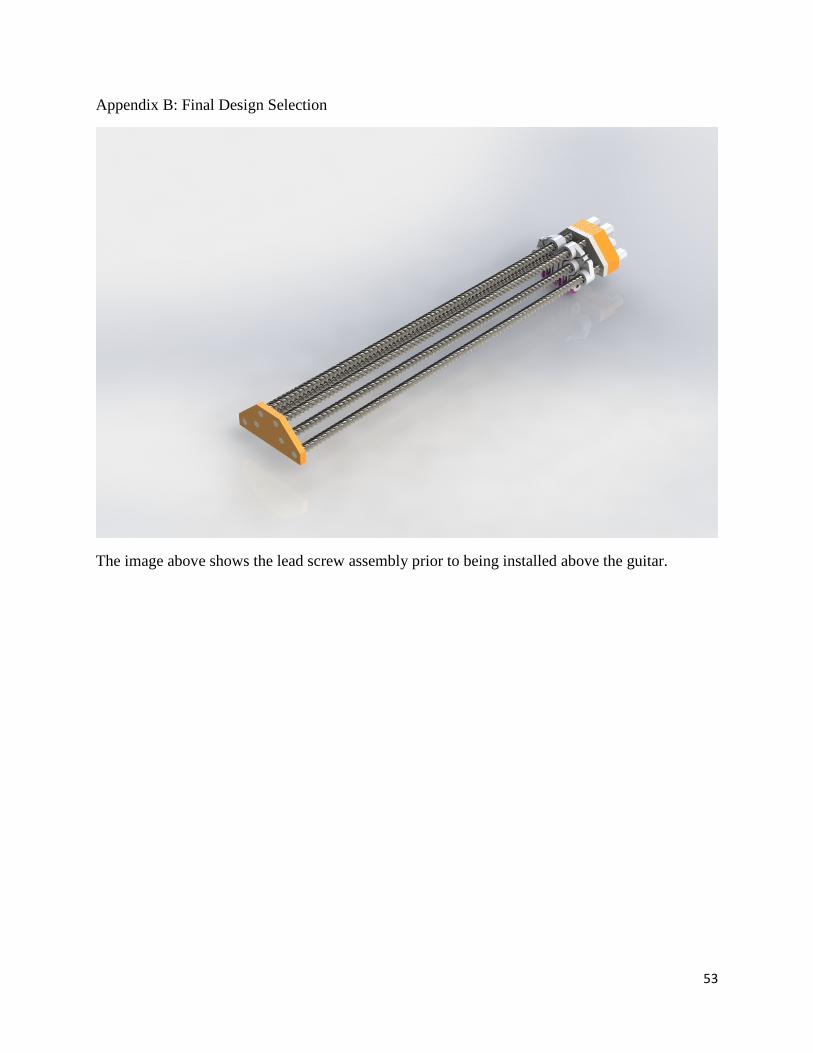
Appendix B: Final Design Selection
The image above shows the lead screw assembly prior to being installed above the guitar.
54
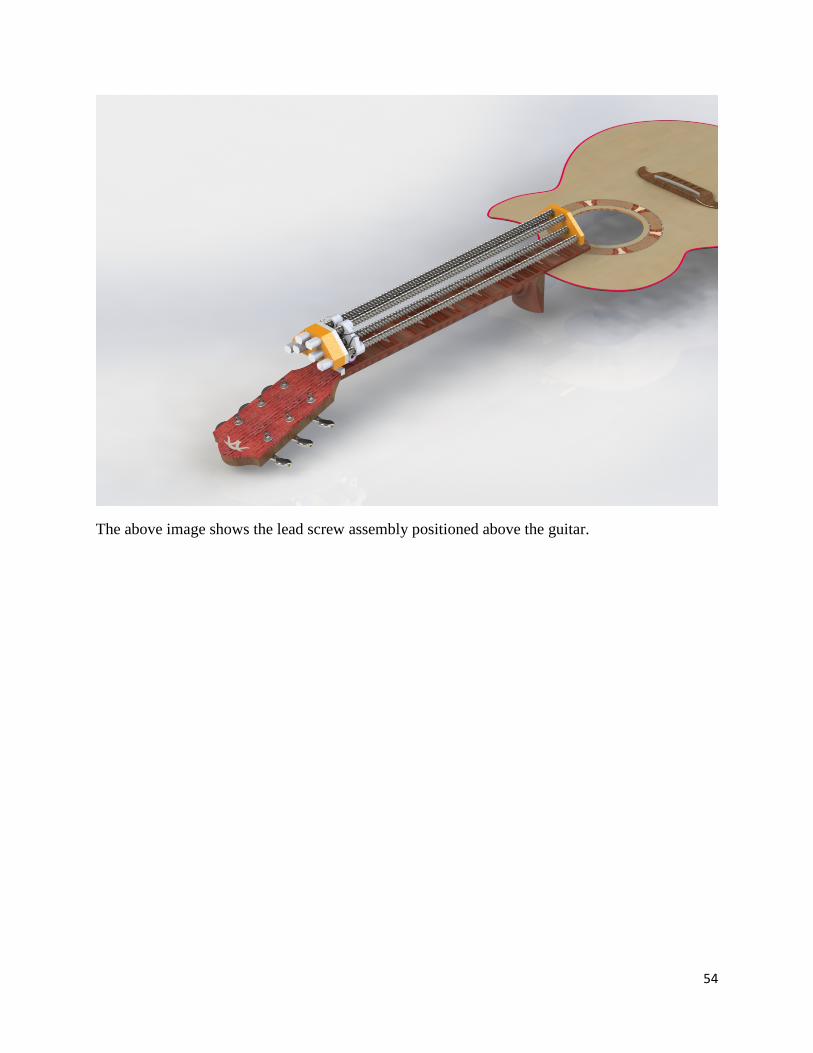
The above image shows the lead screw assembly positioned above the guitar.
55
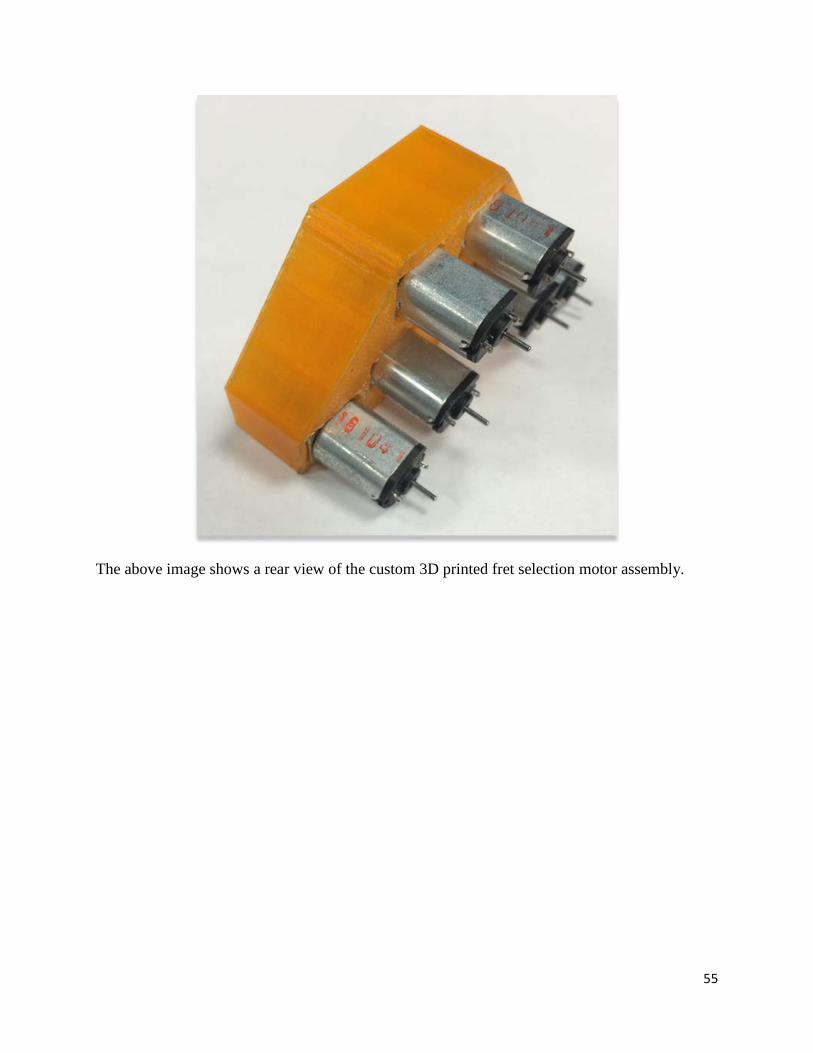
The above image shows a rear view of the custom 3D printed fret selection motor assembly.
56
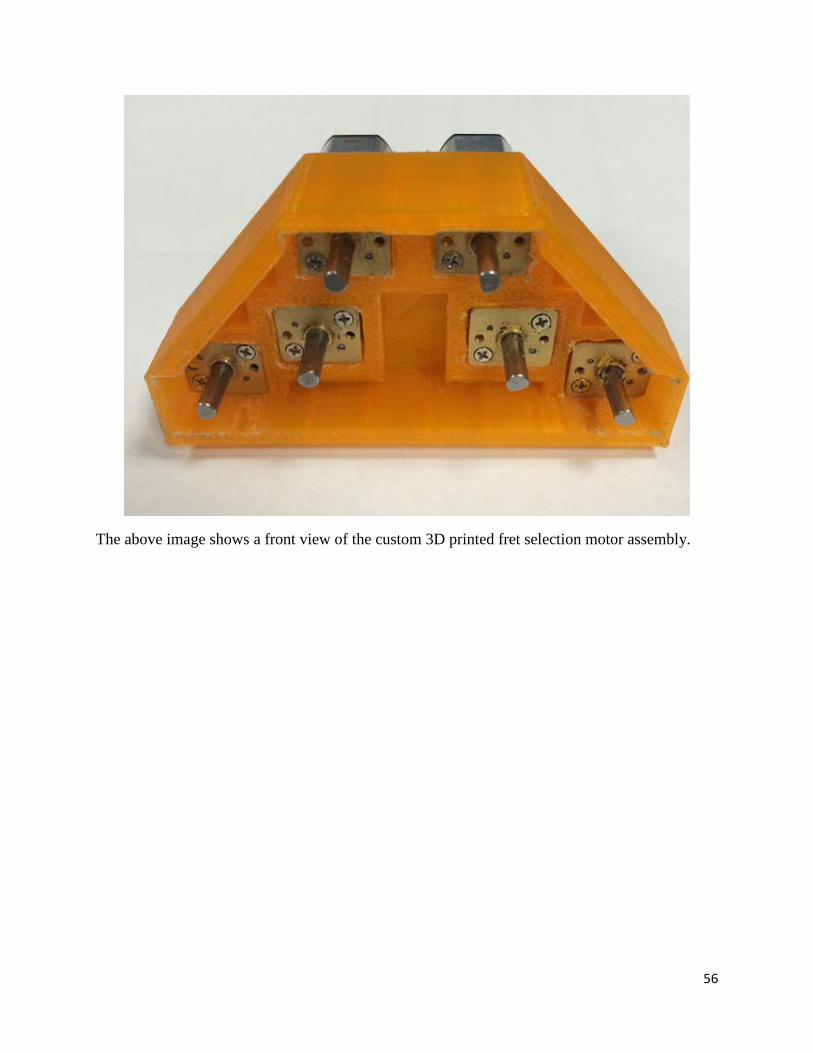
The above image shows a front view of the custom 3D printed fret selection motor assembly.
57
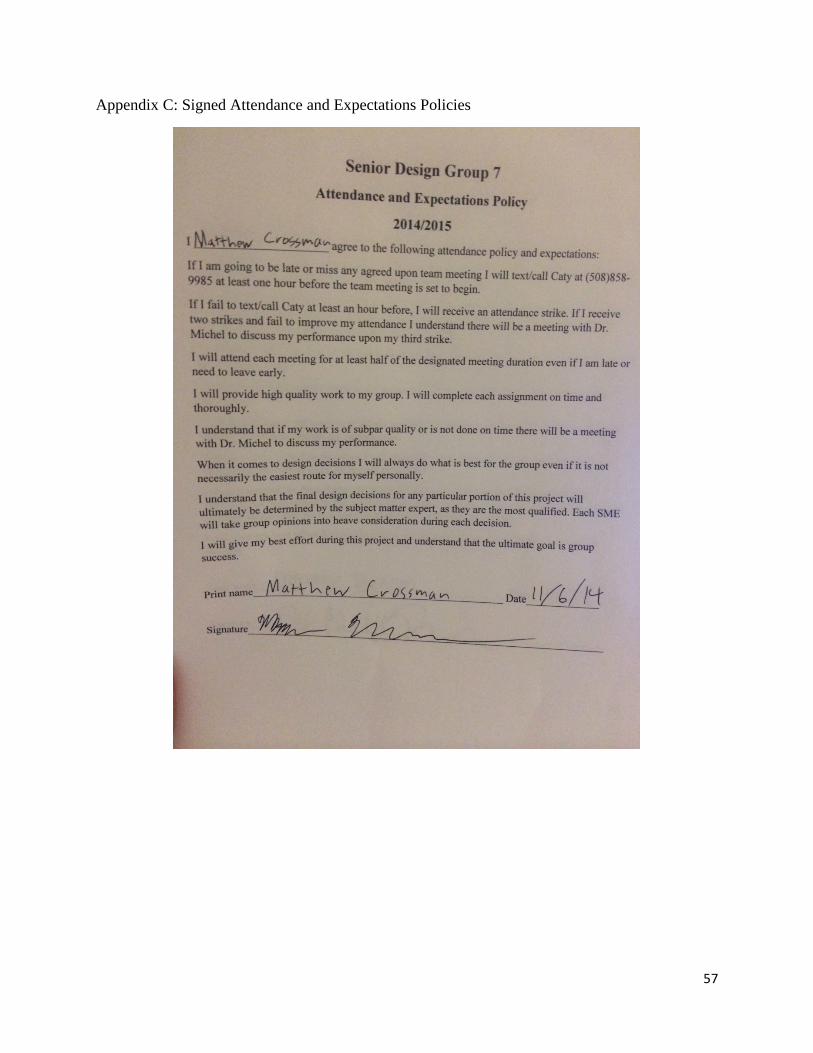
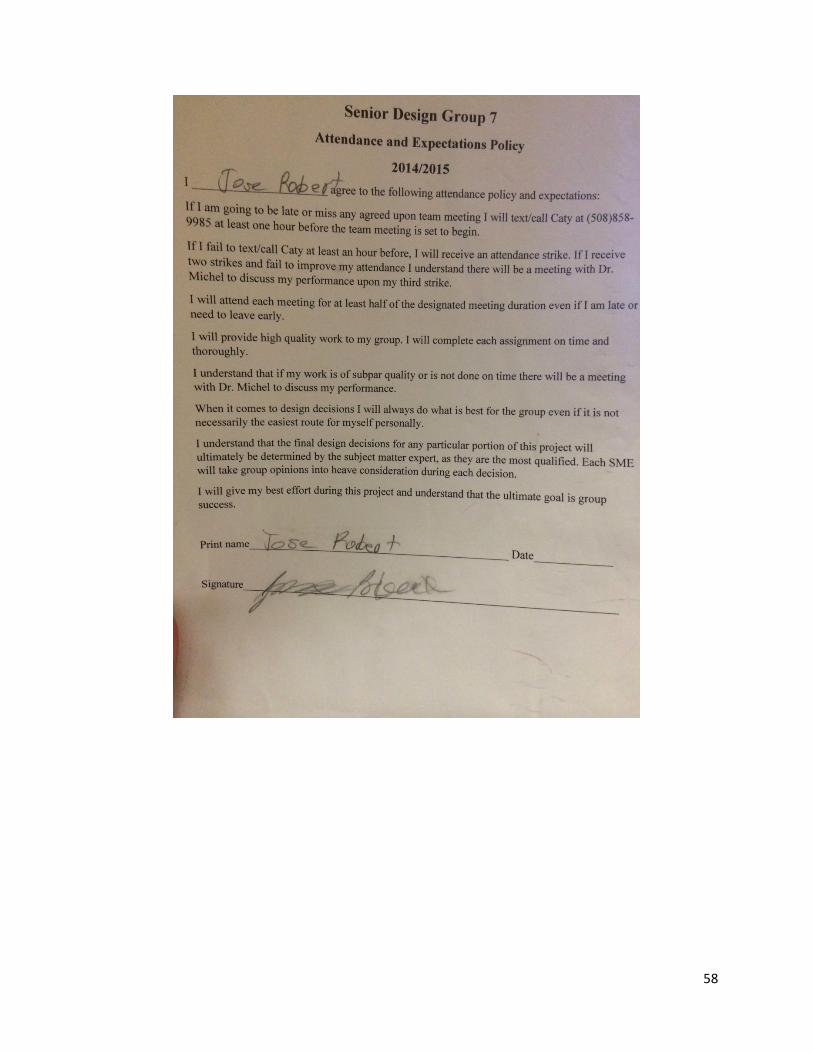
Appendix C: Signed Attendance and Expectations Policies
58
59
60
61
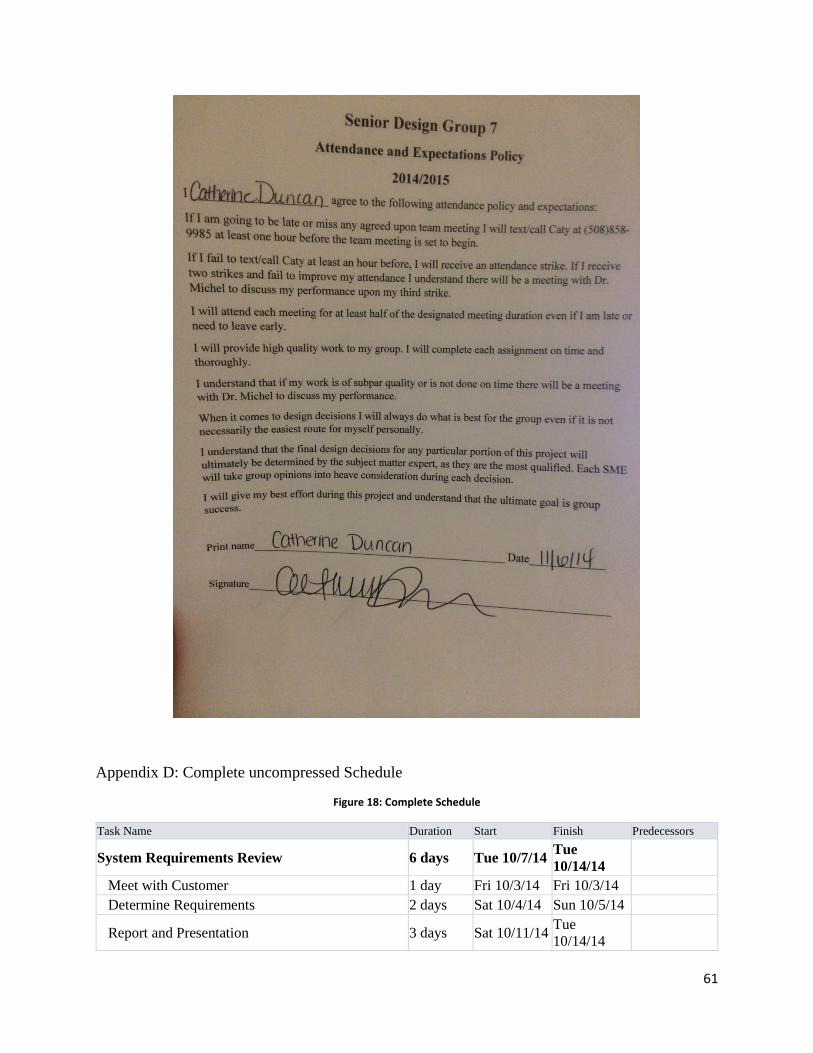
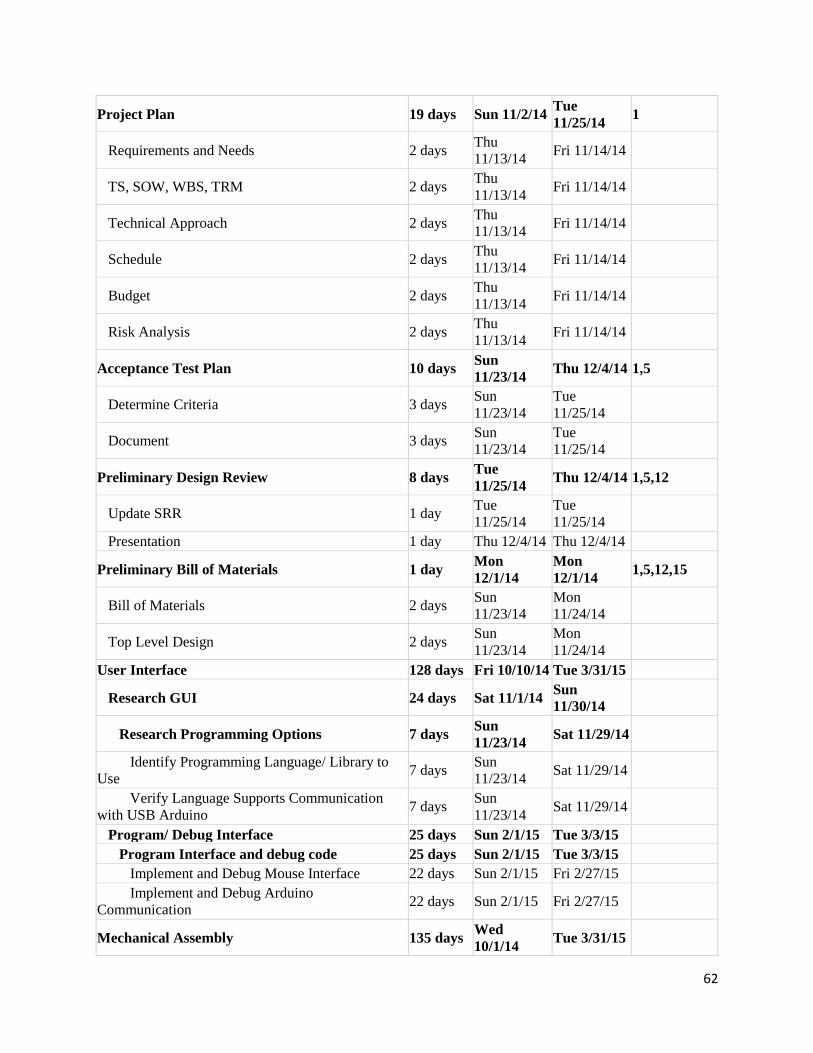
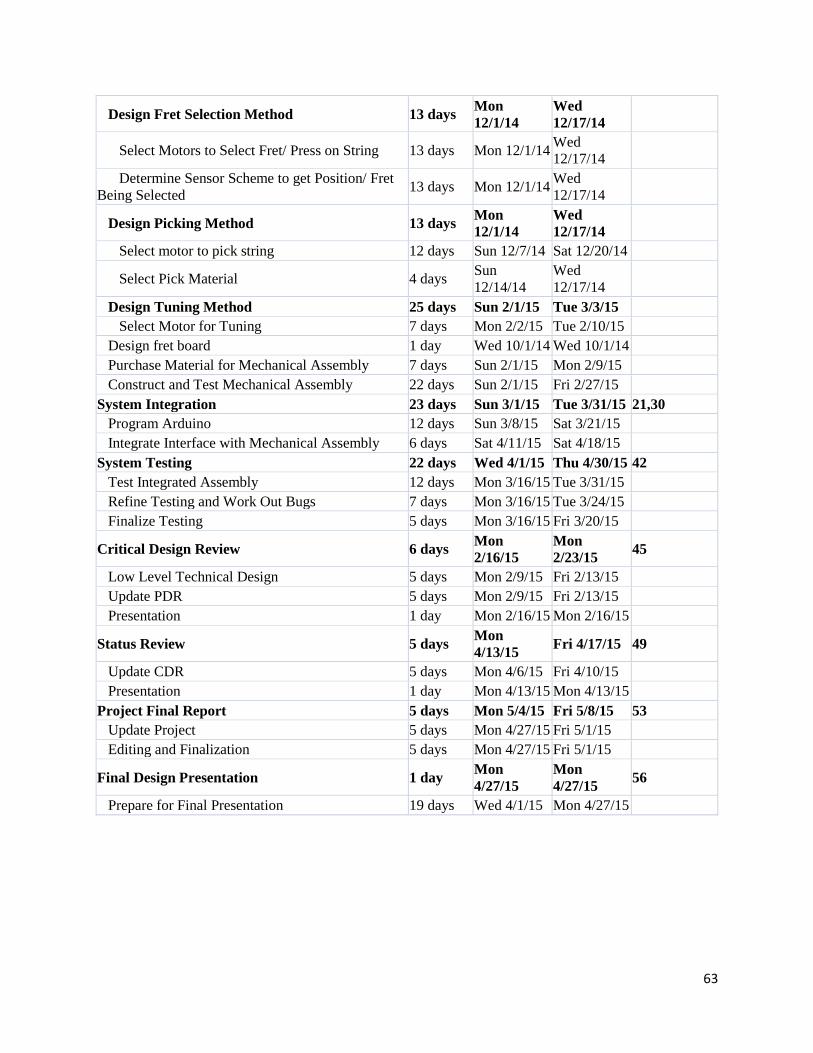
Appendix D: Complete uncompressed Schedule
Figure 18: Complete Schedule
Task Name Duration Start Finish Predecessors
System Requirements Review 6 days Tue 10/7/14 Tue 10/14/14
Meet with Customer 1 day Fri 10/3/14 Fri 10/3/14 Determine Requirements 2 days Sat 10/4/14 Sun 10/5/14
Report and Presentation 3 days Sat 10/11/14 Tue 10/14/14
62
Project Plan 19 days Sun 11/2/14 Tue 11/25/14 1
Requirements and Needs 2 days Thu 11/13/14 Fri 11/14/14
TS, SOW, WBS, TRM 2 days Thu 11/13/14 Fri 11/14/14
Technical Approach 2 days Thu 11/13/14 Fri 11/14/14
Schedule 2 days Thu 11/13/14 Fri 11/14/14
Budget 2 days Thu 11/13/14 Fri 11/14/14
Risk Analysis 2 days Thu 11/13/14 Fri 11/14/14
Acceptance Test Plan 10 days Sun 11/23/14 Thu 12/4/14 1,5
Determine Criteria 3 days Sun 11/23/14
Tue 11/25/14
Document 3 days Sun 11/23/14
Tue 11/25/14
Preliminary Design Review 8 days Tue 11/25/14 Thu 12/4/14 1,5,12
Update SRR 1 day Tue 11/25/14
Tue 11/25/14
Presentation 1 day Thu 12/4/14 Thu 12/4/14
Preliminary Bill of Materials 1 day Mon 12/1/14
Mon 12/1/14 1,5,12,15
Bill of Materials 2 days Sun 11/23/14
Mon 11/24/14
Top Level Design 2 days Sun 11/23/14
Mon 11/24/14
User Interface 128 days Fri 10/10/14 Tue 3/31/15
Research GUI 24 days Sat 11/1/14 Sun 11/30/14
Research Programming Options 7 days Sun 11/23/14 Sat 11/29/14
Identify Programming Language/ Library to Use 7 days Sun
11/23/14 Sat 11/29/14
Verify Language Supports Communication with USB Arduino 7 days Sun
11/23/14 Sat 11/29/14
Program/ Debug Interface 25 days Sun 2/1/15 Tue 3/3/15 Program Interface and debug code 25 days Sun 2/1/15 Tue 3/3/15 Implement and Debug Mouse Interface 22 days Sun 2/1/15 Fri 2/27/15 Implement and Debug Arduino Communication 22 days Sun 2/1/15 Fri 2/27/15
Mechanical Assembly 135 days Wed 10/1/14 Tue 3/31/15
63
Design Fret Selection Method 13 days Mon 12/1/14
Wed 12/17/14
Select Motors to Select Fret/ Press on String 13 days Mon 12/1/14 Wed 12/17/14
Determine Sensor Scheme to get Position/ Fret Being Selected 13 days Mon 12/1/14 Wed
12/17/14
Design Picking Method 13 days Mon 12/1/14
Wed 12/17/14
Select motor to pick string 12 days Sun 12/7/14 Sat 12/20/14
Select Pick Material 4 days Sun 12/14/14
Wed 12/17/14
Design Tuning Method 25 days Sun 2/1/15 Tue 3/3/15 Select Motor for Tuning 7 days Mon 2/2/15 Tue 2/10/15 Design fret board 1 day Wed 10/1/14 Wed 10/1/14 Purchase Material for Mechanical Assembly 7 days Sun 2/1/15 Mon 2/9/15 Construct and Test Mechanical Assembly 22 days Sun 2/1/15 Fri 2/27/15 System Integration 23 days Sun 3/1/15 Tue 3/31/15 21,30 Program Arduino 12 days Sun 3/8/15 Sat 3/21/15 Integrate Interface with Mechanical Assembly 6 days Sat 4/11/15 Sat 4/18/15 System Testing 22 days Wed 4/1/15 Thu 4/30/15 42 Test Integrated Assembly 12 days Mon 3/16/15 Tue 3/31/15 Refine Testing and Work Out Bugs 7 days Mon 3/16/15 Tue 3/24/15 Finalize Testing 5 days Mon 3/16/15 Fri 3/20/15
Critical Design Review 6 days Mon 2/16/15
Mon 2/23/15 45
Low Level Technical Design 5 days Mon 2/9/15 Fri 2/13/15 Update PDR 5 days Mon 2/9/15 Fri 2/13/15 Presentation 1 day Mon 2/16/15 Mon 2/16/15
Status Review 5 days Mon 4/13/15 Fri 4/17/15 49
Update CDR 5 days Mon 4/6/15 Fri 4/10/15 Presentation 1 day Mon 4/13/15 Mon 4/13/15 Project Final Report 5 days Mon 5/4/15 Fri 5/8/15 53 Update Project 5 days Mon 4/27/15 Fri 5/1/15 Editing and Finalization 5 days Mon 4/27/15 Fri 5/1/15
Final Design Presentation 1 day Mon 4/27/15
Mon 4/27/15 56
Prepare for Final Presentation 19 days Wed 4/1/15 Mon 4/27/15
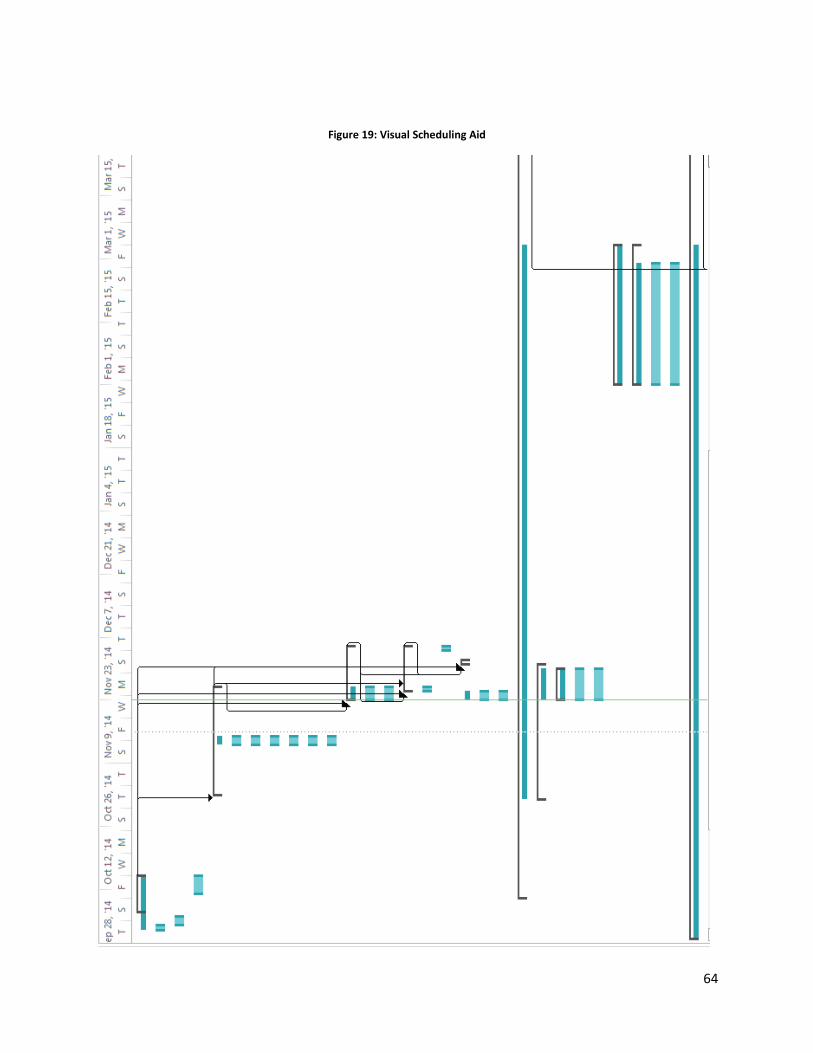
64
Figure 19: Visual Scheduling Aid