computational modeling of pancreatic cancer patients...
TRANSCRIPT

RESEARCH ARTICLE
Computational modeling of pancreatic cancer
patients receiving FOLFIRINOX and
gemcitabine-based therapies identifies
optimum intervention strategies
Kimiyo N. Yamamoto1,2,3,4, Akira Nakamura5, Lin L. LiuID1,2, Shayna Stein1,2, Angela
C. Tramontano6, Uri Kartoun7, Tetsunosuke Shimizu4, Yoshihiro Inoue4,
Mitsuhiro Asakuma4, Hiroshi Haeno8, Chung Yin Kong6, Kazuhisa Uchiyama4,
Mithat Gonen9, Chin Hur6, Franziska Michor1,2,3,10,11*
1 Department of Data Science, Dana-Farber Cancer Institute, Boston, MA, United States of America,
2 Department of Biostatistics, Harvard T.H. Chan School of Public Health, Boston, MA, United States of
America, 3 Department of Stem Cell and Regenerative Biology, Harvard University, Cambridge, MA, United
States of America, 4 Departments of General and Gastroenterological Surgery, Osaka Medical College
Hospital, Osaka, Japan, 5 Department of Radiation Oncology, Massachusetts General Hospital, Boston, MA,
United States of America, 6 Institute for Technology Assessment, Massachusetts General Hospital, Boston,
MA, United States of America, 7 Center for Systems Biology, Center for Assessment Technology &
Continuous Health (CATCH), Massachusetts General Hospital, Boston, MA, United States of America,
8 Mathematical Biology Laboratory, Department of Biology, Faculty of Sciences, Kyushu University,
Fukuoka, Japan, 9 Department of Epidemiology and Biostatistics, Memorial Sloan-Kettering Cancer Center,
New York, New York, United States of America, 10 Center for Cancer Evolution, Dana-Farber Cancer
Institute, Boston, MA, United States of America, 11 The Broad Institute of Harvard and MIT, Cambridge, MA,
United States of America
Abstract
Pancreatic ductal adenocarcinoma (PDAC) exhibits a variety of phenotypes with regard to
disease progression and treatment response. This variability complicates clinical decision-
making despite the improvement of survival due to the recent introduction of FOLFIRINOX
(FFX) and nab-paclitaxel. Questions remain as to the timing and sequence of therapies and
the role of radiotherapy for unresectable PDAC. Here we developed a computational analy-
sis platform to investigate the dynamics of growth, metastasis and treatment response to
FFX, gemcitabine (GEM), and GEM+nab-paclitaxel. Our approach was informed using data
of 1,089 patients treated at the Massachusetts General Hospital and validated using an
independent cohort from Osaka Medical College. Our framework establishes a logistic
growth pattern of PDAC and defines the Local Advancement Index (LAI), which determines
the eventual primary tumor size and predicts the number of metastases. We found that a
smaller LAI leads to a larger metastatic burden. Furthermore, our analyses ascertain that i)
radiotherapy after induction chemotherapy improves survival in cases receiving induction
FFX or with larger LAI, ii) neoadjuvant chemotherapy improves survival in cases with resect-
able PDAC, and iii) temporary cessations of chemotherapies do not impact overall survival,
which supports the feasibility of treatment holidays for patients with FFX-associated adverse
effects. Our findings inform clinical decision-making for PDAC patients and allow for the
PLOS ONE | https://doi.org/10.1371/journal.pone.0215409 April 26, 2019 1 / 19
a1111111111
a1111111111
a1111111111
a1111111111
a1111111111
OPEN ACCESS
Citation: Yamamoto KN, Nakamura A, Liu LL, Stein
S, Tramontano AC, Kartoun U, et al. (2019)
Computational modeling of pancreatic cancer
patients receiving FOLFIRINOX and gemcitabine-
based therapies identifies optimum intervention
strategies. PLoS ONE 14(4): e0215409. https://doi.
org/10.1371/journal.pone.0215409
Editor: Aamir Ahmad, University of South Alabama
Mitchell Cancer Institute, UNITED STATES
Received: January 27, 2019
Accepted: April 1, 2019
Published: April 26, 2019
Copyright: © 2019 Yamamoto et al. This is an open
access article distributed under the terms of the
Creative Commons Attribution License, which
permits unrestricted use, distribution, and
reproduction in any medium, provided the original
author and source are credited.
Data Availability Statement: All relevant data are
within the manuscript and its Supporting
Information files.
Funding: The authors received no specific funding
for this work.
Competing interests: The authors have declared
that no competing interests exist.

rational design of clinical strategies using FFX, GEM, GEM+nab-paclitaxel, neoadjuvant
chemotherapy, and radiation.
Introduction
Pancreatic ductal adenocarcinoma (PDAC) remains one of the most devastating malignancies
with a 5-year survival rate of 8% and is predicted to become the 2nd leading cause of cancer-
related death around 2020 [1, 2]. PDAC is a complex disorder composed of distinct progres-
sion patterns of local invasion and metastasis [3, 4]. A subset of patients die of complications
caused by locally advanced pancreatic cancer (LAPC), including biliary sepsis and gastrointes-
tinal obstruction (Fig 1A), while others succumb to widespread metastatic disease without pre-
senting with intensive local invasion (Fig 1B) [3–5]. Whether a patient will develop
widespread metastatic disease or local invasion is important for clinical decision-making; how-
ever, the course of disease remains difficult to predict in clinical practice [3, 4]. Hence, the
development of a novel platform that fully depicts the divergence of PDAC progression pheno-
types is needed.
Molecular determinants of the metastatic cascade in PDAC have been the topic of several
investigations [3, 4, 6], and it has been shown that a loss of SMAD4, high levels of RUNX3 in
the context of intact SMAD4, and widespread epigenetic reprogramming confer metastatic
potential [4, 7, 8]. In addition, genetic uniformity of driver mutations among primary and
metastatic samples from the same patient has been observed [6, 9]. These findings collectively
suggest that metastatic efficiency is determined by genetic and epigenetic alterations that arise
during clonal expansion.
The introduction of gemcitabine (GEM) has led to survival improvements in both meta-
static [10] and resectable disease [11]. The role of radiotherapy in unresectable disease is
debated because phase III clinical trials have demonstrated that overall survival (OS) in regi-
mens with radiotherapy is comparable to OS in regimens without radiotherapy [12]. More
recently, the chemotherapy arsenal was updated to include two more combination regimens:
FOLFIRINOX (FFX; folinic acid, fluorouracil, irinotecan, and oxaliplatin) [13] and GEM plus
nab-paclitaxel [14]. In addition to survival advantages, FFX offers a high objective response
rate [10, 13], particularly for local tumor control [15]. FFX does, however, lead to a higher inci-
dence of adverse events including low blood counts, and complications such as fever, infection,
diarrhea, weight loss, and fatigue limit the utility of FFX in elderly patient populations [13].
Due to therapeutic efficacy as well as differences in the rates of response and adverse events,
the timing and sequence of therapies needs to be optimized. In particular, the role of radiother-
apy in patients who received induction FFX, the potential impact of regimen adjustments due
to drug toxicities, the impact of switching chemotherapy (CTx) after FFX discontinuation, and
the efficacy of different treatment schedules in the adjuvant and/or neoadjuvant settings need
to be investigated. Clinical studies aimed at answering these questions are challenging and can
take years to mature.
Multiple studies have investigated tumor progression kinetics [16–23]. The paradigm of
exponential growth was established early on based on the assumption that cancer cells divide
in a completely unconstrained fashion [16]. This model represents an accurate description of
early tumor growth but fails to incorporate dynamic changes of growth rates over time, for
instance due to the increased limitation of nutrients, oxygen, and space as tumors increase in
size. Because PDAC is characterized by a prominent desmoplastic/stroma reaction [24], and
Computational modeling of pancreatic cancer informed by over 1000 patients
PLOS ONE | https://doi.org/10.1371/journal.pone.0215409 April 26, 2019 2 / 19

Fig 1. Disease progression phenotypes, clinical cohorts, and our computational framework together with the
reproducibility of disease progression pattern. (A and B) Disease progression phenotypes of (A) patients with local
progression without demonstrating features of metastases and (B) patients with widespread metastatic disease with a
primary site confined to the pancreas. (C) The MGH cohort consisting of 1,089 patients was used for (i) model selection
and parameter estimation and (ii) validation of the computational model of PDAC progression at the terminal stage. For
Computational modeling of pancreatic cancer informed by over 1000 patients
PLOS ONE | https://doi.org/10.1371/journal.pone.0215409 April 26, 2019 3 / 19

tumor volumes and growth rates are anti-correlated for both primary and metastatic tumors
in PDAC patients [4, 25], a more comprehensive class of growth models accounting for
dynamic changes of growth rates needs to be considered [21–23, 26]. The incorporation of
these aspects into a single model will also enable the description of the inter-patient phenotypic
heterogeneity of LAPC versus widespread metastatic PDAC [21–23].
Here we sought to construct a novel computational modeling platform of PDAC progres-
sion that integrates the complexity of PDAC progression phenotypes. Our approach was
parameterized using the largest-to-date clinical cohorts of PDAC patients and allows for the
evaluation of different treatment strategies using standard CTx regimens currently used to
treat PDAC patients. Specifically, we utilized time-series tumor volume data for both primary
and metastatic tumors of homogeneous treatment groups obtained from a large cohort treated
at the Massachusetts General Hospital (MGH, Fig 1C and Table 1). Our model was subse-
quently validated using an independent database from Osaka Medical College (OMC, Fig 1D
and Table 1) (S1(A) Doc). Our platform provides new insights into clinical decision-making
for PDAC.
Results
A novel computational platform of PDAC patient data identifies in vivo
growth kinetics
We first designed a stochastic mathematical model of cell growth, death, mutation accumula-
tion, and dissemination to describe PDAC progression (Fig 1E and S1(B)–S1(D) Doc). In the
model, the primary tumor consists of two cell types, one with (type-0 cells) and one without
(type-1 cells) the potential to disseminate. This modeling choice was made based on evidence
that metastatic ability can be the consequence of a single genetic or epigenetic change, such as
genetic inactivation of SMAD4, high expression levels of RUNX3, or epigenetic reprogram-
ming [4, 6–8, 25]. Type-0 cells divide and die at specified rates per time unit and may give rise
to type-1 cells with a mutation rate u per cell division event. Type-1 cells also divide and die at
given rates per time unit (Fig 1E). The stochastic model accounts for both situations in which
PDAC cells acquire the ability to metastasize very early on and situations in which this pheno-
type arises later during tumor progression, depending on when the first surviving type-1 cell
arises in the stochastic model. Furthermore, the model contains disseminated (type-2) cells
that reside within metastatic sites [4, 25] and arise from type-1 cells at rate q per time unit.
Each time a metastasis event occurs, a new metastatic colony is formed in which type-2 cells
proliferate and die according to their specified rates. After PDAC diagnosis, both the primary
tumor and metastases expand in cell number over time, eventually reaching a fatal tumor bur-
den; see S1(B)–S1(D) Doc for details.
In order to parameterize our model, we obtained longitudinal sequential computed tomog-
raphy (CT) imaging from 1,089 patients treated at the Massachusetts General Hospital (MGH)
model selection and parameter estimations, 742 tumors in 693 patients with sequential volume measurements during
homogeneous treatments were analyzed using Bayesian inference. For validations of PDAC progression at the terminal
stage, we utilized data of 369 patients who had all necessary information: (a) the final scan within two months before
death; (b) the date of death; and (c) type and duration of CTx. The OMC cohort consisting of 73 patients who had all
necessary information of (a)–(c) was used for validation of PDAC progression at the terminal stage. (E) Designed
probabilistic model considering the situation in which the growth rates of tumor cells in the primary and metastatic sites
decrease with increasing tumor size to reach a maximum volume (termed Local or Metastatic Advancement Index
depending on whether the tumor is primary or metastatic). (F) Comparison of distribution of the number of metastatic
cells at death from a rapid autopsy program of PDAC in a literature [4, 25] and three growth models: logistic, linear, and
exponential models. Number of simulations at each growth model was 100 per each; and simulations were performed in
quadruplicate. Mean and standard error for simulation results are indicated. See S1(E) Doc for details.
https://doi.org/10.1371/journal.pone.0215409.g001
Computational modeling of pancreatic cancer informed by over 1000 patients
PLOS ONE | https://doi.org/10.1371/journal.pone.0215409 April 26, 2019 4 / 19
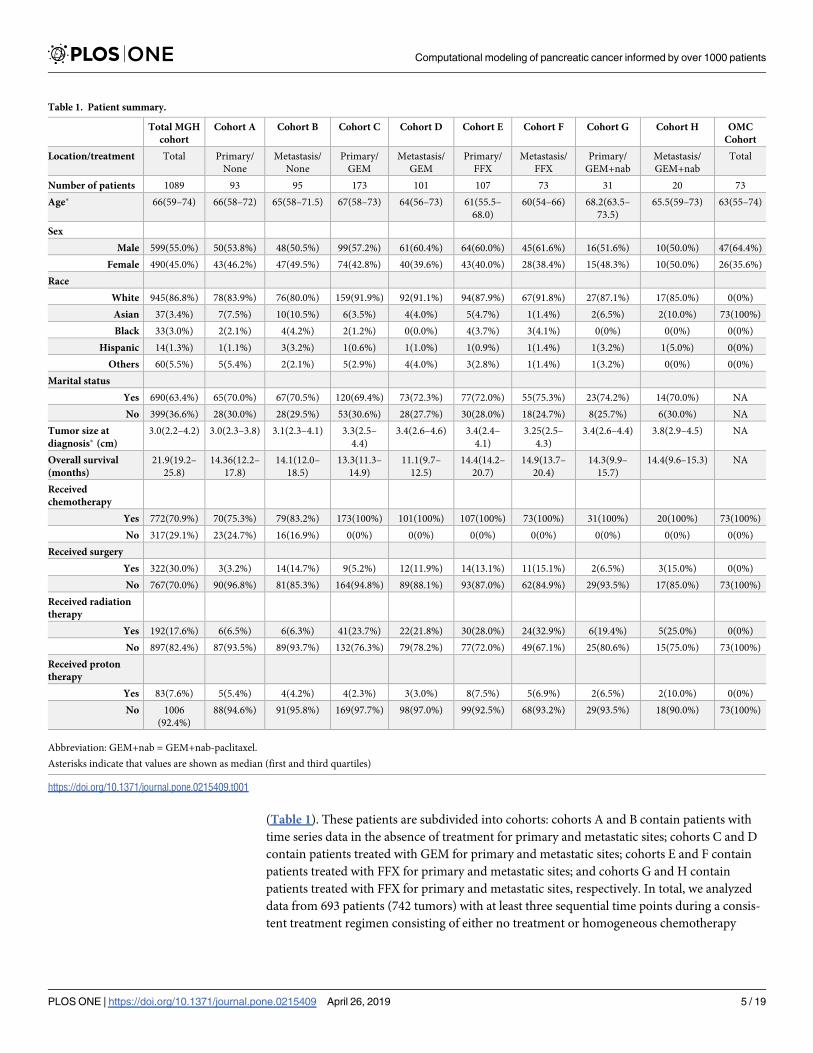
(Table 1). These patients are subdivided into cohorts: cohorts A and B contain patients with
time series data in the absence of treatment for primary and metastatic sites; cohorts C and D
contain patients treated with GEM for primary and metastatic sites; cohorts E and F contain
patients treated with FFX for primary and metastatic sites; and cohorts G and H contain
patients treated with FFX for primary and metastatic sites, respectively. In total, we analyzed
data from 693 patients (742 tumors) with at least three sequential time points during a consis-
tent treatment regimen consisting of either no treatment or homogeneous chemotherapy
Table 1. Patient summary.
Total MGH
cohort
Cohort A Cohort B Cohort C Cohort D Cohort E Cohort F Cohort G Cohort H OMC
Cohort
Location/treatment Total Primary/
None
Metastasis/
None
Primary/
GEM
Metastasis/
GEM
Primary/
FFX
Metastasis/
FFX
Primary/
GEM+nab
Metastasis/
GEM+nab
Total
Number of patients 1089 93 95 173 101 107 73 31 20 73
Age� 66(59–74) 66(58–72) 65(58–71.5) 67(58–73) 64(56–73) 61(55.5–
68.0)
60(54–66) 68.2(63.5–
73.5)
65.5(59–73) 63(55–74)
Sex
Male 599(55.0%) 50(53.8%) 48(50.5%) 99(57.2%) 61(60.4%) 64(60.0%) 45(61.6%) 16(51.6%) 10(50.0%) 47(64.4%)
Female 490(45.0%) 43(46.2%) 47(49.5%) 74(42.8%) 40(39.6%) 43(40.0%) 28(38.4%) 15(48.3%) 10(50.0%) 26(35.6%)
Race
White 945(86.8%) 78(83.9%) 76(80.0%) 159(91.9%) 92(91.1%) 94(87.9%) 67(91.8%) 27(87.1%) 17(85.0%) 0(0%)
Asian 37(3.4%) 7(7.5%) 10(10.5%) 6(3.5%) 4(4.0%) 5(4.7%) 1(1.4%) 2(6.5%) 2(10.0%) 73(100%)
Black 33(3.0%) 2(2.1%) 4(4.2%) 2(1.2%) 0(0.0%) 4(3.7%) 3(4.1%) 0(0%) 0(0%) 0(0%)
Hispanic 14(1.3%) 1(1.1%) 3(3.2%) 1(0.6%) 1(1.0%) 1(0.9%) 1(1.4%) 1(3.2%) 1(5.0%) 0(0%)
Others 60(5.5%) 5(5.4%) 2(2.1%) 5(2.9%) 4(4.0%) 3(2.8%) 1(1.4%) 1(3.2%) 0(0%) 0(0%)
Marital status
Yes 690(63.4%) 65(70.0%) 67(70.5%) 120(69.4%) 73(72.3%) 77(72.0%) 55(75.3%) 23(74.2%) 14(70.0%) NA
No 399(36.6%) 28(30.0%) 28(29.5%) 53(30.6%) 28(27.7%) 30(28.0%) 18(24.7%) 8(25.7%) 6(30.0%) NA
Tumor size at
diagnosis� (cm)
3.0(2.2–4.2) 3.0(2.3–3.8) 3.1(2.3–4.1) 3.3(2.5–
4.4)
3.4(2.6–4.6) 3.4(2.4–
4.1)
3.25(2.5–
4.3)
3.4(2.6–4.4) 3.8(2.9–4.5) NA
Overall survival
(months)
21.9(19.2–
25.8)
14.36(12.2–
17.8)
14.1(12.0–
18.5)
13.3(11.3–
14.9)
11.1(9.7–
12.5)
14.4(14.2–
20.7)
14.9(13.7–
20.4)
14.3(9.9–
15.7)
14.4(9.6–15.3) NA
Received
chemotherapy
Yes 772(70.9%) 70(75.3%) 79(83.2%) 173(100%) 101(100%) 107(100%) 73(100%) 31(100%) 20(100%) 73(100%)
No 317(29.1%) 23(24.7%) 16(16.9%) 0(0%) 0(0%) 0(0%) 0(0%) 0(0%) 0(0%) 0(0%)
Received surgery
Yes 322(30.0%) 3(3.2%) 14(14.7%) 9(5.2%) 12(11.9%) 14(13.1%) 11(15.1%) 2(6.5%) 3(15.0%) 0(0%)
No 767(70.0%) 90(96.8%) 81(85.3%) 164(94.8%) 89(88.1%) 93(87.0%) 62(84.9%) 29(93.5%) 17(85.0%) 73(100%)
Received radiation
therapy
Yes 192(17.6%) 6(6.5%) 6(6.3%) 41(23.7%) 22(21.8%) 30(28.0%) 24(32.9%) 6(19.4%) 5(25.0%) 0(0%)
No 897(82.4%) 87(93.5%) 89(93.7%) 132(76.3%) 79(78.2%) 77(72.0%) 49(67.1%) 25(80.6%) 15(75.0%) 73(100%)
Received proton
therapy
Yes 83(7.6%) 5(5.4%) 4(4.2%) 4(2.3%) 3(3.0%) 8(7.5%) 5(6.9%) 2(6.5%) 2(10.0%) 0(0%)
No 1006
(92.4%)
88(94.6%) 91(95.8%) 169(97.7%) 98(97.0%) 99(92.5%) 68(93.2%) 29(93.5%) 18(90.0%) 73(100%)
Abbreviation: GEM+nab = GEM+nab-paclitaxel.
Asterisks indicate that values are shown as median (first and third quartiles)
https://doi.org/10.1371/journal.pone.0215409.t001
Computational modeling of pancreatic cancer informed by over 1000 patients
PLOS ONE | https://doi.org/10.1371/journal.pone.0215409 April 26, 2019 5 / 19

regimens (Fig 1C(i)); the remaining 396 patients were excluded because they did not have suf-
ficient sequential data.
We first utilized time series tumor volume data in the absence of treatment to determine
the growth kinetics of PDAC. To this end, we compared the goodness-of-fit of various growth
models (Eqs (1)–(3) in Materials and Methods). In the exponential model (Eq 1), tumor cells
divide in a completely unconstrained fashion with a constant growth rate [25]. In the logistic
model (Eq 2), tumor cells divide at a rate that decreases with increasing tumor size such that
the number of cells is given by an increasing curve that converges on a maximum size (S1 Fig).
The maximum capacity of the primary site is defined as the Local Advancement Index (LAI),
and that of a metastatic site as the Metastatic Advancement Index (MAI); both indices are
measured in cm3. In the linear model (Eq 3), the tumor cell number increases linearly with
time. To account for inter-patient variability, we considered both fixed and random effects of
growth rates and LAI/MAI for both primary and metastatic sites for each patient. When using
the Akaike Information Criterion (AIC) to assess model fits, we found that the logistic model
provided the best fit to the data (S1 Table and S1 Data). However, since exponential and logis-
tic models lead to similar predictions for early phases of tumor progression, we utilized an
additional criterion to evaluate the predictive accuracies of the individual growth models
based on the growth patterns at the final stages of tumor growth (Fig 1F). When investigating
the extent of metastatic burden at death using logistic, linear, and exponential growth assump-
tions in the stochastic model, we found that the logistic model was able to recapitulate the met-
astatic burden at death observed previously using data obtained within a PDAC rapid autopsy
program [4, 25]. The exponential and linear models led to worse predictions (p = 0.608,
<0.001, and<0.001 for simulations with logistic, linear, and exponential models, respectively,
Mann-Whitney test, Fig 1F). Thus, we chose the logistic growth model for describing PDAC
growth and progression patterns.
Based on the logistic stochastic model, we then estimated primary and metastatic growth
rates as well as LAI/MAI (i) in the absence of treatment, (ii) during GEM, (iii) during FFX,
and (iv) during GEM+nab-paclitaxel treatment (S2 and S3 Datas). Growth rates during CTx
and in the absence of treatment were estimated using corresponding sequential volume mea-
surement data. Median and first and third quartiles of the estimates (in units of 1/month) are
shown in S2 Table. We found that growth rates for both primary sites and metastases during
FFX were significantly smaller than those during GEM-based therapies or in the absence of
treatment (p-values in S2 Table). We also investigated the sensitivity of estimations to changes
in prior distributions to examine the influence of the choice of prior on the posterior distribu-
tions, and found robustness of the posterior estimates when using priors on all other parame-
ters (S3 Data and S1(F) Doc).
Patients with a smaller LAI have a larger number of metastases
We next hypothesized that disease progression phenotypes in PDAC, such as local invasive-
ness or widespread metastasis, are correlated with a patient’s LAI. Primary tumors with a large
LAI sustain a large population of cells, resulting in locally progressive disease. Patients with a
small LAI contain a smaller population of cells in the primary site, thereby potentially leading
to widespread metastatic disease. We found that both the number of metastatic sites and the
number of cells at the largest metastatic site increased after diagnosis in simulated patients
with a smaller LAI, defined as less than 5×10⁹ cells, as compared to other patients (Fig 2A and
2B); these findings were confirmed using patient data (Fig 2A and 2B). Moreover, simulated
patients with a small LAI presented with a large metastatic burden both at diagnosis and the
final scan (polyserial correlation coefficients in the legend, Fig 2C and 2D); again, these
Computational modeling of pancreatic cancer informed by over 1000 patients
PLOS ONE | https://doi.org/10.1371/journal.pone.0215409 April 26, 2019 6 / 19
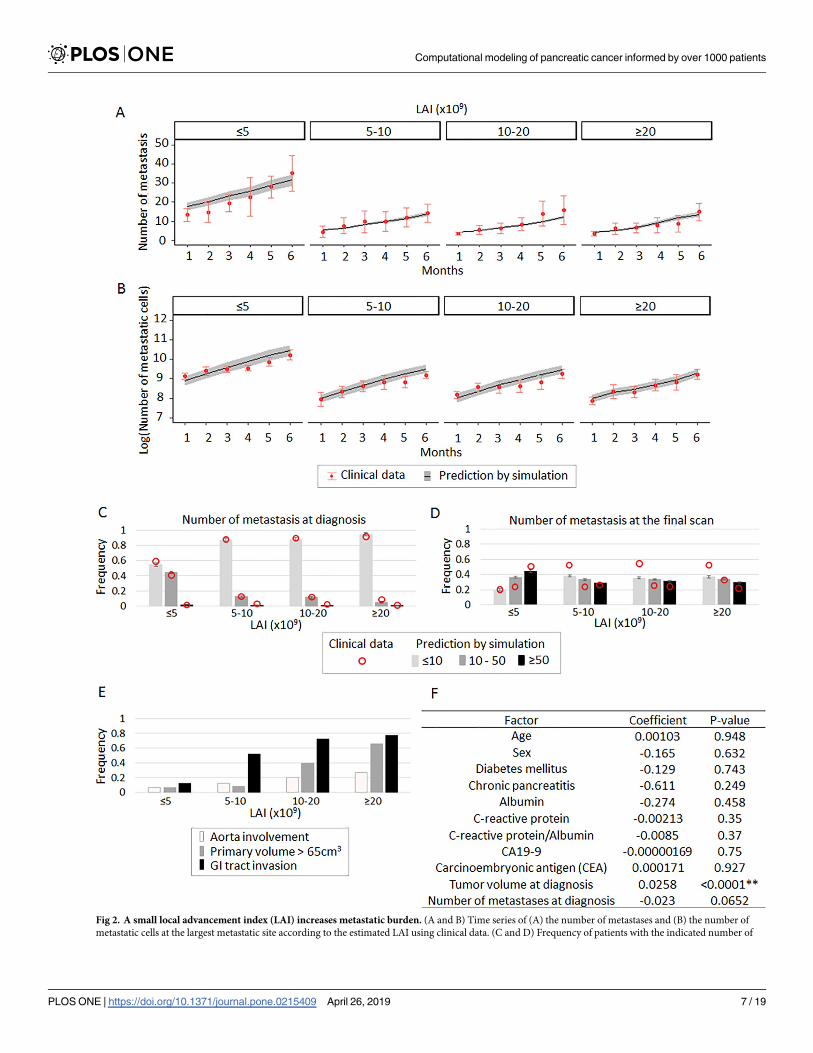
Fig 2. A small local advancement index (LAI) increases metastatic burden. (A and B) Time series of (A) the number of metastases and (B) the number of
metastatic cells at the largest metastatic site according to the estimated LAI using clinical data. (C and D) Frequency of patients with the indicated number of
Computational modeling of pancreatic cancer informed by over 1000 patients
PLOS ONE | https://doi.org/10.1371/journal.pone.0215409 April 26, 2019 7 / 19

findings were confirmed using patient data (Fig 2C and 2D). Note that the model was origi-
nally parameterized using longitudinal imaging data of primary and metastatic sites but con-
firmed using different aspects of the data, such as the numbers of metastases at diagnosis or
death.
Patients from the MGH database with a large LAI suffered from significantly more compli-
cations by local invasion (tumor volume over 65cm3, aorta involvement, and gastrointestinal
invasion) than other patients (polyserial correlation coefficients in the legend, Fig 2E). When
investigating the relationship between LAI and various clinicopathological factors in the MGH
cohort, we observed a correlation between estimated LAI and tumor volume at diagnosis and
a weak correlation between LAI and the number of metastases at diagnosis (Fig 2F). In sum,
our parameterized computational framework was able to accurately capture the relationship
between the size of LAI and metastatic progression.
The effect of CTx on PDAC progression phenotypes
We then sought to investigate the effects of different treatment types and durations on tumor
characteristics and patient outcomes. For simulated cases with unresectable PDAC who
received more than 3 months of FFX, we observed smaller sizes of the primary tumors at the
final scan as compared to those receiving fewer than 3 months (median 9.90 and 9.35 for�3
and>3 months, respectively, p<0.0001, Fig 3A). In contrast, the duration of GEM did not
affect the primary tumor sizes in our simulations (median 9.92 and 9.89 for�3 and>3
months, respectively, p = 0.928, Fig 3C), as expected from the large estimated growth rates
during GEM treatment. Meanwhile, among simulated cases with resections of their primary
tumors, we observed two peaks in the distribution of the primary tumor sizes at the final scan
(Fig 3A and 3C); the right peak represents disease recurrence from residual tumor cells in the
primary site, while the left peak represents post-surgical tumor remnants confined to the pan-
creas (Fig 3A and 3C). In both simulated FFX and GEM regimens, the numbers of metastases
were predicted to be smaller in cases with resection of the primary site as compared to unre-
sectable cases (p = 0.040 and 0.0185 in FFX and GEM, respectively, Fig 3B and 3D). These
model predictions were again confirmed using clinical cohorts from MGH (Fig 1C(ii)). Fur-
thermore, they were validated in an independent patient cohort obtained from OMC (Fig
1D). Overall, we found that model predictions were accurate for the local and distant tumor
burden at the final scan (Fig 3A–3D). The stochastic modeling platform also correctly predicts
survival as confirmed using patient data from the MGH cohort (S2 Fig).
In this study, untreated patients include patients who have not yet initiated treatment, who
are in terminal stages, and for whom no information was available regarding prior treatment.
Thus, this patient group might represent a heterogeneous cohort. To investigate the effects of
differing growth rates among patients in such a heterogeneous cohort, we performed sensitiv-
ity analyses by assuming that drugs may reversibly modify growth rates at the time of treat-
ment discontinuation. We found that differences in the level that growth rates recover to post
metastatic sites (C) at diagnosis and (D) at the final scan according to the estimated LAI using clinical data. Numbers of patients were 16, 26, 25, and 26 for
patients with LAI<5×10⁹, 5×10⁹�LAI< 10×109, 10×109�LAI<20×109, 20×109�LAI, respectively, in clinical data; number of simulation cases was 100 per
each in panels (A)–(D), performed in quadruplicate. Mean and standard error are indicated for both clinical data and simulation results in panels (A)–(D).
Polyserial correlation coefficients between LAI and the number of metastases of�10, 10–50, or�50 were 0.931, -0.927, or -0.999, respectively in (C); and 0.810,
-0.764, -0.816, respectively in (D). (E) Frequency of patients with indicated complications induced by local progression at the final scan according to the
estimated LAI using clinical data. Polyserial correlation coefficients between LAI and each of aorta involvement, primary tumor> 65 cm3, and GI tact
invasion, were 0.999, 0.984, and 0.999, respectively. (F) Univariate analysis to test the statistical significance of patients’ clinicopathological factors on LAI.
Parameter values were u = 6.31×10⁻⁵, q = 6.31×10⁻⁷, r0 and r1 = 0.28, r2 = 1.16, death rate of each type = 0.01×growth rate,Mdiag = 109.47. MAI for primary and
metastatic sites are based on the estimated distributions (S2 Data).
https://doi.org/10.1371/journal.pone.0215409.g002
Computational modeling of pancreatic cancer informed by over 1000 patients
PLOS ONE | https://doi.org/10.1371/journal.pone.0215409 April 26, 2019 8 / 19

Fig 3. Predictions of the computational framework are validated using clinical data. Frequency of cases with (A) the number of primary cells on a
logarithmic scale with base 10 and (B) the number of metastatic sites at the final scan in unresectable patients who received FFX for less than three months,
unresectable patients who received FFX for three or more than three months, and patients after surgical resection of their primary site. (C and D) The
quantities described above in patients who received GEM are shown in the same order. The number of simulation cases was the same as number of patient at
each MGH cohort in each category described in Fig 1C(ii), i.e, 51, 48, and 24 for FFX; and 53, 158, and 35 for GEM, in cases with CTx<3 months, CTx>3
months, and with resection, respectively; and simulations in any categories were performed in quadruplicate. Mean and standard error for simulation results
are indicated. Parameter values used for the panels were u = 6.31×10⁻⁵, q = 6.31×10⁻⁷, r0 and r1 = 0.28, r2 = 1.16, death rate of each type = 1/100×growth rate,
Computational modeling of pancreatic cancer informed by over 1000 patients
PLOS ONE | https://doi.org/10.1371/journal.pone.0215409 April 26, 2019 9 / 19

treatment discontinuation, and the speed at which this reversal occurs, do not affect the results
(S5 Fig). These findings support the robustness and generalizability of our computational
framework.
Optimum treatment strategies for PDAC patients
To evaluate the effects of different treatment strategies on survival, we designed in silico clinical
trials of different scenarios using our validated computational modeling platform (Fig 4 and
S1(G) Doc). First, we investigated whether the use of chemoradiation (CRTx) is effective for
the treatment of LAPC [3]. Simulated LAPC cases were stratified into two arms: (i) three
months of CTx followed by radiation (RTx) and three months of adjuvant CTx, and (ii) six
months of CTx (Fig 4A). Interestingly, although the administration of CRTx after induction
with GEM or GEM+nab-paclitaxel did not improve survival, the use of FFX did (Fig 4B). Fur-
thermore, subgroup analyses showed that simulated cases with a larger than median LAI had a
significantly better prognosis when adding CRTx compared to CTx (S3 Fig; p-values are
0.0547, 0.0429, and 0.0379 for FFX, GEM, and GEM+nab-paclitaxel, respectively), whereas
simulated cases with a lower LAI had comparable OS when adding CRTx compared to CTx
(S3 Fig; p-values 0.117, 0.809, and 0.466 for FFX, GEM, and GEM+nab-paclitaxel, respec-
tively). These results indicate a significant role of LAI for identifying cases who will benefit
from CRTx–those with a larger than median LAI.
We next investigated, again using in silico clinical trials, whether neoadjuvant CTx
improves outcomes when added to the current standard of care of adjuvant protocols (Fig 4C)
[27]. Simulated resectable cases were stratified into two arms: (i) four months of neoadjuvant
CTx followed by resection and six months of adjuvant CTx and (ii) six months of CTx follow-
ing resection (Fig 4C). We observed improved OS in simulated cases receiving the former
compared with those receiving the latter for both GEM-based and FFX settings (Fig 4D;
p<0.001 for any drug between regimens 3 and 4).
Finally, we investigated the effects of temporary cessations and switching CTx after FFX
discontinuation. After PDAC diagnosis, simulated cases were randomized into four arms: (i)
no CTx (regimen 5); (ii) four months CTx and two months cessation (regimen 6); (iii) four
months CTx (regimen 7); (iv) six months CTx (regimen 8); and (v) four months CTx and two
months cessation while treating with a different drug (regimen 9) (Fig 4E). The time period of
two months for a drug holiday was chosen in order to ensure that sufficient time is provided
for the drugs to be cleared from a patient’s body; clearance rates for each drug in the FFX regi-
men are 15 minutes, 8.8 hours, 14.1 minutes, and 7 hours, respectively [28–31], while the
reported mean recovery time for FFX adverse effects is 11.5 days [32]. Based on this data we
chose a two months drug holiday as a representative example for our in silico clinical trials.
When analyzing the simulated data, we found that the impact of CTx on OS was larger in
simulated cases receiving FFX than GEM or GEM+nab-paclitaxel therapy (Fig 4F and S3
Table). Furthermore, a longer duration of CTx improved predicted OS in simulated cases
receiving FFX or GEM-based therapies (Fig 4F and S3 Table) (p-values in S3 Table). Interest-
ingly, simulated temporary cessations did not lead to significantly different OS compared to
regimens without cessations, but with the same total treatment duration (Fig 4F and S3
Table). Moreover, OS of simulated cases receiving FFX and GEM-based therapies in the sec-
ond-line setting after FFX failure were not statistically significantly different (p-values in S3
Mdiag = 10N(9.47,0.29), andMdeath = 1010.6. LAI/MAI and growth rates during CTx for primary and metastatic sites are based on the estimated distributions (S2
Data), CTx duration = 1.5 and 6 months that correspond to median CTx duration in the clinical cohort in groups that received CTx with (i) less than three
months and (ii) three or more than three months, respectively, and ε was randomly chosen from [10−5, 10−1].
https://doi.org/10.1371/journal.pone.0215409.g003
Computational modeling of pancreatic cancer informed by over 1000 patients
PLOS ONE | https://doi.org/10.1371/journal.pone.0215409 April 26, 2019 10 / 19

Fig 4. Prediction of optimum treatment schedules for PDAC. (A) Description of CRTx schedules in cases with LAPC. (B) Assessment of
survival duration of regimens 1 and 2 in each drug. P-values by log-rank test were p = 0.008, 0.236, and 0.253 for FFX, GEM, and GEM+nab-
paclitaxel, respectively. Subgroup analyses were shown in S3 Fig. (C) Description of neoadjuvant and/or adjuvant CTx schedules in cases
with resectable disease. (D) Assessment of survival duration of regimens 3 and 4. P-values between regimen 3 and 4 were p<0.001 for any
drugs. (E) Description of CTx schedules for cases with unresectable disease. (F) Assessment of survival duration of regimens with FFX, GEM,
Computational modeling of pancreatic cancer informed by over 1000 patients
PLOS ONE | https://doi.org/10.1371/journal.pone.0215409 April 26, 2019 11 / 19
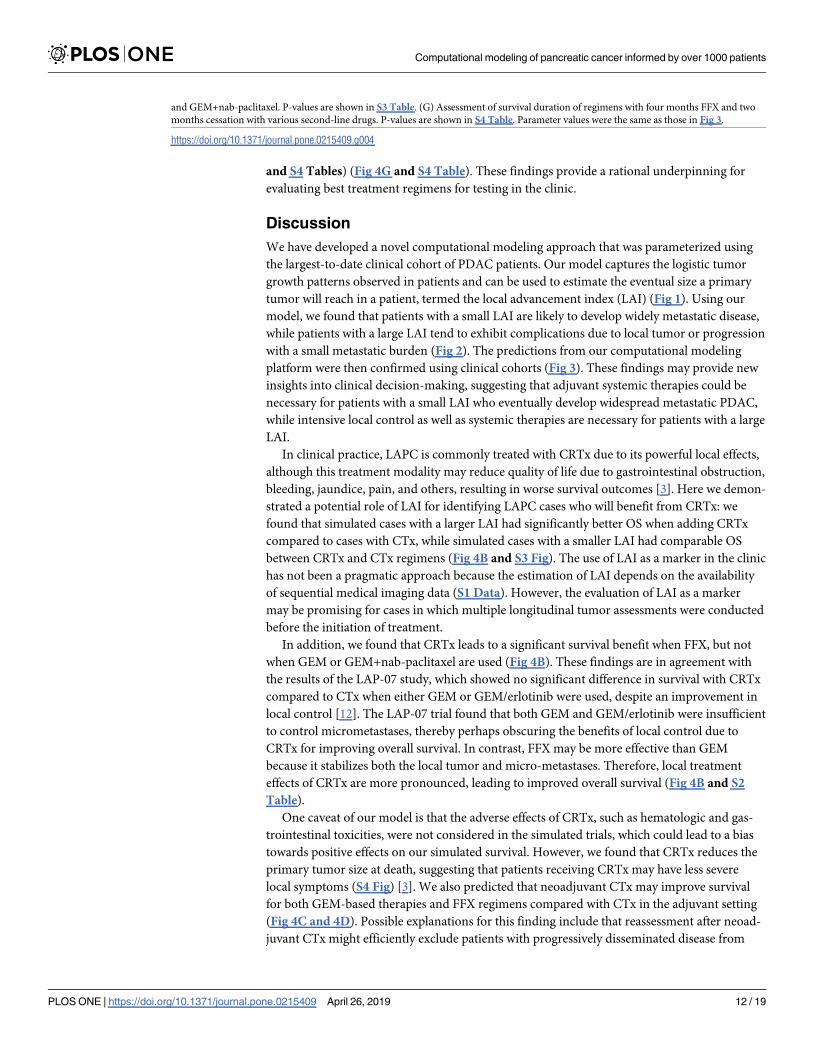
and S4 Tables) (Fig 4G and S4 Table). These findings provide a rational underpinning for
evaluating best treatment regimens for testing in the clinic.
Discussion
We have developed a novel computational modeling approach that was parameterized using
the largest-to-date clinical cohort of PDAC patients. Our model captures the logistic tumor
growth patterns observed in patients and can be used to estimate the eventual size a primary
tumor will reach in a patient, termed the local advancement index (LAI) (Fig 1). Using our
model, we found that patients with a small LAI are likely to develop widely metastatic disease,
while patients with a large LAI tend to exhibit complications due to local tumor or progression
with a small metastatic burden (Fig 2). The predictions from our computational modeling
platform were then confirmed using clinical cohorts (Fig 3). These findings may provide new
insights into clinical decision-making, suggesting that adjuvant systemic therapies could be
necessary for patients with a small LAI who eventually develop widespread metastatic PDAC,
while intensive local control as well as systemic therapies are necessary for patients with a large
LAI.
In clinical practice, LAPC is commonly treated with CRTx due to its powerful local effects,
although this treatment modality may reduce quality of life due to gastrointestinal obstruction,
bleeding, jaundice, pain, and others, resulting in worse survival outcomes [3]. Here we demon-
strated a potential role of LAI for identifying LAPC cases who will benefit from CRTx: we
found that simulated cases with a larger LAI had significantly better OS when adding CRTx
compared to cases with CTx, while simulated cases with a smaller LAI had comparable OS
between CRTx and CTx regimens (Fig 4B and S3 Fig). The use of LAI as a marker in the clinic
has not been a pragmatic approach because the estimation of LAI depends on the availability
of sequential medical imaging data (S1 Data). However, the evaluation of LAI as a marker
may be promising for cases in which multiple longitudinal tumor assessments were conducted
before the initiation of treatment.
In addition, we found that CRTx leads to a significant survival benefit when FFX, but not
when GEM or GEM+nab-paclitaxel are used (Fig 4B). These findings are in agreement with
the results of the LAP-07 study, which showed no significant difference in survival with CRTx
compared to CTx when either GEM or GEM/erlotinib were used, despite an improvement in
local control [12]. The LAP-07 trial found that both GEM and GEM/erlotinib were insufficient
to control micrometastases, thereby perhaps obscuring the benefits of local control due to
CRTx for improving overall survival. In contrast, FFX may be more effective than GEM
because it stabilizes both the local tumor and micro-metastases. Therefore, local treatment
effects of CRTx are more pronounced, leading to improved overall survival (Fig 4B and S2
Table).
One caveat of our model is that the adverse effects of CRTx, such as hematologic and gas-
trointestinal toxicities, were not considered in the simulated trials, which could lead to a bias
towards positive effects on our simulated survival. However, we found that CRTx reduces the
primary tumor size at death, suggesting that patients receiving CRTx may have less severe
local symptoms (S4 Fig) [3]. We also predicted that neoadjuvant CTx may improve survival
for both GEM-based therapies and FFX regimens compared with CTx in the adjuvant setting
(Fig 4C and 4D). Possible explanations for this finding include that reassessment after neoad-
juvant CTx might efficiently exclude patients with progressively disseminated disease from
and GEM+nab-paclitaxel. P-values are shown in S3 Table. (G) Assessment of survival duration of regimens with four months FFX and two
months cessation with various second-line drugs. P-values are shown in S4 Table. Parameter values were the same as those in Fig 3.
https://doi.org/10.1371/journal.pone.0215409.g004
Computational modeling of pancreatic cancer informed by over 1000 patients
PLOS ONE | https://doi.org/10.1371/journal.pone.0215409 April 26, 2019 12 / 19

undergoing surgery and that neoadjuvant CTx, although not curative, systemically reduces the
number of metastatic cells before surgery, which otherwise might have expanded aggressively
postoperatively [27]. Furthermore, a higher incidence of adverse events for FFX renders some
patients in need of treatment discontinuation. Our analyses predict that temporary cessations
of FFX do not negatively impact OS (Fig 4F and S3 Table), and that switching FFX to GEM-
based therapies after FFX discontinuation does not negatively impact OS either (Fig 4G and
S4 Table). Together, regimens with temporary cessations until patients recover to an accept-
able performance status and regimens with GEM-based therapy as the second-line setting rep-
resent reasonable options.
Our validated computational modeling framework addresses another important issue: in
the clinic, the same patient cannot be stratified into different treatment arms in a trial. It is
thus impossible to know what the counterfactual outcome of a different treatment would have
been in the same patient. Our in silico clinical trials tackle this important issue since each case
can receive both standard and experimental arms, which enables us to evaluate the outcomes
of several experimental regimens for exactly the same case. Our approach also has potential
implications for the rational design of novel clinical strategies for patients with other cancer
types for which similar data can be obtained.
Materials and methods
Clinical cohorts
We analyzed a total of 1,089 patients (599 men, 490 women) who were treated for PDAC at
Massachusetts General Hospital (MGH) between October 2002 and September 2015
(Table 1). A validation cohort contained information on 73 PDAC patients (47 men, 26
women) with surgically unresectable disease who were treated between April 2008 and March
2016 at Osaka Medical College (OMC) in Japan (Table 1). This clinical dataset is unique in
that longitudinal imaging data without any treatment can hardly ever be obtained in PDAC
because most patients receive treatment soon after diagnosis. Data collection and analysis were
approved by the Ethics Committees for Clinical Investigation of both MGH and OMC. Meth-
ods were carried out in accordance with the approved guidelines. S1(A) Doc provides more
details.
Computational modeling of PDAC progression
We designed a computational model of PDAC progression using a three-cell type logistic
branching process starting from a single cell in the primary site. This cell gives rise to a clone
of cells, so-called type-0 cells, that proliferate and die at specified rates. During each type-0 cell
division, an alteration may arise at rate u that enables the cell, now called type-1 cell, to leave
the primary site and establish a metastatic colony elsewhere; at that point a cell is called a type-
2 cell. This modeling assumption is based on the findings that metastatic efficiency is deter-
mined by (epi)genetic alterations that arise during the clonal expansion of PDAC [4, 6–8] (Fig
1E and S1 Fig). In the model, the growth rate of each cell type decreases with increasing tumor
size such that the number of cells is given by an increasing curve that converges on a maximal
size, defined as local advancement index (LAI) for the primary and metastatic advancement
index (MAI) for a metastatic site. The growth rates and LAI/MAI were estimated using the
logistic model described in S1(B) Doc. The death rates of each cell type are assumed to be
fixed as death rates = growth rate/100. One of the defining features of PDAC is the presence of
extensive fibrosis. The desmoplastic stroma consists of proliferating fibroblasts and pancreatic
stellate cells, inflammatory cells, nerve fibers, and marrow derived stem cells [33]. In this
study, we assumed that the primary tumor consists of 80% stromal cells present [33]. We
Computational modeling of pancreatic cancer informed by over 1000 patients
PLOS ONE | https://doi.org/10.1371/journal.pone.0215409 April 26, 2019 13 / 19

converted the tumor volume to cell numbers with the assumption of a spherical shape (109
cells occupy a volume of 1 cm3) [25]. See S1(B) and S1(C) Doc for details.
Computer simulations before and after diagnosis
We performed in silico trials of the stochastic process based on our mathematical modeling.
Once a tumor has been diagnosed, we implemented clinical practice based on the guidelines of
PDAC treatment provided by the National Comprehensive Cancer Network (NCCN) in the
United States in the context of the computational framework [34]. If no metastases are
detected at diagnosis, a case is regarded as non-metastatic disease and the patient becomes the
candidates for either surgery or CRTx. If any metastases are detected, a patient receives CTx
without surgical resection nor RTx.
• Resection: to remove a fraction (1-ε) (0�ε� 1) of the primary tumor so that the remnant
tumor volume becomes ε of the primary tumor. The parameter ε is randomly chosen from
[10−5, 10−1].
• CTx: The growth rates of cells during CTx (GEM or FFX) were estimated by the correspond-
ing clinical data of patients during treatment with these drugs. Specifically, we utilized three
or more time points of sequential volume measurements in primary and metastatic sites dur-
ing each treatment. We fitted a logistic model, which was selected as the best model. We con-
firmed a good fit to clinical data in each cohort and then estimated growth rates during each
CTx (S1 and S2 Datas). In this study, we assumed that drugs reversibly modify growth rates
at the time of treatment discontinuation.
• RTx: The conventional long course 3D-CRT has been assumed. The effect of conventionally
fractioned RTx was determined by using the Linear-Quadratic model [35]. In this frame-
work, the surviving fraction of radiated cells is given by e-(ωD+ξD2), where ω and ξ are con-
stants and D is the dose. We consider ω = 10ξ, which is a well-accepted quantity for cancer
cells [36], that RTx with a total dose of 54 Gy was delivered in 30 fractions, and D is 1.8 Gy.
For more details of treatment effects by CTx, RTx, and surgery, see S1(D) Doc.
Computational studies for optimum treatment
To evaluate the effects of different treatment strategies on PDAC patients, we designed in silicocomputational clinical trials. We explored three scenarios: (i) CRTx to cases with LAPC (Fig
4A); (ii) neoadjuvant CTx followed by standard adjuvant care (Fig 4C); and (iii) administra-
tion of CTx at different timing in unresectable patients (Fig 4E). Note that all cases are virtual
but not real clinical patients from MGH/OMC. Simulations are conducted based on each of
trial designs in Fig 4 so that we can mimic clinical trials in computers. Their parameters are
determined according to distributions which have been informed by the clinical cases from
MGH. In these scenarios, cases were randomized into different treatment groups after diagno-
sis, and simulations were performed until death in each case. See S1(F) Doc for sample size
estimation.
Model fitting and statistical analysis
We fit mixed effects models (exponential, logistic and linear models) to each individual
patient’s data on both primary and metastatic sites. The exponential model is given by
Volume ¼ eðbþbiÞ � eðbrþbriÞ � DATEi;j ð1Þ
Computational modeling of pancreatic cancer informed by over 1000 patients
PLOS ONE | https://doi.org/10.1371/journal.pone.0215409 April 26, 2019 14 / 19
where β and bi are fixed and random effects of intercept for patient i, βr and bri are fixed and
random effects of growth rates, and DATEi,j is the time period (month) at j-th measurement
occasion from the first measurement, respectively. The logistic model is given by
Volume ¼bCarry þ bCarryi
1þ B� e� 1
brþbri�DATEi;j
ð2Þ
where βCarry and bCarry_i are fixed and random effects of LAI/MAI, and βr and bri are fixed and
random effects of growth rates, respectively. Only fixed effects were considered for parameter
B in the fitting because of identifiability issues. For parameter estimations of LAI/MAI and
growth rates for primary and metastases, we performed Bayesian inference with Markov chain
Monte Carlo methods (MCMC) sampling using stan (S1(I) Doc) [37]. Prior distributions
were obtained from N(0.16, 0.14) and N(0.58, 2.72) for primary and metastatic sites, respec-
tively, based on a previous study [25]. Prior distributions for LAI and B were LN(0, 10) and LN(0, 10), respectively. The linear model is given by
Volume ¼ ðaþ aiÞ � DATEi;j þ ðbþ biÞ ð3Þ
See statistical analyses in S1(F) Doc for more details.
S1(H) Doc contains supplementary discussion.
Supporting information
S1 Data. Growth rates, LAI/MAI for primary and metastatic sites. The estimated growth
rates and LAI/MAI values for both primary and metastatic sites for each patient are provided.
(XLSX)
S2 Data. Estimated growth curve and its comparison with clinical data. The estimated
growth curves with the logistic model (solid line) and the exponential model (dotted line) for
each patient are shown and the tumor sizes at the timing of each medical examination in the
clinical data are also plotted as red square.
(PDF)
S3 Data. Estimated parameters for a mixed effects logistic model. (i)-(iv) Assessments of
growth rates, LAI and B by Bayesian estimation using volume measurements of primary
tumors in different treatment regimens. (v)-(viii) Assessments of growth rates, MAI, and B by
Bayesian estimation using volume measurements of metastatic tumors in different treatment
regimens.
(DOCX)
S1 Doc. Supplementary description. The descriptions include an explanation or discussion
regarding (a) Clinical cohorts, (b) Computational modeling of PDAC progression, (c) Com-
puter simulations before diagnosis, (d) Computer simulations after diagnosis, (e) Three-step
branching process with different growth models, (f) Statistical analysis, (g) Computational
studies for optimal treatment, (h) Supplementary discussion, (i) Stan code for Bayesian infer-
ence, and (j) Evaluation of the accuracy of LAI.
(DOCX)
S1 Fig. Schematic illustration of the computational model. We considered a model of logis-
tic expansion of the number of cancer cells starting from a single cell in the primary site. Can-
cer cells follow a stochastic process: during each elementary time step, cells may divide with a
possibility of accumulating an alteration that allows it to divide, die, or metastasize elsewhere.
We considered the situation in which the growth rate of the tumor decreases with increasing
Computational modeling of pancreatic cancer informed by over 1000 patients
PLOS ONE | https://doi.org/10.1371/journal.pone.0215409 April 26, 2019 15 / 19

tumor size. Cells that have not yet evolved the ability to metastasize, type-0 cells, divide at rate
r0(1-(w+x)/LAI) and die at rate d0 per unit time. Type-0 cells give rise to type-1 cells through
accumulating an alteration in a metastatic-related gene with probability u per type-0 cell divi-
sion. Type-1 cells divide and die at rates of r1(1-(w+x)/LAI) and d1 per unit time. Type-1 cells
can establish a metastatic colony, consisting of type-2 cells, at another location with probability
q; these sites start from a single metastatic cell in each metastatic site. Type-2 cells grow with a
division and death rate of r2(1-yi/MAIi) and d2 per unit time, respectively. When the total
number of all tumor cells reaches Mdiag, the tumor is detected and treatment in the form of
chemotherapy, radiation, and/or surgery initiates. When the total number of cells reaches
Mdeath, the patient dies. See S1(B)–S1(D) Doc for a description of the model.
(TIF)
S2 Fig. The model accurately predicts OS observed in the clinical cohort. The panel shows
overall survival of patients in the MGH cohort (black line) and simulated cases (red line).
Parameter values are u = 6.31×10⁻⁵, q = 6.31×10⁻⁷, r0 and r1 = 0.28, r2 = 1.16, death rate of
each type = 1/100×growth rate, Mdiag = 10N(9.47,0.29), and Mdeath = 1010.6. LAI/MAI and growth
rates during CTx for primary and metastatic sites are based on the estimated distributions (S2
and S3 Data), and ε was randomly chosen from [10−5, 10−1]. The number of simulated cases
was the same as the number of patients in the clinical cohort (n = 1,089).
(TIF)
S3 Fig. Subgroup analysis of the in silico clinical trial of CRTx for LAPC patients (Sub-
group analysis of cases in Fig 4A). (A) Description of CRTx schedules for LAPC cases. (B and
C) Assessment of survival of regimens 1 and 2 in simulated cases with LAPC (B) whose LAI is
less than the median, and (C) whose LAI is larger than the median. The median
LAI = 1.2×10¹⁰, 1.4×10¹⁰, and 1.4×10¹⁰ for FFX, GEM, and GEM+nab-paclitaxel, respectively.
Number of simulated cases was 50 per group; and P-values by log-rank test were 0.117, 0.809,
and 0.466 for FFX, GEM, and GEM+nab-paclitaxel in (B); and 0.0547, 0.0429, and 0.0379 for
FFX, GEM, and GEM+nab-paclitaxel in (C). Parameter values were the same as those in S2
Fig.
(TIF)
S4 Fig. Effects of CRTx schedules on PDAC progression phenotype at death. (A–C) Assess-
ment of (A) the primary tumor size at death; (B) the average size of metastatic sites at death;
and (C) the number of metastases at death with different chemotherapies in each regimen.
Number of simulated cases was 100 per category, and P<0.001 for each pair of regimens using
any drug in (A)–(C). Parameter values used for the panels were the same as those described in
S2 Fig.
(TIF)
S5 Fig. Sensitivity analysis of the effect of FFX under the assumption that treatment
reversibly alters growth rates. (A) Description of tested CTx schedules with regard to our
sensitivity analyses of the assumption of growth rate reversibility after treatment. In scenarios
2–4, the time until the growth rates recover to pre-treatment levels after treatment discontinu-
ation is 2 weeks, 1 month, and 2 months, respectively. In scenarios 5 and 6, the levels the
growth rate recovers to after treatment discontinuation are 95% and 90% of the original
growth rate levels, respectively. (B) Waterfall plot of relative changes in diameters of simulated
primary tumors at death compared with those at diagnosis in each scenario. P>0.05 for com-
parisons of all pairs of scenarios. (C) Assessment of survival duration. P>0.05 for comparisons
of all pairs of scenarios 1–4; P>0.05 for scenarios 1 vs 5 and 1 vs 6. (D-F) Assessment of (D)
the primary tumor size at death; (E) the average size of metastatic sites at death; and (F) the
Computational modeling of pancreatic cancer informed by over 1000 patients
PLOS ONE | https://doi.org/10.1371/journal.pone.0215409 April 26, 2019 16 / 19
number of metastases at death in each scenario. P>0.05 for each pair of scenarios. Number of
simulation cases are 100 per each scenario. Parameter values used are the same as those
described in S2 Fig.
(TIF)
S1 Table. Comparison of model fitting according to AIC. The Akaike Information Criterion
is shown to assess model fits to the data. The models include the logistic model, the linear
model, and the exponential model.
(DOCX)
S2 Table. Median, 1st and 3rd quartiles for estimated growth rates and LAI/MAI using the
logistic growth model. Estimated growth rates during CTx and in the absence of treatment
are summarized and shown in the values of median, first and third quartiles. Also, the P-values
by Mann-Whitney test are shown for the comparison of metastatic growth rates among the
treatments.
(DOCX)
S3 Table. P-values using the log-rank test for comparisons of the four chemotherapies regi-
mens. The log-rank test was performed for the group comparisons regarding the Kaplan-
Meier analyses shown in Fig 4F.
(DOCX)
S4 Table. P-values using the log-rank test for comparisons of the three regimens with ces-
sations. The log-rank test was performed for the group comparison regarding the Kaplan-
Meier analyses shown in Fig 4G.
(DOCX)
Acknowledgments
We thank F. Begum, F. Choudhury, and Penny Ni for assistance with data cleaning and
Michor laboratory members for discussions.
Author Contributions
Conceptualization: Kimiyo N. Yamamoto, Akira Nakamura, Franziska Michor.
Data curation: Kimiyo N. Yamamoto, Akira Nakamura, Angela C. Tramontano, Uri Kartoun,
Tetsunosuke Shimizu, Yoshihiro Inoue, Mitsuhiro Asakuma, Kazuhisa Uchiyama, Chin
Hur.
Formal analysis: Kimiyo N. Yamamoto, Akira Nakamura, Lin L. Liu, Mithat Gonen.
Funding acquisition: Kimiyo N. Yamamoto, Akira Nakamura, Franziska Michor.
Investigation: Kimiyo N. Yamamoto, Akira Nakamura.
Methodology: Kimiyo N. Yamamoto, Akira Nakamura.
Project administration: Kimiyo N. Yamamoto, Akira Nakamura.
Resources: Kimiyo N. Yamamoto, Akira Nakamura.
Software: Akira Nakamura.
Supervision: Kimiyo N. Yamamoto, Akira Nakamura.
Validation: Kimiyo N. Yamamoto, Akira Nakamura.
Computational modeling of pancreatic cancer informed by over 1000 patients
PLOS ONE | https://doi.org/10.1371/journal.pone.0215409 April 26, 2019 17 / 19
Visualization: Kimiyo N. Yamamoto, Akira Nakamura.
Writing – original draft: Kimiyo N. Yamamoto, Akira Nakamura, Lin L. Liu, Shayna Stein,
Hiroshi Haeno, Chung Yin Kong, Chin Hur, Franziska Michor.
Writing – review & editing: Kimiyo N. Yamamoto, Akira Nakamura, Lin L. Liu, Shayna
Stein, Franziska Michor.
References1. Rahib L, Smith BD, Aizenberg R, Rosenzweig AB, Fleshman JM, Matrisian LM. Projecting cancer inci-
dence and deaths to 2030: the unexpected burden of thyroid, liver, and pancreas cancers in the United
States. Cancer Res. 2014; 74(11):2913–2921. https://doi.org/10.1158/0008-5472.CAN-14-0155 PMID:
24840647
2. Siegel RL, Miller KD, Jemal A. Cancer Statistics, 2017. CA Cancer J Clin. 2017; 67(1):7–30. https://doi.
org/10.3322/caac.21387 PMID: 28055103
3. Crane CH, Varadhachary GR, Yordy JS, Staerkel GA, Javle MM, Safran H, et al. Phase II trial of cetuxi-
mab, gemcitabine, and oxaliplatin followed by chemoradiation with cetuximab for locally advanced (T4)
pancreatic adenocarcinoma: correlation of Smad4(Dpc4) immunostaining with pattern of disease pro-
gression. J Clin Oncol. 2011; 29(22):3037–43. https://doi.org/10.1200/JCO.2010.33.8038 PMID:
21709185
4. Iacobuzio-Donahue CA, Fu B, Yachida S, Luo M, Abe H, Henderson CM, et al. DPC4 gene status of the
primary carcinoma correlates with patterns of failure in patients with pancreatic cancer. J Clin Oncol.
2009; 27(11):1806–13. https://doi.org/10.1200/JCO.2008.17.7188 PMID: 19273710
5. Yamamoto KN, Yachida S, Nakamura A, Niida A, Oshima M, De S, et al. Personalized Management of
Pancreatic Ductal Adenocarcinoma Patients through Computational Modeling. Cancer Res. 2017; 77
(12):3325–3335. https://doi.org/10.1158/0008-5472.CAN-16-1208 PMID: 28381541
6. Yachida S, Jones S, Bozic I, Antal T, Leary R, Fu B, et al. Distant metastasis occurs late during the
genetic evolution of pancreatic cancer. Nature. 2010; 467(7319):1114–7. https://doi.org/10.1038/
nature09515 PMID: 20981102
7. Whittle MC, Izeradjene K, Rani PG, Feng L, Carlson MA, DelGiorno KE, et al. RUNX3 Controls a Meta-
static Switch in Pancreatic Ductal Adenocarcinoma. Cell. 2015; 161(6):1345–60. https://doi.org/10.
1016/j.cell.2015.04.048 PMID: 26004068
8. McDonald OG, Li X, Saunders T, Tryggvadottir R, Mentch SJ, Warmoes MO, et al. Epigenomic repro-
gramming during pancreatic cancer progression links anabolic glucose metabolism to distant metasta-
sis. Nat Genet. 2017; 49(3):367–376. https://doi.org/10.1038/ng.3753 PMID: 28092686
9. Makohon-Moore AP, Zhang M, Reiter JG, Bozic I, Allen B, Kundu D, et al. Limited heterogeneity of
known driver gene mutations among the metastases of individual patients with pancreatic cancer. Nat
Genet. 2017; 49(3):358–366. https://doi.org/10.1038/ng.3764 PMID: 28092682
10. Burris HA 3rd, Moore MJ, Andersen J, Green MR, Rothenberg ML, Modiano MR, et al. Improvements in
survival and clinical benefit with gemcitabine as first-line therapy for patients with advanced pancreas
cancer: a randomized trial. J Clin Oncol. 1997; 15(6):2403–13. https://doi.org/10.1200/JCO.1997.15.6.
2403 PMID: 9196156
11. Oettle H, Post S, Neuhaus P, Gellert K, Langrehr J, Ridwelski K, et al. Adjuvant chemotherapy with
gemcitabine vs observation in patients undergoing curative-intent resection of pancreatic cancer: a ran-
domized controlled trial. JAMA. 2007; 297(3):267–77. https://doi.org/10.1001/jama.297.3.267 PMID:
17227978
12. Hammel P, Huguet F, van Laethem JL, Goldstein D, Glimelius B, Artru P, et al. Effect of Chemora-
diotherapy vs Chemotherapy on Survival in Patients With Locally Advanced Pancreatic Cancer Con-
trolled After 4 Months of Gemcitabine With or Without Erlotinib: The LAP07 Randomized Clinical Trial.
JAMA. 2016; 315(17):1844–53. https://doi.org/10.1001/jama.2016.4324 PMID: 27139057
13. Conroy T, Desseigne F, Ychou M, Bouche O, Guimbaud R, Becouarn Y, et al. FOLFIRINOX versus
gemcitabine for metastatic pancreatic cancer. N Engl J Med. 2011; 364(19):1817–25. https://doi.org/10.
1056/NEJMoa1011923 PMID: 21561347
14. Von Hoff DD, Ervin T, Arena FP, Chiorean EG, Infante J, Moore M, et al. Increased survival in pancre-
atic cancer with nab-paclitaxel plus gemcitabine. N Engl J Med. 2013; 369(18):1691–703. https://doi.
org/10.1056/NEJMoa1304369 PMID: 24131140
15. Boone BA, Steve J, Krasinskas AM, Zureikat AH, Lembersky BC, Gibson MK, et al. Outcomes with
FOLFIRINOX for borderline resectable and locally unresectable pancreatic cancer. J Surg Oncol. 2013;
108(4):236–41. https://doi.org/10.1002/jso.23392 PMID: 23955427
Computational modeling of pancreatic cancer informed by over 1000 patients
PLOS ONE | https://doi.org/10.1371/journal.pone.0215409 April 26, 2019 18 / 19

16. Collins VP, Loeffler RK, Tivey H. Observations on growth rates of human tumors. Am J Roentgenol
Radium Ther Nucl Med. 1956; 76(5):988–1000. PMID: 13362715
17. Laird AK. Dynamics of tumor growth: comparison of growth rates and extrapolation of growth curve to
one cell. Br J Cancer. 1965; 19:278–91. PMID: 14316202
18. Steel GG, Lamerton LF. The growth rate of human tumours. Br J Cancer. 1966; 20(1):74–86. PMID:
5327764
19. Norton L, Simon R. Growth curve of an experimental solid tumor following radiotherapy. J Natl Cancer
Inst. 1977; 58(6):1735–41. PMID: 194044
20. Norton L. A Gompertzian model of human breast cancer growth. Cancer Res. 1988; 48(24):7067–71.
21. Vaidya VG, Alexandro FJ. Evaluation of some mathematical models for tumor growth. Int J Biomed
Comput. 1982; 13(1):19–36. PMID: 7061168
22. Spratt JA, von Fournier D, Spratt JS, Weber EE. Decelerating growth and human breast cancer. Can-
cer. 1993; 71(6):2013–9. PMID: 8443753
23. Benzekry S, Lamont C, Beheshti A, Tracz A, Ebos JM, Hlatky L, et al. Classical mathematical models
for description and prediction of experimental tumor growth. PLoS Comput Biol. 2014; 10(8):e1003800.
https://doi.org/10.1371/journal.pcbi.1003800 PMID: 25167199
24. Moffitt RA, Marayati R, Flate EL, Volmar KE, Loeza SG, Hoadley KA, et al. Virtual microdissection iden-
tifies distinct tumor- and stroma-specific subtypes of pancreatic ductal adenocarcinoma. Nat Genet.
2015; 47(10):1168–78. https://doi.org/10.1038/ng.3398 PMID: 26343385
25. Haeno H, Gonen M, Davis MB, Herman JM, Iacobuzio-Donahue CA, Michor F. Computational modeling
of pancreatic cancer reveals kinetics of metastasis suggesting optimum treatment strategies. Cell.
2012; 148(1–2):362–75. https://doi.org/10.1016/j.cell.2011.11.060 PMID: 22265421
26. Pienta KJ, Robertson BA, Coffey DS, Taichman RS. The cancer diaspora: Metastasis beyond the seed
and soil hypothesis. Clin Cancer Res. 2013; 19(21):5849–55. https://doi.org/10.1158/1078-0432.CCR-
13-2158 PMID: 24100626
27. Gillen S, Schuster T, Meyer Zum Buschenfelde C, Friess H, Kleeff J. Preoperative/neoadjuvant therapy
in pancreatic cancer: a systematic review and meta-analysis of response and resection percentages.
PLoS Med. 2010; 7(4):e1000267. https://doi.org/10.1371/journal.pmed.1000267 PMID: 20422030
28. Phillips TA, Howell A, Grieve RJ, Welling PG. Pharmacokinetics of oral and intravenous fluorouracil in
humans. J Pharm Sci. 1980; 69(12):1428–31. PMID: 7463330
29. Payet B, Fabre G, Tubiana N, Cano JP. Plasma kinetic study of folinic acid and 5-methyltetrahydrofolate
in healthy volunteers and cancer patients by high-performance liquid chromatography. Cancer Che-
mother Pharmacol. 1987; 19(4):319–25. PMID: 3496173
30. Gupta E, Mick R, Ramirez J, Wang X, Lestingi TM, Vokes EE, et al. Pharmacokinetic and pharmacody-
namic evaluation of the topoisomerase inhibitor irinotecan in cancer patients. J Clin Oncol. 1997 Apr; 15
(4):1502–10. https://doi.org/10.1200/JCO.1997.15.4.1502 PMID: 9193346
31. Ehrsson H, Wallin I, Yachnin J. Pharmacokinetics of oxaliplatin in humans. Med Oncol. 2002; 19
(4):261–5. https://doi.org/10.1385/MO:19:4:261 PMID: 12512920
32. Marsh Rde W, Talamonti MS, Katz MH, Herman JM. Pancreatic cancer and FOLFIRINOX: a new era
and new questions. Cancer Med. 2015; 4(6):853–63. https://doi.org/10.1002/cam4.433 PMID:
25693729
33. Kadaba R, Birke H, Wang J, Hooper S, Andl CD, Di Maggio F, et al. Imbalance of desmoplastic stromal
cell numbers drives aggressive cancer processes. J Pathol. 2013; 230(1):107–17. https://doi.org/10.
1002/path.4172 PMID: 23359139
34. National Comprehensive Cancer Network. NCCN clinical practice guidelines in oncology. Pancreatic
Adenocarcinoma Version 2016, http://www.nccn.org/professionals/physician_gls/pdf/pancreatic.pdf
35. Halperin EC, Perez CA, Brady LW. Perez and Brady’s Principles and Practice of Radiation Oncology.
Lippincott Williams & Wilkins, 2008.
36. Butturini G, Stocken DD, Wente MN, Jeekel H, Klinkenbijl JH, Bakkevold KE, et al. Influence of resec-
tion margins and treatment on survival in patients with pancreatic cancer: meta-analysis of randomized
controlled trials. Arch Surg. 2008; 143(1):75–83; discussion 83. https://doi.org/10.1001/archsurg.2007.
17 PMID: 18209156
37. Carpenter B, Gelman A, Hoffman MD, Lee D, Goodrich B, Betancourt M, et al. Stan: A Probabilistic Pro-
gramming Language. J Stat Softw. 2017; 76(1):1–32.
Computational modeling of pancreatic cancer informed by over 1000 patients
PLOS ONE | https://doi.org/10.1371/journal.pone.0215409 April 26, 2019 19 / 19