comprehensiveannual financialreport -...
TRANSCRIPT
CCoommpprreehheennssiivvee AAnnnnuuaallFFiinnaanncciiaall RReeppoorrtt
AAmmeerriiccaa’’ss GGaatteewwaayy ttoo tthhee GGuullffssttrreeaamm
CCITTY OOFF BBOOYNNTTOONN BBEEACCHH,, FFLLORRIDDAAFFOORR FFIISSCCAALL YYEEAARR EENNDDEEDD
SSEEPPTTEEMMBBEERR 3300,, 22001111
City of Boynton Beach, Florida
COMPREHENSIVE ANNUAL FINANCIAL REPORT
FOR THE FISCAL YEAR ENDEDSeptember 30, 2011
Prepared by Department of Financial Services
E. Barrett Atwood, Sr., CPADirector of Financial Services
Tim W. HowardDeputy Director of Financial Services
THE CITY OF BOYNTON BEACH
FY 2011 COMPREHENSIVE ANNUAL FINANCIAL REPORT
Table of Contents
I – INTRODUCTORY SECTION
Transmittal Letter ............................................................................................................................................................I-1Elected and Appointed Officials.......................................................................................................................................I-4Organizational Chart ........................................................................................................................................................I-5Map of the City of Boynton Beach...................................................................................................................................I-6
II – FINANCIAL SECTION
Independent Auditor’s Report .........................................................................................................................................II-1Management’s Discussion and Analysis ..........................................................................................................................II-3
BASIC FINANCIAL STATEMENTS
Government-wide Financial StatementsStatement of Net Assets ...........................................................................................................................................II-13Statement of Activities .............................................................................................................................................II-14
Fund Financial StatementsGovernmental Funds:
Balance Sheet........................................................................................................................................................II-16Reconciliation of the Fund Balances of Governmental Funds to the
Statement of Net Assets of Governmental Activities ........................................................................................II-17Statement of Revenues, Expenditures, and Changes in Fund Balances................................................................II-18Reconciliation of the Statement of Revenues, Expenditures, and
Changes in Fund Balances of Governmental Funds to the Statement of Activities of Governmental Activities ..........................................................................................II-19
General Fund Statement of Revenues, Expenditures, and Changes in Fund Balance – Budget and Actual..................................................................................................II-20
Boynton Beach CRA Special Revenue Fund Statement of Revenues,Expenditures, and Changes in Fund Balance – Budget and Actual....................................................................II-22
Public Service Tax Debt Service Fund Statement of Revenues, Expenditures, and Changes in Fund Balance – Budget and Actual....................................................................II-23
Proprietary Funds:Statement of Net Assets .......................................................................................................................................II-24Reconciliation of the Total Enterprise Funds to the
Government-wide Statements Business-Type Activities...................................................................................II-26Statement of Revenues, Expenses, and Changes in Net Assets ............................................................................II-27Statement of Cash Flows.......................................................................................................................................II-28
Fiduciary Funds (Pension Trust Funds):Statement of Fiduciary Net Assets ........................................................................................................................II-30Statement of Changes in Fiduciary Net Assets......................................................................................................II-31
Notes to the Financial Statements ..............................................................................................................................II-32
Required Supplementary Information – Pension Trust FundsSchedules of Funding Progress .................................................................................................................................II-70
Required Supplementary Information – Other Post Employment Benefits (OPEB)Schedule of Funding Progress ..................................................................................................................................II-71
THE CITY OF BOYNTON BEACH
FY 2011 COMPREHENSIVE ANNUAL FINANCIAL REPORT
Table of Contents (Continued)
II – FINANCIAL SECTION (Continued)
COMBINING AND INDIVIDUAL FUND FINANCIAL STATEMENTS
Major Governmental FundsDescriptions ..............................................................................................................................................................II-72Balance Sheets..........................................................................................................................................................II-73Statements of Revenues, Expenditures, and Changes in Fund Balances..................................................................II-74
General FundBalance Sheet ....................................................................................................................................................II-75Statement of Revenues, Expenditures, and Changes in Fund Balance..............................................................II-76
Boynton Beach CRA Special Revenue FundBalance Sheet ....................................................................................................................................................II-77Statement of Revenues, Expenditures, and Changes in Fund Balance..............................................................II-78
Public Service Tax Debt Service FundBalance Sheet ....................................................................................................................................................II-79Statement of Revenues, Expenditures, and Changes in Fund Balance..............................................................II-80
Major Enterprise FundsDescriptions ..............................................................................................................................................................II-81Statements of Net Assets..........................................................................................................................................II-82Statements of Revenues, Expenses, and Changes in Net Assets ..............................................................................II-83Statements of Cash Flows.........................................................................................................................................II-84
Water & Sewer FundStatement of Net Assets ....................................................................................................................................II-85Statement of Revenues, Expenses, and Changes in Net Assets ........................................................................II-86Statement of Cash Flows ...................................................................................................................................II-87
Sanitation FundStatement of Net Assets ....................................................................................................................................II-88Statement of Revenues, Expenses, and Changes in Net Assets ........................................................................II-89Statement of Cash Flows ...................................................................................................................................II-90
Non-Major Governmental FundsDescription................................................................................................................................................................II-91Combining Balance Sheet .........................................................................................................................................II-92Combining Statement of Revenues, Expenditures, and Changes in Fund Balances.................................................II-96
Grants FundBalance Sheet ....................................................................................................................................................II-100Statement of Revenues, Expenditures, and Changes in Fund Balance..............................................................II-101
FEMA Hurricane FundBalance Sheet ....................................................................................................................................................II-102Statement of Revenues, Expenditures, and Changes in Fund Balance..............................................................II-103
SHIP Grant FundBalance Sheet ....................................................................................................................................................II-104Statement of Revenues, Expenditures, and Changes in Fund Balance..............................................................II-105
ARRA Grant FundBalance Sheet ....................................................................................................................................................II-106Statement of Revenues, Expenditures, and Changes in Fund Balance..............................................................II-107
CDBG Grant FundBalance Sheet ....................................................................................................................................................II-108Statement of Revenues, Expenditures, and Changes in Fund Balance..............................................................II-109
THE CITY OF BOYNTON BEACH
FY 2011 COMPREHENSIVE ANNUAL FINANCIAL REPORT
Table of Contents (Continued)
II – FINANCIAL SECTION (Continued)
COMBINING AND INDIVIDUAL FUND FINANCIAL STATEMENTS (Continued):
Non-major Governmental Funds (Continued)NSP Grant Fund
Balance Sheet ....................................................................................................................................................II-110Statement of Revenues, Expenditures, and Changes in Fund Balance..............................................................II-111
Traffic Safety FundBalance Sheet ....................................................................................................................................................II-112Statement of Revenues, Expenditures, and Changes in Fund Balance..............................................................II-113
Local Option Gas Tax FundBalance Sheet ....................................................................................................................................................II-114Statement of Revenues, Expenditures, and Changes in Fund Balance..............................................................II-115Statement of Revenues, Expenditures, and Changes in Fund Balance – Budget and Actual ............................II-116
Community Improvements FundBalance Sheet ....................................................................................................................................................II-117Statement of Revenues, Expenditures, and Changes in Fund Balance..............................................................II-118Statement of Revenues, Expenditures, and Changes in Fund Balance – Budget and Actual ............................II-119
Green Building FundBalance Sheet ....................................................................................................................................................II-120Statement of Revenues, Expenditures, and Changes in Fund Balance..............................................................II-121
Public Art FundBalance Sheet ....................................................................................................................................................II-122Statement of Revenues, Expenditures, and Changes in Fund Balance..............................................................II-123Statement of Revenues, Expenditures, and Changes in Fund Balance – Budget and Actual ............................II-124
Recreation Program FundBalance Sheet ....................................................................................................................................................II-125Statement of Revenues, Expenditures, and Changes in Fund Balance..............................................................II-126Statement of Revenues, Expenditures, and Changes in Fund Balance – Budget and Actual ............................II-127
Boynton Beach Memorial Park FundBalance Sheet ....................................................................................................................................................II-128Statement of Revenues, Expenditures, and Changes in Fund Balance..............................................................II-129Statement of Revenues, Expenditures, and Changes in Fund Balance – Budget and Actual ............................II-130
Community Services FundBalance Sheet ....................................................................................................................................................II-131Statement of Revenues, Expenditures, and Changes in Fund Balance..............................................................II-132
Boynton Beach CRA Debt Service FundBalance Sheet ....................................................................................................................................................II-133Statement of Revenues, Expenditures, and Changes in Fund Balance..............................................................II-134
General Capital Improvements FundBalance Sheet ....................................................................................................................................................II-135Statement of Revenues, Expenditures, and Changes in Fund Balance..............................................................II-136Statement of Revenues, Expenditures, and Changes in Fund Balance – Budget and Actual ............................II-137
Fire Rescue Capital Improvements FundBalance Sheet ....................................................................................................................................................II-138Statement of Revenues, Expenditures, and Changes in Fund Balance..............................................................II-139Statement of Revenues, Expenditures, and Changes in Fund Balance – Budget and Actual ............................II-140
Parks & Recreational Facilities FundBalance Sheet ....................................................................................................................................................II-141Statement of Revenues, Expenditures, and Changes in Fund Balance..............................................................II-142
THE CITY OF BOYNTON BEACH
FY 2011 COMPREHENSIVE ANNUAL FINANCIAL REPORT
Table of Contents (Continued)
II – FINANCIAL SECTION (Continued)
COMBINING AND INDIVIDUAL FUND FINANCIAL STATEMENTS (Continued):
Non-major Governmental Funds (Continued)Public Service Tax Construction Fund
Balance Sheet ....................................................................................................................................................II-143Statement of Revenues, Expenditures, and Changes in Fund Balance..............................................................II-144
Boynton Beach CRA Bond Projects FundBalance Sheet ....................................................................................................................................................II-145Statement of Revenues, Expenditures, and Changes in Fund Balance..............................................................II-146
Non-Major Enterprise FundsDescriptions ..............................................................................................................................................................II-147Combining Statement of Net Assets.........................................................................................................................II-148Combining Statement of Revenues, Expenses, and Changes in Net Assets .............................................................II-149Combining Statement of Cash Flows ........................................................................................................................II-150
Golf Course FundStatement of Net Assets ....................................................................................................................................II-151Statement of Revenues, Expenses, and Changes in Net Assets ........................................................................II-152Statement of Cash Flows ...................................................................................................................................II-153
Mass Transit FundStatement of Net Assets ....................................................................................................................................II-154Statement of Revenues, Expenses, and Changes in Net Assets ........................................................................II-155Statement of Cash Flows ...................................................................................................................................II-156
Internal Service FundsDescriptions ..............................................................................................................................................................II-157Combining Statement of Net Assets.........................................................................................................................II-158Combining Statement of Revenues, Expenses, and Changes in Net Assets .............................................................II-159Combining Statement of Cash Flows ........................................................................................................................II-160
Vehicle Service FundStatement of Net Assets ....................................................................................................................................II-161Statement of Revenues, Expenses, and Changes in Net Assets ........................................................................II-162Statement of Cash Flows ...................................................................................................................................II-163
Warehouse FundStatement of Net Assets ....................................................................................................................................II-164Statement of Revenues, Expenses, and Changes in Net Assets ........................................................................II-165Statement of Cash Flows ...................................................................................................................................II-166
Self Insurance FundStatement of Net Assets ....................................................................................................................................II-167Statement of Revenues, Expenses, and Changes in Net Assets ........................................................................II-168Statement of Cash Flows ...................................................................................................................................II-169
Pension Trust FundsDescriptions ..............................................................................................................................................................II-170Combining Statement of Fiduciary Net Assets .........................................................................................................II-171Combining Statement of Changes in Fiduciary Net Assets .......................................................................................II-172
General Employees’ Pension FundStatement of Net Assets ....................................................................................................................................II-173Statement of Changes in Net Assets..................................................................................................................II-174
THE CITY OF BOYNTON BEACH
FY 2011 COMPREHENSIVE ANNUAL FINANCIAL REPORT
Table of Contents (Continued)
II – FINANCIAL SECTION (Continued)
COMBINING AND INDIVIDUAL FUND FINANCIAL STATEMENTS (Continued):
Pension Trust Funds (Continued)Police Officers’ Pension Fund
Statement of Net Assets ....................................................................................................................................II-175Statement of Changes in Net Assets..................................................................................................................II-176
Firefighters’ Pension FundStatement of Net Assets ....................................................................................................................................II-177Statement of Changes in Net Assets..................................................................................................................II-178
III – STATISTICAL SECTION
Table of Contents and Descriptions................................................................................................................................III-1
Financial TrendsGovernment-wide Net Assets by Activity.....................................................................................................................III-2Government-wide Changes in Net Assets ....................................................................................................................III-4Governmental Activities Tax Revenues by Source .......................................................................................................III-8Fund Balances of Governmental Funds........................................................................................................................III-9Changes in Fund Balances of Governmental Funds .....................................................................................................III-11
Revenue CapacityAssessed Value and Estimated Actual Value of Taxable Property ...............................................................................III-13Property Tax Rates – Direct and Overlapping Governments........................................................................................III-15Ten Principal Property Taxpayers.................................................................................................................................III-16Property Tax Levies and Collections.............................................................................................................................III-17
Debt CapacityRatios of Outstanding Debt by Type.............................................................................................................................III-18Ratios of General Bonded Debt Outstanding ...............................................................................................................III-19Direct and Overlapping Governmental Activities Debt ................................................................................................III-20Legal Debt Margin Information ....................................................................................................................................III-21Pledged Revenue Coverage – Water & Sewer Bonds...................................................................................................III-22Pledged Revenue Coverage – Public Service Tax Bonds...............................................................................................III-23
Demographics and Economic InformationDemographic and Economic Statistics .........................................................................................................................III-24Principal Employers ......................................................................................................................................................III-25
Operating InformationFull-Time Equivalent City Government Employees by Function ..................................................................................III-26Operating Indicators by Function/Program .................................................................................................................III-27Capital Asset Statistics by Function/Program...............................................................................................................III-29
IV – COMPLIANCE SECTION
Independent Auditor’s Report on Internal Control Over Financial Reportingand on Compliance and Other Matters Based on an Audit of FinancialStatements Performed in Accordance with Government Auditing Standards.............................................................IV-1
Schedule of Expenditures of Federal Awards ..................................................................................................................IV-3Notes to Schedule of Expenditures of Federal Awards....................................................................................................IV-4
THE CITY OF BOYNTON BEACH
FY 2011 COMPREHENSIVE ANNUAL FINANCIAL REPORT
Table of Contents (Continued)
IV – COMPLIANCE SECTION (Continued)
Independent Auditor’s Report on Compliance With Requirements That CouldHave a Direct and Material Effect on Each Major Federal Program and onInternal Control Over Compliance in Accordance With OMB Circular A-133 ..............................................................IV-5
Schedule of Findings and Questioned Costs ....................................................................................................................IV-7Summary Schedule of Prior Audit Findings......................................................................................................................IV-15City Corrective Action Plan ..............................................................................................................................................IV-16Management Letter Required by the Rules of the
Auditor General for the State of Florida.......................................................................................................................IV-22City Response to Management Letter .............................................................................................................................IV-32

THE CITY OF BOYNTON BEACH
FY 2011 COMPREHENSIVE ANNUAL FINANCIAL REPORT
INTRODUCTORY SECTION
THE CITY OF BOYNTON BEACH
FY 2011 COMPREHENSIVE ANNUAL FINANCIAL REPORT
December 12, 2012
To the Honorable Mayor,Members of the City Commission,Citizens of the City of Boynton Beach, Florida
The Financial Services Department is pleased to submit the Comprehensive Annual Financial Report (CAFR) of the City of Boynton Beach, Florida, for the fiscal year ended September 30, 2011. The report fulfills the requirements set forth in Chapter 166.241 of the Florida Statutes and the Rules of the Florida Auditor General, Chapter 10.550. In addition to meeting legal requirements, the report continues to present the City’s tradition of full financial disclosure as demonstrated by the informative financial analysis provided and the exhibits and statistical tables included herein.
Management assumes full responsibility for both the completeness and the reliability of the information contained in this report, based on a framework of internal control established for this purpose. Because the cost of internal control should not exceed the anticipated benefit, the objective is to provide reasonable, rather than absolute, assurance that the financial statements are free of any material misstatements. To the best of our knowledge and belief, the data is accurate in all material aspects.
The City’s independent auditor, Caler, Donten, Levine, Cohen, Porter & Veil, P.A., Certified Public Accountants, have issued an unqualified (“clean”) opinion on the City of Boynton Beach’s financial statements for the year ended September 30, 2011. The auditor’s report is located at the front of the Financial Section of this report.
Management’s Discussion and Analysis (MD&A) immediately follows the independent auditor’s report and provides a narrative, overview, and analysis of the basic financial statements. MD&A complements this transmittal letter and we suggest reading it to obtain an introduction to the financial statements.
The CAFR contains four sections to facilitate understanding by the non-financially oriented user as well as to provide all necessary information for the most sophisticated financial observer.
The Introductory Section introduces the reader to the City and summarizes the financial story told in the financial statements, schedules, notes and statistical tables. This section includes this Transmittal letter, a list of principal officials and the City’s organizational chart.
The Financial Section includes the Independent Auditor’s Report of their opinion on the financial statements, Management’s Discussion and Analysis, and the Basic Financial Statements that include the Notes to the Financial Statements. The Basic Financial Statements provide an overview of the City’s financial position and results of operations. The remainder of this section presents Required Supplementary Information and the Combining and Individual Fund Statements, that focus on each individual fund and include the Non-Major Governmental Funds, Non-Major Enterprise Funds, Internal Service Funds, and Pension Trust Funds.
The Statistical Section contains a number of tables and other data designed to provide historical financial trends, revenue capacity, debt capacity, demographic and economic information, and operating information. These trendsgive an overall view of the fiscal capacity of the City.
The Compliance Section contains data required by the State of Florida and the Federal Single Audit Act. It includes the Independent Auditor’s Reports on internal control and compliance, schedules related to Federal Awards, findings and questioned costs, prior year findings, corrective action plan and the Auditor’s Management Letter and City’s response to the management letter.
100 East Boynton Beach Boulevard, Boynton Beach, FL 33435Phone: (561) 742-6310 Internet: www.boynton-beach.org
CCiittyy ooff BBooyynnttoonn BBeeaacchh,, FFlloorriiddaa
I-1
THE CITY OF BOYNTON BEACH
FY 2011 COMPREHENSIVE ANNUAL FINANCIAL REPORT
The role of this Comprehensive Annual Financial Report is to assist the City in making service, financial, and budgetary decisions and to assist in assessing accountability to the City Commission, citizens, bondholders and management by:
Comparing actual financial results with the legally adopted budget, where appropriate;
Assessing financial condition and results of operations;
Assisting in determining compliance with finance related laws, rules and regulations; and
Assisting in evaluating the efficiency and effectiveness of City operations.
PROFILE OF THE CITY OF BOYNTON BEACH
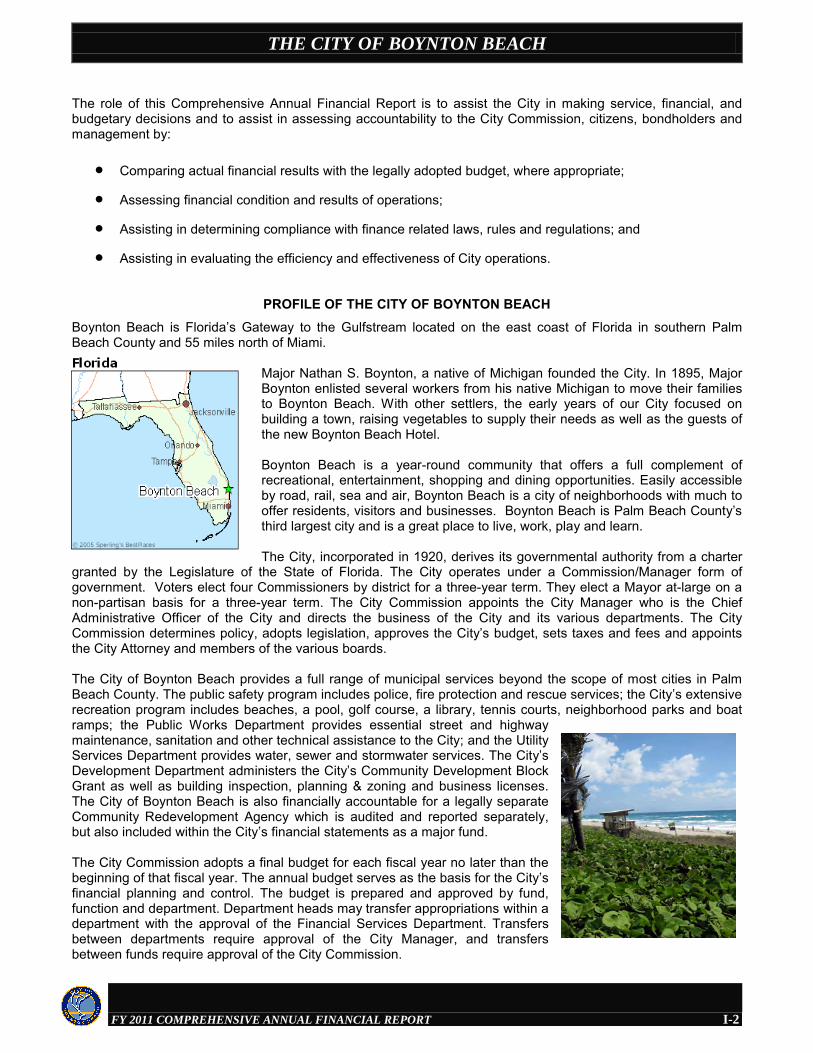
Boynton Beach is Florida’s Gateway to the Gulfstream located on the east coast of Florida in southern Palm Beach County and 55 miles north of Miami.
Major Nathan S. Boynton, a native of Michigan founded the City. In 1895, Major Boynton enlisted several workers from his native Michigan to move their families to Boynton Beach. With other settlers, the early years of our City focused onbuilding a town, raising vegetables to supply their needs as well as the guests of the new Boynton Beach Hotel.
Boynton Beach is a year-round community that offers a full complement of recreational, entertainment, shopping and dining opportunities. Easily accessible by road, rail, sea and air, Boynton Beach is a city of neighborhoods with much to offer residents, visitors and businesses. Boynton Beach is Palm Beach County’s third largest city and is a great place to live, work, play and learn.
The City, incorporated in 1920, derives its governmental authority from a charter granted by the Legislature of the State of Florida. The City operates under a Commission/Manager form of government. Voters elect four Commissioners by district for a three-year term. They elect a Mayor at-large on a non-partisan basis for a three-year term. The City Commission appoints the City Manager who is the Chief Administrative Officer of the City and directs the business of the City and its various departments. The City Commission determines policy, adopts legislation, approves the City’s budget, sets taxes and fees and appoints the City Attorney and members of the various boards.
The City of Boynton Beach provides a full range of municipal services beyond the scope of most cities in Palm Beach County. The public safety program includes police, fire protection and rescue services; the City’s extensive recreation program includes beaches, a pool, golf course, a library, tennis courts, neighborhood parks and boat ramps; the Public Works Department provides essential street and highway maintenance, sanitation and other technical assistance to the City; and the Utility Services Department provides water, sewer and stormwater services. The City’s Development Department administers the City’s Community Development Block Grant as well as building inspection, planning & zoning and business licenses.The City of Boynton Beach is also financially accountable for a legally separate Community Redevelopment Agency which is audited and reported separately, but also included within the City’s financial statements as a major fund.
The City Commission adopts a final budget for each fiscal year no later than the beginning of that fiscal year. The annual budget serves as the basis for the City’s financial planning and control. The budget is prepared and approved by fund, function and department. Department heads may transfer appropriations within a department with the approval of the Financial Services Department. Transfers between departments require approval of the City Manager, and transfers between funds require approval of the City Commission.
I-2
THE CITY OF BOYNTON BEACH
FY 2011 COMPREHENSIVE ANNUAL FINANCIAL REPORT
ECONOMIC CONDITIONS AND OUTLOOK
Over the last few years, the City’s population growth declined from an annual average of 2.7% during the 1990-2000 period to slightly over 1% annually for the last ten years, resulting in 68,217 residents as of the 2010 U.S. Census. This slowdown reflects the fact that the City is nearing buildout and changing gears from development to redevelopment activities. According to prior City projections, Boynton Beach’s population was estimated toincrease to 75,000 by the year 2015 and to 91,000 by 2025. However, the current residential market slowdown is likely to cause a forward shift in the projected growth rates for the next five years, but economic prospects still remain bright, with the City experiencing an increase in building permits for both residential and commercial.
There are a number of reasons for the good economic outlook. For a number of years, Boynton Beach lagged behind other municipalities in redevelopment activities in neighborhoods located east of Interstate 95. The City approved a number of projects in this area during the last few years. The area will continue to offer good opportunities for redevelopment. Public projects in the last few years, such as the building of Fire Station #5 that includes fire department offices, a communications center and an emergency operations center, the City library expansion, street beautifications and park improvements, are all likely to enhance the area’s attractiveness for citizens and tourists alike. All these activities will enhance Boynton’s overall appearance in the coming years.
Development and redevelopment activities in recent years are also transforming Congress Avenue, a major but aging commercial corridor within the City. Three large mixed-use projects – Renaissance Commons, Boynton Village and Town Center – are going to bolster the economic draw of the area.
MAJOR CITY INITIATIVESRecent and Continuing Projects:
Continuing upgrades to our water and wastewater system.
Reconstruction of the boardwalk at the City’s Oceanfront Park.
Conversions of the West Water Treatment Plant to low pressure reverse osmosis and an interplant raw water conveyance line.
AWARDS AND ACKNOWLEDGEMENTS
The preparation and issuance of this report represents countless hours of work. I thank many individuals of the Financial Services Department who are responsible for maintaining the financial records upon which we base this report for its completion.
I also take this opportunity to thank you and senior management of Boynton Beach for the vital role you play in enabling the City to achieve and maintain this high degree of fiscal responsibility.
Respectfully submitted,
.E. Barrett (Barry) Atwood, Sr. CPADirector of Financial Services
.Tim W. HowardDeputy Director of Financial Services
I-3

THE CITY OF BOYNTON BEACH
FY 2011 COMPREHENSIVE ANNUAL FINANCIAL REPORT
Elected and Appointed Officials
Elected Officials
MayorWoodrow Hay
VACANCY
District 1Commissioner
District 2 Vice Mayor
Mack McCray
District 3 Commissioner
Steven Holzman
District 4 Commissioner Marlene Ross
Appointed Officials
Lori LaVerriere, Interim City Manager
James Cherof City AttorneyCarisse LeJeune Interim Assistant City ManagerJanet Prainito City ClerkRay Carter Fire ChiefMatthew Immler Police ChiefNancy Byrne Director of DevelopmentJeff Livergood Director of Public WorksKofi Boateng Director of UtilitiesJulie Oldbury Director of Human ResourcesBarry Atwood Director of Financial Services
I-4
THE CITY OF BOYNTON BEACH
FY 2011 COMPREHENSIVE ANNUAL FINANCIAL REPORT
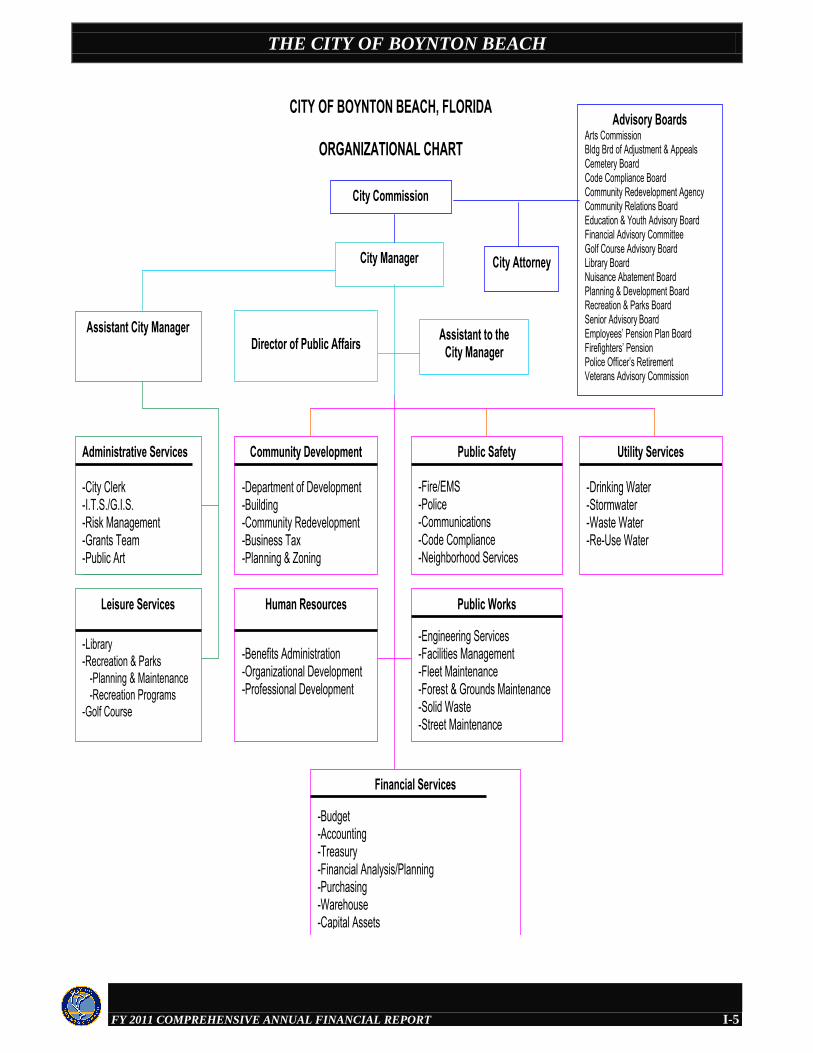
CITY OF BOYNTON BEACH, FLORIDA
ORGANIZATIONAL CHART
City Manager
Director of Public AffairsAssistant City Manager Assistant to the
City Manager
Administrative Services
-City Clerk-I.T.S./G.I.S.-Risk Management-Grants Team-Public Art
Utility Services
-Drinking Water-Stormwater -Waste Water-Re-Use Water
Community Development
-Department of Development-Building-Community Redevelopment-Business Tax-Planning & Zoning
Leisure Services
-Library-Recreation & Parks -Planning & Maintenance -Recreation Programs-Golf Course
Public Safety
-Fire/EMS-Police-Communications -Code Compliance-Neighborhood Services
Public Works
-Engineering Services-Facilities Management-Fleet Maintenance-Forest & Grounds Maintenance-Solid Waste-Street Maintenance
City Commission
City Attorney
Advisory BoardsArts CommissionBldg Brd of Adjustment & AppealsCemetery BoardCode Compliance BoardCommunity Redevelopment AgencyCommunity Relations BoardEducation & Youth Advisory BoardFinancial Advisory CommitteeGolf Course Advisory BoardLibrary BoardNuisance Abatement BoardPlanning & Development BoardRecreation & Parks BoardSenior Advisory BoardEmployees’ Pension Plan BoardFirefighters’ Pension Police Officer’s Retirement Veterans Advisory Commission
Financial Services
-Budget-Accounting-Treasury-Financial Analysis/Planning-Purchasing-Warehouse-Capital Assets
Human Resources
-Benefits Administration-Organizational Development-Professional Development
I-5
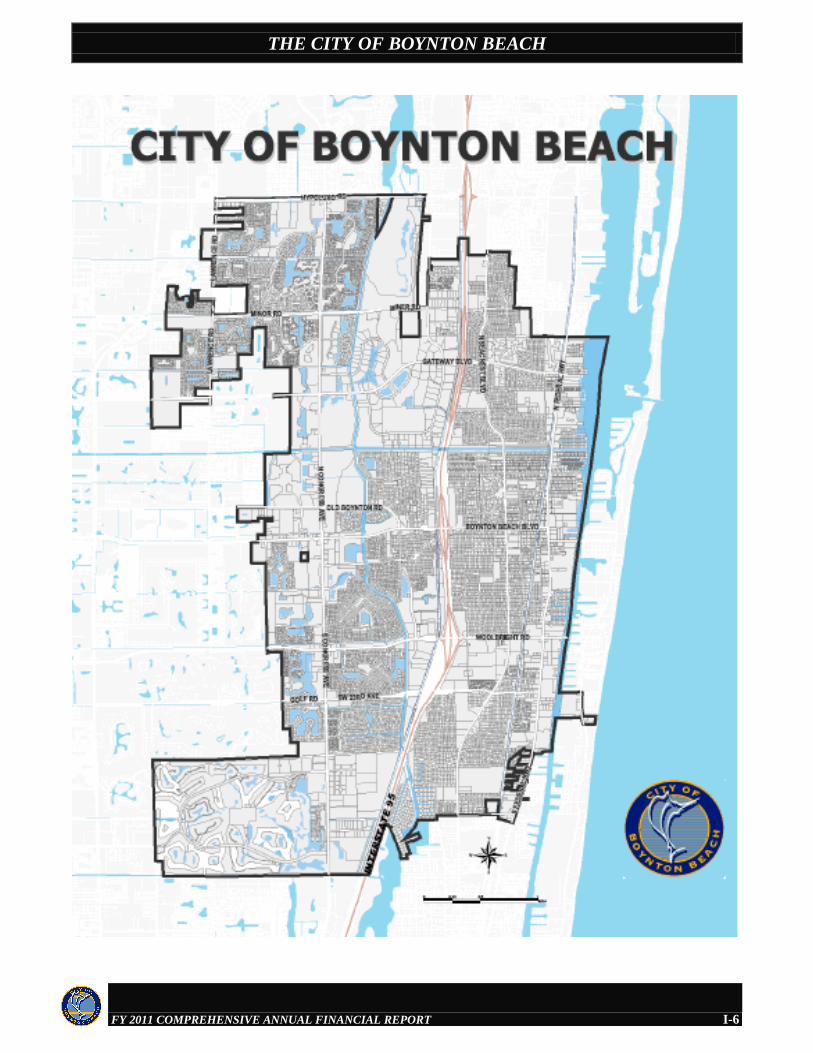
THE CITY OF BOYNTON BEACH
FY 2011 COMPREHENSIVE ANNUAL FINANCIAL REPORT
I-6

THE CITY OF BOYNTON BEACH
FY 2011 COMPREHENSIVE ANNUAL FINANCIAL REPORT
FINANCIAL SECTION
THE CITY OF BOYNTON BEACH
FY 2011 COMPREHENSIVE ANNUAL FINANCIAL REPORT
CALER, DONTEN, LEVINE,
COHEN, PORTER & VEIL, P.A.
CERTIFIED PUBLIC ACCOUNTANTS WILLIAM K CALER, JR , CPA LOUIS M COHEN, CPA JOHN C COURTNEY, CPA, JD DAVID S DONTEN, CPA JAMES B HUTCHISON, CPA JOEL H LEVINE, CPA JAMES F MULLEN, IV, CPA THOMAS A PENCE, JR , CPA SCOTT L PORTER, CPA MARK D VEIL, CPA
505 SOUTH FLAGLER DRIVE, SUITE 900
WEST PALM BEACH, FL 33401-5948
TELEPHONE (561) 832-9292 FAX (561) 832-9455
info@cdlcpa com
MEMBERS
AMERICAN INSTITUTE OF CERTIFIED PUBLIC ACCOUNTANTS
FLORIDA INSTITUTE OF
CERTIFIED PUBLIC ACCOUNTANTS
II-1
Independent Auditor’s Report
To the Honorable Mayor and City Commission City of Boynton Beach, Florida We have audited the accompanying financial statements of the governmental activities, the business-type activities, each major fund, and the aggregate remaining fund information of the City of Boynton Beach, Florida, as of and for the year ended September 30, 2011, which collectively comprise the City’s basic financial statements as listed in the table of contents. These financial statements are the responsibility of the management of the City of Boynton Beach, Florida. Our responsibility is to express opinions on these financial statements based on our audit. We did not audit the financial statements of the Boynton Beach Community Redevelopment Agency (“CRA”), which is a major governmental fund; 22%, 10%, and 9%, respectively, of the assets, net assets, and revenues of the governmental activities; and 3%, 2%, and 2%, respectively, of the assets, fund balances/net assets, and revenues/additions of the aggregate remaining fund information. We also did not audit the financial statements of the City of Boynton Beach General Employees’ Pension Fund, the City of Boynton Beach Police Officers’ Pension Fund, and the City of Boynton Beach Firefighters’ Pension Fund, which together represent 89%, 91%, and 52%, respectively, of the assets, fund balance/net assets, and revenues/additions of the aggregate remaining fund information of the City. Those financial statements were audited by other auditors whose reports thereon have been furnished to us, and our opinions, insofar as it relates to the amounts included for the CRA, General Employees’ Pension Fund, Police Officers’ Pension Fund, and Firefighters’ Pension Fund, are based solely on the reports of the other auditors. We conducted our audit in accordance with U.S. generally accepted auditing standards and the standards applicable to financial audits contained in Government Auditing Standards, issued by the Comptroller General of the United States. Those standards require that we plan and perform the audit to obtain reasonable assurance about whether the financial statements are free of material misstatement. An audit includes consideration of internal control over financial reporting as a basis for designing audit procedures that are appropriate in the circumstances, but not for the purpose of expressing an opinion on the effectiveness of the City’s internal control over financial reporting. Accordingly, we express no such opinion. An audit includes examining, on a test basis, evidence supporting the amounts and disclosures in the financial statements. An audit also includes assessing the accounting principles used and significant estimates made by management, as well as evaluating the overall financial statement presentation. We believe that our audit and the reports of other auditors provide a reasonable basis for our opinions. In our opinion, based on our audit and the reports of other auditors, the financial statements referred to in the first paragraph present fairly, in all material respects, the respective financial position of the governmental activities, the business-type activities, each major fund and the aggregate remaining fund information of the City of Boynton Beach, Florida, as of September 30, 2011, and the respective changes in financial position, and, where applicable, cash flows thereof for the year then ended in conformity with U.S. generally accepted accounting principles and the respective budgetary comparison for the General Fund, Boynton Beach CRA Special Revenue Fund and Public Service Tax Debt Service Fund. In accordance with Government Auditing Standards, we have also issued our report dated December 10, 2012, on our consideration of the internal control over financial reporting of the City of Boynton Beach, Florida, and on our tests of its compliance with certain provisions of laws, regulations, contracts and grant agreements and other matters. The
II-1
THE CITY OF BOYNTON BEACH
FY 2011 COMPREHENSIVE ANNUAL FINANCIAL REPORT
II-2
purpose of that report is to describe the scope of our testing of internal control over financial reporting and compliance and the results of that testing, and not to provide an opinion on the internal control over financial reporting or on compliance. That report is an integral part of an audit performed in accordance with Government Auditing Standards and should be considered in assessing the results of our audit. U.S. generally accepted accounting principles require that the management’s discussion and analysis on pages II-3 through II-12, the Schedules of Funding Progress for Pension Trust Funds and Other Postemployment Benefits (OPEB) on pages II-70 through II-71 be presented to supplement the basic financial statements. Such information, although not a part of the basic financial statements, is required by the Governmental Accounting Standards Board, who considers it to be an essential part of financial reporting for placing the basic financial statements in an appropriate operational, economic, or historical context. We and the other auditors have applied certain limited procedures to the required supplementary information in accordance with U.S. generally accepted auditing standards, which consisted of inquiries of management about the methods of preparing the information and comparing the information for consistency with management’s responses to our inquiries, the basic financial statements, and other knowledge we obtained during our audit of the basic financial statements. We do not express an opinion or provide any assurance on the information because the limited procedures do not provide us with sufficient evidence to express an opinion or provide any assurance. Our audit was conducted for the purpose of forming opinions on the financial statements that collectively comprise the basic financial statements of the City of Boynton Beach, Florida, as a whole. The introductory section, the combining and individual fund financial statements and the statistical section are presented for purposes of additional analysis and are not a required part of the basic financial statements. The accompanying Schedule of Expenditures of Federal Awards is presented for purposes of additional analysis as required by U.S. Office of Management and Budget Circular A-133, Audits of States, Local Governments, and Non-Profit Organizations, and Chapter 10.550, Rules of the Auditor General, and is also not a required part of the basic financial statements. The combining and individual fund financial statements and the Schedule of Expenditures of Federal Awards are the responsibility of management and were derived from and directly related to the underlying accounting and other records used to prepare the financial statements. The information has been subjected to the auditing procedures applied by us and the other auditors in the audit of the financial statements and certain additional procedures, including comparing and reconciling such information directly to the underlying accounting and other records used to prepare the financial statements or to the financial statements themselves, and other additional procedures in accordance with U.S. generally accepted auditing standards. In our opinion, based on our audit and the reports of other auditors, the information is fairly stated in all material respects in relation to the financial statements as a whole. The introductory section and statistical section have not been subjected to the auditing procedures applied by us and the other auditors in the audit of the basic financial statements and, accordingly, we do not express an opinion or provide any assurance on them. The financial statements of the City of Boynton Beach, Florida, as of and for the year ended September 30, 2010, which are not presented with the accompanying financial statements, were audited by other auditors whose report thereon dated December 7, 2011, expressed unqualified opinions on the respective financial statements of the governmental activities, the business-type activities, each major fund, and the aggregate remaining fund information. Their audit was conducted for the purpose of forming opinions on the financial statements that collectively comprise the financial statements of the City of Boynton Beach, Florida, as a whole. The comparative figures for 2010 presented for individual major and nonmajor fund financial statements are presented for purposes of additional analysis and are not a required part of the 2011 financial statements. Such information is the responsibility of management and was derived from and relates directly to the 2010 financial statements. The report of the other auditors indicated that such information had been subjected to the auditing procedures applied by them and other auditors in their audit of the 2010 financial statements and certain additional procedures, including comparing and reconciling such information directly to the underlying accounting and other records used to prepare the 2010 financial statements or to the 2010 financial statements themselves, and other additional procedures in accordance with U.S. generally accepted auditing standards. In their opinion, the 2010 individual major and nonmajor fund financial statements were fairly stated in all material respects in relation to the 2010 basic financial statements from which they were derived.
December 10, 2012
II-2
THE CITY OF BOYNTON BEACH
FY 2011 COMPREHENSIVE ANNUAL FINANCIAL REPORT
MANAGEMENT’S DISCUSSION AND ANALYSIS
II-3
This discussion and analysis provides a narrative overview and introduction to the City’s financial position and results of operations as of and for the fiscal year ended September 30, 2011 organized under the following topics: Financial highlights (Page II-3), Discussion of the basic financial statements (Pages II-3 to II-6), Government-wide overall financial analysis (Pages II-6 to II-9), Discussion of major funds (Pages II-10 to II-11), Summary of General Fund budgetary results, (Page II-11), and Review of capital assets and debt administration (Pages II-11 to II-12). We conclude with a discussion of our future budgetary outlook and the impact of declining property values related to local ad valorem property taxes (Page II-12). FINANCIAL HIGHLIGHTS The City’s net assets (total assets less liabilities) at September 30, 2011 total $259,285,096 representing a $7,550,991
decrease in net assets when compared to $266,836,087 at September 30, 2010. For both years, approximately two-thirds of the net assets are attributable to our business-type activities (primarily our Water and Sewer System). Of the 2011 amount, the City has
o $158,675,196 invested in capital assets, net of related debt, o $ 30,815,363 restricted for capital improvements, revenue bond covenants and special projects, and o $ 69,794,537 unrestricted to meet our ongoing services to citizens and creditors.
No additional bonds were issued during the year. The City’s previously outstanding debt decreased by $5,170,174 during
the fiscal year. The City’s total fund balances (available financial resources) of all governmental funds at September 30, 2011 total
$33,552,797 in comparison with $39,904,154 in the prior year. The 2011 fund balances of individual governmental funds are: o $10,708,544 - General Fund ($6,514,230 is committed for emergencies) o $ 6,087,017 - Capital Project Funds (committed or assigned for capital improvements) o $ 5,131,833 - Debt Service Funds (accumulated to repay principal and interest on outstanding debt) o $11,625,403 - Special Revenue Funds (restricted, committed, assigned or unassigned for specific purposes)
The General Fund includes $6,514,230 committed for emergencies according to a City Ordinance requiring 10% of the
subsequent year’s General Fund expenditures be set aside for emergencies. Other than $208,867 representing prepaid items and nonspendable in the future, along with $110,000 assigned funds, the remaining $3,875,447 unassigned fund balance of the General Fund is available (a) to mitigate future revenue shortfalls and unanticipated expenditures, (b) to stabilize tax rates, and (c) to provide for working capital to minimize short-term borrowing for operations.
The $3,875,447 unassigned General Fund balance represents approximately 5% of total General Fund expenditures. DISCUSSION OF THE BASIC FINANCIAL STATEMENTS The City’s basic financial statements comprise three components:
1. Government-Wide Financial Statements, 2. Fund Financial Statements, and 3. Notes to the Financial Statements.
II-3
THE CITY OF BOYNTON BEACH
FY 2011 COMPREHENSIVE ANNUAL FINANCIAL REPORT
MANAGEMENT’S DISCUSSION AND ANALYSIS (Continued)
II-4
Government-Wide Financial Statements - The government-wide financial statements provide readers with a broad overview of the City’s finances for both its governmental activities and business-type activities. They include two statements:
Statement of Net Assets Statement of Activities
The statements consolidate all the City’s governmental and proprietary funds similar to those of a private-sector business. The above statements exclude pension funds held in trust for others since these funds cannot be used for the City’s programs. However, they are included in the fund financial statements since the City is accountable for those resources. The Statement of Net Assets presents information on all of the City’s assets owned and liabilities owed, with the difference between the two reported as net assets. Over time, increases or decreases in net assets may serve as a useful indicator of whether the financial position of the City is improving or weakening. The Statement of Activities presents information showing how the City’s net assets changed during the most recent fiscal year. The City reports all changes in net assets as soon as the underlying event giving rise to the change occurs, regardless of
the timing of related cash flows. Thus, revenues and expenses currently reported in this statement for some items will only result in cash flows in future fiscal periods (e.g., uncollected taxes and earned but unused vacation leave). Both of the above government-wide financial statements distinguish between functions of the City that are either:
Governmental Activities – principally supported by taxes and intergovernmental (grant) revenues or Business-Type Activities – intended to recover all or a major part of their costs through user fees and charges.
The governmental activities of the City include general government activities, public safety, public works, economic environment, and culture and recreational programs. The business-type activities of the City primarily include water and sewer, sanitation, recreational (golf course) facilities and the municipal public transportation program. Both government-wide financial statements include not only the City itself, but also a legally separate Community Redevelopment Agency (the CRA), that is a “component unit” for which the City is financially accountable. The City reports the financial information for the CRA within the governmental funds and activities of the City. See Note 1 of the Notes to the Financial Statements. The government-wide financial statements can be found on pages II-13 through II-15 of this report. Fund Financial Statements - A fund is a grouping of related accounts established to maintain control over resources segregated for specific activities or objectives. The City, like other state and local governments, uses fund accounting to ensure and demonstrate compliance with finance-related legal requirements. The City groups its funds into three categories:
Governmental Funds Proprietary Funds, and Fiduciary (Pension) Funds.
Governmental Funds account for essentially the same functions reported as governmental activities in the government-wide financial statements. However, unlike the government-wide financial statements, governmental fund financial statements focus on:
Near-term inflows and outflows of spendable financial resources, as well as on Balances of spendable financial resources available at the end of the fiscal year.
Such information may be useful in evaluating the City’s near-term financing requirements.
II-4
THE CITY OF BOYNTON BEACH
FY 2011 COMPREHENSIVE ANNUAL FINANCIAL REPORT
MANAGEMENT’S DISCUSSION AND ANALYSIS (Continued)
II-5
Because the focus of governmental funds is narrower than that of the government-wide financial statements, it is useful to compare the information presented for governmental funds with similar information presented for governmental activities in the government-wide financial statements. By doing so, readers may better understand the long-term impact of the government’s near-term financing decisions. Both the governmental fund balance sheet and the governmental fund statement of revenues, expenditures, and changes in fund balances provide a reconciliation to facilitate this comparison between governmental funds and governmental activities. The City maintains a number of individual governmental funds. Financial information is presented separately for each “major fund” of the City in a Balance Sheet and a Statement of Revenues, Expenditures, and Changes in Fund Balances. The City’s major governmental funds are defined as the:
General Fund, Boynton Beach Community Redevelopment Agency (CRA) Special Revenue Fund, and Public Service Tax Debt Service Fund
Financial information for non-major funds is combined into a single, aggregated presentation. Individual fund data for each of these governmental funds is provided in the form of combining statements elsewhere in this report. The City adopts an annual appropriated budget for certain governmental funds. A budgetary comparison statement has been provided for the General Fund and other budgeted funds to demonstrate compliance with this budget. The basic governmental fund financial statements can be found on pages II-16 through II-23 of this report. Proprietary Funds include enterprise funds and internal service funds providing the same type of information as the government-wide financial statements, only in more detail. Enterprise funds account for business-type activities that charge fees to customers for the use of specific goods or services. The basis of accounting of the financial statements is similar to the basis used to prepare the government-wide financial statements. The City uses enterprise funds to account for its water and sewer utility system, the sanitation operations, the municipal golf course and municipal public transportation program. Internal service funds are an accounting device used to accumulate and allocate costs internally among the City’s various functions that serve only City departments. The City uses internal service funds to account for its fleet of vehicles, its self-insurance activities, and its warehouse operations. Because these services predominantly benefit governmental rather than business-type functions, they have been included within the governmental activities in the government-wide financial statements. The proprietary fund financial statements provide separate information for the water and sewer utility system and for the sanitation operations, both of which are considered to be major funds of the City. Conversely, the three internal service funds are combined into a single, aggregated presentation in the proprietary fund financial statements. Individual fund data for the major and non-major enterprise funds and the individual internal service funds are provided in the form of combining
statements elsewhere in this report. The City’s proprietary fund financial statements can be found on pages II-24 through II-29 of this report. Fiduciary Funds account for resources held for the benefit of parties outside the City that represent separate pension plans for general employees, police officers and firefighters. The City does not include fiduciary funds in the government-wide financial statements because the resources of those funds are not available to support the City’s own programs. Instead they are held for the benefit of employees upon retirement. The accounting used for fiduciary funds is much like that used for proprietary funds. The City’s Fiduciary Fund financial statements can be found on pages II-30 and II-31.
II-5
THE CITY OF BOYNTON BEACH
FY 2011 COMPREHENSIVE ANNUAL FINANCIAL REPORT
MANAGEMENT’S DISCUSSION AND ANALYSIS (Continued)
II-6
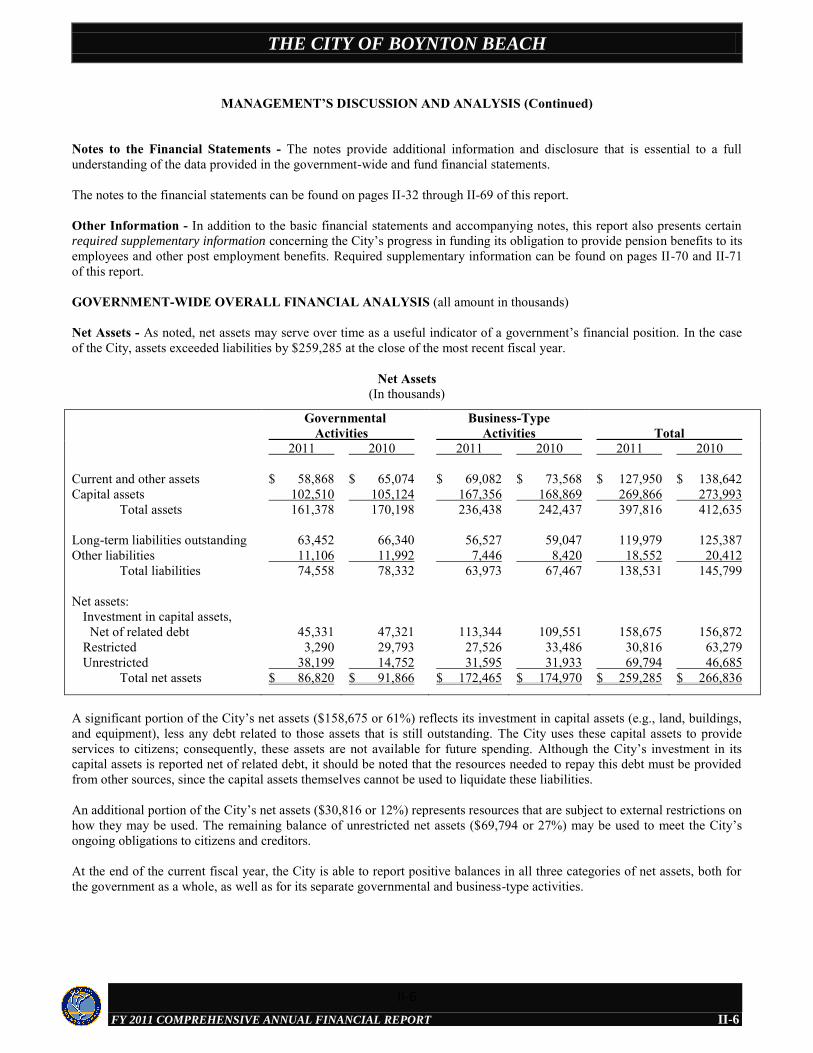
Notes to the Financial Statements - The notes provide additional information and disclosure that is essential to a full understanding of the data provided in the government-wide and fund financial statements. The notes to the financial statements can be found on pages II-32 through II-69 of this report. Other Information - In addition to the basic financial statements and accompanying notes, this report also presents certain required supplementary information concerning the City’s progress in funding its obligation to provide pension benefits to its employees and other post employment benefits. Required supplementary information can be found on pages II-70 and II-71 of this report. GOVERNMENT-WIDE OVERALL FINANCIAL ANALYSIS (all amount in thousands) Net Assets - As noted, net assets may serve over time as a useful indicator of a government’s financial position. In the case of the City, assets exceeded liabilities by $259,285 at the close of the most recent fiscal year.
Net Assets (In thousands)
Governmental Activities
Business-Type Activities
Total
2011 2010 2011 2010 2011 2010 Current and other assets Capital assets Total assets Long-term liabilities outstanding Other liabilities Total liabilities Net assets: Investment in capital assets, Net of related debt Restricted Unrestricted Total net assets
$ 58,868 102,510 161,378 63,452 11,106 74,558 45,331 3,290 38,199 $ 86,820
$ 65,074 105,124 170,198 66,340 11,992 78,332 47,321 29,793 14,752 $ 91,866
$ 69,082 167,356 236,438 56,527 7,446 63,973 113,344 27,526 31,595 $ 172,465
$ 73,568 168,869 242,437 59,047 8,420 67,467 109,551 33,486 31,933 $ 174,970
$ 127,950 269,866 397,816 119,979 18,552 138,531 158,675 30,816 69,794 $ 259,285
$ 138,642 273,993 412,635 125,387 20,412 145,799 156,872 63,279 46,685 $ 266,836
A significant portion of the City’s net assets ($158,675 or 61%) reflects its investment in capital assets (e.g., land, buildings, and equipment), less any debt related to those assets that is still outstanding. The City uses these capital assets to provide services to citizens; consequently, these assets are not available for future spending. Although the City’s investment in its capital assets is reported net of related debt, it should be noted that the resources needed to repay this debt must be provided from other sources, since the capital assets themselves cannot be used to liquidate these liabilities. An additional portion of the City’s net assets ($30,816 or 12%) represents resources that are subject to external restrictions on how they may be used. The remaining balance of unrestricted net assets ($69,794 or 27%) may be used to meet the City’s ongoing obligations to citizens and creditors. At the end of the current fiscal year, the City is able to report positive balances in all three categories of net assets, both for the government as a whole, as well as for its separate governmental and business-type activities.
II-6
THE CITY OF BOYNTON BEACH
FY 2011 COMPREHENSIVE ANNUAL FINANCIAL REPORT
MANAGEMENT’S DISCUSSION AND ANALYSIS (Continued)
II-7
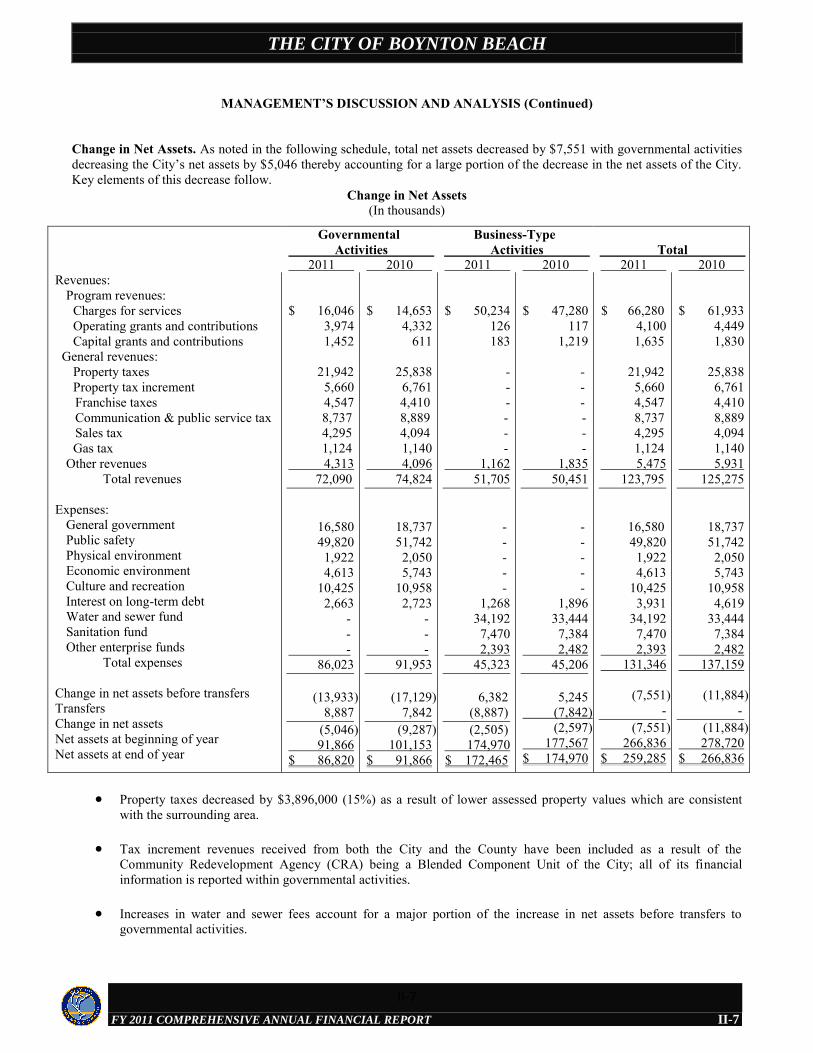
Change in Net Assets. As noted in the following schedule, total net assets decreased by $7,551 with governmental activities decreasing the City’s net assets by $5,046 thereby accounting for a large portion of the decrease in the net assets of the City. Key elements of this decrease follow.
Change in Net Assets (In thousands)
Governmental Activities
Business-Type Activities
Total
2011 2010 2011 2010 2011 2010 Revenues: Program revenues: Charges for services Operating grants and contributions Capital grants and contributions General revenues: Property taxes Property tax increment Franchise taxes Communication & public service tax Sales tax Gas tax Other revenues Total revenues Expenses: General government Public safety Physical environment Economic environment Culture and recreation Interest on long-term debt Water and sewer fund Sanitation fund Other enterprise funds Total expenses Change in net assets before transfers Transfers Change in net assets Net assets at beginning of year Net assets at end of year
$ 16,046 3,974 1,452 21,942 5,660 4,547
8,737 4,295 1,124
4,313 72,090
16,580 49,820 1,922 4,613 10,425 2,663 - - - 86,023 (13,933) 8,887 (5,046) 91,866 $ 86,820
$ 14,653 4,332 611 25,838 6,761
4,410 8,889 4,094
1,140 4,096 74,824 18,737 51,742 2,050 5,743 10,958 2,723 - - - 91,953
(17,129) 7,842 (9,287) 101,153 $ 91,866
$ 50,234 126 183 - - -
- - -
1,162 51,705 - - - - - 1,268 34,192 7,470 2,393 45,323
6,382 (8,887) (2,505)
174,970 $ 172,465
$ 47,280 117 1,219 - - -
- -
- 1,835 50,451 - - - - - 1,896 33,444 7,384 2,482 45,206 5,245 (7,842) (2,597) 177,567 $ 174,970
$ 66,280 4,100
1,635
21,942 5,660 4,547 8,737 4,295 1,124
5,475 123,795
16,580 49,820 1,922 4,613 10,425 3,931 34,192 7,470 2,393 131,346 (7,551) - (7,551) 266,836 $ 259,285
$ 61,933 4,449 1,830 25,838 6,761 4,410 8,889 4,094 1,140 5,931 125,275 18,737 51,742 2,050 5,743 10,958 4,619 33,444 7,384 2,482 137,159 (11,884)
- (11,884) 278,720 $ 266,836
Property taxes decreased by $3,896,000 (15%) as a result of lower assessed property values which are consistent
with the surrounding area.
Tax increment revenues received from both the City and the County have been included as a result of the Community Redevelopment Agency (CRA) being a Blended Component Unit of the City; all of its financial information is reported within governmental activities.
Increases in water and sewer fees account for a major portion of the increase in net assets before transfers to governmental activities.
II-7
THE CITY OF BOYNTON BEACH
FY 2011 COMPREHENSIVE ANNUAL FINANCIAL REPORT
MANAGEMENT’S DISCUSSION AND ANALYSIS (Continued)
II-8
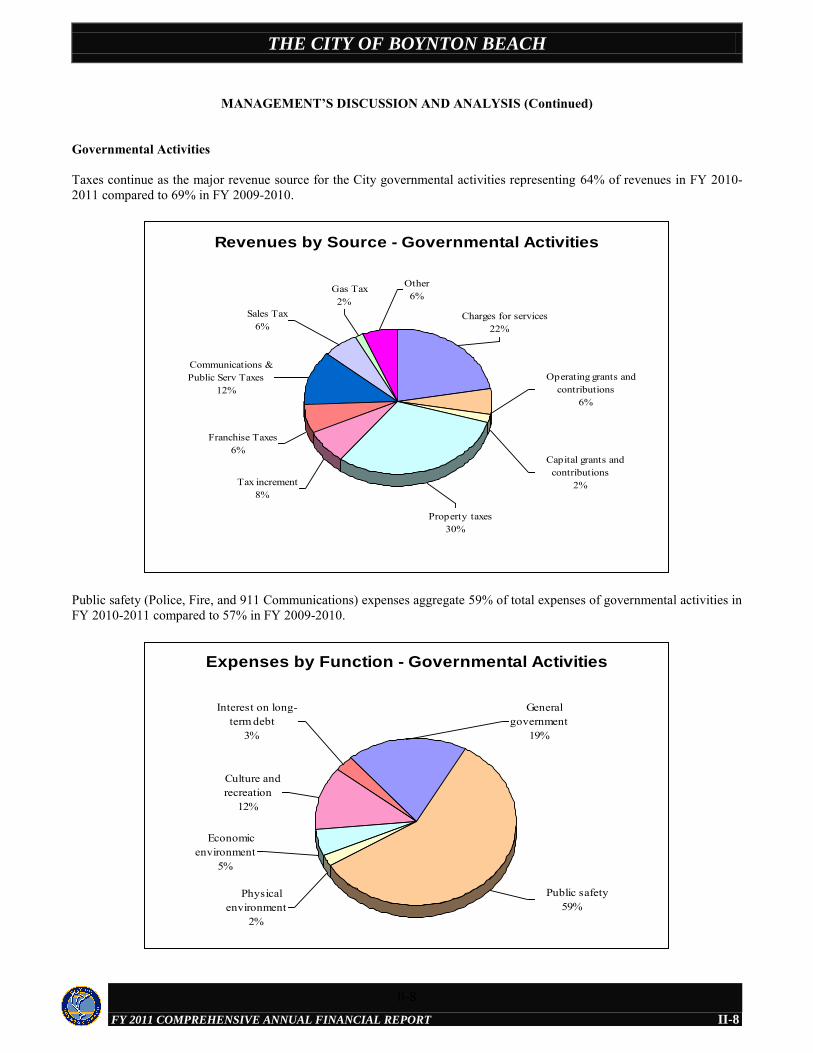
Governmental Activities Taxes continue as the major revenue source for the City governmental activities representing 64% of revenues in FY 2010-2011 compared to 69% in FY 2009-2010.
Public safety (Police, Fire, and 911 Communications) expenses aggregate 59% of total expenses of governmental activities in FY 2010-2011 compared to 57% in FY 2009-2010.
Revenues by Source - Governmental Activities
Sales Tax6%
Gas Tax2%
Other6%
Charges for services22%
Capital grants and contributions
2%
Operating grants and contributions
6%
Property taxes30%
Tax increment8%
Franchise Taxes6%
Communications & Public Serv Taxes
12%
Expenses by Function - Governmental Activities
Public safety59%
Culture and recreation
12%
Interest on long-term debt
3%
General government
19%
Physical environment
2%
Economic environment
5%
II-8
THE CITY OF BOYNTON BEACH
FY 2011 COMPREHENSIVE ANNUAL FINANCIAL REPORT
MANAGEMENT’S DISCUSSION AND ANALYSIS (Continued)
II-9
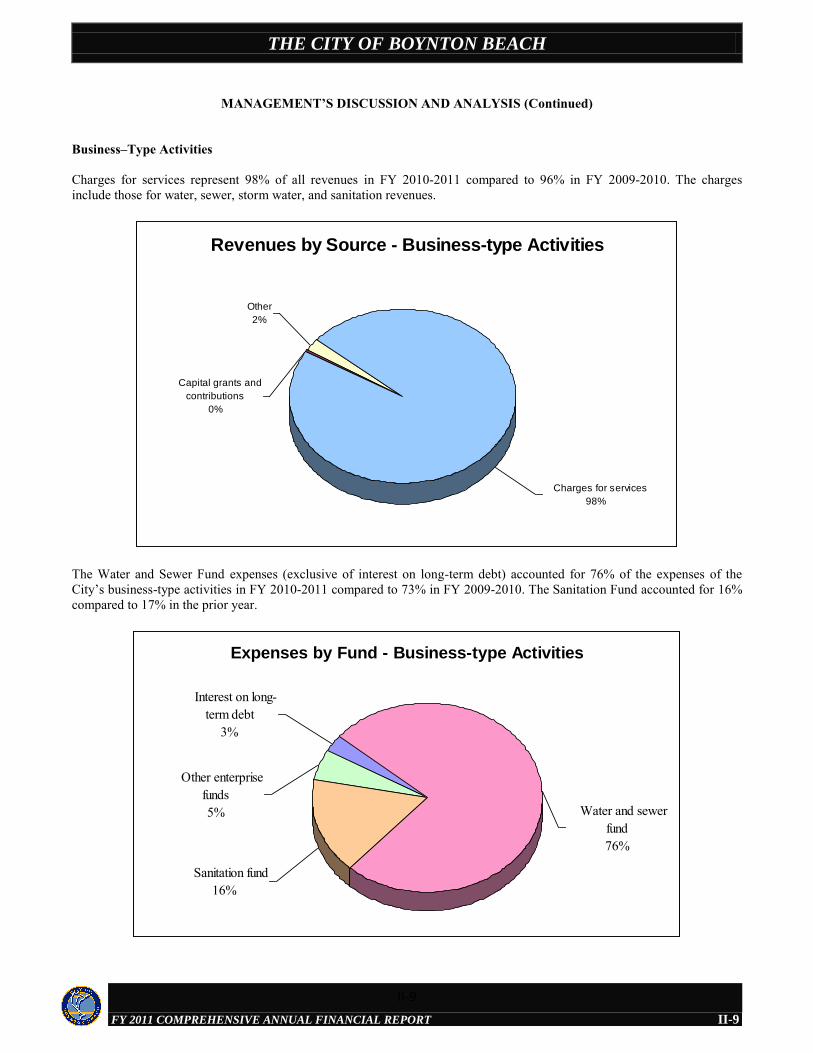
Business–Type Activities Charges for services represent 98% of all revenues in FY 2010-2011 compared to 96% in FY 2009-2010. The charges include those for water, sewer, storm water, and sanitation revenues.
The Water and Sewer Fund expenses (exclusive of interest on long-term debt) accounted for 76% of the expenses of the City’s business-type activities in FY 2010-2011 compared to 73% in FY 2009-2010. The Sanitation Fund accounted for 16% compared to 17% in the prior year.
Revenues by Source - Business-type Activities
Other
2%
Charges for services
98%
Capital grants and
contributions
0%
Expenses by Fund - Business-type Activities
Water and sewer fund76%
Other enterprise funds5%
Interest on long-term debt
3%
Sanitation fund16%
II-9
THE CITY OF BOYNTON BEACH
FY 2011 COMPREHENSIVE ANNUAL FINANCIAL REPORT
MANAGEMENT’S DISCUSSION AND ANALYSIS (Continued)
II-10
DISCUSSION OF MAJOR FUNDS The City uses fund accounting to ensure and demonstrate compliance with finance-related legal requirements. According to U.S. generally accepted accounting principles (GAAP), the City identifies and separately reports certain major governmental funds and major proprietary funds. The following paragraphs discuss the financial highlights of these selected major funds. Governmental Funds - The identified major governmental funds discussed are –
General Fund Boynton Beach Community Redevelopment Agency (CRA) Special Revenue Fund Public Service Tax Debt Service Fund
The City’s governmental funds focus on providing information on near-term inflows, outflows, and balances of spendable resources. Such information is useful in assessing the City’s financing requirements. In particular, unassigned fund balance may serve as a useful measure of a government’s net resources available for spending at the end of the fiscal year. The General Fund is the primary operating fund accounting for all unrestricted operating expenditures of the City.
Revenues plus transfers from other funds aggregated $71.9 million while expenditures plus net transfers to other funds totaled $69.6 million resulting in a $2.3 million increase in fund balance for the year. The ending fund balance of $10.7 million includes $6.5 million committed by City Ordinance for emergencies and $110,000 assigned to the subsequent year’s budget. The remaining $3.9 million, representing approximately 5% of annual General Fund expenditures, is unassigned and available (a) to mitigate future revenue shortfalls and unanticipated expenditures, (b) to stabilize tax rates, and (c) to provide for working capital to minimize short-term borrowing for operations.
General Fund financial statements are on pages II-75 to II-76.
The Boynton Beach CRA Special Revenue Fund accounts for all of the CRA’s general operations. Major revenues for
the year included property tax increment revenue - $5.7 million and charges for services - $1.3 million. Expenditures included $2.5 million for general operations. At the end of 2011, $3.4 million of fund balance was committed and assigned for future operations and redevelopment projects while $0.6 million was unassigned.
The CRA Special Revenue Fund financial statements are on pages II-77 to II-78.
The Public Service Tax Debt Service Fund accounts for all the receipt of pledged revenues that are used for the payment
of principal and interest and fiscal charges on the City’s revenue bonds. Major revenues for the year were communications and public service taxes - $8.7 million. Expenditures were $2.6 million for bond principal and interest payments, and transfers to the General Fund of $6.1 million for communications and public service taxes received in excess of the debt service requirements for the year. At the end of 2011, the $2.0 million fund balance was available to pay future debt service.
The Public Service Tax Debt Service Fund financial statements are on pages II-79 to II-80. Proprietary Funds - The identified major proprietary funds are:
Water and Sewer Fund Sanitation Fund
The City’s major proprietary funds provide the same type of information found in the government-wide financial statements, but in more detail. Unrestricted net assets of the City’s major proprietary funds at September 30, 2011 were:
$39,493,495 – Water and Sewer Fund $ 4,384,183 – Sanitation Fund
II-10
THE CITY OF BOYNTON BEACH
FY 2011 COMPREHENSIVE ANNUAL FINANCIAL REPORT
MANAGEMENT’S DISCUSSION AND ANALYSIS (Continued)
II-11
The above total unrestricted net assets compares to $37,850,894 for the Water and Sewer Fund and $4,525,321 for the Sanitation Fund as of September 30, 2011. Other factors concerning the finances of these funds have already been addressed in the discussion of the City’s business-type activities. The Water and Sewer Fund financial statements are on pages II-85 to II-87. The Sanitation Fund financial statements are on pages II-88 to II-90. SUMMARY OF GENERAL FUND BUDGETARY RESULTS The original General Fund budget appropriation for expenditures and transfers to other funds approved for FY 2010-2011 was $68,550,846. There was a mid-year budget reallocation from public safety expenditures to transfers, although the final appropriation for FY 2010-2011 of $68,550,846 did not change in total. Total expenditures alone of $67,279,954 for the year were $545,013 less than the final appropriation for expenditures. Departmental details are reflected on page II-20. REVIEW OF CAPITAL ASSETS AND DEBT ADMINISTRATION Capital Assets - The City’s investment in capital assets (including intangible assets) for its governmental and business-type activities as of September 30, 2011, amounts to $272,775,241 (net of accumulated depreciation). This investment in capital assets includes land, buildings, improvements, equipment, park facilities, and streets. The total net decrease in the City’s investment in capital assets for the current fiscal year was $1,218,118 or 0.4% (a 2.5% decrease for governmental activities and a 1.0% increase for business-type activities).
Capital Assets - Net of Depreciation (In thousands)
Governmental Activities
Business-Type Activities
Total
2011 2010 2011 2010 2011 2010 Land Intangible assets Building and improvements Equipment and vehicles Utility lines and wells Infrastructure Construction in progress Total
$ 40,840 - 42,607 10,993 - 6,249 1,821 $ 102,510
$ 41,686 - 41,305 14,046 - 7,224 862 $ 105,123
$ 5,132 2,910 41,668 5,446 86,944 - 28,165 $ 170,265
$ 5,132 2,910 43,343 6,099 83,739 - 27,647 $ 168,870
$ 45,972 2,910 84,275 16,439 86,944 6,249 29,986 $ 272,775
$ 46,818 2,910 84,648 20,145 83,739 7,224 28,509 $ 273,993
Additional information on the City’s capital assets can be found in Note 4 on pages II-51 to II-52. Long-Term Liabilities - At the end of the current fiscal year, the City had total debt outstanding of $113,698,713. Of this amount, $1,308,713 is a general obligation note payable by the CRA. The remainder of the debt represents revenue bonds of $112,390,000 secured solely by specified revenue sources. Amounts stated below are at par value.
Bonded Debt and Notes Payable (in thousands)
Governmental Activities
Business-Type Activities
Total
2011 2010 2011 2010 2011 2010 Revenue bonds Notes payable Total bonds and notes
$ 54,665 1,309 $ 55,974
$ 56,885 1,712 $ 58,597
$ 57,725 - $ 57,725
$ 60,315 - $ 60,315
$ 112,390 1,309 $ 113,699
$ 117,200 1,712 $ 118,912
II-11
THE CITY OF BOYNTON BEACH
FY 2011 COMPREHENSIVE ANNUAL FINANCIAL REPORT
MANAGEMENT’S DISCUSSION AND ANALYSIS (Continued)
II-12
The City’s bonded debt and note payable decreased by $5,213,120, or 4.4% during the current year. Additional information on the City’s long-term liabilities can be found in Note 4 on pages II-53 to II-59. FUTURE BUDGETARY OUTLOOK The City experienced the following economic factors in developing the 2011/2012 fiscal year budget. Continuing decline in housing prices resulting in an overall 3% decline in taxable values for fiscal year 2011/12. Taxable values are expected to decline slightly further for fiscal year 2012/13 and then level off or a slight increase
thereafter. A 6.3% ad valorem tax rate increase to 7.1941 mills to offset the decline in assessed valuations. This also required a
$110,000 appropriation of the available unassigned fund balance for spending in the 2011/2012 fiscal year budget. Interest rates are expected to continue their decline enabling refunding debt for a portion of outstanding Utility and
Community Redevelopment Agency bonds. Adoption of a $65,142,275 General Fund budget for the 2011/2012 fiscal year which was a reduction of 5% from the
2010/11 fiscal year. Salary costs were reduced with the elimination of 65 positions city-wide and a continued pay freeze. This was partially
offset with expected increases in health insurance premiums and pension costs paid by the City. New water and sewer rates were adopted through the 2015/16 fiscal year with an annual average increase of 3%. Requests for Information This financial report is designed to provide a general overview of the City’s finances for all those with an interest in the government’s finances. Questions or requests for additional information should be addressed to: Director of Financial Services, 100 East Boynton Beach Boulevard, Boynton Beach, FL 33435, (561) 742-6310. E. Barrett (Barry) Atwood, Sr., CPA Director of Financial Services Tim W. Howard Deputy Director of Financial Services
II-12
THE CITY OF BOYNTON BEACH
FY 2011 COMPREHENSIVE ANNUAL FINANCIAL REPORT
Basic Financial Statements
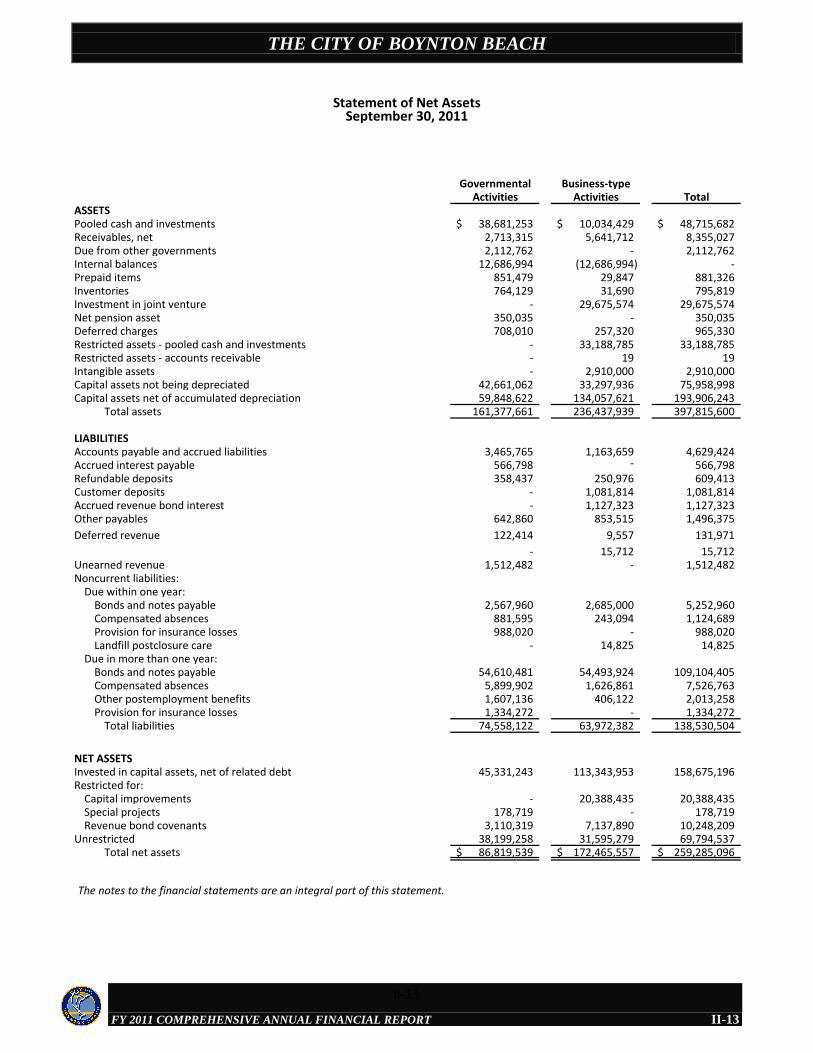
THE CITY OF BOYNTON BEACH
FY 2011 COMPREHENSIVE ANNUAL FINANCIAL REPORT
Governmental Business-typeActivities Activities Total
ASSETSPooled cash and investments 38,681,253$ 10,034,429$ 48,715,682$ Receivables, net 2,713,315 5,641,712 8,355,027 Due from other governments 2,112,762 - 2,112,762 Internal balances 12,686,994 (12,686,994) - Prepaid items 851,479 29,847 881,326 Inventories 764,129 31,690 795,819 Investment in joint venture - 29,675,574 29,675,574 Net pension asset 350,035 - 350,035 Deferred charges 708,010 257,320 965,330 Restricted assets - pooled cash and investments - 33,188,785 33,188,785 Restricted assets - accounts receivable - 19 19 Intangible assets - 2,910,000 2,910,000 Capital assets not being depreciated 42,661,062 33,297,936 75,958,998 Capital assets net of accumulated depreciation 59,848,622 134,057,621 193,906,243
Total assets 161,377,661 236,437,939 397,815,600
LIABILITIESAccounts payable and accrued liabilities 3,465,765 1,163,659 4,629,424 Accrued interest payable 566,798 - 566,798 Refundable deposits 358,437 250,976 609,413 Customer deposits - 1,081,814 1,081,814 Accrued revenue bond interest - 1,127,323 1,127,323 Other payables 642,860 853,515 1,496,375
Deferred revenue 122,414 9,557 131,971
- 15,712 15,712 Unearned revenue 1,512,482 - 1,512,482 Noncurrent liabilities:
Due within one year:Bonds and notes payable 2,567,960 2,685,000 5,252,960 Compensated absences 881,595 243,094 1,124,689 Provision for insurance losses 988,020 - 988,020 Landfill postclosure care - 14,825 14,825
Due in more than one year:Bonds and notes payable 54,610,481 54,493,924 109,104,405 Compensated absences 5,899,902 1,626,861 7,526,763 Other postemployment benefits 1,607,136 406,122 2,013,258 Provision for insurance losses 1,334,272 - 1,334,272
Total liabilities 74,558,122 63,972,382 138,530,504
NET ASSETSInvested in capital assets, net of related debt 45,331,243 113,343,953 158,675,196 Restricted for:
Capital improvements - 20,388,435 20,388,435 Special projects 178,719 - 178,719 Revenue bond covenants 3,110,319 7,137,890 10,248,209
Unrestricted 38,199,258 31,595,279 69,794,537 Total net assets 86,819,539$ 172,465,557$ 259,285,096$
Statement of Net AssetsSeptember 30, 2011
The notes to the financial statements are an integral part of this statement.
II-13
II-13
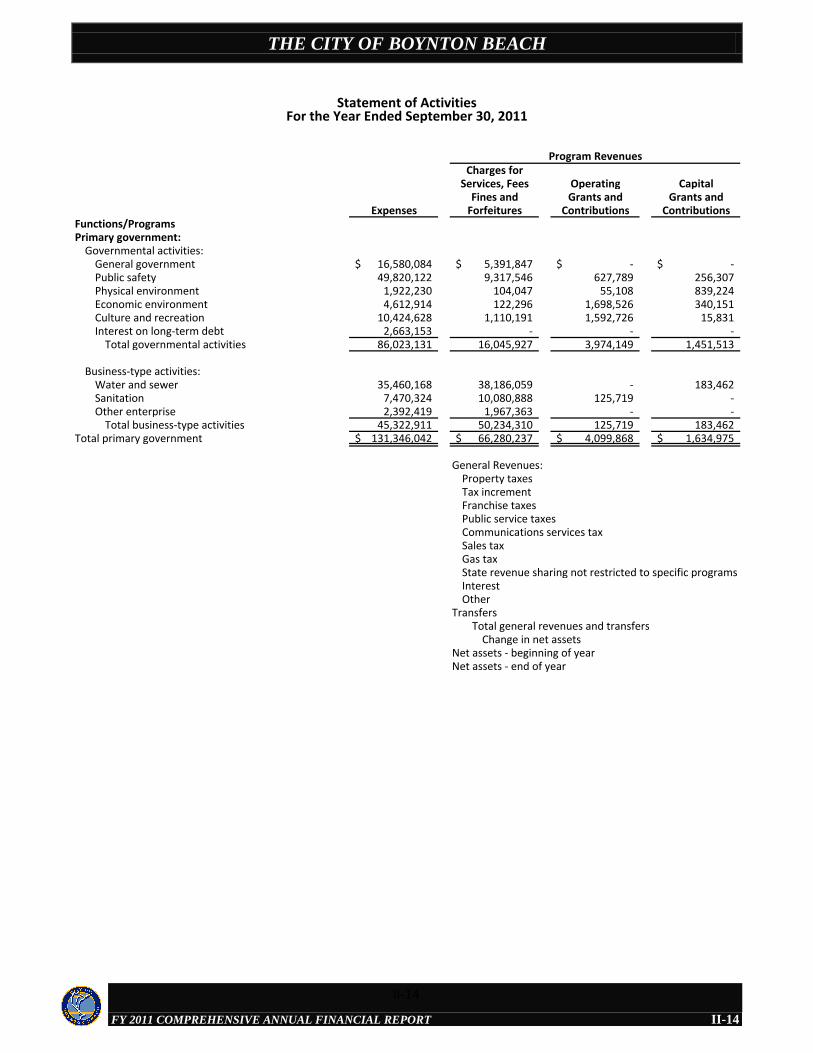
THE CITY OF BOYNTON BEACH
FY 2011 COMPREHENSIVE ANNUAL FINANCIAL REPORT
Charges forServices, Fees Operating Capital
Fines and Grants and Grants andExpenses Forfeitures Contributions Contributions
Functions/ProgramsPrimary government:
Governmental activities:General government 16,580,084$ 5,391,847$ -$ -$ Public safety 49,820,122 9,317,546 627,789 256,307 Physical environment 1,922,230 104,047 55,108 839,224 Economic environment 4,612,914 122,296 1,698,526 340,151 Culture and recreation 10,424,628 1,110,191 1,592,726 15,831 Interest on long-term debt 2,663,153 - - -
Total governmental activities 86,023,131 16,045,927 3,974,149 1,451,513
Business-type activities:Water and sewer 35,460,168 38,186,059 - 183,462 Sanitation 7,470,324 10,080,888 125,719 - Other enterprise 2,392,419 1,967,363 - -
Total business-type activities 45,322,911 50,234,310 125,719 183,462 Total primary government 131,346,042$ 66,280,237$ 4,099,868$ 1,634,975$
General Revenues:Property taxesTax incrementFranchise taxesPublic service taxesCommunications services taxSales taxGas taxState revenue sharing not restricted to specific programsInterestOther
TransfersTotal general revenues and transfers
Change in net assetsNet assets - beginning of yearNet assets - end of year
Statement of ActivitiesFor the Year Ended September 30, 2011
Program Revenues
II-14
II-14
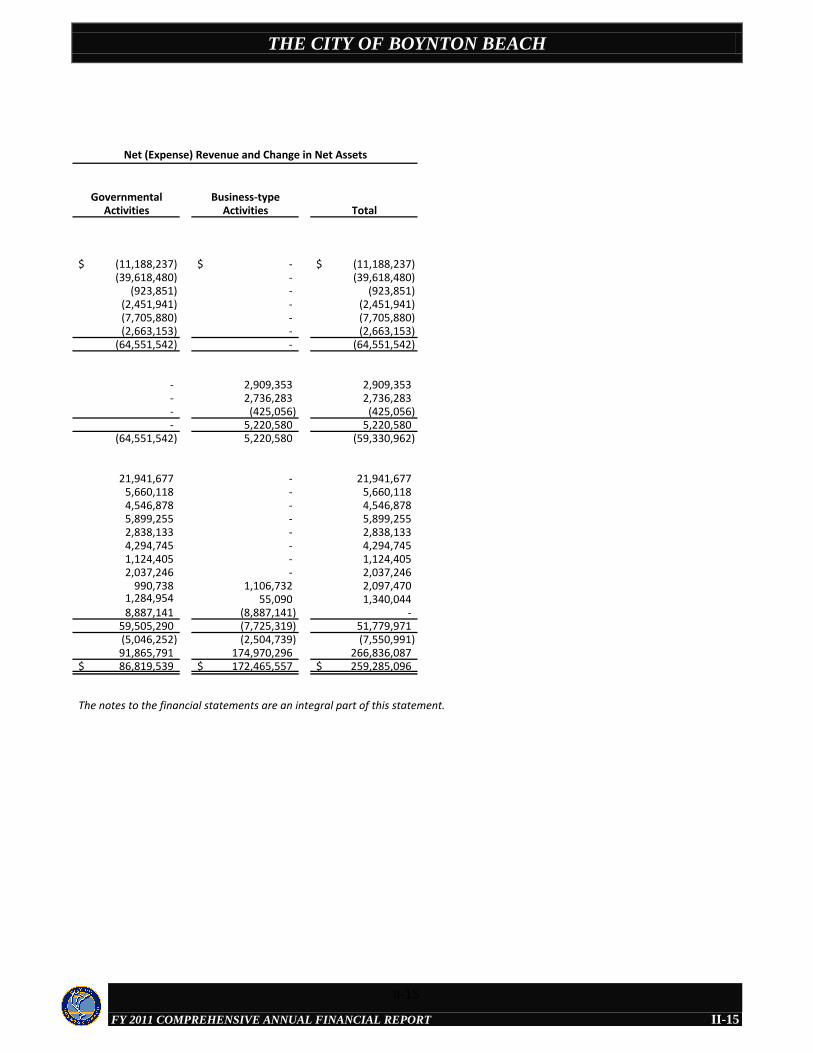
THE CITY OF BOYNTON BEACH
FY 2011 COMPREHENSIVE ANNUAL FINANCIAL REPORT
Governmental Business-typeActivities Activities Total
(11,188,237)$ -$ (11,188,237)$ (39,618,480) - (39,618,480)
(923,851) - (923,851) (2,451,941) - (2,451,941) (7,705,880) - (7,705,880) (2,663,153) - (2,663,153)
(64,551,542) - (64,551,542)
- 2,909,353 2,909,353 - 2,736,283 2,736,283 - (425,056) (425,056) - 5,220,580 5,220,580
(64,551,542) 5,220,580 (59,330,962)
21,941,677 - 21,941,677 5,660,118 - 5,660,118 4,546,878 - 4,546,878 5,899,255 - 5,899,255 2,838,133 - 2,838,133 4,294,745 - 4,294,745 1,124,405 - 1,124,405 2,037,246 - 2,037,246
990,738 1,106,732 2,097,470 1,284,954 55,090 1,340,044 8,887,141 (8,887,141) -
59,505,290 (7,725,319) 51,779,971 (5,046,252) (2,504,739) (7,550,991) 91,865,791 174,970,296 266,836,08786,819,539$ 172,465,557$ 259,285,096$
Net (Expense) Revenue and Change in Net Assets
The notes to the financial statements are an integral part of this statement.
II-15
II-15
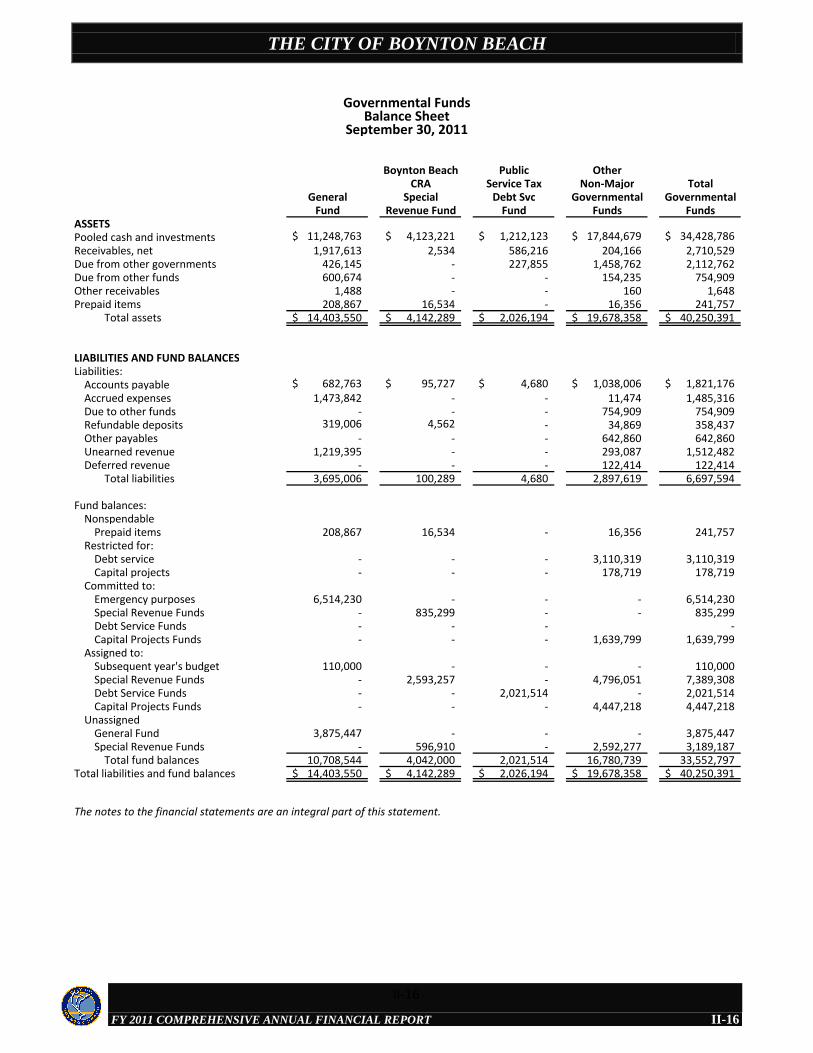
THE CITY OF BOYNTON BEACH
FY 2011 COMPREHENSIVE ANNUAL FINANCIAL REPORT
Boynton Beach Public OtherCRA Service Tax Non-Major Total
General Special Debt Svc Governmental GovernmentalFund Revenue Fund Fund Funds Funds
ASSETSPooled cash and investments 11,248,763$ 4,123,221$ 1,212,123$ 17,844,679$ 34,428,786$ Receivables, net 1,917,613 2,534 586,216 204,166 2,710,529 Due from other governments 426,145 - 227,855 1,458,762 2,112,762 Due from other funds 600,674 - - 154,235 754,909 Other receivables 1,488 - - 160 1,648 Prepaid items 208,867 16,534 - 16,356 241,757
Total assets 14,403,550$ 4,142,289$ 2,026,194$ 19,678,358$ 40,250,391$
LIABILITIES AND FUND BALANCESLiabilities:
Accounts payable 682,763$ 95,727$ 4,680$ 1,038,006$ 1,821,176$ Accrued expenses 1,473,842 - - 11,474 1,485,316 Due to other funds - - - 754,909 754,909 Refundable deposits 319,006 4,562 - 34,869 358,437 Other payables - - - 642,860 642,860 Unearned revenue 1,219,395 - - 293,087 1,512,482 Deferred revenue - - - 122,414 122,414
Total liabilities 3,695,006 100,289 4,680 2,897,619 6,697,594
Fund balances:Nonspendable
Prepaid items 208,867 16,534 - 16,356 241,757 Restricted for:
Debt service - - - 3,110,319 3,110,319 Capital projects - - - 178,719 178,719
Committed to:Emergency purposes 6,514,230 - - - 6,514,230 Special Revenue Funds - 835,299 - - 835,299 Debt Service Funds - - - - Capital Projects Funds - - - 1,639,799 1,639,799
Assigned to:Subsequent year's budget 110,000 - - - 110,000 Special Revenue Funds - 2,593,257 - 4,796,051 7,389,308 Debt Service Funds - - 2,021,514 - 2,021,514 Capital Projects Funds - - - 4,447,218 4,447,218
UnassignedGeneral Fund 3,875,447 - - - 3,875,447 Special Revenue Funds - 596,910 - 2,592,277 3,189,187
Total fund balances 10,708,544 4,042,000 2,021,514 16,780,739 33,552,797 Total liabilities and fund balances 14,403,550$ 4,142,289$ 2,026,194$ 19,678,358$ 40,250,391$
The notes to the financial statements are an integral part of this statement.
Governmental Funds
September 30, 2011Balance Sheet
II-16
II-16
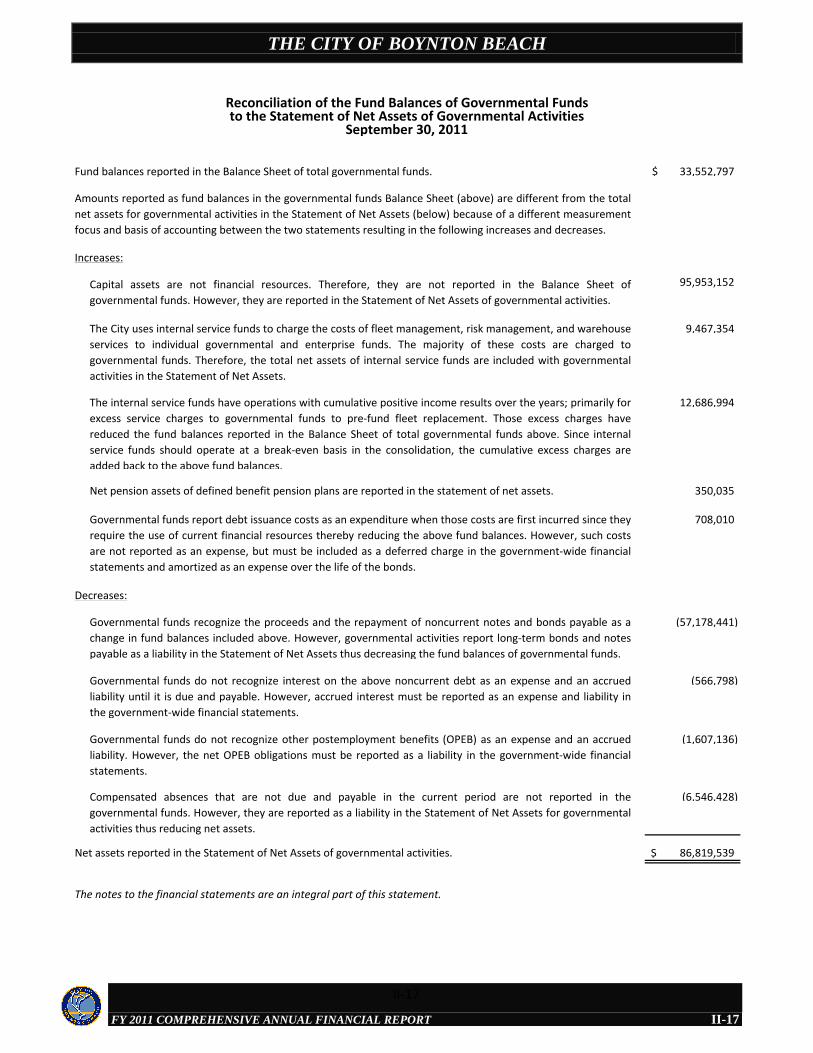
THE CITY OF BOYNTON BEACH
FY 2011 COMPREHENSIVE ANNUAL FINANCIAL REPORT
33,552,797$
95,953,152
9,467,354
12,686,994
Net pension assets of defined benefit pension plans are reported in the statement of net assets. 350,035
708,010
(57,178,441)
(566,798)
(1,607,136)
(6,546,428)
86,819,539$
The notes to the financial statements are an integral part of this statement.
Reconciliation of the Fund Balances of Governmental Fundsto the Statement of Net Assets of Governmental Activities
September 30, 2011
Fund balances reported in the Balance Sheet of total governmental funds.
Compensated absences that are not due and payable in the current period are not reported in the
governmental funds. However, they are reported as a liability in the Statement of Net Assets for governmental
activities thus reducing net assets.
Net assets reported in the Statement of Net Assets of governmental activities.
Amounts reported as fund balances in the governmental funds Balance Sheet (above) are different from the total
net assets for governmental activities in the Statement of Net Assets (below) because of a different measurement
focus and basis of accounting between the two statements resulting in the following increases and decreases.
Capital assets are not financial resources. Therefore, they are not reported in the Balance Sheet of
governmental funds. However, they are reported in the Statement of Net Assets of governmental activities.
The City uses internal service funds to charge the costs of fleet management, risk management, and warehouse
services to individual governmental and enterprise funds. The majority of these costs are charged to
governmental funds. Therefore, the total net assets of internal service funds are included with governmental
activities in the Statement of Net Assets.
The internal service funds have operations with cumulative positive income results over the years; primarily for
excess service charges to governmental funds to pre-fund fleet replacement. Those excess charges have
reduced the fund balances reported in the Balance Sheet of total governmental funds above. Since internal
service funds should operate at a break-even basis in the consolidation, the cumulative excess charges are
added back to the above fund balances.
Increases:
Governmental funds report debt issuance costs as an expenditure when those costs are first incurred since they
require the use of current financial resources thereby reducing the above fund balances. However, such costs
are not reported as an expense, but must be included as a deferred charge in the government-wide financial
statements and amortized as an expense over the life of the bonds.
Governmental funds recognize the proceeds and the repayment of noncurrent notes and bonds payable as a
change in fund balances included above. However, governmental activities report long-term bonds and notes
payable as a liability in the Statement of Net Assets thus decreasing the fund balances of governmental funds.
Governmental funds do not recognize interest on the above noncurrent debt as an expense and an accrued
liability until it is due and payable. However, accrued interest must be reported as an expense and liability in
the government-wide financial statements.
Decreases:
Governmental funds do not recognize other postemployment benefits (OPEB) as an expense and an accrued
liability. However, the net OPEB obligations must be reported as a liability in the government-wide financial
statements.
II-17
II-17
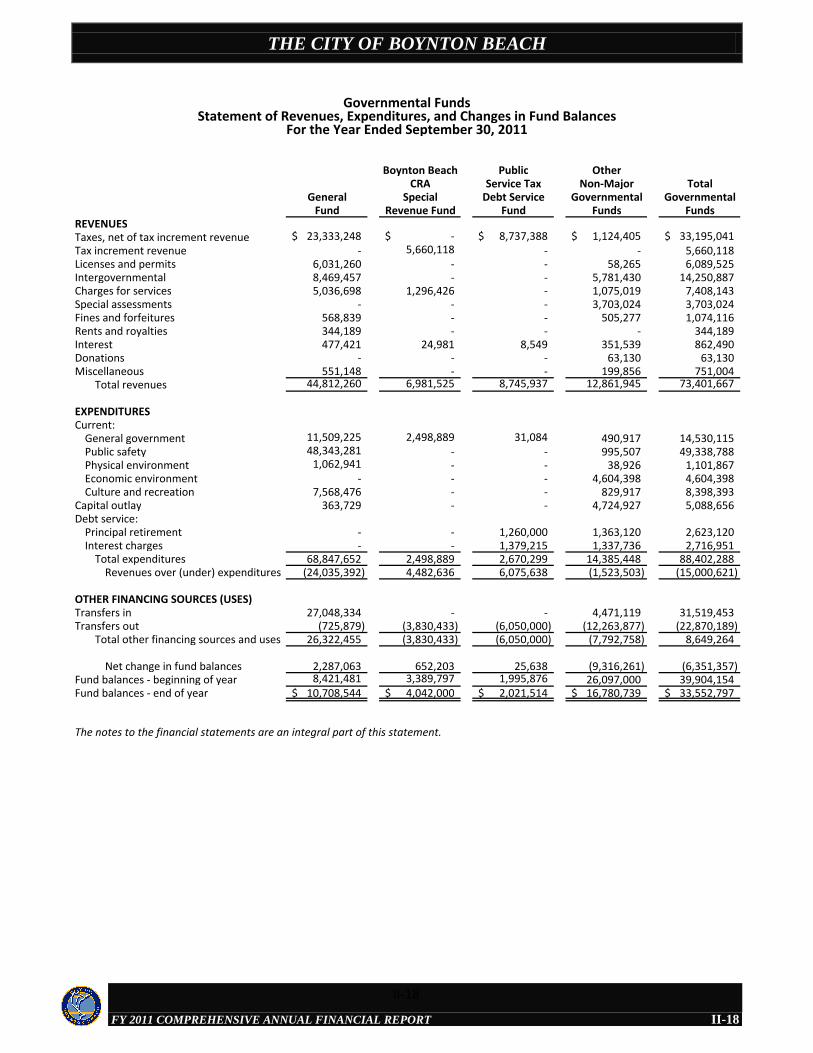
THE CITY OF BOYNTON BEACH
FY 2011 COMPREHENSIVE ANNUAL FINANCIAL REPORT
Boynton Beach Public OtherCRA Service Tax Non-Major Total
General Special Debt Service Governmental GovernmentalFund Revenue Fund Fund Funds Funds
REVENUESTaxes, net of tax increment revenue 23,333,248$ -$ 8,737,388$ 1,124,405$ 33,195,041$ Tax increment revenue - 5,660,118 - - 5,660,118 Licenses and permits 6,031,260 - - 58,265 6,089,525 Intergovernmental 8,469,457 - - 5,781,430 14,250,887 Charges for services 5,036,698 1,296,426 - 1,075,019 7,408,143 Special assessments - - - 3,703,024 3,703,024 Fines and forfeitures 568,839 - - 505,277 1,074,116 Rents and royalties 344,189 - - - 344,189 Interest 477,421 24,981 8,549 351,539 862,490 Donations - - - 63,130 63,130 Miscellaneous 551,148 - - 199,856 751,004
Total revenues 44,812,260 6,981,525 8,745,937 12,861,945 73,401,667
EXPENDITURESCurrent:
General government 11,509,225 2,498,889 31,084 490,917 14,530,115 Public safety 48,343,281 - - 995,507 49,338,788 Physical environment 1,062,941 - - 38,926 1,101,867 Economic environment - - - 4,604,398 4,604,398 Culture and recreation 7,568,476 - - 829,917 8,398,393
Capital outlay 363,729 - - 4,724,927 5,088,656 Debt service:
Principal retirement - - 1,260,000 1,363,120 2,623,120 Interest charges - - 1,379,215 1,337,736 2,716,951
Total expenditures 68,847,652 2,498,889 2,670,299 14,385,448 88,402,288 Revenues over (under) expenditures (24,035,392) 4,482,636 6,075,638 (1,523,503) (15,000,621)
OTHER FINANCING SOURCES (USES)Transfers in 27,048,334 - - 4,471,119 31,519,453 Transfers out (725,879) (3,830,433) (6,050,000) (12,263,877) (22,870,189)
Total other financing sources and uses 26,322,455 (3,830,433) (6,050,000) (7,792,758) 8,649,264
Net change in fund balances 2,287,063 652,203 25,638 (9,316,261) (6,351,357) Fund balances - beginning of year 8,421,481 3,389,797 1,995,876 26,097,000 39,904,154 Fund balances - end of year 10,708,544$ 4,042,000$ 2,021,514$ 16,780,739$ 33,552,797$
The notes to the financial statements are an integral part of this statement.
Governmental FundsStatement of Revenues, Expenditures, and Changes in Fund Balances
For the Year Ended September 30, 2011
II-18
II-18
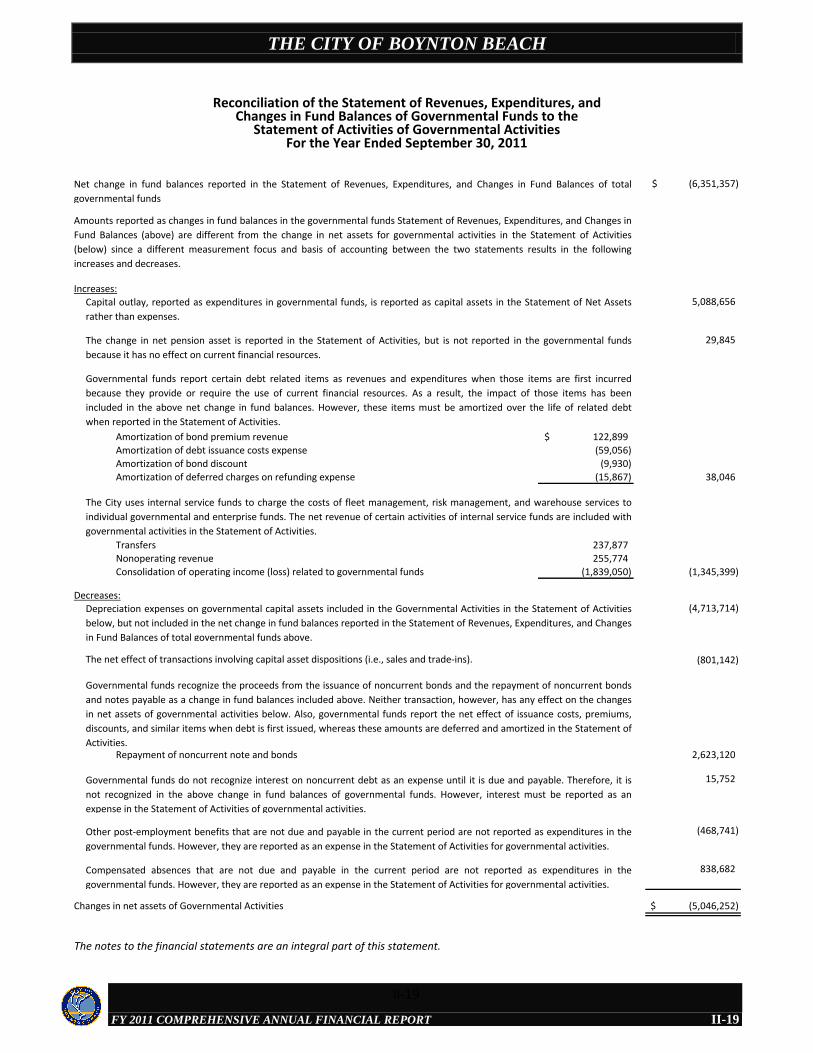
THE CITY OF BOYNTON BEACH
FY 2011 COMPREHENSIVE ANNUAL FINANCIAL REPORT
(6,351,357)$
5,088,656
29,845
Amortization of bond premium revenue 122,899$
Amortization of debt issuance costs expense (59,056)
Amortization of bond discount (9,930)
Amortization of deferred charges on refunding expense (15,867) 38,046
Transfers 237,877
Nonoperating revenue 255,774
Consolidation of operating income (loss) related to governmental funds (1,839,050) (1,345,399)
(4,713,714)
(801,142)
Repayment of noncurrent note and bonds 2,623,120
15,752
(468,741)
838,682
(5,046,252)$
The notes to the financial statements are an integral part of this statement.
Reconciliation of the Statement of Revenues, Expenditures, and
For the Year Ended September 30, 2011Statement of Activities of Governmental Activities
Changes in Fund Balances of Governmental Funds to the
Net change in fund balances reported in the Statement of Revenues, Expenditures, and Changes in Fund Balances of total
governmental funds
Increases:
Amounts reported as changes in fund balances in the governmental funds Statement of Revenues, Expenditures, and Changes in
Fund Balances (above) are different from the change in net assets for governmental activities in the Statement of Activities
(below) since a different measurement focus and basis of accounting between the two statements results in the following
increases and decreases.
Decreases:
Depreciation expenses on governmental capital assets included in the Governmental Activities in the Statement of Activities
below, but not included in the net change in fund balances reported in the Statement of Revenues, Expenditures, and Changes
in Fund Balances of total governmental funds above.
Capital outlay, reported as expenditures in governmental funds, is reported as capital assets in the Statement of Net Assets
rather than expenses.
The change in net pension asset is reported in the Statement of Activities, but is not reported in the governmental funds
because it has no effect on current financial resources.
Governmental funds report certain debt related items as revenues and expenditures when those items are first incurred
because they provide or require the use of current financial resources. As a result, the impact of those items has been
included in the above net change in fund balances. However, these items must be amortized over the life of related debt
when reported in the Statement of Activities.
The City uses internal service funds to charge the costs of fleet management, risk management, and warehouse services to
individual governmental and enterprise funds. The net revenue of certain activities of internal service funds are included with
governmental activities in the Statement of Activities.
The net effect of transactions involving capital asset dispositions (i.e., sales and trade-ins).
Other post-employment benefits that are not due and payable in the current period are not reported as expenditures in the
governmental funds. However, they are reported as an expense in the Statement of Activities for governmental activities.
Compensated absences that are not due and payable in the current period are not reported as expenditures in the
governmental funds. However, they are reported as an expense in the Statement of Activities for governmental activities.
Changes in net assets of Governmental Activities
Governmental funds recognize the proceeds from the issuance of noncurrent bonds and the repayment of noncurrent bonds
and notes payable as a change in fund balances included above. Neither transaction, however, has any effect on the changes
in net assets of governmental activities below. Also, governmental funds report the net effect of issuance costs, premiums,
discounts, and similar items when debt is first issued, whereas these amounts are deferred and amortized in the Statement of
Activities.
Governmental funds do not recognize interest on noncurrent debt as an expense until it is due and payable. Therefore, it is
not recognized in the above change in fund balances of governmental funds. However, interest must be reported as an
expense in the Statement of Activities of governmental activities.
II-19
II-19
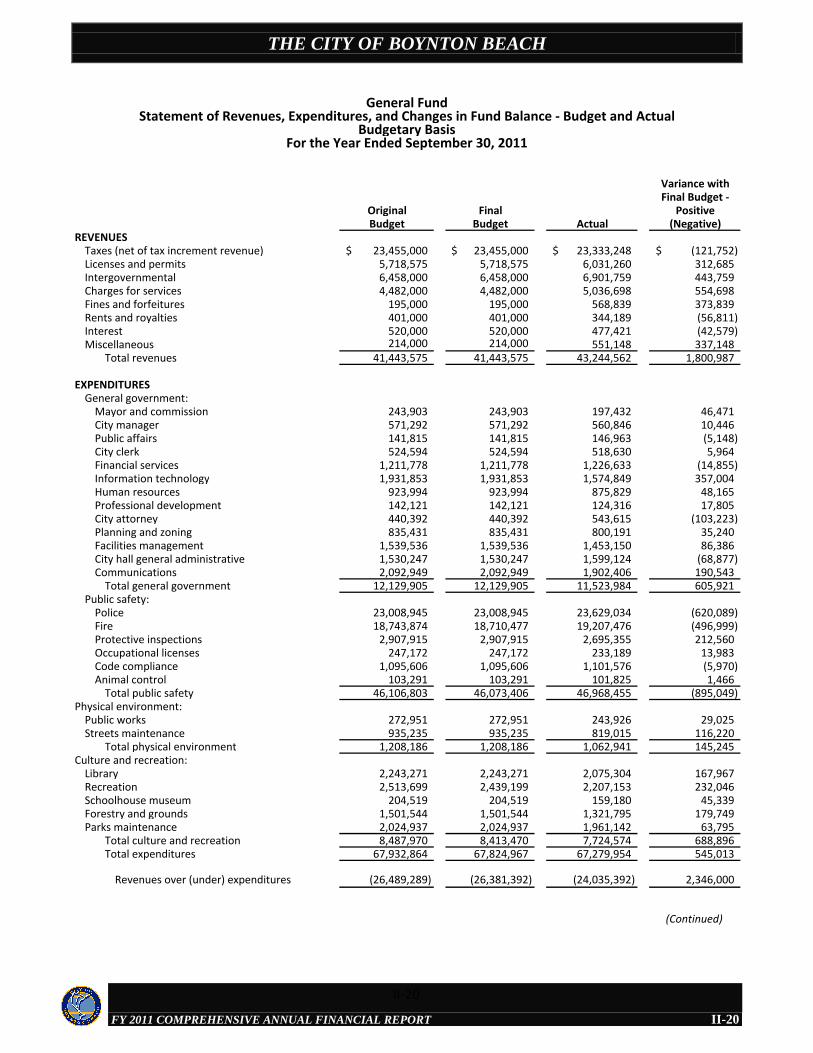
THE CITY OF BOYNTON BEACH
FY 2011 COMPREHENSIVE ANNUAL FINANCIAL REPORT
Variance withFinal Budget -
Original Final PositiveBudget Budget Actual (Negative)
REVENUESTaxes (net of tax increment revenue) 23,455,000$ 23,455,000$ 23,333,248$ (121,752)$ Licenses and permits 5,718,575 5,718,575 6,031,260 312,685 Intergovernmental 6,458,000 6,458,000 6,901,759 443,759 Charges for services 4,482,000 4,482,000 5,036,698 554,698 Fines and forfeitures 195,000 195,000 568,839 373,839 Rents and royalties 401,000 401,000 344,189 (56,811) Interest 520,000 520,000 477,421 (42,579) Miscellaneous 214,000 214,000 551,148 337,148
Total revenues 41,443,575 41,443,575 43,244,562 1,800,987
EXPENDITURESGeneral government:
Mayor and commission 243,903 243,903 197,432 46,471 City manager 571,292 571,292 560,846 10,446 Public affairs 141,815 141,815 146,963 (5,148) City clerk 524,594 524,594 518,630 5,964 Financial services 1,211,778 1,211,778 1,226,633 (14,855) Information technology 1,931,853 1,931,853 1,574,849 357,004 Human resources 923,994 923,994 875,829 48,165 Professional development 142,121 142,121 124,316 17,805 City attorney 440,392 440,392 543,615 (103,223) Planning and zoning 835,431 835,431 800,191 35,240 Facilities management 1,539,536 1,539,536 1,453,150 86,386 City hall general administrative 1,530,247 1,530,247 1,599,124 (68,877) Communications 2,092,949 2,092,949 1,902,406 190,543
Total general government 12,129,905 12,129,905 11,523,984 605,921 Public safety:
Police 23,008,945 23,008,945 23,629,034 (620,089) Fire 18,743,874 18,710,477 19,207,476 (496,999) Protective inspections 2,907,915 2,907,915 2,695,355 212,560 Occupational licenses 247,172 247,172 233,189 13,983 Code compliance 1,095,606 1,095,606 1,101,576 (5,970) Animal control 103,291 103,291 101,825 1,466
Total public safety 46,106,803 46,073,406 46,968,455 (895,049) Physical environment:
Public works 272,951 272,951 243,926 29,025 Streets maintenance 935,235 935,235 819,015 116,220
Total physical environment 1,208,186 1,208,186 1,062,941 145,245 Culture and recreation:
Library 2,243,271 2,243,271 2,075,304 167,967 Recreation 2,513,699 2,439,199 2,207,153 232,046 Schoolhouse museum 204,519 204,519 159,180 45,339 Forestry and grounds 1,501,544 1,501,544 1,321,795 179,749 Parks maintenance 2,024,937 2,024,937 1,961,142 63,795
Total culture and recreation 8,487,970 8,413,470 7,724,574 688,896 Total expenditures 67,932,864 67,824,967 67,279,954 545,013
Revenues over (under) expenditures (26,489,289) (26,381,392) (24,035,392) 2,346,000
(Continued)
General FundStatement of Revenues, Expenditures, and Changes in Fund Balance - Budget and Actual
Budgetary BasisFor the Year Ended September 30, 2011
II-20
II-20
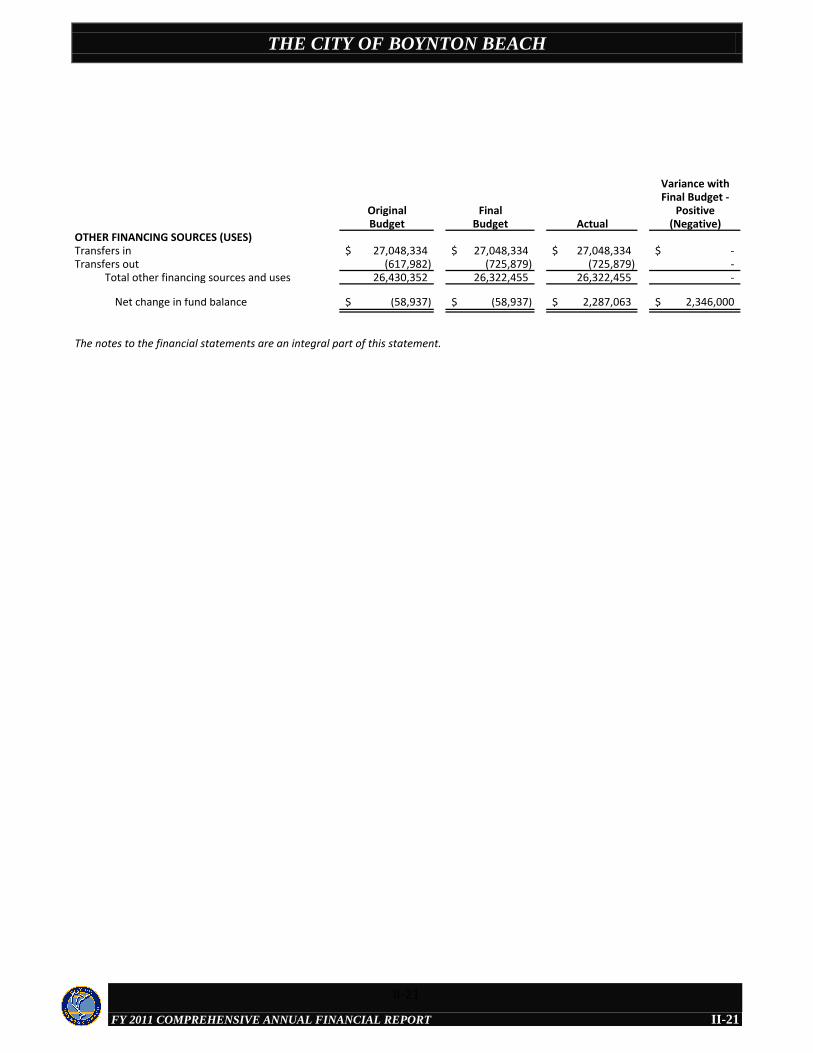
THE CITY OF BOYNTON BEACH
FY 2011 COMPREHENSIVE ANNUAL FINANCIAL REPORT
Variance withFinal Budget -
Original Final PositiveBudget Budget Actual (Negative)
OTHER FINANCING SOURCES (USES)Transfers in 27,048,334$ 27,048,334$ 27,048,334$ -$ Transfers out (617,982) (725,879) (725,879) -
Total other financing sources and uses 26,430,352 26,322,455 26,322,455 -
Net change in fund balance (58,937)$ (58,937)$ 2,287,063$ 2,346,000$
The notes to the financial statements are an integral part of this statement.
II-21
II-21
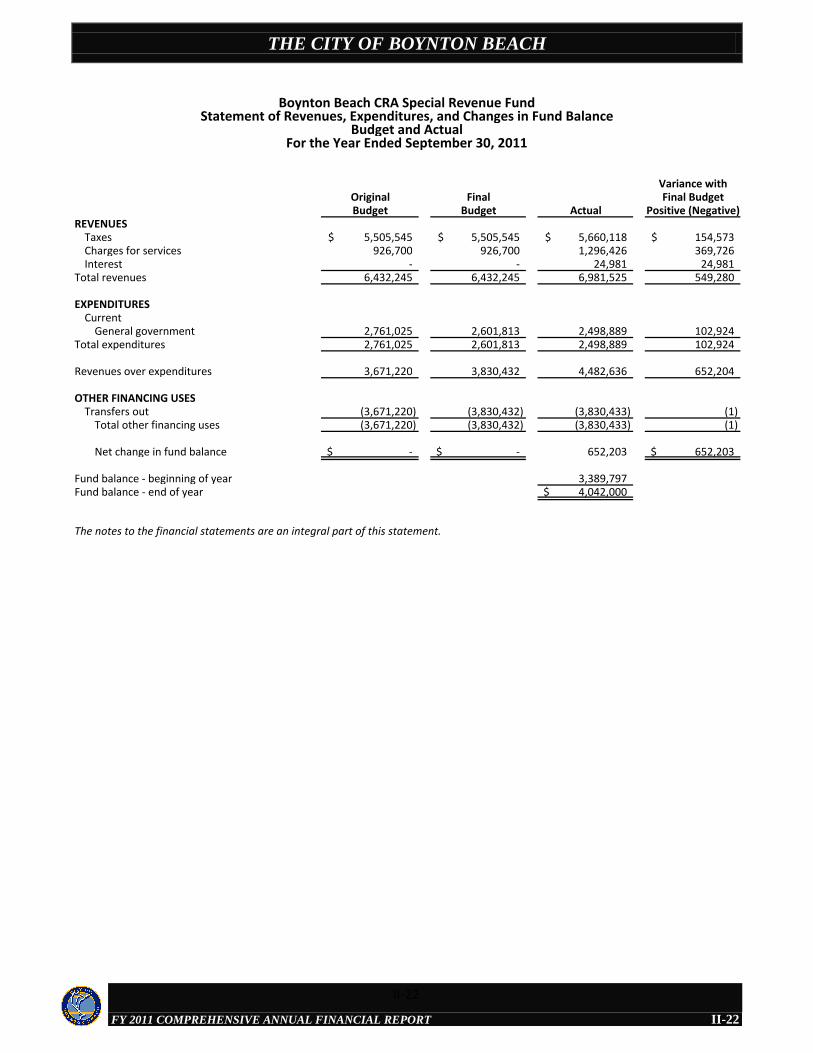
THE CITY OF BOYNTON BEACH
FY 2011 COMPREHENSIVE ANNUAL FINANCIAL REPORT
Variance withOriginal Final Final BudgetBudget Budget Actual Positive (Negative)
REVENUESTaxes 5,505,545$ 5,505,545$ 5,660,118$ 154,573$ Charges for services 926,700 926,700 1,296,426 369,726 Interest - - 24,981 24,981
Total revenues 6,432,245 6,432,245 6,981,525 549,280
EXPENDITURESCurrent
General government 2,761,025 2,601,813 2,498,889 102,924 Total expenditures 2,761,025 2,601,813 2,498,889 102,924
Revenues over expenditures 3,671,220 3,830,432 4,482,636 652,204
OTHER FINANCING USESTransfers out (3,671,220) (3,830,432) (3,830,433) (1)
Total other financing uses (3,671,220) (3,830,432) (3,830,433) (1)
Net change in fund balance -$ -$ 652,203 652,203$
Fund balance - beginning of year 3,389,797 Fund balance - end of year 4,042,000$
The notes to the financial statements are an integral part of this statement.
Boynton Beach CRA Special Revenue FundStatement of Revenues, Expenditures, and Changes in Fund Balance
Budget and ActualFor the Year Ended September 30, 2011
II-22
II-22
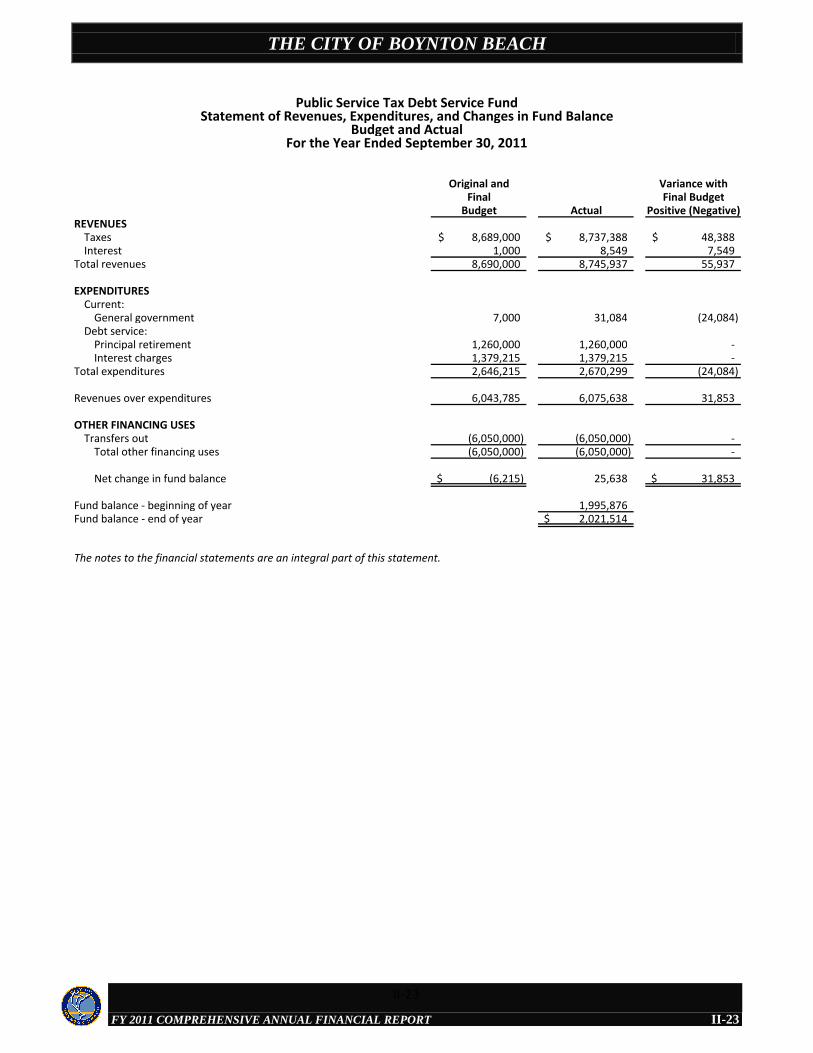
THE CITY OF BOYNTON BEACH
FY 2011 COMPREHENSIVE ANNUAL FINANCIAL REPORT
Original and Variance withFinal Final Budget
Budget Actual Positive (Negative)REVENUES
Taxes 8,689,000$ 8,737,388$ 48,388$ Interest 1,000 8,549 7,549
Total revenues 8,690,000 8,745,937 55,937
EXPENDITURESCurrent:
General government 7,000 31,084 (24,084) Debt service:
Principal retirement 1,260,000 1,260,000 - Interest charges 1,379,215 1,379,215 -
Total expenditures 2,646,215 2,670,299 (24,084)
Revenues over expenditures 6,043,785 6,075,638 31,853
OTHER FINANCING USESTransfers out (6,050,000) (6,050,000) -
Total other financing uses (6,050,000) (6,050,000) -
Net change in fund balance (6,215)$ 25,638 31,853$
Fund balance - beginning of year 1,995,876 Fund balance - end of year 2,021,514$
The notes to the financial statements are an integral part of this statement.
Public Service Tax Debt Service FundStatement of Revenues, Expenditures, and Changes in Fund Balance
Budget and ActualFor the Year Ended September 30, 2011
II-23
II-23
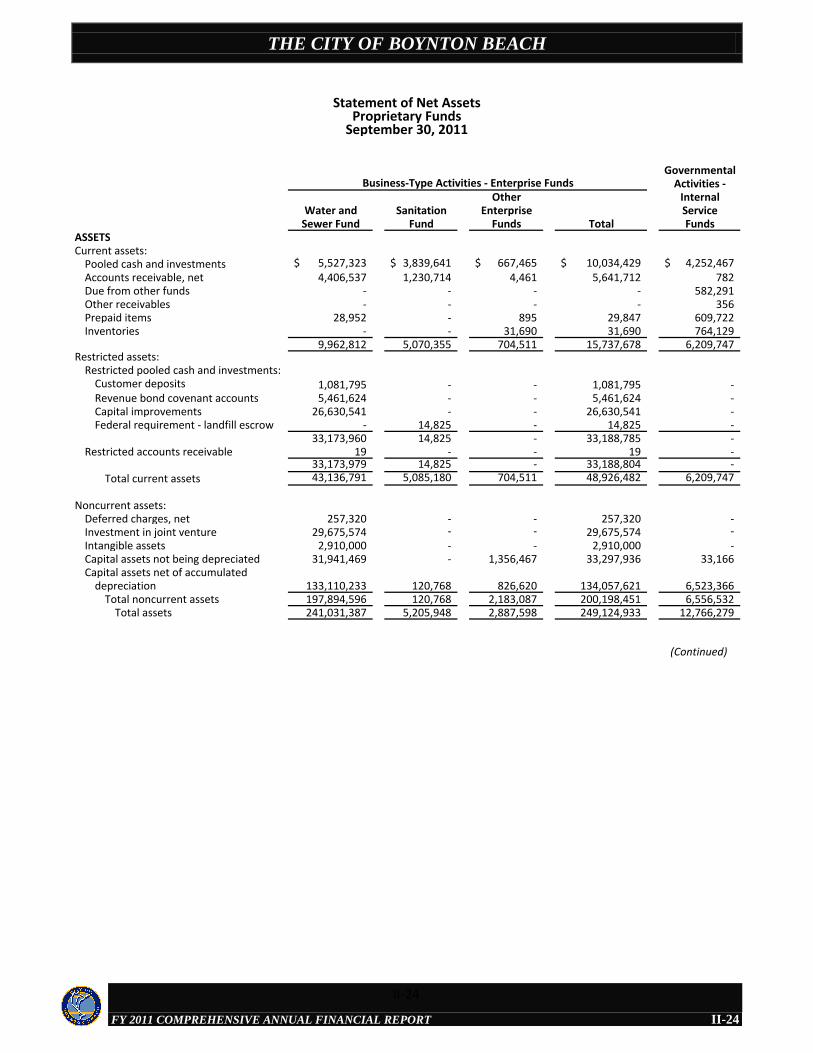
THE CITY OF BOYNTON BEACH
FY 2011 COMPREHENSIVE ANNUAL FINANCIAL REPORT
GovernmentalActivities -
Other InternalWater and Sanitation Enterprise Service
Sewer Fund Fund Funds Total FundsASSETSCurrent assets:
Pooled cash and investments 5,527,323$ 3,839,641$ 667,465$ 10,034,429$ 4,252,467$ Accounts receivable, net 4,406,537 1,230,714 4,461 5,641,712 782 Due from other funds - - - - 582,291 Other receivables - - - - 356 Prepaid items 28,952 - 895 29,847 609,722 Inventories - - 31,690 31,690 764,129
9,962,812 5,070,355 704,511 15,737,678 6,209,747 Restricted assets:
Restricted pooled cash and investments:Customer deposits 1,081,795 - - 1,081,795 - Revenue bond covenant accounts 5,461,624 - - 5,461,624 - Capital improvements 26,630,541 - - 26,630,541 - Federal requirement - landfill escrow - 14,825 - 14,825 -
33,173,960 14,825 - 33,188,785 - Restricted accounts receivable 19 - - 19 -
33,173,979 14,825 - 33,188,804 - Total current assets 43,136,791 5,085,180 704,511 48,926,482 6,209,747
Noncurrent assets:Deferred charges, net 257,320 - - 257,320 - Investment in joint venture 29,675,574 - - 29,675,574 - Intangible assets 2,910,000 - - 2,910,000 - Capital assets not being depreciated 31,941,469 - 1,356,467 33,297,936 33,166 Capital assets net of accumulated
depreciation 133,110,233 120,768 826,620 134,057,621 6,523,366 Total noncurrent assets 197,894,596 120,768 2,183,087 200,198,451 6,556,532
Total assets 241,031,387 5,205,948 2,887,598 249,124,933 12,766,279
(Continued)
Statement of Net AssetsProprietary Funds
September 30, 2011
Business-Type Activities - Enterprise Funds
II-24
II-24
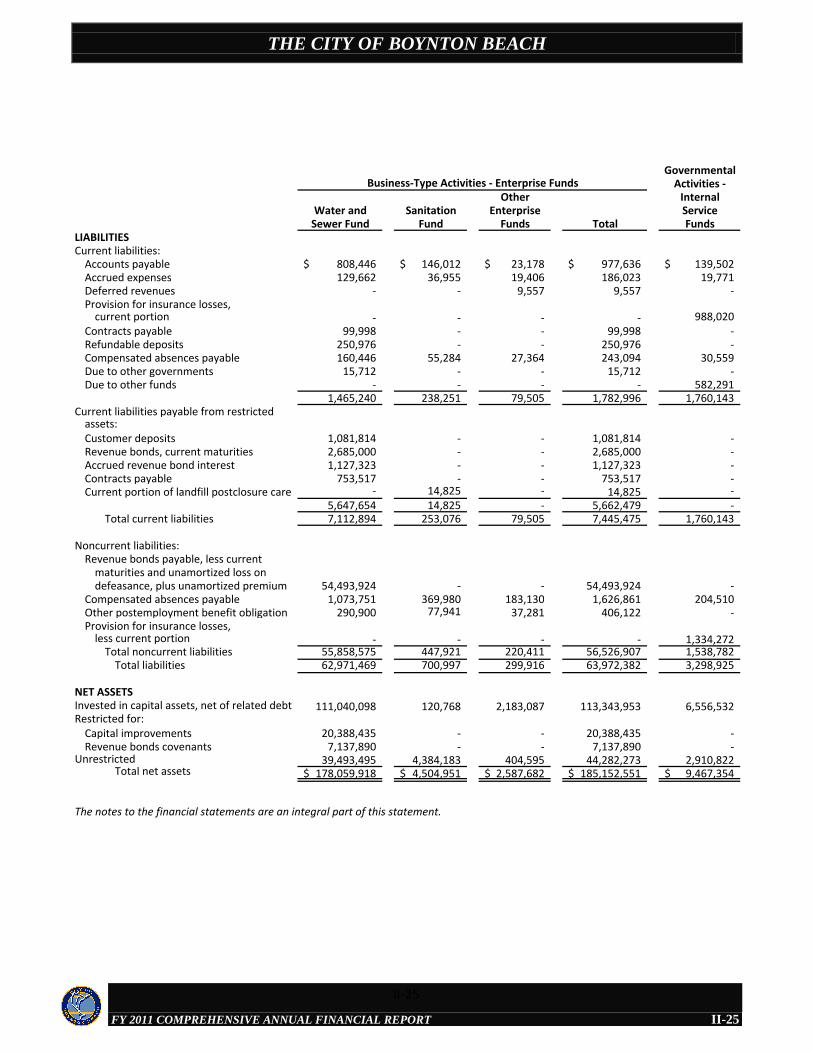
THE CITY OF BOYNTON BEACH
FY 2011 COMPREHENSIVE ANNUAL FINANCIAL REPORT
GovernmentalActivities -
Other InternalWater and Sanitation Enterprise Service
Sewer Fund Fund Funds Total FundsLIABILITIESCurrent liabilities:
Accounts payable 808,446$ 146,012$ 23,178$ 977,636$ 139,502$ Accrued expenses 129,662 36,955 19,406 186,023 19,771 Deferred revenues - - 9,557 9,557 - Provision for insurance losses,
current portion - - - - 988,020 Contracts payable 99,998 - - 99,998 - Refundable deposits 250,976 - - 250,976 - Compensated absences payable 160,446 55,284 27,364 243,094 30,559 Due to other governments 15,712 - - 15,712 - Due to other funds - - - - 582,291
1,465,240 238,251 79,505 1,782,996 1,760,143 Current liabilities payable from restricted
assets:Customer deposits 1,081,814 - - 1,081,814 - Revenue bonds, current maturities 2,685,000 - - 2,685,000 - Accrued revenue bond interest 1,127,323 - - 1,127,323 - Contracts payable 753,517 - - 753,517 - Current portion of landfill postclosure care - 14,825 - 14,825 -
5,647,654 14,825 - 5,662,479 - Total current liabilities 7,112,894 253,076 79,505 7,445,475 1,760,143
Noncurrent liabilities:Revenue bonds payable, less current
maturities and unamortized loss ondefeasance, plus unamortized premium 54,493,924 - - 54,493,924 -
Compensated absences payable 1,073,751 369,980 183,130 1,626,861 204,510 Other postemployment benefit obligation 290,900 77,941 37,281 406,122 - Provision for insurance losses,
less current portion - - - - 1,334,272 Total noncurrent liabilities 55,858,575 447,921 220,411 56,526,907 1,538,782
Total liabilities 62,971,469 700,997 299,916 63,972,382 3,298,925
NET ASSETSInvested in capital assets, net of related debt 111,040,098 120,768 2,183,087 113,343,953 6,556,532 Restricted for:
Capital improvements 20,388,435 - - 20,388,435 - Revenue bonds covenants 7,137,890 - - 7,137,890 -
Unrestricted 39,493,495 4,384,183 404,595 44,282,273 2,910,822 Total net assets 178,059,918$ 4,504,951$ 2,587,682$ 185,152,551$ 9,467,354$
The notes to the financial statements are an integral part of this statement.
Business-Type Activities - Enterprise Funds
II-25
II-25
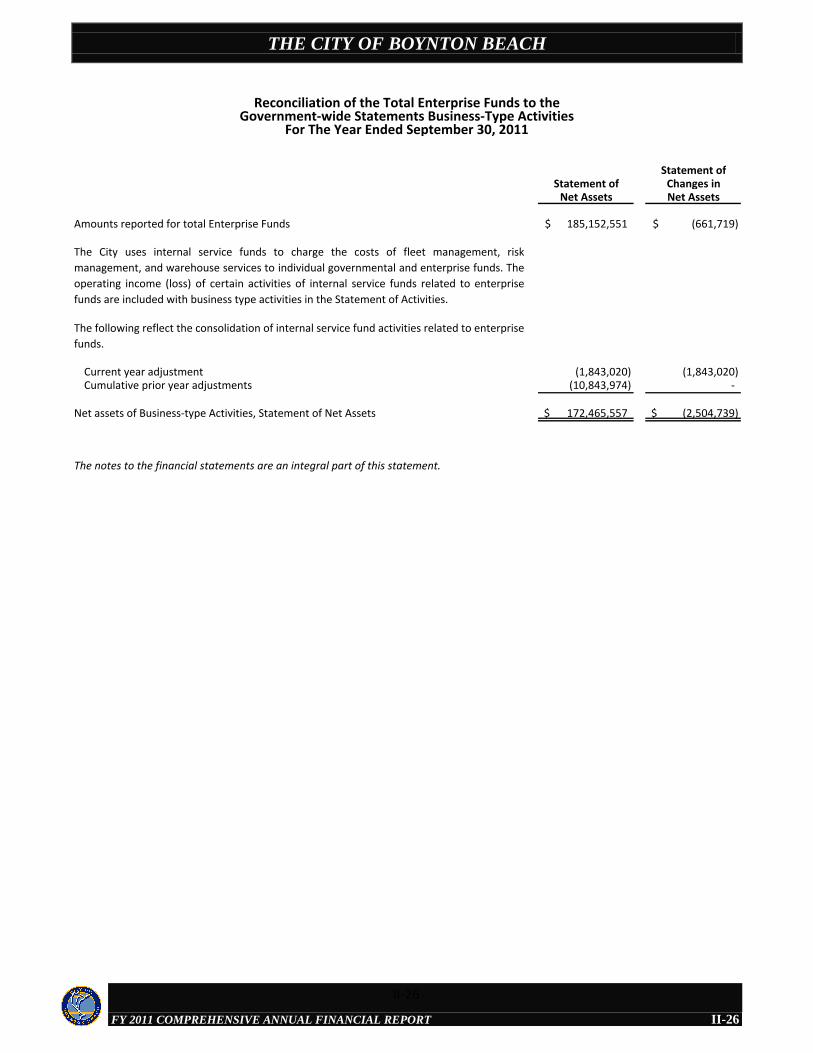
THE CITY OF BOYNTON BEACH
FY 2011 COMPREHENSIVE ANNUAL FINANCIAL REPORT
Statement ofStatement of Changes in
Net Assets Net Assets
Amounts reported for total Enterprise Funds 185,152,551$ (661,719)$
The City uses internal service funds to charge the costs of fleet management, risk
management, and warehouse services to individual governmental and enterprise funds. The
operating income (loss) of certain activities of internal service funds related to enterprise
funds are included with business type activities in the Statement of Activities.
The following reflect the consolidation of internal service fund activities related to enterprise
funds.
Current year adjustment (1,843,020) (1,843,020) Cumulative prior year adjustments (10,843,974) -
Net assets of Business-type Activities, Statement of Net Assets 172,465,557$ (2,504,739)$
The notes to the financial statements are an integral part of this statement.
Reconciliation of the Total Enterprise Funds to theGovernment-wide Statements Business-Type Activities
For The Year Ended September 30, 2011
II-26
II-26
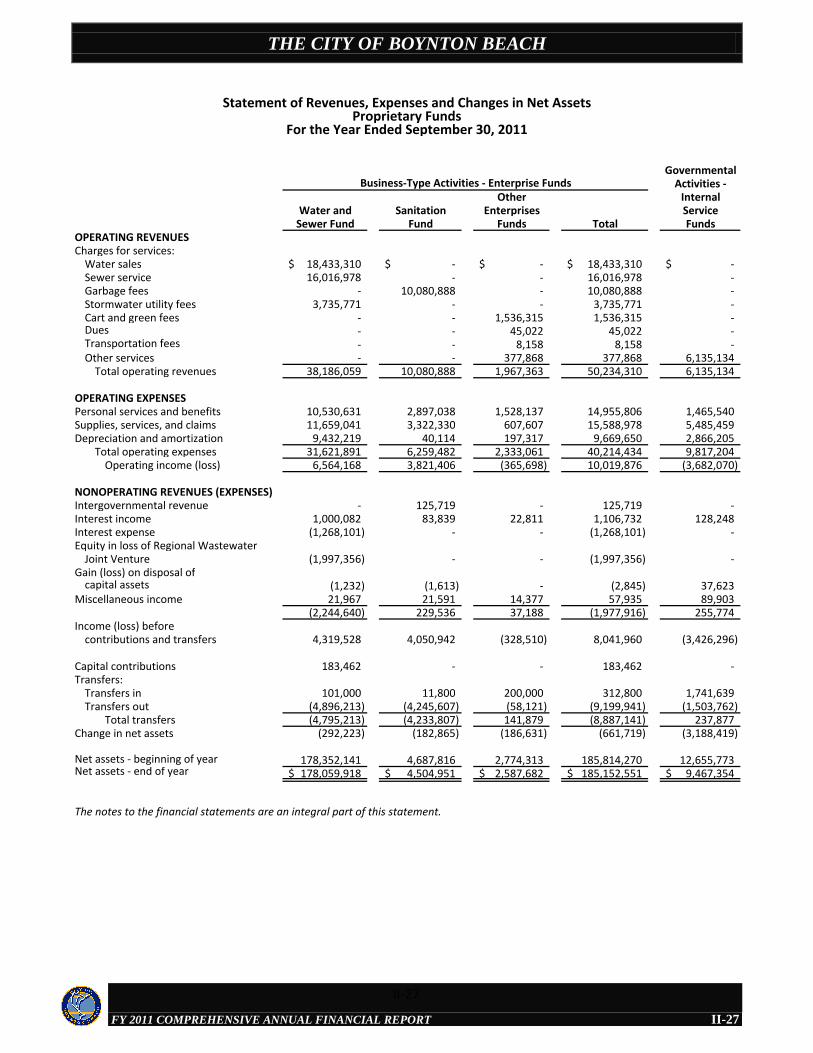
THE CITY OF BOYNTON BEACH
FY 2011 COMPREHENSIVE ANNUAL FINANCIAL REPORT
GovernmentalActivities -
Other InternalWater and Sanitation Enterprises Service
Sewer Fund Fund Funds Total FundsOPERATING REVENUESCharges for services:
Water sales 18,433,310$ -$ -$ 18,433,310$ -$ Sewer service 16,016,978 - - 16,016,978 - Garbage fees - 10,080,888 - 10,080,888 - Stormwater utility fees 3,735,771 - - 3,735,771 - Cart and green fees - - 1,536,315 1,536,315 - Dues - - 45,022 45,022 - Transportation fees - - 8,158 8,158 - Other services - - 377,868 377,868 6,135,134
Total operating revenues 38,186,059 10,080,888 1,967,363 50,234,310 6,135,134
OPERATING EXPENSESPersonal services and benefits 10,530,631 2,897,038 1,528,137 14,955,806 1,465,540 Supplies, services, and claims 11,659,041 3,322,330 607,607 15,588,978 5,485,459 Depreciation and amortization 9,432,219 40,114 197,317 9,669,650 2,866,205
Total operating expenses 31,621,891 6,259,482 2,333,061 40,214,434 9,817,204 Operating income (loss) 6,564,168 3,821,406 (365,698) 10,019,876 (3,682,070)
NONOPERATING REVENUES (EXPENSES)Intergovernmental revenue - 125,719 - 125,719 - Interest income 1,000,082 83,839 22,811 1,106,732 128,248 Interest expense (1,268,101) - - (1,268,101) - Equity in loss of Regional Wastewater
Joint Venture (1,997,356) - - (1,997,356) - Gain (loss) on disposal of
capital assets (1,232) (1,613) - (2,845) 37,623 Miscellaneous income 21,967 21,591 14,377 57,935 89,903
(2,244,640) 229,536 37,188 (1,977,916) 255,774 Income (loss) before
contributions and transfers 4,319,528 4,050,942 (328,510) 8,041,960 (3,426,296)
Capital contributions 183,462 - - 183,462 - Transfers:
Transfers in 101,000 11,800 200,000 312,800 1,741,639 Transfers out (4,896,213) (4,245,607) (58,121) (9,199,941) (1,503,762)
Total transfers (4,795,213) (4,233,807) 141,879 (8,887,141) 237,877 Change in net assets (292,223) (182,865) (186,631) (661,719) (3,188,419)
Net assets - beginning of year 178,352,141 4,687,816 2,774,313 185,814,270 12,655,773 Net assets - end of year 178,059,918$ 4,504,951$ 2,587,682$ 185,152,551$ 9,467,354$
The notes to the financial statements are an integral part of this statement.
Business-Type Activities - Enterprise Funds
Statement of Revenues, Expenses and Changes in Net AssetsProprietary Funds
For the Year Ended September 30, 2011
II-27
II-27
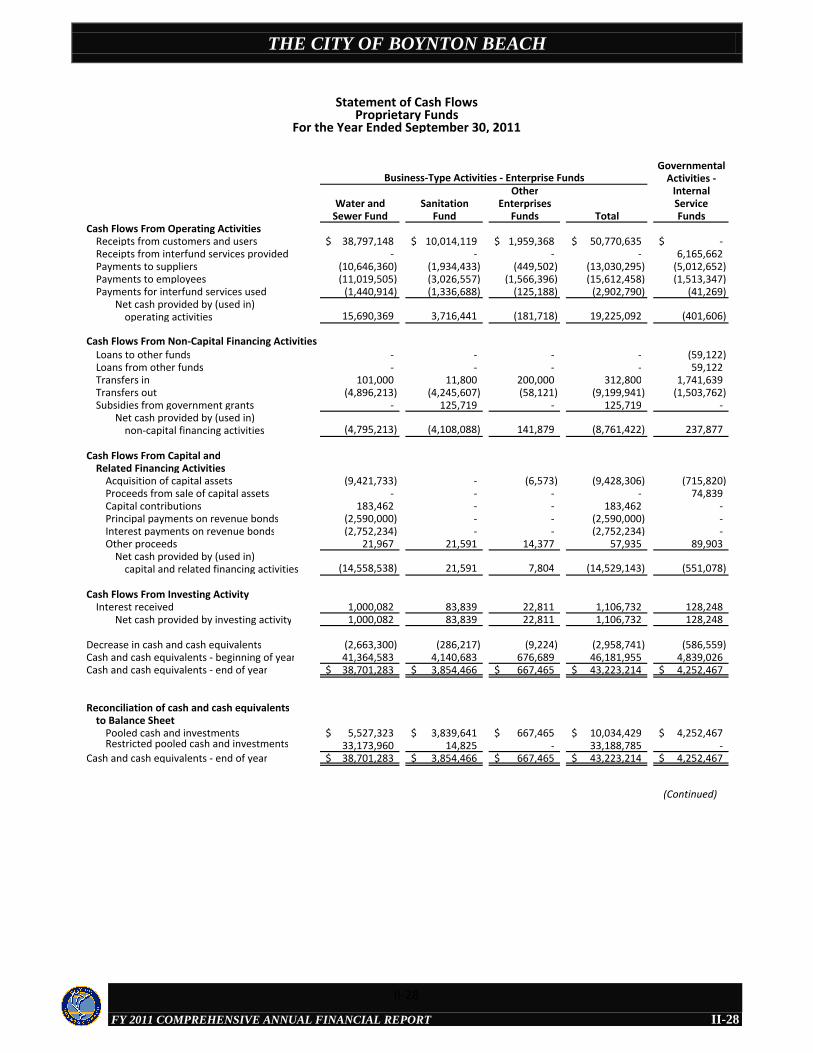
THE CITY OF BOYNTON BEACH
FY 2011 COMPREHENSIVE ANNUAL FINANCIAL REPORT
Governmental
Activities -
Other Internal
Water and Sanitation Enterprises Service
Sewer Fund Fund Funds Total Funds
Cash Flows From Operating Activities
Receipts from customers and users 38,797,148$ 10,014,119$ 1,959,368$ 50,770,635$ -$ Receipts from interfund services provided - - - - 6,165,662 Payments to suppliers (10,646,360) (1,934,433) (449,502) (13,030,295) (5,012,652) Payments to employees (11,019,505) (3,026,557) (1,566,396) (15,612,458) (1,513,347) Payments for interfund services used (1,440,914) (1,336,688) (125,188) (2,902,790) (41,269)
Net cash provided by (used in)
operating activities 15,690,369 3,716,441 (181,718) 19,225,092 (401,606)
Cash Flows From Non-Capital Financing Activities
Loans to other funds - - - - (59,122) Loans from other funds - - - - 59,122 Transfers in 101,000 11,800 200,000 312,800 1,741,639 Transfers out (4,896,213) (4,245,607) (58,121) (9,199,941) (1,503,762) Subsidies from government grants - 125,719 - 125,719 -
Net cash provided by (used in)non-capital financing activities (4,795,213) (4,108,088) 141,879 (8,761,422) 237,877
Cash Flows From Capital and
Related Financing Activities
Acquisition of capital assets (9,421,733) - (6,573) (9,428,306) (715,820) Proceeds from sale of capital assets - - - - 74,839 Capital contributions 183,462 - - 183,462 - Principal payments on revenue bonds (2,590,000) - - (2,590,000) - Interest payments on revenue bonds (2,752,234) - - (2,752,234) - Other proceeds 21,967 21,591 14,377 57,935 89,903
Net cash provided by (used in)capital and related financing activities (14,558,538) 21,591 7,804 (14,529,143) (551,078)
Cash Flows From Investing Activity
Interest received 1,000,082 83,839 22,811 1,106,732 128,248 Net cash provided by investing activity 1,000,082 83,839 22,811 1,106,732 128,248
Decrease in cash and cash equivalents (2,663,300) (286,217) (9,224) (2,958,741) (586,559) Cash and cash equivalents - beginning of year 41,364,583 4,140,683 676,689 46,181,955 4,839,026 Cash and cash equivalents - end of year 38,701,283$ 3,854,466$ 667,465$ 43,223,214$ 4,252,467$
Reconciliation of cash and cash equivalents
to Balance Sheet
Pooled cash and investments 5,527,323$ 3,839,641$ 667,465$ 10,034,429$ 4,252,467$ Restricted pooled cash and investments 33,173,960 14,825 - 33,188,785 -
Cash and cash equivalents - end of year 38,701,283$ 3,854,466$ 667,465$ 43,223,214$ 4,252,467$
(Continued)
Statement of Cash FlowsProprietary Funds
For the Year Ended September 30, 2011
Business-Type Activities - Enterprise Funds
II-28
II-28
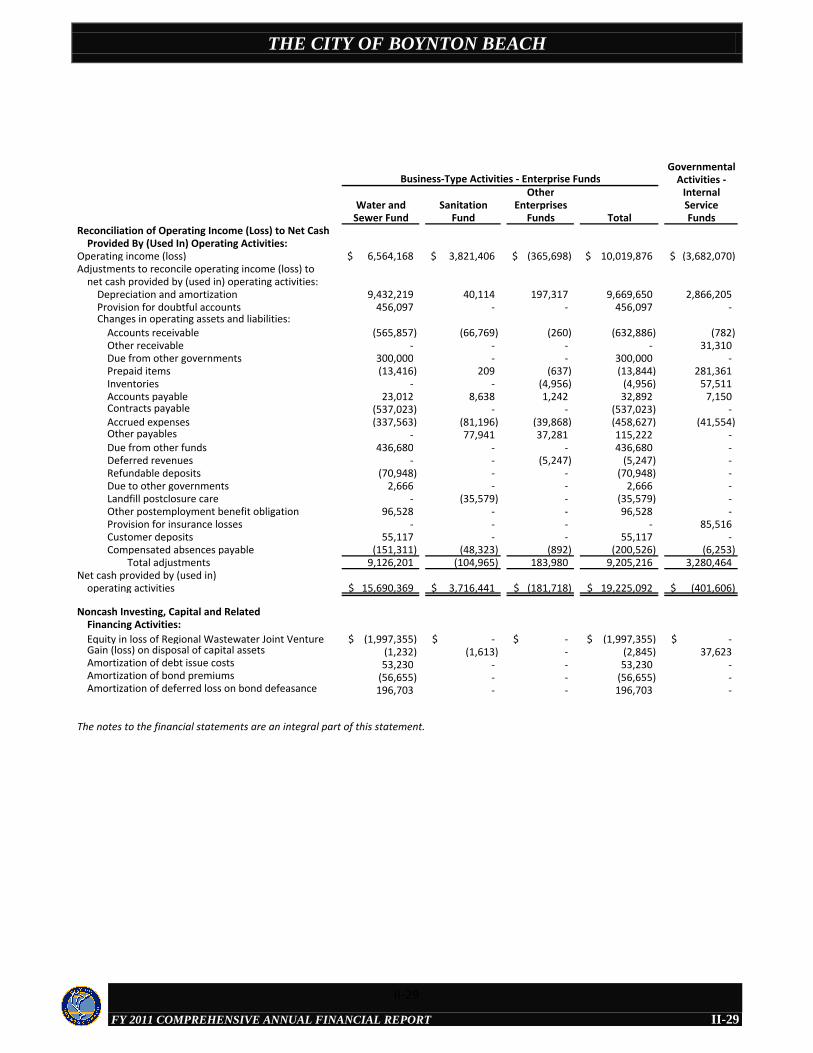
THE CITY OF BOYNTON BEACH
FY 2011 COMPREHENSIVE ANNUAL FINANCIAL REPORT
GovernmentalActivities -
Other InternalWater and Sanitation Enterprises Service
Sewer Fund Fund Funds Total FundsReconciliation of Operating Income (Loss) to Net Cash
Provided By (Used In) Operating Activities:Operating income (loss) 6,564,168$ 3,821,406$ (365,698)$ 10,019,876$ (3,682,070)$ Adjustments to reconcile operating income (loss) to
net cash provided by (used in) operating activities:Depreciation and amortization 9,432,219 40,114 197,317 9,669,650 2,866,205 Provision for doubtful accounts 456,097 - - 456,097 - Changes in operating assets and liabilities:
Accounts receivable (565,857) (66,769) (260) (632,886) (782) Other receivable - - - - 31,310 Due from other governments 300,000 - - 300,000 - Prepaid items (13,416) 209 (637) (13,844) 281,361 Inventories - - (4,956) (4,956) 57,511 Accounts payable 23,012 8,638 1,242 32,892 7,150 Contracts payable (537,023) - - (537,023) - Accrued expenses (337,563) (81,196) (39,868) (458,627) (41,554) Other payables - 77,941 37,281 115,222 - Due from other funds 436,680 - - 436,680 - Deferred revenues - - (5,247) (5,247) - Refundable deposits (70,948) - - (70,948) - Due to other governments 2,666 - - 2,666 - Landfill postclosure care - (35,579) - (35,579) - Other postemployment benefit obligation 96,528 - - 96,528 - Provision for insurance losses - - - - 85,516 Customer deposits 55,117 - - 55,117 - Compensated absences payable (151,311) (48,323) (892) (200,526) (6,253)
Total adjustments 9,126,201 (104,965) 183,980 9,205,216 3,280,464 Net cash provided by (used in)
operating activities 15,690,369$ 3,716,441$ (181,718)$ 19,225,092$ (401,606)$
Noncash Investing, Capital and Related Financing Activities:
Equity in loss of Regional Wastewater Joint Venture (1,997,355)$ -$ -$ (1,997,355)$ -$ Gain (loss) on disposal of capital assets (1,232) (1,613) - (2,845) 37,623 Amortization of debt issue costs 53,230 - - 53,230 - Amortization of bond premiums (56,655) - - (56,655) - Amortization of deferred loss on bond defeasance 196,703 - - 196,703 -
The notes to the financial statements are an integral part of this statement.
Business-Type Activities - Enterprise Funds
II-29
II-29
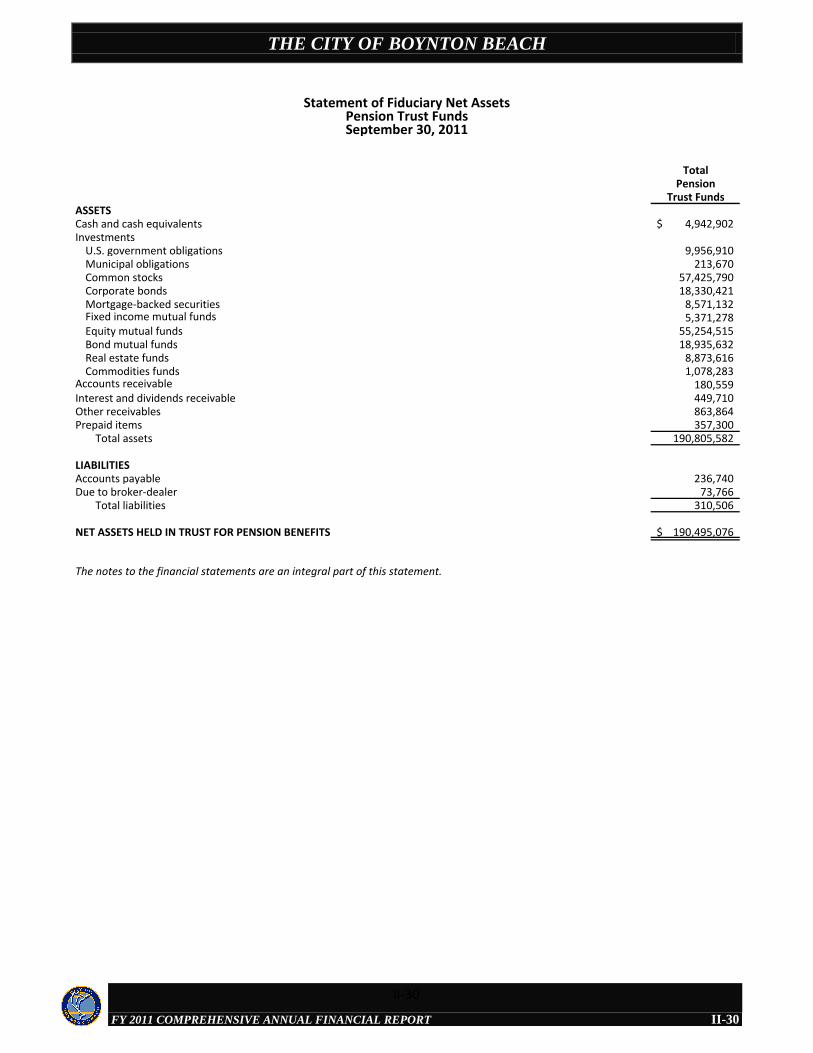
THE CITY OF BOYNTON BEACH
FY 2011 COMPREHENSIVE ANNUAL FINANCIAL REPORT
TotalPension
Trust FundsASSETSCash and cash equivalents 4,942,902$ Investments
U.S. government obligations 9,956,910 Municipal obligations 213,670 Common stocks 57,425,790 Corporate bonds 18,330,421 Mortgage-backed securities 8,571,132 Fixed income mutual funds 5,371,278 Equity mutual funds 55,254,515 Bond mutual funds 18,935,632 Real estate funds 8,873,616 Commodities funds 1,078,283
Accounts receivable 180,559 Interest and dividends receivable 449,710 Other receivables 863,864 Prepaid items 357,300
Total assets 190,805,582
LIABILITIESAccounts payable 236,740 Due to broker-dealer 73,766
Total liabilities 310,506
NET ASSETS HELD IN TRUST FOR PENSION BENEFITS 190,495,076$
The notes to the financial statements are an integral part of this statement.
Statement of Fiduciary Net AssetsPension Trust FundsSeptember 30, 2011
II-30
II-30

THE CITY OF BOYNTON BEACH
FY 2011 COMPREHENSIVE ANNUAL FINANCIAL REPORT
TotalPension
Trust FundsADDITIONSContributions:
Employer 11,273,399$ Plan members 4,828,052 State 1,567,698
Total contributions 17,669,149
Investment income (loss):Net depreciation in the fair value of investments (realized and unrealized) (4,155,568) Interest and dividends 3,945,727 Miscellaneous 21,814
(188,027) Less investment expenses:
Investment expenses 1,124,791 Net investment loss (1,312,818)
Total additions 16,356,331
DEDUCTIONSBenefits paid 13,427,409 Refunds of contributions 682,149 Other operating expenses 370,916
Total deductions 14,480,474 Net increase 1,875,857
Net assets held in trust for pension benefits - beginning of year, as restated 188,619,219 Net assets held in trust for pension benefits - end of year 190,495,076$
The notes to the financial statements are an integral part of this statement.
Statement of Changes in Fiduciary Net AssetsPension Trust FundsSeptember 30, 2011
II-31
II-31
THE CITY OF BOYNTON BEACH
FY 2011 COMPREHENSIVE ANNUAL FINANCIAL REPORT
NOTES TO THE FINANCIAL STATEMENTS
September 30, 2011
II-32
1. Summary of Significant Accounting Policies A. Reporting Entity The City of Boynton Beach (the “City”) is a Florida municipality established in 1920 by the Laws of Florida, Section 24398, pursuant to the authority provided in Chapter 165, Florida Statutes, and governed by an elected five-member Commission. The City provides a full range of municipal services including public safety, planning and zoning, sanitation, highways and streets, recreation and park facilities, public improvements, water and sewer service, and general administration functions. The accompanying financial statements present the City as the primary government, its component unit, the Boynton Beach Community Redevelopment Agency (CRA), and a joint venture, the South Central Regional Wastewater Treatment and Disposal Board (the “Board”). Under governmental accounting and financial reporting standards, the reporting entity consists of the primary government, organizations for which the primary government is financially accountable, and other organizations for which the nature and significance of their relationship with the primary government are such that exclusion would cause the City’s financial statements to be misleading or incomplete. The primary government is financially accountable if it appoints a voting majority of an organization’s governing body and imposes its will on that organization. The primary government may also be financially accountable if an organization is fiscally dependent on the primary government regardless of the authority of the organization’s governing board. Legally separate organizations outside of the primary government, which meet the criteria for financial accountability, are component units of the reporting entity. Blended Component Unit. The Boynton Beach Community Redevelopment Agency operates under the authority of Florida Statute Chapter 163, Part III and City Ordinance Number 83-41 to finance and develop certain targeted areas in the City. The City is financially accountable for the CRA and in accordance with City Ordinance Number 11-009 and pursuant to Florida Statutes, Section 163.357, the Mayor and City Commissioners plus two (2) additional members appointed by the City Commission comprise the governing board of the CRA, approve its budget, and guarantee its debt. Accordingly, the CRA meets the criteria to blend its activities within the funds of these financial statements. The CRA has a September 30 year-end and issues separate, audited financial statements which are available at: 710 North Federal Highway, Boynton Beach, Florida, 33435. Joint Venture. The South Central Regional Wastewater Treatment and Disposal Board is an independent special district created by the cities of Boynton Beach and Delray Beach to operate a regional wastewater treatment facility. The Board’s governing body is comprised of the City Commissions of Boynton Beach and Delray Beach, who exercise equal control and oversight. The City accounts for its investment in the Board as a joint venture recorded on the equity method of accounting as discussed in Note 4.E. The Board has a September 30 year-end and issues separate, audited financial statements which are available at their administrative offices located at 1801 North Congress Avenue, Delray Beach, Florida, 33445. Related Organization. The Quantum Park Overlay Dependent District (the “District”) was created on October 18, 2005 by City Ordinance 05-061 pursuant to the Florida Uniform Dependent District Act of 1980. Members of the District’s governing body are elected at bi-annual meetings of the landowners in the District, although members of the governing body are subject to removal by the City Commission. The City does not provide funding, approve budgets, retain any financial interest or have any obligation for debt and cannot impose its will on the District. Accordingly, the District is not included in the City’s financial reporting entity. B. Government-Wide Financial Statements The government-wide financial statements include the statement of net assets and the statement of activities on all the non-fiduciary activities. Both statements report separate information on the governmental activities and the business-type activities of the City and its component unit. Governmental activities are functions primarily supported by taxes and grants. Business-type activities are those functions supported by charges for services and fees.
II-32
THE CITY OF BOYNTON BEACH
FY 2011 COMPREHENSIVE ANNUAL FINANCIAL REPORT
NOTES TO THE FINANCIAL STATEMENTS
September 30, 2011
II-33
1. Summary of Significant Accounting Policies (Continued) B. Government-Wide Financial Statements (Continued) The statement of activities demonstrates the degree to which the direct expenses of a given function or program is offset by program revenues. Direct expenses are those that are clearly identifiable with a specific function or program. Program revenues include 1) charges to customers or applicants who purchase, use, or directly benefit from goods, services, or privileges provided by a given function or program and 2) grants and contributions that are restricted to meeting the operational or capital requirements of a particular function or program. Taxes and other items not properly included among program revenues are reported as general revenues. C. Fund Financial Statements The basic financial statements include separate fund financial statements for governmental funds, proprietary funds, and fiduciary funds, even though the latter are excluded from the government-wide financial statements. The governmental funds and enterprise funds financial statements report major funds as separate columns in the respective fund financial statements. The City reports the following funds as major governmental funds:
The General Fund (the City's primary operating fund) accounts for all financial resources of the general government, except those required to be accounted for in another fund.
The Boynton Beach CRA Special Revenue Fund accounts for the activity and redevelopment projects of the CRA covering an identified area in downtown Boynton Beach.
The Public Service Tax Debt Service Fund accounts for the payment of principal and interest on the City’s revenue bonds secured by public service taxes.
The City reports the following major proprietary funds: The Water And Sewer Fund accounts for the activities related to providing water, wastewater and stormwater services to the public.
The Sanitation Fund accounts for the activities related to providing trash collection and disposal services to the public.
Additionally, the City reports the following fund types:
Internal Service Funds account for the activities related to providing fleet services, risk management, and warehouse services to other departments of the City.
Pension Trust Funds account for the activities of the pension funds which accumulate resources for pension benefit payments to City employees.
D. Measurement Focus and Basis of Accounting The government-wide financial statements are reported using the economic resources measurement focus and the accrual basis of accounting, as are the proprietary fund and fiduciary fund financial statements. Revenues are recorded when earned and expenses are recorded when a liability is incurred, regardless of the timing of related cash flows. Property taxes are recognized as revenues in the year for which they are levied. Grants and similar items are recognized as revenue as soon as all eligibility requirements imposed by the provider have been met. Water and sewer and other proprietary fund revenues are recognized as earned when the services are provided.
II-33
THE CITY OF BOYNTON BEACH
FY 2011 COMPREHENSIVE ANNUAL FINANCIAL REPORT
NOTES TO THE FINANCIAL STATEMENTS
September 30, 2011
II-34
1. Summary of Significant Accounting Policies (Continued) D. Measurement Focus and Basis of Accounting (Continued) Governmental fund financial statements are reported using the current financial resources measurement focus and the modified accrual basis of accounting. Revenues are recognized as soon as they are both measurable and available. Revenues are considered available when they are collectible within the current period or soon enough thereafter to pay liabilities of the current period. For this purpose, the City considers revenues available if collected within 60 days of the end of the current fiscal year. Property taxes, franchise taxes, public service taxes, state shared revenues and charges for services and interest associated with the current fiscal period are all considered susceptible to accrual and are recognized as revenues of the current fiscal period. Only the portion of the special assessment receivable due within the current fiscal period is considered susceptible to accrual as revenue of the current fiscal period. Business taxes collected in advance of periods to which they relate are recorded as unearned revenue. Grant revenue is recorded when the related expenditures/expenses are incurred and the eligibility requirements have been met. All other revenue items are measurable and available only when the City receives the cash. Expenditures generally are recorded when a liability is incurred, as under accrual accounting. However, debt service expenditures, as well as expenditures related to compensated absences and claims and judgments, are recorded only when payment is due. E. Financial Statement Presentation The City maintains its accounting records in accordance with the principles and policies applicable to governmental units set forth by the Governmental Accounting Standards Board (GASB) as well as accounting principles promulgated by the American Institute of Certified Public Accountants and the Financial Accounting Standards Board (FASB), which collectively comprise accounting principles generally accepted in the United States of America (GAAP) applicable to governments. The enterprise funds do not apply FASB statements and interpretations issued after November 30, 1989. As a general rule the effect of interfund activity has been eliminated from the government-wide financial statements. Exceptions to this general rule are payment-in-lieu of taxes where the amounts are reasonably equivalent in value to the interfund services provided and other charges between the City's water and sewer function and various other functions of the government. Amounts reported as program revenues include: (1) charges to customers or applicants for goods, services, or privileges provided, (2) operating grants and contributions, and (3) capital grants and contributions, including special assessments. Internally dedicated resources are reported as general revenues rather than as program revenues. Likewise, general revenues include all taxes. Proprietary funds distinguish operating revenues and expenses from nonoperating items. Operating revenues and expenses generally result from providing services and producing and delivering goods in connection with a proprietary fund's principal ongoing operations. The principal operating revenues of the water and sewer, sanitation, and other enterprise funds, and of the City's internal service funds are charges to customers for sales and services. Operating expenses for enterprise funds and internal service funds include the cost of sales and services, administrative expenses, and depreciation on capital assets. All revenues and expenses not meeting this definition are reported as nonoperating revenues and expenses. When both restricted and unrestricted resources are available for use, it is the City's policy to use restricted resources first, then unrestricted resources as they are needed.
II-34
THE CITY OF BOYNTON BEACH
FY 2011 COMPREHENSIVE ANNUAL FINANCIAL REPORT
NOTES TO THE FINANCIAL STATEMENTS
September 30, 2011
II-35
1. Summary of Significant Accounting Policies (Continued) F. Pooled Cash and Investments Cash and cash equivalents consist of cash on hand, demand deposits with financial institutions, money market mutual funds, and pooled investments with the Florida Municipal Investment Trust. Interest earned on pooled cash and investments is allocated to funds based on their average daily cash balances. For purposes of the statement of cash flows, the City considers all highly liquid investments (including restricted assets) with an original maturity of three months or less to be cash equivalents. All deposits with financial institutions were entirely covered by a combination of federal depository insurance and a collateral pool pledged to the State Treasurer of Florida by financial institutions which comply with the requirements of Florida Statutes and have been designated as a qualified public depository. Qualified public depositories are required to pledge collateral to the State Treasurer with a fair value equal to a percentage of the average daily balance of all government deposits in excess of any federal deposit insurance. In the event of a default by a qualified public depository, all claims for government deposits would be satisfied by the State Treasurer from the proceeds of federal deposit insurance, pledged collateral of the public depository in default and, if necessary, a pro rata assessment to the other qualified public depositories in the collateral pool. The Florida Municipal Investment Trust (the "Trust") is an external investment pool established in 1993 and administered by the Florida League of Cities, Inc. pursuant to the laws of the State of Florida. The Trust is exempt from registration under the Securities Act of 1933, the Investment Company Act of 1940 and the Florida Securities and Investors Protection Act. Participants in the Trust are limited to governmental entities in the State of Florida. The Trust operates five fixed income and five equity portfolios with differing investment goals. The City invests in three fixed income portfolios as follows: 1) the 0 -2 Year High Quality Bond Fund; 2) the 1-3 Year High Quality Bond Fund; and, 3) the Intermediate High Quality Bond Fund which are designed to provide an investment horizon and yield greater than that of money market instruments. The fair value of the City's position in the Trust is the same as the fair value of the Trust shares. For all funds except the pension trust funds, investments consist of U.S. Government and Agency obligations, the “Trust”, money market funds and time deposits. Investments of the pension trust funds consist of money market funds, equity and bond mutual funds, U.S. Government and Agency obligations, corporate bonds, and common stocks. City and Pension Trust Fund investment policies do not allow investments in derivatives. All investments are reported at fair value based on quoted market prices. Purchases and sales of investments are recorded on the trade dates. Net realized gains and losses on sales of investments are reflected in current operating results as investment earnings. The calculation of realized gains and losses is separate from the calculation of the net change in the fair value of investments. Realized gains and losses on investments held at the end of the prior year and sold during the current year include the change in fair value from the beginning of the year to the date sold. G. Receivables and Payables Activity between funds that represents interfund lending / borrowing that is outstanding at year end is classified as “due to/due from other funds”. Any such balances outstanding between governmental activities and business-type activities in the government-wide financial statements are classified as “internal balances.” All property tax and other receivables are reported net of an allowance for uncollectible accounts. H. Prepaid Items and Inventories Expenditures/expenses for insurance premiums and other administrative expenses extending over more than one accounting period are accounted for as prepaid items and allocated between accounting periods. Inventories are valued at average cost which approximates market. Inventories are accounted for using the consumption method, whereby inventories are recorded as expenditures in the period when used.
II-35
THE CITY OF BOYNTON BEACH
FY 2011 COMPREHENSIVE ANNUAL FINANCIAL REPORT
NOTES TO THE FINANCIAL STATEMENTS
September 30, 2011
II-36
1. Summary of Significant Accounting Policies (Continued) I. Investment in Joint Venture The City accounts for its investment in the jointly owned South Central Regional Wastewater Treat and Disposal Board as a joint venture recorded on the equity method of accounting. This investment is included in the City’s Water and Sewer enterprise fund balance sheet as Investment in Joint Venture. See Note 4.E. J. Restricted Assets The City classifies certain amounts of pooled cash and investments as restricted assets because their use is primarily restricted to assets related to the Water & Sewer Enterprise Fund for capital improvements, revenue bond covenant requirements, and monies held for customers as security deposits. The City also classifies an amount in accordance with Federal requirements pertaining to closure monitoring of a landfill site in the Sanitation Enterprise Fund. K. Capital Assets Capital assets include land, buildings, equipment, and infrastructure. The City reports these assets in the applicable governmental or business-type activities columns in the government-wide statement of net assets and in the balance sheets of enterprise and internal service funds. The City defines capital assets as assets with an initial, individual cost of more than $750 and an estimated useful life in excess of one year. Donated capital assets are recorded at estimated fair value at the date of donation. Capital asset acquisitions are recorded as expenditures in the governmental fund financial statements. All costs relating to the construction of facilities are capitalized including salaries, employee benefits, contracted services, and materials. The City includes interest incurred during the construction phase of capital assets of business-type activities as part of the capitalized value of the assets constructed. Costs which materially extend the useful life of existing properties are capitalized. However, the City does not capitalize the costs of normal maintenance and repairs that do not add to the value of the asset or materially extend asset lives. Infrastructure assets of the governmental activities are reported in the government-wide financial statements. Governmental activities infrastructure assets include roads, bridges, streets and sidewalks, curbs and gutters, lighting systems and similar assets that are immovable and of value only to the City. The City has historically reported business-type activities infrastructure assets in a manner consistent with the requirements of GASB Statement No. 34. The City calculates depreciation of capital assets using the straight-line method over the following estimated useful lives of the related assets:
Equipment 5-12 years Buildings and other improvements 10-40 years Water/sewer system 15-50 years Infrastructure 15-50 years
II-36
THE CITY OF BOYNTON BEACH
FY 2011 COMPREHENSIVE ANNUAL FINANCIAL REPORT
NOTES TO THE FINANCIAL STATEMENTS
September 30, 2011
II-37
1. Summary of Significant Accounting Policies (Continued) L. Unearned/Deferred Revenue Unearned revenue in the Governmental Activities and deferred revenue in the Governmental Funds includes amounts received in advance for business licenses, grants and long-term receivables for various housing assistance programs provided by the City. Unearned revenue in the Business-type Activities and Proprietary Funds is composed of advance utility payments from customers and other amounts received in advance of the related services being provided by the City. M. Compensated Absences It is the City's policy to permit employees to accumulate earned but unused vacation and sick pay benefits in varying amounts based on length of service. Upon termination, employees are paid accumulated vacation at full rates. Upon termination, employees will be compensated up to a maximum of 50% of accumulated sick leave, depending on hire date and length of service. Compensated absences are accrued when incurred in the government-wide and proprietary fund financial statements. A liability for these amounts is reported in the governmental funds only if they have matured, for example, as a result of employee resignations and retirements. N. Long-Term Obligations In the government-wide financial statements, and proprietary fund types in the fund financial statements, long-term debt and other long-term obligations are reported as liabilities in the applicable governmental activities, business-type activities, or proprietary fund type statement of net assets. Bond premiums and discounts, as well as issuance costs, are deferred and amortized over the life of the bonds using the effective interest method. Bonds payable are reported net of the applicable bond premium or discount. Bond issuance costs are reported as deferred charges and amortized over the term of the related debt. In the fund financial statements, governmental fund types recognize bond premiums and discounts, as well as bond issuance costs, during the current period. The face amount of debt issued is reported as other financing sources. Premiums received on debt issuances are reported as other financing sources while discounts on debt are reported as other financing uses. Issuance costs, whether or not withheld from the actual debt proceeds received, are reported as debt service expenditures. O. Fund Balance/Net Assets Change in Accounting - The GASB issued Statement No. 54, Fund Balance Reporting and Governmental Fund Type Definitions, which establishes accounting and financial reporting requirements for all governmental funds and establishes criteria for classifying fund balances. The City implemented Statement No. 54 for the fiscal year ended September 30, 2011.
Nature and Purpose of Fund Equity Classifications - In the fund financial statements, governmental funds report fund equity classifications that comprise a hierarchy based primarily on the extent to which the City is legally bound to honor the specific purposes for which amounts in fund balance may be spent. The fund balance classifications are summarized as follows:
Nonspendable - Nonspendable fund balances include amounts that cannot be spent because they are either 1) not in spendable form; or, 2) legally or contractually required to be maintained intact.
Restricted - Restricted fund balances include amounts that are restricted to specific purposes either by 1) constraints placed on the use of resources by creditors, grantors, contributors, or laws or regulations of other governments; or, 2) imposed by law through constitutional provisions or enabling legislation.
II-37

THE CITY OF BOYNTON BEACH
FY 2011 COMPREHENSIVE ANNUAL FINANCIAL REPORT
NOTES TO THE FINANCIAL STATEMENTS
September 30, 2011
II-38
1. Summary of Significant Accounting Policies (Continued) O. Fund Balance/Net Assets (Continued)
Committed - Committed fund balances include amounts that can only be used for specific purposes pursuant to constraints imposed by the City Commission through an ordinance or resolution.
Assigned - Assigned fund balances include amounts that are constrained by the City’s intent to be used for specific purposes. The intent shall be expressed by City Commission or by a City Official or other Board to which the City Commission designates its authority. Unassigned - Unassigned fund balances include amounts that are not assigned to other funds and have not been restricted, committed, or assigned to specific purposes within the General Fund.
The City considers restricted fund balances to be spent when an expenditure is incurred for the restricted purpose. The City considers committed, assigned or unassigned fund balances to be spent when an expenditure is incurred for purposes for which amounts in any of those fund balance classifications could be used.
Minimum Fund Balance Policy - Generally, the City strives to maintain 10% to 20% of the following year’s budgeted expenditures to provide for short term revenue fluctuations and other emergency purposes. Net Assets Net assets of the government-wide and proprietary funds are categorized as invested in capital assets, net of related debt, restricted or unrestricted. Invested in capital assets, net of related debt is that portion of net assets that relates to the City’s capital assets reduced by the portion of the assets that has been acquired through the use of long-term debt. This amount is offset by any unspent proceeds that are outstanding at fiscal year-end. Restricted net assets are that portion of net assets that has been restricted for general use by external parties (creditors, grantors, contributors, or laws or regulations of other governments) or imposed by law through constitutional provisions or enabling legislation. The government-wide statement of net assets reports governmental activities net assets of $3,289,038 restricted for debt service and special projects and business-type activities net assets of $27,526,325 restricted for debt service and capital projects. Unrestricted net assets consist of net assets not included in invested in capital assets, net of related debt or restricted. P. Restricted Net Assets Net assets of the enterprise funds are restricted for the following: Capital Improvements—net assets of the Water and Sewer Fund reserved for renewal and replacement represent the excess of restricted assets required for renewal and replacement over the related liabilities payable from restricted assets. Revenue Bond Covenants—net assets of the Water and Sewer Fund reserved for revenue bond debt service represent the excess of restricted assets required for debt service under bond covenants over the related liabilities payable from restricted assets. Q. Property Taxes Ad valorem property taxes are assessed as of January 1 and levied the following October. They are due March 31 and become delinquent on April 1. Delinquent tax certificates are sold on June 1 and become a lien on the property. These taxes are collected by the Palm Beach County Tax Collector and remitted to the City. Revenue is recognized at the time monies are received from Palm Beach County. At September 30, unpaid
II-38
THE CITY OF BOYNTON BEACH
FY 2011 COMPREHENSIVE ANNUAL FINANCIAL REPORT
NOTES TO THE FINANCIAL STATEMENTS
September 30, 2011
II-39
1. Summary of Significant Accounting Policies (Continued) Q. Property Taxes (Continued) delinquent taxes are recorded as a receivable and offset by an allowance for estimated uncollectibility. During 2007, the Florida Legislature passed property tax reform legislation limiting the property tax levies of local governments in the State of Florida. Local governments that adopt a property tax levy in excess of the limit under State law will lose their Half-Cent Sales Tax distribution from the State for the succeeding twelve months. For the fiscal year ended September 30, 2011, the maximum tax levy allowed by a majority vote of the governing body is generally based on a percentage reduction applied to the prior year (2009/2010) property tax revenue. The percentage reduction is calculated based on the compound annual growth rate in the per capita property taxes levied for five preceding fiscal years. The State law allows local governments to adopt a higher millage rate based on the following approval of the governing body: 1) a majority vote to adopt a rate equal to the adjusted current year rolled-back millage rate plus an adjustment for growth in per capita Florida personal income; 2) a two-thirds vote to adopt a rate equal to the adjusted current year roll back millage rate plus 10%; or, 3) any millage rate approved by unanimous vote or referendum. R. On-behalf Payments The City receives on-behalf payments from the State of Florida to be used for Police Officers and Firefighters pension benefits. Such payments are recorded as intergovernmental revenue and public safety expenditures in the GAAP basis government-wide and General Fund financial statements, but are not budgeted and therefore are not included in the General Fund budgetary comparison statement. On-behalf payments to the City totaled $1,567,698 for the fiscal year ended September 30, 2011. S. Amortization For the government-wide financial statements and proprietary fund types, bond discounts and premiums are amortized using the interest method. Deferred issuance costs are amortized using the straight-line method over the term of the respective debt issues, which approximates the interest method. Losses resulting from the refinancing of debt are deferred and amortized over the remaining life of the old debt or the life of the new debt, whichever is shorter. T. Interfund Transactions Transactions between funds during the year consisted of loans, services provided, reimbursements or transfers. Loans are reported in the fund financial statements as Due from Other Funds and Due to Other Funds as appropriate and are subject to elimination in the government-wide financial statements. Services, deemed to be reasonably equivalent in value, are treated as revenue and expenditures/expenses. Reimbursements are when one fund incurs a cost, charges the appropriate benefiting fund and reduces its related cost as a reimbursement. All other interfund transactions are presented as transfers. Transfers within the governmental and business-type activities are eliminated in the government-wide financial statements.
U. Use of Estimates Management uses estimates and assumptions in preparing financial statements in accordance with U.S. generally accepted accounting principles. Those estimates and assumptions affect the reported amounts of assets and liabilities, the disclosure of contingent assets and liabilities, and the reported revenues and expenditures. Actual results could vary from the estimates that were used.
II-39
THE CITY OF BOYNTON BEACH
FY 2011 COMPREHENSIVE ANNUAL FINANCIAL REPORT
NOTES TO THE FINANCIAL STATEMENTS
September 30, 2011
II-40
1. Summary of Significant Accounting Policies (Continued) V. Recent Accounting Pronouncements GASB has issued the following Statements effective in future years. Management has not completed its analysis of the effects, if any, of these GASB statements on the financial statements of the City. GASB Statement No. 61, The Financial Reporting Entity: Omnibus-an amendment of GASB Statements 14 and 34, which modifies certain requirements for including of component units in the financial reporting entity. The requirements of this statement will be effective for the City for the fiscal year ending September 30, 2013. GASB Statement No. 62, Codification of Accounting and Financial Reporting Guidance Contained in Pre-November 30, 1989 FASB and AICPA Pronouncements, which incorporates into GASB authoritative literature certain accounting and financial reporting guidance included in pronouncements of the Financial Accounting Standards Board (FASB) and American Institute of Certified Public Accountants (AICPA). The requirements of this statement will be effective for the City for the fiscal year ending September 30, 2013. GASB Statement No. 63, Financial Reporting of Deferred Outflows of Resources, Deferred Inflows of Resources, and Net Position, provides financial reporting guidance for deferred outflows and deferred inflows of resources, which relate to the consumption of net assets by the government that is applicable to a future reporting period and an acquisition of net assets by the government that is applicable to a future reporting period, respectively. The requirements of this statement will be effective for the City for the fiscal year ending September 30, 2013. GASB Statement No. 65, Items Previously Reported as Assets and Liabilities, provides accounting and financial reporting standards for deferred outflows of resources or deferred inflows of resources and certain items that were previously reported as assets and liabilities and recognizes these items as outflows of resources or inflows of resources that were previously reported as assets and liabilities. The requirements of this statement will be effective for the City for the fiscal year ending September 30, 2014. GASB Statement No. 66, Technical Corrections – 2012 – An Amendment of GASB Statements No. 10 and No. 62, amends Statement No. 10, Accounting and Financial Reporting for Risk Financing and Related Insurance Issues, by removing the provision that limits fund-based reporting of an entity’s risk financing activities to the general fund and the internal service fund type. This Statement also amends Statement No. 62 by modifying the specific guidance on accounting for (1) operating lease payments that vary from a straight-line basis, (2) the difference between the initial investment (purchase price) and the principal amount of a purchased loan or group of loans, and (3) servicing fees related to mortgage loans that are sold when the stated service fee rate differs significantly from a current (normal) servicing fee rate. The requirements of this statement will be effective for the City for the fiscal year ending September 30, 2014. GASB Statement No. 67, Financial Reporting for Pension Plans – An Amendment of GASB Statement No. 25, provides accounting and financial reporting requirements related to pensions for governments whose employees are provided with pensions through pension plans. The Statement establishes a definition for pension arrangements and determining pension obligations and requirements for accumulating and managing assets dedicated for pensions, and paying benefits to plan members as they come due. The requirements of this statement will be effective for the City for the fiscal year ending September 30, 2014. GASB Statement No. 68, Accounting and Financial Reporting for Pension – An Amendment of GASB Statement No. 27, provides accounting and financial reporting requirements related to pensions for governments whose employees are provided with pensions through pension plans. The Statement establishes a definition for pension arrangements and determining pension obligations and requirements for accumulating and managing assets dedicated for pensions, and paying benefits to plan members as they come due. The requirements of this statement will be effective for the City for the fiscal year ending September 30, 2015.
II-40
THE CITY OF BOYNTON BEACH
FY 2011 COMPREHENSIVE ANNUAL FINANCIAL REPORT
NOTES TO THE FINANCIAL STATEMENTS
September 30, 2011
II-41
2. Reconciliation of Government-wide and Fund Financial Statements A. Explanation of certain differences between the governmental fund balance sheet and the government-
wide statement of net assets The governmental fund balance sheet includes a reconciliation between fund balance-total governmental funds and net assets-governmental activities as reported in the government-wide statement of net assets. One element of that reconciliation explains that “long-term liabilities, including bonds payable, are not due and payable in the current period and therefore are not reported in the funds.” The details of this $57,178,441 difference are as follows:
Bonds payable Notes payable Unamortized premium Unamortized discount Net adjustment to reduce fund balance – Total governmental funds to arrive at net assets-governmental activities
$ 54,665,000 1,308,713 1,351,685 (146,957) $ 57,178,441
3. Stewardship, Compliance, and Accountability A. Concentration of Credit Risk The City performs ongoing credit evaluations of its customers and generally does not require collateral, except for customer deposits in the City's Water and Sewer Fund. The City maintains an allowance for doubtful accounts at a level which management believes is sufficient to cover potential credit losses. Generally, the allowance includes accounts over 90 days past due. Accounts receivable are written off on an individual basis in the year the City deems them uncollectible. B. Encumbrances Encumbrance accounting, under which purchase orders, contracts and other commitments for the expenditure of funds are recorded in order to reserve that portion of the applicable appropriation, is employed as part of the budget accounting system in the general, special revenue and capital projects funds. The City records encumbrances as an appropriation of fund balance until expended or accrued as a liability of the fund. C. Budgets and the Budgeting Process The City follows these procedures in establishing the budgetary data reflected in the financial statements:
1) Prior to July 15, the City Manager submits a tentative budget to the City Commission for consideration and approval. The budget, which is prepared by fund, function and activity, is made available to the public at this time.
2) Informal budget workshops are held by the City Commission to review the proposed budget and to obtain
public comment.
3) The City advises the Palm Beach County Tax Collector of the proposed millage rate, the rolled-back millage rate, and the day, time and place of the public hearing for budget acceptance.
4) The public hearing is held to obtain final taxpayer input and to adopt the final budget.
II-41
THE CITY OF BOYNTON BEACH
FY 2011 COMPREHENSIVE ANNUAL FINANCIAL REPORT
NOTES TO THE FINANCIAL STATEMENTS
September 30, 2011
II-42
3. Stewardship, Compliance, and Accountability (Continued) C. Budgets and the Budgeting Process (Continued)
5) The budget and related millage rates are legally enacted through passage of an ordinance.
6) Changes or amendments to the total budgeted expenditures of a fund and transfers between funds must be approved by the City Commission. There were no amendments to total budgeted expenditures and other financing uses. Department heads may transfer appropriations within a department with the approval of the Financial Services Department. Changes or amendments to the total budgeted expenditures of a department require approval of the City Manager. Accordingly, the legal level of control for appropriations is exercised at the fund level.
Appropriated budgets are legally adopted for the General Fund; Local Option Gas Tax Fund, Community Improvements Fund, Recreation Program Fund, Boynton Beach Memorial Park Fund (special revenue funds); Promissory Note Debt Service Fund, Public Service Tax Debt Service Fund (debt service funds); Capital Improvements Fund, and Fire Rescue Capital Improvement Fund (capital projects funds); on a modified-accrual basis excluding on-behalf payments from the State for Police Officers and Firefighters' pension. The General Fund revenues and expenditures reported in the Statement of Revenues, Expenditures and Changes in Fund Balances--Budget and Actual differ from the revenues and expenditures reported on the GAAP Basis. The differences are reconciled as follows:
Revenues Expenditures Budgetary basis On-behalf payments for pension benefits GAAP basis
$ 43,244,562 1,567,698 $ 44,812,260
$ 67,279,954 1,567,698 $ 68,847,652
An appropriated budget is prepared for the Water and Sewer Fund, Recreational Facilities Fund, Sanitation Fund, Mass Transit Fund, Vehicle Service Fund, Warehouse Fund and Self-Insurance Fund. The operations of the Grants Fund, SHIP Fund, Parks and Recreation Facilities Fund and Community Service Fund (special revenue funds) and all fiduciary fund types are non-budgeted financial activities. D. Excess of Expenditures Over Appropriations For the year ended September 30, 2011, expenditures exceeded appropriations at the fund level (the legal level of budgetary control) for the Public Service Tax Debt Service Fund. These over-expenditures were funded by accumulated fund balance of the Public Service Tax Debt Service Fund. E. Deficit Fund Equity The Grants Fund and the Public Art Fund had accumulated deficits of $140,231 and $328,707, respectively as of September 30, 2011. The deficit was caused by program expenditures that were paid but not eligible for reimbursement until more than 60 days after the end of the current fiscal year. The City anticipates receiving these funds in FY 2012. The City anticipated this situation due to the initial and ongoing expenditures and the timing of receipt of program revenues. The City anticipates this will improve during FY2012 and FY2013.
II-42
THE CITY OF BOYNTON BEACH
FY 2011 COMPREHENSIVE ANNUAL FINANCIAL REPORT
NOTES TO THE FINANCIAL STATEMENTS
September 30, 2011
II-43
4. Detailed Notes on All Funds A. Deposits The City’s deposits with financial institutions were entirely covered by a combination of federal depository insurance and a collateral pool pledged to the State Treasurer of Florida by financial institutions which comply with the requirements of Florida Statutes and have been designated as a qualified public depository. Accordingly, the City’s deposits at year end are considered to be fully insured or collateralized with securities held by the entity or by its agent in the entity's name. B. Investments The City adopted an investment policy to establish guidelines for the efficient management of its cash reserves. Section VI of the investment policy identifies permitted instruments as follows: a. U.S. Government securities and U.S. Government Agency obligations; b. State Board of Administration Local Government Surplus Funds Trust Fund; c. Florida Municipal Investment Trust (Florida League of Cities); d. Certificates of deposit or savings accounts in state-certified qualified public depositories; e. Repurchase agreements; f. Money market mutual funds, with portfolios limited to direct obligations of the U.S. Government or any Agency
or Instrumentality thereof; g. Commercial paper, of any United States company that is rated at least “P-1” by Moody’s and “A-1” by
Standard & Poor’s; h. Corporate notes, issued by corporations organized and operating within the United States or by depository
institutions licensed by the United States that have a minimum long term debt rating, at the time of purchase, of “Aa” by Moody’s and “AA” by Standard & Poor’s.
Investments of the General Employees’ Pension Fund are limited to: a. Direct obligations of the U.S. Government with a maturity of one year or less; b. Commercial paper, with a maturity of 270 days or less that is rated “Prime 1” by Moody’s and “A-1” by
Standard & Poor’s; c. The money market mutual fund or short term investment fund provided by the Plan’s custodian; d. Bankers Acceptances issued by the largest 50 banks in the United States (in terms of total assets); e. Corporate bonds, issued by a corporation organized under the laws of the United States, any state or
organized territory of the United States, or the District of Columbia; f. Mortgage-backed securities, issued, guaranteed, or fully insured by the Government National Mortgage
Association (GNMA), the Federal Home Loan Mortgage Corporation (FHLMC), the Federal National Mortgage Association (FNMA) or rated “Aaa” by Moody’s or “AAA” by Standard & Poor’s;
g. Common stocks, with investments in stocks of foreign companies limited to 20% (at cost) of the total investment portfolio, and those stocks publicly traded for less than one year limited to 15% of the equity portfolio.
Investments of the Police Officers’ Pension Fund are limited to: a. Time or savings accounts of a national bank, a state bank insured by the Bank Insurance Fund, or a savings
and loan association insured by the Saving Insurance Association Insurance Fund which is administered by the Federal Deposit Insurance Corporation or a state or federal chartered credit union whose share accounts are insured by the National Credit Union Share Insurance Fund;
b. Obligations issued by the United States Government or obligations guaranteed as to principal and interest by the government of the United States;
II-43
THE CITY OF BOYNTON BEACH
FY 2011 COMPREHENSIVE ANNUAL FINANCIAL REPORT
NOTES TO THE FINANCIAL STATEMENTS
September 30, 2011
II-44
4. Detailed Notes on All Funds (Continued)
B. Investments (Continued) c. Bonds issued by the State of Israel; d. Bonds, stocks, or other evidences of indebtedness issued or guaranteed by a corporation organized under
the laws of the United States or the District of Columbia provided the corporation is listed on one or more of the recognized national exchanges or on the National Market System of the NASDAQ stock market and, in the case of bonds only, the average rating of such investments in bonds shall be no lower than AA;
e. Real estate investment trusts (REIT’S); f. Commingled stock, bond, or money market funds and institutional mutual funds whose investments are
restricted to securities meeting the criteria outlined above. Investments of the Firefighters’ Pension Fund are subject to limitations set forth in Florida Statute Section 215.47 and are limited to: a. Bonds, notes, or other obligations of the United States or those guaranteed by the United States or for which
the credit of the United States is pledged for the payment of the principal and interest or dividends thereof; b. State bonds pledging the full faith and credit of the state and revenue bonds additionally secured by the full
faith and credit of the state; c. Certificates of deposit or savings accounts in state certified qualified public depositories; d. Notes, bonds, or other obligations of agencies of the United States; e. Bankers Acceptances, which are accepted by a member bank of the Federal Reserve System having total
deposits of not less than $400 million; f. Commercial paper, of prime quality of the highest letter and numerical rating as provided for by at least one
nationally recognized rating service; g. Negotiable certificates of deposit by domestic or foreign financial institutions in United States dollars; h. Securities of, or other interests in any open-end or closed-end management type investment company or
investment trust registered under the Investment Company Act of 1940, provided the portfolio of such investment company or investment trust is limited to United States Government obligations and to repurchase agreements fully collateralized by such United States Government obligations, and provided such investment company or investment trust takes delivery of such collateral either directly or through an authorized custodian;
A summary of deposits and investments as shown on the statement of net assets and statement of fiduciary net assets for the City is as follows: Pooled Cash and Investments Cash and Cash Unrestricted Restricted Equivalents Investments Total
Governmental activities Business-type activities
Total statement of net assets Pension Trust Funds
Total deposits and investments
$ 38,681,253 10,034,429 48,715,682 - $ 48,715,682
$ - 33,188,785 33,188,785 - $ 33,188,785
$ - - - 4,942,902 $ 4,942,902
$ - - - 184,011,247 $ 184,011,247
$ 38,681,253 43,223,214 81,904,467 188,954,149 $ 270,858,616
II-44
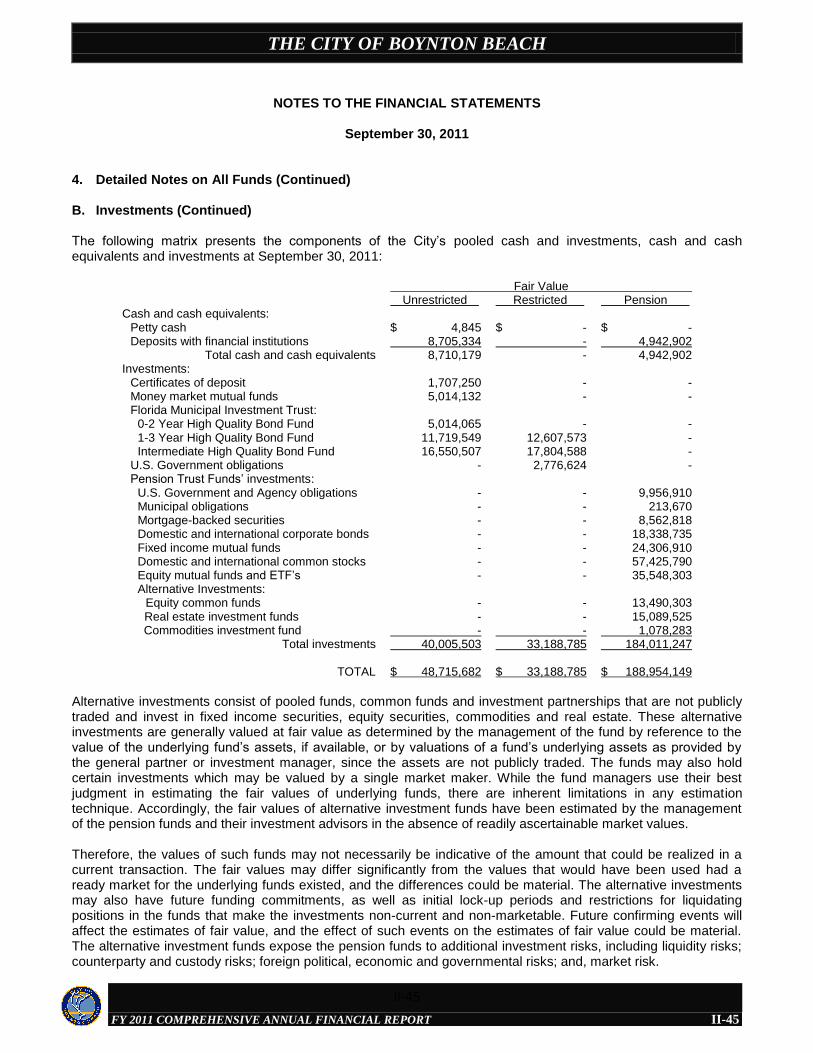
THE CITY OF BOYNTON BEACH
FY 2011 COMPREHENSIVE ANNUAL FINANCIAL REPORT
NOTES TO THE FINANCIAL STATEMENTS
September 30, 2011
II-45
4. Detailed Notes on All Funds (Continued) B. Investments (Continued) The following matrix presents the components of the City’s pooled cash and investments, cash and cash equivalents and investments at September 30, 2011:
Fair Value Unrestricted Restricted Pension Cash and cash equivalents: Petty cash Deposits with financial institutions
Total cash and cash equivalents
$ 4,845 8,705,334 8,710,179
$ - - -
$ - 4,942,902 4,942,902
Investments: Certificates of deposit Money market mutual funds Florida Municipal Investment Trust: 0-2 Year High Quality Bond Fund 1-3 Year High Quality Bond Fund Intermediate High Quality Bond Fund U.S. Government obligations Pension Trust Funds’ investments: U.S. Government and Agency obligations Municipal obligations Mortgage-backed securities Domestic and international corporate bonds Fixed income mutual funds Domestic and international common stocks Equity mutual funds and ETF’s Alternative Investments: Equity common funds Real estate investment funds Commodities investment fund
Total investments
TOTAL
1,707,250 5,014,132 5,014,065 11,719,549 16,550,507 - - - - - - - - - - - 40,005,503 $ 48,715,682
- - - 12,607,573 17,804,588 2,776,624 - - - - - - - - - - 33,188,785 $ 33,188,785
- - - - - - 9,956,910 213,670 8,562,818 18,338,735 24,306,910 57,425,790 35,548,303 13,490,303 15,089,525 1,078,283 184,011,247 $ 188,954,149
Alternative investments consist of pooled funds, common funds and investment partnerships that are not publicly traded and invest in fixed income securities, equity securities, commodities and real estate. These alternative investments are generally valued at fair value as determined by the management of the fund by reference to the value of the underlying fund’s assets, if available, or by valuations of a fund’s underlying assets as provided by the general partner or investment manager, since the assets are not publicly traded. The funds may also hold certain investments which may be valued by a single market maker. While the fund managers use their best judgment in estimating the fair values of underlying funds, there are inherent limitations in any estimation technique. Accordingly, the fair values of alternative investment funds have been estimated by the management of the pension funds and their investment advisors in the absence of readily ascertainable market values. Therefore, the values of such funds may not necessarily be indicative of the amount that could be realized in a current transaction. The fair values may differ significantly from the values that would have been used had a ready market for the underlying funds existed, and the differences could be material. The alternative investments may also have future funding commitments, as well as initial lock-up periods and restrictions for liquidating positions in the funds that make the investments non-current and non-marketable. Future confirming events will affect the estimates of fair value, and the effect of such events on the estimates of fair value could be material. The alternative investment funds expose the pension funds to additional investment risks, including liquidity risks; counterparty and custody risks; foreign political, economic and governmental risks; and, market risk.
II-45
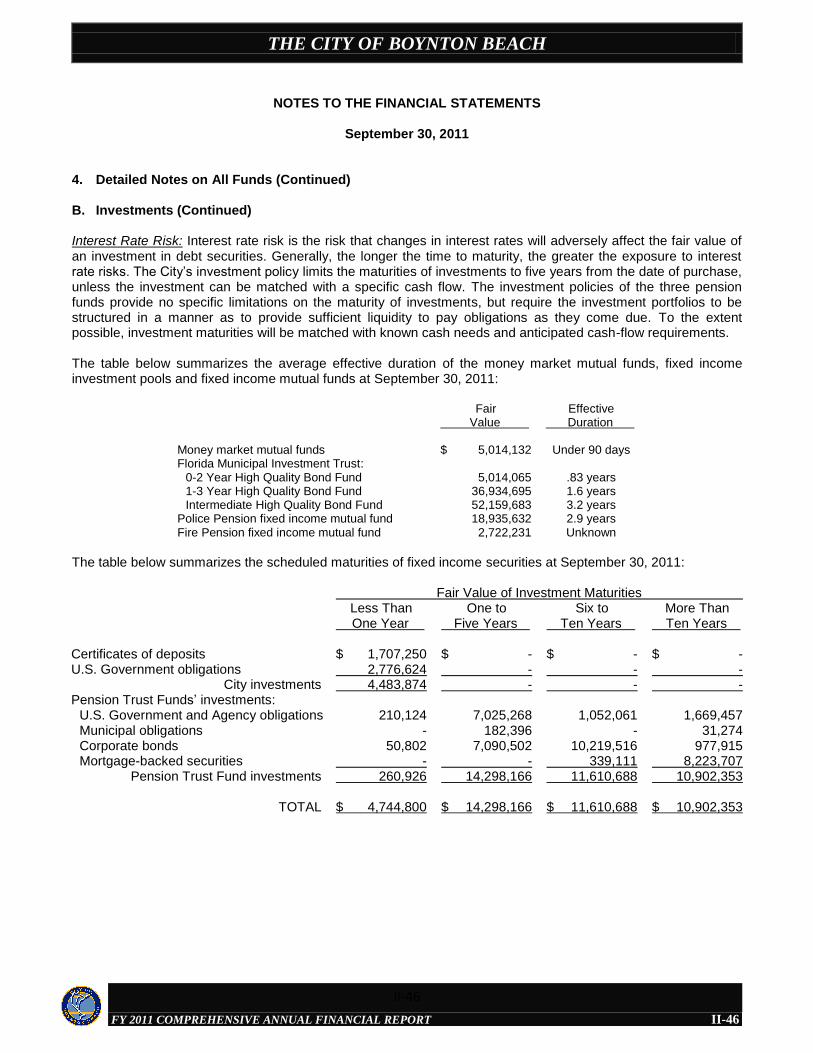
THE CITY OF BOYNTON BEACH
FY 2011 COMPREHENSIVE ANNUAL FINANCIAL REPORT
NOTES TO THE FINANCIAL STATEMENTS
September 30, 2011
II-46
4. Detailed Notes on All Funds (Continued) B. Investments (Continued) Interest Rate Risk: Interest rate risk is the risk that changes in interest rates will adversely affect the fair value of an investment in debt securities. Generally, the longer the time to maturity, the greater the exposure to interest rate risks. The City’s investment policy limits the maturities of investments to five years from the date of purchase, unless the investment can be matched with a specific cash flow. The investment policies of the three pension funds provide no specific limitations on the maturity of investments, but require the investment portfolios to be structured in a manner as to provide sufficient liquidity to pay obligations as they come due. To the extent possible, investment maturities will be matched with known cash needs and anticipated cash-flow requirements. The table below summarizes the average effective duration of the money market mutual funds, fixed income investment pools and fixed income mutual funds at September 30, 2011:
Fair Value
Effective Duration
Money market mutual funds Florida Municipal Investment Trust: 0-2 Year High Quality Bond Fund 1-3 Year High Quality Bond Fund Intermediate High Quality Bond Fund Police Pension fixed income mutual fund Fire Pension fixed income mutual fund
$ 5,014,132 5,014,065 36,934,695 52,159,683 18,935,632 2,722,231
Under 90 days
.83 years 1.6 years 3.2 years 2.9 years Unknown
The table below summarizes the scheduled maturities of fixed income securities at September 30, 2011: Fair Value of Investment Maturities
Less Than One Year
One to Five Years
Six to Ten Years
More Than Ten Years
Certificates of deposits U.S. Government obligations
City investments Pension Trust Funds’ investments: U.S. Government and Agency obligations Municipal obligations Corporate bonds Mortgage-backed securities
Pension Trust Fund investments
TOTAL
$ 1,707,250 2,776,624 4,483,874 210,124 - 50,802 - 260,926 $ 4,744,800
$ - - - 7,025,268 182,396 7,090,502 - 14,298,166 $ 14,298,166
$ - - - 1,052,061 - 10,219,516 339,111 11,610,688 $ 11,610,688
$ - - - 1,669,457 31,274 977,915 8,223,707 10,902,353 $ 10,902,353
II-46
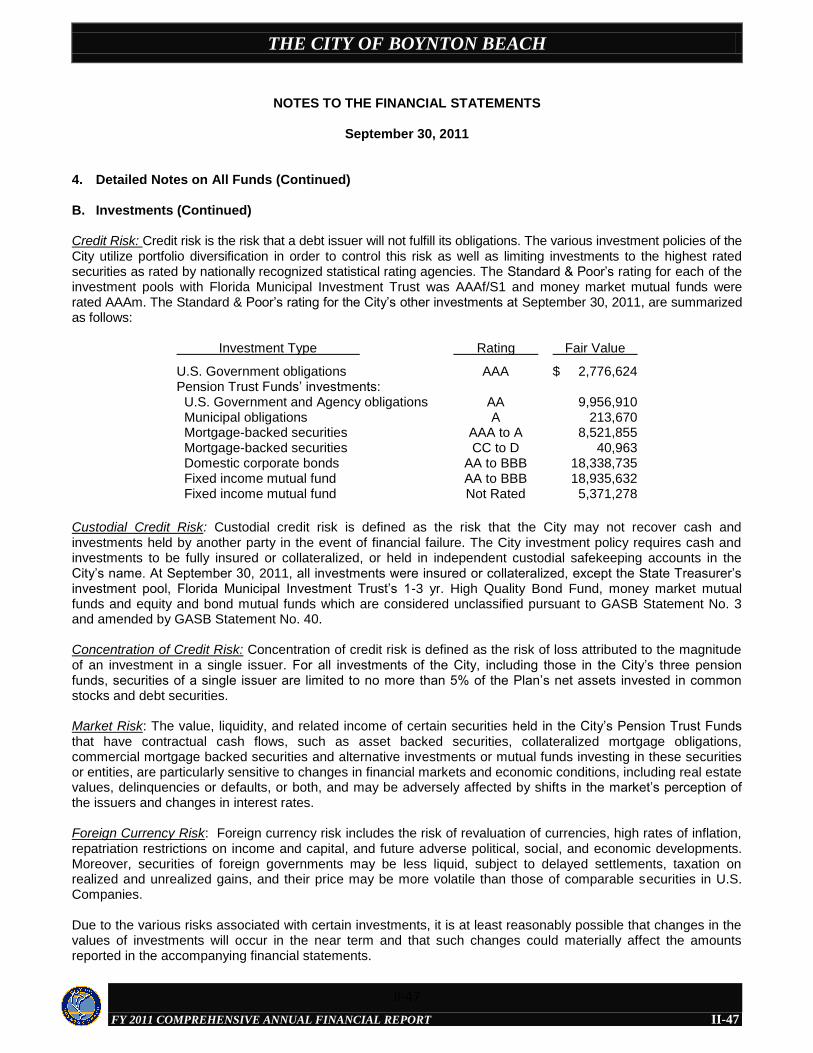
THE CITY OF BOYNTON BEACH
FY 2011 COMPREHENSIVE ANNUAL FINANCIAL REPORT
NOTES TO THE FINANCIAL STATEMENTS
September 30, 2011
II-47
4. Detailed Notes on All Funds (Continued) B. Investments (Continued) Credit Risk: Credit risk is the risk that a debt issuer will not fulfill its obligations. The various investment policies of the City utilize portfolio diversification in order to control this risk as well as limiting investments to the highest rated securities as rated by nationally recognized statistical rating agencies. The Standard & Poor’s rating for each of the investment pools with Florida Municipal Investment Trust was AAAf/S1 and money market mutual funds were rated AAAm. The Standard & Poor’s rating for the City’s other investments at September 30, 2011, are summarized as follows:
Investment Type Rating Fair Value
U.S. Government obligations Pension Trust Funds’ investments: U.S. Government and Agency obligations Municipal obligations Mortgage-backed securities Mortgage-backed securities Domestic corporate bonds Fixed income mutual fund Fixed income mutual fund
AAA
AA A
AAA to A CC to D
AA to BBB AA to BBB Not Rated
$ 2,776,624 9,956,910 213,670 8,521,855 40,963 18,338,735 18,935,632 5,371,278
Custodial Credit Risk: Custodial credit risk is defined as the risk that the City may not recover cash and investments held by another party in the event of financial failure. The City investment policy requires cash and investments to be fully insured or collateralized, or held in independent custodial safekeeping accounts in the City’s name. At September 30, 2011, all investments were insured or collateralized, except the State Treasurer’s investment pool, Florida Municipal Investment Trust’s 1-3 yr. High Quality Bond Fund, money market mutual funds and equity and bond mutual funds which are considered unclassified pursuant to GASB Statement No. 3 and amended by GASB Statement No. 40. Concentration of Credit Risk: Concentration of credit risk is defined as the risk of loss attributed to the magnitude of an investment in a single issuer. For all investments of the City, including those in the City’s three pension funds, securities of a single issuer are limited to no more than 5% of the Plan’s net assets invested in common stocks and debt securities. Market Risk: The value, liquidity, and related income of certain securities held in the City’s Pension Trust Funds that have contractual cash flows, such as asset backed securities, collateralized mortgage obligations, commercial mortgage backed securities and alternative investments or mutual funds investing in these securities or entities, are particularly sensitive to changes in financial markets and economic conditions, including real estate values, delinquencies or defaults, or both, and may be adversely affected by shifts in the market’s perception of the issuers and changes in interest rates. Foreign Currency Risk: Foreign currency risk includes the risk of revaluation of currencies, high rates of inflation, repatriation restrictions on income and capital, and future adverse political, social, and economic developments. Moreover, securities of foreign governments may be less liquid, subject to delayed settlements, taxation on realized and unrealized gains, and their price may be more volatile than those of comparable securities in U.S. Companies. Due to the various risks associated with certain investments, it is at least reasonably possible that changes in the values of investments will occur in the near term and that such changes could materially affect the amounts reported in the accompanying financial statements.
II-47
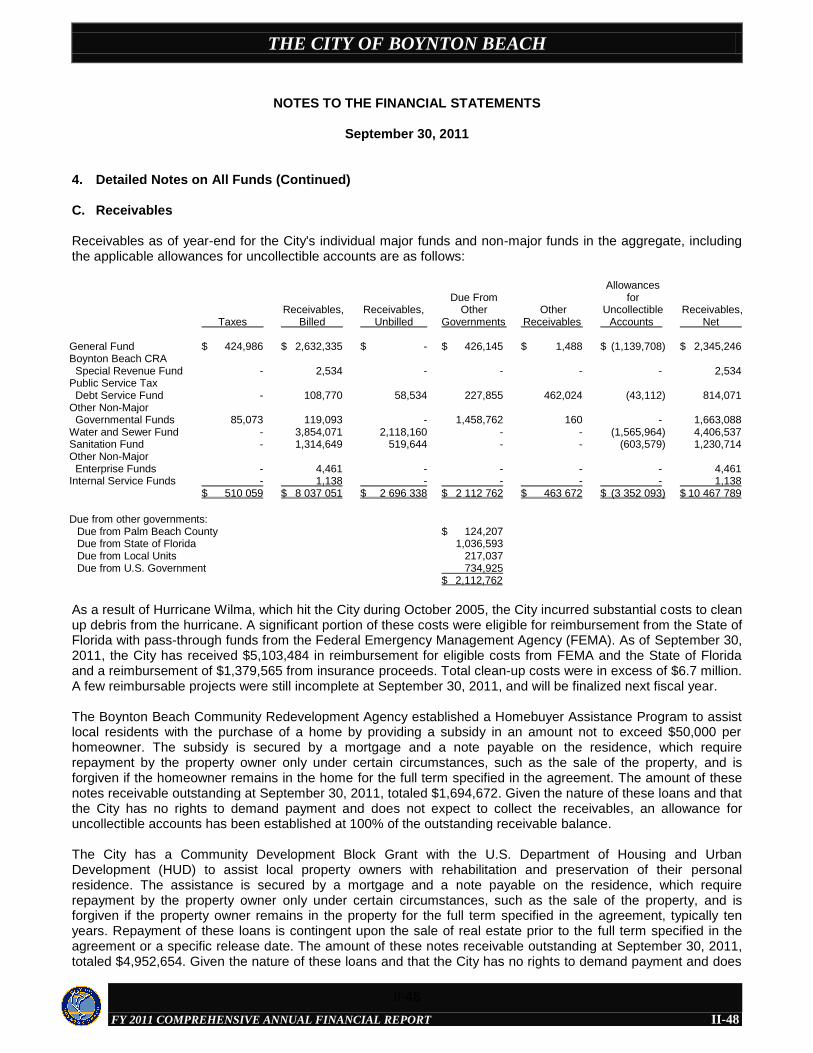
THE CITY OF BOYNTON BEACH
FY 2011 COMPREHENSIVE ANNUAL FINANCIAL REPORT
NOTES TO THE FINANCIAL STATEMENTS
September 30, 2011
II-48
4. Detailed Notes on All Funds (Continued) C. Receivables Receivables as of year-end for the City's individual major funds and non-major funds in the aggregate, including the applicable allowances for uncollectible accounts are as follows:
Taxes
Receivables, Billed
Receivables, Unbilled
Due From
Other Governments
Other Receivables
Allowances for
Uncollectible Accounts
Receivables, Net
General Fund Boynton Beach CRA Special Revenue Fund Public Service Tax Debt Service Fund
$ 424,986 - -
$ 2,632,335 2,534 108,770
$ - - 58,534
$ 426,145 - 227,855
$ 1,488 - 462,024
$ (1,139,708) - (43,112)
$ 2,345,246 2,534 814,071
Other Non-Major Governmental Funds Water and Sewer Fund Sanitation Fund Other Non-Major Enterprise Funds Internal Service Funds
85,073 - - - - $ 510 059
119,093 3,854,071 1,314,649 4,461 1,138 $ 8 037 051
- 2,118,160 519,644 - - $ 2 696 338
1,458,762 - - - - $ 2 112 762
160 - - - - $ 463 672
- (1,565,964) (603,579) - - $ (3 352 093)
1,663,088 4,406,537 1,230,714 4,461 1,138 $ 10 467 789
Due from other governments: Due from Palm Beach County Due from State of Florida Due from Local Units Due from U.S. Government
$ 124,207 1,036,593 217,037 734,925 $ 2,112,762
As a result of Hurricane Wilma, which hit the City during October 2005, the City incurred substantial costs to clean up debris from the hurricane. A significant portion of these costs were eligible for reimbursement from the State of Florida with pass-through funds from the Federal Emergency Management Agency (FEMA). As of September 30, 2011, the City has received $5,103,484 in reimbursement for eligible costs from FEMA and the State of Florida and a reimbursement of $1,379,565 from insurance proceeds. Total clean-up costs were in excess of $6.7 million. A few reimbursable projects were still incomplete at September 30, 2011, and will be finalized next fiscal year. The Boynton Beach Community Redevelopment Agency established a Homebuyer Assistance Program to assist local residents with the purchase of a home by providing a subsidy in an amount not to exceed $50,000 per homeowner. The subsidy is secured by a mortgage and a note payable on the residence, which require repayment by the property owner only under certain circumstances, such as the sale of the property, and is forgiven if the homeowner remains in the home for the full term specified in the agreement. The amount of these notes receivable outstanding at September 30, 2011, totaled $1,694,672. Given the nature of these loans and that the City has no rights to demand payment and does not expect to collect the receivables, an allowance for uncollectible accounts has been established at 100% of the outstanding receivable balance. The City has a Community Development Block Grant with the U.S. Department of Housing and Urban Development (HUD) to assist local property owners with rehabilitation and preservation of their personal residence. The assistance is secured by a mortgage and a note payable on the residence, which require repayment by the property owner only under certain circumstances, such as the sale of the property, and is forgiven if the property owner remains in the property for the full term specified in the agreement, typically ten years. Repayment of these loans is contingent upon the sale of real estate prior to the full term specified in the agreement or a specific release date. The amount of these notes receivable outstanding at September 30, 2011, totaled $4,952,654. Given the nature of these loans and that the City has no rights to demand payment and does
II-48
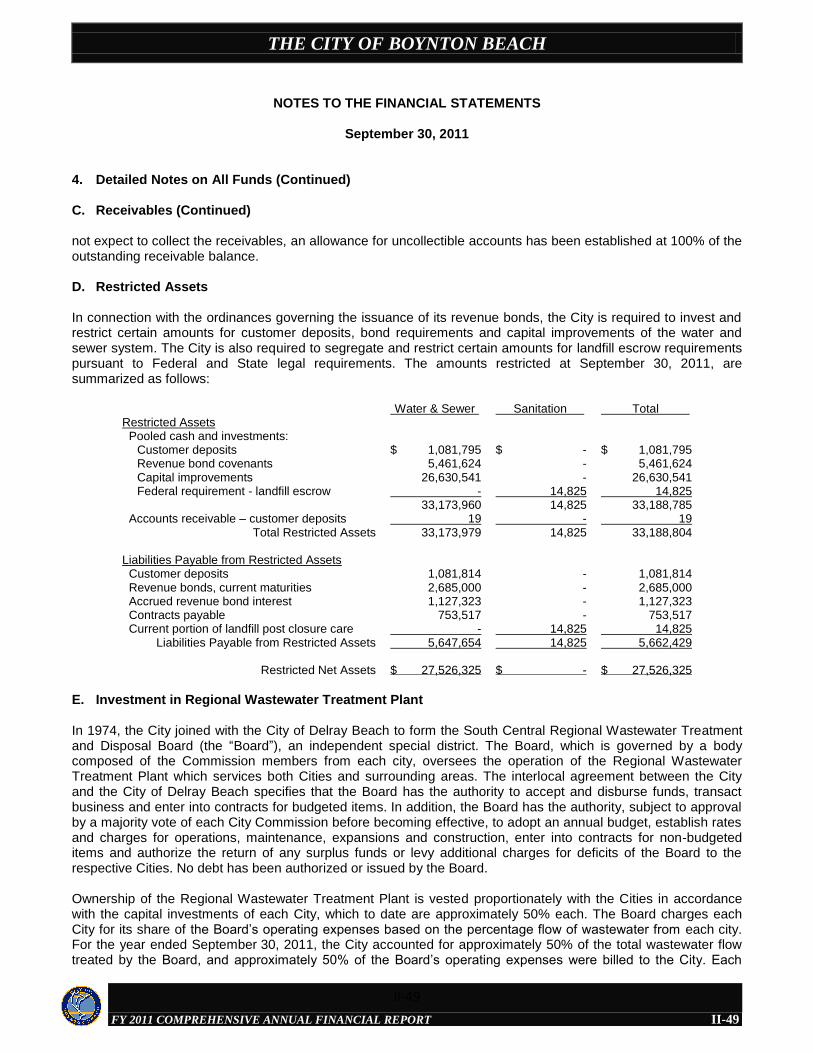
THE CITY OF BOYNTON BEACH
FY 2011 COMPREHENSIVE ANNUAL FINANCIAL REPORT
NOTES TO THE FINANCIAL STATEMENTS
September 30, 2011
II-49
4. Detailed Notes on All Funds (Continued) C. Receivables (Continued) not expect to collect the receivables, an allowance for uncollectible accounts has been established at 100% of the outstanding receivable balance. D. Restricted Assets In connection with the ordinances governing the issuance of its revenue bonds, the City is required to invest and restrict certain amounts for customer deposits, bond requirements and capital improvements of the water and sewer system. The City is also required to segregate and restrict certain amounts for landfill escrow requirements pursuant to Federal and State legal requirements. The amounts restricted at September 30, 2011, are summarized as follows:
Water & Sewer Sanitation Total Restricted Assets Pooled cash and investments: Customer deposits Revenue bond covenants Capital improvements Federal requirement - landfill escrow Accounts receivable – customer deposits
Total Restricted Assets Liabilities Payable from Restricted Assets Customer deposits Revenue bonds, current maturities Accrued revenue bond interest Contracts payable Current portion of landfill post closure care
Liabilities Payable from Restricted Assets
Restricted Net Assets
$ 1,081,795 5,461,624 26,630,541 - 33,173,960 19 33,173,979 1,081,814 2,685,000 1,127,323 753,517 - 5,647,654 $ 27,526,325
$ - - - 14,825 14,825 - 14,825 - - - - 14,825 14,825 $ -
$ 1,081,795 5,461,624 26,630,541 14,825 33,188,785 19 33,188,804 1,081,814 2,685,000 1,127,323 753,517 14,825 5,662,429 $ 27,526,325
E. Investment in Regional Wastewater Treatment Plant In 1974, the City joined with the City of Delray Beach to form the South Central Regional Wastewater Treatment and Disposal Board (the “Board”), an independent special district. The Board, which is governed by a body composed of the Commission members from each city, oversees the operation of the Regional Wastewater Treatment Plant which services both Cities and surrounding areas. The interlocal agreement between the City and the City of Delray Beach specifies that the Board has the authority to accept and disburse funds, transact business and enter into contracts for budgeted items. In addition, the Board has the authority, subject to approval by a majority vote of each City Commission before becoming effective, to adopt an annual budget, establish rates and charges for operations, maintenance, expansions and construction, enter into contracts for non-budgeted items and authorize the return of any surplus funds or levy additional charges for deficits of the Board to the respective Cities. No debt has been authorized or issued by the Board. Ownership of the Regional Wastewater Treatment Plant is vested proportionately with the Cities in accordance with the capital investments of each City, which to date are approximately 50% each. The Board charges each City for its share of the Board’s operating expenses based on the percentage flow of wastewater from each city. For the year ended September 30, 2011, the City accounted for approximately 50% of the total wastewater flow treated by the Board, and approximately 50% of the Board’s operating expenses were billed to the City. Each
II-49
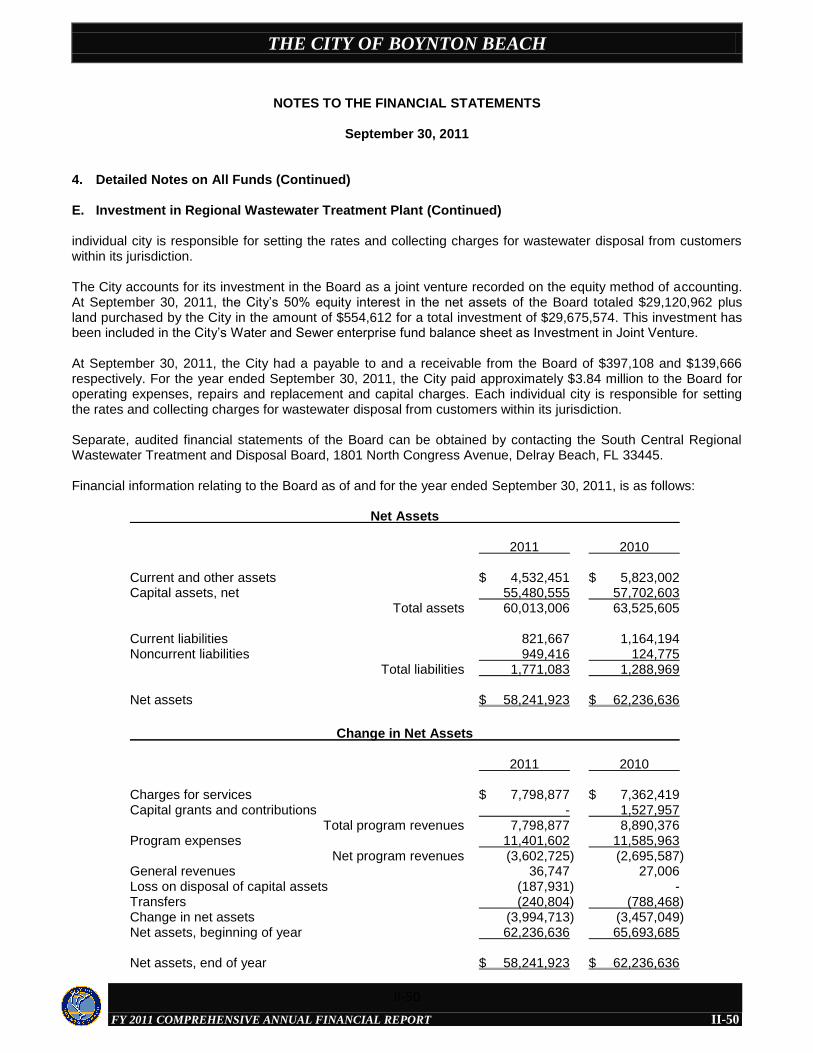
THE CITY OF BOYNTON BEACH
FY 2011 COMPREHENSIVE ANNUAL FINANCIAL REPORT
NOTES TO THE FINANCIAL STATEMENTS
September 30, 2011
II-50
4. Detailed Notes on All Funds (Continued) E. Investment in Regional Wastewater Treatment Plant (Continued) individual city is responsible for setting the rates and collecting charges for wastewater disposal from customers within its jurisdiction. The City accounts for its investment in the Board as a joint venture recorded on the equity method of accounting. At September 30, 2011, the City’s 50% equity interest in the net assets of the Board totaled $29,120,962 plus land purchased by the City in the amount of $554,612 for a total investment of $29,675,574. This investment has been included in the City’s Water and Sewer enterprise fund balance sheet as Investment in Joint Venture. At September 30, 2011, the City had a payable to and a receivable from the Board of $397,108 and $139,666 respectively. For the year ended September 30, 2011, the City paid approximately $3.84 million to the Board for operating expenses, repairs and replacement and capital charges. Each individual city is responsible for setting the rates and collecting charges for wastewater disposal from customers within its jurisdiction. Separate, audited financial statements of the Board can be obtained by contacting the South Central Regional Wastewater Treatment and Disposal Board, 1801 North Congress Avenue, Delray Beach, FL 33445. Financial information relating to the Board as of and for the year ended September 30, 2011, is as follows:
Net Assets
2011 2010
Current and other assets Capital assets, net
Total assets Current liabilities Noncurrent liabilities
Total liabilities Net assets
$ 4,532,451 55,480,555 60,013,006 821,667 949,416 1,771,083 $ 58,241,923
$ 5,823,002 57,702,603 63,525,605 1,164,194 124,775 1,288,969 $ 62,236,636
Change in Net Assets
2011 2010
Charges for services Capital grants and contributions
Total program revenues Program expenses
Net program revenues General revenues Loss on disposal of capital assets Transfers Change in net assets Net assets, beginning of year Net assets, end of year
$ 7,798,877 - 7,798,877 11,401,602 (3,602,725) 36,747 (187,931) (240,804) (3,994,713) 62,236,636 $ 58,241,923
$ 7,362,419 1,527,957 8,890,376 11,585,963 (2,695,587) 27,006 - (788,468) (3,457,049) 65,693,685 $ 62,236,636
II-50
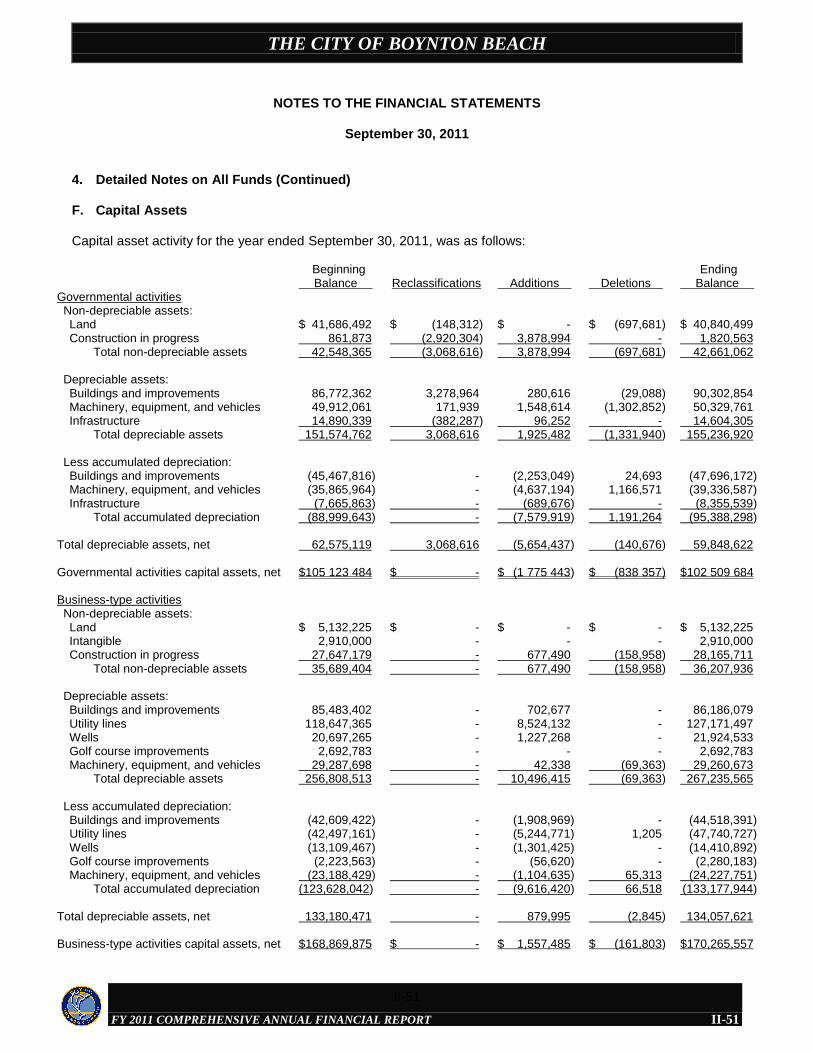
THE CITY OF BOYNTON BEACH
FY 2011 COMPREHENSIVE ANNUAL FINANCIAL REPORT
NOTES TO THE FINANCIAL STATEMENTS
September 30, 2011
II-51
4. Detailed Notes on All Funds (Continued) F. Capital Assets Capital asset activity for the year ended September 30, 2011, was as follows:
Beginning
Balance
Reclassifications
Additions
Deletions
Ending
Balance Governmental activities Non-depreciable assets: Land Construction in progress Total non-depreciable assets Depreciable assets: Buildings and improvements Machinery, equipment, and vehicles Infrastructure Total depreciable assets Less accumulated depreciation: Buildings and improvements Machinery, equipment, and vehicles Infrastructure Total accumulated depreciation Total depreciable assets, net Governmental activities capital assets, net
$ 41,686,492 861,873 42,548,365 86,772,362 49,912,061 14,890,339 151,574,762 (45,467,816) (35,865,964) (7,665,863) (88,999,643) 62,575,119 $105 123 484
$ (148,312) (2,920,304) (3,068,616) 3,278,964 171,939 (382,287) 3,068,616 - - - - 3,068,616 $ -
$ - 3,878,994 3,878,994 280,616 1,548,614 96,252 1,925,482 (2,253,049) (4,637,194) (689,676) (7,579,919) (5,654,437) $ (1 775 443)
$ (697,681) - (697,681) (29,088) (1,302,852) - (1,331,940) 24,693 1,166,571 - 1,191,264 (140,676) $ (838 357)
$ 40,840,499 1,820,563 42,661,062 90,302,854 50,329,761 14,604,305 155,236,920 (47,696,172) (39,336,587) (8,355,539) (95,388,298) 59,848,622 $102 509 684
Business-type activities Non-depreciable assets: Land Intangible Construction in progress Total non-depreciable assets Depreciable assets: Buildings and improvements Utility lines Wells Golf course improvements Machinery, equipment, and vehicles Total depreciable assets Less accumulated depreciation: Buildings and improvements Utility lines Wells Golf course improvements Machinery, equipment, and vehicles Total accumulated depreciation Total depreciable assets, net Business-type activities capital assets, net
$ 5,132,225 2,910,000 27,647,179 35,689,404 85,483,402 118,647,365 20,697,265 2,692,783 29,287,698 256,808,513 (42,609,422) (42,497,161) (13,109,467) (2,223,563) (23,188,429) (123,628,042) 133,180,471 $168,869,875
$ - - - - - - - - - - - - - - - - - $ -
$ - - 677,490 677,490 702,677 8,524,132 1,227,268 - 42,338 10,496,415 (1,908,969) (5,244,771) (1,301,425) (56,620) (1,104,635) (9,616,420) 879,995 $ 1,557,485
$ - - (158,958) (158,958) - - - - (69,363) (69,363) - 1,205 - - 65,313 66,518 (2,845) $ (161,803)
$ 5,132,225 2,910,000 28,165,711 36,207,936 86,186,079 127,171,497 21,924,533 2,692,783 29,260,673 267,235,565 (44,518,391) (47,740,727) (14,410,892) (2,280,183) (24,227,751) (133,177,944) 134,057,621 $170,265,557
II-51
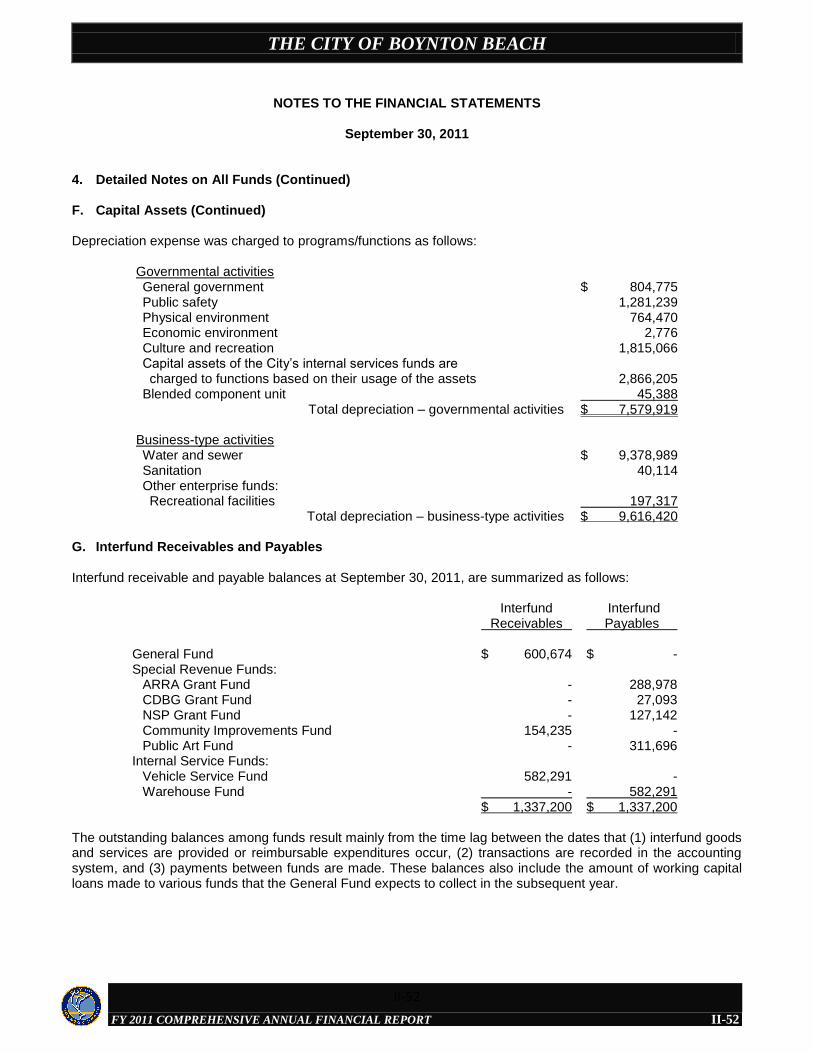
THE CITY OF BOYNTON BEACH
FY 2011 COMPREHENSIVE ANNUAL FINANCIAL REPORT
NOTES TO THE FINANCIAL STATEMENTS
September 30, 2011
II-52
4. Detailed Notes on All Funds (Continued) F. Capital Assets (Continued) Depreciation expense was charged to programs/functions as follows:
Governmental activities General government Public safety Physical environment Economic environment Culture and recreation Capital assets of the City’s internal services funds are charged to functions based on their usage of the assets Blended component unit
Total depreciation – governmental activities Business-type activities Water and sewer Sanitation Other enterprise funds: Recreational facilities
Total depreciation – business-type activities
$ 804,775 1,281,239 764,470 2,776 1,815,066 2,866,205 45,388 $ 7,579,919 $ 9,378,989 40,114 197,317 $ 9,616,420
G. Interfund Receivables and Payables Interfund receivable and payable balances at September 30, 2011, are summarized as follows:
Interfund Receivables
Interfund Payables
General Fund Special Revenue Funds: ARRA Grant Fund CDBG Grant Fund NSP Grant Fund Community Improvements Fund Public Art Fund Internal Service Funds: Vehicle Service Fund Warehouse Fund
$ 600,674 - - - 154,235 - 582,291 - $ 1,337,200
$ - 288,978 27,093 127,142 - 311,696 - 582,291 $ 1,337,200
The outstanding balances among funds result mainly from the time lag between the dates that (1) interfund goods and services are provided or reimbursable expenditures occur, (2) transactions are recorded in the accounting system, and (3) payments between funds are made. These balances also include the amount of working capital loans made to various funds that the General Fund expects to collect in the subsequent year.
II-52
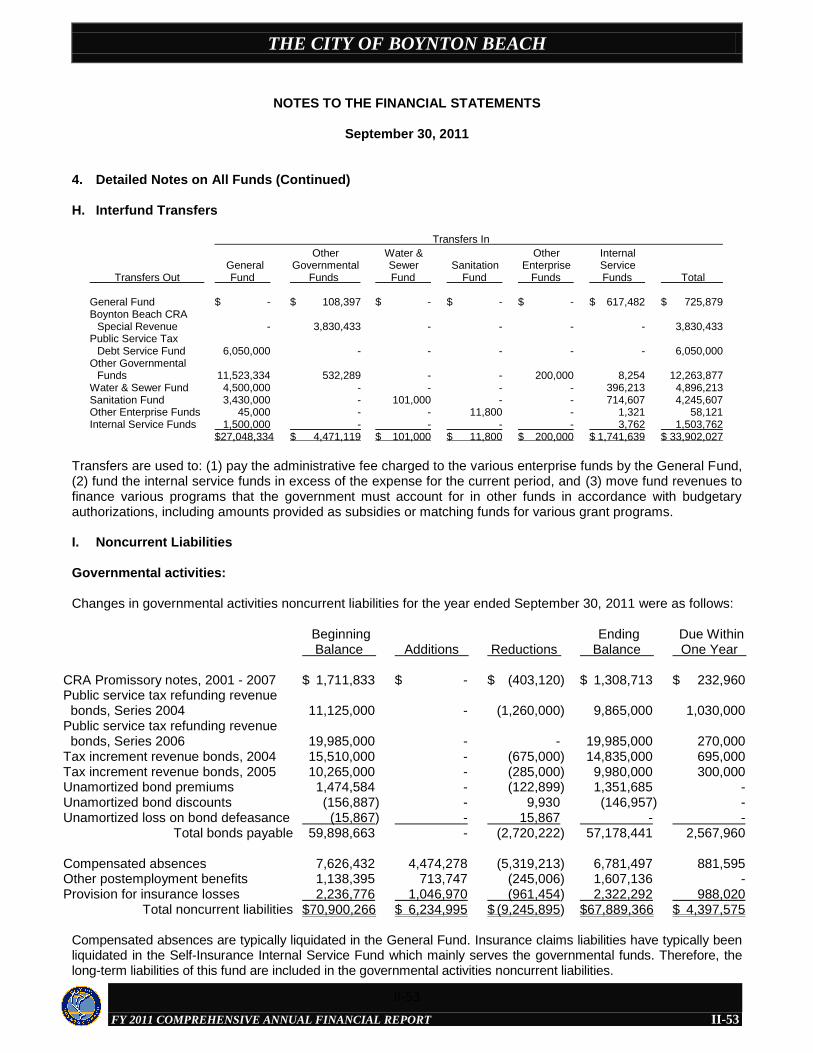
THE CITY OF BOYNTON BEACH
FY 2011 COMPREHENSIVE ANNUAL FINANCIAL REPORT
NOTES TO THE FINANCIAL STATEMENTS
September 30, 2011
II-53
4. Detailed Notes on All Funds (Continued) H. Interfund Transfers
Transfers In
Transfers Out
General
Fund
Other Governmental Funds
Water & Sewer
Fund
Sanitation
Fund
Other Enterprise
Funds
Internal Service
Funds
Total
General Fund Boynton Beach CRA
Special Revenue Public Service Tax
Debt Service Fund Other Governmental
Funds Water & Sewer Fund Sanitation Fund Other Enterprise Funds Internal Service Funds
$ - - 6,050,000 11,523,334 4,500,000 3,430,000 45,000 1,500,000 $27,048,334
$ 108,397 3,830,433 - 532,289 - - - - $ 4,471,119
$ - - - - - 101,000 - - $ 101,000
$ - - - - - - 11,800 - $ 11,800
$ - - - 200,000 - - - - $ 200,000
$ 617,482 - - 8,254 396,213 714,607 1,321 3,762 $ 1,741,639
$ 725,879 3,830,433 6,050,000 12,263,877 4,896,213 4,245,607 58,121 1,503,762 $ 33,902,027
Transfers are used to: (1) pay the administrative fee charged to the various enterprise funds by the General Fund, (2) fund the internal service funds in excess of the expense for the current period, and (3) move fund revenues to finance various programs that the government must account for in other funds in accordance with budgetary authorizations, including amounts provided as subsidies or matching funds for various grant programs. I. Noncurrent Liabilities
Governmental activities: Changes in governmental activities noncurrent liabilities for the year ended September 30, 2011 were as follows:
Beginning Balance
Additions
Reductions
Ending Balance
Due Within One Year
CRA Promissory notes, 2001 - 2007 Public service tax refunding revenue bonds, Series 2004 Public service tax refunding revenue bonds, Series 2006 Tax increment revenue bonds, 2004 Tax increment revenue bonds, 2005 Unamortized bond premiums Unamortized bond discounts Unamortized loss on bond defeasance
Total bonds payable Compensated absences Other postemployment benefits Provision for insurance losses
Total noncurrent liabilities
$ 1,711,833 11,125,000 19,985,000 15,510,000 10,265,000 1,474,584 (156,887) (15,867) 59,898,663 7,626,432 1,138,395 2,236,776 $70,900,266
$ - - - - - - - - - 4,474,278 713,747 1,046,970 $ 6,234,995
$ (403,120) (1,260,000) - (675,000) (285,000) (122,899) 9,930 15,867 (2,720,222) (5,319,213) (245,006) (961,454) $ (9,245,895)
$ 1,308,713 9,865,000 19,985,000 14,835,000 9,980,000 1,351,685 (146,957) - 57,178,441 6,781,497 1,607,136 2,322,292 $67,889,366
$ 232,960 1,030,000 270,000 695,000 300,000 - - - 2,567,960 881,595 - 988,020 $ 4,397,575
Compensated absences are typically liquidated in the General Fund. Insurance claims liabilities have typically been liquidated in the Self-Insurance Internal Service Fund which mainly serves the governmental funds. Therefore, the long-term liabilities of this fund are included in the governmental activities noncurrent liabilities.
II-53
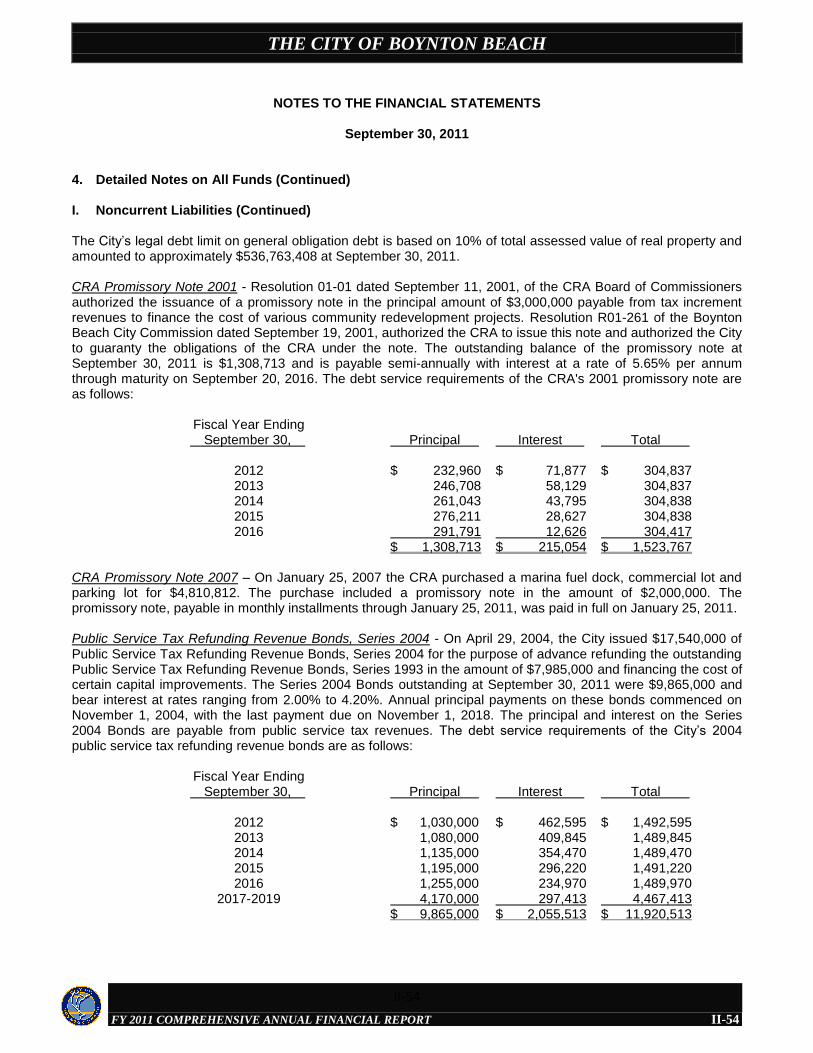
THE CITY OF BOYNTON BEACH
FY 2011 COMPREHENSIVE ANNUAL FINANCIAL REPORT
NOTES TO THE FINANCIAL STATEMENTS
September 30, 2011
II-54
4. Detailed Notes on All Funds (Continued) I. Noncurrent Liabilities (Continued) The City’s legal debt limit on general obligation debt is based on 10% of total assessed value of real property and amounted to approximately $536,763,408 at September 30, 2011. CRA Promissory Note 2001 - Resolution 01-01 dated September 11, 2001, of the CRA Board of Commissioners authorized the issuance of a promissory note in the principal amount of $3,000,000 payable from tax increment revenues to finance the cost of various community redevelopment projects. Resolution R01-261 of the Boynton Beach City Commission dated September 19, 2001, authorized the CRA to issue this note and authorized the City to guaranty the obligations of the CRA under the note. The outstanding balance of the promissory note at September 30, 2011 is $1,308,713 and is payable semi-annually with interest at a rate of 5.65% per annum through maturity on September 20, 2016. The debt service requirements of the CRA's 2001 promissory note are as follows:
Fiscal Year Ending September 30,
Principal
Interest
Total
2012 2013 2014 2015 2016
$ 232,960 246,708 261,043 276,211 291,791 $ 1,308,713
$ 71,877 58,129 43,795 28,627 12,626 $ 215,054
$ 304,837 304,837 304,838 304,838 304,417 $ 1,523,767
CRA Promissory Note 2007 – On January 25, 2007 the CRA purchased a marina fuel dock, commercial lot and parking lot for $4,810,812. The purchase included a promissory note in the amount of $2,000,000. The promissory note, payable in monthly installments through January 25, 2011, was paid in full on January 25, 2011. Public Service Tax Refunding Revenue Bonds, Series 2004 - On April 29, 2004, the City issued $17,540,000 of Public Service Tax Refunding Revenue Bonds, Series 2004 for the purpose of advance refunding the outstanding Public Service Tax Refunding Revenue Bonds, Series 1993 in the amount of $7,985,000 and financing the cost of certain capital improvements. The Series 2004 Bonds outstanding at September 30, 2011 were $9,865,000 and bear interest at rates ranging from 2.00% to 4.20%. Annual principal payments on these bonds commenced on November 1, 2004, with the last payment due on November 1, 2018. The principal and interest on the Series 2004 Bonds are payable from public service tax revenues. The debt service requirements of the City’s 2004 public service tax refunding revenue bonds are as follows:
Fiscal Year Ending September 30,
Principal
Interest
Total
2012 2013 2014 2015 2016
2017-2019
$ 1,030,000 1,080,000 1,135,000 1,195,000 1,255,000 4,170,000 $ 9,865,000
$ 462,595 409,845 354,470 296,220 234,970 297,413 $ 2,055,513
$ 1,492,595 1,489,845 1,489,470 1,491,220 1,489,970 4,467,413 $ 11,920,513
II-54
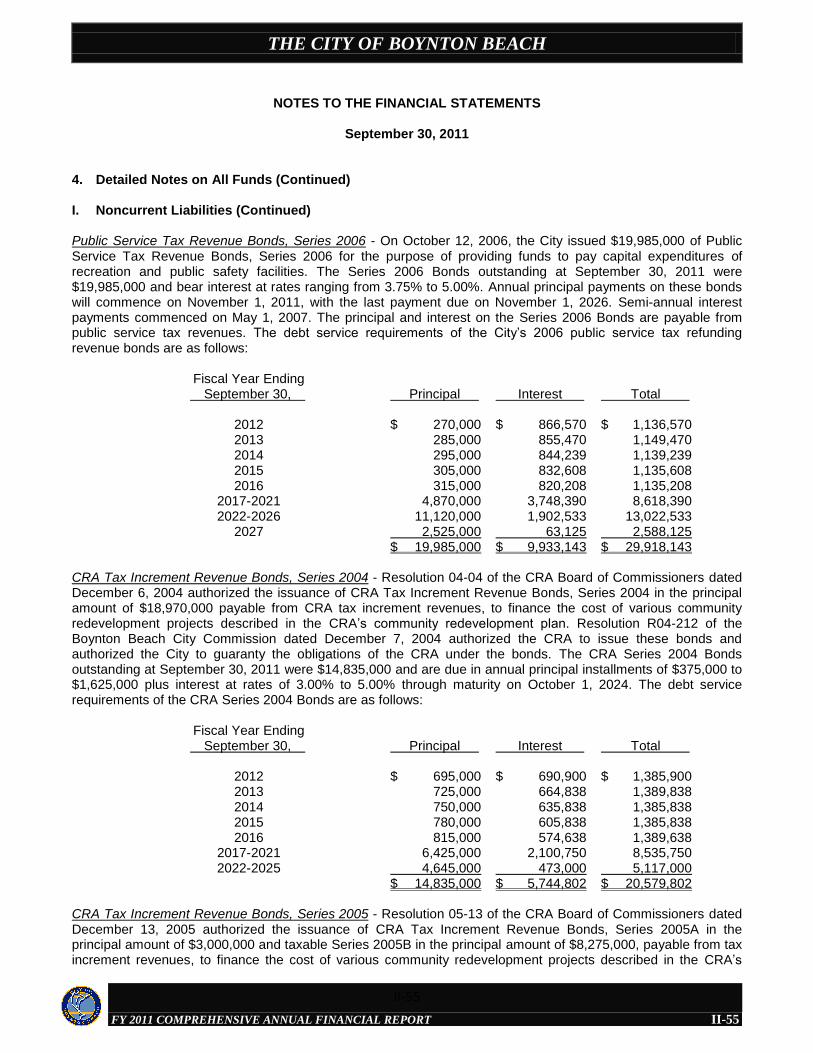
THE CITY OF BOYNTON BEACH
FY 2011 COMPREHENSIVE ANNUAL FINANCIAL REPORT
NOTES TO THE FINANCIAL STATEMENTS
September 30, 2011
II-55
4. Detailed Notes on All Funds (Continued) I. Noncurrent Liabilities (Continued) Public Service Tax Revenue Bonds, Series 2006 - On October 12, 2006, the City issued $19,985,000 of Public Service Tax Revenue Bonds, Series 2006 for the purpose of providing funds to pay capital expenditures of recreation and public safety facilities. The Series 2006 Bonds outstanding at September 30, 2011 were $19,985,000 and bear interest at rates ranging from 3.75% to 5.00%. Annual principal payments on these bonds will commence on November 1, 2011, with the last payment due on November 1, 2026. Semi-annual interest payments commenced on May 1, 2007. The principal and interest on the Series 2006 Bonds are payable from public service tax revenues. The debt service requirements of the City’s 2006 public service tax refunding revenue bonds are as follows:
Fiscal Year Ending September 30,
Principal
Interest
Total
2012 2013 2014 2015 2016
2017-2021 2022-2026
2027
$ 270,000 285,000 295,000 305,000 315,000 4,870,000 11,120,000 2,525,000 $ 19,985,000
$ 866,570 855,470 844,239 832,608 820,208 3,748,390 1,902,533 63,125 $ 9,933,143
$ 1,136,570 1,149,470 1,139,239 1,135,608 1,135,208 8,618,390 13,022,533 2,588,125 $ 29,918,143
CRA Tax Increment Revenue Bonds, Series 2004 - Resolution 04-04 of the CRA Board of Commissioners dated December 6, 2004 authorized the issuance of CRA Tax Increment Revenue Bonds, Series 2004 in the principal amount of $18,970,000 payable from CRA tax increment revenues, to finance the cost of various community redevelopment projects described in the CRA’s community redevelopment plan. Resolution R04-212 of the Boynton Beach City Commission dated December 7, 2004 authorized the CRA to issue these bonds and authorized the City to guaranty the obligations of the CRA under the bonds. The CRA Series 2004 Bonds outstanding at September 30, 2011 were $14,835,000 and are due in annual principal installments of $375,000 to $1,625,000 plus interest at rates of 3.00% to 5.00% through maturity on October 1, 2024. The debt service requirements of the CRA Series 2004 Bonds are as follows:
Fiscal Year Ending September 30,
Principal
Interest
Total
2012 2013 2014 2015 2016
2017-2021 2022-2025
$ 695,000 725,000 750,000 780,000 815,000 6,425,000 4,645,000 $ 14,835,000
$ 690,900 664,838 635,838 605,838 574,638 2,100,750 473,000 $ 5,744,802
$ 1,385,900 1,389,838 1,385,838 1,385,838 1,389,638 8,535,750 5,117,000 $ 20,579,802
CRA Tax Increment Revenue Bonds, Series 2005 - Resolution 05-13 of the CRA Board of Commissioners dated December 13, 2005 authorized the issuance of CRA Tax Increment Revenue Bonds, Series 2005A in the principal amount of $3,000,000 and taxable Series 2005B in the principal amount of $8,275,000, payable from tax increment revenues, to finance the cost of various community redevelopment projects described in the CRA’s
II-55
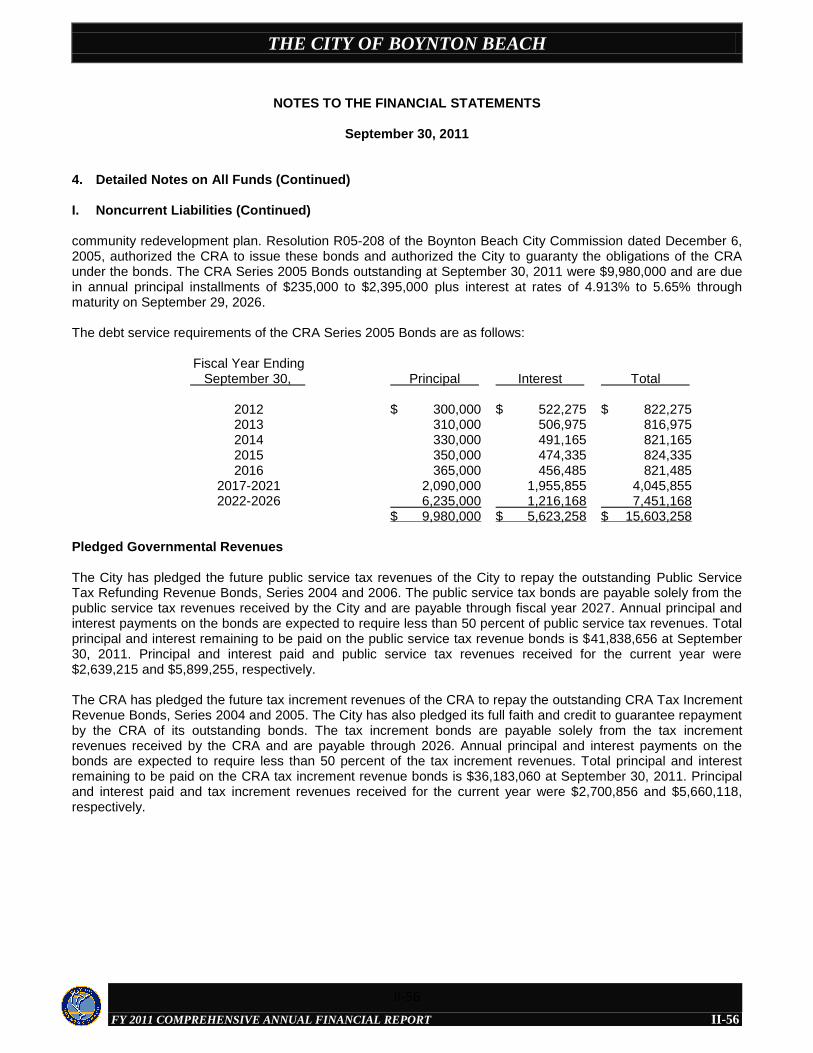
THE CITY OF BOYNTON BEACH
FY 2011 COMPREHENSIVE ANNUAL FINANCIAL REPORT
NOTES TO THE FINANCIAL STATEMENTS
September 30, 2011
II-56
4. Detailed Notes on All Funds (Continued) I. Noncurrent Liabilities (Continued) community redevelopment plan. Resolution R05-208 of the Boynton Beach City Commission dated December 6, 2005, authorized the CRA to issue these bonds and authorized the City to guaranty the obligations of the CRA under the bonds. The CRA Series 2005 Bonds outstanding at September 30, 2011 were $9,980,000 and are due in annual principal installments of $235,000 to $2,395,000 plus interest at rates of 4.913% to 5.65% through maturity on September 29, 2026. The debt service requirements of the CRA Series 2005 Bonds are as follows:
Fiscal Year Ending September 30,
Principal
Interest
Total
2012 2013 2014 2015 2016
2017-2021 2022-2026
$ 300,000 310,000 330,000 350,000 365,000 2,090,000 6,235,000 $ 9,980,000
$ 522,275 506,975 491,165 474,335 456,485 1,955,855 1,216,168 $ 5,623,258
$ 822,275 816,975 821,165 824,335 821,485 4,045,855 7,451,168 $ 15,603,258
Pledged Governmental Revenues The City has pledged the future public service tax revenues of the City to repay the outstanding Public Service Tax Refunding Revenue Bonds, Series 2004 and 2006. The public service tax bonds are payable solely from the public service tax revenues received by the City and are payable through fiscal year 2027. Annual principal and interest payments on the bonds are expected to require less than 50 percent of public service tax revenues. Total principal and interest remaining to be paid on the public service tax revenue bonds is $41,838,656 at September 30, 2011. Principal and interest paid and public service tax revenues received for the current year were $2,639,215 and $5,899,255, respectively. The CRA has pledged the future tax increment revenues of the CRA to repay the outstanding CRA Tax Increment Revenue Bonds, Series 2004 and 2005. The City has also pledged its full faith and credit to guarantee repayment by the CRA of its outstanding bonds. The tax increment bonds are payable solely from the tax increment revenues received by the CRA and are payable through 2026. Annual principal and interest payments on the bonds are expected to require less than 50 percent of the tax increment revenues. Total principal and interest remaining to be paid on the CRA tax increment revenue bonds is $36,183,060 at September 30, 2011. Principal and interest paid and tax increment revenues received for the current year were $2,700,856 and $5,660,118, respectively.
II-56
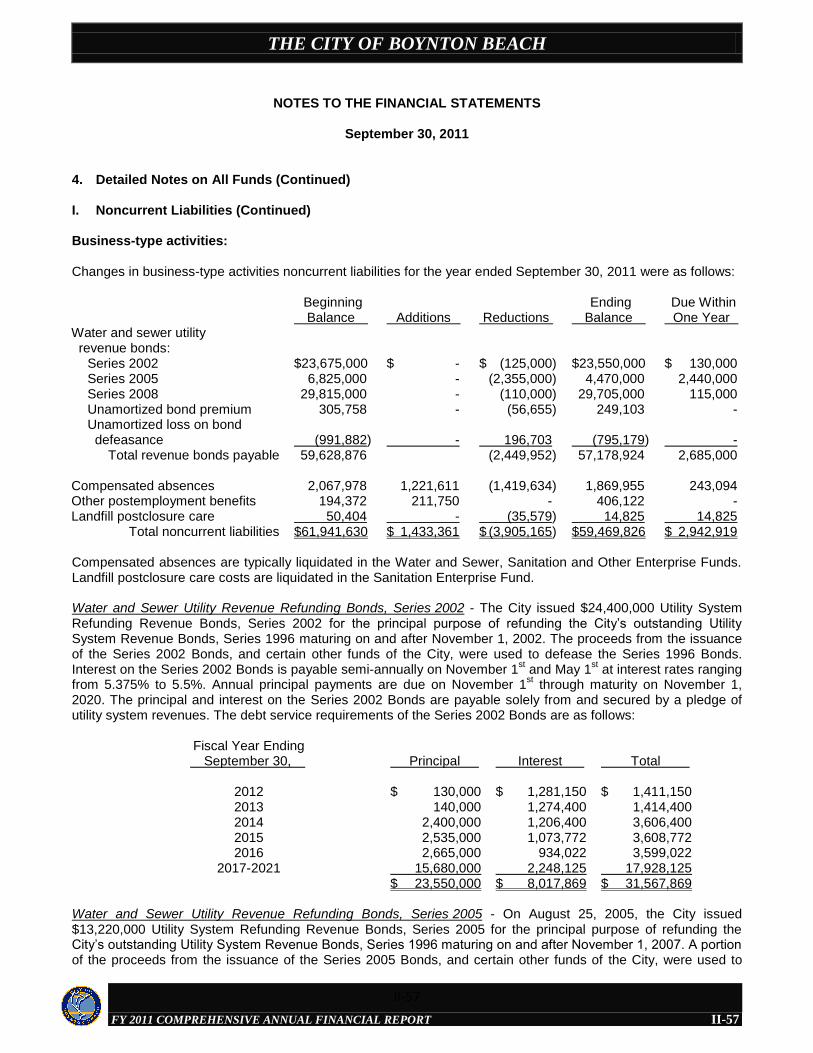
THE CITY OF BOYNTON BEACH
FY 2011 COMPREHENSIVE ANNUAL FINANCIAL REPORT
NOTES TO THE FINANCIAL STATEMENTS
September 30, 2011
II-57
4. Detailed Notes on All Funds (Continued) I. Noncurrent Liabilities (Continued) Business-type activities: Changes in business-type activities noncurrent liabilities for the year ended September 30, 2011 were as follows: Beginning
Balance Additions
Reductions
Ending Balance
Due Within One Year
Water and sewer utility revenue bonds: Series 2002 Series 2005 Series 2008 Unamortized bond premium Unamortized loss on bond defeasance
Total revenue bonds payable Compensated absences Other postemployment benefits Landfill postclosure care
Total noncurrent liabilities
$23,675,000 6,825,000 29,815,000 305,758 (991,882) 59,628,876 2,067,978 194,372 50,404 $61,941,630
$ - - - - - 1,221,611 211,750 - $ 1,433,361
$ (125,000) (2,355,000) (110,000) (56,655) 196,703 (2,449,952) (1,419,634) - (35,579) $ (3,905,165)
$23,550,000 4,470,000 29,705,000 249,103 (795,179) 57,178,924 1,869,955 406,122 14,825 $59,469,826
$ 130,000 2,440,000 115,000 - - 2,685,000 243,094 - 14,825 $ 2,942,919
Compensated absences are typically liquidated in the Water and Sewer, Sanitation and Other Enterprise Funds. Landfill postclosure care costs are liquidated in the Sanitation Enterprise Fund. Water and Sewer Utility Revenue Refunding Bonds, Series 2002 - The City issued $24,400,000 Utility System Refunding Revenue Bonds, Series 2002 for the principal purpose of refunding the City’s outstanding Utility System Revenue Bonds, Series 1996 maturing on and after November 1, 2002. The proceeds from the issuance of the Series 2002 Bonds, and certain other funds of the City, were used to defease the Series 1996 Bonds. Interest on the Series 2002 Bonds is payable semi-annually on November 1
st and May 1
st at interest rates ranging
from 5.375% to 5.5%. Annual principal payments are due on November 1st through maturity on November 1,
2020. The principal and interest on the Series 2002 Bonds are payable solely from and secured by a pledge of utility system revenues. The debt service requirements of the Series 2002 Bonds are as follows:
Fiscal Year Ending September 30,
Principal
Interest
Total
2012 2013 2014 2015 2016
2017-2021
$ 130,000 140,000 2,400,000 2,535,000 2,665,000 15,680,000 $ 23,550,000
$ 1,281,150 1,274,400 1,206,400 1,073,772 934,022 2,248,125 $ 8,017,869
$ 1,411,150 1,414,400 3,606,400 3,608,772 3,599,022 17,928,125 $ 31,567,869
Water and Sewer Utility Revenue Refunding Bonds, Series 2005 - On August 25, 2005, the City issued $13,220,000 Utility System Refunding Revenue Bonds, Series 2005 for the principal purpose of refunding the City’s outstanding Utility System Revenue Bonds, Series 1996 maturing on and after November 1, 2007. A portion of the proceeds from the issuance of the Series 2005 Bonds, and certain other funds of the City, were used to
II-57
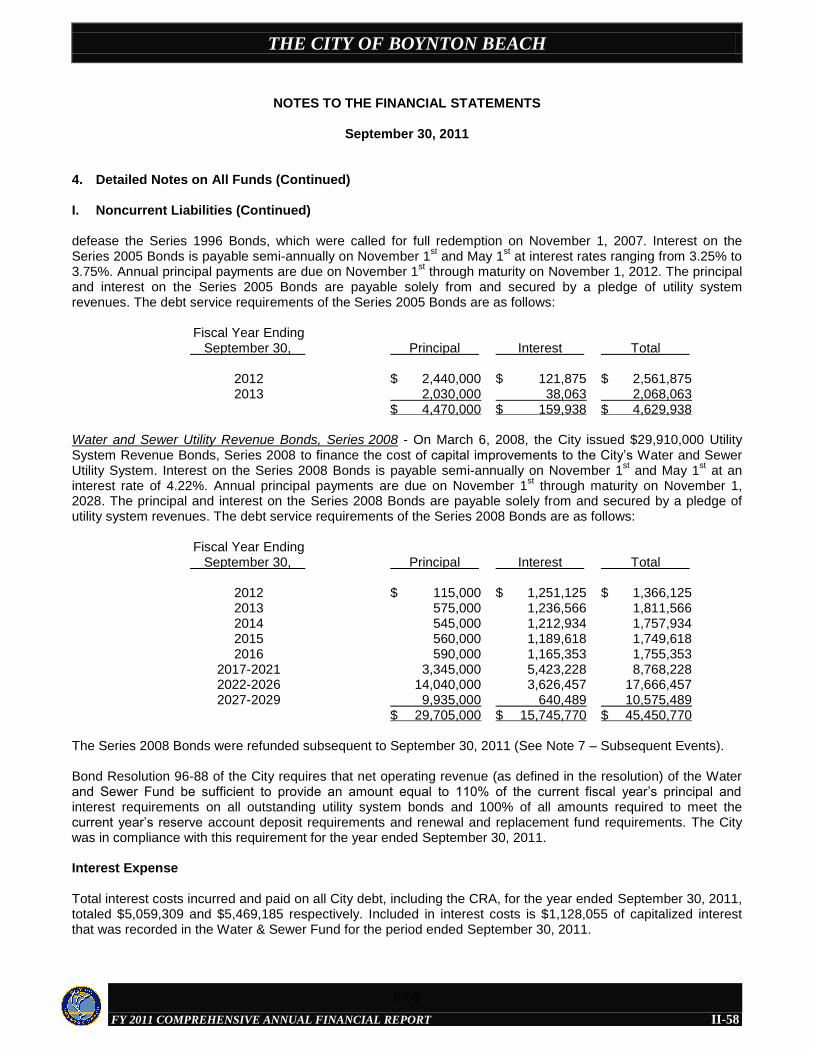
THE CITY OF BOYNTON BEACH
FY 2011 COMPREHENSIVE ANNUAL FINANCIAL REPORT
NOTES TO THE FINANCIAL STATEMENTS
September 30, 2011
II-58
4. Detailed Notes on All Funds (Continued) I. Noncurrent Liabilities (Continued) defease the Series 1996 Bonds, which were called for full redemption on November 1, 2007. Interest on the Series 2005 Bonds is payable semi-annually on November 1
st and May 1
st at interest rates ranging from 3.25% to
3.75%. Annual principal payments are due on November 1st through maturity on November 1, 2012. The principal
and interest on the Series 2005 Bonds are payable solely from and secured by a pledge of utility system revenues. The debt service requirements of the Series 2005 Bonds are as follows:
Fiscal Year Ending September 30,
Principal
Interest
Total
2012 2013
$ 2,440,000 2,030,000 $ 4,470,000
$ 121,875 38,063 $ 159,938
$ 2,561,875 2,068,063 $ 4,629,938
Water and Sewer Utility Revenue Bonds, Series 2008 - On March 6, 2008, the City issued $29,910,000 Utility System Revenue Bonds, Series 2008 to finance the cost of capital improvements to the City’s Water and Sewer Utility System. Interest on the Series 2008 Bonds is payable semi-annually on November 1
st and May 1
st at an
interest rate of 4.22%. Annual principal payments are due on November 1st through maturity on November 1,
2028. The principal and interest on the Series 2008 Bonds are payable solely from and secured by a pledge of utility system revenues. The debt service requirements of the Series 2008 Bonds are as follows:
Fiscal Year Ending September 30,
Principal
Interest
Total
2012 2013 2014 2015 2016
2017-2021 2022-2026 2027-2029
$ 115,000 575,000 545,000 560,000 590,000 3,345,000 14,040,000 9,935,000 $ 29,705,000
$ 1,251,125 1,236,566 1,212,934 1,189,618 1,165,353 5,423,228 3,626,457 640,489 $ 15,745,770
$ 1,366,125 1,811,566 1,757,934 1,749,618 1,755,353 8,768,228 17,666,457 10,575,489 $ 45,450,770
The Series 2008 Bonds were refunded subsequent to September 30, 2011 (See Note 7 – Subsequent Events). Bond Resolution 96-88 of the City requires that net operating revenue (as defined in the resolution) of the Water and Sewer Fund be sufficient to provide an amount equal to 110% of the current fiscal year’s principal and interest requirements on all outstanding utility system bonds and 100% of all amounts required to meet the current year’s reserve account deposit requirements and renewal and replacement fund requirements. The City was in compliance with this requirement for the year ended September 30, 2011. Interest Expense Total interest costs incurred and paid on all City debt, including the CRA, for the year ended September 30, 2011, totaled $5,059,309 and $5,469,185 respectively. Included in interest costs is $1,128,055 of capitalized interest that was recorded in the Water & Sewer Fund for the period ended September 30, 2011.
II-58
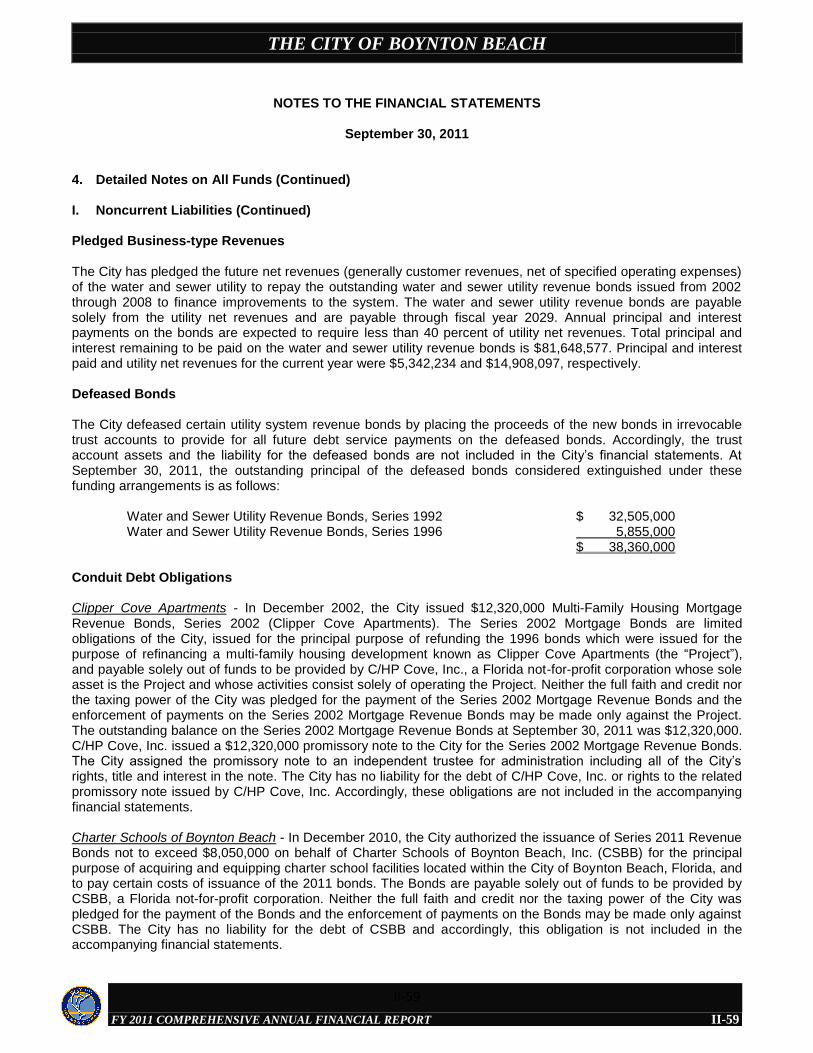
THE CITY OF BOYNTON BEACH
FY 2011 COMPREHENSIVE ANNUAL FINANCIAL REPORT
NOTES TO THE FINANCIAL STATEMENTS
September 30, 2011
II-59
4. Detailed Notes on All Funds (Continued) I. Noncurrent Liabilities (Continued) Pledged Business-type Revenues The City has pledged the future net revenues (generally customer revenues, net of specified operating expenses) of the water and sewer utility to repay the outstanding water and sewer utility revenue bonds issued from 2002 through 2008 to finance improvements to the system. The water and sewer utility revenue bonds are payable solely from the utility net revenues and are payable through fiscal year 2029. Annual principal and interest payments on the bonds are expected to require less than 40 percent of utility net revenues. Total principal and interest remaining to be paid on the water and sewer utility revenue bonds is $81,648,577. Principal and interest paid and utility net revenues for the current year were $5,342,234 and $14,908,097, respectively. Defeased Bonds The City defeased certain utility system revenue bonds by placing the proceeds of the new bonds in irrevocable trust accounts to provide for all future debt service payments on the defeased bonds. Accordingly, the trust account assets and the liability for the defeased bonds are not included in the City’s financial statements. At September 30, 2011, the outstanding principal of the defeased bonds considered extinguished under these funding arrangements is as follows:
Water and Sewer Utility Revenue Bonds, Series 1992 Water and Sewer Utility Revenue Bonds, Series 1996
$ 32,505,000 5,855,000 $ 38,360,000
Conduit Debt Obligations Clipper Cove Apartments - In December 2002, the City issued $12,320,000 Multi-Family Housing Mortgage Revenue Bonds, Series 2002 (Clipper Cove Apartments). The Series 2002 Mortgage Bonds are limited obligations of the City, issued for the principal purpose of refunding the 1996 bonds which were issued for the purpose of refinancing a multi-family housing development known as Clipper Cove Apartments (the “Project”), and payable solely out of funds to be provided by C/HP Cove, Inc., a Florida not-for-profit corporation whose sole asset is the Project and whose activities consist solely of operating the Project. Neither the full faith and credit nor the taxing power of the City was pledged for the payment of the Series 2002 Mortgage Revenue Bonds and the enforcement of payments on the Series 2002 Mortgage Revenue Bonds may be made only against the Project. The outstanding balance on the Series 2002 Mortgage Revenue Bonds at September 30, 2011 was $12,320,000. C/HP Cove, Inc. issued a $12,320,000 promissory note to the City for the Series 2002 Mortgage Revenue Bonds. The City assigned the promissory note to an independent trustee for administration including all of the City’s rights, title and interest in the note. The City has no liability for the debt of C/HP Cove, Inc. or rights to the related promissory note issued by C/HP Cove, Inc. Accordingly, these obligations are not included in the accompanying financial statements. Charter Schools of Boynton Beach - In December 2010, the City authorized the issuance of Series 2011 Revenue Bonds not to exceed $8,050,000 on behalf of Charter Schools of Boynton Beach, Inc. (CSBB) for the principal purpose of acquiring and equipping charter school facilities located within the City of Boynton Beach, Florida, and to pay certain costs of issuance of the 2011 bonds. The Bonds are payable solely out of funds to be provided by CSBB, a Florida not-for-profit corporation. Neither the full faith and credit nor the taxing power of the City was pledged for the payment of the Bonds and the enforcement of payments on the Bonds may be made only against CSBB. The City has no liability for the debt of CSBB and accordingly, this obligation is not included in the accompanying financial statements.
II-59
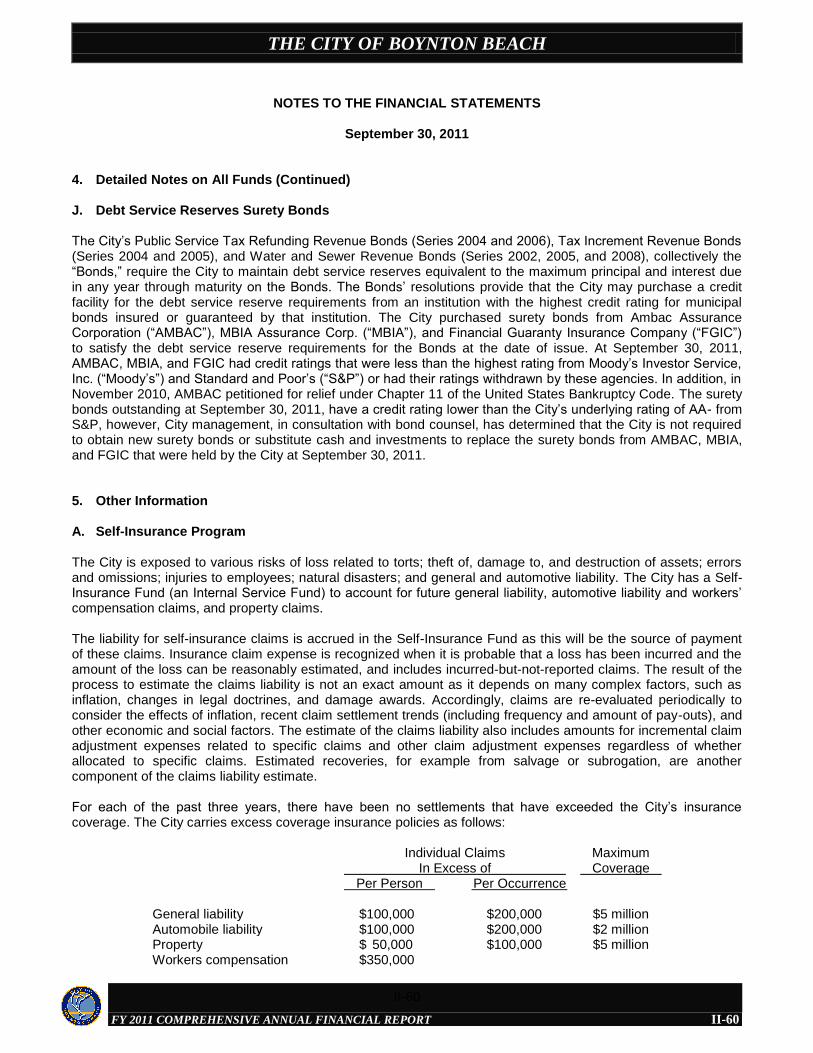
THE CITY OF BOYNTON BEACH
FY 2011 COMPREHENSIVE ANNUAL FINANCIAL REPORT
NOTES TO THE FINANCIAL STATEMENTS
September 30, 2011
II-60
4. Detailed Notes on All Funds (Continued) J. Debt Service Reserves Surety Bonds The City’s Public Service Tax Refunding Revenue Bonds (Series 2004 and 2006), Tax Increment Revenue Bonds (Series 2004 and 2005), and Water and Sewer Revenue Bonds (Series 2002, 2005, and 2008), collectively the “Bonds,” require the City to maintain debt service reserves equivalent to the maximum principal and interest due in any year through maturity on the Bonds. The Bonds’ resolutions provide that the City may purchase a credit facility for the debt service reserve requirements from an institution with the highest credit rating for municipal bonds insured or guaranteed by that institution. The City purchased surety bonds from Ambac Assurance Corporation (“AMBAC”), MBIA Assurance Corp. (“MBIA”), and Financial Guaranty Insurance Company (“FGIC”) to satisfy the debt service reserve requirements for the Bonds at the date of issue. At September 30, 2011, AMBAC, MBIA, and FGIC had credit ratings that were less than the highest rating from Moody’s Investor Service, Inc. (“Moody’s”) and Standard and Poor’s (“S&P”) or had their ratings withdrawn by these agencies. In addition, in November 2010, AMBAC petitioned for relief under Chapter 11 of the United States Bankruptcy Code. The surety bonds outstanding at September 30, 2011, have a credit rating lower than the City’s underlying rating of AA- from S&P, however, City management, in consultation with bond counsel, has determined that the City is not required to obtain new surety bonds or substitute cash and investments to replace the surety bonds from AMBAC, MBIA, and FGIC that were held by the City at September 30, 2011. 5. Other Information A. Self-Insurance Program The City is exposed to various risks of loss related to torts; theft of, damage to, and destruction of assets; errors and omissions; injuries to employees; natural disasters; and general and automotive liability. The City has a Self-Insurance Fund (an Internal Service Fund) to account for future general liability, automotive liability and workers’ compensation claims, and property claims. The liability for self-insurance claims is accrued in the Self-Insurance Fund as this will be the source of payment of these claims. Insurance claim expense is recognized when it is probable that a loss has been incurred and the amount of the loss can be reasonably estimated, and includes incurred-but-not-reported claims. The result of the process to estimate the claims liability is not an exact amount as it depends on many complex factors, such as inflation, changes in legal doctrines, and damage awards. Accordingly, claims are re-evaluated periodically to consider the effects of inflation, recent claim settlement trends (including frequency and amount of pay-outs), and other economic and social factors. The estimate of the claims liability also includes amounts for incremental claim adjustment expenses related to specific claims and other claim adjustment expenses regardless of whether allocated to specific claims. Estimated recoveries, for example from salvage or subrogation, are another component of the claims liability estimate. For each of the past three years, there have been no settlements that have exceeded the City’s insurance coverage. The City carries excess coverage insurance policies as follows:
Individual Claims In Excess of
Maximum Coverage
Per Person Per Occurrence General liability
$100,000
$200,000
$5 million
Automobile liability $100,000 $200,000 $2 million Property $ 50,000 $100,000 $5 million Workers compensation $350,000
II-60
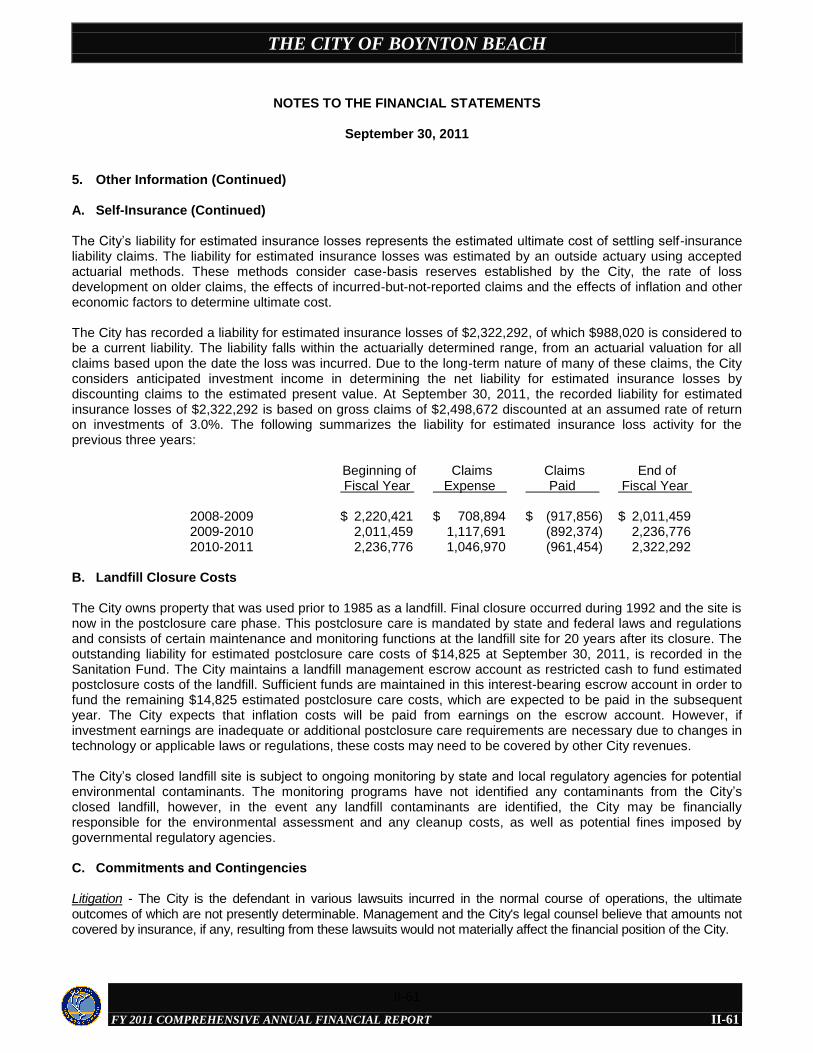
THE CITY OF BOYNTON BEACH
FY 2011 COMPREHENSIVE ANNUAL FINANCIAL REPORT
NOTES TO THE FINANCIAL STATEMENTS
September 30, 2011
II-61
5. Other Information (Continued) A. Self-Insurance (Continued) The City’s liability for estimated insurance losses represents the estimated ultimate cost of settling self-insurance liability claims. The liability for estimated insurance losses was estimated by an outside actuary using accepted actuarial methods. These methods consider case-basis reserves established by the City, the rate of loss development on older claims, the effects of incurred-but-not-reported claims and the effects of inflation and other economic factors to determine ultimate cost. The City has recorded a liability for estimated insurance losses of $2,322,292, of which $988,020 is considered to be a current liability. The liability falls within the actuarially determined range, from an actuarial valuation for all claims based upon the date the loss was incurred. Due to the long-term nature of many of these claims, the City considers anticipated investment income in determining the net liability for estimated insurance losses by discounting claims to the estimated present value. At September 30, 2011, the recorded liability for estimated insurance losses of $2,322,292 is based on gross claims of $2,498,672 discounted at an assumed rate of return on investments of 3.0%. The following summarizes the liability for estimated insurance loss activity for the previous three years:
Beginning of Fiscal Year
Claims Expense
Claims Paid
End of Fiscal Year
2008-2009 2009-2010 2010-2011
$ 2,220,421 2,011,459 2,236,776
$ 708,894 1,117,691 1,046,970
$ (917,856) (892,374) (961,454)
$ 2,011,459 2,236,776 2,322,292
B. Landfill Closure Costs The City owns property that was used prior to 1985 as a landfill. Final closure occurred during 1992 and the site is now in the postclosure care phase. This postclosure care is mandated by state and federal laws and regulations and consists of certain maintenance and monitoring functions at the landfill site for 20 years after its closure. The outstanding liability for estimated postclosure care costs of $14,825 at September 30, 2011, is recorded in the Sanitation Fund. The City maintains a landfill management escrow account as restricted cash to fund estimated postclosure costs of the landfill. Sufficient funds are maintained in this interest-bearing escrow account in order to fund the remaining $14,825 estimated postclosure care costs, which are expected to be paid in the subsequent year. The City expects that inflation costs will be paid from earnings on the escrow account. However, if investment earnings are inadequate or additional postclosure care requirements are necessary due to changes in technology or applicable laws or regulations, these costs may need to be covered by other City revenues. The City’s closed landfill site is subject to ongoing monitoring by state and local regulatory agencies for potential environmental contaminants. The monitoring programs have not identified any contaminants from the City’s closed landfill, however, in the event any landfill contaminants are identified, the City may be financially responsible for the environmental assessment and any cleanup costs, as well as potential fines imposed by governmental regulatory agencies. C. Commitments and Contingencies Litigation - The City is the defendant in various lawsuits incurred in the normal course of operations, the ultimate outcomes of which are not presently determinable. Management and the City's legal counsel believe that amounts not covered by insurance, if any, resulting from these lawsuits would not materially affect the financial position of the City.
II-61
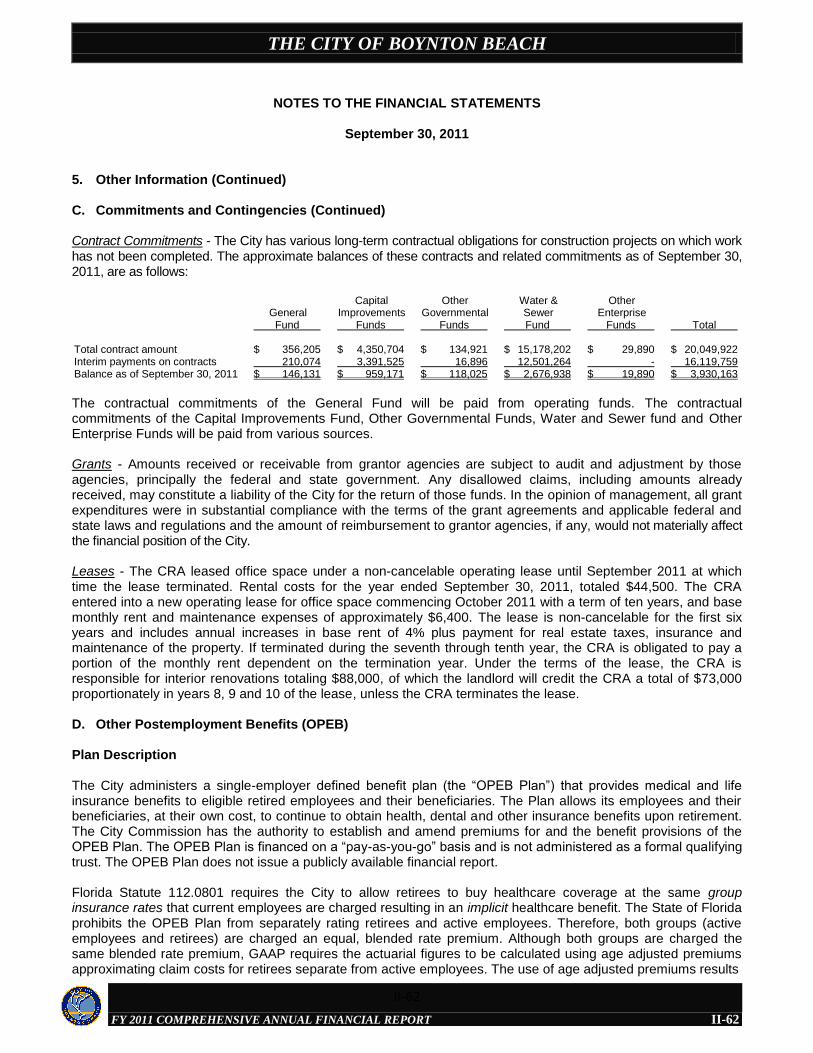
THE CITY OF BOYNTON BEACH
FY 2011 COMPREHENSIVE ANNUAL FINANCIAL REPORT
NOTES TO THE FINANCIAL STATEMENTS
September 30, 2011
II-62
5. Other Information (Continued) C. Commitments and Contingencies (Continued) Contract Commitments - The City has various long-term contractual obligations for construction projects on which work has not been completed. The approximate balances of these contracts and related commitments as of September 30, 2011, are as follows:
General Fund
Capital Improvements Funds
Other Governmental Funds
Water & Sewer
Fund
Other Enterprise
Funds
Total
Total contract amount Interim payments on contracts Balance as of September 30, 2011
$ 356,205 210,074 $ 146,131
$ 4,350,704 3,391,525 $ 959,171
$ 134,921 16,896 $ 118,025
$ 15,178,202 12,501,264 $ 2,676,938
$ 29,890 - $ 19,890
$ 20,049,922 16,119,759 $ 3,930,163
The contractual commitments of the General Fund will be paid from operating funds. The contractual commitments of the Capital Improvements Fund, Other Governmental Funds, Water and Sewer fund and Other Enterprise Funds will be paid from various sources. Grants - Amounts received or receivable from grantor agencies are subject to audit and adjustment by those agencies, principally the federal and state government. Any disallowed claims, including amounts already received, may constitute a liability of the City for the return of those funds. In the opinion of management, all grant expenditures were in substantial compliance with the terms of the grant agreements and applicable federal and state laws and regulations and the amount of reimbursement to grantor agencies, if any, would not materially affect the financial position of the City. Leases - The CRA leased office space under a non-cancelable operating lease until September 2011 at which time the lease terminated. Rental costs for the year ended September 30, 2011, totaled $44,500. The CRA entered into a new operating lease for office space commencing October 2011 with a term of ten years, and base monthly rent and maintenance expenses of approximately $6,400. The lease is non-cancelable for the first six years and includes annual increases in base rent of 4% plus payment for real estate taxes, insurance and maintenance of the property. If terminated during the seventh through tenth year, the CRA is obligated to pay a portion of the monthly rent dependent on the termination year. Under the terms of the lease, the CRA is responsible for interior renovations totaling $88,000, of which the landlord will credit the CRA a total of $73,000 proportionately in years 8, 9 and 10 of the lease, unless the CRA terminates the lease. D. Other Postemployment Benefits (OPEB) Plan Description The City administers a single-employer defined benefit plan (the “OPEB Plan”) that provides medical and life insurance benefits to eligible retired employees and their beneficiaries. The Plan allows its employees and their beneficiaries, at their own cost, to continue to obtain health, dental and other insurance benefits upon retirement. The City Commission has the authority to establish and amend premiums for and the benefit provisions of the OPEB Plan. The OPEB Plan is financed on a “pay-as-you-go” basis and is not administered as a formal qualifying trust. The OPEB Plan does not issue a publicly available financial report. Florida Statute 112.0801 requires the City to allow retirees to buy healthcare coverage at the same group insurance rates that current employees are charged resulting in an implicit healthcare benefit. The State of Florida prohibits the OPEB Plan from separately rating retirees and active employees. Therefore, both groups (active employees and retirees) are charged an equal, blended rate premium. Although both groups are charged the same blended rate premium, GAAP requires the actuarial figures to be calculated using age adjusted premiums approximating claim costs for retirees separate from active employees. The use of age adjusted premiums results
II-62
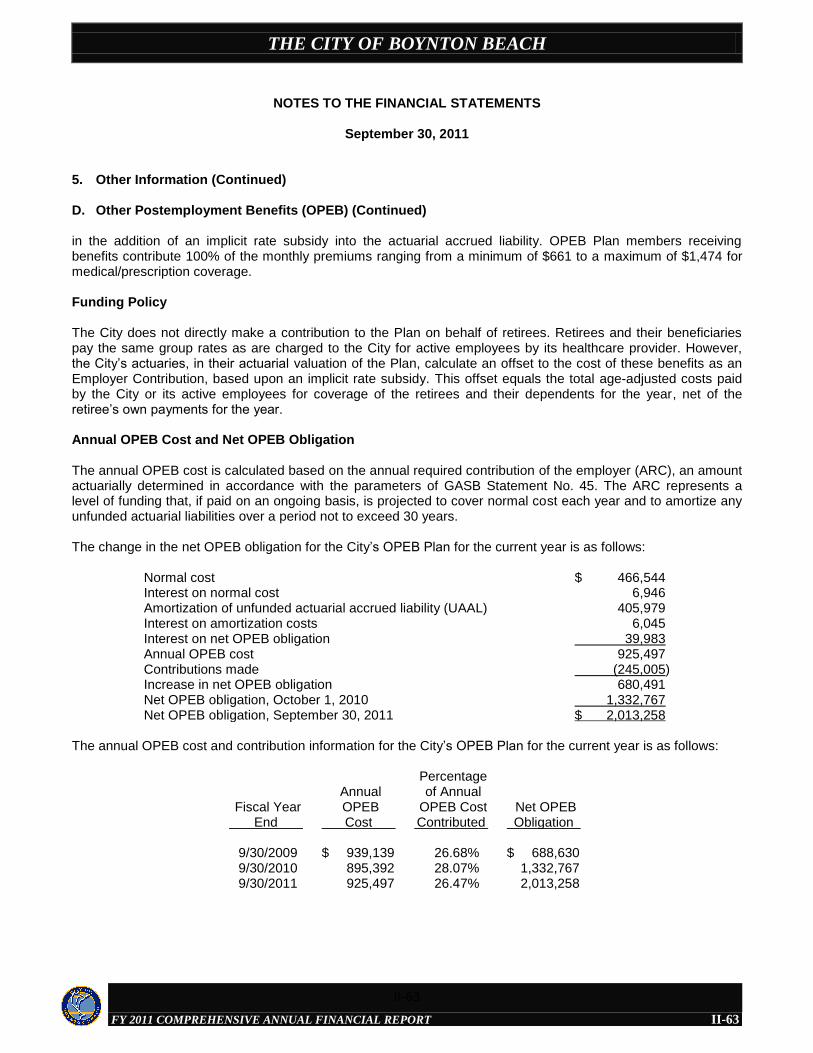
THE CITY OF BOYNTON BEACH
FY 2011 COMPREHENSIVE ANNUAL FINANCIAL REPORT
NOTES TO THE FINANCIAL STATEMENTS
September 30, 2011
II-63
5. Other Information (Continued) D. Other Postemployment Benefits (OPEB) (Continued) in the addition of an implicit rate subsidy into the actuarial accrued liability. OPEB Plan members receiving benefits contribute 100% of the monthly premiums ranging from a minimum of $661 to a maximum of $1,474 for medical/prescription coverage. Funding Policy The City does not directly make a contribution to the Plan on behalf of retirees. Retirees and their beneficiaries pay the same group rates as are charged to the City for active employees by its healthcare provider. However, the City’s actuaries, in their actuarial valuation of the Plan, calculate an offset to the cost of these benefits as an Employer Contribution, based upon an implicit rate subsidy. This offset equals the total age-adjusted costs paid by the City or its active employees for coverage of the retirees and their dependents for the year, net of the retiree’s own payments for the year. Annual OPEB Cost and Net OPEB Obligation The annual OPEB cost is calculated based on the annual required contribution of the employer (ARC), an amount actuarially determined in accordance with the parameters of GASB Statement No. 45. The ARC represents a level of funding that, if paid on an ongoing basis, is projected to cover normal cost each year and to amortize any unfunded actuarial liabilities over a period not to exceed 30 years. The change in the net OPEB obligation for the City’s OPEB Plan for the current year is as follows:
Normal cost Interest on normal cost Amortization of unfunded actuarial accrued liability (UAAL) Interest on amortization costs Interest on net OPEB obligation Annual OPEB cost Contributions made Increase in net OPEB obligation Net OPEB obligation, October 1, 2010 Net OPEB obligation, September 30, 2011
$ 466,544 6,946 405,979 6,045 39,983 925,497 (245,005) 680,491 1,332,767 $ 2,013,258
The annual OPEB cost and contribution information for the City’s OPEB Plan for the current year is as follows:
Fiscal Year End
Annual OPEB
Cost
Percentage of Annual
OPEB Cost Contributed
Net OPEB Obligation
9/30/2009 9/30/2010 9/30/2011
$ 939,139 895,392 925,497
26.68% 28.07% 26.47%
$ 688,630 1,332,767 2,013,258
II-63
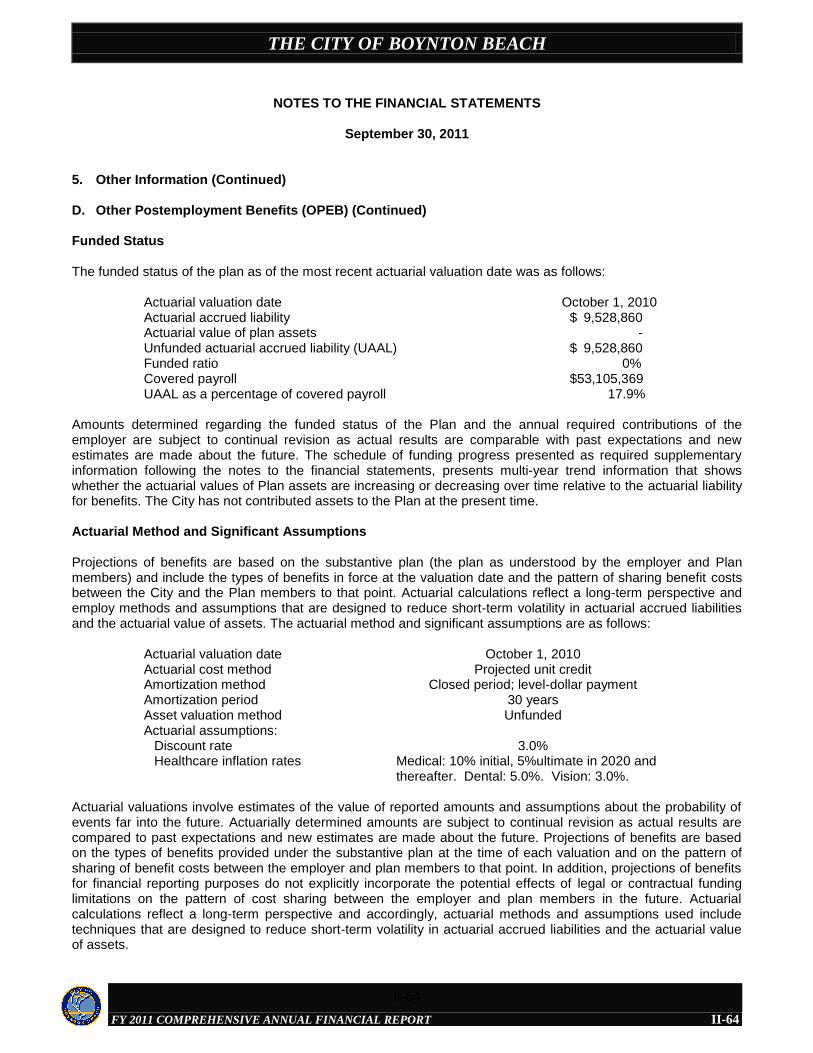
THE CITY OF BOYNTON BEACH
FY 2011 COMPREHENSIVE ANNUAL FINANCIAL REPORT
NOTES TO THE FINANCIAL STATEMENTS
September 30, 2011
II-64
5. Other Information (Continued) D. Other Postemployment Benefits (OPEB) (Continued) Funded Status The funded status of the plan as of the most recent actuarial valuation date was as follows:
Actuarial valuation date Actuarial accrued liability Actuarial value of plan assets Unfunded actuarial accrued liability (UAAL) Funded ratio Covered payroll UAAL as a percentage of covered payroll
October 1, 2010 $ 9,528,860 - $ 9,528,860 0% $53,105,369 17.9%
Amounts determined regarding the funded status of the Plan and the annual required contributions of the employer are subject to continual revision as actual results are comparable with past expectations and new estimates are made about the future. The schedule of funding progress presented as required supplementary information following the notes to the financial statements, presents multi-year trend information that shows whether the actuarial values of Plan assets are increasing or decreasing over time relative to the actuarial liability for benefits. The City has not contributed assets to the Plan at the present time. Actuarial Method and Significant Assumptions Projections of benefits are based on the substantive plan (the plan as understood by the employer and Plan members) and include the types of benefits in force at the valuation date and the pattern of sharing benefit costs between the City and the Plan members to that point. Actuarial calculations reflect a long-term perspective and employ methods and assumptions that are designed to reduce short-term volatility in actuarial accrued liabilities and the actuarial value of assets. The actuarial method and significant assumptions are as follows:
Actuarial valuation date Actuarial cost method Amortization method Amortization period Asset valuation method Actuarial assumptions: Discount rate Healthcare inflation rates
October 1, 2010 Projected unit credit
Closed period; level-dollar payment 30 years Unfunded
3.0%
Medical: 10% initial, 5%ultimate in 2020 and thereafter. Dental: 5.0%. Vision: 3.0%.
Actuarial valuations involve estimates of the value of reported amounts and assumptions about the probability of events far into the future. Actuarially determined amounts are subject to continual revision as actual results are compared to past expectations and new estimates are made about the future. Projections of benefits are based on the types of benefits provided under the substantive plan at the time of each valuation and on the pattern of sharing of benefit costs between the employer and plan members to that point. In addition, projections of benefits for financial reporting purposes do not explicitly incorporate the potential effects of legal or contractual funding limitations on the pattern of cost sharing between the employer and plan members in the future. Actuarial calculations reflect a long-term perspective and accordingly, actuarial methods and assumptions used include techniques that are designed to reduce short-term volatility in actuarial accrued liabilities and the actuarial value of assets.
II-64
THE CITY OF BOYNTON BEACH
FY 2011 COMPREHENSIVE ANNUAL FINANCIAL REPORT
NOTES TO THE FINANCIAL STATEMENTS
September 30, 2011
II-65
5. Other Information (Continued) E. Defined Benefit Pension Plans Description of Plans The City contributes to three single-employer defined benefit pension plans covering all full-time City employees. General Employees' Pension Fund: The General Employees Pension Plan covers all permanent full-time employees except those covered by the Police Officers’ and Firefighters’ Pension Plans. The benefit provisions and all requirements are established by City Ordinance. Employees are fully vested after five years of service with the City. There is no mandatory retirement age. Retirees begin receiving monthly benefit checks the month their retirement begins and continues until death. Benefits to which retirees are entitled are equal to 3% of their final average monthly compensation times years of credited service, provided the employee has completed at least 30 full years of credited service at any age; 25 or more years of credited service at age 55 or 5 or more years of credited service at age 62. Employee contributions are 7.0% of monthly earnings. The City’s contribution is determined actuarially on an annual basis. For 2011 the annual required contribution was $4,694,545. Police Officers' Pension Fund: The Police Officers' Pension Plan covers all sworn police department employees. Employees are vested after 10 years of service with the City and are eligible for retirement after 20 years of service regardless of age. Employees with 10 years of credited service may retire at or after age 55 or employees with 15 years of credited service may retire at or after age 50. Employees who are age 50 and have 10 years of credited service receive a reduced retirement benefit. Monthly benefit checks begin the month an employee retires, and the amount of benefit to which the retired employee is entitled is equal to the number of years of credited service multiplied by 3% of average final compensation. Employee contributions are 7.0% of annual compensation. The City’s contribution is determined actuarially on an annual basis and is reduced by the amount the City receives from the State of Florida. The contributions from the State of Florida are pursuant to Chapter 185 of the Florida Statutes which provides for a premium tax on certain casualty insurance contracts written on properties within the City. The tax is collected by the State of Florida and remitted to the City for the Police Officers' Pension Fund. For 2011 the City’s required contribution was $4,017,435. Firefighters' Pension Fund: The Firefighters' Pension Plan covers all firefighters and fire department officers. Employees become vested after 10 years of service with the City and are eligible for retirement after 20 years regardless of age. Employees with 10 years of credited service may retire at or after age 55. Employees who are age 50 and have 10 years of credited service can receive a reduced retirement benefit. Monthly annuity checks begin the month an employee retires, and the amount of the annuity to which the retired employee will be entitled will be equal to the number of years of credited service multiplied by 3% of average final compensation. Employee contributions are 12% of annual compensation. The City’s contribution is determined actuarially on an annual basis and is reduced by the amount the City receives from the State of Florida. The contributions from the State of Florida are pursuant to Chapter 175 of the Florida Statutes which provides for a premium tax on certain casualty insurance contracts written on properties within the City. The tax is collected by the State of Florida and remitted to the City for the Firefighters' Pension Fund. For 2011 the City’s required contribution was $3,606,278. The benefit provisions and all other requirements of the Police Officers' Pension Fund and Firefighters' Pension Fund are established by City Ordinance. The funding methods and determination of benefits payable are provided in the various acts of the Florida Legislature, which created these plans, including subsequent amendments thereto. The Florida Statutes provide, in general, that funds are to be accumulated from employee contributions, City contributions, state appropriations and income from investment of accumulated funds. The Florida Statutes also provides that, should the accumulated funds at any time be insufficient to meet and pay the benefits due, the City shall supplement the fund by an appropriation from current funds, or from any revenues which may lawfully be used for said purposes and in an amount sufficient to make up the deficiency. The investments of the funds are administered, managed and operated by the respective Board of Trustees of each plan.
II-65
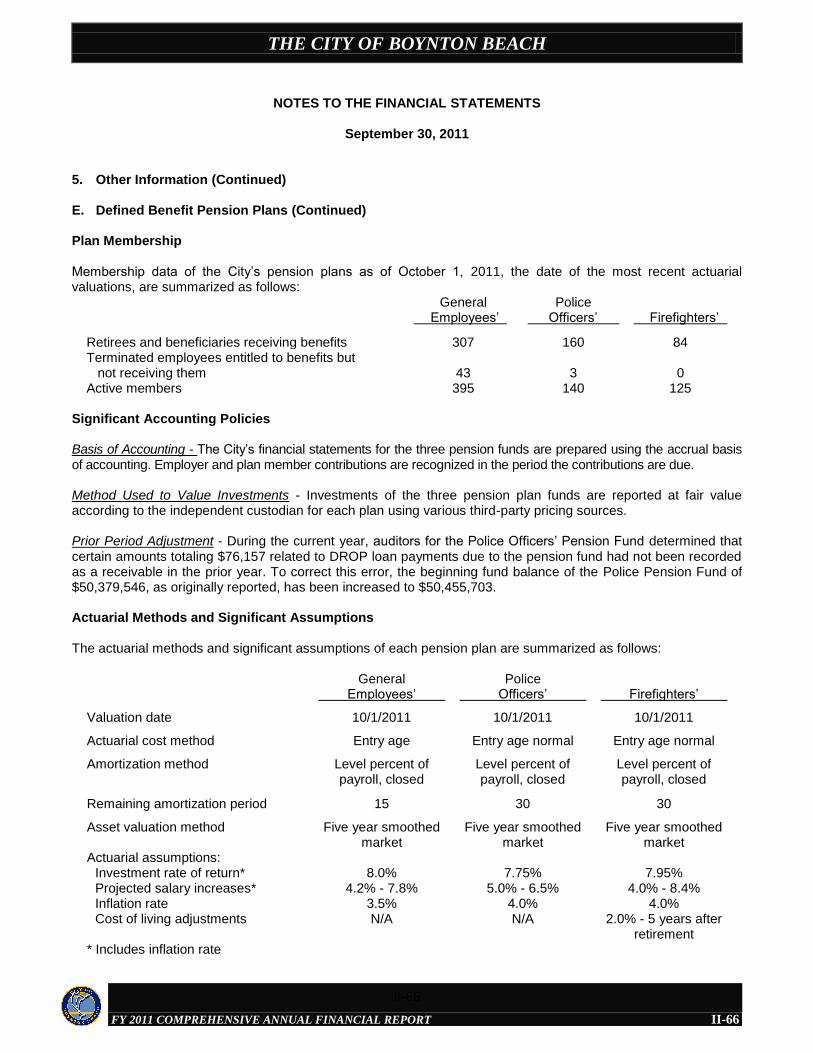
THE CITY OF BOYNTON BEACH
FY 2011 COMPREHENSIVE ANNUAL FINANCIAL REPORT
NOTES TO THE FINANCIAL STATEMENTS
September 30, 2011
II-66
5. Other Information (Continued) E. Defined Benefit Pension Plans (Continued) Plan Membership Membership data of the City’s pension plans as of October 1, 2011, the date of the most recent actuarial valuations, are summarized as follows:
General Employees’
Police Officers’
Firefighters’
Retirees and beneficiaries receiving benefits 307 160 84 Terminated employees entitled to benefits but not receiving them
43
3
0
Active members 395 140 125 Significant Accounting Policies Basis of Accounting - The City’s financial statements for the three pension funds are prepared using the accrual basis of accounting. Employer and plan member contributions are recognized in the period the contributions are due. Method Used to Value Investments - Investments of the three pension plan funds are reported at fair value according to the independent custodian for each plan using various third-party pricing sources. Prior Period Adjustment - During the current year, auditors for the Police Officers’ Pension Fund determined that certain amounts totaling $76,157 related to DROP loan payments due to the pension fund had not been recorded as a receivable in the prior year. To correct this error, the beginning fund balance of the Police Pension Fund of $50,379,546, as originally reported, has been increased to $50,455,703. Actuarial Methods and Significant Assumptions The actuarial methods and significant assumptions of each pension plan are summarized as follows:
General Employees’
Police Officers’
Firefighters’
Valuation date
Actuarial cost method
Amortization method
Remaining amortization period
10/1/2011
Entry age
Level percent of payroll, closed
15
10/1/2011
Entry age normal
Level percent of payroll, closed
30
10/1/2011
Entry age normal
Level percent of payroll, closed
30
Asset valuation method Actuarial assumptions: Investment rate of return* Projected salary increases* Inflation rate Cost of living adjustments * Includes inflation rate
Five year smoothed market
8.0%
4.2% - 7.8% 3.5% N/A
Five year smoothed market
7.75%
5.0% - 6.5% 4.0% N/A
Five year smoothed market
7.95%
4.0% - 8.4% 4.0%
2.0% - 5 years after retirement
II-66
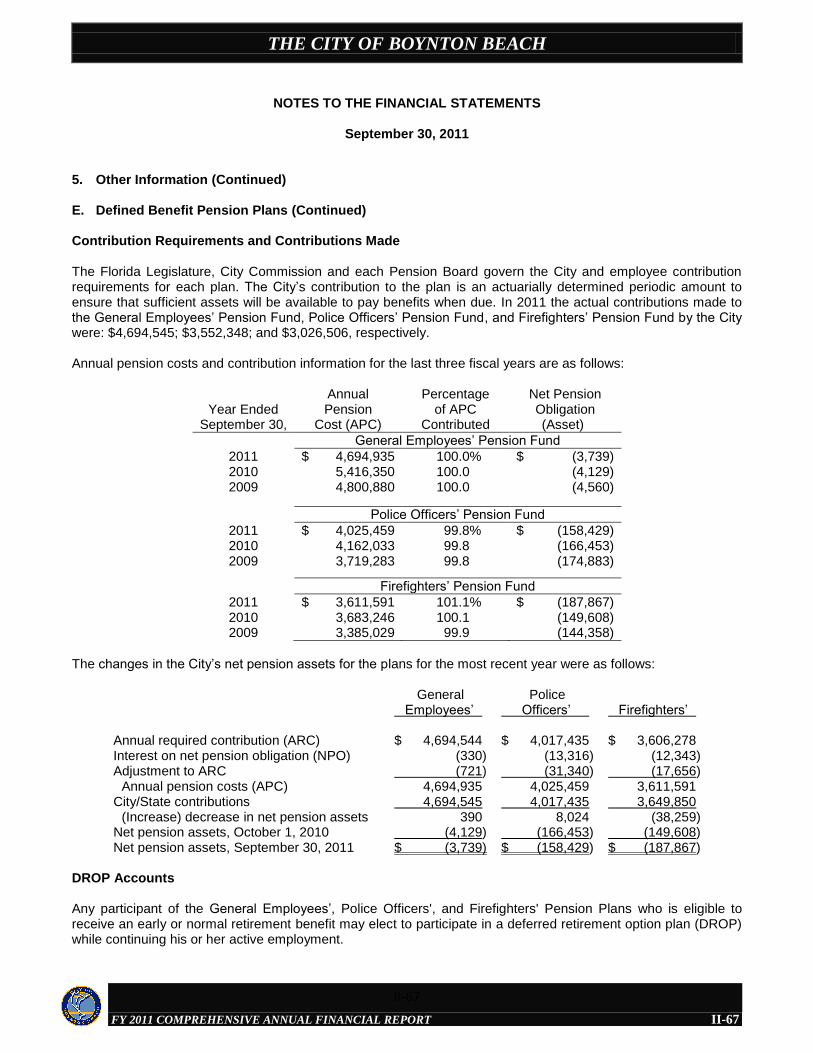
THE CITY OF BOYNTON BEACH
FY 2011 COMPREHENSIVE ANNUAL FINANCIAL REPORT
NOTES TO THE FINANCIAL STATEMENTS
September 30, 2011
II-67
5. Other Information (Continued) E. Defined Benefit Pension Plans (Continued) Contribution Requirements and Contributions Made The Florida Legislature, City Commission and each Pension Board govern the City and employee contribution requirements for each plan. The City’s contribution to the plan is an actuarially determined periodic amount to ensure that sufficient assets will be available to pay benefits when due. In 2011 the actual contributions made to the General Employees’ Pension Fund, Police Officers’ Pension Fund, and Firefighters’ Pension Fund by the City were: $4,694,545; $3,552,348; and $3,026,506, respectively. Annual pension costs and contribution information for the last three fiscal years are as follows:
Year Ended
September 30,
Annual Pension
Cost (APC)
Percentage of APC
Contributed
Net Pension Obligation
(Asset)
General Employees’ Pension Fund
2011 2010 2009
$ 4,694,935 5,416,350 4,800,880
100.0% 100.0 100.0
$ (3,739) (4,129) (4,560)
Police Officers’ Pension Fund
2011 2010 2009
$ 4,025,459 4,162,033 3,719,283
99.8% 99.8 99.8
$ (158,429) (166,453) (174,883)
Firefighters’ Pension Fund
2011 2010 2009
$ 3,611,591 3,683,246 3,385,029
101.1% 100.1
99.9
$ (187,867) (149,608) (144,358)
The changes in the City’s net pension assets for the plans for the most recent year were as follows:
General Employees’
Police Officers’
Firefighters’
Annual required contribution (ARC) Interest on net pension obligation (NPO) Adjustment to ARC Annual pension costs (APC) City/State contributions (Increase) decrease in net pension assets Net pension assets, October 1, 2010 Net pension assets, September 30, 2011
$ 4,694,544 (330) (721) 4,694,935 4,694,545 390 (4,129) $ (3,739)
$ 4,017,435 (13,316) (31,340) 4,025,459 4,017,435 8,024 (166,453) $ (158,429)
$ 3,606,278 (12,343) (17,656) 3,611,591 3,649,850 (38,259) (149,608) $ (187,867)
DROP Accounts Any participant of the General Employees’, Police Officers', and Firefighters' Pension Plans who is eligible to receive an early or normal retirement benefit may elect to participate in a deferred retirement option plan (DROP) while continuing his or her active employment.
II-67
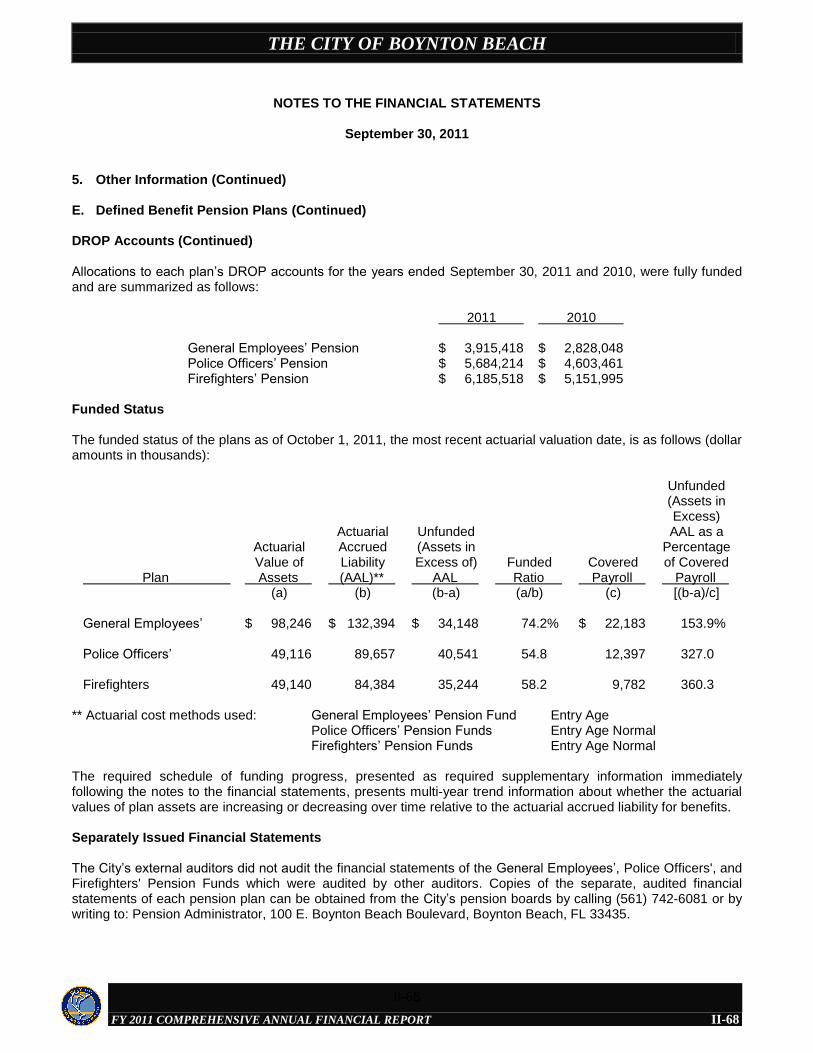
THE CITY OF BOYNTON BEACH
FY 2011 COMPREHENSIVE ANNUAL FINANCIAL REPORT
NOTES TO THE FINANCIAL STATEMENTS
September 30, 2011
II-68
5. Other Information (Continued) E. Defined Benefit Pension Plans (Continued) DROP Accounts (Continued) Allocations to each plan’s DROP accounts for the years ended September 30, 2011 and 2010, were fully funded and are summarized as follows:
2011 2010 General Employees’ Pension
$ 3,915,418
$ 2,828,048
Police Officers’ Pension $ 5,684,214 $ 4,603,461 Firefighters’ Pension $ 6,185,518 $ 5,151,995
Funded Status The funded status of the plans as of October 1, 2011, the most recent actuarial valuation date, is as follows (dollar amounts in thousands):
Plan
Actuarial Value of
Assets
Actuarial Accrued Liability
(AAL)**
Unfunded (Assets in Excess of) AAL
Funded Ratio
Covered Payroll
Unfunded (Assets in Excess) AAL as a
Percentage of Covered Payroll
(a) (b) (b-a) (a/b) (c) [(b-a)/c] General Employees’ $ 98,246 $ 132,394 $ 34,148 74.2% $ 22,183 153.9% Police Officers’ 49,116 89,657 40,541 54.8 12,397 327.0
Firefighters 49,140 84,384 35,244 58.2 9,782 360.3
** Actuarial cost methods used: General Employees’ Pension Fund Entry Age Police Officers’ Pension Funds Entry Age Normal Firefighters’ Pension Funds Entry Age Normal The required schedule of funding progress, presented as required supplementary information immediately following the notes to the financial statements, presents multi-year trend information about whether the actuarial values of plan assets are increasing or decreasing over time relative to the actuarial accrued liability for benefits. Separately Issued Financial Statements The City’s external auditors did not audit the financial statements of the General Employees’, Police Officers', and Firefighters' Pension Funds which were audited by other auditors. Copies of the separate, audited financial statements of each pension plan can be obtained from the City’s pension boards by calling (561) 742-6081 or by writing to: Pension Administrator, 100 E. Boynton Beach Boulevard, Boynton Beach, FL 33435.
II-68
THE CITY OF BOYNTON BEACH
FY 2011 COMPREHENSIVE ANNUAL FINANCIAL REPORT
NOTES TO THE FINANCIAL STATEMENTS
September 30, 2011
II-69
6. Related Party Transactions
The CRA is a blended component unit of the City. For the year ended September 30, 2011, the CRA’s tax increment revenue includes $3,311,708 received from the City. In addition, the CRA reimbursed the City for services performed on behalf of the CRA such as recording, information technology services, landscape and maintenance services, festival expenses, fire and rescue, and police services during the year. Payments by the CRA to the City for these services for the year ended September 30, 2011, totaled $1,097,484. Included in this amount is $436,680 paid to the City under an Interlocal Agreement to provide for the installation of public improvements on Southeast 4th Street in the CRA’s development district. During the fiscal year ended September 30, 2011, a lawsuit was filed against the CRA by the CRA’s former executive director, who is suing for breach of contract and allegations of retaliation resulting from the Board's decision to terminate her employment. The case is currently in active litigation and the CRA is vigorously defending the case. No accrual has been made for this potential claim as the ultimate outcome cannot be determined at this time. 7. Subsequent Event
On February 27, 2012, the City issued $45,895,000 Utility System Revenue Bonds, Series 2012 to pay the costs of capital improvements to the City’s water, sewer and stormwater utility system and to refund all of the City’s outstanding principal balance on the $29,910,000 Water and Sewer Utility Revenue Bonds - Series 2008. Approximately $20,000,000 of the proceeds of the Series 2012 Bonds will be used to pay the costs of capital improvements and the balance, together with other funds of the City, will be used to retire the Series 2008 Bonds on May 1, 2012, and pay costs associated with the issuance of the 2012 Bonds. The refunding resulted in an economic gain (the difference between the present value of the debt service payments of the refunded and refunding bonds) of $1,712,358 and reduced the total debt service payments by $2,289,751. The Series 2012 Bonds are payable from and secured by the proceeds from pledged net revenues of the system (as defined in the bond agreement). Interest on the Series 2012 Bonds is payable on May 1
st and November 1
st beginning
on November 1, 2012 at interest rates ranging from 2.0% to 5.0%. Principal payments on the Series 2012 Bonds are due November 1
st, beginning on November 1, 2013, through maturity on November 1, 2036, and are summarized as
follows: Year Ending
September 30 Principal
2012 2013 2014 2015 2016
2017-2021 2022-2026 2027-2031 2032-2036
2037
$ - - 410,000 410,000 430,000 2,405,000 14,225,000 14,330,000 11,165,000 2,520,000 $ 45,895,000
II-69
THE CITY OF BOYNTON BEACH
FY 2011 COMPREHENSIVE ANNUAL FINANCIAL REPORT
Required Supplementary Information
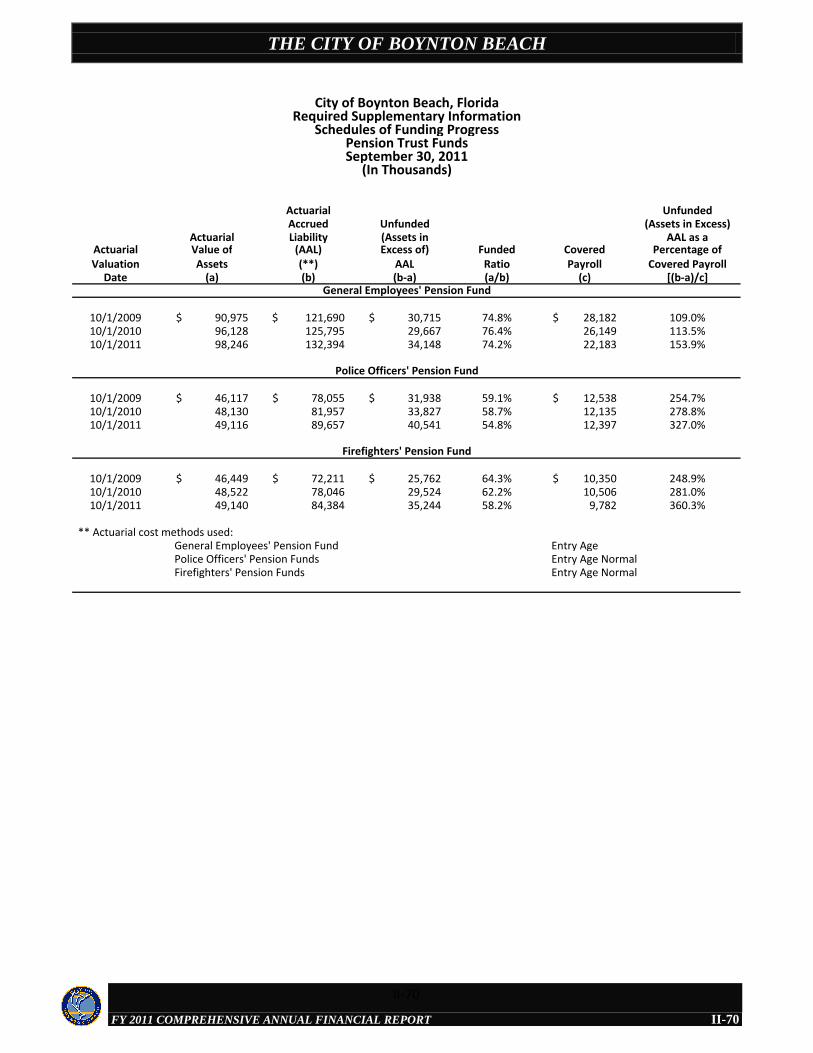
THE CITY OF BOYNTON BEACH
FY 2011 COMPREHENSIVE ANNUAL FINANCIAL REPORT
Actuarial UnfundedAccrued Unfunded (Assets in Excess)
Actuarial Liability (Assets in AAL as aActuarial Value of (AAL) Excess of) Funded Covered Percentage ofValuation Assets (**) AAL Ratio Payroll Covered Payroll
Date (a) (b) (b-a) (a/b) (c) [(b-a)/c]
10/1/2009 90,975$ 121,690$ 30,715$ 74.8% 28,182$ 109.0%10/1/2010 96,128 125,795 29,667 76.4% 26,149 113.5%10/1/2011 98,246 132,394 34,148 74.2% 22,183 153.9%
10/1/2009 46,117$ 78,055$ 31,938$ 59.1% 12,538$ 254.7%10/1/2010 48,130 81,957 33,827 58.7% 12,135 278.8%10/1/2011 49,116 89,657 40,541 54.8% 12,397 327.0%
10/1/2009 46,449$ 72,211$ 25,762$ 64.3% 10,350$ 248.9%10/1/2010 48,522 78,046 29,524 62.2% 10,506 281.0%10/1/2011 49,140 84,384 35,244 58.2% 9,782 360.3%
** Actuarial cost methods used:General Employees' Pension Fund Entry AgePolice Officers' Pension Funds Entry Age NormalFirefighters' Pension Funds Entry Age Normal
General Employees' Pension Fund
Police Officers' Pension Fund
Firefighters' Pension Fund
City of Boynton Beach, FloridaRequired Supplementary Information
Schedules of Funding Progress
September 30, 2011(In Thousands)
Pension Trust Funds
II-70
II-70
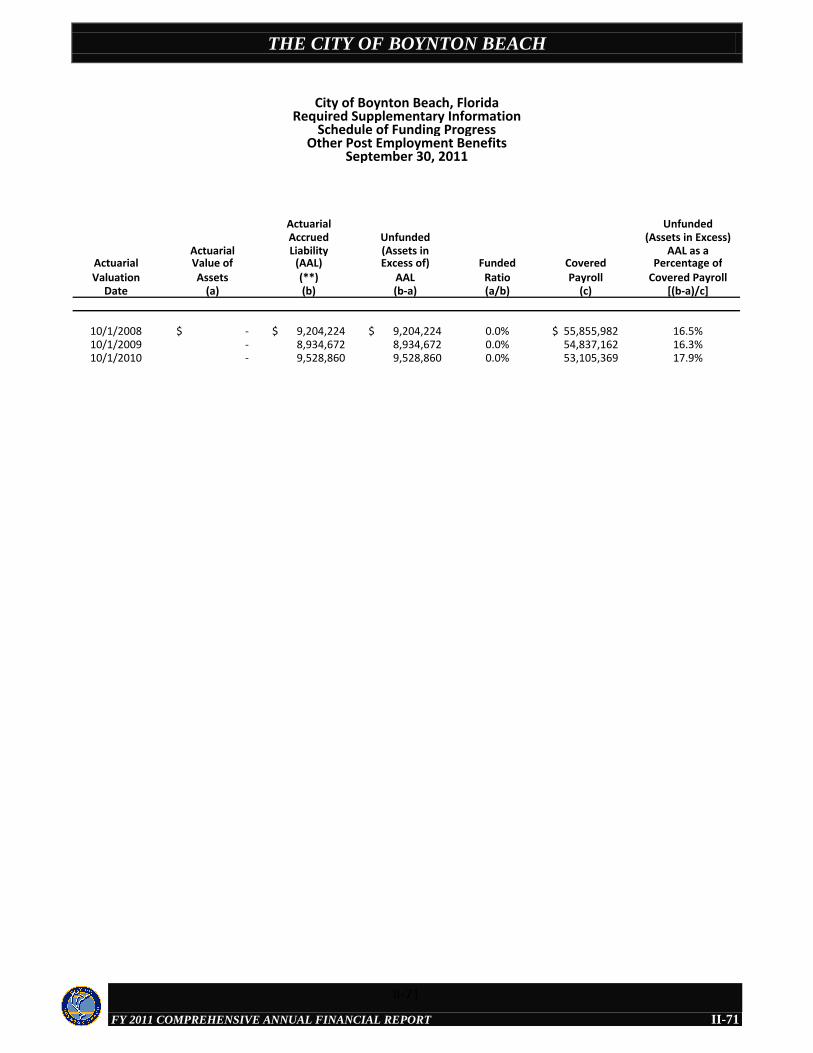
THE CITY OF BOYNTON BEACH
FY 2011 COMPREHENSIVE ANNUAL FINANCIAL REPORT
Actuarial UnfundedAccrued Unfunded (Assets in Excess)
Actuarial Liability (Assets in AAL as aActuarial Value of (AAL) Excess of) Funded Covered Percentage ofValuation Assets (**) AAL Ratio Payroll Covered Payroll
Date (a) (b) (b-a) (a/b) (c) [(b-a)/c]
10/1/2008 -$ 9,204,224$ 9,204,224$ 0.0% 55,855,982$ 16.5%10/1/2009 - 8,934,672 8,934,672 0.0% 54,837,162 16.3%10/1/2010 - 9,528,860 9,528,860 0.0% 53,105,369 17.9%
City of Boynton Beach, FloridaRequired Supplementary Information
Other Post Employment BenefitsSeptember 30, 2011
Schedule of Funding Progress
II-71
II-71

THE CITY OF BOYNTON BEACH
FY 2011 COMPREHENSIVE ANNUAL FINANCIAL REPORT
Combining and Individual Fund Statements

THE CITY OF BOYNTON BEACH
FY 2011 COMPREHENSIVE ANNUAL FINANCIAL REPORT
II-72
MAJOR GOVERNMENTAL FUNDS
General Fund:The General Fund serves as the primary operating fund of the City. It accounts for all financial resources except those required to be accounted for in another fund.
Boynton Beach CRA Special Revenue Fund:The Boynton Beach CRA Special Revenue Fund accounts for revenues and expenditures relative to all the general operations of the City’s Community Redevelopment Agency (CRA). It is a blended component unit that encourages development in the City’s downtown area.
Public Service Tax Debt Service Fund:The Public Service Tax Debt Service Fund accounts for the payment of principal and interest and fiscal charges on the City’s revenue bonds which are payable from non ad valorem revenues.
II-72
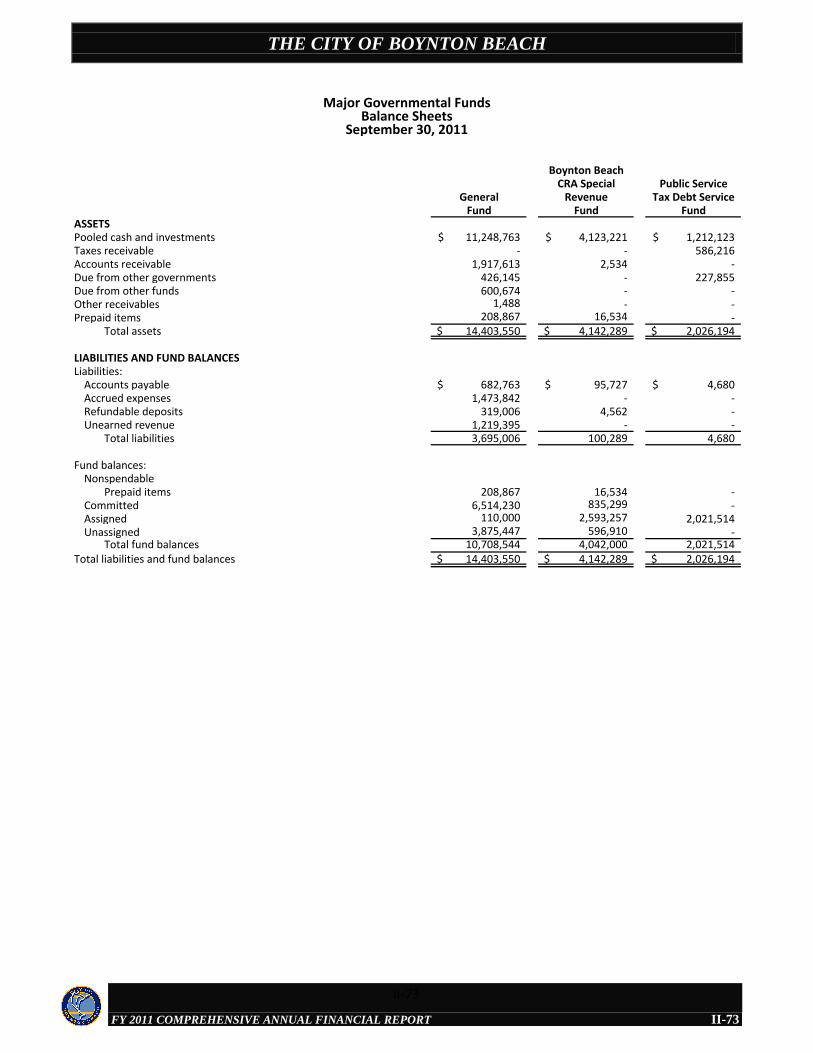
THE CITY OF BOYNTON BEACH
FY 2011 COMPREHENSIVE ANNUAL FINANCIAL REPORT
Boynton BeachCRA Special Public Service
General Revenue Tax Debt ServiceFund Fund Fund
ASSETSPooled cash and investments 11,248,763$ 4,123,221$ 1,212,123$ Taxes receivable - - 586,216 Accounts receivable 1,917,613 2,534 - Due from other governments 426,145 - 227,855 Due from other funds 600,674 - - Other receivables 1,488 - - Prepaid items 208,867 16,534 -
Total assets 14,403,550$ 4,142,289$ 2,026,194$
LIABILITIES AND FUND BALANCESLiabilities:
Accounts payable 682,763$ 95,727$ 4,680$ Accrued expenses 1,473,842 - - Refundable deposits 319,006 4,562 - Unearned revenue 1,219,395 - -
Total liabilities 3,695,006 100,289 4,680
Fund balances:Nonspendable
Prepaid items 208,867 16,534 - Committed 6,514,230 835,299 - Assigned 110,000 2,593,257 2,021,514 Unassigned 3,875,447 596,910 -
Total fund balances 10,708,544 4,042,000 2,021,514 Total liabilities and fund balances 14,403,550$ 4,142,289$ 2,026,194$
Major Governmental FundsBalance Sheets
September 30, 2011
II-73
II-73
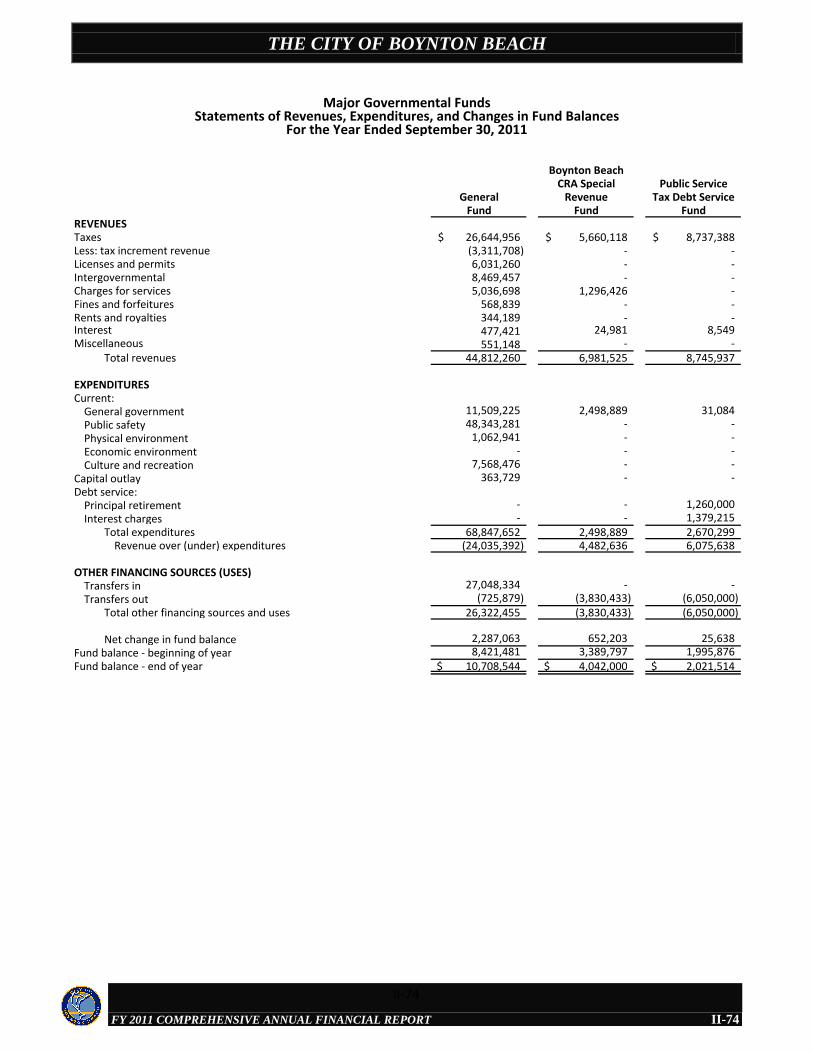
THE CITY OF BOYNTON BEACH
FY 2011 COMPREHENSIVE ANNUAL FINANCIAL REPORT
Boynton BeachCRA Special Public Service
General Revenue Tax Debt ServiceFund Fund Fund
REVENUESTaxes 26,644,956$ 5,660,118$ 8,737,388$ Less: tax increment revenue (3,311,708) - - Licenses and permits 6,031,260 - - Intergovernmental 8,469,457 - - Charges for services 5,036,698 1,296,426 - Fines and forfeitures 568,839 - - Rents and royalties 344,189 - - Interest 477,421 24,981 8,549 Miscellaneous 551,148 - -
Total revenues 44,812,260 6,981,525 8,745,937
EXPENDITURESCurrent:
General government 11,509,225 2,498,889 31,084 Public safety 48,343,281 - - Physical environment 1,062,941 - - Economic environment - - - Culture and recreation 7,568,476 - -
Capital outlay 363,729 - - Debt service:
Principal retirement - - 1,260,000 Interest charges - - 1,379,215
Total expenditures 68,847,652 2,498,889 2,670,299 Revenue over (under) expenditures (24,035,392) 4,482,636 6,075,638
OTHER FINANCING SOURCES (USES)Transfers in 27,048,334 - - Transfers out (725,879) (3,830,433) (6,050,000)
Total other financing sources and uses 26,322,455 (3,830,433) (6,050,000)
Net change in fund balance 2,287,063 652,203 25,638 Fund balance - beginning of year 8,421,481 3,389,797 1,995,876 Fund balance - end of year 10,708,544$ 4,042,000$ 2,021,514$
Major Governmental FundsStatements of Revenues, Expenditures, and Changes in Fund Balances
For the Year Ended September 30, 2011
II-74
II-74
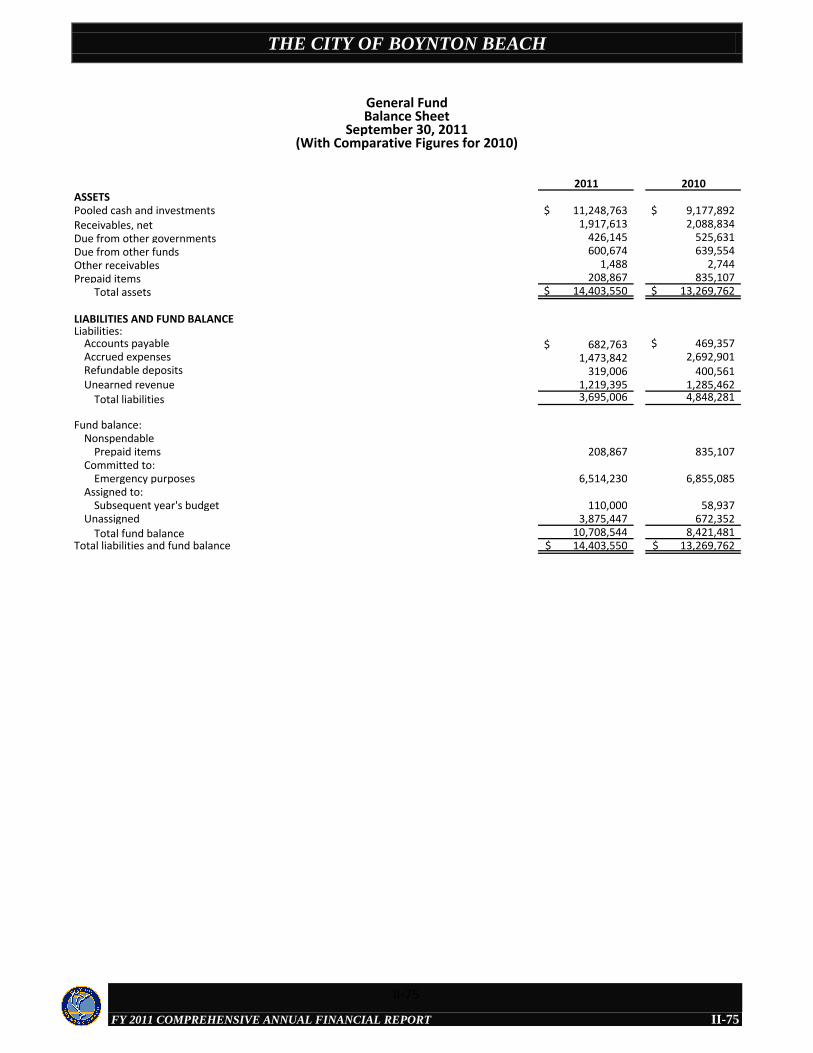
THE CITY OF BOYNTON BEACH
FY 2011 COMPREHENSIVE ANNUAL FINANCIAL REPORT
2011 2010ASSETSPooled cash and investments 11,248,763$ 9,177,892$ Receivables, net 1,917,613 2,088,834Due from other governments 426,145 525,631Due from other funds 600,674 639,554Other receivables 1,488 2,744Prepaid items 208,867 835,107
Total assets 14,403,550$ 13,269,762$
LIABILITIES AND FUND BALANCELiabilities:
Accounts payable 682,763$ 469,357$ Accrued expenses 1,473,842 2,692,901Refundable deposits 319,006 400,561Unearned revenue 1,219,395 1,285,462
Total liabilities 3,695,006 4,848,281
Fund balance:Nonspendable
Prepaid items 208,867 835,107Committed to:
Emergency purposes 6,514,230 6,855,085Assigned to:
Subsequent year's budget 110,000 58,937Unassigned 3,875,447 672,352
Total fund balance 10,708,544 8,421,481 Total liabilities and fund balance 14,403,550$ 13,269,762$
General FundBalance Sheet
September 30, 2011(With Comparative Figures for 2010)
II-75
II-75
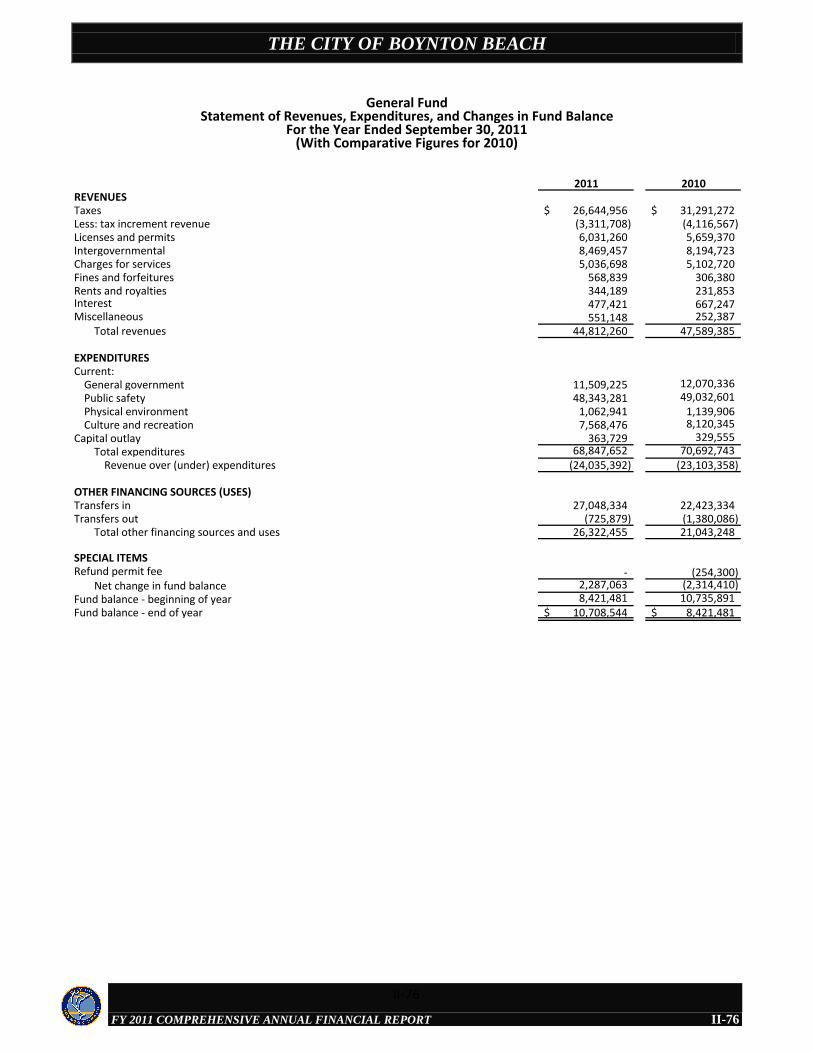
THE CITY OF BOYNTON BEACH
FY 2011 COMPREHENSIVE ANNUAL FINANCIAL REPORT
2011 2010REVENUESTaxes 26,644,956$ 31,291,272$ Less: tax increment revenue (3,311,708) (4,116,567)Licenses and permits 6,031,260 5,659,370Intergovernmental 8,469,457 8,194,723Charges for services 5,036,698 5,102,720Fines and forfeitures 568,839 306,380Rents and royalties 344,189 231,853Interest 477,421 667,247Miscellaneous 551,148 252,387
Total revenues 44,812,260 47,589,385
EXPENDITURESCurrent:
General government 11,509,225 12,070,336Public safety 48,343,281 49,032,601Physical environment 1,062,941 1,139,906Culture and recreation 7,568,476 8,120,345
Capital outlay 363,729 329,555Total expenditures 68,847,652 70,692,743
Revenue over (under) expenditures (24,035,392) (23,103,358)
OTHER FINANCING SOURCES (USES)Transfers in 27,048,334 22,423,334Transfers out (725,879) (1,380,086)
Total other financing sources and uses 26,322,455 21,043,248
SPECIAL ITEMSRefund permit fee - (254,300)
Net change in fund balance 2,287,063 (2,314,410) Fund balance - beginning of year 8,421,481 10,735,891Fund balance - end of year 10,708,544$ 8,421,481$
General FundStatement of Revenues, Expenditures, and Changes in Fund Balance
For the Year Ended September 30, 2011(With Comparative Figures for 2010)
II-76
II-76
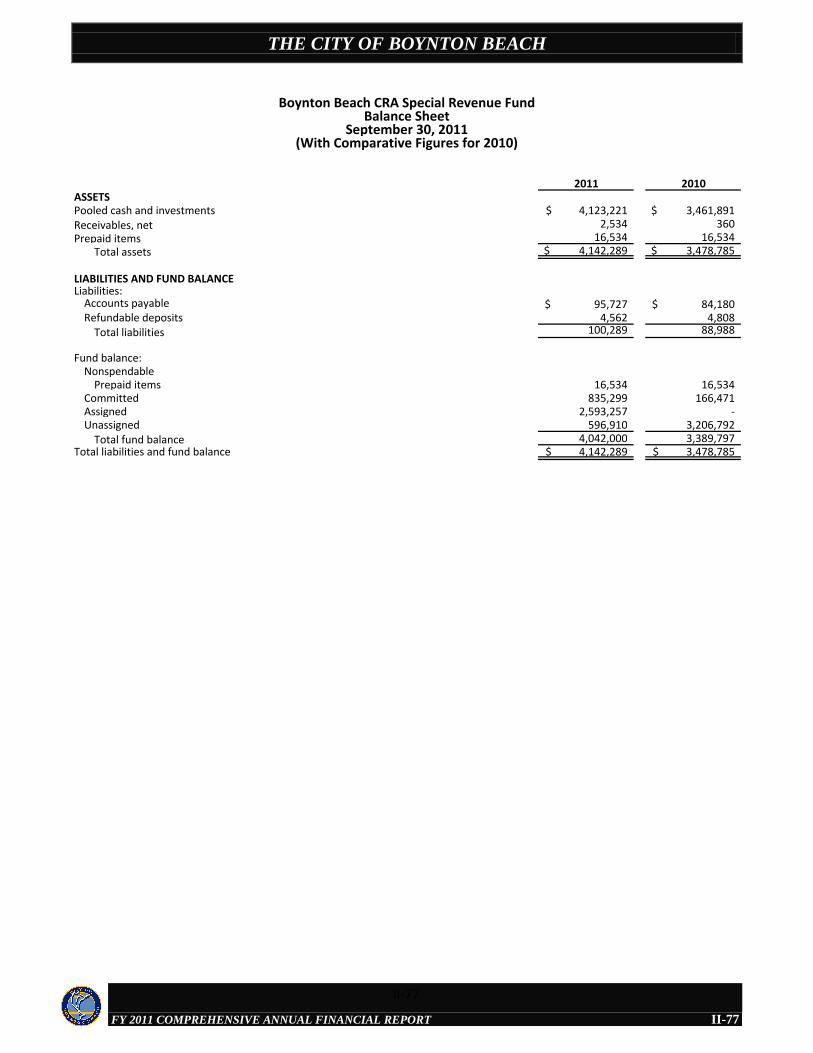
THE CITY OF BOYNTON BEACH
FY 2011 COMPREHENSIVE ANNUAL FINANCIAL REPORT
2011 2010ASSETSPooled cash and investments 4,123,221$ 3,461,891$ Receivables, net 2,534 360Prepaid items 16,534 16,534
Total assets 4,142,289$ 3,478,785$
LIABILITIES AND FUND BALANCELiabilities:
Accounts payable 95,727$ 84,180$ Refundable deposits 4,562 4,808
Total liabilities 100,289 88,988
Fund balance:Nonspendable
Prepaid items 16,534 16,534Committed 835,299 166,471Assigned 2,593,257 - Unassigned 596,910 3,206,792
Total fund balance 4,042,000 3,389,797 Total liabilities and fund balance 4,142,289$ 3,478,785$
Boynton Beach CRA Special Revenue FundBalance Sheet
September 30, 2011(With Comparative Figures for 2010)
II-77
II-77

THE CITY OF BOYNTON BEACH
FY 2011 COMPREHENSIVE ANNUAL FINANCIAL REPORT
2011 2010REVENUESTaxes 5,660,118$ 6,760,869$ Charges for services 1,296,426 1,159,607Interest 24,981 23,904
Total revenues 6,981,525 7,944,380
EXPENDITURESCurrent:
General government 2,498,889 2,944,762Total expenditures 2,498,889 2,944,762
Revenue over expenditures 4,482,636 4,999,618
OTHER FINANCING USESTransfers out (3,830,433) (5,621,571)
Total other financing uses (3,830,433) (5,621,571)
Net change in fund balance 652,203 (621,953) Fund balance - beginning of year 3,389,797 4,011,750Fund balance - end of year 4,042,000$ 3,389,797$
Boynton Beach CRA Special Revenue FundStatement of Revenues, Expenditures, and Changes in Fund Balance
For the Year Ended September 30, 2011(With Comparative Figures for 2010)
II-78
II-78
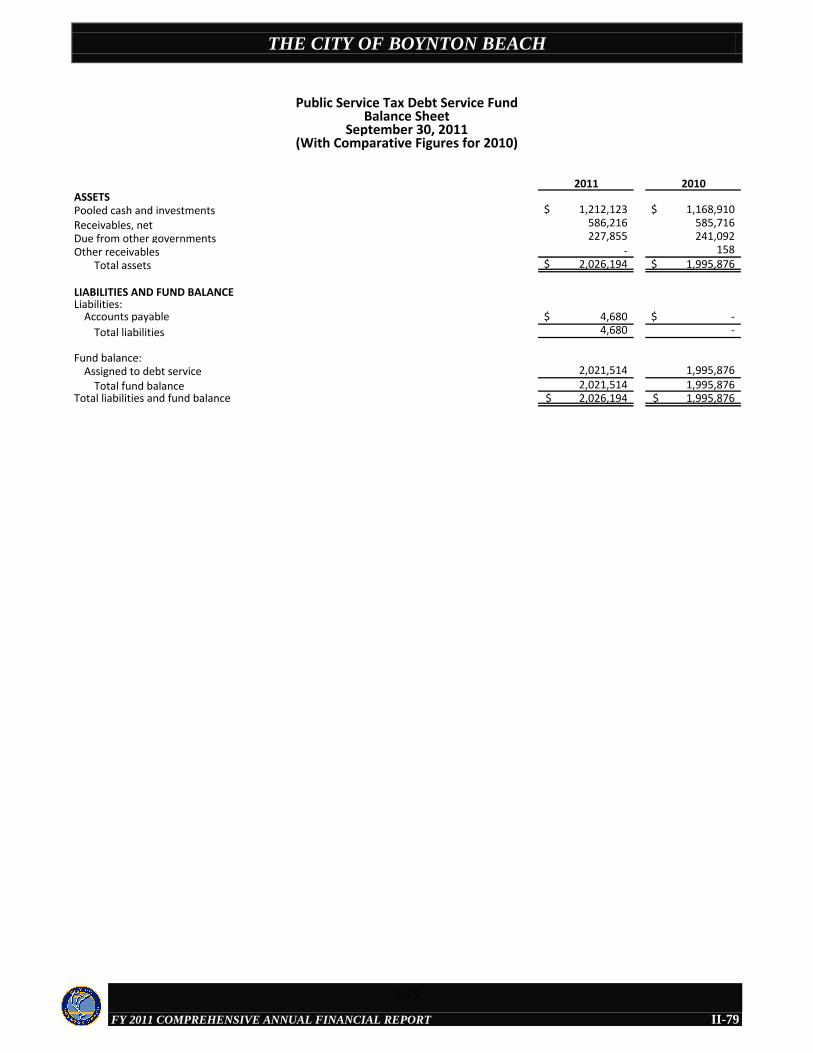
THE CITY OF BOYNTON BEACH
FY 2011 COMPREHENSIVE ANNUAL FINANCIAL REPORT
2011 2010ASSETSPooled cash and investments 1,212,123$ 1,168,910$
Receivables, net 586,216 585,716
Due from other governments 227,855 241,092
Other receivables - 158
Total assets 2,026,194$ 1,995,876$
LIABILITIES AND FUND BALANCELiabilities:
Accounts payable 4,680$ -$
Total liabilities 4,680 -
Fund balance:Assigned to debt service 2,021,514 1,995,876
Total fund balance 2,021,514 1,995,876 Total liabilities and fund balance 2,026,194$ 1,995,876$
Public Service Tax Debt Service FundBalance Sheet
September 30, 2011(With Comparative Figures for 2010)
II-79
II-79
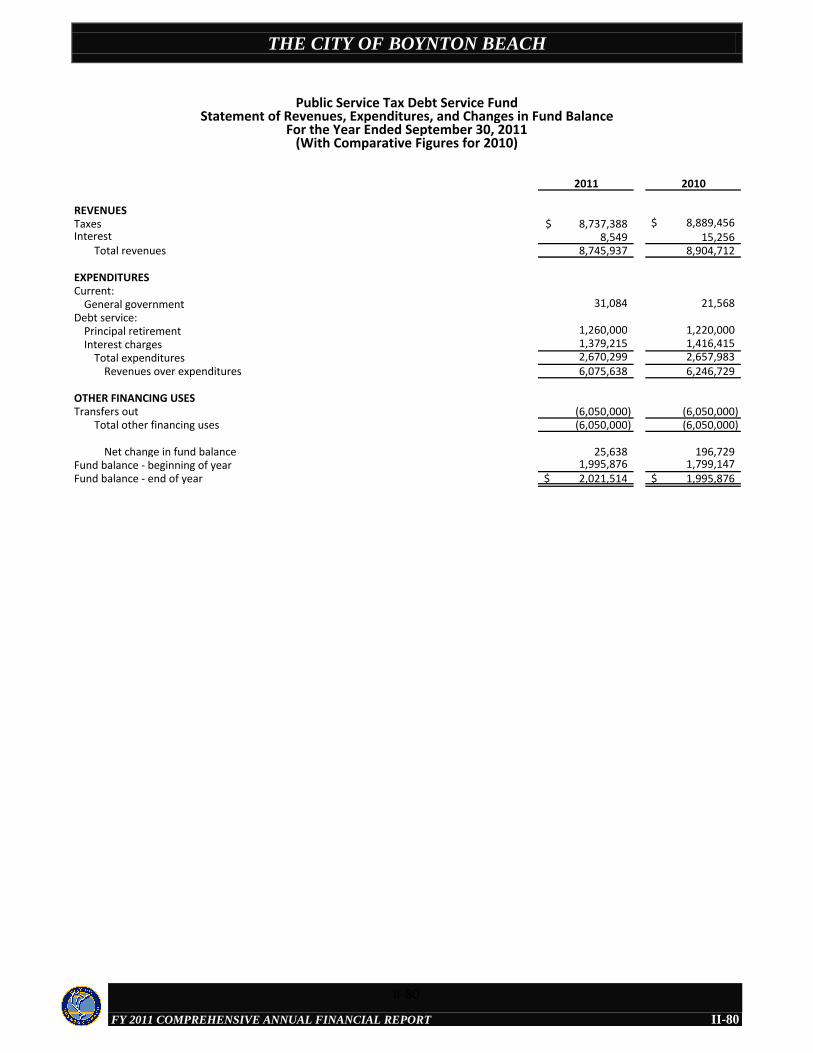
THE CITY OF BOYNTON BEACH
FY 2011 COMPREHENSIVE ANNUAL FINANCIAL REPORT
2011 2010
REVENUESTaxes 8,737,388$ 8,889,456$ Interest 8,549 15,256
Total revenues 8,745,937 8,904,712
EXPENDITURESCurrent:
General government 31,084 21,568Debt service:
Principal retirement 1,260,000 1,220,000Interest charges 1,379,215 1,416,415
Total expenditures 2,670,299 2,657,983 Revenues over expenditures 6,075,638 6,246,729
OTHER FINANCING USESTransfers out (6,050,000) (6,050,000)
Total other financing uses (6,050,000) (6,050,000)
Net change in fund balance 25,638 196,729 Fund balance - beginning of year 1,995,876 1,799,147Fund balance - end of year 2,021,514$ 1,995,876$
Public Service Tax Debt Service FundStatement of Revenues, Expenditures, and Changes in Fund Balance
For the Year Ended September 30, 2011(With Comparative Figures for 2010)
II-80
II-80

THE CITY OF BOYNTON BEACH
FY 2011 COMPREHENSIVE ANNUAL FINANCIAL REPORT
II-81
MAJOR ENTERPRISE FUNDS
Enterprise funds account for activities for which a fee is charged to external users for services or activities financed with debt that is secured solely by a pledge of the net revenues from fees of the activity.
Water & Sewer Fund:To account for the operations of the City’s water, sewer, and stormwater utility services.
Sanitation Fund:To account for the operations of refuse and recycling pickup for all residences and commercial establishments located within the city limits of Boynton Beach.
II-81
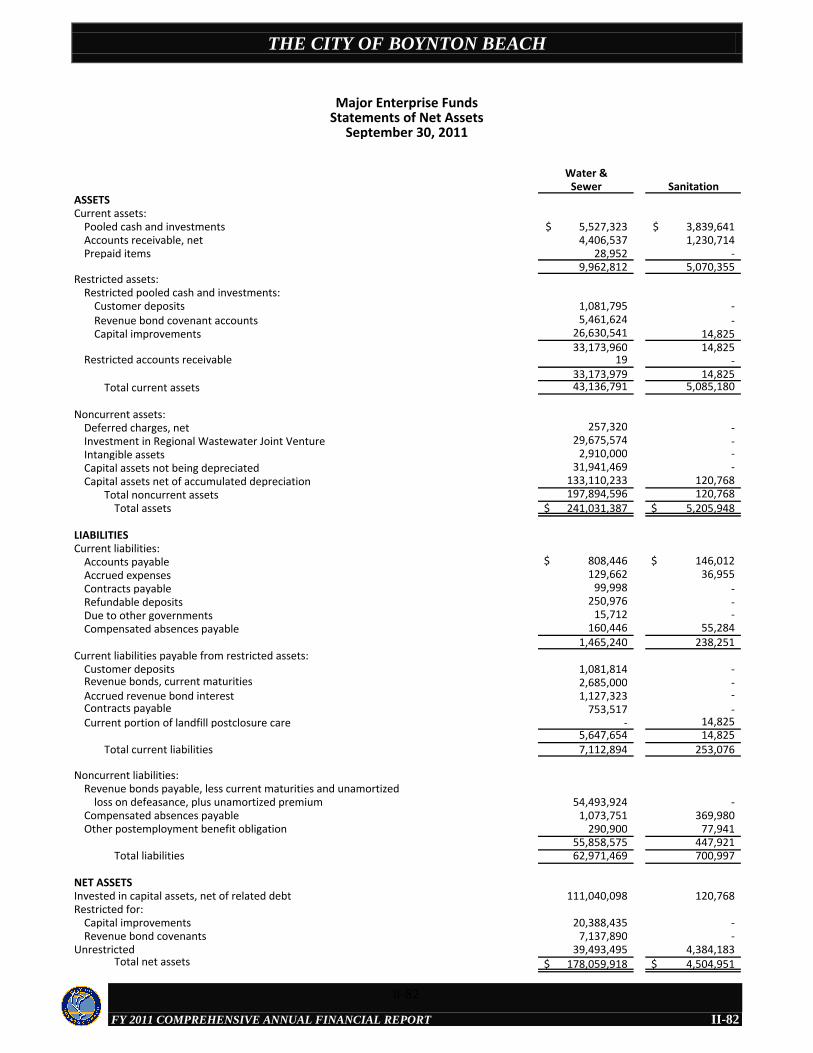
THE CITY OF BOYNTON BEACH
FY 2011 COMPREHENSIVE ANNUAL FINANCIAL REPORT
Water &Sewer Sanitation
ASSETSCurrent assets:
Pooled cash and investments 5,527,323$ 3,839,641$ Accounts receivable, net 4,406,537 1,230,714 Prepaid items 28,952 -
9,962,812 5,070,355 Restricted assets:
Restricted pooled cash and investments:Customer deposits 1,081,795 - Revenue bond covenant accounts 5,461,624 - Capital improvements 26,630,541 14,825
33,173,960 14,825 Restricted accounts receivable 19 -
33,173,979 14,825 Total current assets 43,136,791 5,085,180
Noncurrent assets:Deferred charges, net 257,320 - Investment in Regional Wastewater Joint Venture 29,675,574 - Intangible assets 2,910,000 - Capital assets not being depreciated 31,941,469 - Capital assets net of accumulated depreciation 133,110,233 120,768
Total noncurrent assets 197,894,596 120,768 Total assets 241,031,387$ 5,205,948$
LIABILITIESCurrent liabilities:
Accounts payable 808,446$ 146,012$ Accrued expenses 129,662 36,955 Contracts payable 99,998 - Refundable deposits 250,976 - Due to other governments 15,712 - Compensated absences payable 160,446 55,284
1,465,240 238,251 Current liabilities payable from restricted assets:
Customer deposits 1,081,814 - Revenue bonds, current maturities 2,685,000 - Accrued revenue bond interest 1,127,323 - Contracts payable 753,517 - Current portion of landfill postclosure care - 14,825
5,647,654 14,825 Total current liabilities 7,112,894 253,076
Noncurrent liabilities:Revenue bonds payable, less current maturities and unamortized
loss on defeasance, plus unamortized premium 54,493,924 - Compensated absences payable 1,073,751 369,980 Other postemployment benefit obligation 290,900 77,941
55,858,575 447,921 Total liabilities 62,971,469 700,997
NET ASSETSInvested in capital assets, net of related debt 111,040,098 120,768 Restricted for:
Capital improvements 20,388,435 - Revenue bond covenants 7,137,890 -
Unrestricted 39,493,495 4,384,183 Total net assets 178,059,918$ 4,504,951$
Major Enterprise FundsStatements of Net Assets
September 30, 2011
II-82
II-82
THE CITY OF BOYNTON BEACH
FY 2011 COMPREHENSIVE ANNUAL FINANCIAL REPORT
Water &Sewer Sanitation
OPERATING REVENUESCharges for services:
Water sales 18,433,310$ -$ Sewer service 16,016,978 - Garbage fees - 10,080,888 Stormwater utility fees 3,735,771 -
Total operating revenues 38,186,059 10,080,888
OPERATING EXPENSESPersonal services and benefits 10,530,631 2,897,038 Supplies, services, and claims 11,659,041 3,322,330 Depreciation and amortization 9,432,219 40,114
Total operating expenses 31,621,891 6,259,482 Operating income 6,564,168 3,821,406
NONOPERATING REVENUES (EXPENSES)Intergovernmental revenue - 125,719 Interest income 1,000,082 83,839 Interest expense (1,268,101) - Equity in loss of Regional Wastewater Joint Venture (1,997,356) - Loss on disposal of capital assets (1,232) (1,613) Miscellaneous income 21,967 21,591
(2,244,640) 229,536 Income before contributions and transfers 4,319,528 4,050,942
Capital contributions 183,462 - Transfers:
Transfers in 101,000 11,800 Transfers out (4,896,213) (4,245,607)
Total transfers (4,795,213) (4,233,807) Change in net assets (292,223) (182,865)
Net assets - beginning of year 178,352,141 4,687,816 Net assets - end of year 178,059,918$ 4,504,951$
Major Enterprise FundsStatements of Revenues, Expenses, and Changes in Net Assets
For the Year Ended September 30, 2011
II-83
II-83
THE CITY OF BOYNTON BEACH
FY 2011 COMPREHENSIVE ANNUAL FINANCIAL REPORT
Water &Sewer Sanitation
Cash Flows From Operating ActivitiesReceipts from customers and users 38,797,148$ 10,014,119$ Payments to suppliers (10,646,360) (1,934,433) Payments to employees (11,019,505) (3,026,557) Payments for interfund services used (1,440,914) (1,336,688)
Net cash provided by operating activities 15,690,369 3,716,441
Cash Flows From Non-Capital Financing ActivitiesTransfers in 101,000 11,800 Transfers out (4,896,213) (4,245,607) Subsidies from governmental grants - 125,719
Net cash used in non-capital financing activities (4,795,213) (4,108,088)
Cash Flows From Capital and Related Financing ActivitiesAcquisition of capital assets (9,421,733) - Capital contributions 183,462 - Principal payments on revenue bonds (2,590,000) - Interest payments on revenue bonds (2,752,234) - Other proceeds 21,967 21,591
Net cash provided by (used in) capital and related financing activities (14,558,538) 21,591
Cash Flows From Investing ActivityInterest received 1,000,082 83,839
Net cash provided by investing activity 1,000,082 83,839 Decrease in cash and cash equivalents (2,663,300) (286,217) Cash and cash equivalents - beginning of year 41,364,583 4,140,683 Cash and cash equivalents - end of year 38,701,283$ 3,854,466$
Reconciliation of Operating Income to Net Cash Provided By Operating Activities:
Operating income 6,564,168$ 3,821,406$ Adjustments to reconcile operating income to net cash
provided by operating activities:Depreciation and amortization 9,432,219 40,114 Provision for doubtful accounts 456,097 - Changes in operating assets and liabilities:
Accounts receivable (565,857) (66,769) Due from other funds 436,680 - Due from other governments 300,000 - Prepaid items (13,416) 209 Accounts payable 23,012 8,638 Contracts payable (537,023) - Accrued expenses (337,563) (81,196) Other payables - 77,941 Refundable deposits (70,948) - Due to other governments 2,666 - Landfill postclosure care - (35,579) Compensated absences payable (151,311) (48,323) Customer deposits 55,117 - Other postemployment benefit obligation 96,528 -
Total adjustments 9,126,201 (104,965) Net cash provided by operating activities 15,690,369$ 3,716,441$
Noncash Investing, Capital and Related Financing Activities:Equity in loss of Regional Wastewater Joint Venture (1,997,355)$ -$ Gain (loss) on disposal of capital assets (1,232) (1,613) Amortization of debt issue costs 53,230 - Amortization of bond premiums (56,655) - Amortization of deferred loss on bond defeasance 196,703 -
Major Enterprise FundsStatements of Cash Flows
For the Year Ended September 30, 2011
II-84
II-84
THE CITY OF BOYNTON BEACH
FY 2011 COMPREHENSIVE ANNUAL FINANCIAL REPORT
2011 2010
ASSETS
Current assets:Pooled cash and investments 5,527,323$ 2,376,886$ Accounts receivable, net 4,406,537 4,296,777Due from other funds - 436,680Due from other governments - 300,000Prepaid items 28,952 15,536
9,962,812 7,425,879 Restricted assets:
Restricted pooled cash and investments:Customer deposits 1,081,795 1,026,378 Revenue bond covenant accounts 5,461,624 5,231,754 Capital improvements 26,630,541 32,729,565
33,173,960 38,987,697 Restricted accounts receivable 19 1,362
33,173,979 38,989,059Total current assets 43,136,791 46,414,938
Noncurrent assets:Deferred charges, net 257,320 310,550 Investment in Regional Wastewater Joint Venture 29,675,574 31,672,929 Intangible assets 2,910,000 2,910,000 Capital assets not being depreciated 31,941,469 31,422,937 Capital assets net of accumulated depreciation 133,110,233 132,000,612
Total noncurrent assets 197,894,596 198,317,028 Total assets 241,031,387$ 244,731,966$
LIABILITIES
Current liabilities:Accounts payable 808,446$ 785,434$ Accrued expenses 129,662 467,225 Contracts payable 99,998 4,823 Refundable deposits 250,976 321,924 Due to other governments 15,712 13,046 Compensated absences payable 160,446 180,116
1,465,240 1,772,568 Current liabilities payable from restricted assets:
Customer deposits 1,081,814 1,026,697 Revenue bonds, current maturities 2,685,000 2,590,000 Accrued revenue bond interest 1,127,323 1,166,205 Contracts payable 753,517 1,385,715
5,647,654 6,168,617 Total current liabilities 7,112,894 7,941,185
Noncurrent liabilities:Revenue bonds payable, less current maturities and unamortized
loss on defeasance, plus unamortized premium 54,493,924 57,038,876 Compensated absences payable 1,073,751 1,205,392 Other postemployment benefit obligation 290,900 194,372
Total noncurrent liabilities 55,858,575 58,438,640 Total liabilities 62,971,469 66,379,825
NET ASSETS
Invested in capital assets, net of related debt 111,040,098 107,015,223 Restricted for:
Capital improvements 20,388,435 26,723,723 Revenue bond covenants 7,137,890 6,762,301
Unrestricted 39,493,495 37,850,894 Total net assets 178,059,918$ 178,352,141$
Water & Sewer FundStatement of Net Assets
September 30, 2011(With Comparative Figures for 2010)
II-85
II-85
THE CITY OF BOYNTON BEACH
FY 2011 COMPREHENSIVE ANNUAL FINANCIAL REPORT
2011 2010OPERATING REVENUESCharges for services:
Water sales 18,433,310$ 17,332,495$ Sewer service 16,016,978 15,103,514 Stormwater utility fees 3,735,771 3,508,982
Total operating revenues 38,186,059 35,944,991
OPERATING EXPENSESPersonal services and benefits 10,530,631 10,965,510 Supplies, services, and claims 11,659,041 11,491,905 Depreciation and amortization 9,432,219 9,053,305
Total operating expenses 31,621,891 31,510,720 Operating income 6,564,168 4,434,271
NONOPERATING REVENUES (EXPENSES)Intergovernmental revenue - 1,029,354 Interest income 1,000,082 1,221,190 Interest expense (1,268,101) (1,896,034) Equity in loss of Regional Wastewater Joint Venture (1,997,356) (1,262,261) Gain/(Loss) on disposal of capital assets (1,232) (7,094) Miscellaneous income 21,967 461,774
(2,244,640) (453,071) Income before contributions and transfers 4,319,528 3,981,200
Capital contributions 183,462 189,465 Transfers:
Transfers in 101,000 101,000 Transfers out (4,896,213) (4,912,527)
Total transfers (4,795,213) (4,811,527) Change in net assets (292,223) (640,862)
Net assets - beginning of year 178,352,141 178,993,003 Net assets - end of year 178,059,918$ 178,352,141$
Water & Sewer FundStatement of Revenues, Expenses, and Changes in Net Assets
For the Year Ended September 30, 2011(With Comparative Figures for 2010)
II-86
II-86
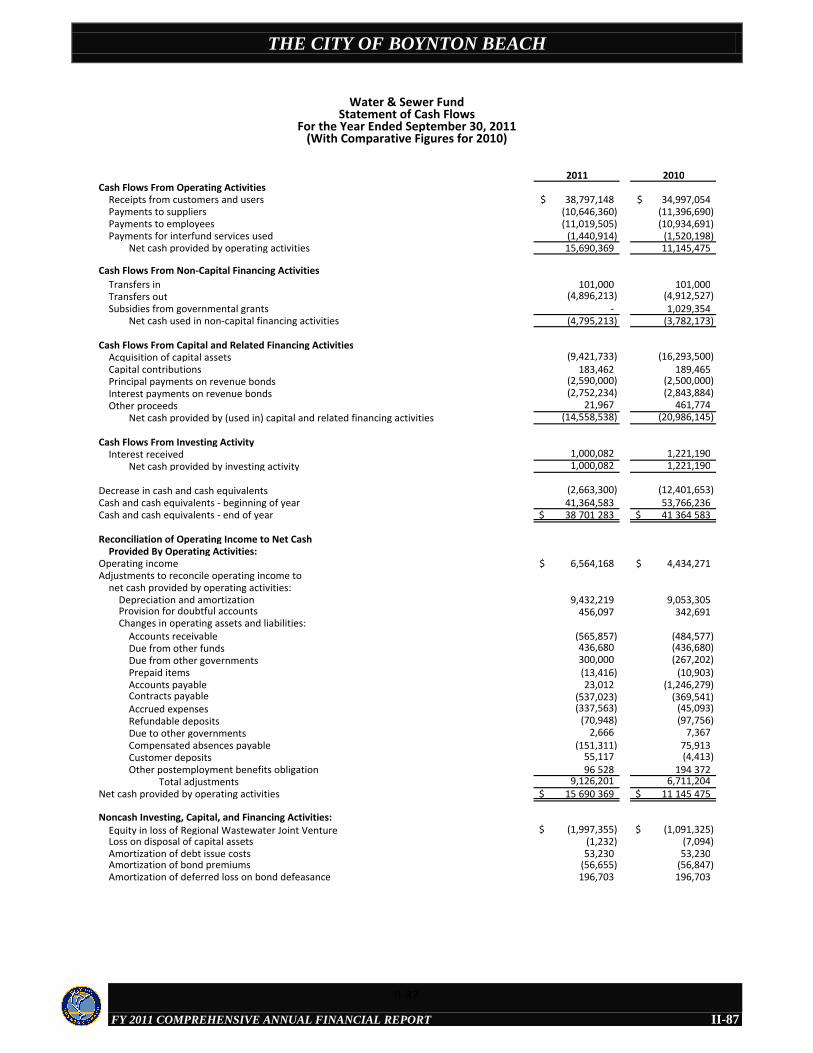
THE CITY OF BOYNTON BEACH
FY 2011 COMPREHENSIVE ANNUAL FINANCIAL REPORT
2011 2010Cash Flows From Operating Activities
Receipts from customers and users 38,797,148$ 34,997,054$ Payments to suppliers (10,646,360) (11,396,690) Payments to employees (11,019,505) (10,934,691) Payments for interfund services used (1,440,914) (1,520,198)
Net cash provided by operating activities 15,690,369 11,145,475
Cash Flows From Non-Capital Financing Activities
Transfers in 101,000 101,000 Transfers out (4,896,213) (4,912,527) Subsidies from governmental grants - 1,029,354
Net cash used in non-capital financing activities (4,795,213) (3,782,173)
Cash Flows From Capital and Related Financing ActivitiesAcquisition of capital assets (9,421,733) (16,293,500) Capital contributions 183,462 189,465 Principal payments on revenue bonds (2,590,000) (2,500,000) Interest payments on revenue bonds (2,752,234) (2,843,884) Other proceeds 21,967 461,774
Net cash provided by (used in) capital and related financing activities (14,558,538) (20,986,145)
Cash Flows From Investing ActivityInterest received 1,000,082 1,221,190
Net cash provided by investing activity 1,000,082 1,221,190
Decrease in cash and cash equivalents (2,663,300) (12,401,653) Cash and cash equivalents - beginning of year 41,364,583 53,766,236 Cash and cash equivalents - end of year 38 701 283$ 41 364 583$
Reconciliation of Operating Income to Net Cash Provided By Operating Activities:
Operating income 6,564,168$ 4,434,271$ Adjustments to reconcile operating income to
net cash provided by operating activities:Depreciation and amortization 9,432,219 9,053,305 Provision for doubtful accounts 456,097 342,691 Changes in operating assets and liabilities:
Accounts receivable (565,857) (484,577) Due from other funds 436,680 (436,680) Due from other governments 300,000 (267,202) Prepaid items (13,416) (10,903) Accounts payable 23,012 (1,246,279) Contracts payable (537,023) (369,541) Accrued expenses (337,563) (45,093) Refundable deposits (70,948) (97,756) Due to other governments 2,666 7,367 Compensated absences payable (151,311) 75,913 Customer deposits 55,117 (4,413) Other postemployment benefits obligation 96 528 194 372
Total adjustments 9,126,201 6,711,204 Net cash provided by operating activities 15 690 369$ 11 145 475$
Noncash Investing, Capital, and Financing Activities:Equity in loss of Regional Wastewater Joint Venture (1,997,355)$ (1,091,325)$ Loss on disposal of capital assets (1,232) (7,094) Amortization of debt issue costs 53,230 53,230 Amortization of bond premiums (56,655) (56,847) Amortization of deferred loss on bond defeasance 196,703 196,703
Water & Sewer FundStatement of Cash Flows
For the Year Ended September 30, 2011(With Comparative Figures for 2010)
II-87
II-87
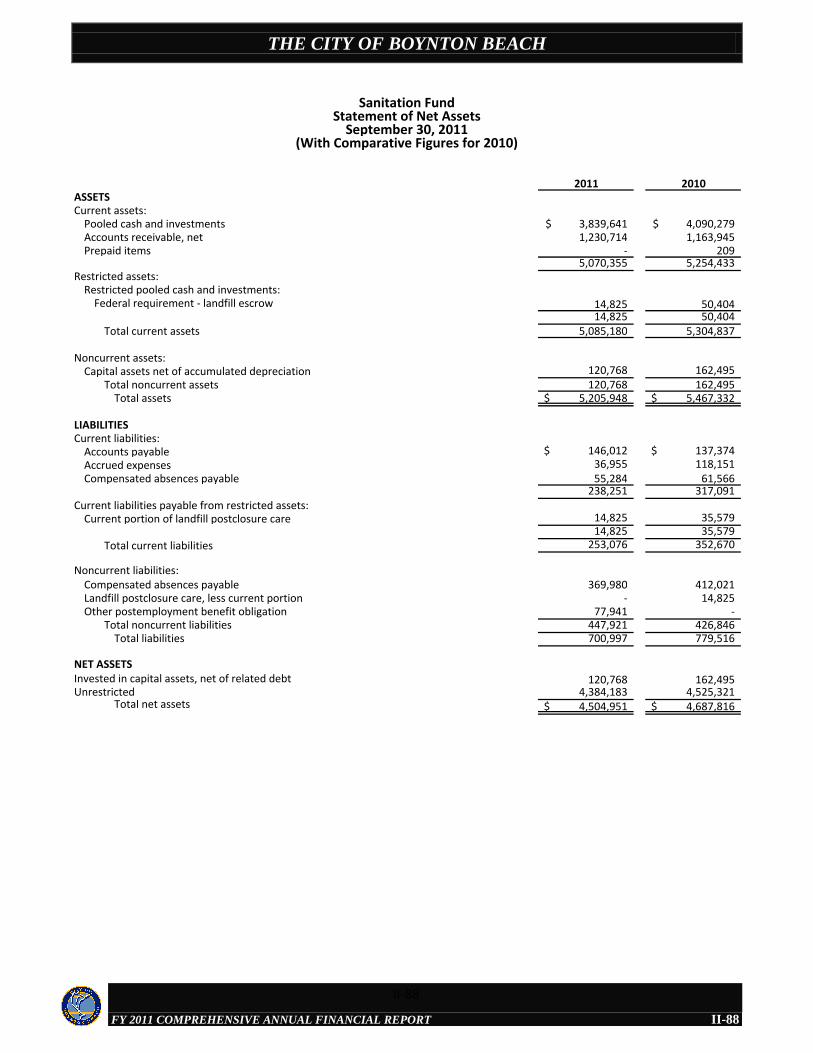
THE CITY OF BOYNTON BEACH
FY 2011 COMPREHENSIVE ANNUAL FINANCIAL REPORT
2011 2010ASSETSCurrent assets:
Pooled cash and investments 3,839,641$ 4,090,279$ Accounts receivable, net 1,230,714 1,163,945Prepaid items - 209
5,070,355 5,254,433 Restricted assets:
Restricted pooled cash and investments:Federal requirement - landfill escrow 14,825 50,404
14,825 50,404Total current assets 5,085,180 5,304,837
Noncurrent assets:Capital assets net of accumulated depreciation 120,768 162,495
Total noncurrent assets 120,768 162,495 Total assets 5,205,948$ 5,467,332$
LIABILITIESCurrent liabilities:
Accounts payable 146,012$ 137,374$ Accrued expenses 36,955 118,151Compensated absences payable 55,284 61,566
238,251 317,091 Current liabilities payable from restricted assets:
Current portion of landfill postclosure care 14,825 35,57914,825 35,579
Total current liabilities 253,076 352,670
Noncurrent liabilities:Compensated absences payable 369,980 412,021Landfill postclosure care, less current portion - 14,825Other postemployment benefit obligation 77,941 -
Total noncurrent liabilities 447,921 426,846 Total liabilities 700,997 779,516
NET ASSETSInvested in capital assets, net of related debt 120,768 162,495Unrestricted 4,384,183 4,525,321
Total net assets 4,504,951$ 4,687,816$
Sanitation FundStatement of Net Assets
September 30, 2011(With Comparative Figures for 2010)
II-88
II-88
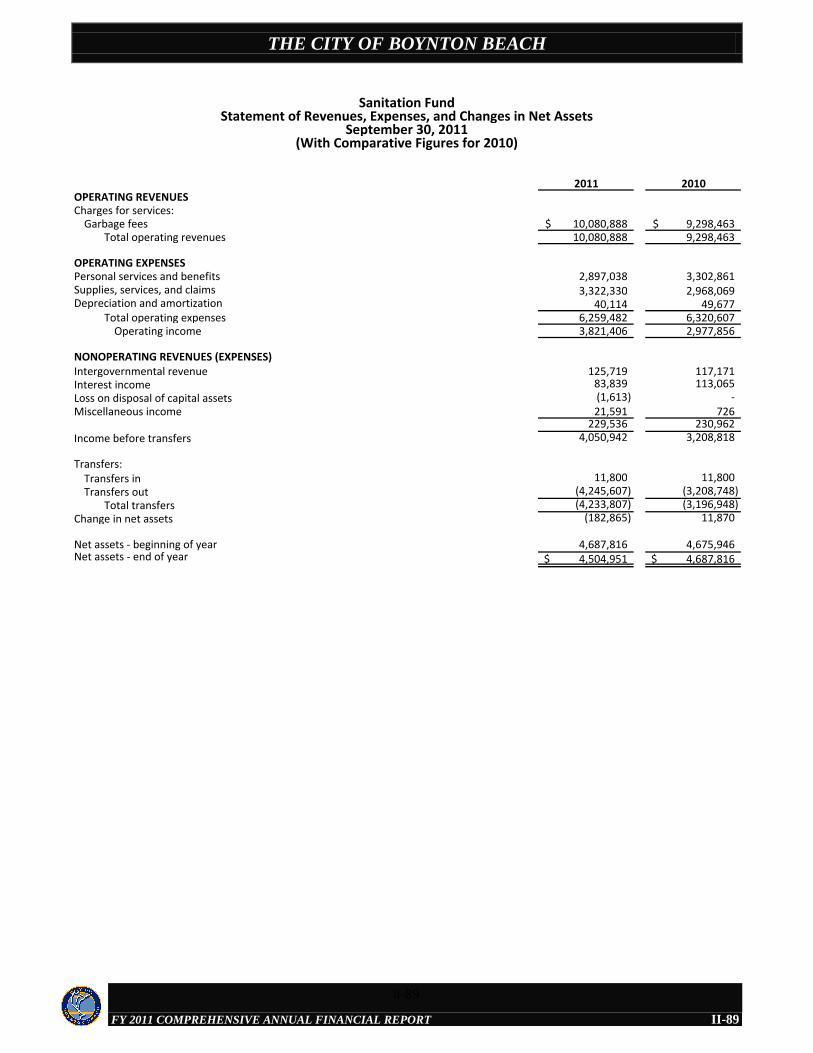
THE CITY OF BOYNTON BEACH
FY 2011 COMPREHENSIVE ANNUAL FINANCIAL REPORT
2011 2010OPERATING REVENUESCharges for services:
Garbage fees 10,080,888$ 9,298,463$ Total operating revenues 10,080,888 9,298,463
OPERATING EXPENSESPersonal services and benefits 2,897,038 3,302,861Supplies, services, and claims 3,322,330 2,968,069Depreciation and amortization 40,114 49,677
Total operating expenses 6,259,482 6,320,607 Operating income 3,821,406 2,977,856
NONOPERATING REVENUES (EXPENSES)Intergovernmental revenue 125,719 117,171Interest income 83,839 113,065Loss on disposal of capital assets (1,613) - Miscellaneous income 21,591 726
229,536 230,962 Income before transfers 4,050,942 3,208,818
Transfers:Transfers in 11,800 11,800Transfers out (4,245,607) (3,208,748)
Total transfers (4,233,807) (3,196,948) Change in net assets (182,865) 11,870
Net assets - beginning of year 4,687,816 4,675,946Net assets - end of year 4,504,951$ 4,687,816$
Sanitation FundStatement of Revenues, Expenses, and Changes in Net Assets
September 30, 2011(With Comparative Figures for 2010)
II-89
II-89
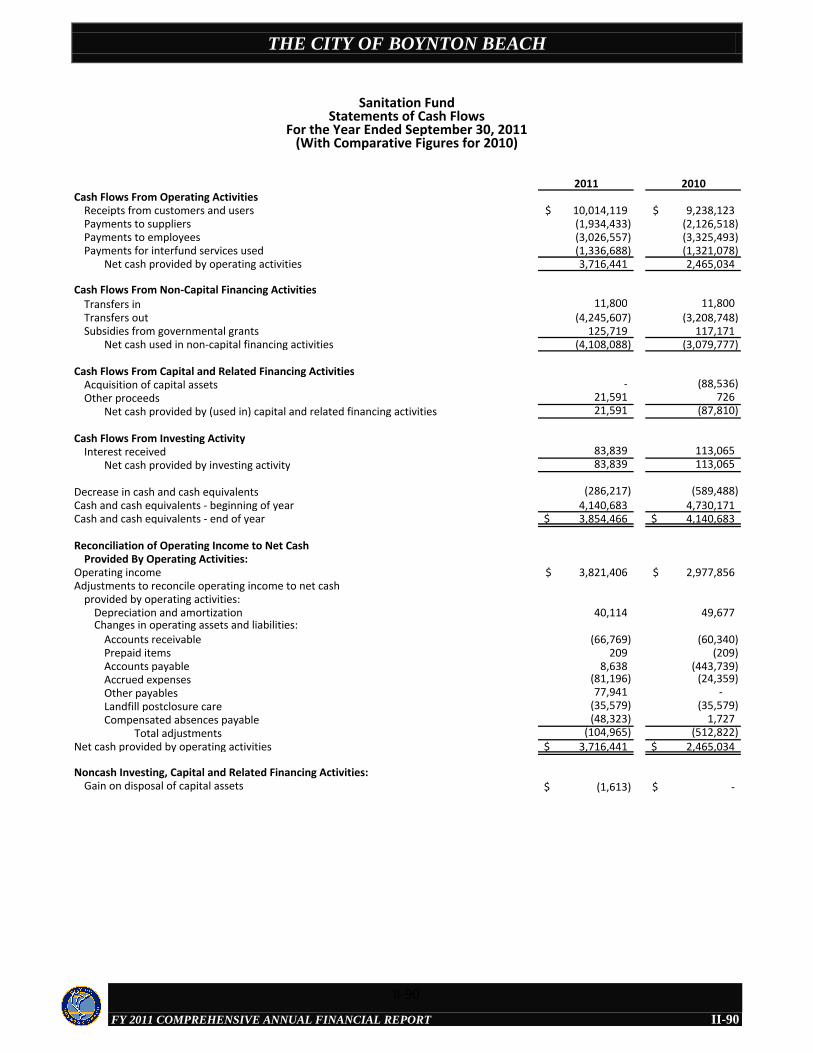
THE CITY OF BOYNTON BEACH
FY 2011 COMPREHENSIVE ANNUAL FINANCIAL REPORT
2011 2010Cash Flows From Operating Activities
Receipts from customers and users 10,014,119$ 9,238,123$ Payments to suppliers (1,934,433) (2,126,518) Payments to employees (3,026,557) (3,325,493) Payments for interfund services used (1,336,688) (1,321,078)
Net cash provided by operating activities 3,716,441 2,465,034
Cash Flows From Non-Capital Financing ActivitiesTransfers in 11,800 11,800 Transfers out (4,245,607) (3,208,748) Subsidies from governmental grants 125,719 117,171
Net cash used in non-capital financing activities (4,108,088) (3,079,777)
Cash Flows From Capital and Related Financing ActivitiesAcquisition of capital assets - (88,536) Other proceeds 21,591 726
Net cash provided by (used in) capital and related financing activities 21,591 (87,810)
Cash Flows From Investing ActivityInterest received 83,839 113,065
Net cash provided by investing activity 83,839 113,065
Decrease in cash and cash equivalents (286,217) (589,488) Cash and cash equivalents - beginning of year 4,140,683 4,730,171 Cash and cash equivalents - end of year 3,854,466$ 4,140,683$
Reconciliation of Operating Income to Net Cash Provided By Operating Activities:
Operating income 3,821,406$ 2,977,856$ Adjustments to reconcile operating income to net cash
provided by operating activities:Depreciation and amortization 40,114 49,677 Changes in operating assets and liabilities:
Accounts receivable (66,769) (60,340) Prepaid items 209 (209) Accounts payable 8,638 (443,739) Accrued expenses (81,196) (24,359) Other payables 77,941 - Landfill postclosure care (35,579) (35,579) Compensated absences payable (48,323) 1,727
Total adjustments (104,965) (512,822) Net cash provided by operating activities 3,716,441$ 2,465,034$
Noncash Investing, Capital and Related Financing Activities:Gain on disposal of capital assets (1,613)$ -$
Sanitation FundStatements of Cash Flows
For the Year Ended September 30, 2011(With Comparative Figures for 2010)
II-90
II-90
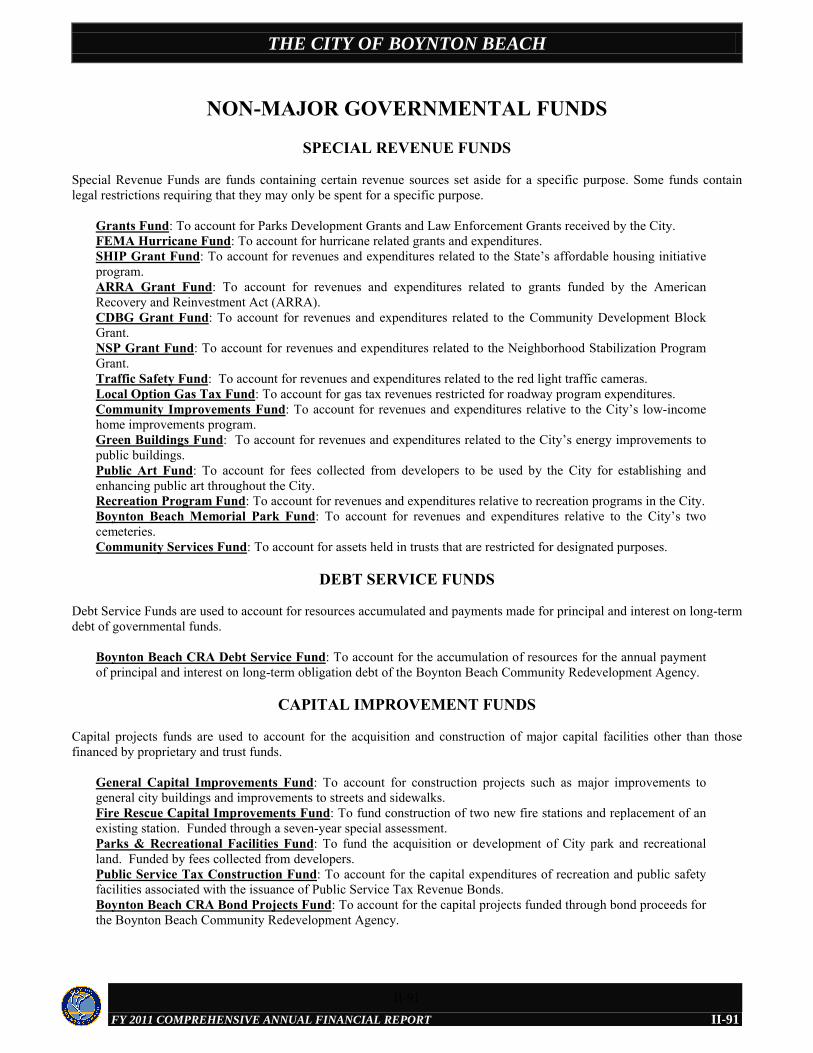
THE CITY OF BOYNTON BEACH
FY 2011 COMPREHENSIVE ANNUAL FINANCIAL REPORT
II-91
NON-MAJOR GOVERNMENTAL FUNDS
SPECIAL REVENUE FUNDS
Special Revenue Funds are funds containing certain revenue sources set aside for a specific purpose. Some funds contain legal restrictions requiring that they may only be spent for a specific purpose.
Grants Fund: To account for Parks Development Grants and Law Enforcement Grants received by the City.FEMA Hurricane Fund: To account for hurricane related grants and expenditures.SHIP Grant Fund: To account for revenues and expenditures related to the State’s affordable housing initiative program.ARRA Grant Fund: To account for revenues and expenditures related to grants funded by the American Recovery and Reinvestment Act (ARRA).CDBG Grant Fund: To account for revenues and expenditures related to the Community Development Block Grant.NSP Grant Fund: To account for revenues and expenditures related to the Neighborhood Stabilization Program Grant.Traffic Safety Fund: To account for revenues and expenditures related to the red light traffic cameras.Local Option Gas Tax Fund: To account for gas tax revenues restricted for roadway program expenditures.Community Improvements Fund: To account for revenues and expenditures relative to the City’s low-income home improvements program.Green Buildings Fund: To account for revenues and expenditures related to the City’s energy improvements to public buildings.Public Art Fund: To account for fees collected from developers to be used by the City for establishing and enhancing public art throughout the City.Recreation Program Fund: To account for revenues and expenditures relative to recreation programs in the City.Boynton Beach Memorial Park Fund: To account for revenues and expenditures relative to the City’s two cemeteries. Community Services Fund: To account for assets held in trusts that are restricted for designated purposes.
DEBT SERVICE FUNDS
Debt Service Funds are used to account for resources accumulated and payments made for principal and interest on long-term debt of governmental funds.
Boynton Beach CRA Debt Service Fund: To account for the accumulation of resources for the annual payment of principal and interest on long-term obligation debt of the Boynton Beach Community Redevelopment Agency.
CAPITAL IMPROVEMENT FUNDS
Capital projects funds are used to account for the acquisition and construction of major capital facilities other than those financed by proprietary and trust funds.
General Capital Improvements Fund: To account for construction projects such as major improvements to general city buildings and improvements to streets and sidewalks.Fire Rescue Capital Improvements Fund: To fund construction of two new fire stations and replacement of an existing station. Funded through a seven-year special assessment.Parks & Recreational Facilities Fund: To fund the acquisition or development of City park and recreational land. Funded by fees collected from developers.Public Service Tax Construction Fund: To account for the capital expenditures of recreation and public safety facilities associated with the issuance of Public Service Tax Revenue Bonds.Boynton Beach CRA Bond Projects Fund: To account for the capital projects funded through bond proceeds for the Boynton Beach Community Redevelopment Agency.
II-91
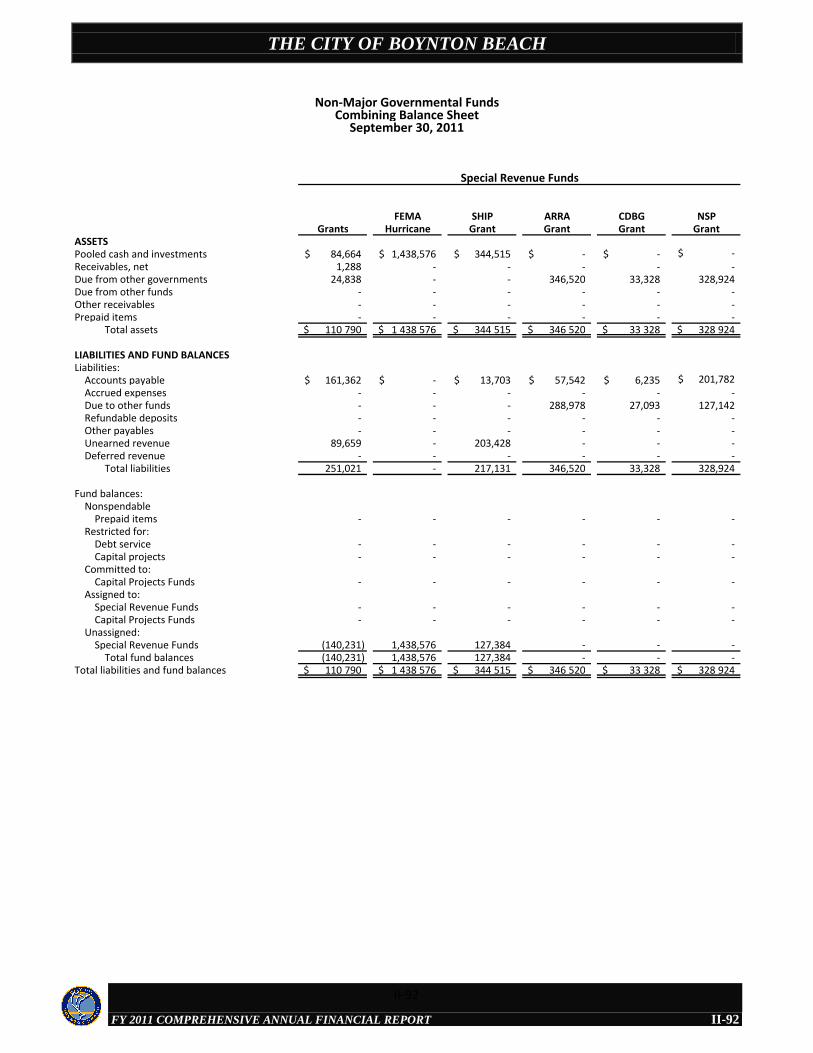
THE CITY OF BOYNTON BEACH
FY 2011 COMPREHENSIVE ANNUAL FINANCIAL REPORT
FEMA SHIP ARRA CDBG NSPGrants Hurricane Grant Grant Grant Grant
ASSETSPooled cash and investments 84,664$ 1,438,576$ 344,515$ -$ -$ -$ Receivables, net 1,288 - - - - - Due from other governments 24,838 - - 346,520 33,328 328,924 Due from other funds - - - - - - Other receivables - - - - - - Prepaid items - - - - - -
Total assets 110 790$ 1 438 576$ 344 515$ 346 520$ 33 328$ 328 924$
LIABILITIES AND FUND BALANCESLiabilities:
Accounts payable 161,362$ -$ 13,703$ 57,542$ 6,235$ 201,782$ Accrued expenses - - - - - - Due to other funds - - - 288,978 27,093 127,142 Refundable deposits - - - - - - Other payables - - - - - - Unearned revenue 89,659 - 203,428 - - - Deferred revenue - - - - - -
Total liabilities 251,021 - 217,131 346,520 33,328 328,924
Fund balances:Nonspendable
Prepaid items - - - - - - Restricted for:
Debt service - - - - - - Capital projects - - - - - -
Committed to:Capital Projects Funds - - - - - -
Assigned to:Special Revenue Funds - - - - - - Capital Projects Funds - - - - - -
Unassigned:Special Revenue Funds (140,231) 1,438,576 127,384 - - -
Total fund balances (140,231) 1,438,576 127,384 - - - Total liabilities and fund balances 110 790$ 1 438 576$ 344 515$ 346 520$ 33 328$ 328 924$
Non-Major Governmental FundsCombining Balance Sheet
September 30, 2011
Special Revenue Funds
II-92
II-92
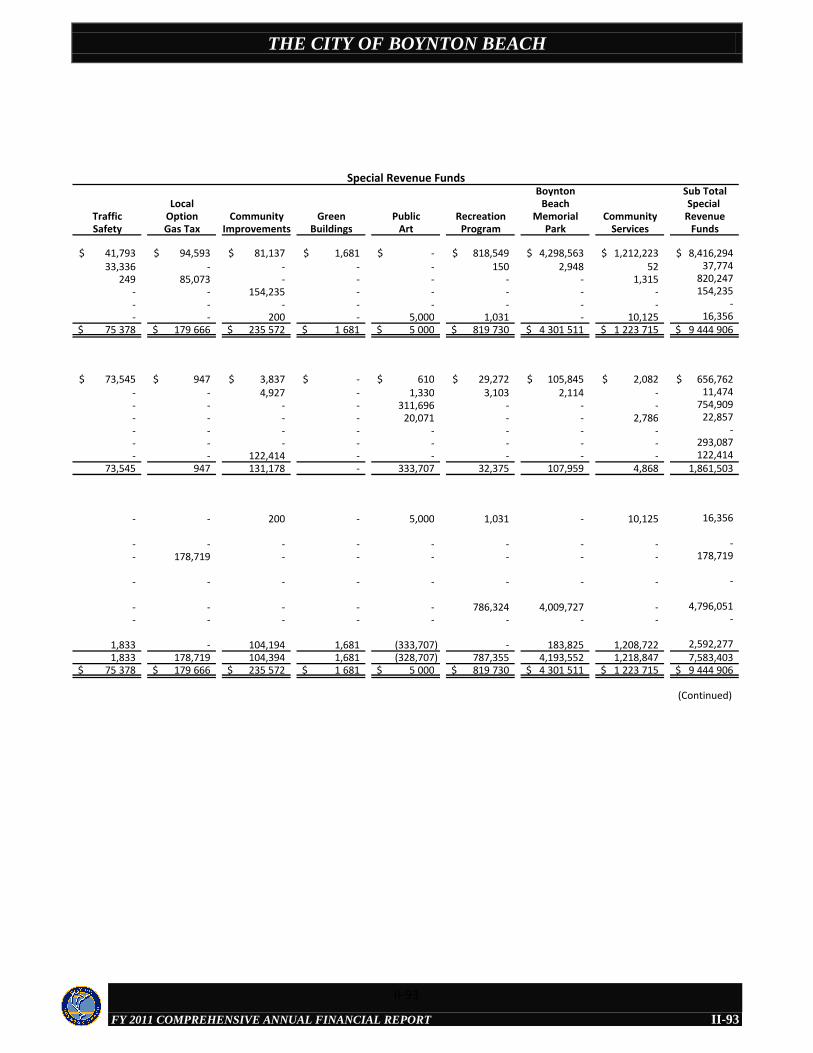
THE CITY OF BOYNTON BEACH
FY 2011 COMPREHENSIVE ANNUAL FINANCIAL REPORT
Boynton Sub TotalLocal Beach Special
Traffic Option Community Green Public Recreation Memorial Community RevenueSafety Gas Tax Improvements Buildings Art Program Park Services Funds
41,793$ 94,593$ 81,137$ 1,681$ -$ 818,549$ 4,298,563$ 1,212,223$ 8,416,294$ 33,336 - - - - 150 2,948 52 37,774
249 85,073 - - - - - 1,315 820,247 - - 154,235 - - - - - 154,235 - - - - - - - - - - - 200 - 5,000 1,031 - 10,125 16,356
75 378$ 179 666$ 235 572$ 1 681$ 5 000$ 819 730$ 4 301 511$ 1 223 715$ 9 444 906$
73,545$ 947$ 3,837$ -$ 610$ 29,272$ 105,845$ 2,082$ 656,762$ - - 4,927 - 1,330 3,103 2,114 - 11,474 - - - - 311,696 - - - 754,909 - - - - 20,071 - - 2,786 22,857 - - - - - - - - - - - - - - - - - 293,087 - - 122,414 - - - - - 122,414
73,545 947 131,178 - 333,707 32,375 107,959 4,868 1,861,503
- - 200 - 5,000 1,031 - 10,125 16,356
- - - - - - - - - - 178,719 - - - - - - 178,719
- - - - - - - - -
- - - - - 786,324 4,009,727 - 4,796,051 - - - - - - - - -
1,833 - 104,194 1,681 (333,707) - 183,825 1,208,722 2,592,277 1,833 178,719 104,394 1,681 (328,707) 787,355 4,193,552 1,218,847 7,583,403
75 378$ 179 666$ 235 572$ 1 681$ 5 000$ 819 730$ 4 301 511$ 1 223 715$ 9 444 906$
(Continued)
Special Revenue Funds
II-93
II-93
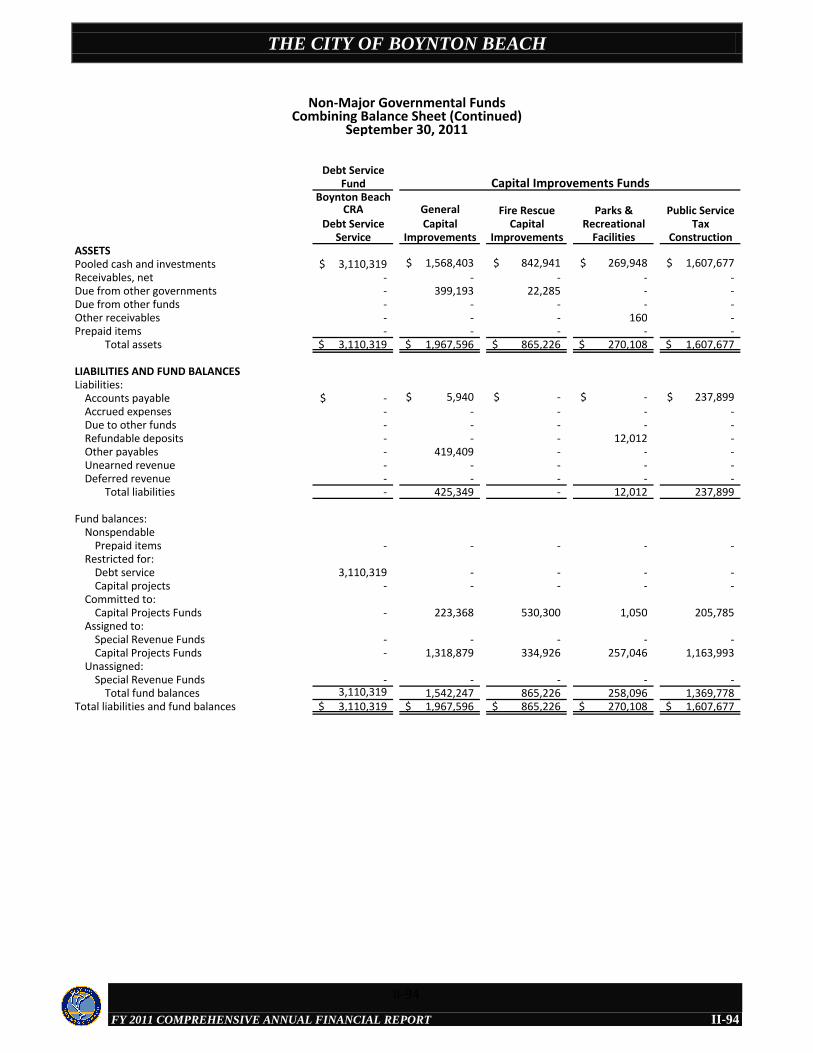
THE CITY OF BOYNTON BEACH
FY 2011 COMPREHENSIVE ANNUAL FINANCIAL REPORT
Debt ServiceFund
Boynton BeachCRA General Fire Rescue Parks & Public Service
Debt Service Capital Capital Recreational TaxService Improvements Improvements Facilities Construction
ASSETSPooled cash and investments 3,110,319$ 1,568,403$ 842,941$ 269,948$ 1,607,677$ Receivables, net - - - - - Due from other governments - 399,193 22,285 - - Due from other funds - - - - - Other receivables - - - 160 - Prepaid items - - - - -
Total assets 3,110,319$ 1,967,596$ 865,226$ 270,108$ 1,607,677$
LIABILITIES AND FUND BALANCESLiabilities:
Accounts payable -$ 5,940$ -$ -$ 237,899$ Accrued expenses - - - - - Due to other funds - - - - - Refundable deposits - - - 12,012 - Other payables - 419,409 - - - Unearned revenue - - - - - Deferred revenue - - - - -
Total liabilities - 425,349 - 12,012 237,899
Fund balances:Nonspendable
Prepaid items - - - - - Restricted for:
Debt service 3,110,319 - - - - Capital projects - - - - -
Committed to:Capital Projects Funds - 223,368 530,300 1,050 205,785
Assigned to:Special Revenue Funds - - - - - Capital Projects Funds - 1,318,879 334,926 257,046 1,163,993
Unassigned:Special Revenue Funds - - - - -
Total fund balances 3,110,319 1,542,247 865,226 258,096 1,369,778 Total liabilities and fund balances 3,110,319$ 1,967,596$ 865,226$ 270,108$ 1,607,677$
Capital Improvements Funds
Non-Major Governmental FundsCombining Balance Sheet (Continued)
September 30, 2011
II-94
II-94
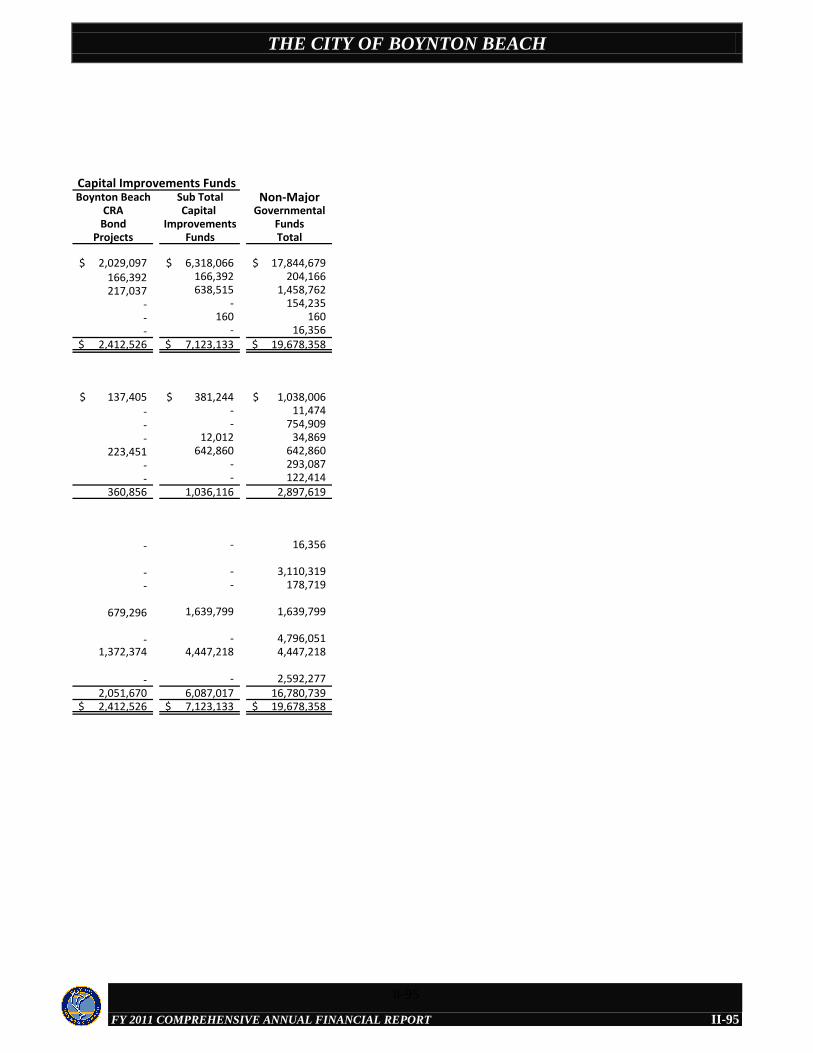
THE CITY OF BOYNTON BEACH
FY 2011 COMPREHENSIVE ANNUAL FINANCIAL REPORT
Boynton Beach Sub Total Non-MajorCRA Capital Governmental
Bond Improvements FundsProjects Funds Total
2,029,097$ 6,318,066$ 17,844,679$ 166,392 166,392 204,166 217,037 638,515 1,458,762
- - 154,235 - 160 160 - - 16,356
2,412,526$ 7,123,133$ 19,678,358$
137,405$ 381,244$ 1,038,006$ - - 11,474 - - 754,909 - 12,012 34,869
223,451 642,860 642,860 - - 293,087 - - 122,414
360,856 1,036,116 2,897,619
- - 16,356
- - 3,110,319 - - 178,719
679,296 1,639,799 1,639,799
- - 4,796,051 1,372,374 4,447,218 4,447,218
- - 2,592,277 2,051,670 6,087,017 16,780,739 2,412,526$ 7,123,133$ 19,678,358$
Capital Improvements Funds
II-95
II-95
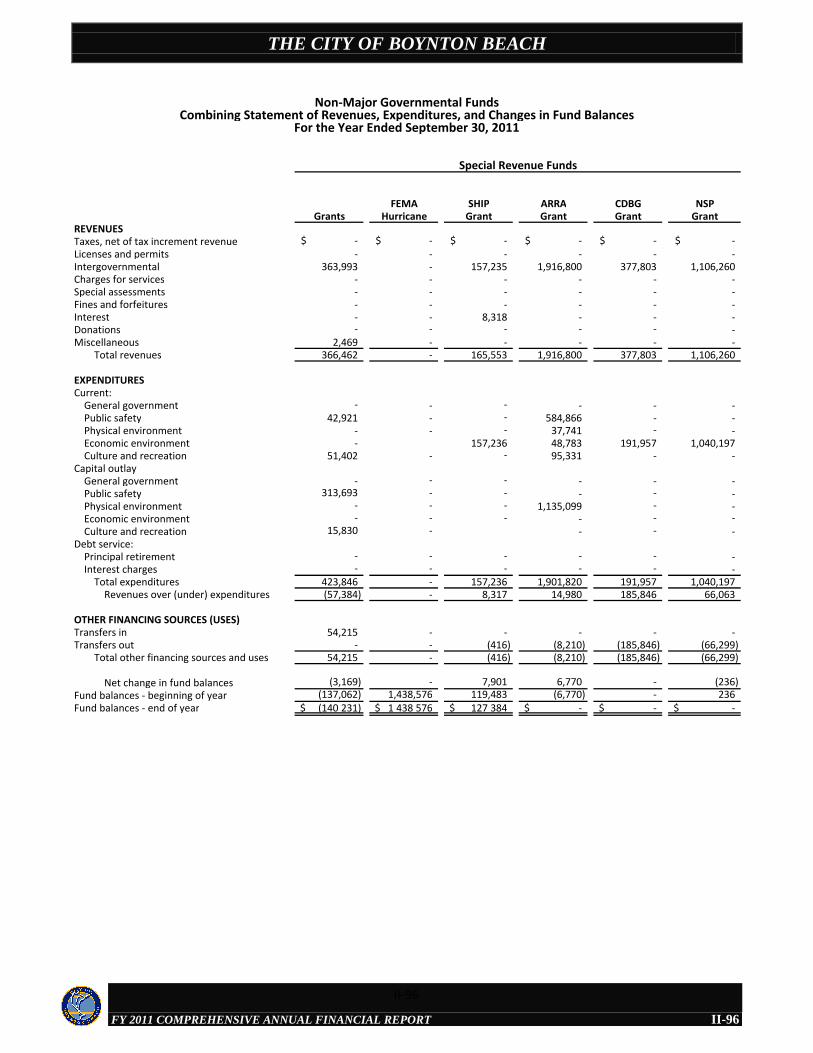
THE CITY OF BOYNTON BEACH
FY 2011 COMPREHENSIVE ANNUAL FINANCIAL REPORT
FEMA SHIP ARRA CDBG NSPGrants Hurricane Grant Grant Grant Grant
REVENUESTaxes, net of tax increment revenue -$ -$ -$ -$ -$ -$ Licenses and permits - - - - - - Intergovernmental 363,993 - 157,235 1,916,800 377,803 1,106,260 Charges for services - - - - - - Special assessments - - - - - - Fines and forfeitures - - - - - - Interest - - 8,318 - - - Donations - - - - - - Miscellaneous 2,469 - - - - -
Total revenues 366,462 - 165,553 1,916,800 377,803 1,106,260
EXPENDITURESCurrent:
General government - - - - - - Public safety 42,921 - - 584,866 - - Physical environment - - - 37,741 - - Economic environment - 157,236 48,783 191,957 1,040,197 Culture and recreation 51,402 - - 95,331 - -
Capital outlayGeneral government - - - - - - Public safety 313,693 - - - - - Physical environment - - - 1,135,099 - - Economic environment - - - - - - Culture and recreation 15,830 - - - -
Debt service:Principal retirement - - - - - - Interest charges - - - - - -
Total expenditures 423,846 - 157,236 1,901,820 191,957 1,040,197 Revenues over (under) expenditures (57,384) - 8,317 14,980 185,846 66,063
OTHER FINANCING SOURCES (USES)Transfers in 54,215 - - - - - Transfers out - - (416) (8,210) (185,846) (66,299)
Total other financing sources and uses 54,215 - (416) (8,210) (185,846) (66,299)
Net change in fund balances (3,169) - 7,901 6,770 - (236) Fund balances - beginning of year (137,062) 1,438,576 119,483 (6,770) - 236 Fund balances - end of year (140 231)$ 1 438 576$ 127 384$ -$ -$ -$
Special Revenue Funds
Non-Major Governmental FundsCombining Statement of Revenues, Expenditures, and Changes in Fund Balances
For the Year Ended September 30, 2011
II-96
II-96
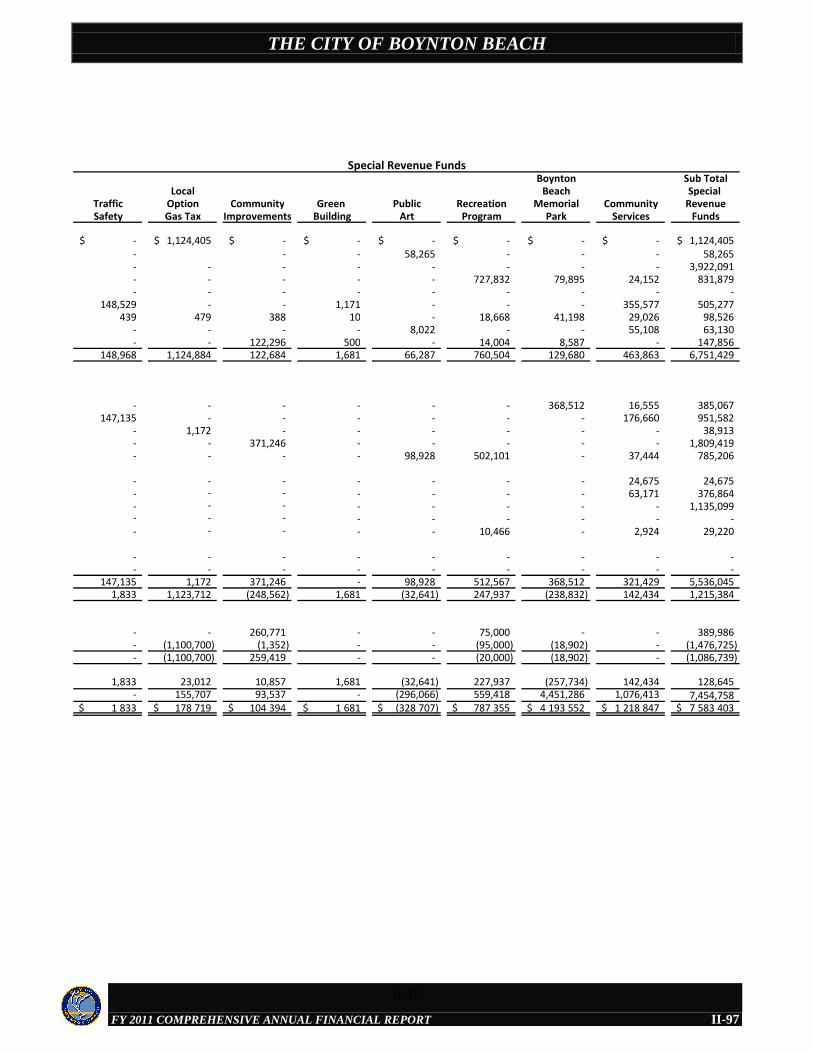
THE CITY OF BOYNTON BEACH
FY 2011 COMPREHENSIVE ANNUAL FINANCIAL REPORT
Boynton Sub TotalLocal Beach Special
Traffic Option Community Green Public Recreation Memorial Community RevenueSafety Gas Tax Improvements Building Art Program Park Services Funds
-$ 1,124,405$ -$ -$ -$ -$ -$ -$ 1,124,405$ - - - 58,265 - - - 58,265 - - - - - - - - 3,922,091 - - - - - 727,832 79,895 24,152 831,879 - - - - - - - - -
148,529 - - 1,171 - - - 355,577 505,277 439 479 388 10 - 18,668 41,198 29,026 98,526
- - - - 8,022 - - 55,108 63,130 - - 122,296 500 - 14,004 8,587 - 147,856
148,968 1,124,884 122,684 1,681 66,287 760,504 129,680 463,863 6,751,429
- - - - - - 368,512 16,555 385,067 147,135 - - - - - - 176,660 951,582
- 1,172 - - - - - - 38,913 - - 371,246 - - - - - 1,809,419 - - - - 98,928 502,101 - 37,444 785,206
- - - - - - - 24,675 24,675 - - - - - - - 63,171 376,864 - - - - - - - - 1,135,099 - - - - - - - - - - - - - - 10,466 - 2,924 29,220
- - - - - - - - - - - - - - - - - -
147,135 1,172 371,246 - 98,928 512,567 368,512 321,429 5,536,045 1,833 1,123,712 (248,562) 1,681 (32,641) 247,937 (238,832) 142,434 1,215,384
- - 260,771 - - 75,000 - - 389,986 - (1,100,700) (1,352) - - (95,000) (18,902) - (1,476,725) - (1,100,700) 259,419 - - (20,000) (18,902) - (1,086,739)
1,833 23,012 10,857 1,681 (32,641) 227,937 (257,734) 142,434 128,645 - 155,707 93,537 - (296,066) 559,418 4,451,286 1,076,413 7,454,758
1 833$ 178 719$ 104 394$ 1 681$ (328 707)$ 787 355$ 4 193 552$ 1 218 847$ 7 583 403$
Special Revenue Funds
II-97
II-97
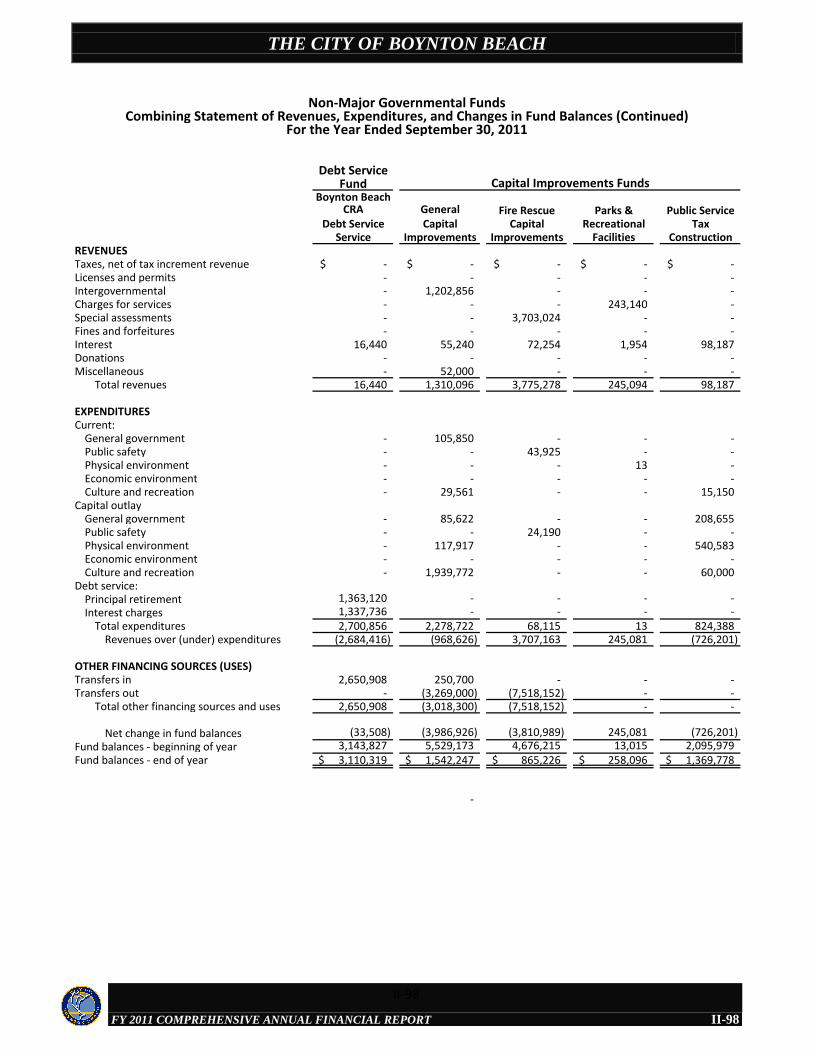
THE CITY OF BOYNTON BEACH
FY 2011 COMPREHENSIVE ANNUAL FINANCIAL REPORT
Debt ServiceFund
Boynton BeachCRA General Fire Rescue Parks & Public Service
Debt Service Capital Capital Recreational TaxService Improvements Improvements Facilities Construction
REVENUESTaxes, net of tax increment revenue -$ -$ -$ -$ -$ Licenses and permits - - - - - Intergovernmental - 1,202,856 - - - Charges for services - - - 243,140 - Special assessments - - 3,703,024 - - Fines and forfeitures - - - - - Interest 16,440 55,240 72,254 1,954 98,187 Donations - - - - - Miscellaneous - 52,000 - - -
Total revenues 16,440 1,310,096 3,775,278 245,094 98,187
EXPENDITURESCurrent:
General government - 105,850 - - - Public safety - - 43,925 - - Physical environment - - - 13 - Economic environment - - - - - Culture and recreation - 29,561 - - 15,150
Capital outlayGeneral government - 85,622 - - 208,655 Public safety - - 24,190 - - Physical environment - 117,917 - - 540,583 Economic environment - - - - - Culture and recreation - 1,939,772 - - 60,000
Debt service:Principal retirement 1,363,120 - - - - Interest charges 1,337,736 - - - -
Total expenditures 2,700,856 2,278,722 68,115 13 824,388 Revenues over (under) expenditures (2,684,416) (968,626) 3,707,163 245,081 (726,201)
OTHER FINANCING SOURCES (USES)Transfers in 2,650,908 250,700 - - - Transfers out - (3,269,000) (7,518,152) - -
Total other financing sources and uses 2,650,908 (3,018,300) (7,518,152) - -
Net change in fund balances (33,508) (3,986,926) (3,810,989) 245,081 (726,201) Fund balances - beginning of year 3,143,827 5,529,173 4,676,215 13,015 2,095,979 Fund balances - end of year 3,110,319$ 1,542,247$ 865,226$ 258,096$ 1,369,778$
-
Non-Major Governmental FundsCombining Statement of Revenues, Expenditures, and Changes in Fund Balances (Continued)
For the Year Ended September 30, 2011
Capital Improvements Funds
II-98
II-98
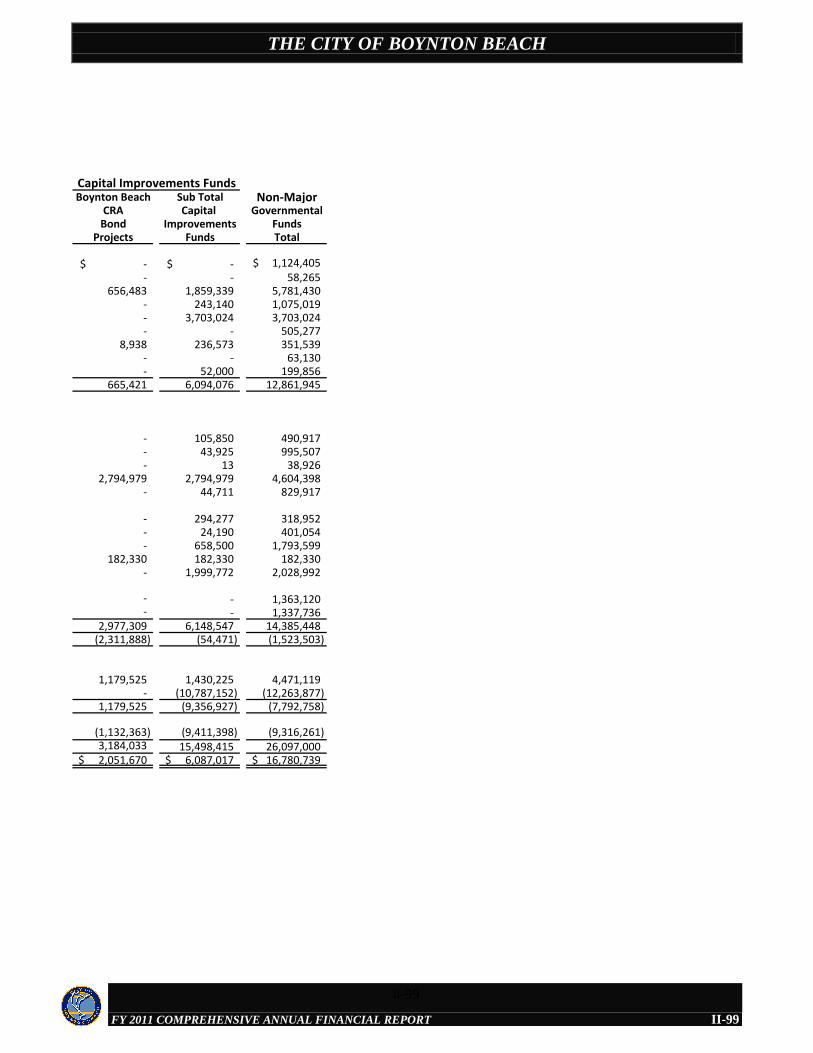
THE CITY OF BOYNTON BEACH
FY 2011 COMPREHENSIVE ANNUAL FINANCIAL REPORT
Boynton Beach Sub Total Non-MajorCRA Capital Governmental
Bond Improvements FundsProjects Funds Total
-$ -$ 1,124,405$ - - 58,265
656,483 1,859,339 5,781,430 - 243,140 1,075,019 - 3,703,024 3,703,024 - - 505,277
8,938 236,573 351,539 - - 63,130 - 52,000 199,856
665,421 6,094,076 12,861,945
- 105,850 490,917 - 43,925 995,507 - 13 38,926
2,794,979 2,794,979 4,604,398 - 44,711 829,917
- 294,277 318,952 - 24,190 401,054 - 658,500 1,793,599
182,330 182,330 182,330 - 1,999,772 2,028,992
- - 1,363,120 - - 1,337,736
2,977,309 6,148,547 14,385,448 (2,311,888) (54,471) (1,523,503)
1,179,525 1,430,225 4,471,119 - (10,787,152) (12,263,877)
1,179,525 (9,356,927) (7,792,758)
(1,132,363) (9,411,398) (9,316,261) 3,184,033 15,498,415 26,097,000 2,051,670$ 6,087,017$ 16,780,739$
Capital Improvements Funds
II-99
II-99

THE CITY OF BOYNTON BEACH
FY 2011 COMPREHENSIVE ANNUAL FINANCIAL REPORT
2011 2010ASSETSPooled cash and investments 84,664$ -$ Receivables, net 1,288 - Due from other governments 24,838 23,678
Total assets 110,790$ 23,678$
LIABILITIES AND FUND BALANCELiabilities:
Accounts payable 161,362$ 1,586$ Due to other funds - 48,508Unearned revenue 89,659 110,646
Total liabilities 251,021 160,740
Fund balance:Unassigned:
Special Revenue Funds (140,231) (137,062)Total fund balance (140,231) (137,062)
Total liabilities and fund balance 110,790$ 23,678$
Grants FundBalance Sheet
September 30, 2011(With Comparative Figures for 2010)
II-100
II-100

THE CITY OF BOYNTON BEACH
FY 2011 COMPREHENSIVE ANNUAL FINANCIAL REPORT
2011 2010REVENUESIntergovernmental 363,993$ 156,058$ Miscellaneous 2,469 -
Total revenues 366,462 156,058
EXPENDITURESCurrent:
Public safety 42,921 40,986 Culture and recreation 51,402 38,298
Capital outlayPublic safety 313,693 64,621 Culture and recreation 15,830 12,153 Total expenditures 423,846 156,058
Revenues over (under) expenditures (57,384) -
OTHER FINANCING SOURCESTransfers in 54,215 -
Total other financing sources 54,215 -
Net change in fund balance (3,169) - Fund balance - beginning of year (137,062) (137,062) Fund balance - end of year (140,231)$ (137,062)$
Grants FundStatement of Revenues, Expenditures, and Changes in Fund Balance
For the Year Ended September 30, 2011(With Comparative Figures for 2010)
II-101
II-101
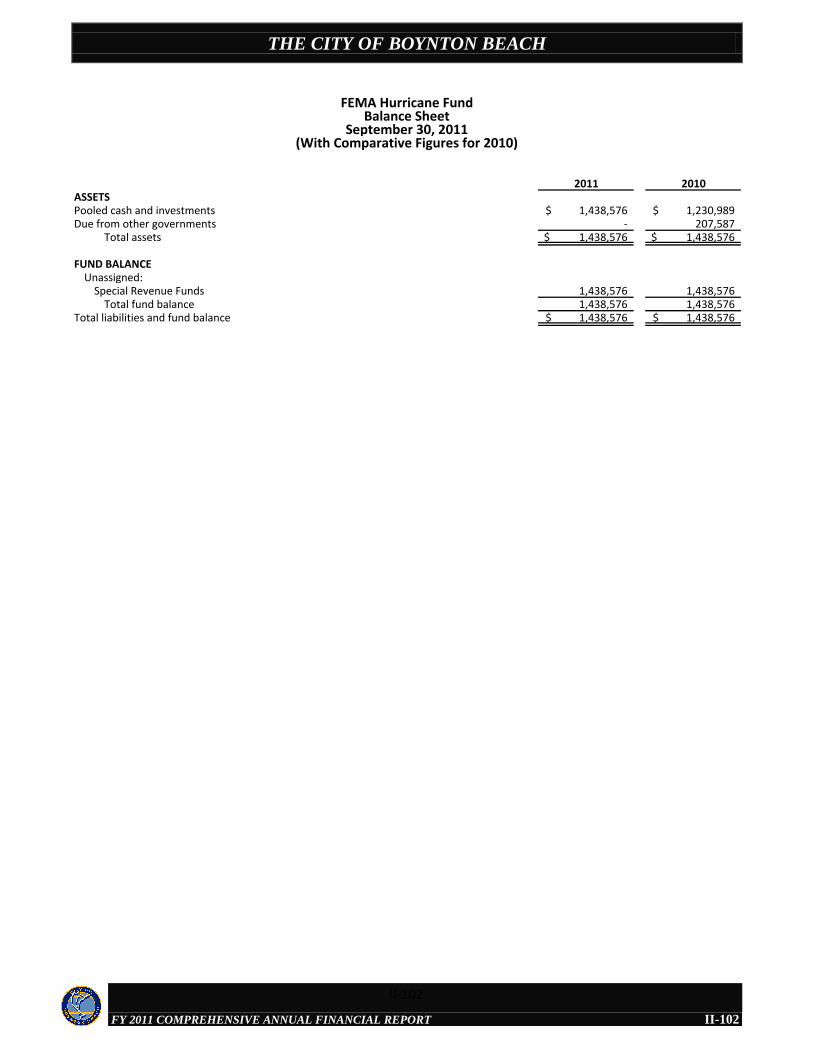
THE CITY OF BOYNTON BEACH
FY 2011 COMPREHENSIVE ANNUAL FINANCIAL REPORT
2011 2010ASSETSPooled cash and investments 1,438,576$ 1,230,989$ Due from other governments - 207,587
Total assets 1,438,576$ 1,438,576$
FUND BALANCEUnassigned:
Special Revenue Funds 1,438,576 1,438,576 Total fund balance 1,438,576 1,438,576
Total liabilities and fund balance 1,438,576$ 1,438,576$
FEMA Hurricane FundBalance Sheet
September 30, 2011(With Comparative Figures for 2010)
II-102
II-102
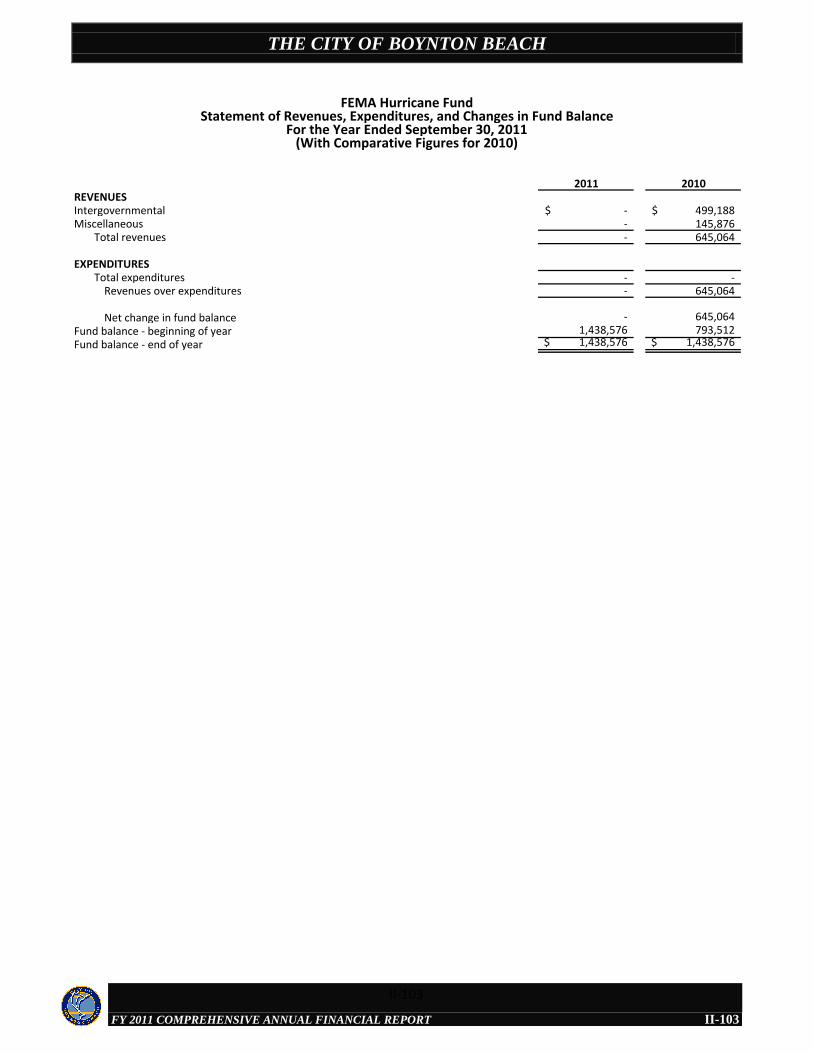
THE CITY OF BOYNTON BEACH
FY 2011 COMPREHENSIVE ANNUAL FINANCIAL REPORT
2011 2010REVENUESIntergovernmental -$ 499,188$ Miscellaneous - 145,876
Total revenues - 645,064
EXPENDITURESTotal expenditures - -
Revenues over expenditures - 645,064
Net change in fund balance - 645,064 Fund balance - beginning of year 1,438,576 793,512Fund balance - end of year 1,438,576$ 1,438,576$
FEMA Hurricane FundStatement of Revenues, Expenditures, and Changes in Fund Balance
For the Year Ended September 30, 2011(With Comparative Figures for 2010)
II-103
II-103
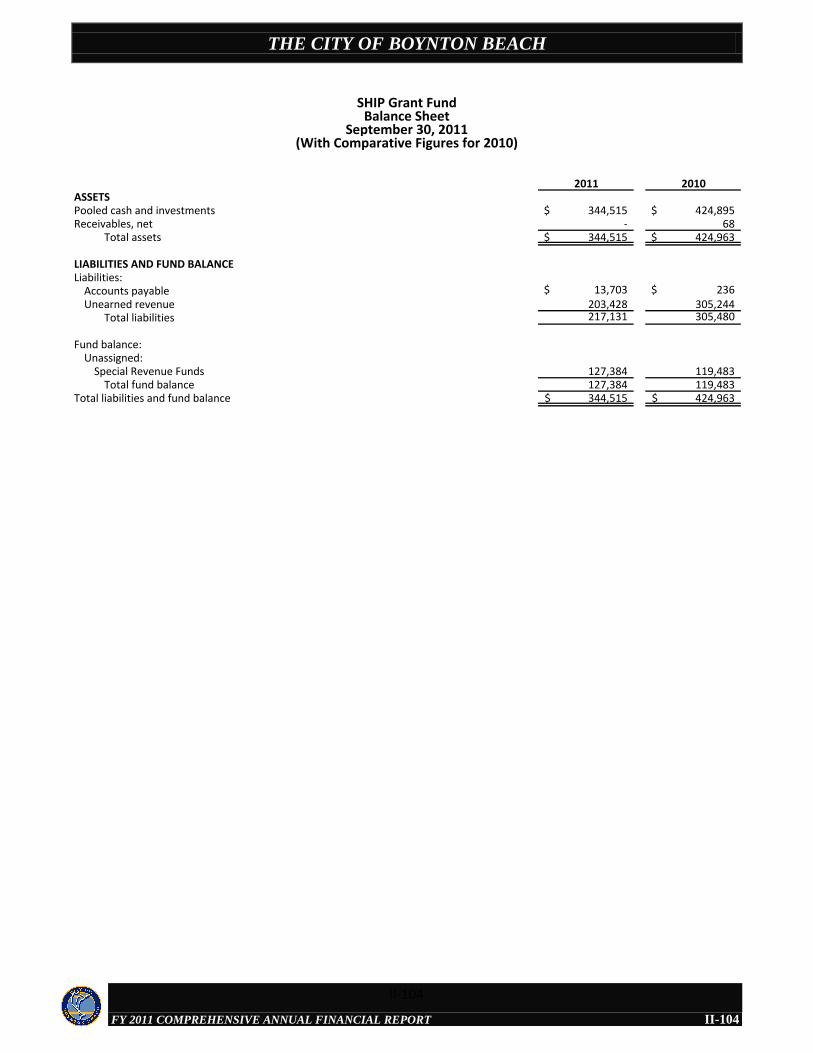
THE CITY OF BOYNTON BEACH
FY 2011 COMPREHENSIVE ANNUAL FINANCIAL REPORT
2011 2010ASSETSPooled cash and investments 344,515$ 424,895$ Receivables, net - 68
Total assets 344,515$ 424,963$
LIABILITIES AND FUND BALANCELiabilities:
Accounts payable 13,703$ 236$ Unearned revenue 203,428 305,244
Total liabilities 217,131 305,480
Fund balance:Unassigned:
Special Revenue Funds 127,384 119,483Total fund balance 127,384 119,483
Total liabilities and fund balance 344,515$ 424,963$
SHIP Grant FundBalance Sheet
September 30, 2011(With Comparative Figures for 2010)
II-104
II-104
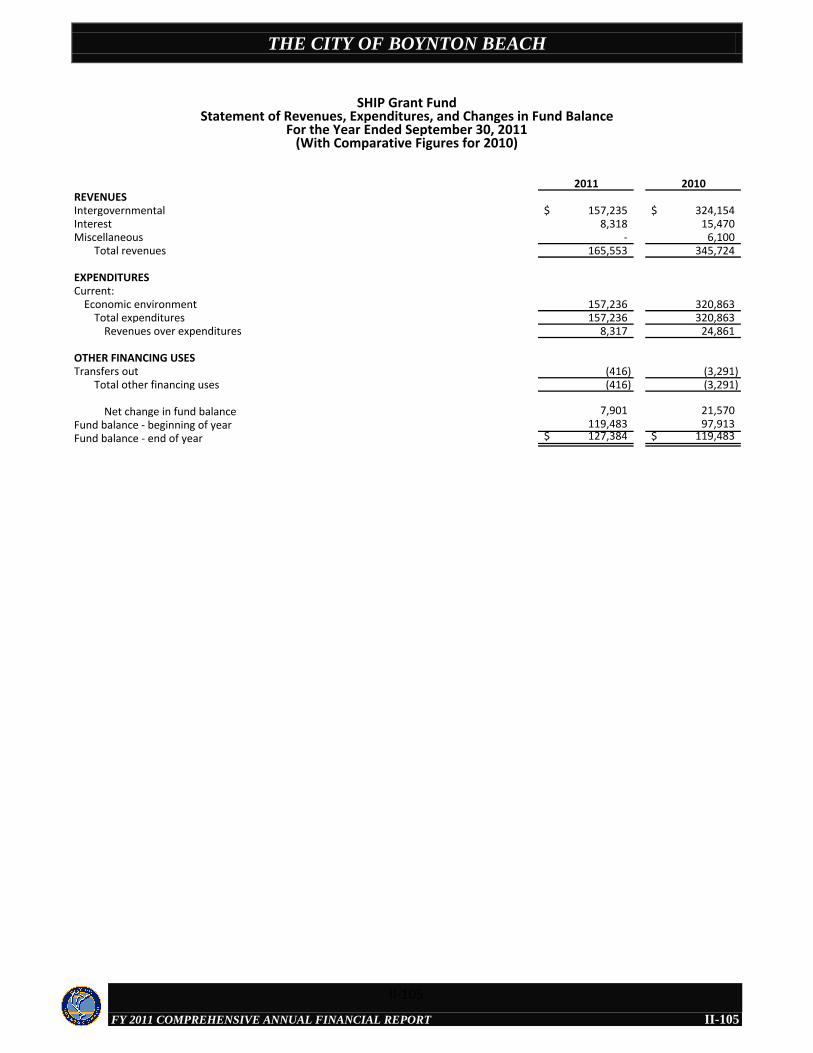
THE CITY OF BOYNTON BEACH
FY 2011 COMPREHENSIVE ANNUAL FINANCIAL REPORT
2011 2010REVENUESIntergovernmental 157,235$ 324,154$ Interest 8,318 15,470Miscellaneous - 6,100
Total revenues 165,553 345,724
EXPENDITURESCurrent:
Economic environment 157,236 320,863Total expenditures 157,236 320,863
Revenues over expenditures 8,317 24,861
OTHER FINANCING USESTransfers out (416) (3,291)
Total other financing uses (416) (3,291)
Net change in fund balance 7,901 21,570 Fund balance - beginning of year 119,483 97,913Fund balance - end of year 127,384$ 119,483$
SHIP Grant FundStatement of Revenues, Expenditures, and Changes in Fund Balance
For the Year Ended September 30, 2011(With Comparative Figures for 2010)
II-105
II-105
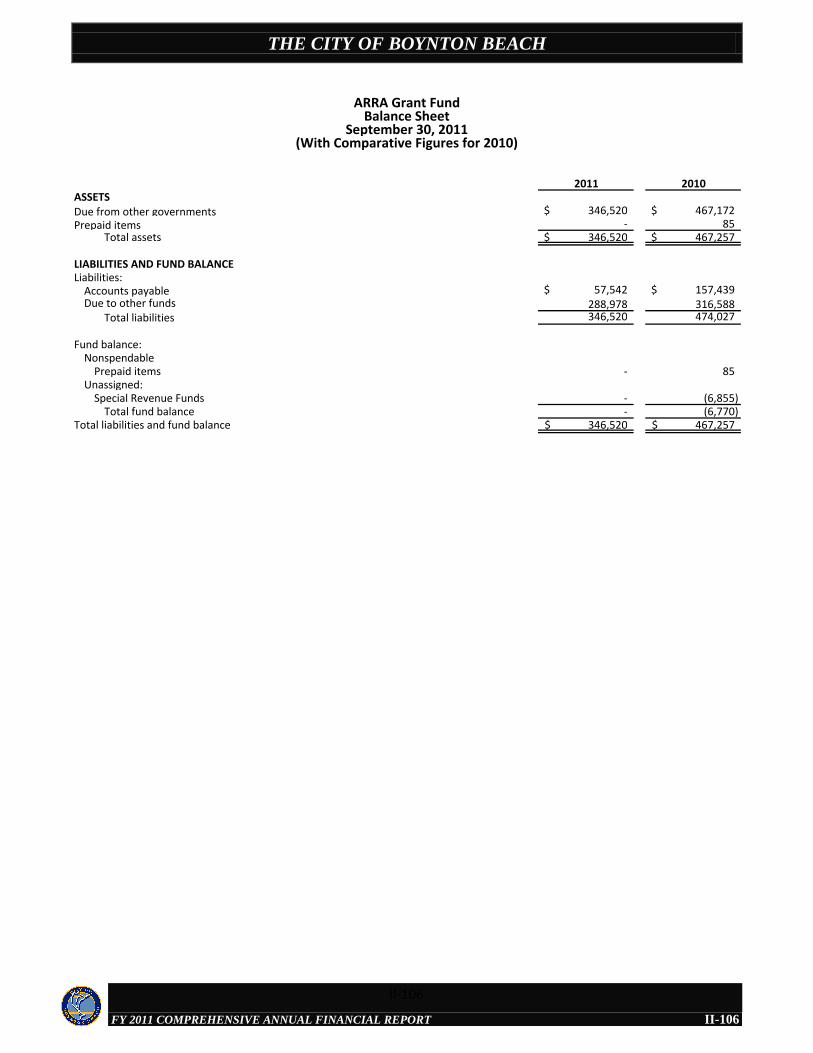
THE CITY OF BOYNTON BEACH
FY 2011 COMPREHENSIVE ANNUAL FINANCIAL REPORT
2011 2010ASSETSDue from other governments 346,520$ 467,172$ Prepaid items - 85
Total assets 346,520$ 467,257$
LIABILITIES AND FUND BALANCELiabilities:
Accounts payable 57,542$ 157,439$ Due to other funds 288,978 316,588
Total liabilities 346,520 474,027
Fund balance:Nonspendable
Prepaid items - 85 Unassigned:
Special Revenue Funds - (6,855)Total fund balance - (6,770)
Total liabilities and fund balance 346,520$ 467,257$
ARRA Grant FundBalance Sheet
September 30, 2011(With Comparative Figures for 2010)
II-106
II-106
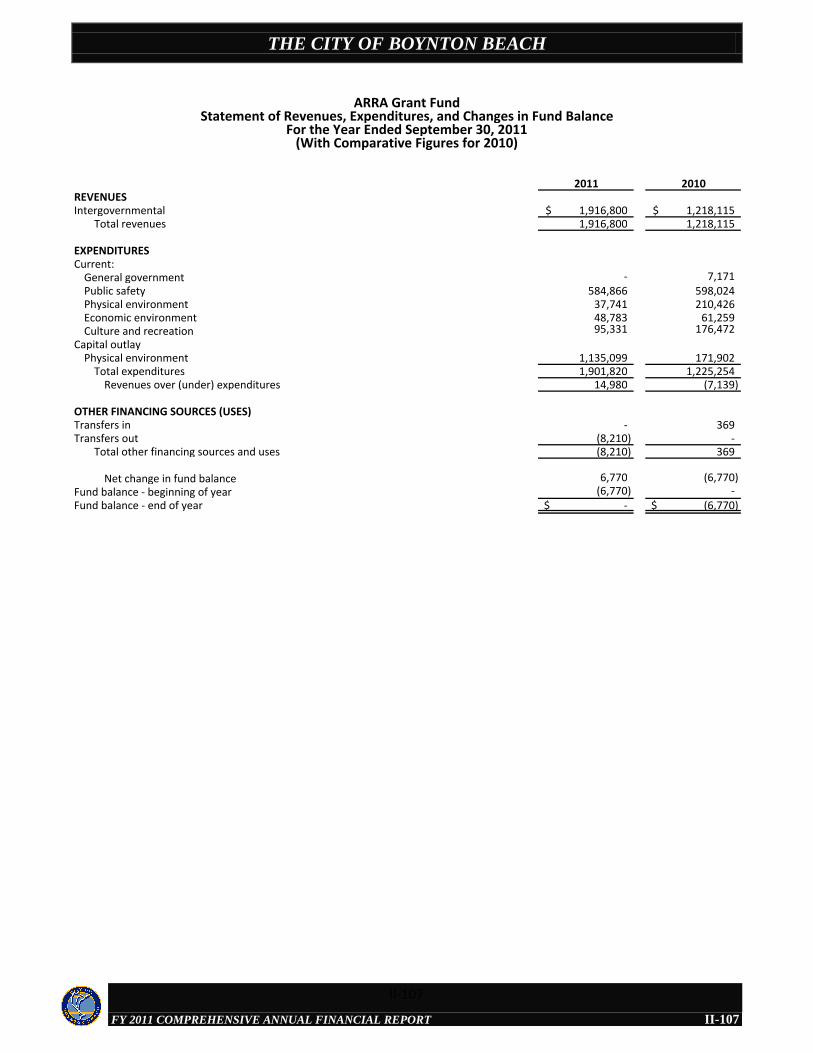
THE CITY OF BOYNTON BEACH
FY 2011 COMPREHENSIVE ANNUAL FINANCIAL REPORT
2011 2010REVENUESIntergovernmental 1,916,800$ 1,218,115$
Total revenues 1,916,800 1,218,115
EXPENDITURESCurrent:
General government - 7,171Public safety 584,866 598,024Physical environment 37,741 210,426Economic environment 48,783 61,259Culture and recreation 95,331 176,472
Capital outlayPhysical environment 1,135,099 171,902
Total expenditures 1,901,820 1,225,254 Revenues over (under) expenditures 14,980 (7,139)
OTHER FINANCING SOURCES (USES)Transfers in - 369Transfers out (8,210) -
Total other financing sources and uses (8,210) 369
Net change in fund balance 6,770 (6,770) Fund balance - beginning of year (6,770) - Fund balance - end of year -$ (6,770)$
ARRA Grant FundStatement of Revenues, Expenditures, and Changes in Fund Balance
For the Year Ended September 30, 2011(With Comparative Figures for 2010)
II-107
II-107
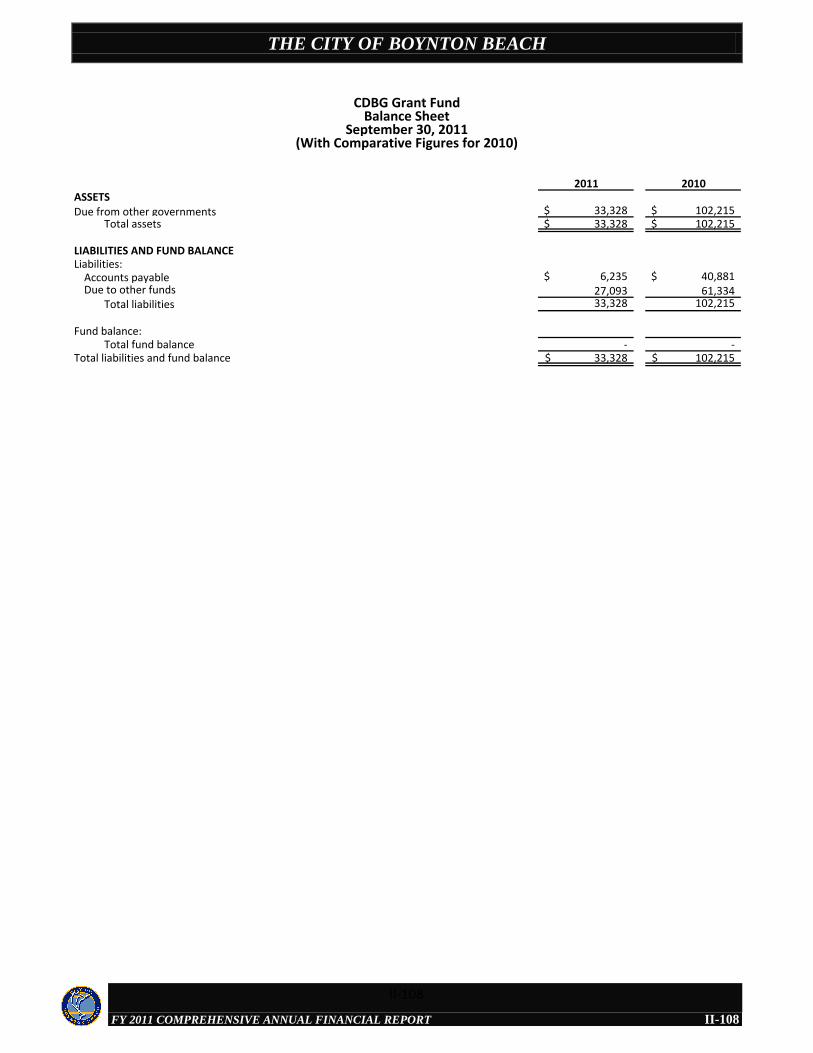
THE CITY OF BOYNTON BEACH
FY 2011 COMPREHENSIVE ANNUAL FINANCIAL REPORT
2011 2010ASSETSDue from other governments 33,328$ 102,215$
Total assets 33,328$ 102,215$
LIABILITIES AND FUND BALANCELiabilities:
Accounts payable 6,235$ 40,881$ Due to other funds 27,093 61,334
Total liabilities 33,328 102,215
Fund balance:Total fund balance - -
Total liabilities and fund balance 33,328$ 102,215$
CDBG Grant FundBalance Sheet
September 30, 2011(With Comparative Figures for 2010)
II-108
II-108

THE CITY OF BOYNTON BEACH
FY 2011 COMPREHENSIVE ANNUAL FINANCIAL REPORT
2011 2010REVENUESIntergovernmental 377,803$ 639,758$
Total revenues 377,803 639,758
EXPENDITURESCurrent:
Economic environment 191,957 369,396Total expenditures 191,957 369,396
Revenues over (under) expenditures 185,846 270,362
OTHER FINANCING USESTransfers out (185,846) (243,135)
Total other financing uses (185,846) (243,135)
Net change in fund balance - 27,227 Fund balance - beginning of year - (27,227)Fund balance - end of year -$ -$
CDBG Grant FundStatement of Revenues, Expenditures, and Changes in Fund Balance
For the Year Ended September 30, 2011(With Comparative Figures for 2010)
II-109
II-109
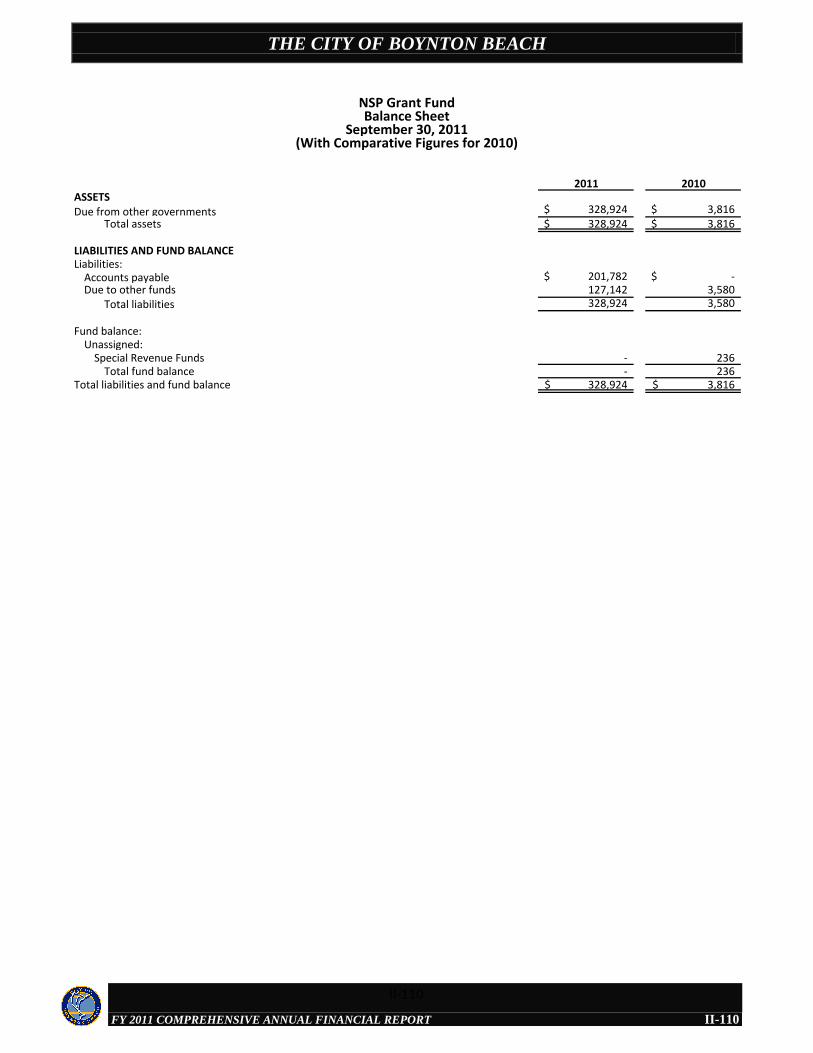
THE CITY OF BOYNTON BEACH
FY 2011 COMPREHENSIVE ANNUAL FINANCIAL REPORT
2011 2010ASSETSDue from other governments 328,924$ 3,816$
Total assets 328,924$ 3,816$
LIABILITIES AND FUND BALANCELiabilities:
Accounts payable 201,782$ -$ Due to other funds 127,142 3,580
Total liabilities 328,924 3,580
Fund balance:Unassigned:
Special Revenue Funds - 236Total fund balance - 236
Total liabilities and fund balance 328,924$ 3,816$
NSP Grant FundBalance Sheet
September 30, 2011(With Comparative Figures for 2010)
II-110
II-110
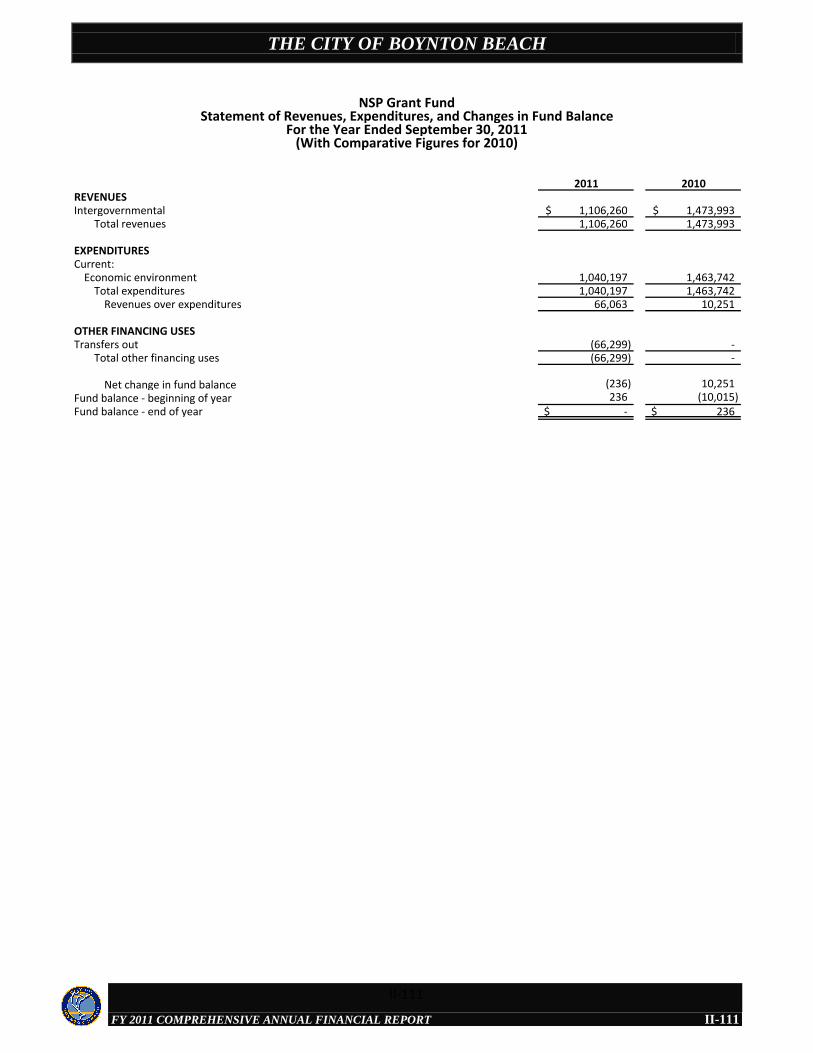
THE CITY OF BOYNTON BEACH
FY 2011 COMPREHENSIVE ANNUAL FINANCIAL REPORT
2011 2010REVENUESIntergovernmental 1,106,260$ 1,473,993$
Total revenues 1,106,260 1,473,993
EXPENDITURESCurrent:
Economic environment 1,040,197 1,463,742Total expenditures 1,040,197 1,463,742
Revenues over expenditures 66,063 10,251
OTHER FINANCING USESTransfers out (66,299) -
Total other financing uses (66,299) -
Net change in fund balance (236) 10,251 Fund balance - beginning of year 236 (10,015)Fund balance - end of year -$ 236$
NSP Grant FundStatement of Revenues, Expenditures, and Changes in Fund Balance
For the Year Ended September 30, 2011(With Comparative Figures for 2010)
II-111
II-111
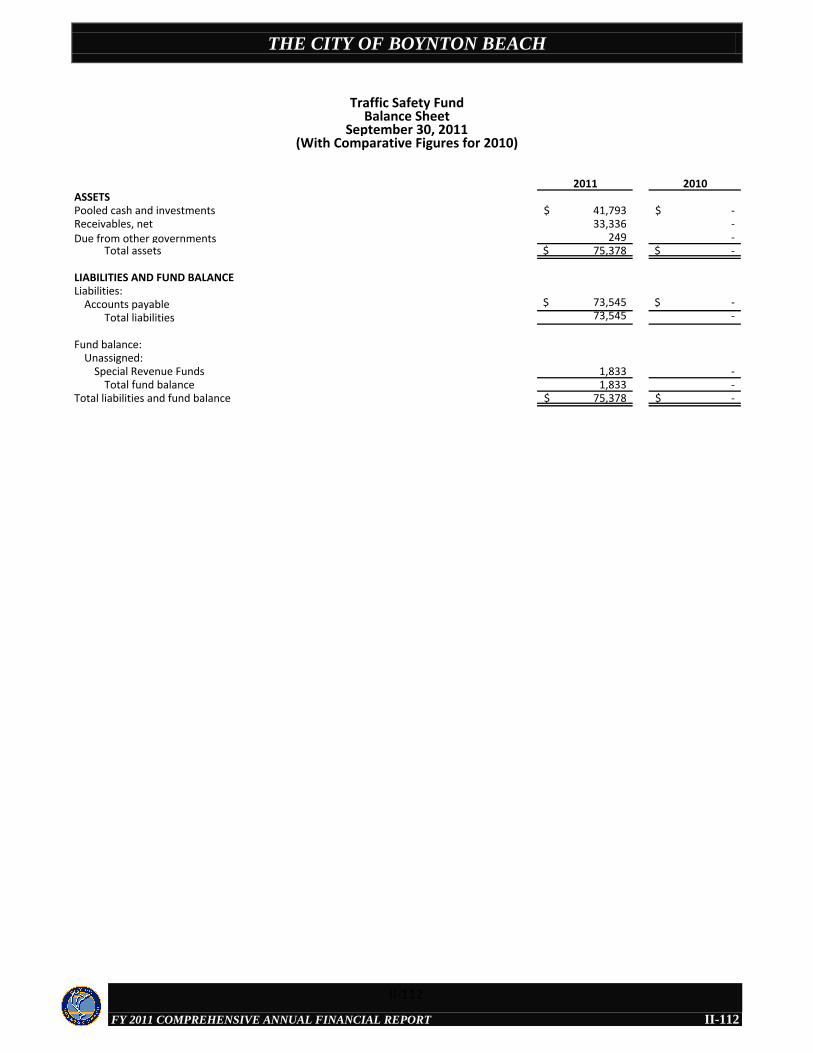
THE CITY OF BOYNTON BEACH
FY 2011 COMPREHENSIVE ANNUAL FINANCIAL REPORT
2011 2010ASSETSPooled cash and investments 41,793$ -$ Receivables, net 33,336 - Due from other governments 249 -
Total assets 75,378$ -$
LIABILITIES AND FUND BALANCELiabilities:
Accounts payable 73,545$ -$
Total liabilities 73,545 -
Fund balance:Unassigned:
Special Revenue Funds 1,833 - Total fund balance 1,833 -
Total liabilities and fund balance 75,378$ -$
Traffic Safety FundBalance Sheet
September 30, 2011(With Comparative Figures for 2010)
II-112
II-112
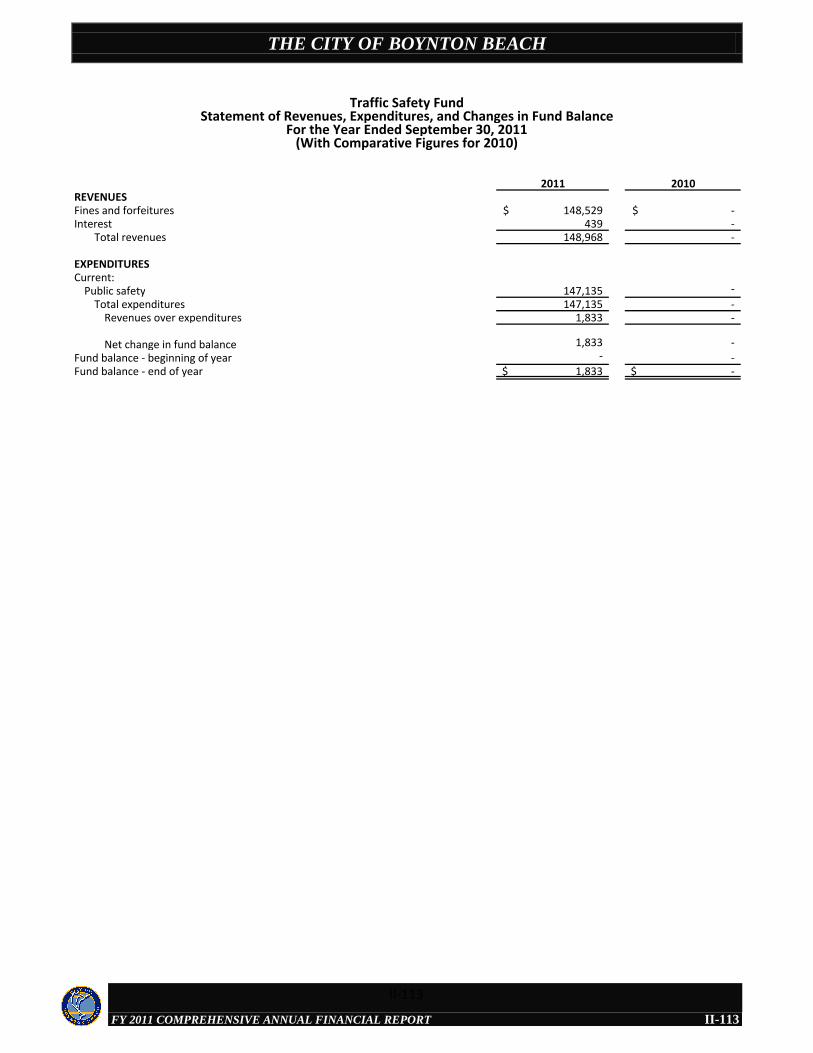
THE CITY OF BOYNTON BEACH
FY 2011 COMPREHENSIVE ANNUAL FINANCIAL REPORT
2011 2010REVENUESFines and forfeitures 148,529$ -$ Interest 439 -
Total revenues 148,968 -
EXPENDITURESCurrent:
Public safety 147,135 -
Total expenditures 147,135 - Revenues over expenditures 1,833 -
Net change in fund balance 1,833 -
Fund balance - beginning of year - - Fund balance - end of year 1,833$ -$
Traffic Safety FundStatement of Revenues, Expenditures, and Changes in Fund Balance
For the Year Ended September 30, 2011(With Comparative Figures for 2010)
II-113
II-113

THE CITY OF BOYNTON BEACH
FY 2011 COMPREHENSIVE ANNUAL FINANCIAL REPORT
2011 2010ASSETSPooled cash and investments 94,593$ 64,787$ Due from other governments 85,073 90,910Other receivables - 10
Total assets 179,666$ 155,707$
LIABILITIES AND FUND BALANCELiabilities:
Accounts payable 947$ -$ Total liabilities 947 -
Fund balance:Restricted for capital projects 178,719 155,707
Total fund balance 178,719 155,707 Total liabilities and fund balance 179,666$ 155,707$
Local Option Gas Tax FundBalance Sheet
September 30, 2011(With Comparative Figures for 2010)
II-114
II-114
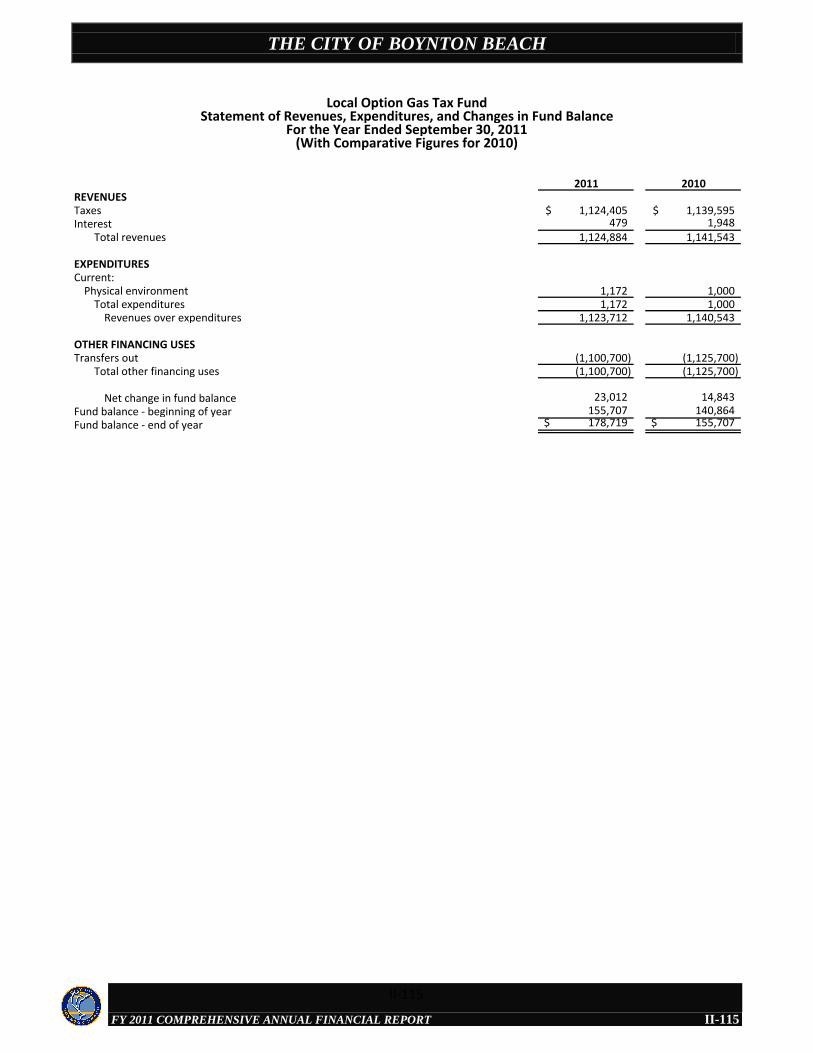
THE CITY OF BOYNTON BEACH
FY 2011 COMPREHENSIVE ANNUAL FINANCIAL REPORT
2011 2010REVENUESTaxes 1,124,405$ 1,139,595$ Interest 479 1,948
Total revenues 1,124,884 1,141,543
EXPENDITURESCurrent:
Physical environment 1,172 1,000Total expenditures 1,172 1,000
Revenues over expenditures 1,123,712 1,140,543
OTHER FINANCING USESTransfers out (1,100,700) (1,125,700)
Total other financing uses (1,100,700) (1,125,700)
Net change in fund balance 23,012 14,843 Fund balance - beginning of year 155,707 140,864Fund balance - end of year 178,719$ 155,707$
Local Option Gas Tax FundStatement of Revenues, Expenditures, and Changes in Fund Balance
For the Year Ended September 30, 2011(With Comparative Figures for 2010)
II-115
II-115
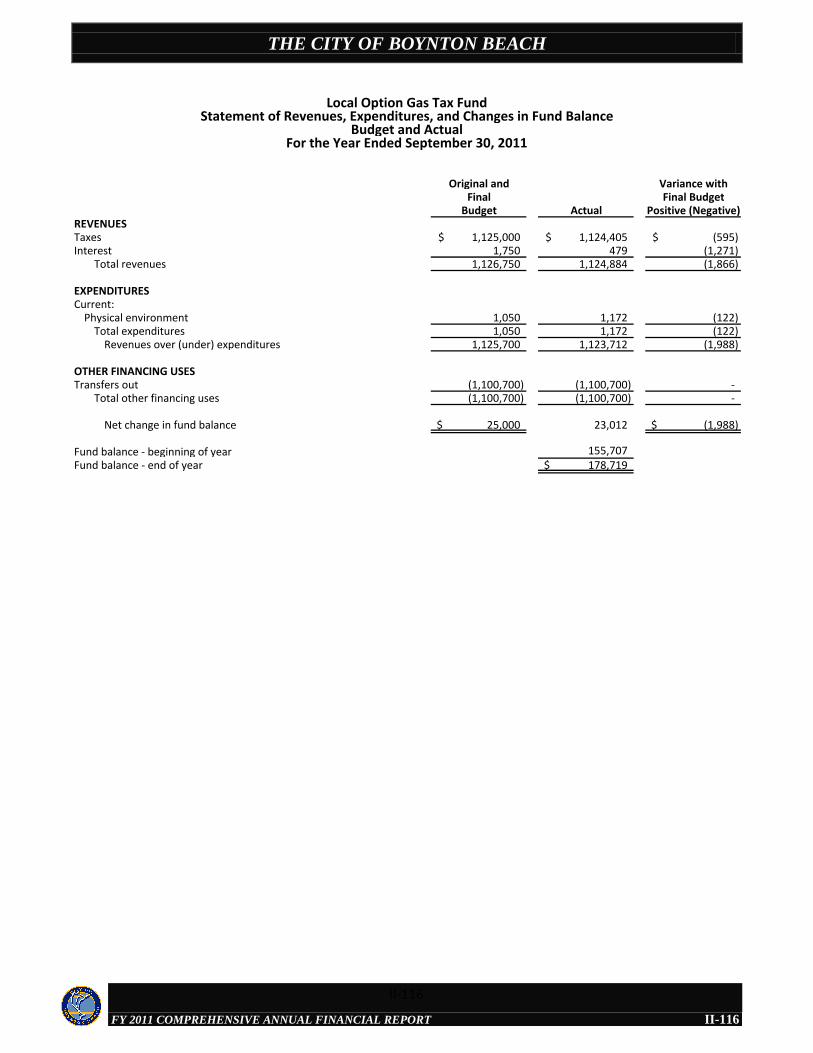
THE CITY OF BOYNTON BEACH
FY 2011 COMPREHENSIVE ANNUAL FINANCIAL REPORT
Original and Variance withFinal Final Budget
Budget Actual Positive (Negative)REVENUESTaxes 1,125,000$ 1,124,405$ (595)$ Interest 1,750 479 (1,271)
Total revenues 1,126,750 1,124,884 (1,866)
EXPENDITURESCurrent:
Physical environment 1,050 1,172 (122) Total expenditures 1,050 1,172 (122)
Revenues over (under) expenditures 1,125,700 1,123,712 (1,988)
OTHER FINANCING USESTransfers out (1,100,700) (1,100,700) -
Total other financing uses (1,100,700) (1,100,700) -
Net change in fund balance 25,000$ 23,012 (1,988)$
Fund balance - beginning of year 155,707 Fund balance - end of year 178,719$
Local Option Gas Tax FundStatement of Revenues, Expenditures, and Changes in Fund Balance
Budget and ActualFor the Year Ended September 30, 2011
II-116
II-116

THE CITY OF BOYNTON BEACH
FY 2011 COMPREHENSIVE ANNUAL FINANCIAL REPORT
2011 2010
ASSETSPooled cash and investments 81,137$ 287,537$ Due from other funds 154,235 64,914Interest receivable - 25Prepaid items 200 971
Total assets 235,572$ 353,447$
LIABILITIES AND FUND BALANCELiabilities:
Accounts payable 3,837$ 463$ Accrued expenses 4,927 14,737Deferred revenue 122,414 244,710
Total liabilities 131,178 259,910
Fund balance:Nonspendable
Prepaid items 200 971 Unassigned:
Special Revenue Funds 104,194 92,566Total fund balance 104,394 93,537
Total liabilities and fund balance 235,572$ 353,447$
Community Improvements FundBalance Sheet
September 30, 2011(With Comparative Figures for 2010)
II-117
II-117
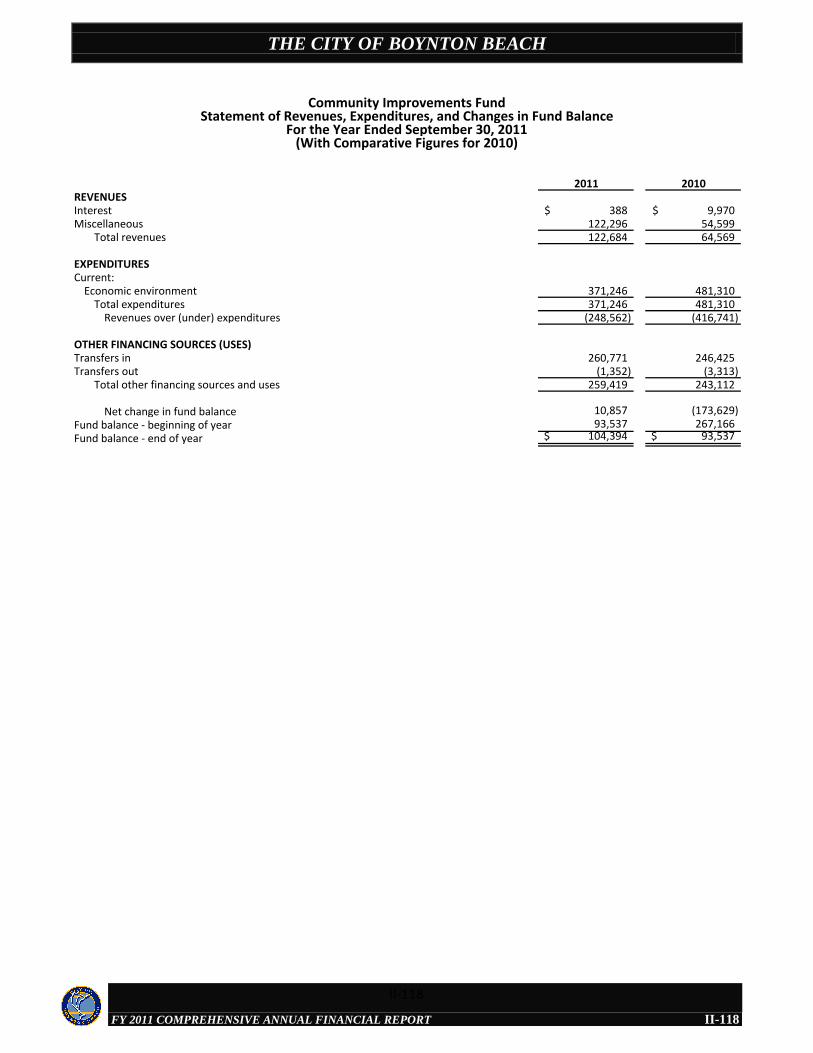
THE CITY OF BOYNTON BEACH
FY 2011 COMPREHENSIVE ANNUAL FINANCIAL REPORT
2011 2010REVENUESInterest 388$ 9,970$ Miscellaneous 122,296 54,599
Total revenues 122,684 64,569
EXPENDITURESCurrent:
Economic environment 371,246 481,310Total expenditures 371,246 481,310
Revenues over (under) expenditures (248,562) (416,741)
OTHER FINANCING SOURCES (USES)Transfers in 260,771 246,425Transfers out (1,352) (3,313)
Total other financing sources and uses 259,419 243,112
Net change in fund balance 10,857 (173,629) Fund balance - beginning of year 93,537 267,166Fund balance - end of year 104,394$ 93,537$
Community Improvements FundStatement of Revenues, Expenditures, and Changes in Fund Balance
For the Year Ended September 30, 2011(With Comparative Figures for 2010)
II-118
II-118
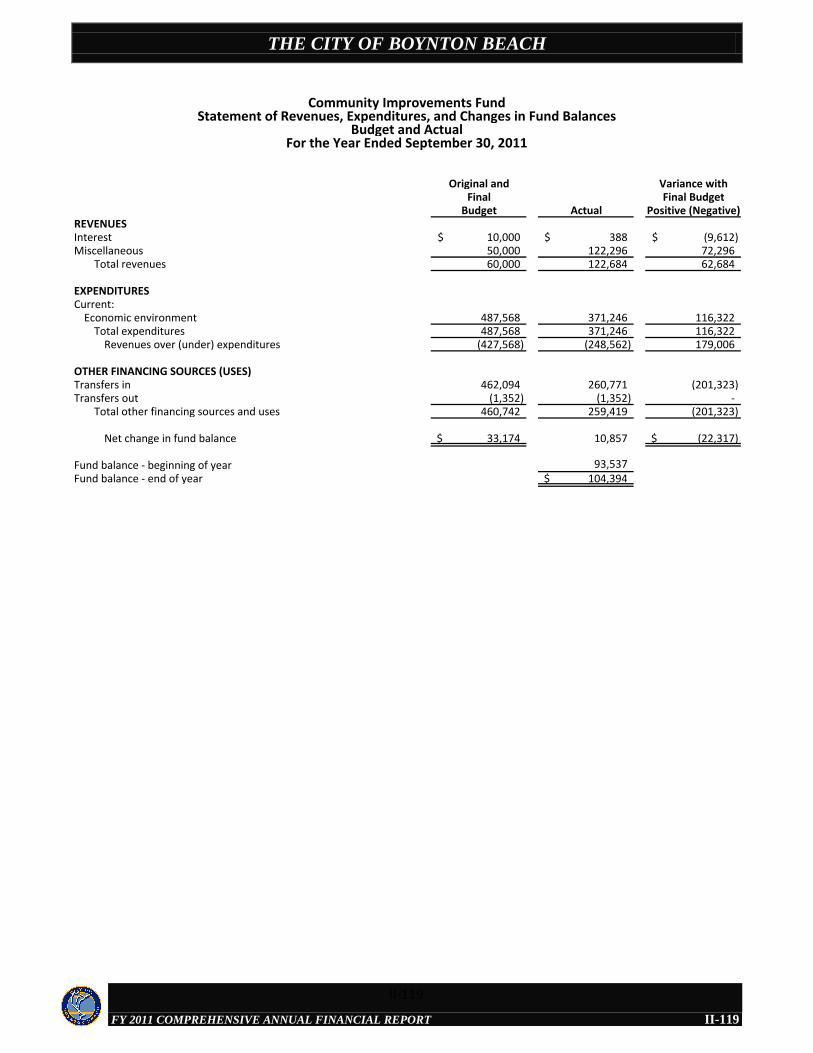
THE CITY OF BOYNTON BEACH
FY 2011 COMPREHENSIVE ANNUAL FINANCIAL REPORT
Original and Variance withFinal Final Budget
Budget Actual Positive (Negative)REVENUESInterest 10,000$ 388$ (9,612)$ Miscellaneous 50,000 122,296 72,296
Total revenues 60,000 122,684 62,684
EXPENDITURESCurrent:
Economic environment 487,568 371,246 116,322 Total expenditures 487,568 371,246 116,322
Revenues over (under) expenditures (427,568) (248,562) 179,006
OTHER FINANCING SOURCES (USES)Transfers in 462,094 260,771 (201,323) Transfers out (1,352) (1,352) -
Total other financing sources and uses 460,742 259,419 (201,323)
Net change in fund balance 33,174$ 10,857 (22,317)$
Fund balance - beginning of year 93,537 Fund balance - end of year 104,394$
Community Improvements FundStatement of Revenues, Expenditures, and Changes in Fund Balances
Budget and ActualFor the Year Ended September 30, 2011
II-119
II-119
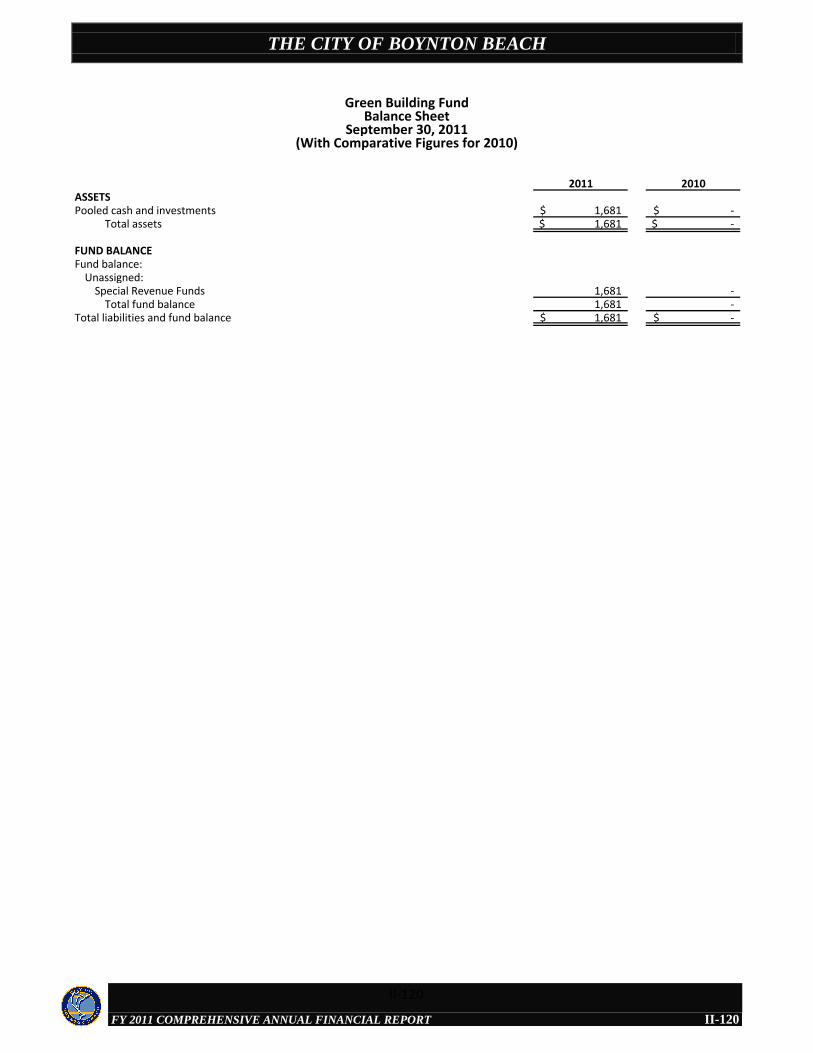
THE CITY OF BOYNTON BEACH
FY 2011 COMPREHENSIVE ANNUAL FINANCIAL REPORT
2011 2010ASSETSPooled cash and investments 1,681$ -$
Total assets 1,681$ -$
FUND BALANCEFund balance:
Unassigned:Special Revenue Funds 1,681 -
Total fund balance 1,681 - Total liabilities and fund balance 1,681$ -$
Green Building FundBalance Sheet
September 30, 2011(With Comparative Figures for 2010)
II-120
II-120

THE CITY OF BOYNTON BEACH
FY 2011 COMPREHENSIVE ANNUAL FINANCIAL REPORT
2011 2010REVENUESFines and forfeitures 1,171$ -$ Interest 10 - Miscellaneous 500 -
Total revenues 1,681 -
EXPENDITURESTotal expenditures - -
Revenues over expenditures 1,681 -
Net change in fund balance 1,681 -
Fund balance - beginning of year - - Fund balance - end of year 1,681$ -$
Green Building FundStatement of Revenues, Expenditures, and Changes in Fund Balance
For the Year Ended September 30, 2011(With Comparative Figures for 2010)
II-121
II-121
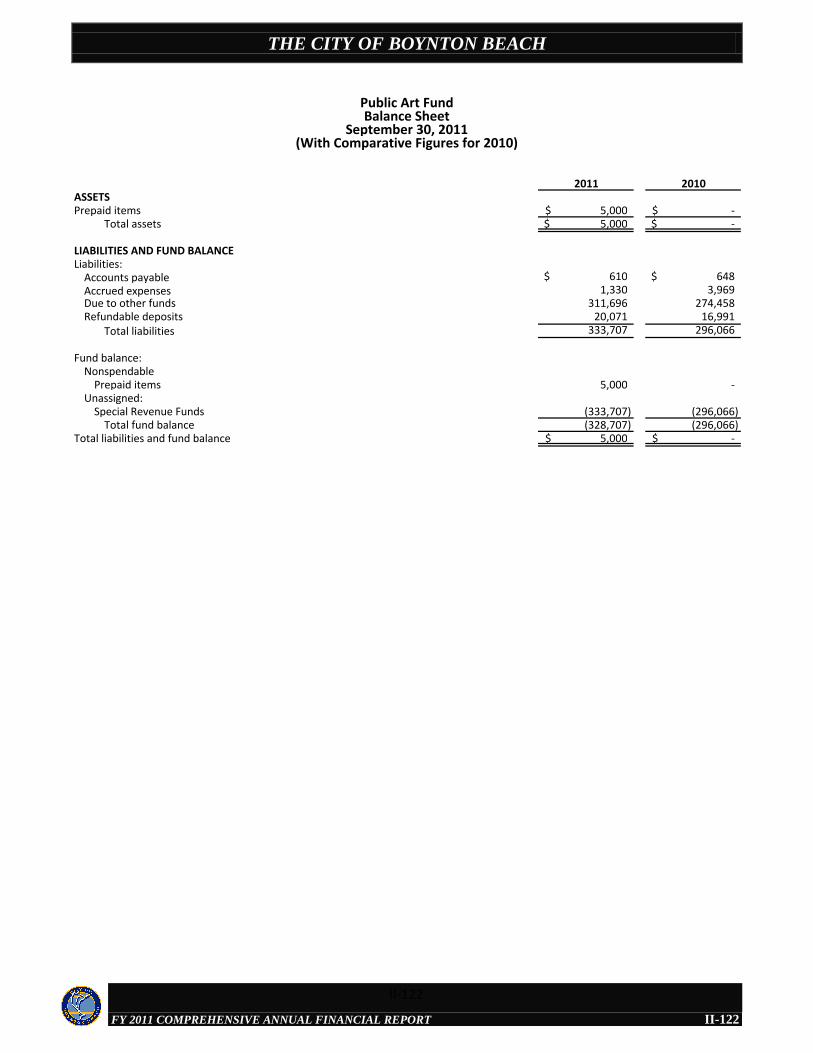
THE CITY OF BOYNTON BEACH
FY 2011 COMPREHENSIVE ANNUAL FINANCIAL REPORT
2011 2010ASSETSPrepaid items 5,000$ -$
Total assets 5,000$ -$
LIABILITIES AND FUND BALANCELiabilities:
Accounts payable 610$ 648$ Accrued expenses 1,330 3,969Due to other funds 311,696 274,458Refundable deposits 20,071 16,991
Total liabilities 333,707 296,066
Fund balance:Nonspendable
Prepaid items 5,000 - Unassigned:
Special Revenue Funds (333,707) (296,066)Total fund balance (328,707) (296,066)
Total liabilities and fund balance 5,000$ -$
Public Art FundBalance Sheet
September 30, 2011(With Comparative Figures for 2010)
II-122
II-122
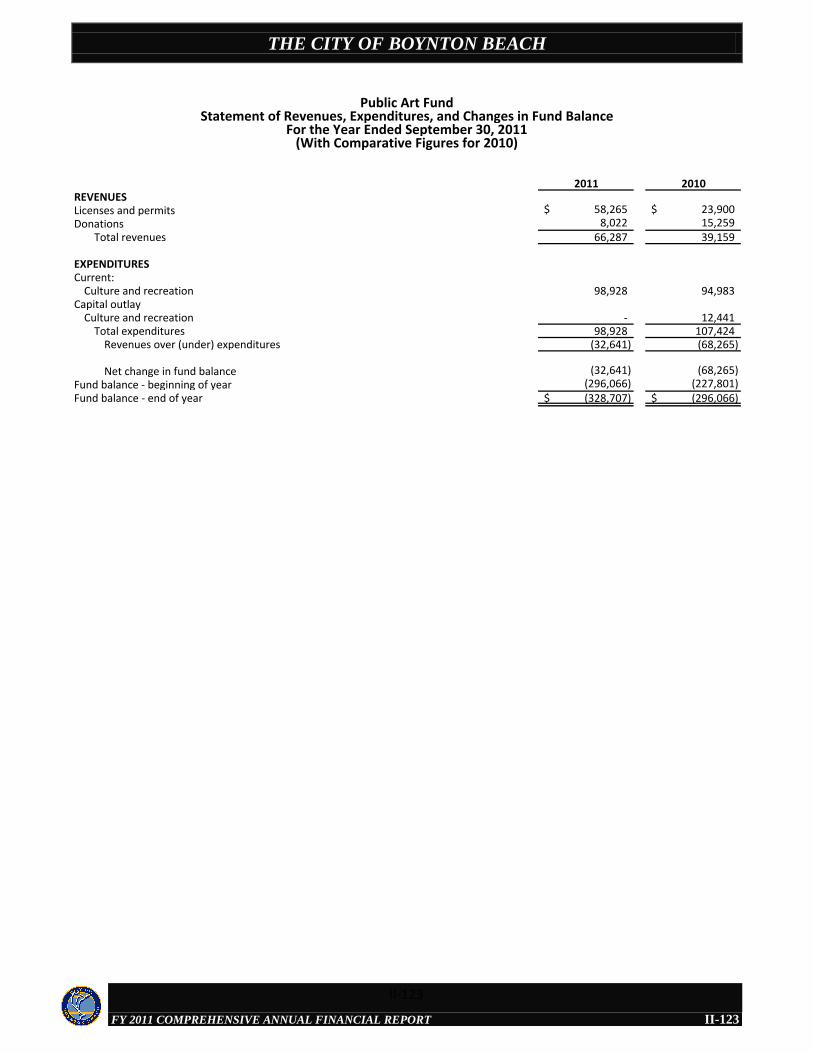
THE CITY OF BOYNTON BEACH
FY 2011 COMPREHENSIVE ANNUAL FINANCIAL REPORT
2011 2010REVENUESLicenses and permits 58,265$ 23,900$ Donations 8,022 15,259
Total revenues 66,287 39,159
EXPENDITURESCurrent:
Culture and recreation 98,928 94,983Capital outlay
Culture and recreation - 12,441Total expenditures 98,928 107,424
Revenues over (under) expenditures (32,641) (68,265)
Net change in fund balance (32,641) (68,265) Fund balance - beginning of year (296,066) (227,801)Fund balance - end of year (328,707)$ (296,066)$
Public Art FundStatement of Revenues, Expenditures, and Changes in Fund Balance
For the Year Ended September 30, 2011(With Comparative Figures for 2010)
II-123
II-123
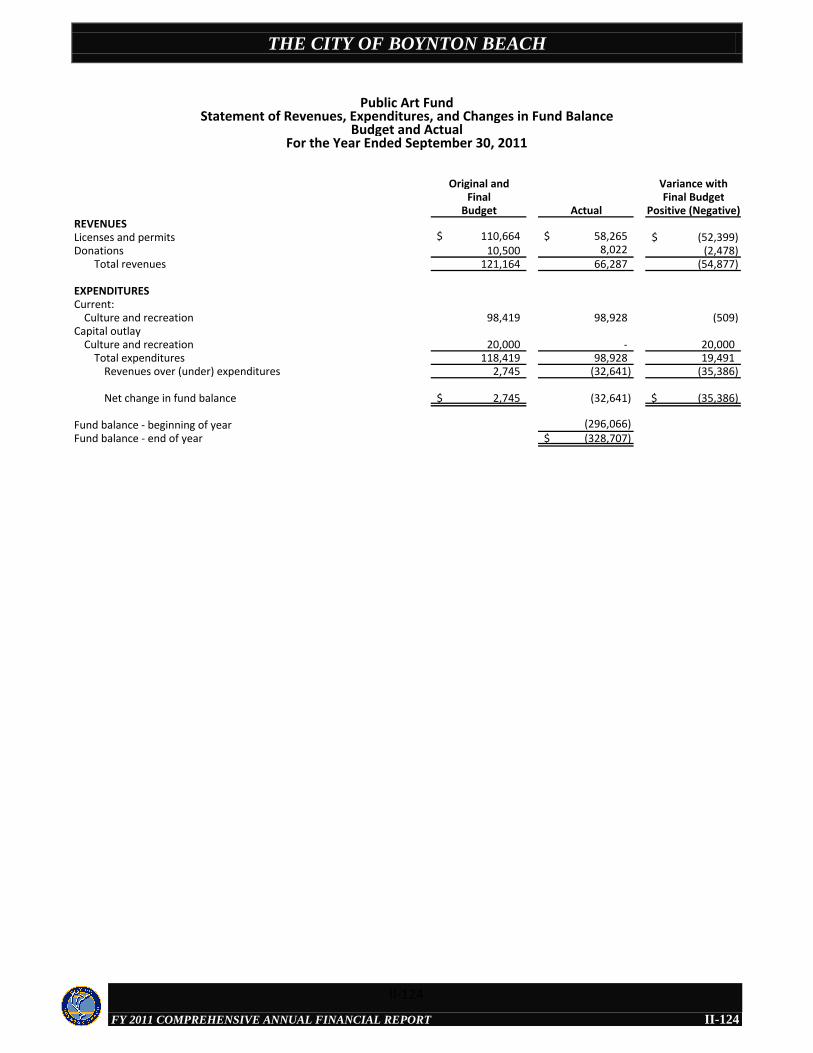
THE CITY OF BOYNTON BEACH
FY 2011 COMPREHENSIVE ANNUAL FINANCIAL REPORT
Original and Variance withFinal Final Budget
Budget Actual Positive (Negative)REVENUESLicenses and permits 110,664$ 58,265$ (52,399)$ Donations 10,500 8,022 (2,478)
Total revenues 121,164 66,287 (54,877)
EXPENDITURESCurrent:
Culture and recreation 98,419 98,928 (509) Capital outlay
Culture and recreation 20,000 - 20,000 Total expenditures 118,419 98,928 19,491
Revenues over (under) expenditures 2,745 (32,641) (35,386)
Net change in fund balance 2,745$ (32,641) (35,386)$
Fund balance - beginning of year (296,066) Fund balance - end of year (328,707)$
Public Art FundStatement of Revenues, Expenditures, and Changes in Fund Balance
Budget and ActualFor the Year Ended September 30, 2011
II-124
II-124

THE CITY OF BOYNTON BEACH
FY 2011 COMPREHENSIVE ANNUAL FINANCIAL REPORT
2011 2010ASSETSPooled cash and investments 818,549$ 575,321$ Receivables, net 150 400 Other receivables - 84 Prepaid items 1,031 770
Total assets 819,730$ 576,575$
LIABILITIES AND FUND BALANCELiabilities:
Accounts payable 29,272$ 11,864$ Accrued expenses 3,103 5,293
Total liabilities 32,375 17,157
Fund balance:Nonspendable
Prepaid items 1,031 770 Assigned to:
Special Revenue Funds 786,324 558,648Total fund balance 787,355 559,418
Total liabilities and fund balance 819,730$ 576,575$
Recreation Program FundBalance Sheet
September 30, 2011(With Comparative Figures for 2010)
II-125
II-125

THE CITY OF BOYNTON BEACH
FY 2011 COMPREHENSIVE ANNUAL FINANCIAL REPORT
2011 2010REVENUESCharges for services 727,832$ 694,651$ Interest 18,668 13,740 Miscellaneous 14,004 28,558
Total revenues 760,504 736,949
EXPENDITURESCurrent:
Culture and recreation 502,101 447,187 Capital outlay
Culture and recreation 10,466 - Total expenditures 512,567 447,187
Revenues over expenditures 247,937 289,762
OTHER FINANCING SOURCES (USES)Transfers in 75,000 - Transfers out (95,000) (95,369)
Total other financing sources and uses (20,000) (95,369)
Net change in fund balance 227,937 194,393 Fund balance - beginning of year 559,418 365,025Fund balance - end of year 787,355$ 559,418$
Recreation Program FundStatement of Revenues, Expenditures, and Changes in Fund Balance
For the Year Ended September 30, 2011(With Comparative Figures for 2010)
II-126
II-126
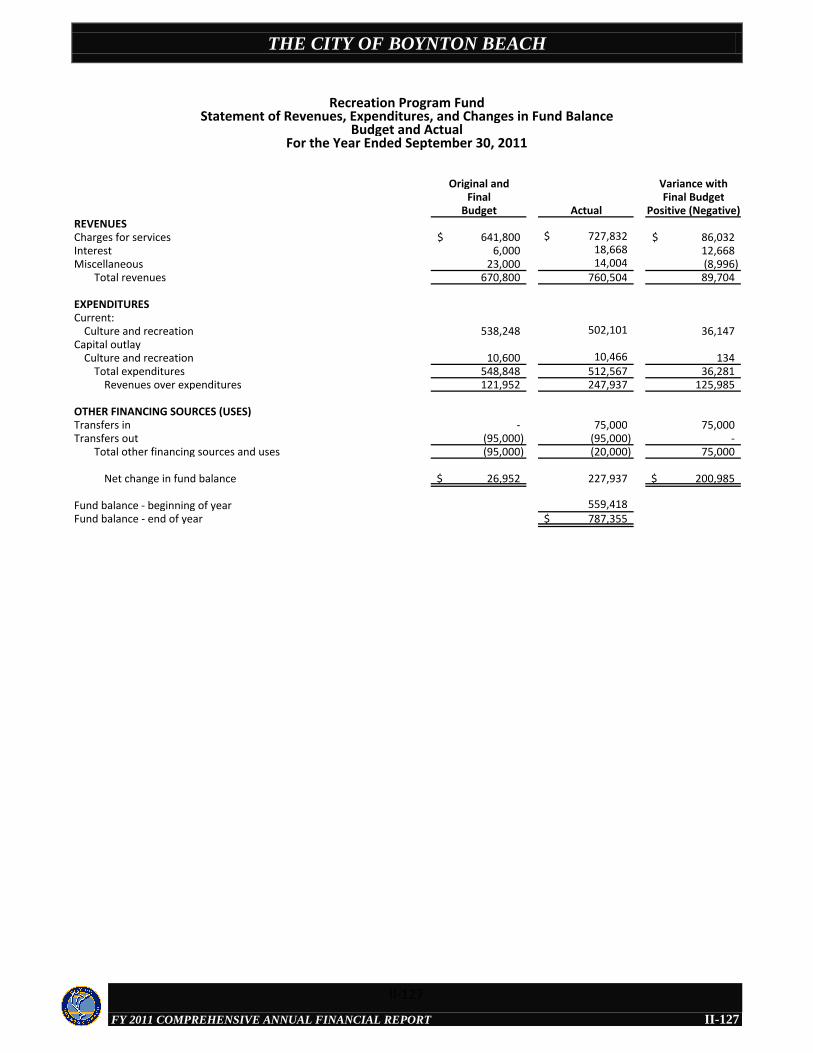
THE CITY OF BOYNTON BEACH
FY 2011 COMPREHENSIVE ANNUAL FINANCIAL REPORT
Original and Variance withFinal Final Budget
Budget Actual Positive (Negative)REVENUESCharges for services 641,800$ 727,832$ 86,032$ Interest 6,000 18,668 12,668 Miscellaneous 23,000 14,004 (8,996)
Total revenues 670,800 760,504 89,704
EXPENDITURESCurrent:
Culture and recreation 538,248 502,101 36,147 Capital outlay
Culture and recreation 10,600 10,466 134 Total expenditures 548,848 512,567 36,281
Revenues over expenditures 121,952 247,937 125,985
OTHER FINANCING SOURCES (USES)Transfers in - 75,000 75,000 Transfers out (95,000) (95,000) -
Total other financing sources and uses (95,000) (20,000) 75,000
Net change in fund balance 26,952$ 227,937 200,985$
Fund balance - beginning of year 559,418 Fund balance - end of year 787,355$
Recreation Program FundStatement of Revenues, Expenditures, and Changes in Fund Balance
Budget and ActualFor the Year Ended September 30, 2011
II-127
II-127

THE CITY OF BOYNTON BEACH
FY 2011 COMPREHENSIVE ANNUAL FINANCIAL REPORT
2011 2010ASSETSPooled cash and investments 4,298,563$ 4,462,630$ Receivables, net 2,948 1,476
Total assets 4,301,511$ 4,464,106$
LIABILITIES AND FUND BALANCELiabilities:
Accounts payable 105,845$ 6,307$ Accrued expenses 2,114 6,513
Total liabilities 107,959 12,820
Fund balance:Assigned to:
Special Revenue Funds 4,009,727 4,281,481Unassigned
Special Revenue Funds 183,825 169,805Total fund balance 4,193,552 4,451,286
Total liabilities and fund balance 4,301,511$ 4,464,106$
Boynton Beach Memorial Park FundBalance Sheet
September 30, 2011(With Comparative Figures for 2010)
II-128
II-128
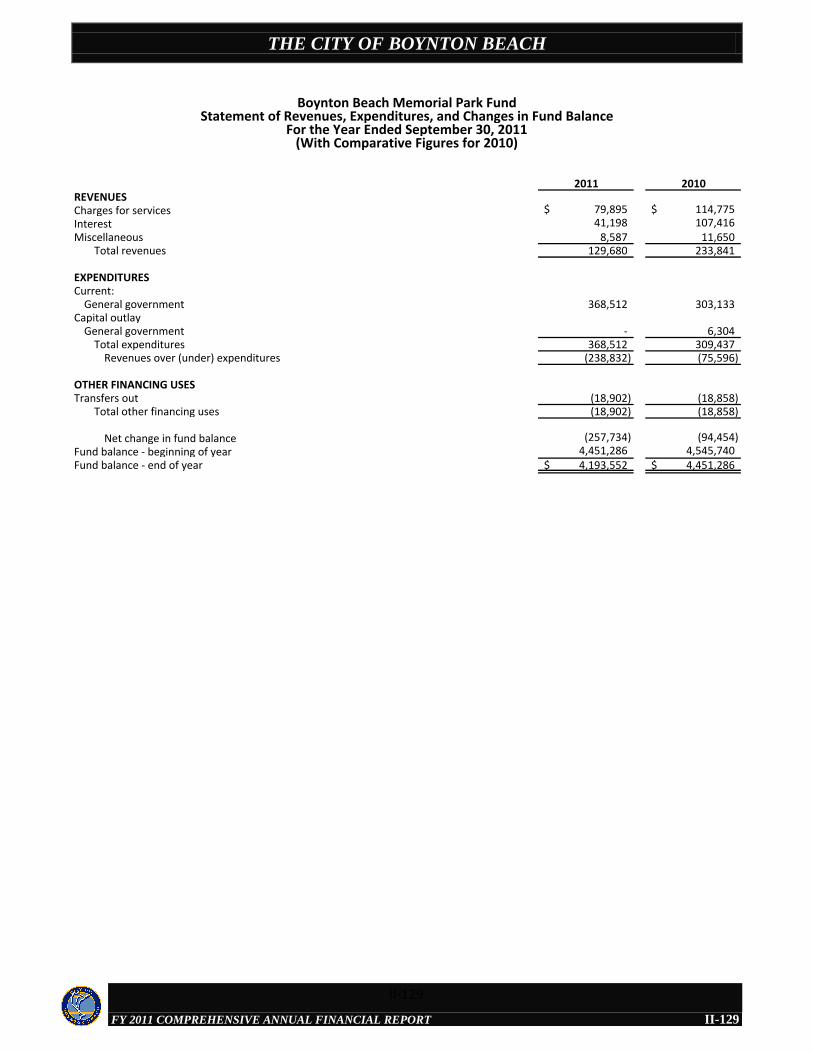
THE CITY OF BOYNTON BEACH
FY 2011 COMPREHENSIVE ANNUAL FINANCIAL REPORT
2011 2010REVENUESCharges for services 79,895$ 114,775$ Interest 41,198 107,416 Miscellaneous 8,587 11,650
Total revenues 129,680 233,841
EXPENDITURESCurrent:
General government 368,512 303,133Capital outlay
General government - 6,304 Total expenditures 368,512 309,437
Revenues over (under) expenditures (238,832) (75,596)
OTHER FINANCING USESTransfers out (18,902) (18,858)
Total other financing uses (18,902) (18,858)
Net change in fund balance (257,734) (94,454) Fund balance - beginning of year 4,451,286 4,545,740Fund balance - end of year 4,193,552$ 4,451,286$
Boynton Beach Memorial Park FundStatement of Revenues, Expenditures, and Changes in Fund Balance
For the Year Ended September 30, 2011(With Comparative Figures for 2010)
II-129
II-129
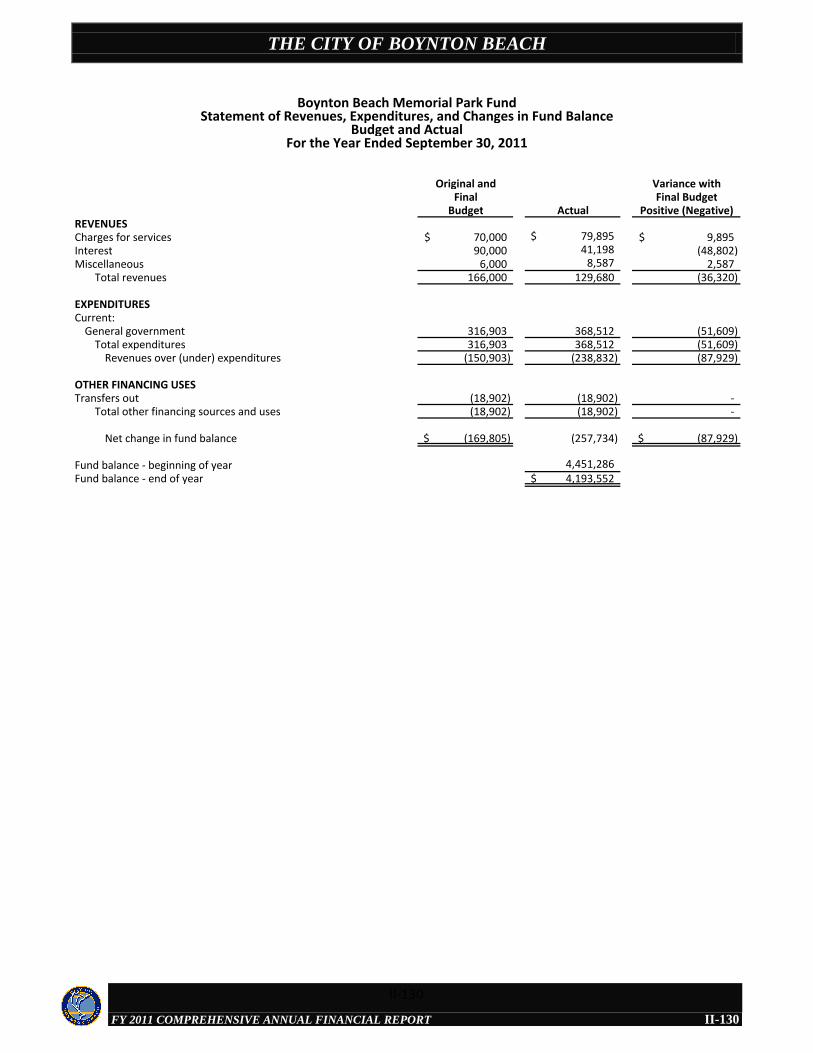
THE CITY OF BOYNTON BEACH
FY 2011 COMPREHENSIVE ANNUAL FINANCIAL REPORT
Original and Variance withFinal Final Budget
Budget Actual Positive (Negative)REVENUESCharges for services 70,000$ 79,895$ 9,895$ Interest 90,000 41,198 (48,802) Miscellaneous 6,000 8,587 2,587
Total revenues 166,000 129,680 (36,320)
EXPENDITURESCurrent:
General government 316,903 368,512 (51,609) Total expenditures 316,903 368,512 (51,609)
Revenues over (under) expenditures (150,903) (238,832) (87,929)
OTHER FINANCING USESTransfers out (18,902) (18,902) -
Total other financing sources and uses (18,902) (18,902) -
Net change in fund balance (169,805)$ (257,734) (87,929)$
Fund balance - beginning of year 4,451,286 Fund balance - end of year 4,193,552$
Boynton Beach Memorial Park FundStatement of Revenues, Expenditures, and Changes in Fund Balance
Budget and ActualFor the Year Ended September 30, 2011
II-130
II-130
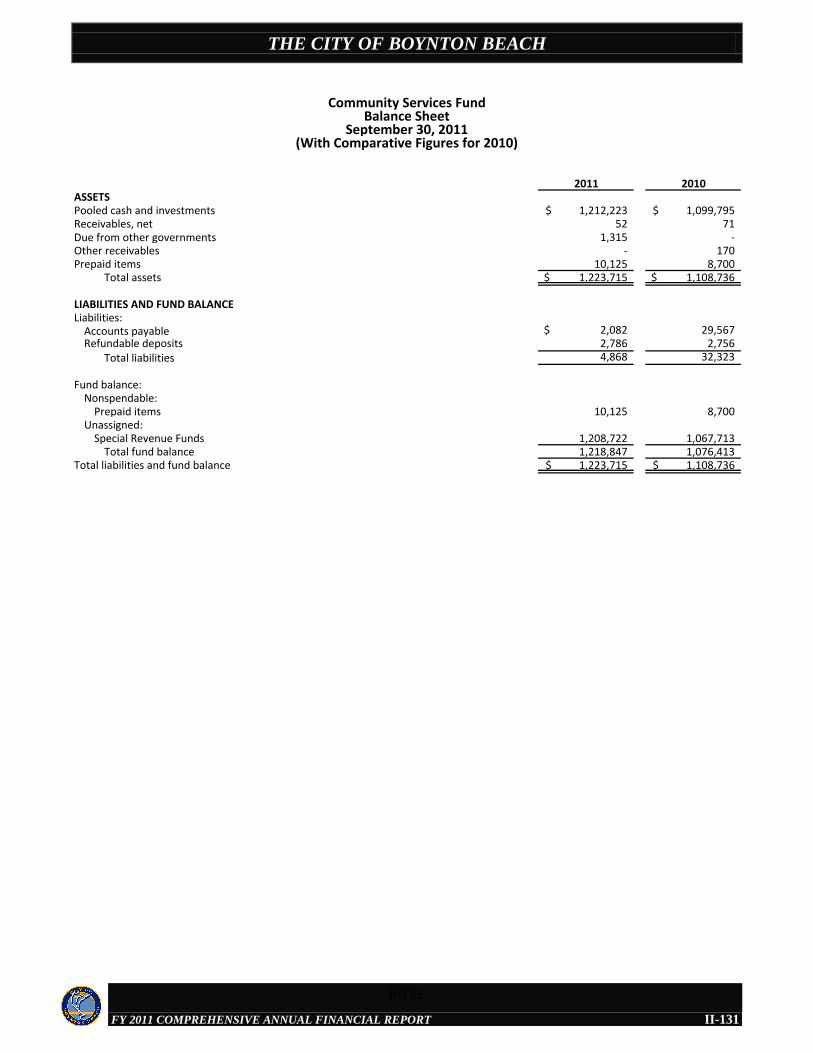
THE CITY OF BOYNTON BEACH
FY 2011 COMPREHENSIVE ANNUAL FINANCIAL REPORT
2011 2010ASSETSPooled cash and investments 1,212,223$ 1,099,795$ Receivables, net 52 71 Due from other governments 1,315 - Other receivables - 170 Prepaid items 10,125 8,700
Total assets 1,223,715$ 1,108,736$
LIABILITIES AND FUND BALANCELiabilities:
Accounts payable 2,082$ 29,567Refundable deposits 2,786 2,756
Total liabilities 4,868 32,323
Fund balance:Nonspendable:
Prepaid items 10,125 8,700 Unassigned:
Special Revenue Funds 1,208,722 1,067,713Total fund balance 1,218,847 1,076,413
Total liabilities and fund balance 1,223,715$ 1,108,736$
Community Services FundBalance Sheet
September 30, 2011(With Comparative Figures for 2010)
II-131
II-131
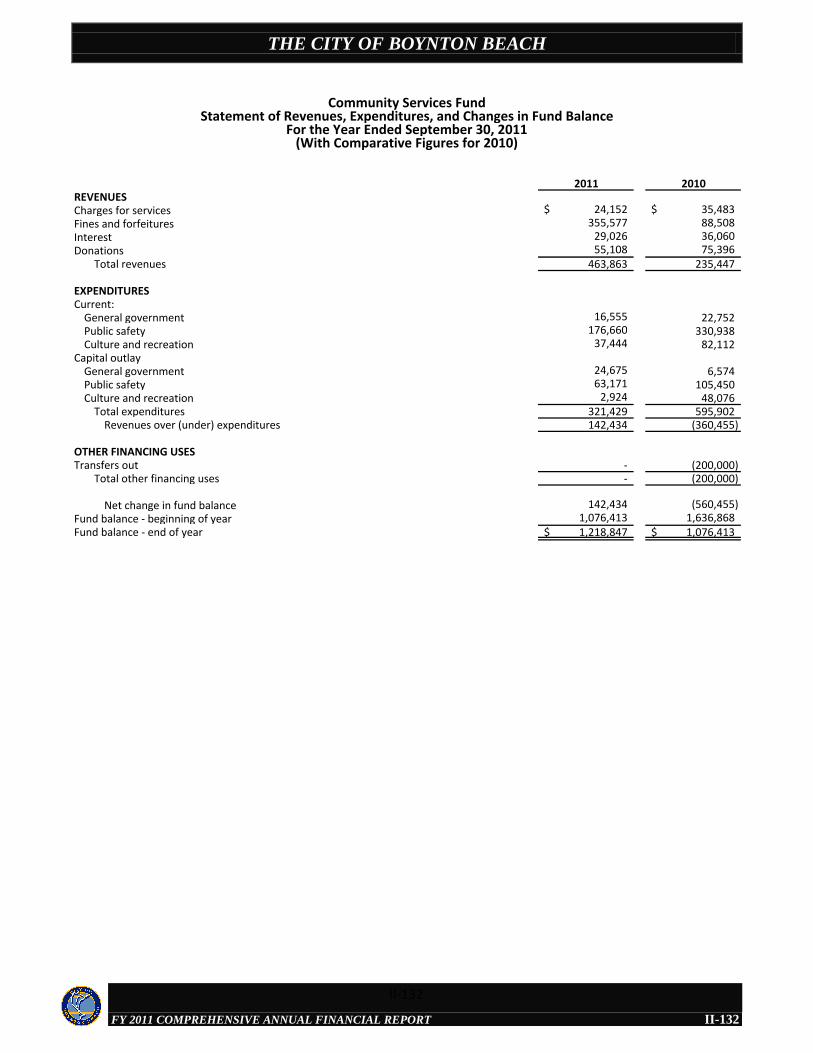
THE CITY OF BOYNTON BEACH
FY 2011 COMPREHENSIVE ANNUAL FINANCIAL REPORT
2011 2010REVENUESCharges for services 24,152$ 35,483$ Fines and forfeitures 355,577 88,508 Interest 29,026 36,060 Donations 55,108 75,396
Total revenues 463,863 235,447
EXPENDITURESCurrent:
General government 16,555 22,752 Public safety 176,660 330,938 Culture and recreation 37,444 82,112
Capital outlayGeneral government 24,675 6,574 Public safety 63,171 105,450 Culture and recreation 2,924 48,076
Total expenditures 321,429 595,902 Revenues over (under) expenditures 142,434 (360,455)
OTHER FINANCING USESTransfers out - (200,000)
Total other financing uses - (200,000)
Net change in fund balance 142,434 (560,455) Fund balance - beginning of year 1,076,413 1,636,868Fund balance - end of year 1,218,847$ 1,076,413$
Community Services FundStatement of Revenues, Expenditures, and Changes in Fund Balance
For the Year Ended September 30, 2011(With Comparative Figures for 2010)
II-132
II-132
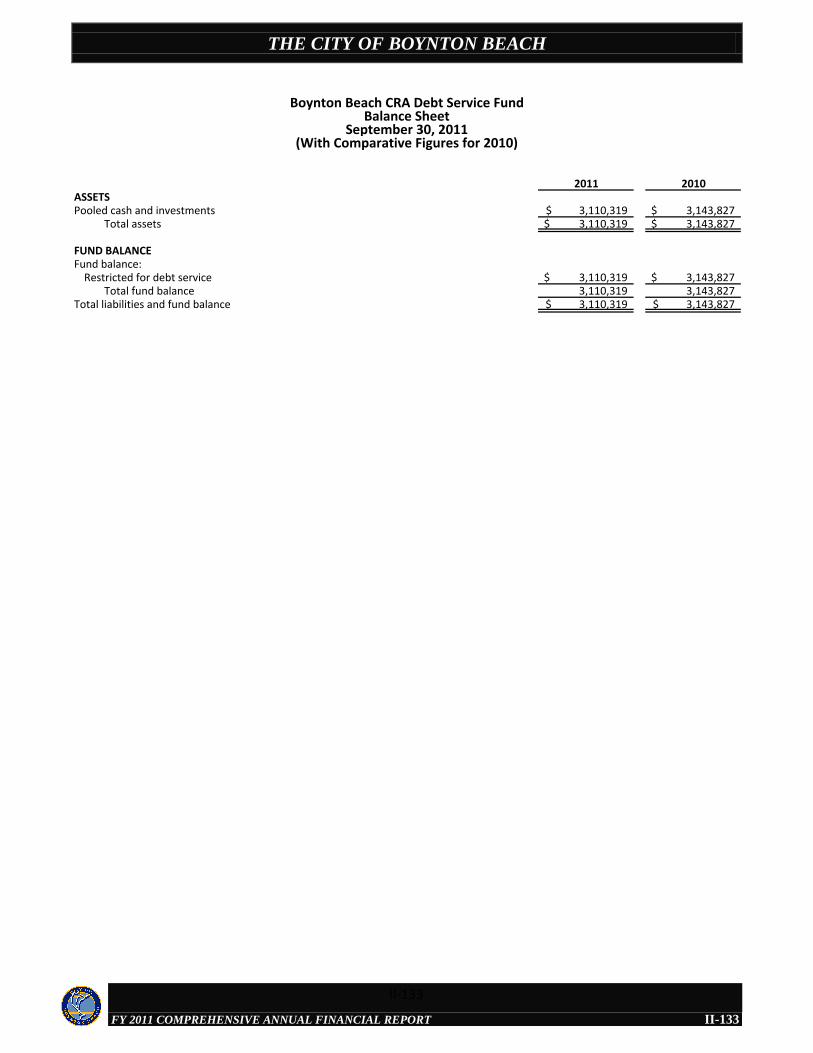
THE CITY OF BOYNTON BEACH
FY 2011 COMPREHENSIVE ANNUAL FINANCIAL REPORT
2011 2010ASSETSPooled cash and investments 3,110,319$ 3,143,827$
Total assets 3,110,319$ 3,143,827$
FUND BALANCEFund balance:
Restricted for debt service 3,110,319$ 3,143,827$ Total fund balance 3,110,319 3,143,827
Total liabilities and fund balance 3,110,319$ 3,143,827$
Boynton Beach CRA Debt Service FundBalance Sheet
September 30, 2011(With Comparative Figures for 2010)
II-133
II-133
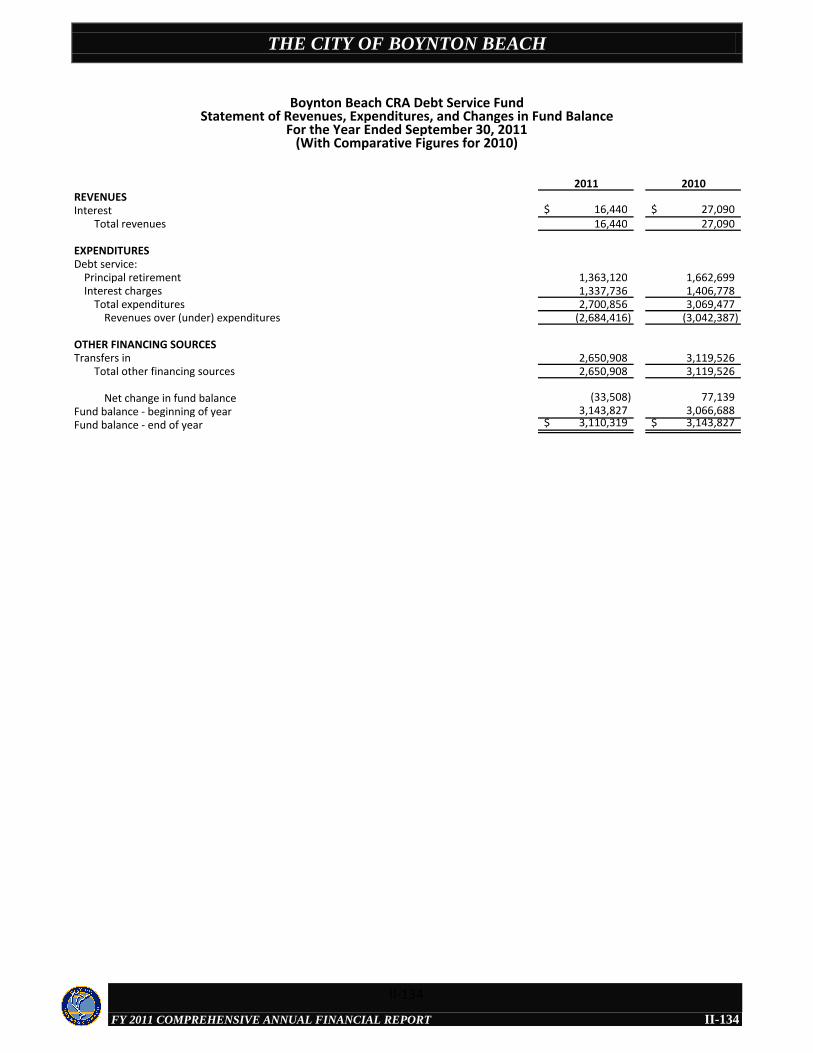
THE CITY OF BOYNTON BEACH
FY 2011 COMPREHENSIVE ANNUAL FINANCIAL REPORT
2011 2010REVENUESInterest 16,440$ 27,090$
Total revenues 16,440 27,090
EXPENDITURESDebt service:
Principal retirement 1,363,120 1,662,699 Interest charges 1,337,736 1,406,778
Total expenditures 2,700,856 3,069,477 Revenues over (under) expenditures (2,684,416) (3,042,387)
OTHER FINANCING SOURCES Transfers in 2,650,908 3,119,526
Total other financing sources 2,650,908 3,119,526
Net change in fund balance (33,508) 77,139 Fund balance - beginning of year 3,143,827 3,066,688Fund balance - end of year 3,110,319$ 3,143,827$
Boynton Beach CRA Debt Service FundStatement of Revenues, Expenditures, and Changes in Fund Balance
For the Year Ended September 30, 2011(With Comparative Figures for 2010)
II-134
II-134
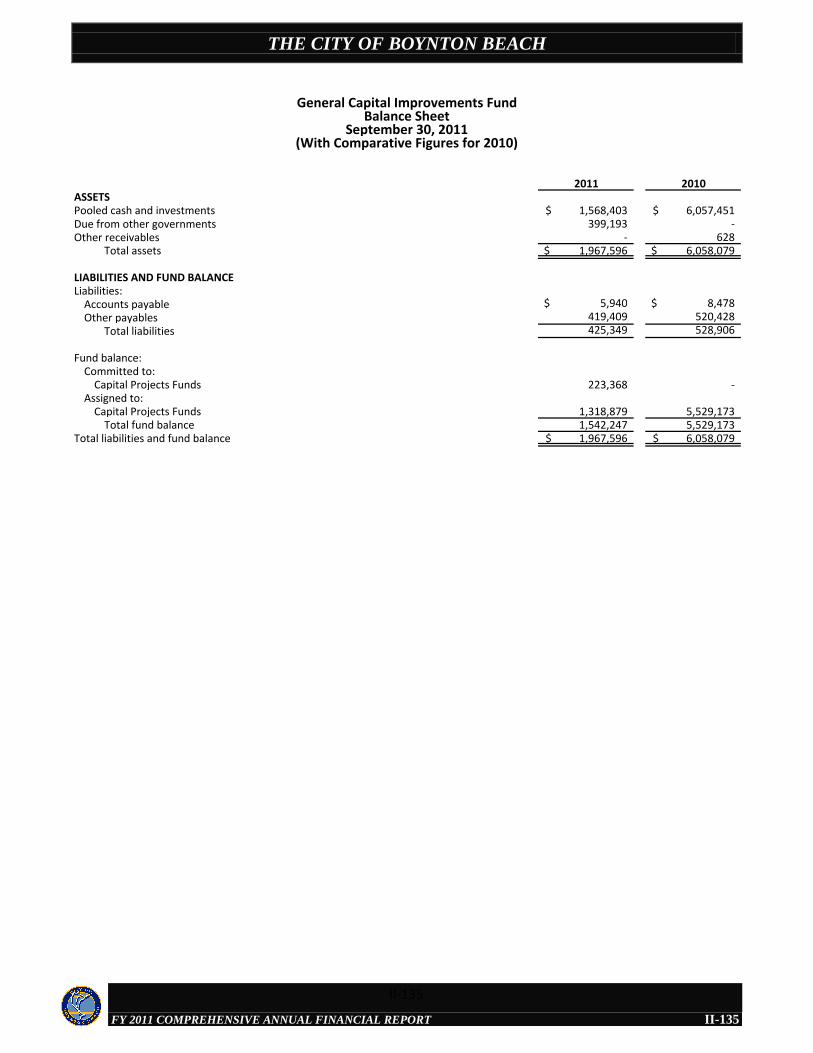
THE CITY OF BOYNTON BEACH
FY 2011 COMPREHENSIVE ANNUAL FINANCIAL REPORT
2011 2010ASSETSPooled cash and investments 1,568,403$ 6,057,451$ Due from other governments 399,193 - Other receivables - 628
Total assets 1,967,596$ 6,058,079$
LIABILITIES AND FUND BALANCELiabilities:
Accounts payable 5,940$ 8,478$ Other payables 419,409 520,428
Total liabilities 425,349 528,906
Fund balance:Committed to:
Capital Projects Funds 223,368 - Assigned to:
Capital Projects Funds 1,318,879 5,529,173Total fund balance 1,542,247 5,529,173
Total liabilities and fund balance 1,967,596$ 6,058,079$
General Capital Improvements FundBalance Sheet
September 30, 2011(With Comparative Figures for 2010)
II-135
II-135
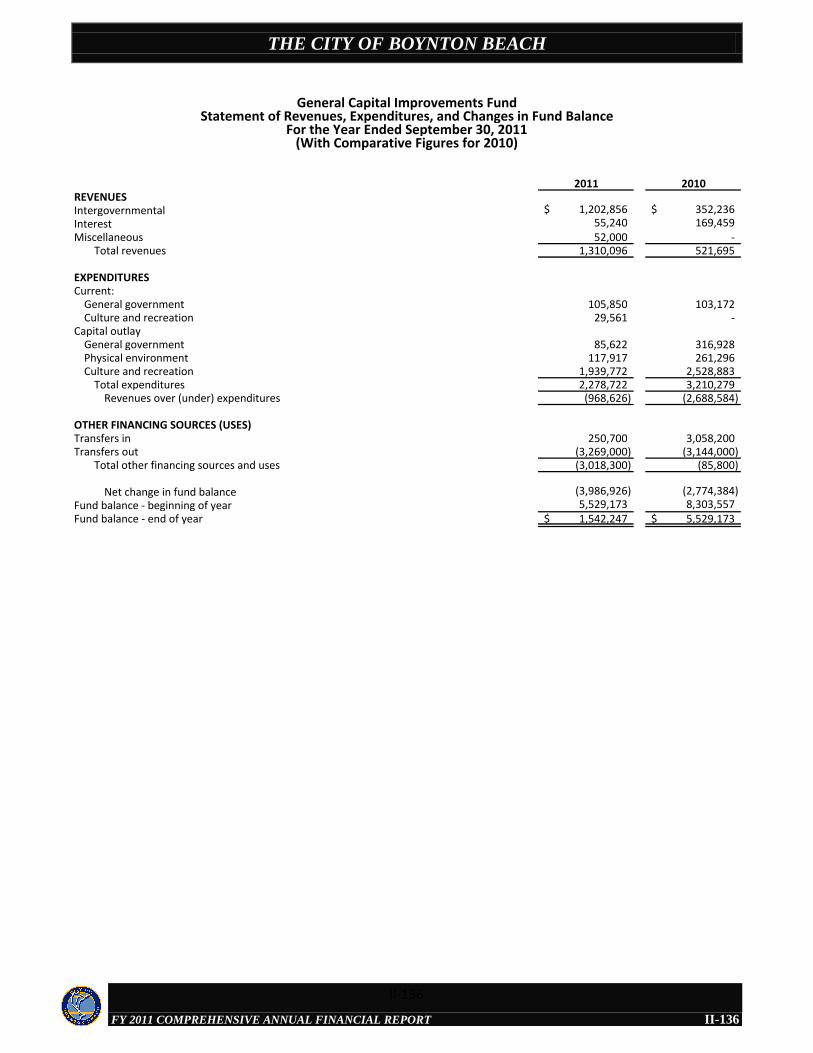
THE CITY OF BOYNTON BEACH
FY 2011 COMPREHENSIVE ANNUAL FINANCIAL REPORT
2011 2010REVENUESIntergovernmental 1,202,856$ 352,236$ Interest 55,240 169,459 Miscellaneous 52,000 -
Total revenues 1,310,096 521,695
EXPENDITURESCurrent:
General government 105,850 103,172Culture and recreation 29,561 -
Capital outlayGeneral government 85,622 316,928Physical environment 117,917 261,296 Culture and recreation 1,939,772 2,528,883
Total expenditures 2,278,722 3,210,279 Revenues over (under) expenditures (968,626) (2,688,584)
OTHER FINANCING SOURCES (USES)Transfers in 250,700 3,058,200 Transfers out (3,269,000) (3,144,000)
Total other financing sources and uses (3,018,300) (85,800)
Net change in fund balance (3,986,926) (2,774,384) Fund balance - beginning of year 5,529,173 8,303,557 Fund balance - end of year 1,542,247$ 5,529,173$
General Capital Improvements FundStatement of Revenues, Expenditures, and Changes in Fund Balance
For the Year Ended September 30, 2011(With Comparative Figures for 2010)
II-136
II-136
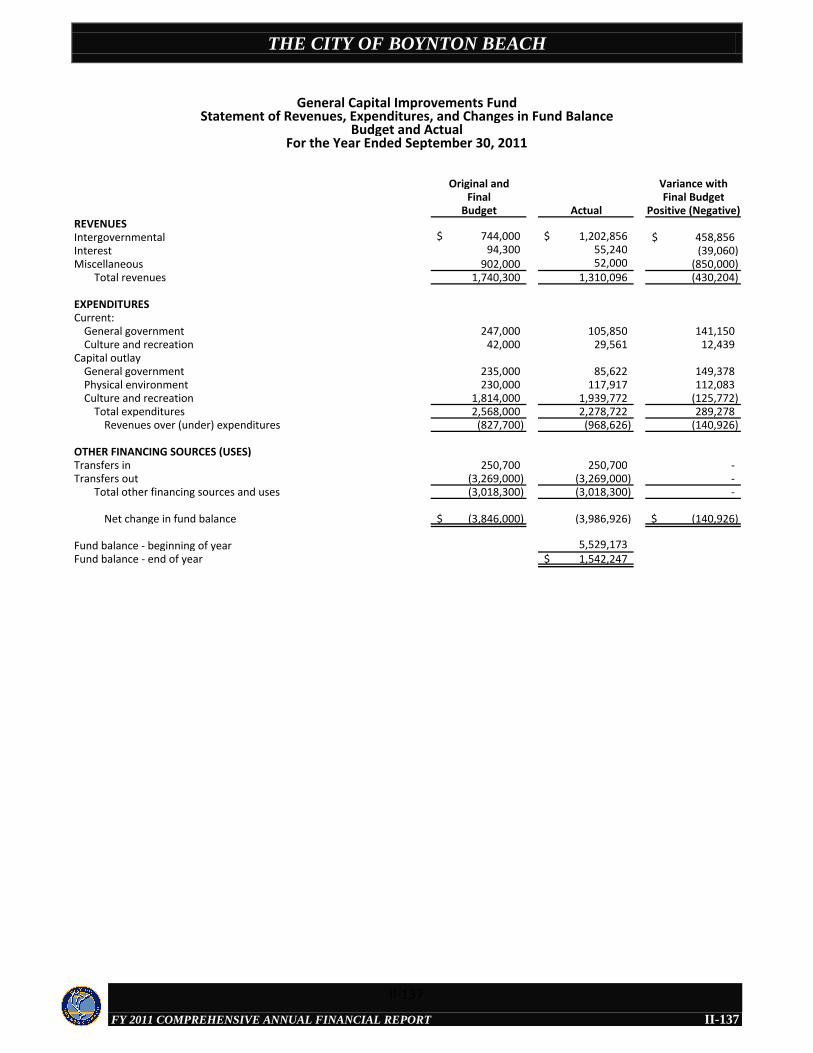
THE CITY OF BOYNTON BEACH
FY 2011 COMPREHENSIVE ANNUAL FINANCIAL REPORT
Original and Variance withFinal Final Budget
Budget Actual Positive (Negative)REVENUESIntergovernmental 744,000$ 1,202,856$ 458,856$ Interest 94,300 55,240 (39,060) Miscellaneous 902,000 52,000 (850,000)
Total revenues 1,740,300 1,310,096 (430,204)
EXPENDITURESCurrent:
General government 247,000 105,850 141,150 Culture and recreation 42,000 29,561 12,439
Capital outlayGeneral government 235,000 85,622 149,378 Physical environment 230,000 117,917 112,083 Culture and recreation 1,814,000 1,939,772 (125,772)
Total expenditures 2,568,000 2,278,722 289,278 Revenues over (under) expenditures (827,700) (968,626) (140,926)
OTHER FINANCING SOURCES (USES)Transfers in 250,700 250,700 - Transfers out (3,269,000) (3,269,000) -
Total other financing sources and uses (3,018,300) (3,018,300) -
Net change in fund balance (3,846,000)$ (3,986,926) (140,926)$
Fund balance - beginning of year 5,529,173 Fund balance - end of year 1,542,247$
General Capital Improvements FundStatement of Revenues, Expenditures, and Changes in Fund Balance
Budget and ActualFor the Year Ended September 30, 2011
II-137
II-137
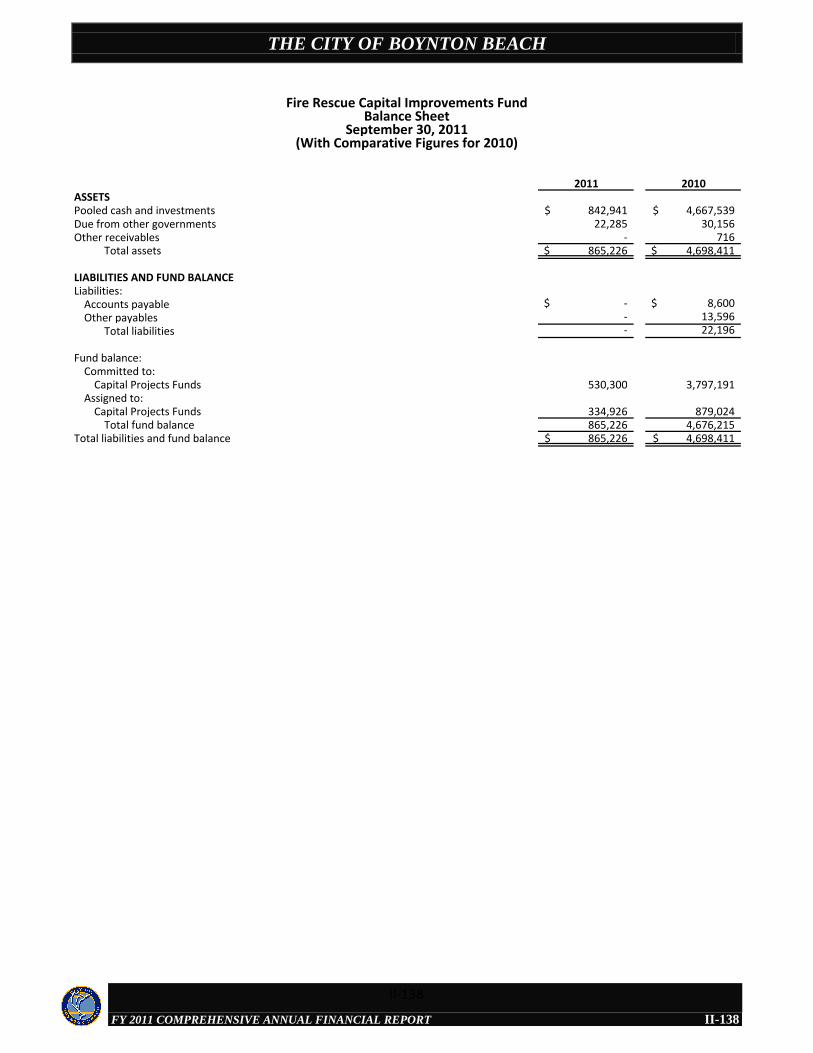
THE CITY OF BOYNTON BEACH
FY 2011 COMPREHENSIVE ANNUAL FINANCIAL REPORT
2011 2010ASSETSPooled cash and investments 842,941$ 4,667,539$ Due from other governments 22,285 30,156 Other receivables - 716
Total assets 865,226$ 4,698,411$
LIABILITIES AND FUND BALANCELiabilities:
Accounts payable -$ 8,600$ Other payables - 13,596
Total liabilities - 22,196
Fund balance:Committed to:
Capital Projects Funds 530,300 3,797,191Assigned to:
Capital Projects Funds 334,926 879,024Total fund balance 865,226 4,676,215
Total liabilities and fund balance 865,226$ 4,698,411$
Fire Rescue Capital Improvements FundBalance Sheet
September 30, 2011(With Comparative Figures for 2010)
II-138
II-138
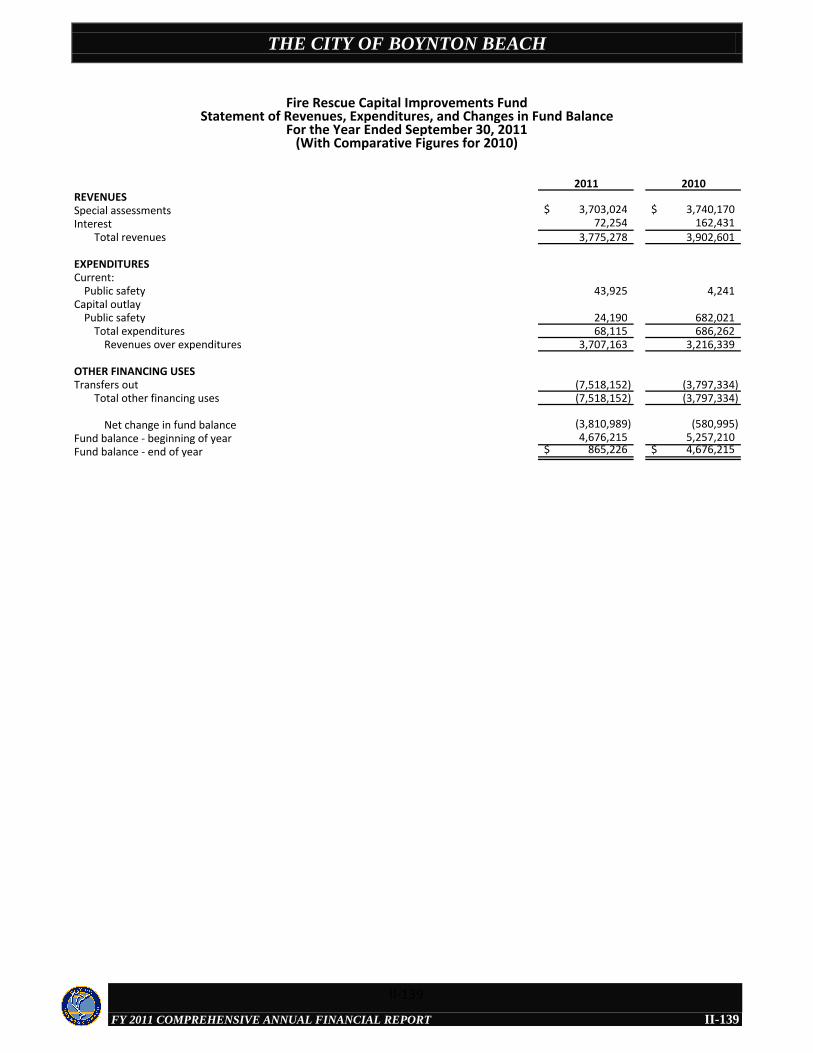
THE CITY OF BOYNTON BEACH
FY 2011 COMPREHENSIVE ANNUAL FINANCIAL REPORT
2011 2010REVENUESSpecial assessments 3,703,024$ 3,740,170$ Interest 72,254 162,431
Total revenues 3,775,278 3,902,601
EXPENDITURESCurrent:
Public safety 43,925 4,241 Capital outlay
Public safety 24,190 682,021 Total expenditures 68,115 686,262
Revenues over expenditures 3,707,163 3,216,339
OTHER FINANCING USESTransfers out (7,518,152) (3,797,334)
Total other financing uses (7,518,152) (3,797,334)
Net change in fund balance (3,810,989) (580,995) Fund balance - beginning of year 4,676,215 5,257,210Fund balance - end of year 865,226$ 4,676,215$
Fire Rescue Capital Improvements FundStatement of Revenues, Expenditures, and Changes in Fund Balance
For the Year Ended September 30, 2011(With Comparative Figures for 2010)
II-139
II-139
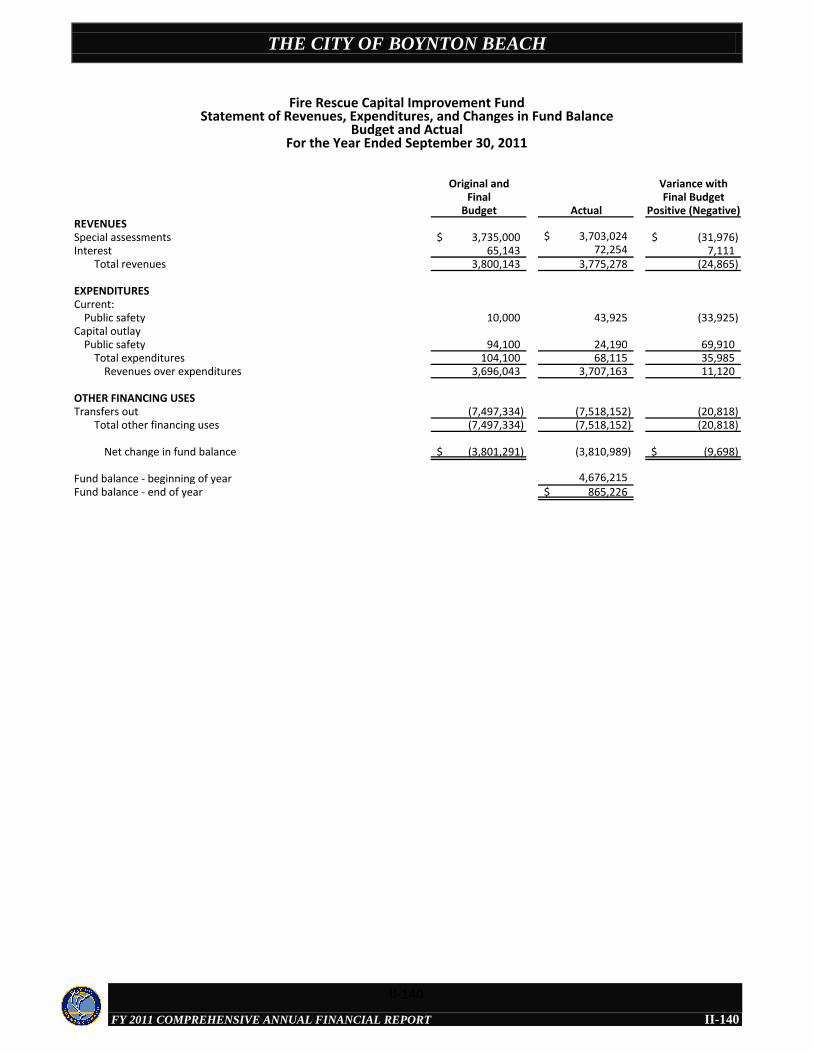
THE CITY OF BOYNTON BEACH
FY 2011 COMPREHENSIVE ANNUAL FINANCIAL REPORT
Original and Variance withFinal Final Budget
Budget Actual Positive (Negative)REVENUESSpecial assessments 3,735,000$ 3,703,024$ (31,976)$ Interest 65,143 72,254 7,111
Total revenues 3,800,143 3,775,278 (24,865)
EXPENDITURESCurrent:
Public safety 10,000 43,925 (33,925) Capital outlay
Public safety 94,100 24,190 69,910 Total expenditures 104,100 68,115 35,985
Revenues over expenditures 3,696,043 3,707,163 11,120
OTHER FINANCING USESTransfers out (7,497,334) (7,518,152) (20,818)
Total other financing uses (7,497,334) (7,518,152) (20,818)
Net change in fund balance (3,801,291)$ (3,810,989) (9,698)$
Fund balance - beginning of year 4,676,215 Fund balance - end of year 865,226$
Fire Rescue Capital Improvement FundStatement of Revenues, Expenditures, and Changes in Fund Balance
Budget and ActualFor the Year Ended September 30, 2011
II-140
II-140
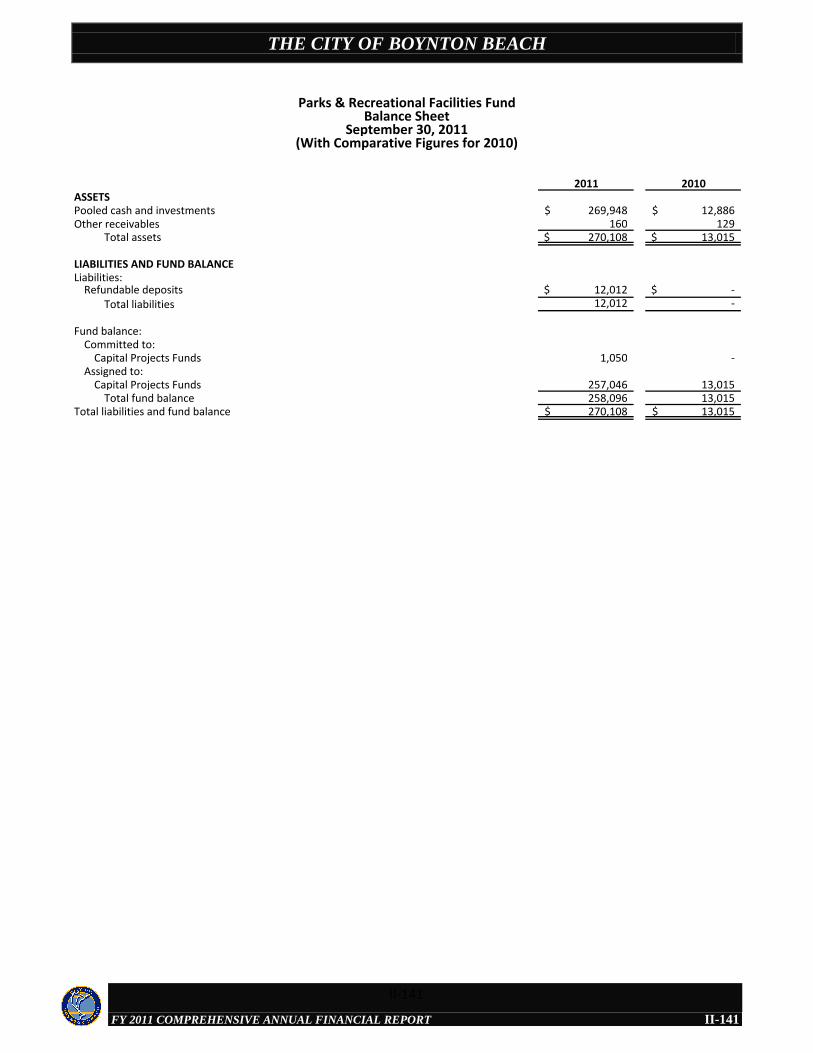
THE CITY OF BOYNTON BEACH
FY 2011 COMPREHENSIVE ANNUAL FINANCIAL REPORT
2011 2010ASSETSPooled cash and investments 269,948$ 12,886$ Other receivables 160 129
Total assets 270,108$ 13,015$
LIABILITIES AND FUND BALANCELiabilities:
Refundable deposits 12,012$ -$ Total liabilities 12,012 -
Fund balance:Committed to:
Capital Projects Funds 1,050 - Assigned to:
Capital Projects Funds 257,046 13,015Total fund balance 258,096 13,015
Total liabilities and fund balance 270,108$ 13,015$
Parks & Recreational Facilities FundBalance Sheet
September 30, 2011(With Comparative Figures for 2010)
II-141
II-141

THE CITY OF BOYNTON BEACH
FY 2011 COMPREHENSIVE ANNUAL FINANCIAL REPORT
2011 2010REVENUESCharges for services 243,140$ 4,254$ Interest 1,954 43,815
Total revenues 245,094 48,069
EXPENDITURESCurrent:
Physical environment 13 - Total expenditures 13 -
Revenues over expenditures 245,081 48,069
OTHER FINANCING USESTransfers out - (2,807,500)
Total other financing uses - (2,807,500)
Net change in fund balance 245,081 (2,759,431) Fund balance - beginning of year 13,015 2,772,446Fund balance - end of year 258,096$ 13,015$
Parks & Recreational Facilities FundStatement of Revenues, Expenditures, and Changes in Fund Balance
For the Year Ended September 30, 2011(With Comparative Figures for 2010)
II-142
II-142
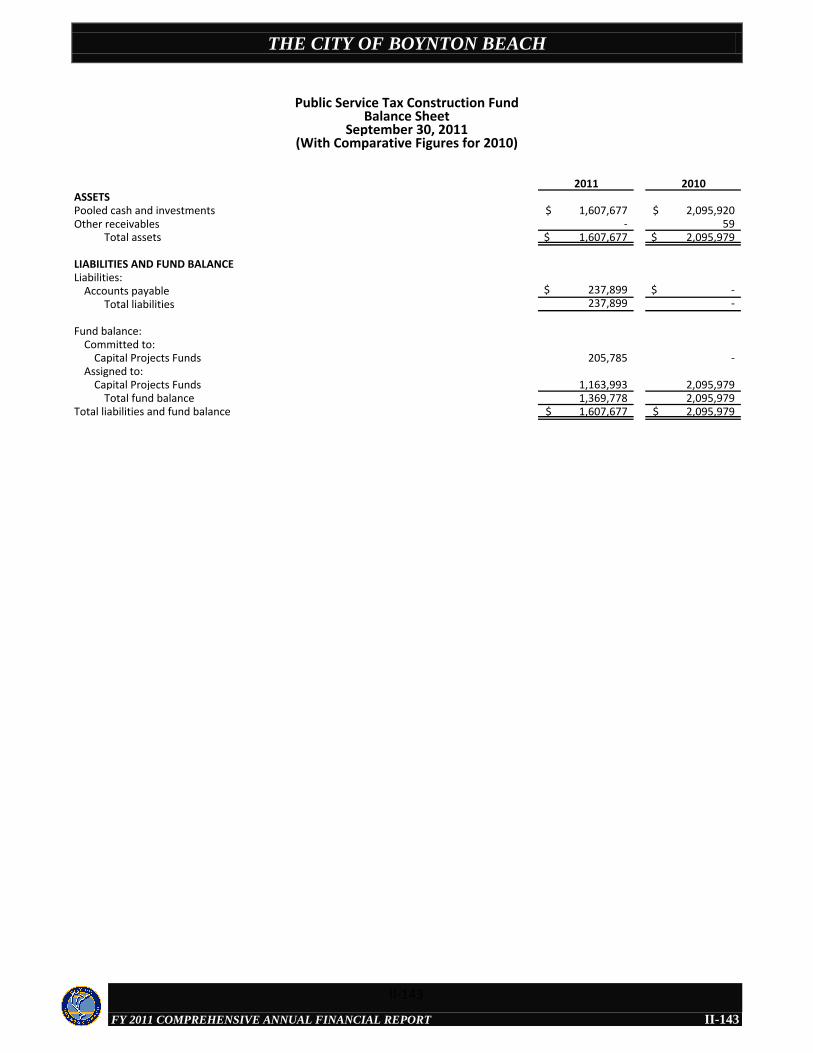
THE CITY OF BOYNTON BEACH
FY 2011 COMPREHENSIVE ANNUAL FINANCIAL REPORT
2011 2010ASSETSPooled cash and investments 1,607,677$ 2,095,920$ Other receivables - 59
Total assets 1,607,677$ 2,095,979$
LIABILITIES AND FUND BALANCELiabilities:
Accounts payable 237,899$ -$ Total liabilities 237,899 -
Fund balance:Committed to:
Capital Projects Funds 205,785 - Assigned to:
Capital Projects Funds 1,163,993 2,095,979Total fund balance 1,369,778 2,095,979
Total liabilities and fund balance 1,607,677$ 2,095,979$
Public Service Tax Construction FundBalance Sheet
September 30, 2011(With Comparative Figures for 2010)
II-143
II-143
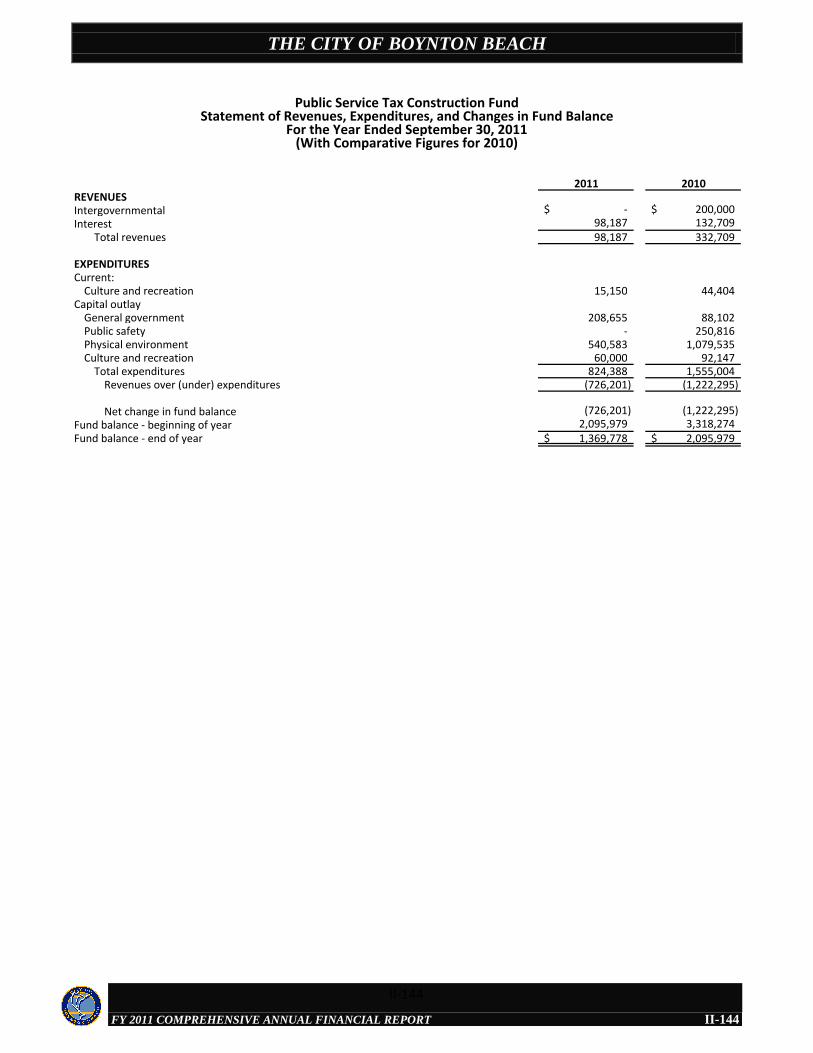
THE CITY OF BOYNTON BEACH
FY 2011 COMPREHENSIVE ANNUAL FINANCIAL REPORT
2011 2010REVENUESIntergovernmental -$ 200,000$ Interest 98,187 132,709
Total revenues 98,187 332,709
EXPENDITURESCurrent:
Culture and recreation 15,150 44,404 Capital outlay
General government 208,655 88,102 Public safety - 250,816 Physical environment 540,583 1,079,535 Culture and recreation 60,000 92,147
Total expenditures 824,388 1,555,004 Revenues over (under) expenditures (726,201) (1,222,295)
Net change in fund balance (726,201) (1,222,295) Fund balance - beginning of year 2,095,979 3,318,274Fund balance - end of year 1,369,778$ 2,095,979$
Public Service Tax Construction FundStatement of Revenues, Expenditures, and Changes in Fund Balance
For the Year Ended September 30, 2011(With Comparative Figures for 2010)
II-144
II-144
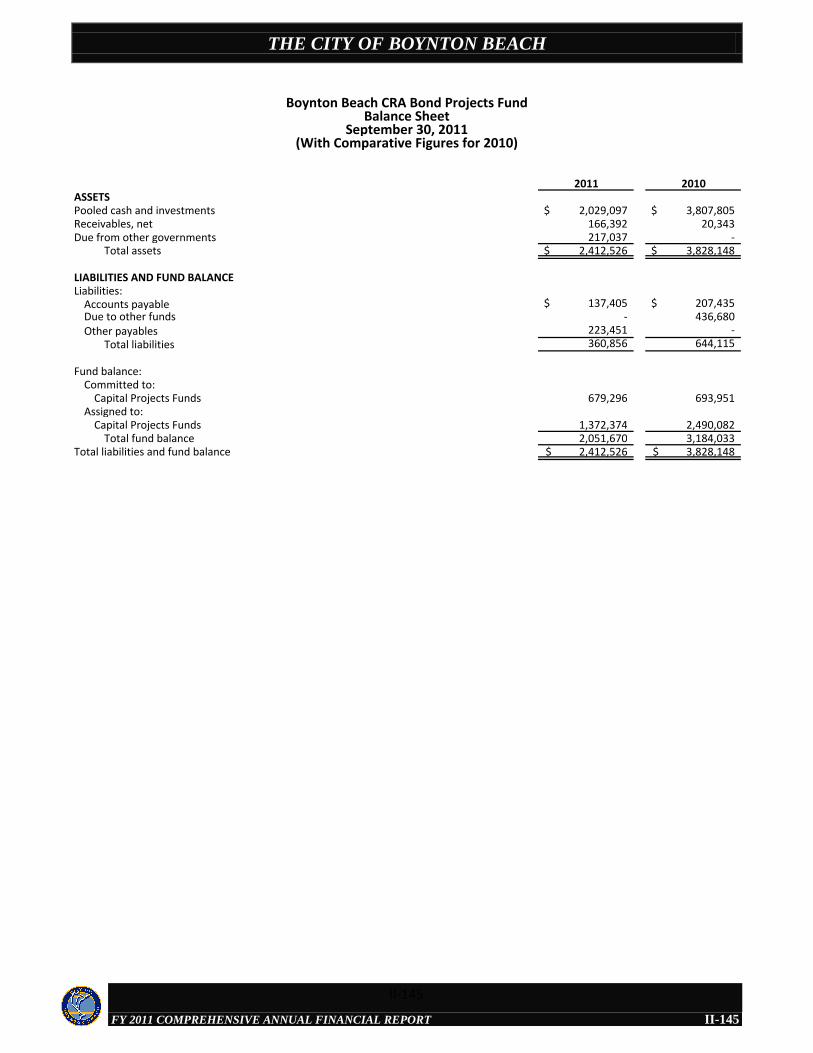
THE CITY OF BOYNTON BEACH
FY 2011 COMPREHENSIVE ANNUAL FINANCIAL REPORT
2011 2010ASSETSPooled cash and investments 2,029,097$ 3,807,805$ Receivables, net 166,392 20,343Due from other governments 217,037 -
Total assets 2,412,526$ 3,828,148$
LIABILITIES AND FUND BALANCELiabilities:
Accounts payable 137,405$ 207,435$ Due to other funds - 436,680Other payables 223,451 -
Total liabilities 360,856 644,115
Fund balance:Committed to:
Capital Projects Funds 679,296 693,951Assigned to:
Capital Projects Funds 1,372,374 2,490,082Total fund balance 2,051,670 3,184,033
Total liabilities and fund balance 2,412,526$ 3,828,148$
Boynton Beach CRA Bond Projects FundBalance Sheet
September 30, 2011(With Comparative Figures for 2010)
II-145
II-145
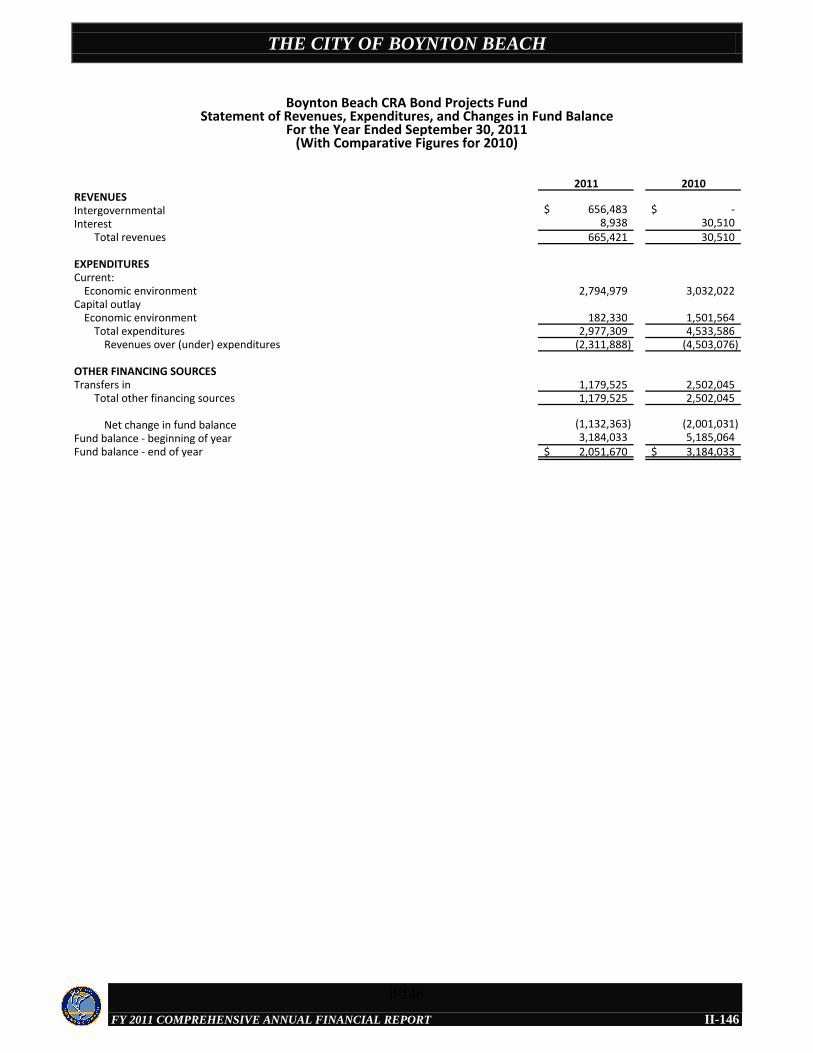
THE CITY OF BOYNTON BEACH
FY 2011 COMPREHENSIVE ANNUAL FINANCIAL REPORT
2011 2010REVENUESIntergovernmental 656,483$ -$ Interest 8,938 30,510
Total revenues 665,421 30,510
EXPENDITURESCurrent:
Economic environment 2,794,979 3,032,022Capital outlay
Economic environment 182,330 1,501,564Total expenditures 2,977,309 4,533,586
Revenues over (under) expenditures (2,311,888) (4,503,076)
OTHER FINANCING SOURCESTransfers in 1,179,525 2,502,045
Total other financing sources 1,179,525 2,502,045
Net change in fund balance (1,132,363) (2,001,031) Fund balance - beginning of year 3,184,033 5,185,064Fund balance - end of year 2,051,670$ 3,184,033$
Boynton Beach CRA Bond Projects FundStatement of Revenues, Expenditures, and Changes in Fund Balance
For the Year Ended September 30, 2011(With Comparative Figures for 2010)
II-146
II-146
THE CITY OF BOYNTON BEACH
FY 2011 COMPREHENSIVE ANNUAL FINANCIAL REPORT
II-147
NON-MAJOR ENTERPRISE FUNDS
Enterprise funds account for activities for which a fee is charged to external users for services or activities financed with debt that is secured solely by a pledge of the net revenues from fees of the activity.
Golf Course Fund: To account for operations of the City’s municipal golf course.
Mass Transit Fund: To account for the operations of the municipal public transportation program.
II-147
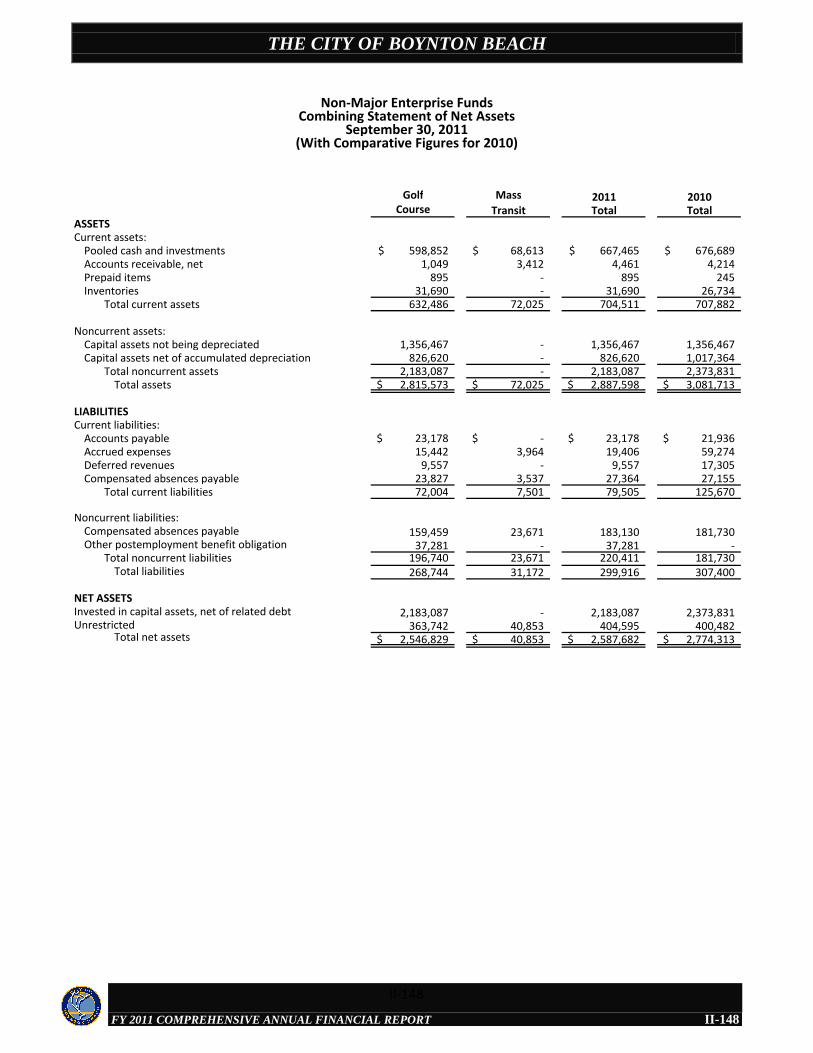
THE CITY OF BOYNTON BEACH
FY 2011 COMPREHENSIVE ANNUAL FINANCIAL REPORT
Golf Mass 2011 2010Course Transit Total Total
ASSETSCurrent assets:
Pooled cash and investments 598,852$ 68,613$ 667,465$ 676,689$ Accounts receivable, net 1,049 3,412 4,461 4,214 Prepaid items 895 - 895 245 Inventories 31,690 - 31,690 26,734
Total current assets 632,486 72,025 704,511 707,882
Noncurrent assets:Capital assets not being depreciated 1,356,467 - 1,356,467 1,356,467 Capital assets net of accumulated depreciation 826,620 - 826,620 1,017,364
Total noncurrent assets 2,183,087 - 2,183,087 2,373,831 Total assets 2,815,573$ 72,025$ 2,887,598$ 3,081,713$
LIABILITIESCurrent liabilities:
Accounts payable 23,178$ -$ 23,178$ 21,936$ Accrued expenses 15,442 3,964 19,406 59,274 Deferred revenues 9,557 - 9,557 17,305 Compensated absences payable 23,827 3,537 27,364 27,155
Total current liabilities 72,004 7,501 79,505 125,670
Noncurrent liabilities:Compensated absences payable 159,459 23,671 183,130 181,730 Other postemployment benefit obligation 37,281 - 37,281 -
Total noncurrent liabilities 196,740 23,671 220,411 181,730 Total liabilities 268,744 31,172 299,916 307,400
NET ASSETSInvested in capital assets, net of related debt 2,183,087 - 2,183,087 2,373,831 Unrestricted 363,742 40,853 404,595 400,482
Total net assets 2,546,829$ 40,853$ 2,587,682$ 2,774,313$
Non-Major Enterprise FundsCombining Statement of Net Assets
September 30, 2011(With Comparative Figures for 2010)
II-148
II-148
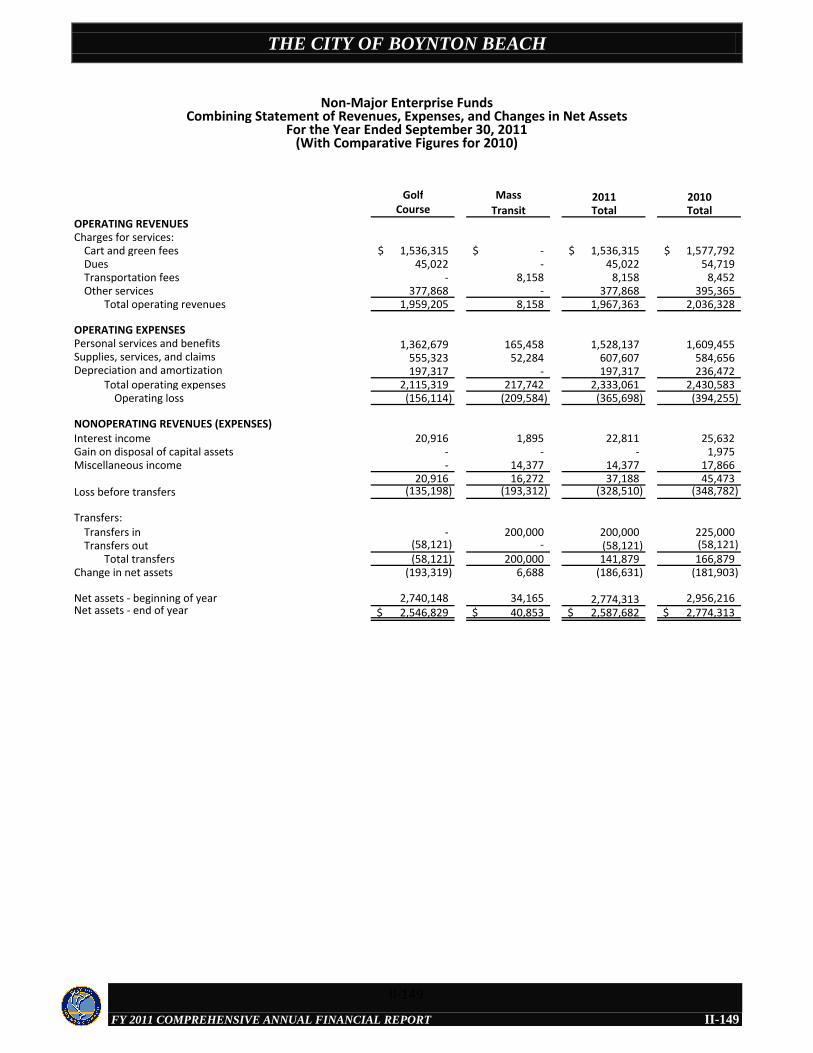
THE CITY OF BOYNTON BEACH
FY 2011 COMPREHENSIVE ANNUAL FINANCIAL REPORT
Golf Mass 2011 2010Course Transit Total Total
OPERATING REVENUESCharges for services:
Cart and green fees 1,536,315$ -$ 1,536,315$ 1,577,792$ Dues 45,022 - 45,022 54,719 Transportation fees - 8,158 8,158 8,452 Other services 377,868 - 377,868 395,365
Total operating revenues 1,959,205 8,158 1,967,363 2,036,328
OPERATING EXPENSESPersonal services and benefits 1,362,679 165,458 1,528,137 1,609,455 Supplies, services, and claims 555,323 52,284 607,607 584,656 Depreciation and amortization 197,317 - 197,317 236,472
Total operating expenses 2,115,319 217,742 2,333,061 2,430,583 Operating loss (156,114) (209,584) (365,698) (394,255)
NONOPERATING REVENUES (EXPENSES)Interest income 20,916 1,895 22,811 25,632 Gain on disposal of capital assets - - - 1,975 Miscellaneous income - 14,377 14,377 17,866
20,916 16,272 37,188 45,473 Loss before transfers (135,198) (193,312) (328,510) (348,782)
Transfers:Transfers in - 200,000 200,000 225,000 Transfers out (58,121) - (58,121) (58,121)
Total transfers (58,121) 200,000 141,879 166,879 Change in net assets (193,319) 6,688 (186,631) (181,903)
Net assets - beginning of year 2,740,148 34,165 2,774,313 2,956,216 Net assets - end of year 2,546,829$ 40,853$ 2,587,682$ 2,774,313$
Non-Major Enterprise FundsCombining Statement of Revenues, Expenses, and Changes in Net Assets
For the Year Ended September 30, 2011(With Comparative Figures for 2010)
II-149
II-149
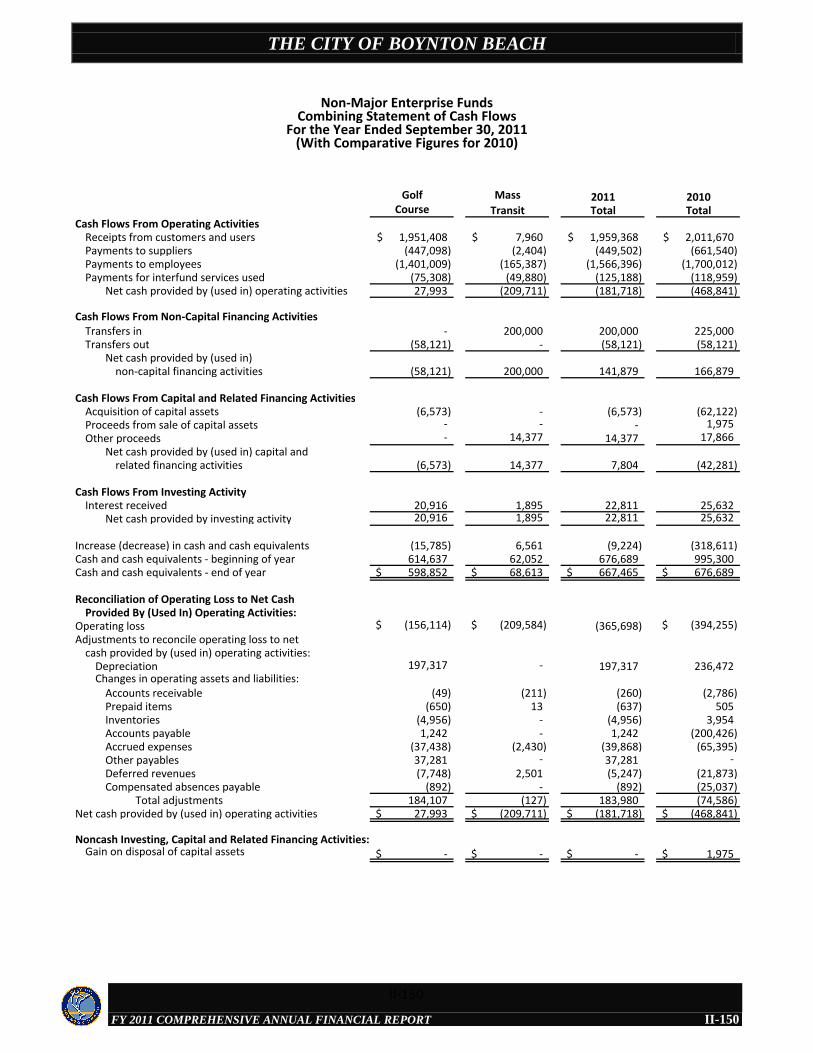
THE CITY OF BOYNTON BEACH
FY 2011 COMPREHENSIVE ANNUAL FINANCIAL REPORT
Golf Mass 2011 2010Course Transit Total Total
Cash Flows From Operating ActivitiesReceipts from customers and users 1,951,408$ 7,960$ 1,959,368$ 2,011,670$ Payments to suppliers (447,098) (2,404) (449,502) (661,540) Payments to employees (1,401,009) (165,387) (1,566,396) (1,700,012) Payments for interfund services used (75,308) (49,880) (125,188) (118,959)
Net cash provided by (used in) operating activities 27,993 (209,711) (181,718) (468,841)
Cash Flows From Non-Capital Financing ActivitiesTransfers in - 200,000 200,000 225,000 Transfers out (58,121) - (58,121) (58,121)
Net cash provided by (used in)non-capital financing activities (58,121) 200,000 141,879 166,879
Cash Flows From Capital and Related Financing ActivitiesAcquisition of capital assets (6,573) - (6,573) (62,122) Proceeds from sale of capital assets - - - 1,975 Other proceeds - 14,377 14,377 17,866
Net cash provided by (used in) capital andrelated financing activities (6,573) 14,377 7,804 (42,281)
Cash Flows From Investing ActivityInterest received 20,916 1,895 22,811 25,632
Net cash provided by investing activity 20,916 1,895 22,811 25,632
Increase (decrease) in cash and cash equivalents (15,785) 6,561 (9,224) (318,611) Cash and cash equivalents - beginning of year 614,637 62,052 676,689 995,300 Cash and cash equivalents - end of year 598,852$ 68,613$ 667,465$ 676,689$
Reconciliation of Operating Loss to Net Cash Provided By (Used In) Operating Activities:
Operating loss (156,114)$ (209,584)$ (365,698) (394,255)$ Adjustments to reconcile operating loss to net
cash provided by (used in) operating activities:Depreciation 197,317 - 197,317 236,472 Changes in operating assets and liabilities:
Accounts receivable (49) (211) (260) (2,786) Prepaid items (650) 13 (637) 505 Inventories (4,956) - (4,956) 3,954 Accounts payable 1,242 - 1,242 (200,426) Accrued expenses (37,438) (2,430) (39,868) (65,395) Other payables 37,281 - 37,281 - Deferred revenues (7,748) 2,501 (5,247) (21,873) Compensated absences payable (892) - (892) (25,037)
Total adjustments 184,107 (127) 183,980 (74,586) Net cash provided by (used in) operating activities 27,993$ (209,711)$ (181,718)$ (468,841)$
Noncash Investing, Capital and Related Financing Activities:Gain on disposal of capital assets -$ -$ -$ 1,975$
Non-Major Enterprise FundsCombining Statement of Cash Flows
For the Year Ended September 30, 2011(With Comparative Figures for 2010)
II-150
II-150
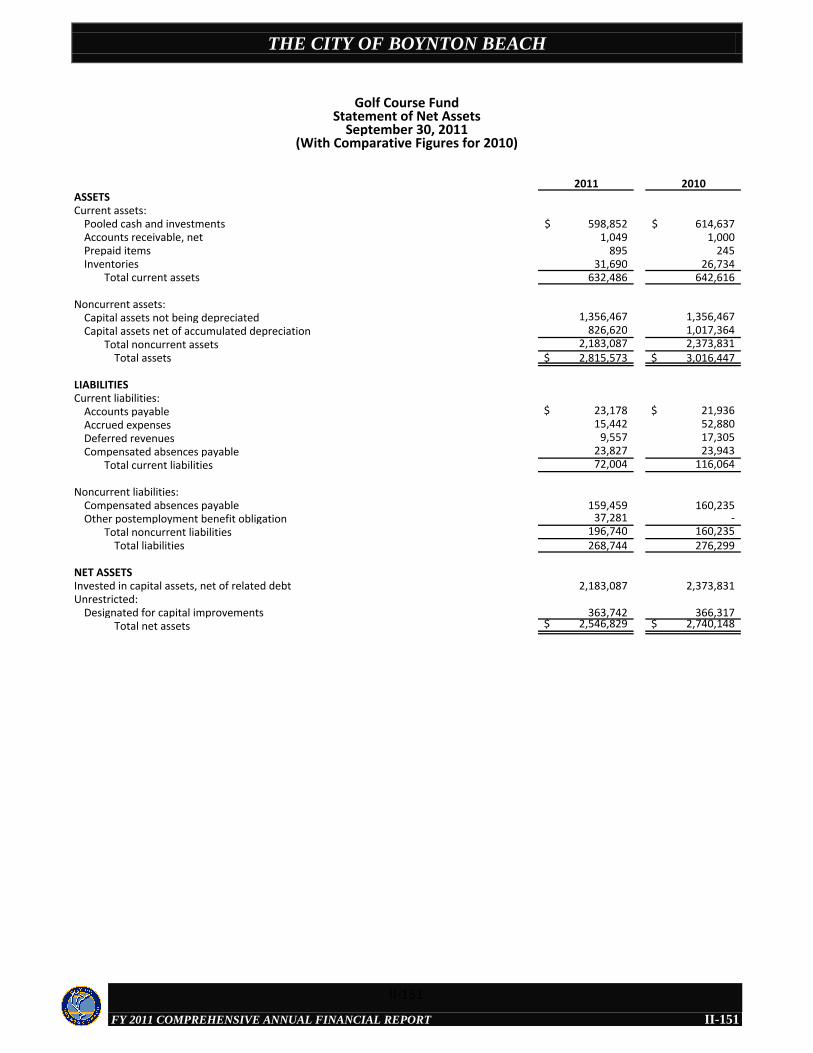
THE CITY OF BOYNTON BEACH
FY 2011 COMPREHENSIVE ANNUAL FINANCIAL REPORT
2011 2010ASSETSCurrent assets:
Pooled cash and investments 598,852$ 614,637$ Accounts receivable, net 1,049 1,000Prepaid items 895 245Inventories 31,690 26,734
Total current assets 632,486 642,616
Noncurrent assets:Capital assets not being depreciated 1,356,467 1,356,467Capital assets net of accumulated depreciation 826,620 1,017,364
Total noncurrent assets 2,183,087 2,373,831 Total assets 2,815,573$ 3,016,447$
LIABILITIESCurrent liabilities:
Accounts payable 23,178$ 21,936$ Accrued expenses 15,442 52,880Deferred revenues 9,557 17,305Compensated absences payable 23,827 23,943
Total current liabilities 72,004 116,064
Noncurrent liabilities:Compensated absences payable 159,459 160,235Other postemployment benefit obligation 37,281 -
Total noncurrent liabilities 196,740 160,235Total liabilities 268,744 276,299
NET ASSETSInvested in capital assets, net of related debt 2,183,087 2,373,831Unrestricted:
Designated for capital improvements 363,742 366,317Total net assets 2,546,829$ 2,740,148$
Golf Course FundStatement of Net Assets
September 30, 2011(With Comparative Figures for 2010)
II-151
II-151
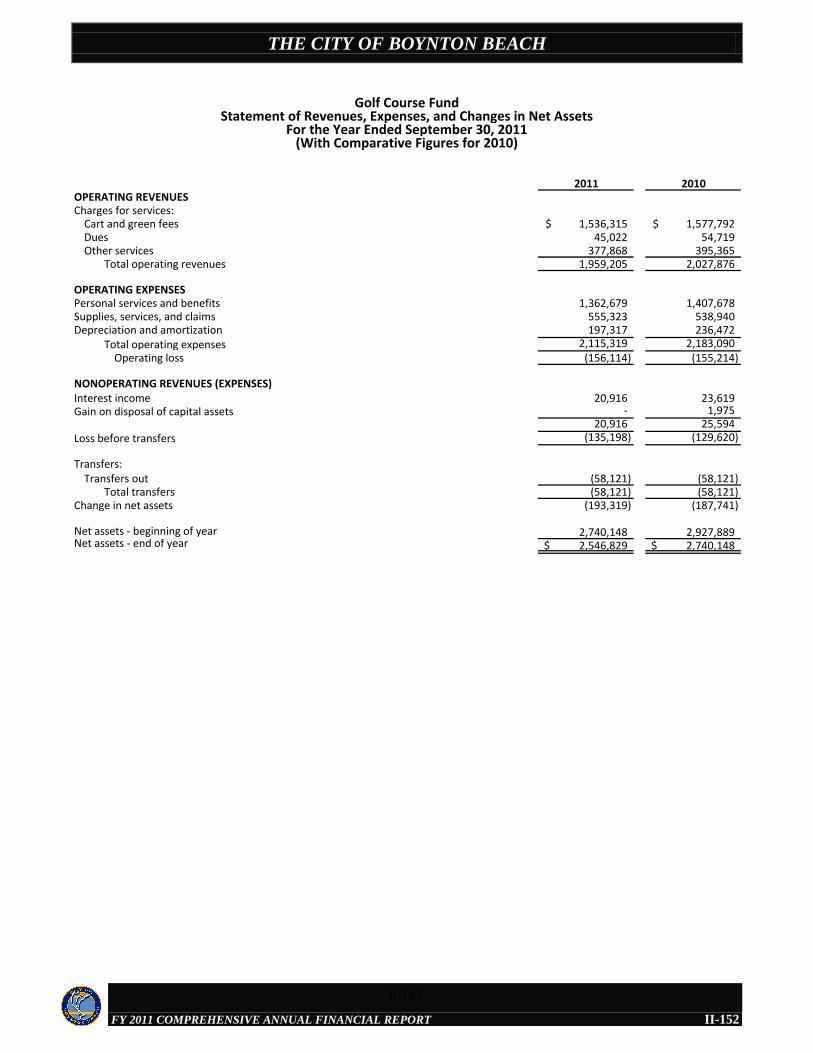
THE CITY OF BOYNTON BEACH
FY 2011 COMPREHENSIVE ANNUAL FINANCIAL REPORT
2011 2010OPERATING REVENUESCharges for services:
Cart and green fees 1,536,315$ 1,577,792$ Dues 45,022 54,719Other services 377,868 395,365
Total operating revenues 1,959,205 2,027,876
OPERATING EXPENSESPersonal services and benefits 1,362,679 1,407,678Supplies, services, and claims 555,323 538,940Depreciation and amortization 197,317 236,472
Total operating expenses 2,115,319 2,183,090 Operating loss (156,114) (155,214)
NONOPERATING REVENUES (EXPENSES)Interest income 20,916 23,619Gain on disposal of capital assets - 1,975
20,916 25,594 Loss before transfers (135,198) (129,620)
Transfers:Transfers out (58,121) (58,121)
Total transfers (58,121) (58,121) Change in net assets (193,319) (187,741)
Net assets - beginning of year 2,740,148 2,927,889 Net assets - end of year 2,546,829$ 2,740,148$
Golf Course FundStatement of Revenues, Expenses, and Changes in Net Assets
For the Year Ended September 30, 2011(With Comparative Figures for 2010)
II-152
II-152
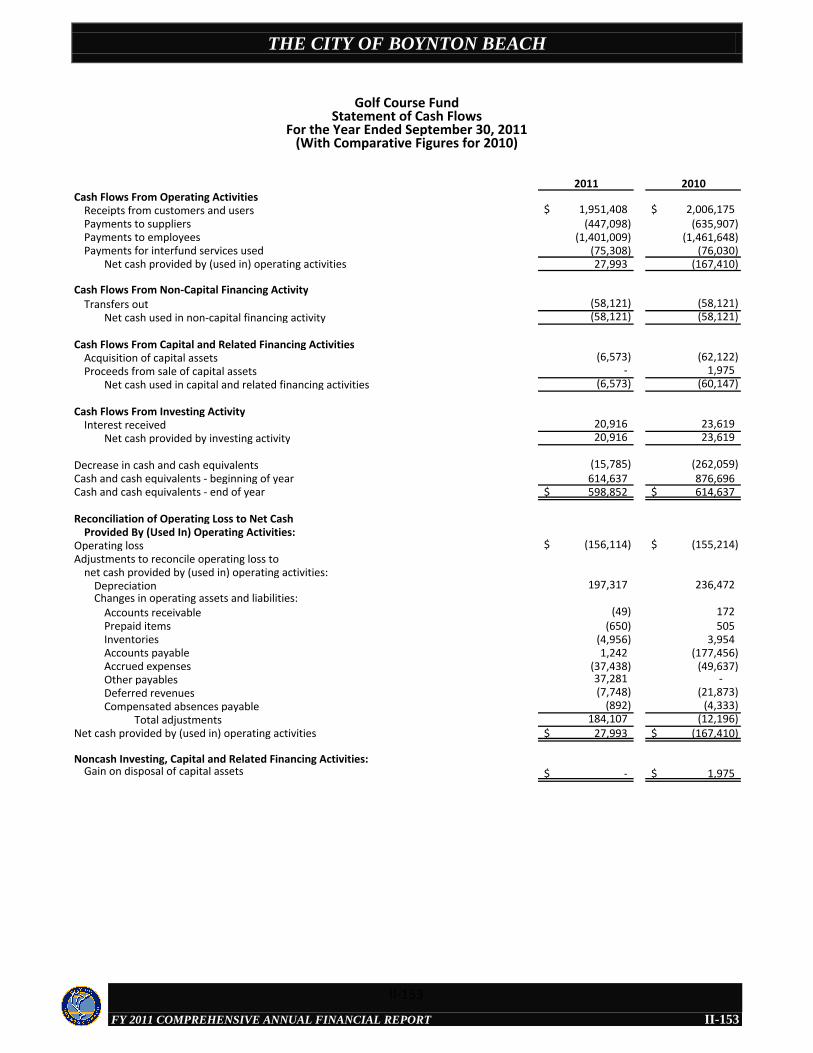
THE CITY OF BOYNTON BEACH
FY 2011 COMPREHENSIVE ANNUAL FINANCIAL REPORT
2011 2010Cash Flows From Operating Activities
Receipts from customers and users 1,951,408$ 2,006,175$ Payments to suppliers (447,098) (635,907) Payments to employees (1,401,009) (1,461,648) Payments for interfund services used (75,308) (76,030)
Net cash provided by (used in) operating activities 27,993 (167,410)
Cash Flows From Non-Capital Financing ActivityTransfers out (58,121) (58,121)
Net cash used in non-capital financing activity (58,121) (58,121)
Cash Flows From Capital and Related Financing ActivitiesAcquisition of capital assets (6,573) (62,122) Proceeds from sale of capital assets - 1,975
Net cash used in capital and related financing activities (6,573) (60,147)
Cash Flows From Investing ActivityInterest received 20,916 23,619
Net cash provided by investing activity 20,916 23,619
Decrease in cash and cash equivalents (15,785) (262,059) Cash and cash equivalents - beginning of year 614,637 876,696 Cash and cash equivalents - end of year 598,852$ 614,637$
Reconciliation of Operating Loss to Net Cash Provided By (Used In) Operating Activities:
Operating loss (156,114)$ (155,214)$ Adjustments to reconcile operating loss to
net cash provided by (used in) operating activities:Depreciation 197,317 236,472 Changes in operating assets and liabilities:
Accounts receivable (49) 172 Prepaid items (650) 505 Inventories (4,956) 3,954 Accounts payable 1,242 (177,456) Accrued expenses (37,438) (49,637) Other payables 37,281 - Deferred revenues (7,748) (21,873) Compensated absences payable (892) (4,333)
Total adjustments 184,107 (12,196) Net cash provided by (used in) operating activities 27,993$ (167,410)$
Noncash Investing, Capital and Related Financing Activities:Gain on disposal of capital assets -$ 1,975$
Golf Course FundStatement of Cash Flows
For the Year Ended September 30, 2011(With Comparative Figures for 2010)
II-153
II-153

THE CITY OF BOYNTON BEACH
FY 2011 COMPREHENSIVE ANNUAL FINANCIAL REPORT
2011 2010ASSETSCurrent assets:
Pooled cash and investments 68,613$ 62,052$ Accounts receivable, net 3,412 3,201Other receivables - 13
Total current assets 72,025 65,266 Total assets 72,025$ 65,266$
LIABILITIESCurrent liabilities:
Accrued expenses 3,964$ 6,394$ Compensated absences payable 3,537 3,212
Total current liabilities 7,501 9,606
Noncurrent liabilities:Compensated absences payable 23,671 21,495
Total noncurrent liabilities 23,671 21,495 Total liabilities 31,172 31,101
NET ASSETSUnrestricted 40,853 34,165
Total net assets 40,853$ 34,165$
Mass Transit FundStatement of Net Assets
September 30, 2011(With Comparative Figures for 2010)
II-154
II-154
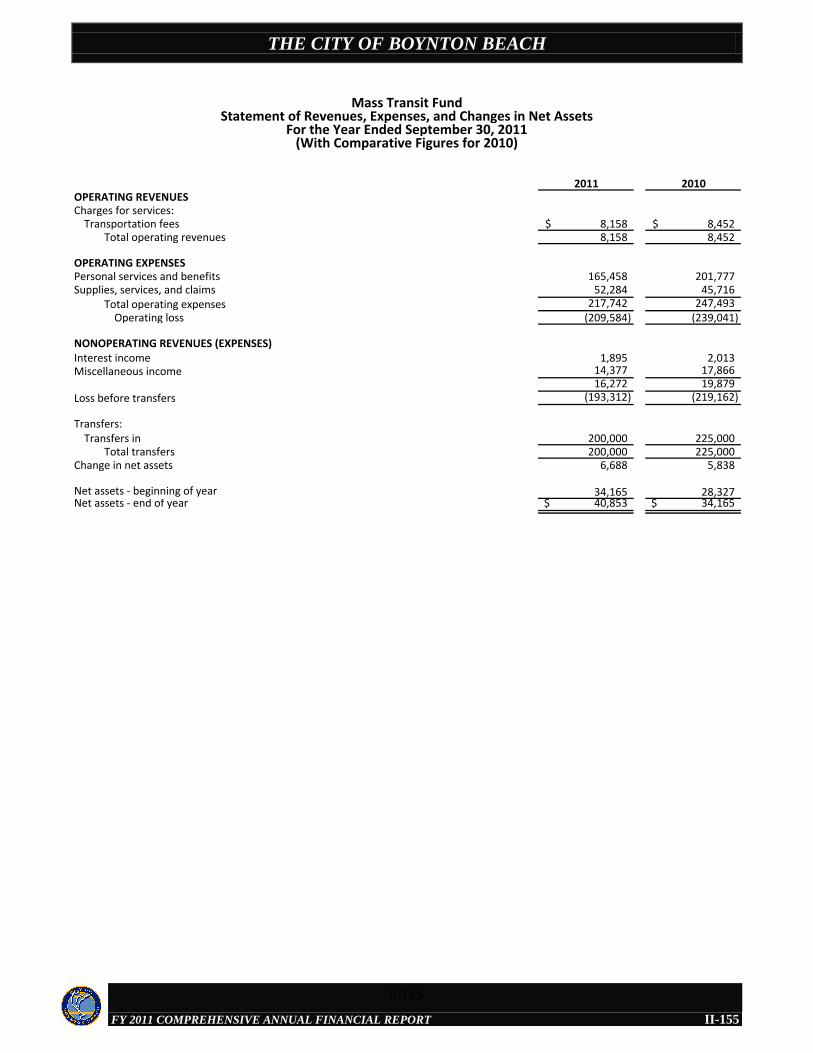
THE CITY OF BOYNTON BEACH
FY 2011 COMPREHENSIVE ANNUAL FINANCIAL REPORT
2011 2010OPERATING REVENUESCharges for services:
Transportation fees 8,158$ 8,452$ Total operating revenues 8,158 8,452
OPERATING EXPENSESPersonal services and benefits 165,458 201,777Supplies, services, and claims 52,284 45,716
Total operating expenses 217,742 247,493 Operating loss (209,584) (239,041)
NONOPERATING REVENUES (EXPENSES)Interest income 1,895 2,013Miscellaneous income 14,377 17,866
16,272 19,879 Loss before transfers (193,312) (219,162)
Transfers:Transfers in 200,000 225,000
Total transfers 200,000 225,000 Change in net assets 6,688 5,838
Net assets - beginning of year 34,165 28,327Net assets - end of year 40,853$ 34,165$
Mass Transit FundStatement of Revenues, Expenses, and Changes in Net Assets
For the Year Ended September 30, 2011(With Comparative Figures for 2010)
II-155
II-155
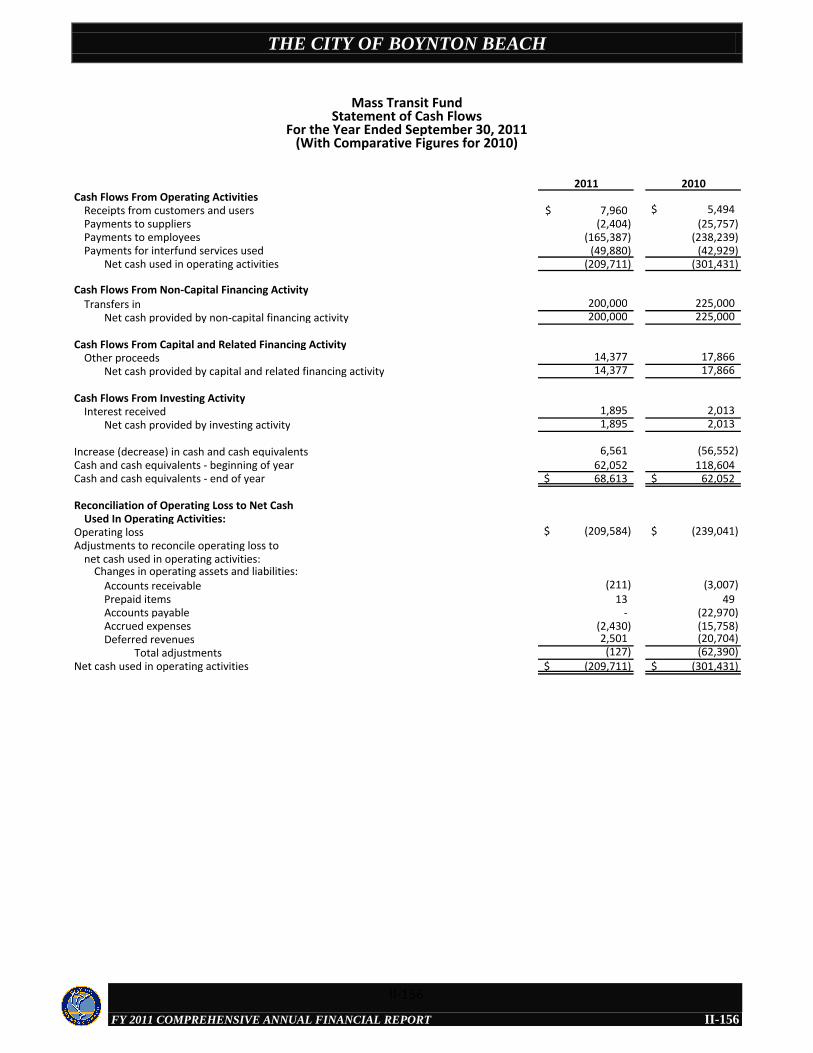
THE CITY OF BOYNTON BEACH
FY 2011 COMPREHENSIVE ANNUAL FINANCIAL REPORT
2011 2010Cash Flows From Operating Activities
Receipts from customers and users 7,960$ 5,494$ Payments to suppliers (2,404) (25,757) Payments to employees (165,387) (238,239) Payments for interfund services used (49,880) (42,929)
Net cash used in operating activities (209,711) (301,431)
Cash Flows From Non-Capital Financing ActivityTransfers in 200,000 225,000
Net cash provided by non-capital financing activity 200,000 225,000
Cash Flows From Capital and Related Financing ActivityOther proceeds 14,377 17,866
Net cash provided by capital and related financing activity 14,377 17,866
Cash Flows From Investing ActivityInterest received 1,895 2,013
Net cash provided by investing activity 1,895 2,013
Increase (decrease) in cash and cash equivalents 6,561 (56,552) Cash and cash equivalents - beginning of year 62,052 118,604 Cash and cash equivalents - end of year 68,613$ 62,052$
Reconciliation of Operating Loss to Net Cash Used In Operating Activities:
Operating loss (209,584)$ (239,041)$ Adjustments to reconcile operating loss to
net cash used in operating activities:Changes in operating assets and liabilities:
Accounts receivable (211) (3,007) Prepaid items 13 49 Accounts payable - (22,970) Accrued expenses (2,430) (15,758) Deferred revenues 2,501 (20,704)
Total adjustments (127) (62,390) Net cash used in operating activities (209,711)$ (301,431)$
Mass Transit FundStatement of Cash Flows
For the Year Ended September 30, 2011(With Comparative Figures for 2010)
II-156
II-156
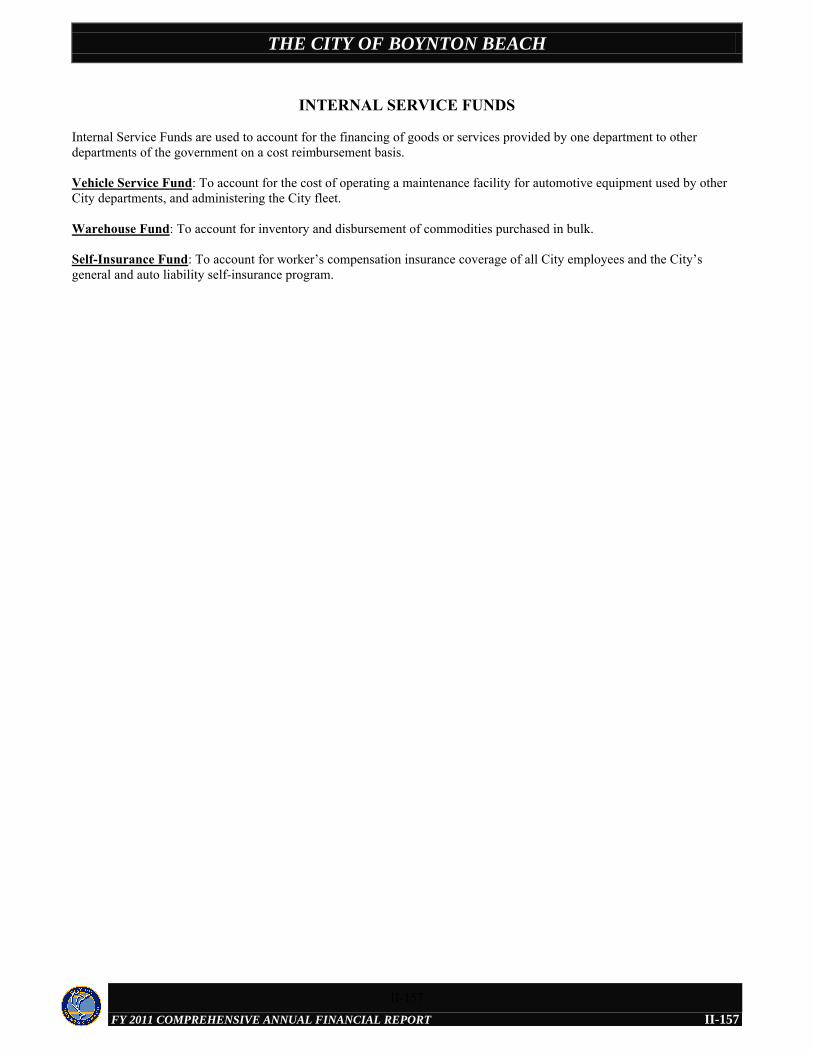
THE CITY OF BOYNTON BEACH
FY 2011 COMPREHENSIVE ANNUAL FINANCIAL REPORT
II-157
INTERNAL SERVICE FUNDS
Internal Service Funds are used to account for the financing of goods or services provided by one department to other departments of the government on a cost reimbursement basis.
Vehicle Service Fund: To account for the cost of operating a maintenance facility for automotive equipment used by other City departments, and administering the City fleet.
Warehouse Fund: To account for inventory and disbursement of commodities purchased in bulk.
Self-Insurance Fund: To account for worker’s compensation insurance coverage of all City employees and the City’s general and auto liability self-insurance program.
II-157
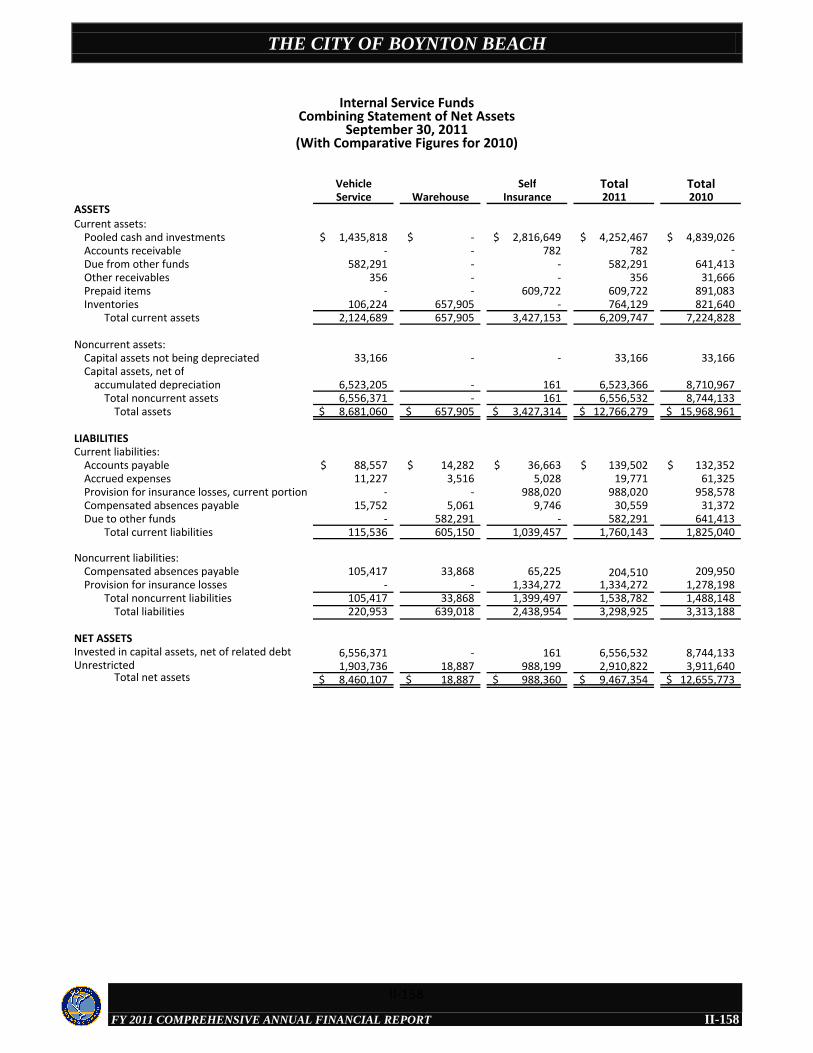
THE CITY OF BOYNTON BEACH
FY 2011 COMPREHENSIVE ANNUAL FINANCIAL REPORT
Vehicle Self Total TotalService Warehouse Insurance 2011 2010
ASSETSCurrent assets:
Pooled cash and investments 1,435,818$ -$ 2,816,649$ 4,252,467$ 4,839,026$ Accounts receivable - - 782 782 - Due from other funds 582,291 - - 582,291 641,413 Other receivables 356 - - 356 31,666 Prepaid items - - 609,722 609,722 891,083 Inventories 106,224 657,905 - 764,129 821,640
Total current assets 2,124,689 657,905 3,427,153 6,209,747 7,224,828
Noncurrent assets:Capital assets not being depreciated 33,166 - - 33,166 33,166 Capital assets, net of
accumulated depreciation 6,523,205 - 161 6,523,366 8,710,967 Total noncurrent assets 6,556,371 - 161 6,556,532 8,744,133
Total assets 8,681,060$ 657,905$ 3,427,314$ 12,766,279$ 15,968,961$
LIABILITIESCurrent liabilities:
Accounts payable 88,557$ 14,282$ 36,663$ 139,502$ 132,352$ Accrued expenses 11,227 3,516 5,028 19,771 61,325 Provision for insurance losses, current portion - - 988,020 988,020 958,578 Compensated absences payable 15,752 5,061 9,746 30,559 31,372 Due to other funds - 582,291 - 582,291 641,413
Total current liabilities 115,536 605,150 1,039,457 1,760,143 1,825,040
Noncurrent liabilities:Compensated absences payable 105,417 33,868 65,225 204,510 209,950 Provision for insurance losses - - 1,334,272 1,334,272 1,278,198
Total noncurrent liabilities 105,417 33,868 1,399,497 1,538,782 1,488,148 Total liabilities 220,953 639,018 2,438,954 3,298,925 3,313,188
NET ASSETSInvested in capital assets, net of related debt 6,556,371 - 161 6,556,532 8,744,133 Unrestricted 1,903,736 18,887 988,199 2,910,822 3,911,640
Total net assets 8,460,107$ 18,887$ 988,360$ 9,467,354$ 12,655,773$
Internal Service FundsCombining Statement of Net Assets
September 30, 2011(With Comparative Figures for 2010)
II-158
II-158
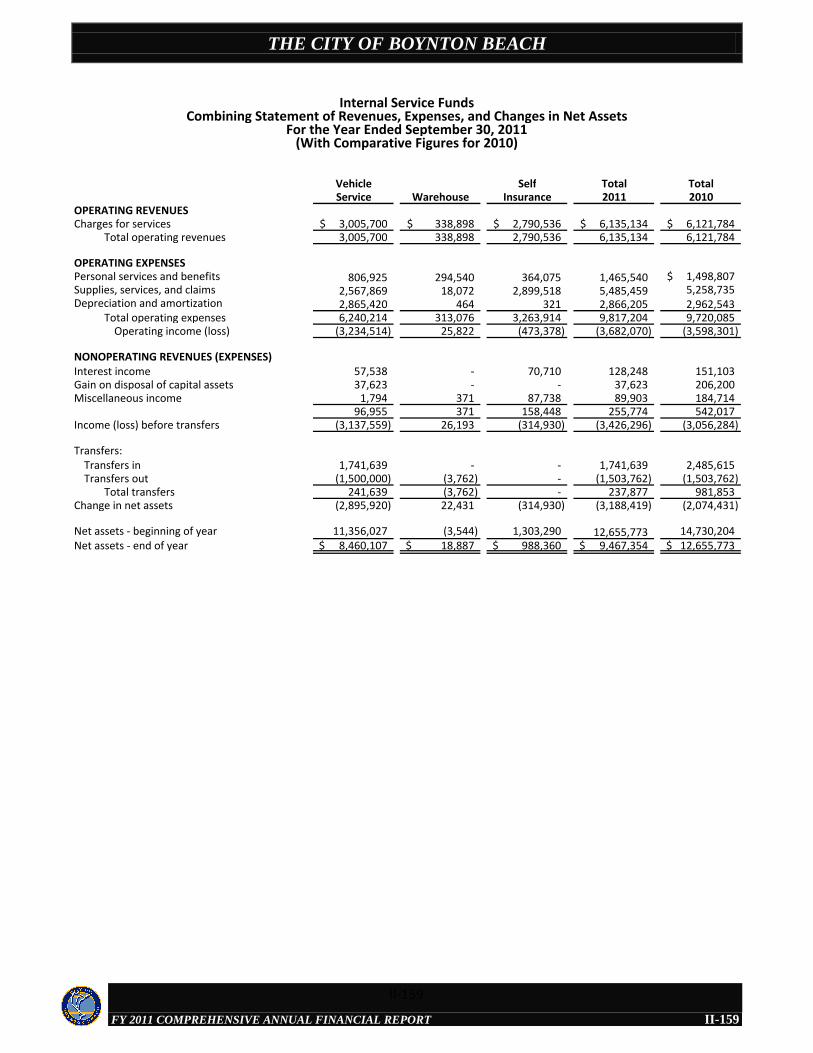
THE CITY OF BOYNTON BEACH
FY 2011 COMPREHENSIVE ANNUAL FINANCIAL REPORT
Vehicle Self Total TotalService Warehouse Insurance 2011 2010
OPERATING REVENUESCharges for services 3,005,700$ 338,898$ 2,790,536$ 6,135,134$ 6,121,784$
Total operating revenues 3,005,700 338,898 2,790,536 6,135,134 6,121,784
OPERATING EXPENSESPersonal services and benefits 806,925 294,540 364,075 1,465,540 1,498,807$ Supplies, services, and claims 2,567,869 18,072 2,899,518 5,485,459 5,258,735 Depreciation and amortization 2,865,420 464 321 2,866,205 2,962,543
Total operating expenses 6,240,214 313,076 3,263,914 9,817,204 9,720,085 Operating income (loss) (3,234,514) 25,822 (473,378) (3,682,070) (3,598,301)
NONOPERATING REVENUES (EXPENSES)Interest income 57,538 - 70,710 128,248 151,103 Gain on disposal of capital assets 37,623 - - 37,623 206,200 Miscellaneous income 1,794 371 87,738 89,903 184,714
96,955 371 158,448 255,774 542,017 Income (loss) before transfers (3,137,559) 26,193 (314,930) (3,426,296) (3,056,284)
Transfers:Transfers in 1,741,639 - - 1,741,639 2,485,615 Transfers out (1,500,000) (3,762) - (1,503,762) (1,503,762)
Total transfers 241,639 (3,762) - 237,877 981,853 Change in net assets (2,895,920) 22,431 (314,930) (3,188,419) (2,074,431)
Net assets - beginning of year 11,356,027 (3,544) 1,303,290 12,655,773 14,730,204 Net assets - end of year 8,460,107$ 18,887$ 988,360$ 9,467,354$ 12,655,773$
Internal Service FundsCombining Statement of Revenues, Expenses, and Changes in Net Assets
For the Year Ended September 30, 2011(With Comparative Figures for 2010)
II-159
II-159
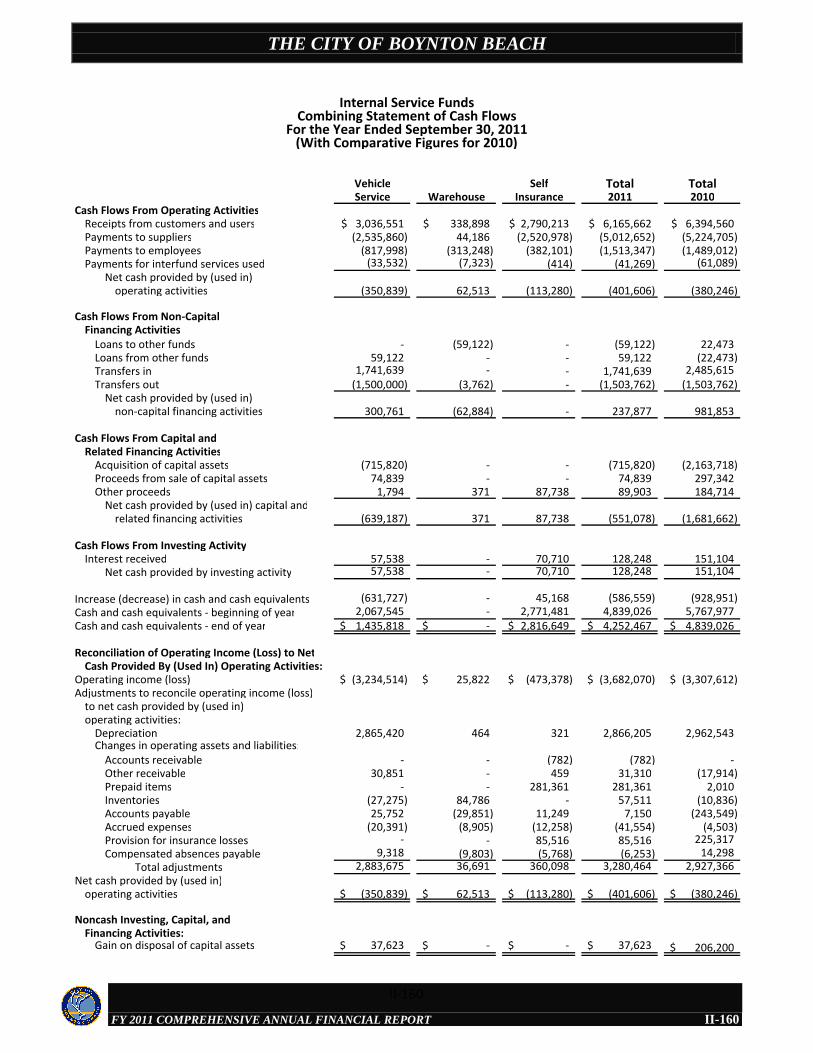
THE CITY OF BOYNTON BEACH
FY 2011 COMPREHENSIVE ANNUAL FINANCIAL REPORT
Vehicle Self Total TotalService Warehouse Insurance 2011 2010
Cash Flows From Operating Activities
Receipts from customers and users 3,036,551$ 338,898$ 2,790,213$ 6,165,662$ 6,394,560$ Payments to suppliers (2,535,860) 44,186 (2,520,978) (5,012,652) (5,224,705) Payments to employees (817,998) (313,248) (382,101) (1,513,347) (1,489,012) Payments for interfund services used (33,532) (7,323) (414) (41,269) (61,089)
Net cash provided by (used in)operating activities (350,839) 62,513 (113,280) (401,606) (380,246)
Cash Flows From Non-Capital
Financing Activities
Loans to other funds - (59,122) - (59,122) 22,473 Loans from other funds 59,122 - - 59,122 (22,473) Transfers in 1,741,639 - - 1,741,639 2,485,615
Transfers out (1,500,000) (3,762) - (1,503,762) (1,503,762) Net cash provided by (used in)
non-capital financing activities 300,761 (62,884) - 237,877 981,853
Cash Flows From Capital and
Related Financing Activities
Acquisition of capital assets (715,820) - - (715,820) (2,163,718) Proceeds from sale of capital assets 74,839 - - 74,839 297,342 Other proceeds 1,794 371 87,738 89,903 184,714
Net cash provided by (used in) capital andrelated financing activities (639,187) 371 87,738 (551,078) (1,681,662)
Cash Flows From Investing Activity
Interest received 57,538 - 70,710 128,248 151,104 Net cash provided by investing activity 57,538 - 70,710 128,248 151,104
Increase (decrease) in cash and cash equivalents (631,727) - 45,168 (586,559) (928,951)
Cash and cash equivalents - beginning of year 2,067,545 - 2,771,481 4,839,026 5,767,977
Cash and cash equivalents - end of year 1,435,818$ -$ 2,816,649$ 4,252,467$ 4,839,026$
Reconciliation of Operating Income (Loss) to Net
Cash Provided By (Used In) Operating Activities:
Operating income (loss) (3,234,514)$ 25,822$ (473,378)$ (3,682,070)$ (3,307,612)$ Adjustments to reconcile operating income (loss)
to net cash provided by (used in)operating activities:
Depreciation 2,865,420 464 321 2,866,205 2,962,543 Changes in operating assets and liabilities:
Accounts receivable - - (782) (782) - Other receivable 30,851 - 459 31,310 (17,914) Prepaid items - - 281,361 281,361 2,010 Inventories (27,275) 84,786 - 57,511 (10,836) Accounts payable 25,752 (29,851) 11,249 7,150 (243,549) Accrued expenses (20,391) (8,905) (12,258) (41,554) (4,503) Provision for insurance losses - - 85,516 85,516 225,317
Compensated absences payable 9,318 (9,803) (5,768) (6,253) 14,298
Total adjustments 2,883,675 36,691 360,098 3,280,464 2,927,366
Net cash provided by (used in)operating activities (350,839)$ 62,513$ (113,280)$ (401,606)$ (380,246)$
Noncash Investing, Capital, and
Financing Activities:Gain on disposal of capital assets 37,623$ -$ -$ 37,623$ 206,200$
Internal Service FundsCombining Statement of Cash Flows
For the Year Ended September 30, 2011(With Comparative Figures for 2010)
II-160
II-160

THE CITY OF BOYNTON BEACH
FY 2011 COMPREHENSIVE ANNUAL FINANCIAL REPORT
2011 2010ASSETSCurrent assets:
Pooled cash and investments 1,435,818$ 2,067,545$ Due from other funds 582,291 641,413 Other receivables 356 31,207 Prepaid items - - Inventories 106,224 78,949
Total current assets 2,124,689 2,819,114
Noncurrent assets:Capital assets not being depreciated 33,166 33,166Capital assets, net of accumulated depreciation 6,523,205 8,710,021
Total noncurrent assets 6,556,371 8,743,187 Total assets 8,681,060$ 11,562,301$
LIABILITIESCurrent liabilities:
Accounts payable 88,557$ 62,805$ Accrued expenses 11,227 31,618Compensated absences payable 15,752 14,541
Total current liabilities 115,536 108,964
Noncurrent liabilities:Compensated absences payable 105,417 97,310
Total noncurrent liabilities 105,417 97,310 Total liabilities 220,953 206,274
NET ASSETSInvested in capital assets, net of related debt 6,556,371 8,743,187Unrestricted 1,903,736 2,612,840
Total net assets 8,460,107$ 11,356,027$
Vehicle Service FundStatement of Net Assets
September 30, 2011(With Comparative Figures for 2010)
II-161
II-161
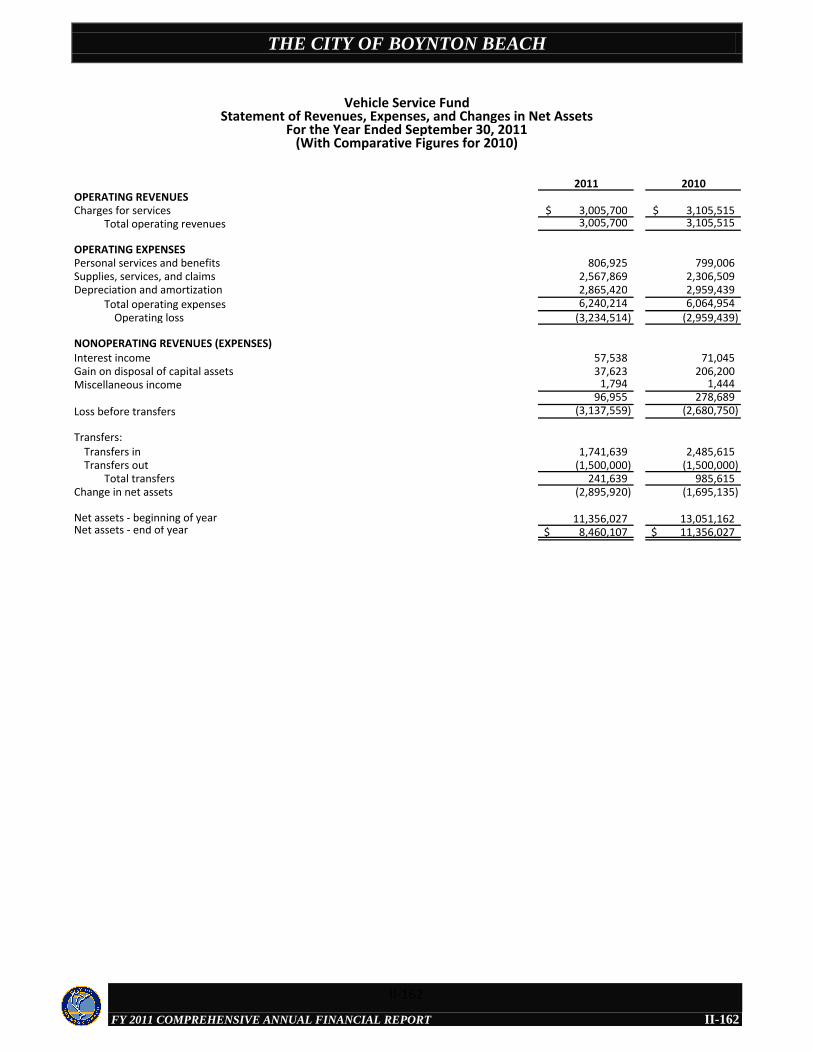
THE CITY OF BOYNTON BEACH
FY 2011 COMPREHENSIVE ANNUAL FINANCIAL REPORT
2011 2010OPERATING REVENUESCharges for services 3,005,700$ 3,105,515$
Total operating revenues 3,005,700 3,105,515
OPERATING EXPENSESPersonal services and benefits 806,925 799,006Supplies, services, and claims 2,567,869 2,306,509Depreciation and amortization 2,865,420 2,959,439
Total operating expenses 6,240,214 6,064,954 Operating loss (3,234,514) (2,959,439)
NONOPERATING REVENUES (EXPENSES)Interest income 57,538 71,045Gain on disposal of capital assets 37,623 206,200Miscellaneous income 1,794 1,444
96,955 278,689 Loss before transfers (3,137,559) (2,680,750)
Transfers:Transfers in 1,741,639 2,485,615Transfers out (1,500,000) (1,500,000)
Total transfers 241,639 985,615 Change in net assets (2,895,920) (1,695,135)
Net assets - beginning of year 11,356,027 13,051,162Net assets - end of year 8,460,107$ 11,356,027$
Vehicle Service FundStatement of Revenues, Expenses, and Changes in Net Assets
For the Year Ended September 30, 2011(With Comparative Figures for 2010)
II-162
II-162
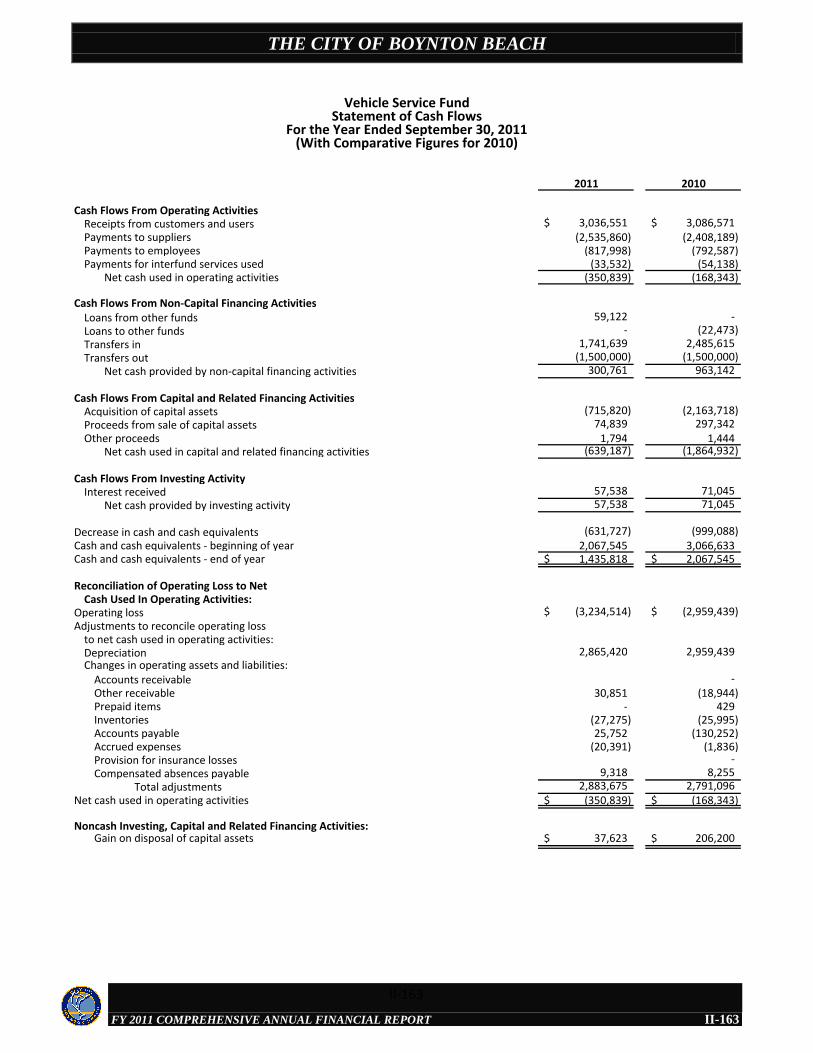
THE CITY OF BOYNTON BEACH
FY 2011 COMPREHENSIVE ANNUAL FINANCIAL REPORT
2011 2010
Cash Flows From Operating ActivitiesReceipts from customers and users 3,036,551$ 3,086,571$ Payments to suppliers (2,535,860) (2,408,189) Payments to employees (817,998) (792,587) Payments for interfund services used (33,532) (54,138)
Net cash used in operating activities (350,839) (168,343)
Cash Flows From Non-Capital Financing ActivitiesLoans from other funds 59,122 - Loans to other funds - (22,473) Transfers in 1,741,639 2,485,615 Transfers out (1,500,000) (1,500,000)
Net cash provided by non-capital financing activities 300,761 963,142
Cash Flows From Capital and Related Financing ActivitiesAcquisition of capital assets (715,820) (2,163,718) Proceeds from sale of capital assets 74,839 297,342 Other proceeds 1,794 1,444
Net cash used in capital and related financing activities (639,187) (1,864,932)
Cash Flows From Investing ActivityInterest received 57,538 71,045
Net cash provided by investing activity 57,538 71,045
Decrease in cash and cash equivalents (631,727) (999,088) Cash and cash equivalents - beginning of year 2,067,545 3,066,633 Cash and cash equivalents - end of year 1,435,818$ 2,067,545$
Reconciliation of Operating Loss to NetCash Used In Operating Activities:
Operating loss (3,234,514)$ (2,959,439)$ Adjustments to reconcile operating loss
to net cash used in operating activities:Depreciation 2,865,420 2,959,439 Changes in operating assets and liabilities:
Accounts receivable - Other receivable 30,851 (18,944) Prepaid items - 429 Inventories (27,275) (25,995) Accounts payable 25,752 (130,252) Accrued expenses (20,391) (1,836) Provision for insurance losses - Compensated absences payable 9,318 8,255
Total adjustments 2,883,675 2,791,096 Net cash used in operating activities (350,839)$ (168,343)$
Noncash Investing, Capital and Related Financing Activities:Gain on disposal of capital assets 37,623$ 206,200$
Vehicle Service FundStatement of Cash Flows
For the Year Ended September 30, 2011(With Comparative Figures for 2010)
II-163
II-163
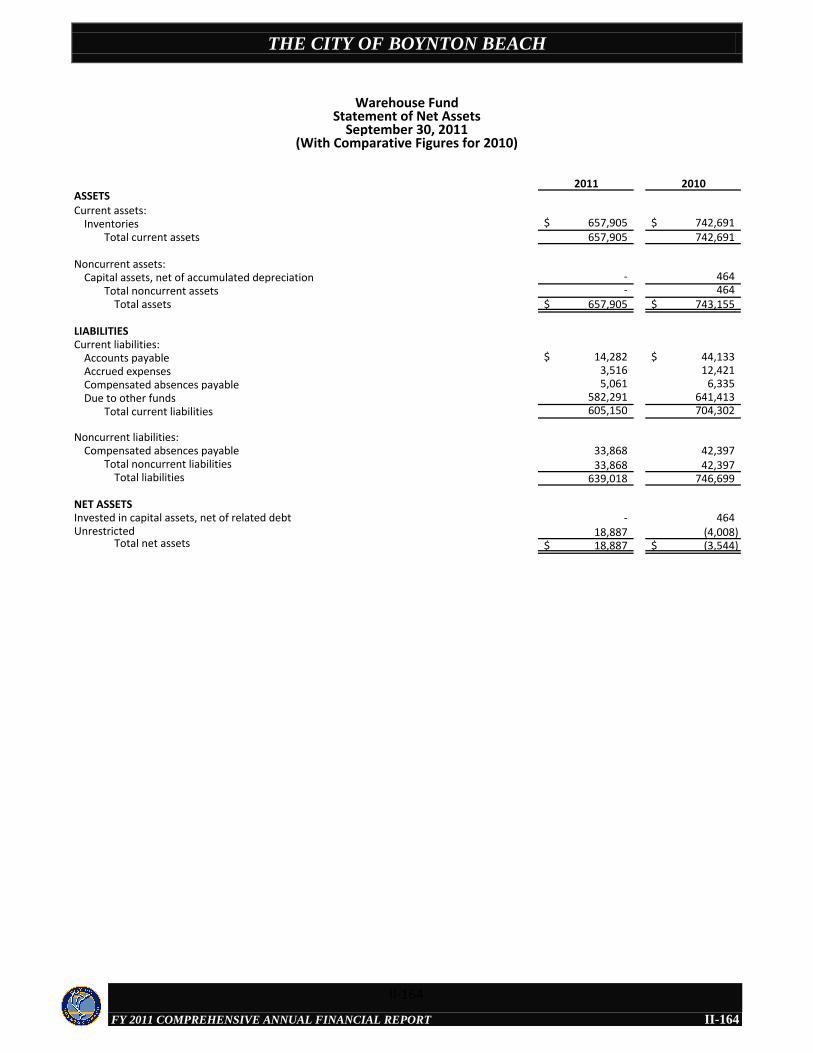
THE CITY OF BOYNTON BEACH
FY 2011 COMPREHENSIVE ANNUAL FINANCIAL REPORT
2011 2010ASSETSCurrent assets:
Inventories 657,905$ 742,691$ Total current assets 657,905 742,691
Noncurrent assets:Capital assets, net of accumulated depreciation - 464
Total noncurrent assets - 464 Total assets 657,905$ 743,155$
LIABILITIESCurrent liabilities:
Accounts payable 14,282$ 44,133$ Accrued expenses 3,516 12,421Compensated absences payable 5,061 6,335Due to other funds 582,291 641,413
Total current liabilities 605,150 704,302
Noncurrent liabilities:Compensated absences payable 33,868 42,397
Total noncurrent liabilities 33,868 42,397 Total liabilities 639,018 746,699
NET ASSETSInvested in capital assets, net of related debt - 464Unrestricted 18,887 (4,008)
Total net assets 18,887$ (3,544)$
Warehouse FundStatement of Net Assets
September 30, 2011(With Comparative Figures for 2010)
II-164
II-164
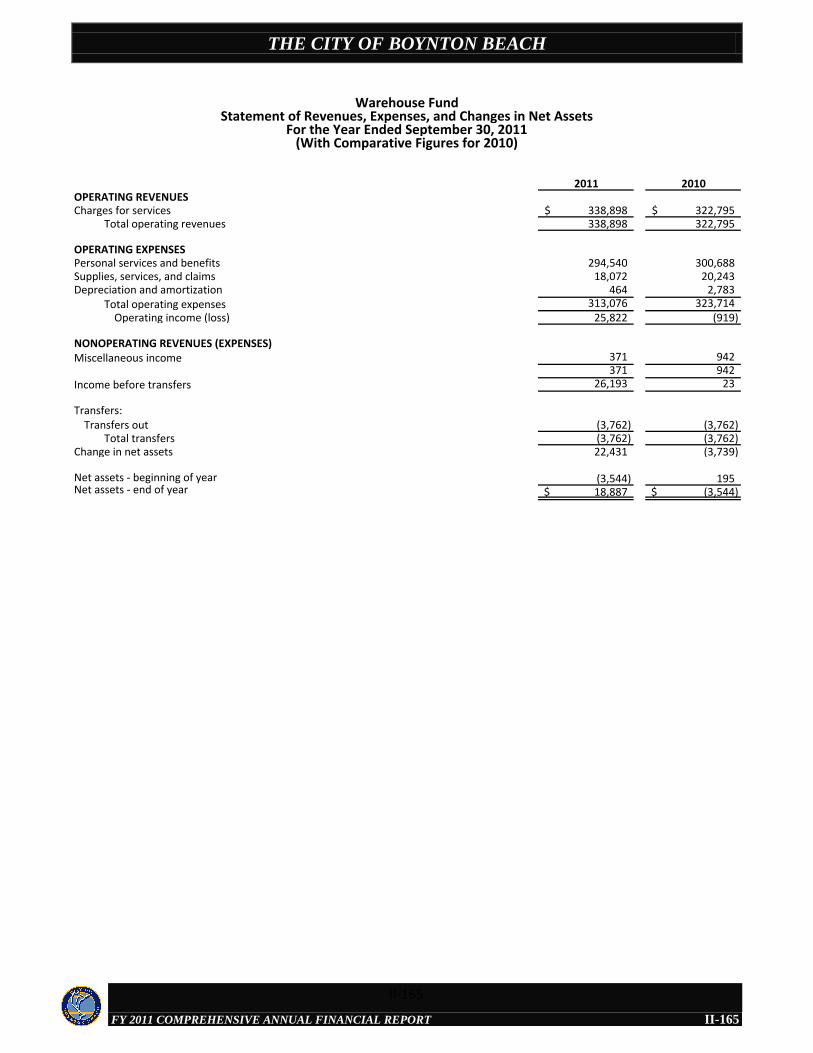
THE CITY OF BOYNTON BEACH
FY 2011 COMPREHENSIVE ANNUAL FINANCIAL REPORT
2011 2010OPERATING REVENUESCharges for services 338,898$ 322,795$
Total operating revenues 338,898 322,795
OPERATING EXPENSESPersonal services and benefits 294,540 300,688Supplies, services, and claims 18,072 20,243Depreciation and amortization 464 2,783
Total operating expenses 313,076 323,714 Operating income (loss) 25,822 (919)
NONOPERATING REVENUES (EXPENSES)Miscellaneous income 371 942
371 942 Income before transfers 26,193 23
Transfers:Transfers out (3,762) (3,762)
Total transfers (3,762) (3,762) Change in net assets 22,431 (3,739)
Net assets - beginning of year (3,544) 195Net assets - end of year 18,887$ (3,544)$
Warehouse FundStatement of Revenues, Expenses, and Changes in Net Assets
For the Year Ended September 30, 2011(With Comparative Figures for 2010)
II-165
II-165
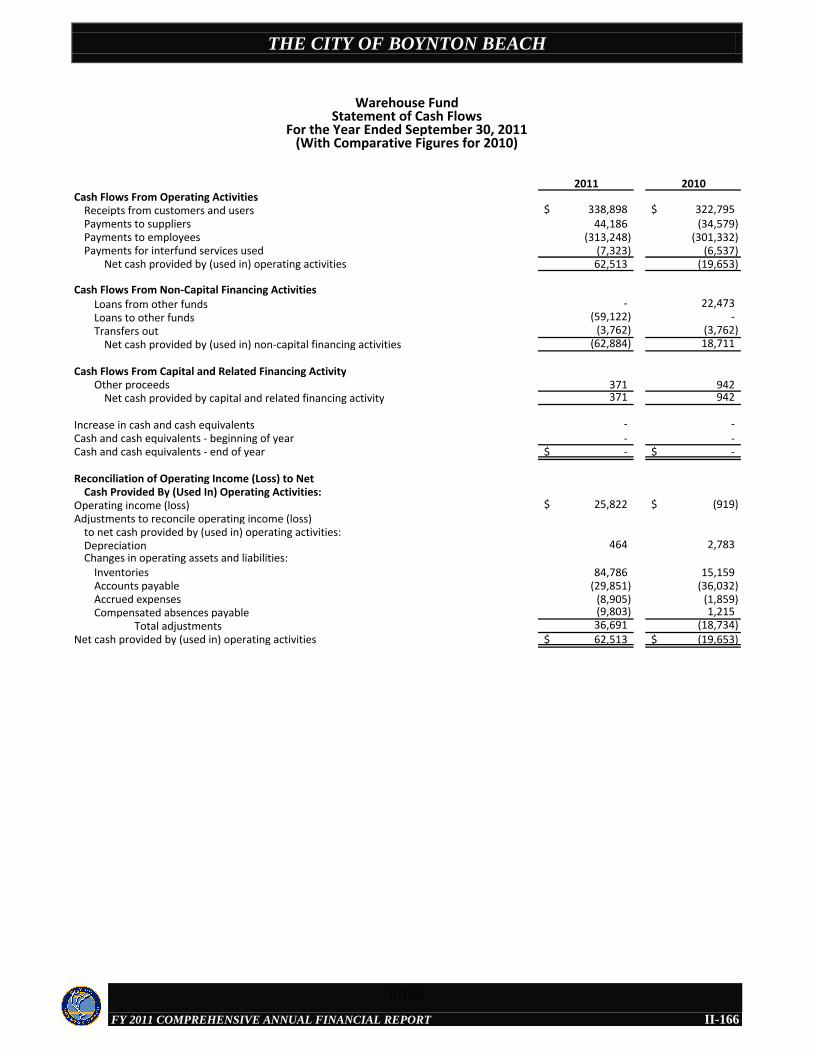
THE CITY OF BOYNTON BEACH
FY 2011 COMPREHENSIVE ANNUAL FINANCIAL REPORT
2011 2010Cash Flows From Operating Activities
Receipts from customers and users 338,898$ 322,795$ Payments to suppliers 44,186 (34,579) Payments to employees (313,248) (301,332) Payments for interfund services used (7,323) (6,537)
Net cash provided by (used in) operating activities 62,513 (19,653)
Cash Flows From Non-Capital Financing ActivitiesLoans from other funds - 22,473 Loans to other funds (59,122) - Transfers out (3,762) (3,762)
Net cash provided by (used in) non-capital financing activities (62,884) 18,711
Cash Flows From Capital and Related Financing ActivityOther proceeds 371 942
Net cash provided by capital and related financing activity 371 942
Increase in cash and cash equivalents - - Cash and cash equivalents - beginning of year - - Cash and cash equivalents - end of year -$ -$
Reconciliation of Operating Income (Loss) to NetCash Provided By (Used In) Operating Activities:
Operating income (loss) 25,822$ (919)$ Adjustments to reconcile operating income (loss)
to net cash provided by (used in) operating activities:Depreciation 464 2,783 Changes in operating assets and liabilities:
Inventories 84,786 15,159 Accounts payable (29,851) (36,032) Accrued expenses (8,905) (1,859) Compensated absences payable (9,803) 1,215
Total adjustments 36,691 (18,734) Net cash provided by (used in) operating activities 62,513$ (19,653)$
Warehouse FundStatement of Cash Flows
For the Year Ended September 30, 2011(With Comparative Figures for 2010)
II-166
II-166
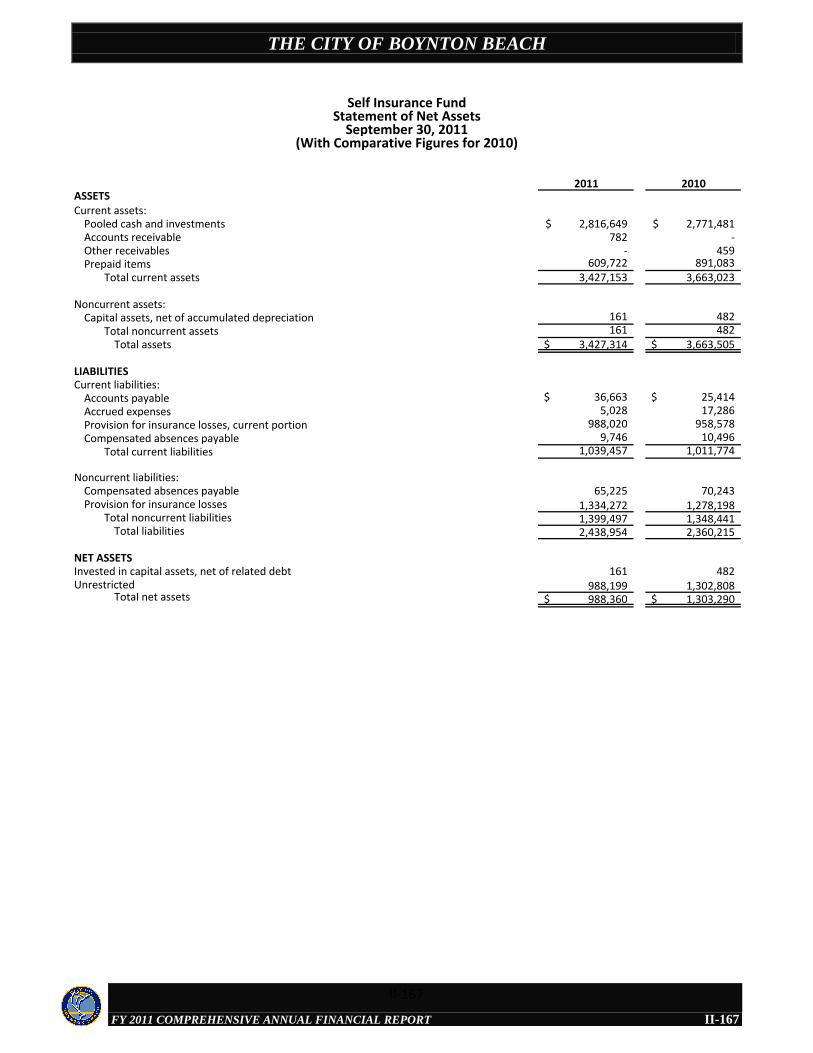
THE CITY OF BOYNTON BEACH
FY 2011 COMPREHENSIVE ANNUAL FINANCIAL REPORT
2011 2010ASSETSCurrent assets:
Pooled cash and investments 2,816,649$ 2,771,481$ Accounts receivable 782 - Other receivables - 459 Prepaid items 609,722 891,083
Total current assets 3,427,153 3,663,023
Noncurrent assets:Capital assets, net of accumulated depreciation 161 482
Total noncurrent assets 161 482 Total assets 3,427,314$ 3,663,505$
LIABILITIESCurrent liabilities:
Accounts payable 36,663$ 25,414$ Accrued expenses 5,028 17,286Provision for insurance losses, current portion 988,020 958,578Compensated absences payable 9,746 10,496
Total current liabilities 1,039,457 1,011,774
Noncurrent liabilities:Compensated absences payable 65,225 70,243Provision for insurance losses 1,334,272 1,278,198
Total noncurrent liabilities 1,399,497 1,348,441 Total liabilities 2,438,954 2,360,215
NET ASSETSInvested in capital assets, net of related debt 161 482Unrestricted 988,199 1,302,808
Total net assets 988,360$ 1,303,290$
Self Insurance FundStatement of Net Assets
September 30, 2011(With Comparative Figures for 2010)
II-167
II-167
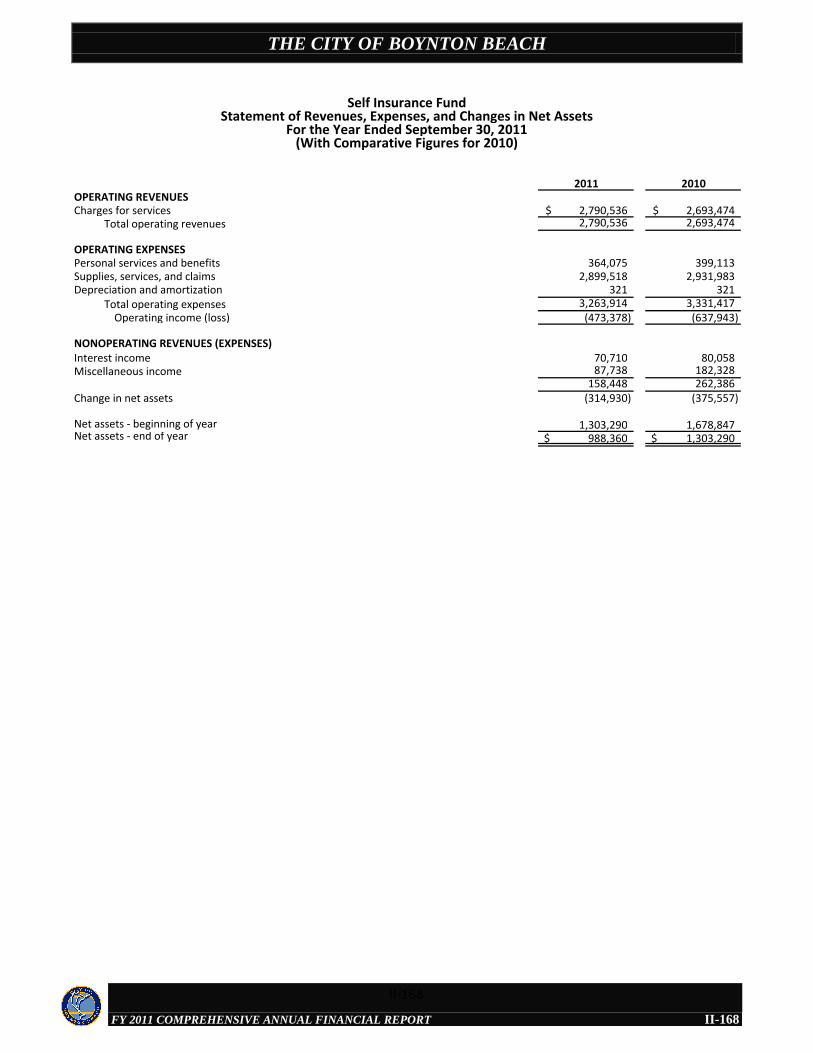
THE CITY OF BOYNTON BEACH
FY 2011 COMPREHENSIVE ANNUAL FINANCIAL REPORT
2011 2010OPERATING REVENUESCharges for services 2,790,536$ 2,693,474$
Total operating revenues 2,790,536 2,693,474
OPERATING EXPENSESPersonal services and benefits 364,075 399,113Supplies, services, and claims 2,899,518 2,931,983Depreciation and amortization 321 321
Total operating expenses 3,263,914 3,331,417 Operating income (loss) (473,378) (637,943)
NONOPERATING REVENUES (EXPENSES)Interest income 70,710 80,058Miscellaneous income 87,738 182,328
158,448 262,386 Change in net assets (314,930) (375,557)
Net assets - beginning of year 1,303,290 1,678,847Net assets - end of year 988,360$ 1,303,290$
Self Insurance FundStatement of Revenues, Expenses, and Changes in Net Assets
For the Year Ended September 30, 2011(With Comparative Figures for 2010)
II-168
II-168
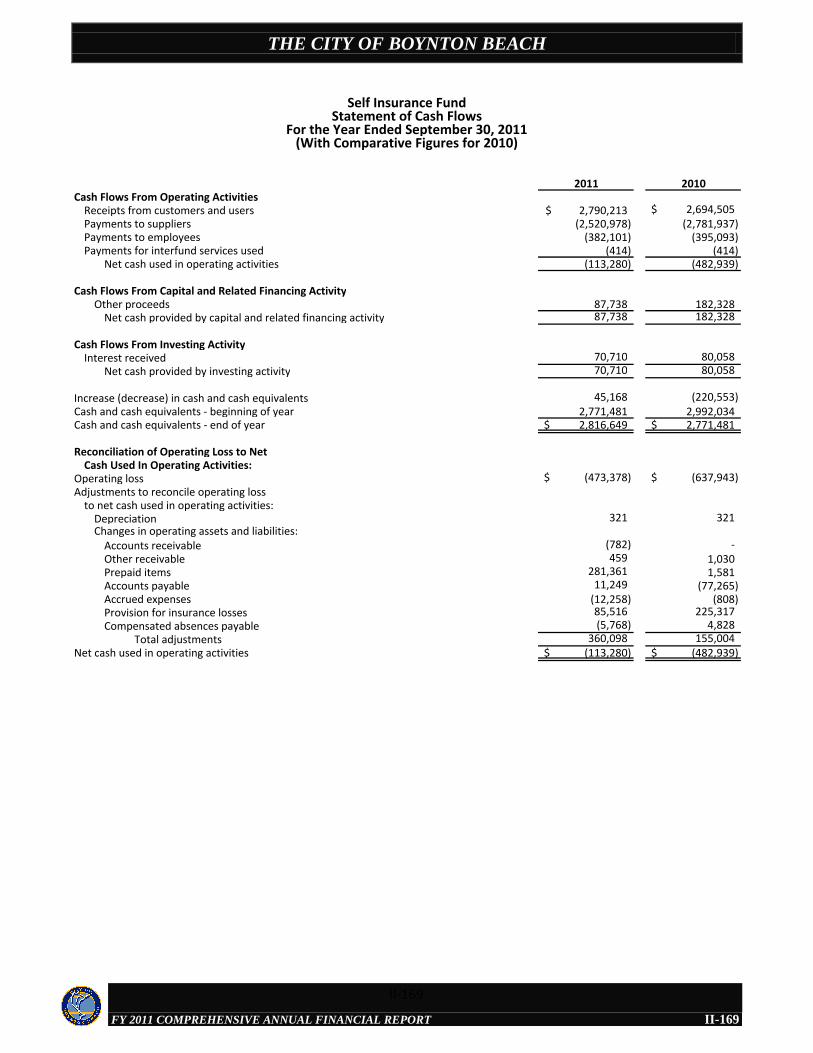
THE CITY OF BOYNTON BEACH
FY 2011 COMPREHENSIVE ANNUAL FINANCIAL REPORT
2011 2010Cash Flows From Operating Activities
Receipts from customers and users 2,790,213$ 2,694,505$ Payments to suppliers (2,520,978) (2,781,937) Payments to employees (382,101) (395,093) Payments for interfund services used (414) (414)
Net cash used in operating activities (113,280) (482,939)
Cash Flows From Capital and Related Financing ActivityOther proceeds 87,738 182,328
Net cash provided by capital and related financing activity 87,738 182,328
Cash Flows From Investing ActivityInterest received 70,710 80,058
Net cash provided by investing activity 70,710 80,058
Increase (decrease) in cash and cash equivalents 45,168 (220,553) Cash and cash equivalents - beginning of year 2,771,481 2,992,034 Cash and cash equivalents - end of year 2,816,649$ 2,771,481$
Reconciliation of Operating Loss to NetCash Used In Operating Activities:
Operating loss (473,378)$ (637,943)$ Adjustments to reconcile operating loss
to net cash used in operating activities:Depreciation 321 321 Changes in operating assets and liabilities:
Accounts receivable (782) - Other receivable 459 1,030 Prepaid items 281,361 1,581 Accounts payable 11,249 (77,265) Accrued expenses (12,258) (808) Provision for insurance losses 85,516 225,317 Compensated absences payable (5,768) 4,828
Total adjustments 360,098 155,004 Net cash used in operating activities (113,280)$ (482,939)$
Self Insurance FundStatement of Cash Flows
For the Year Ended September 30, 2011(With Comparative Figures for 2010)
II-169
II-169
THE CITY OF BOYNTON BEACH
FY 2011 COMPREHENSIVE ANNUAL FINANCIAL REPORT
II-170
PENSION TRUST FUNDS
Pension Trust Funds account for the net assets held and the changes in net assets held in trust for pension benefits of the City’s three pension plans. Since these funds are not funds of the City of Boynton Beach, but those held in trust for employees and retirees, they are not included in the Government-Wide Financial Statements. Instead, they are reported in the following pages as part of the City’s fiduciary responsibility.
General Employees’ Pension Fund: To account for the accumulation of resources to be used for the retirement benefit payments to the City’s general employees.
Police Officers’ Pension Fund: To account for the accumulation of resources to be used for the retirement benefit payments to the City’s sworn police personnel.
Firefighters’ Pension Fund: To account for the accumulation of resources to be used for the retirement benefit payments to the City’s certified fire personnel.
II-170
THE CITY OF BOYNTON BEACH
FY 2011 COMPREHENSIVE ANNUAL FINANCIAL REPORT
General PoliceEmployees' Officers' Firefighters' Total Total
Pension Fund Pension Fund Pension Fund 2011 2010ASSETSCash and cash equivalents 2,930,362$ 13,291$ 1,999,249$ 4,942,902$ 4,661,639$ Investments:
U.S. government obligations 5,599,748 - 4,357,162 9,956,910 8,452,387 Municipal obligations 31,274 - 182,396 213,670 257,852 Common stocks 38,745,422 - 18,680,368 57,425,790 49,857,295 Corporate bonds 11,876,208 - 6,454,213 18,330,421 21,616,701 Mortgage-backed securities 8,571,132 - - 8,571,132 7,365,315 Fixed income mutual funds - - 5,371,278 5,371,278 - Equity mutual funds 19,927,414 27,107,018 8,220,083 55,254,515 62,077,347 Bond mutual funds - 18,935,632 - 18,935,632 15,631,912 Real estate funds - 3,943,939 4,929,677 8,873,616 6,052,788 Commodities funds 1,078,283 - 1,078,283 -
Accounts receivable 180,559 - - 180,559 - Interest and dividends receivable 322,514 - 127,196 449,710 426,712 Other receivables 398,974 415,277 49,613 863,864 12,620,616 Prepaid items 347,297 5,432 4,571 357,300 12,956
Total assets 88,930,904 51,498,872 50,375,806 190,805,582 189,033,520
LIABILITIESAccounts payable 81,132 105,865 49,743 236,740 273,875 Due to broker-dealer - - 73,766 73,766 216,583
Total liabilities 81,132 105,865 123,509 310,506 490,458
NET ASSETSNet assets held in trust for pension benefits 88,849,772$ 51,393,007$ 50,252,297$ 190,495,076$ 188,543,062$
(See schedule of funding progress on page II-70)
Pension Trust FundsCombining Statement of Fiduciary Net Assets
September 30, 2011(With Comparative Figures for 2010)
II-171
II-171
THE CITY OF BOYNTON BEACH
FY 2011 COMPREHENSIVE ANNUAL FINANCIAL REPORT
General PoliceEmployees' Officers' Firefighters' Total Total
Pension Fund Pension Fund Pension Fund 2011 2010ADDITIONSContributions:
Employer 4,694,545$ 3,552,348$ 3,026,506$ 11,273,399$ 12,213,158$ Plan members 1,811,372 1,147,723 1,868,957 4,828,052 4,578,421 State - 623,168 944,530 1,567,698 1,632,242
Total contributions 6,505,917 5,323,239 5,839,993 17,669,149 18,423,821
Investment income (loss):Net appreciation (depreciation)
in the fair value of investments (realized and unrealized) (2,593,303) 5,610 (1,567,875) (4,155,568) 12,573,775
Interest and dividends 2,560,826 4,104 1,380,797 3,945,727 3,532,561 Miscellaneous 10,514 5,383 5,917 21,814 61,658
(21,963) 15,097 (181,161) (188,027) 16,167,994 Less investment expenses:
Investment expenses 439,208 414,217 271,366 1,124,791 950,911 Net investment income (loss) (461,171) (399,120) (452,527) (1,312,818) 15,217,083
Total additions 6,044,746 4,924,119 5,387,466 16,356,331 33,640,904
DEDUCTIONSBenefits paid 5,369,586 3,773,411 4,284,412 13,427,409 12,251,644 Refunds of contributions 602,225 78,709 1,215 682,149 534,603 Other operating expenses 139,486 134,695 96,735 370,916 384,679
Total deductions 6,111,297 3,986,815 4,382,362 14,480,474 13,170,926
Net increase (decrease) (66,551) 937,304 1,005,104 1,875,857 20,469,978
Net assets held in trust for pension benefits:Beginning of year, as originally reported 88,916,323 50,379,546 49,247,193 188,543,062 168,073,084 Prior period adjustment - error correction - 76,157 - 76,157 - Beginning of year, as restated 88,916,323 50,455,703 49,247,193 188,619,219 168,073,084 End of year 88,849,772$ 51,393,007$ 50,252,297$ 190,495,076$ 188,543,062$
Pension Trust FundsCombining Statement of Changes in Fiduciary Net Assets
For the Year Ended September 30, 2011(With Comparative Figures for 2010)
II-172
II-172
THE CITY OF BOYNTON BEACH
FY 2011 COMPREHENSIVE ANNUAL FINANCIAL REPORT
2011 2010ASSETSCash and cash equivalents 2,930,362$ 2,278,418$ Investments:
U.S. government obligations 5,599,748 5,200,516 Municipal obligations 31,274 27,470 Common stocks 38,745,422 30,101,117 Corporate bonds 11,876,208 11,619,327 Mortgage-backed securities 8,571,132 7,365,315 Equity mutual funds 19,927,414 26,899,258
Accounts receivable 180,559 5,415,919
Interest and dividends receivable 322,514 270,657 Other receivables 398,974 - Prepaid items 347,297 8,280
Total assets 88,930,904 89,186,277
LIABILITIESAccounts payable 81,132 53,371 Due to broker-dealer - 216,583
Total liabilities 81,132 269,954
NET ASSETSNet assets held in trust for pension benefits 88,849,772$ 88,916,323$
General Employees' Pension FundStatement of Net Assets
September 30, 2011(With Comparative Figures for 2010)
II-173
II-173

THE CITY OF BOYNTON BEACH
FY 2011 COMPREHENSIVE ANNUAL FINANCIAL REPORT
2011 2010ADDITIONSContributions:
Employer 4,694,545$ 5,415,919$ Plan members 1,811,372 1,957,816
Total contributions 6,505,917 7,373,735
Investment income (loss):Net appreciation (depreciation) in the fair value
of investments (realized and unrealized) (2,593,303) 4,700,988 Interest and dividends 2,560,826 2,468,972 Miscellaneous 10,514 40,928
(21,963) 7,210,888 Less investment expenses:
Investment expenses 439,208 350,309 Net investment income (loss) (461,171) 6,860,579
Total additions 6,044,746 14,234,314
DEDUCTIONSBenefits paid 5,369,586 4,645,585 Refunds of contributions 602,225 390,712 Refunds of elective benefit - 105,271 Other operating expenses 139,486 130,610
6,111,297 5,272,178 Net increase (decrease) (66,551) 8,962,136
Net assets held in trust for pension benefits - beginning of year 88,916,323 79,954,187 Net assets held in trust for pension benefits - end of year 88,849,772$ 88,916,323$
General Employees' Pension FundStatement of Changes in Net Assets
For the Year Ended September 30, 2011(With Comparative Figures for 2010)
II-174
II-174
THE CITY OF BOYNTON BEACH
FY 2011 COMPREHENSIVE ANNUAL FINANCIAL REPORT
2011 2010ASSETSCash and cash equivalents 13,291$ 81,380$ Investments:
Equity mutual funds 27,107,018 27,793,167 Bond mutual funds 18,935,632 15,631,912 Real estate funds 3,943,939 3,078,053 Commodities fund 1,078,283 -
Other receivables 415,277 3,969,635 Prepaid items 5,432 -
Total assets 51,498,872 50,554,147
LIABILITIESAccounts payable 105,865 174,601
Total liabilities 105,865 174,601
NET ASSETSNet assets held in trust for pension benefits 51,393,007$ 50,379,546$
Police Officers' Pension FundStatement of Net Assets
September 30, 2011(With Comparative Figures for 2010)
II-175
II-175
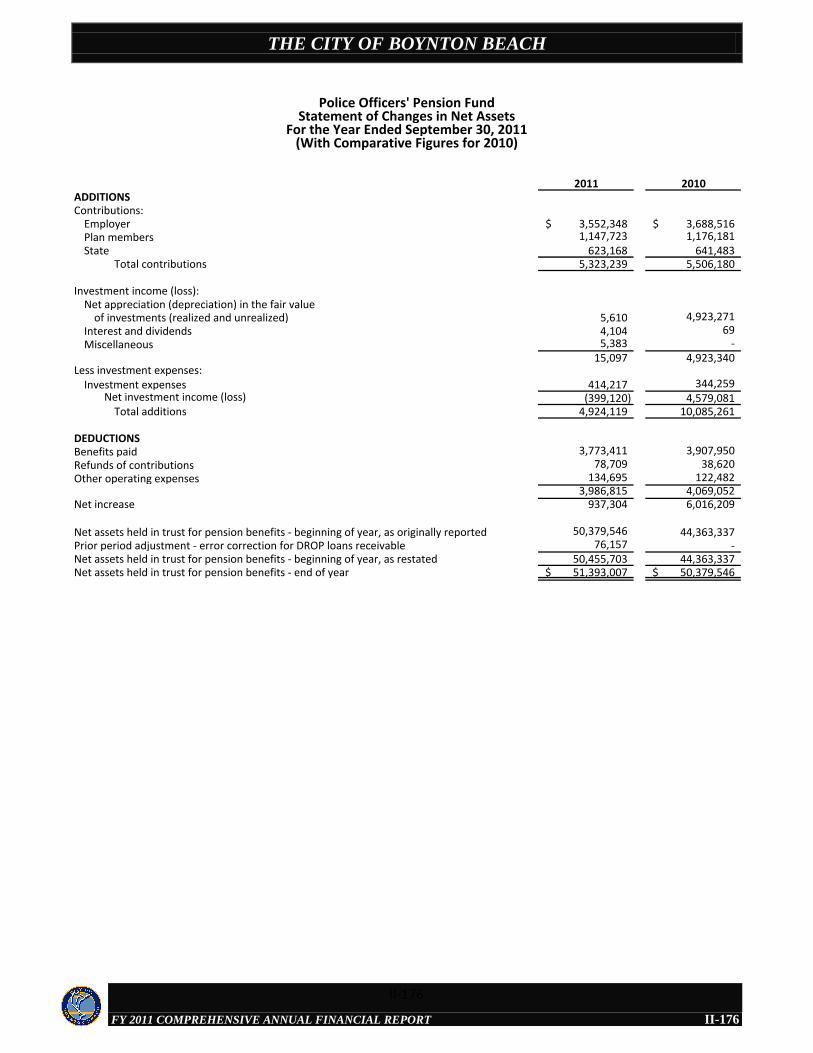
THE CITY OF BOYNTON BEACH
FY 2011 COMPREHENSIVE ANNUAL FINANCIAL REPORT
2011 2010ADDITIONSContributions:
Employer 3,552,348$ 3,688,516$ Plan members 1,147,723 1,176,181 State 623,168 641,483
Total contributions 5,323,239 5,506,180
Investment income (loss):Net appreciation (depreciation) in the fair value
of investments (realized and unrealized) 5,610 4,923,271 Interest and dividends 4,104 69 Miscellaneous 5,383 -
15,097 4,923,340 Less investment expenses:
Investment expenses 414,217 344,259 Net investment income (loss) (399,120) 4,579,081
Total additions 4,924,119 10,085,261
DEDUCTIONSBenefits paid 3,773,411 3,907,950 Refunds of contributions 78,709 38,620 Other operating expenses 134,695 122,482
3,986,815 4,069,052 Net increase 937,304 6,016,209
Net assets held in trust for pension benefits - beginning of year, as originally reported 50,379,546 44,363,337 Prior period adjustment - error correction for DROP loans receivable 76,157 - Net assets held in trust for pension benefits - beginning of year, as restated 50,455,703 44,363,337 Net assets held in trust for pension benefits - end of year 51,393,007$ 50,379,546$
Police Officers' Pension FundStatement of Changes in Net Assets
For the Year Ended September 30, 2011(With Comparative Figures for 2010)
II-176
II-176
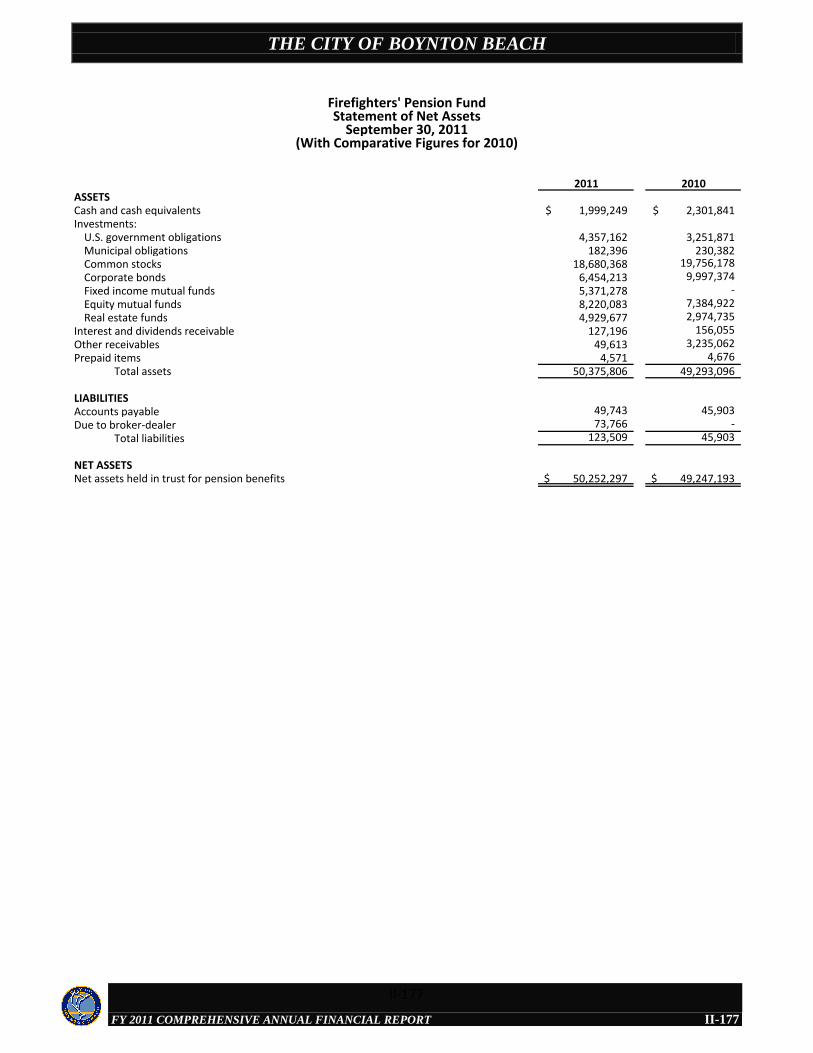
THE CITY OF BOYNTON BEACH
FY 2011 COMPREHENSIVE ANNUAL FINANCIAL REPORT
2011 2010ASSETSCash and cash equivalents 1,999,249$ 2,301,841$ Investments:
U.S. government obligations 4,357,162 3,251,871 Municipal obligations 182,396 230,382 Common stocks 18,680,368 19,756,178 Corporate bonds 6,454,213 9,997,374 Fixed income mutual funds 5,371,278 - Equity mutual funds 8,220,083 7,384,922 Real estate funds 4,929,677 2,974,735
Interest and dividends receivable 127,196 156,055 Other receivables 49,613 3,235,062 Prepaid items 4,571 4,676
Total assets 50,375,806 49,293,096
LIABILITIESAccounts payable 49,743 45,903 Due to broker-dealer 73,766 -
Total liabilities 123,509 45,903
NET ASSETSNet assets held in trust for pension benefits 50,252,297$ 49,247,193$
Firefighters' Pension FundStatement of Net Assets
September 30, 2011(With Comparative Figures for 2010)
II-177
II-177

THE CITY OF BOYNTON BEACH
FY 2011 COMPREHENSIVE ANNUAL FINANCIAL REPORT
2011 2010ADDITIONSContributions:
Employer 3,026,506$ 3,108,723$ Plan members 1,868,957 1,444,424 State 944,530 990,759
Total contributions 5,839,993 5,543,906
Investment income (loss):Net appreciation (depreciation) in the fair value
of investments (realized and unrealized) (1,567,875) 2,949,516 Interest and dividends 1,380,797 1,063,520 Miscellaneous 5,917 20,730
(181,161) 4,033,766 Less investment expenses:
Investment expenses 271,366 256,343 Net investment income (loss) (452,527) 3,777,423
Total additions 5,387,466 9,321,329
DEDUCTIONSBenefits paid 4,284,412 3,698,109 Refunds of contributions 1,215 - Other operating expenses 96,735 131,587
4,382,362 3,829,696 Net increase 1,005,104 5,491,633
Net assets held in trust for pension benefits - beginning of year 49,247,193 43,755,560 Net assets held in trust for pension benefits - end of year 50,252,297$ 49,247,193$
Firefighters' Pension FundStatement of Changes in Net Assets
For the Year Ended September 30, 2011(With Comparative Figures for 2010)
II-178
II-178

THE CITY OF BOYNTON BEACH
FY 2011 COMPREHENSIVE ANNUAL FINANCIAL REPORT
STATISTICAL SECTION
THE CITY OF BOYNTON BEACH
FY 2011 COMPREHENSIVE ANNUAL FINANCIAL REPORT
III-1
STATISTICAL SECTION
This part of the City of Boynton Beach’s Comprehensive Annual Financial Report presents detailed information as a context for understanding what the information in the financial statements, note disclosures, and required supplementary information says about the City’s overall financial health.
Contents Page
Financial TrendsThese schedules contain trend information to help the reader understand how the City’s financial performance and well-being have changed over time. These schedules include:Government-wide Net Assets by Activity III-2Government-wide Changes in Net Assets III-4Governmental Activities Tax Revenues by Source III-8Fund Balances of Governmental Funds III-9Changes in Fund Balances of Governmental Funds III-11
Revenue CapacityThese schedules contain information to help the reader assess the City’s most significant local revenue source, the property tax.Assessed Value and Estimated Actual Value of Taxable Property III-13Property Tax Rates – Direct and Overlapping Governments III-15Ten Principal Property Taxpayers III-16Property Tax Levies and Collections III-17
Debt CapacityThese schedules contain information to help the reader assess the affordability of the City’s current levels of outstanding debt and the City’s ability to issue additional debt in the futureRatios of Outstanding Debt by Type III-18Ratios of General Bonded Debt Outstanding III-19Direct and Overlapping Governmental Activities Debt III-20Legal Debt Margin Information III-21Pledged Revenue Coverage - Water & Sewer Bonds III-22Pledged Revenue Coverage - Public Service Tax Bonds III-23
Demographics and Economic InformationThese schedules offer demographic and economic indicators to help the reader understand the environment within which the City’s financial activities take placeDemographic and Economic Statistics III-24Principal Employers III-25
Operating InformationThese schedules contain service and infrastructure data to help the reader understand how the information in the City’s financial report relates to the services the City provides and the activities it performsFull-Time Equivalent City Government Employees by Function III-26Operating Indicators by Function/Program III-27Capital Asset Statistics by Function/Program III-29
Sources: Unless otherwise noted, the information in these schedules is derived from the Comprehensive Annual Financial Report (CAFR) for the relevant year.
III-1
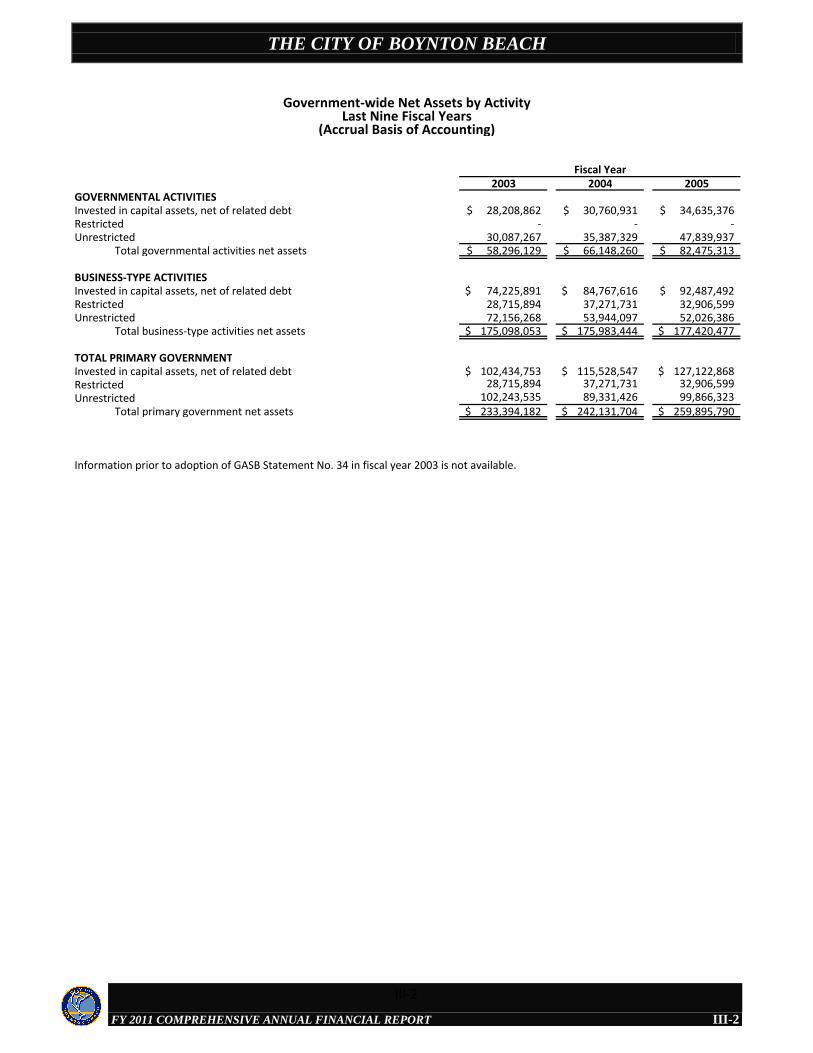
THE CITY OF BOYNTON BEACH
FY 2011 COMPREHENSIVE ANNUAL FINANCIAL REPORT
2003 2004 2005GOVERNMENTAL ACTIVITIESInvested in capital assets, net of related debt 28,208,862$ 30,760,931$ 34,635,376$ Restricted - - - Unrestricted 30,087,267 35,387,329 47,839,937
Total governmental activities net assets 58,296,129$ 66,148,260$ 82,475,313$
BUSINESS-TYPE ACTIVITIESInvested in capital assets, net of related debt 74,225,891$ 84,767,616$ 92,487,492$ Restricted 28,715,894 37,271,731 32,906,599 Unrestricted 72,156,268 53,944,097 52,026,386
Total business-type activities net assets 175,098,053$ 175,983,444$ 177,420,477$
TOTAL PRIMARY GOVERNMENTInvested in capital assets, net of related debt 102,434,753$ 115,528,547$ 127,122,868$ Restricted 28,715,894 37,271,731 32,906,599 Unrestricted 102,243,535 89,331,426 99,866,323
Total primary government net assets 233,394,182$ 242,131,704$ 259,895,790$
Information prior to adoption of GASB Statement No. 34 in fiscal year 2003 is not available.
Fiscal Year
Government-wide Net Assets by ActivityLast Nine Fiscal Years
(Accrual Basis of Accounting)
III-2
III-2
THE CITY OF BOYNTON BEACH
FY 2011 COMPREHENSIVE ANNUAL FINANCIAL REPORT
2006 2007 2008 2009 2010 2011
38,931,131$ 33,865,851$ 40,551,744$ 45,594,063$ 47,320,741$ 45,331,243$ - 13,000,000 36,302,615 35,625,330 29,793,106 3,289,038
54,509,175 63,290,823 30,135,308 20,476,623 14,751,944 38,199,258 93,440,306$ 110,156,674$ 106,989,667$ 101,696,016$ 91,865,791$ 86,819,539$
128,826,949$ 132,594,527$ 115,696,545$ 111,840,715$ 109,551,549$ 113,343,953$ 37,729,846 40,735,374 58,991,537 36,197,782 33,486,024 27,526,325 25,417,180 13,573,517 7,310,529 29,529,178 31,932,723 31,595,279
191,973,975$ 186,903,418$ 181,998,611$ 177,567,675$ 174,970,296$ 172,465,557$
167,758,080$ 166,460,378$ 156,248,289$ 157,434,778$ 156,872,290$ 158,675,196$ 37,729,846 53,735,374 95,294,152 71,823,112 63,279,130 30,815,363 79,926,355 76,864,340 37,445,837 50,005,801 46,684,667 69,794,537
285,414,281$ 297,060,092$ 288,988,278$ 279,263,691$ 266,836,087$ 259,285,096$
Fiscal Year
III-3
III-3
THE CITY OF BOYNTON BEACH
FY 2011 COMPREHENSIVE ANNUAL FINANCIAL REPORT
2003 2004 2005EXPENSESGovernmental activities:
General government 10,920,258$ 13,681,107$ 14,509,497$ Public safety 28,881,604 32,919,033 34,981,050 Physical environment 1,564,832 1,350,192 1,265,137 Economic environment 1,551,919 1,667,440 1,555,131 Culture and recreation 8,661,942 9,329,249 8,575,927 Interest on long-term debt 671,892 653,647 723,411
Total governmental activities expenses 52,252,447 59,600,668 61,610,153
Business-type activities:Water and sewer 24,703,738 26,768,722 27,287,773 Sanitation 5,797,519 7,322,559 6,924,912 Other enterprise 2,450,664 2,636,977 2,594,955
Total business-type activities expenses 32,951,921 36,728,258 36,807,640 Total primary government expenses 85,204,368$ 96,328,926$ 98,417,793$
PROGRAM REVENUESGovernmental activities:
Charges for services:General government 5,398,659$ 9,600,494$ 9,702,581$ Public safety 3,238,727 4,788,703 6,238,808 Physical environment - - - Economic environment 322,197 146,360 261,922 Culture and recreation 1,863,176 2,027,172 2,431,092
Operating grants and contributions:General government - - 84,007 Public safety 3,050,913 3,011,598 2,407,797 Physical environment - - - Economic environment 1,434,236 1,381,005 1,234,878 Culture and recreation 113,144 110,524 104,023
Capital grants and contributions:General government - 40,780 1,717,750 Public safety - 127,907 8,771 Physical environment - - - Economic environment - - - Culture and recreation 942,577 853,492 2,737,798
Total governmental activities program revenues 16,363,629 22,088,035 26,929,427
Business-type activities:Charges for services:
Water and sewer 25,582,666 26,572,657 26,709,522 Sanitation 6,646,297 6,859,994 7,816,257 Other enterprise 2,535,044 2,420,514 2,389,288
Operating grants and contributions:Water and sewer - 805,000 44,490 Sanitation - - 53,798 Other enterprise - - 104,945
Capital grants and contributions:Water and sewer 5,882,779 5,160,126 5,422,358
Total business-type activities program revenues 40,646,786 41,818,291 42,540,658 Total primary government program revenues 57,010,415$ 63,906,326$ 69,470,085$
NET (EXPENSE)/REVENUEGovernmental activities (35,888,818)$ (37,512,633)$ (34,680,726)$ Business-type activities 7,694,865 5,090,033 5,733,018
Total primary government net expense (28,193,953)$ (32,422,600)$ (28,947,708)$
Information prior to adoption of GASB Statement No. 34 in fiscal year 2003 is not available.
Government-wide Changes in Net AssetsLast Nine Fiscal Years
(Accrual Basis of Accounting)
Fiscal Year
III-4
III-4
THE CITY OF BOYNTON BEACH
FY 2011 COMPREHENSIVE ANNUAL FINANCIAL REPORT
2006 2007 2008 2009 2010 2011
16,986,771$ 18,886,801$ 21,896,716$ 18,780,141$ 18,737,298$ 16,580,084$ 39,939,128 43,236,069 51,246,353 51,759,110 51,742,281 49,820,122
4,049,198 1,910,796 1,929,868 1,911,558 2,049,821 1,922,230 2,331,150 4,408,329 4,969,515 3,921,017 5,742,630 4,612,914 9,908,414 10,992,905 11,748,032 12,302,209 10,958,549 10,424,628
658,680 3,022,778 2,942,138 2,836,920 2,722,629 2,663,153 73,873,341 82,457,678 94,732,622 91,510,955 91,953,208 86,023,131
30,419,284 31,313,678 33,064,701 33,860,369 35,340,105 35,460,168 7,421,367 6,626,029 7,836,860 7,599,393 7,384,218 7,470,324 2,667,019 3,540,796 2,826,406 2,827,484 2,482,366 2,392,419
40,507,670 41,480,503 43,727,967 44,287,246 45,206,689 45,322,911 114,381,011$ 123,938,181$ 138,460,589$ 135,798,201$ 137,159,897$ 131,346,042$
11,041,961$ 9,098,607$ 7,965,917$ 3,922,962$ 4,545,268$ 5,391,847$ 5,930,479 6,004,198 7,713,024 9,249,132 8,918,145 9,317,546
- - 184,676 213,106 150,423 104,047 213,298 205,569 713,173 563,631 54,599 122,296
1,737,485 2,038,245 1,929,600 968,180 985,278 1,110,191
1,163,162 243,912 834,999 137,336 176,136 - 3,430,481 3,049,131 2,184,153 782,716 1,337,611 627,789 2,356,633 422,131 - - 75,396 55,108 2,353,929 1,990,906 962,964 1,152,759 2,505,730 1,698,526
393,935 112,782 201,743 353,280 237,483 1,592,726
33,230 82,344 - - - - 182,458 61,737 1,334,346 1,069,459 35,002 256,307
- - - - 125,755 839,224 - - - - 250,039 340,151
267,148 490,213 1,434,805 - 200,000 15,831 29,104,199 23,799,775 25,459,400 18,412,561 19,596,865 21,471,589
29,902,392 25,763,237 26,894,571 33,324,003 35,944,991 38,186,059 8,549,080 9,024,468 9,052,783 9,538,269 9,298,463 10,080,888 2,399,107 2,556,055 2,454,429 2,130,930 2,036,328 1,967,363
- - - - - - - - - 11,628 117,171 125,719 - - - - - -
13,520,165 5,914,480 4,605,925 778,890 1,218,819 183,462 54,370,744 43,258,240 43,007,708 45,783,720 48,615,772 50,543,491 83,474,943$ 67,058,015$ 68,467,108$ 64,196,281$ 68,212,637$ 72,015,080$
(44,769,142)$ (58,657,903)$ (69,273,222)$ (73,098,394)$ (72,356,343)$ (64,551,542)$ 13,863,074 1,777,737 (720,259) 1,496,474 3,409,083 5,220,580
(30,906,068)$ (56,880,166)$ (69,993,481)$ (71,601,920)$ (68,947,260)$ (59,330,962)$
Fiscal Year
III-5
III-5
THE CITY OF BOYNTON BEACH
FY 2011 COMPREHENSIVE ANNUAL FINANCIAL REPORT
2003 2004 2005GENERAL REVENUES AND OTHER CHANGES IN NET ASSETSGovernmental activities:
Taxes:Property taxes 21,532,538$ 22,995,830$ 24,330,855$ Tax increment - - - Franchise taxes 5,483,227 5,764,094 3,625,268 Public service taxes 1,788,021 1,767,298 4,190,171 Communications services taxes 1,821,365 1,715,356 2,996,514 Sales tax 4,387,757 4,786,748 5,006,582 Gas tax 1,252,651 1,310,648 1,334,220
Intergovernmental, unrestricted 1,450,799 1,612,302 2,087,273 Investment earnings 1,080,555 744,878 1,364,296 Miscellaneous 48,582 107,070 130,658 Special item - - - Transfers 4,557,101 4,560,540 5,941,942
Total governmental activities 43,402,596 45,364,764 51,007,779
Business-type activities:Intergovernmental, unrestricted - 1,241,717 - Investment earnings 1,877,358 11,861 1,474,728 Miscellaneous 207,938 (897,680) 171,229 Transfers (4,557,101) (4,560,540) (5,941,942)
Total business-type activities (2,471,805) (4,204,642) (4,295,985) Total primary government 40,930,791$ 41,160,122$ 46,711,794$
CHANGES IN NET ASSETSGovernmental activities 7,513,778$ 7,852,131$ 16,327,053$ Business-type activities 5,223,060 885,391 1,437,033
Total primary government 12,736,838$ 8,737,522$ 17,764,086$
Information prior to adoption of GASB Statement No. 34 in fiscal year 2003 is not available.
Government-wide Changes in Net Assets (Continued)Last Nine Fiscal Years
(Accrual Basis of Accounting)
Fiscal Year
III-6
III-6
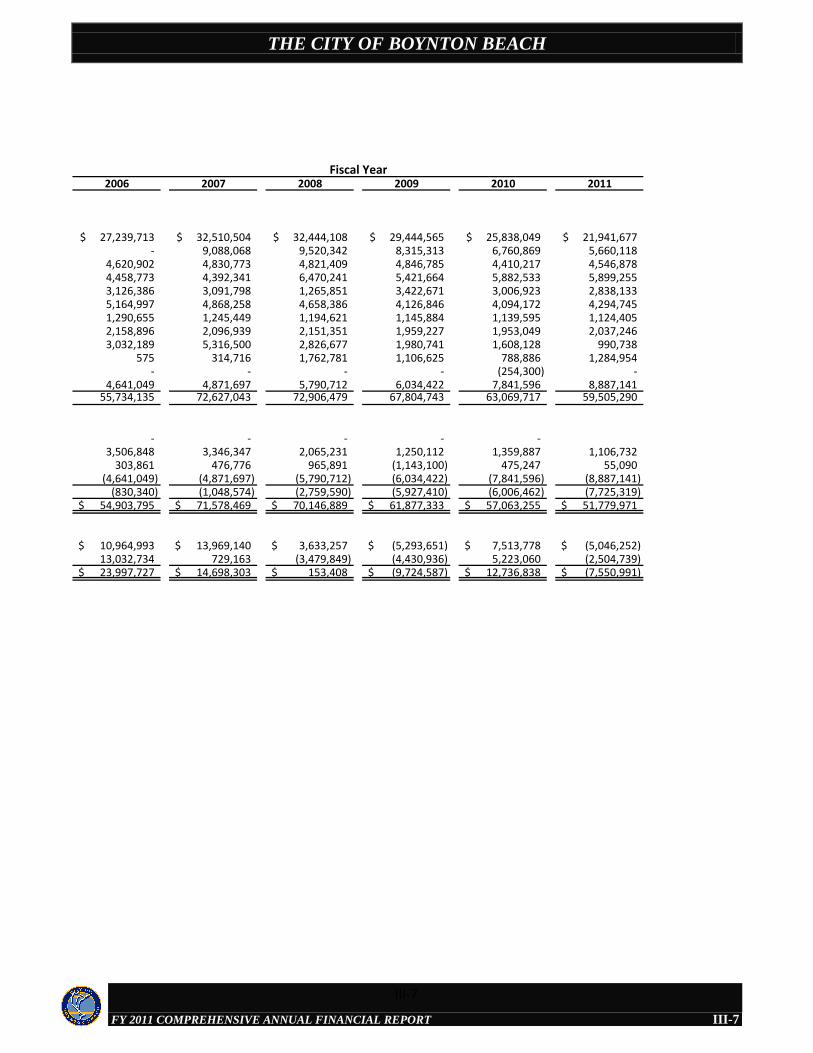
THE CITY OF BOYNTON BEACH
FY 2011 COMPREHENSIVE ANNUAL FINANCIAL REPORT
2006 2007 2008 2009 2010 2011
27,239,713$ 32,510,504$ 32,444,108$ 29,444,565$ 25,838,049$ 21,941,677$ - 9,088,068 9,520,342 8,315,313 6,760,869 5,660,118
4,620,902 4,830,773 4,821,409 4,846,785 4,410,217 4,546,878 4,458,773 4,392,341 6,470,241 5,421,664 5,882,533 5,899,255 3,126,386 3,091,798 1,265,851 3,422,671 3,006,923 2,838,133 5,164,997 4,868,258 4,658,386 4,126,846 4,094,172 4,294,745 1,290,655 1,245,449 1,194,621 1,145,884 1,139,595 1,124,405 2,158,896 2,096,939 2,151,351 1,959,227 1,953,049 2,037,246 3,032,189 5,316,500 2,826,677 1,980,741 1,608,128 990,738
575 314,716 1,762,781 1,106,625 788,886 1,284,954 - - - - (254,300) -
4,641,049 4,871,697 5,790,712 6,034,422 7,841,596 8,887,141 55,734,135 72,627,043 72,906,479 67,804,743 63,069,717 59,505,290
- - - - - 3,506,848 3,346,347 2,065,231 1,250,112 1,359,887 1,106,732
303,861 476,776 965,891 (1,143,100) 475,247 55,090 (4,641,049) (4,871,697) (5,790,712) (6,034,422) (7,841,596) (8,887,141)
(830,340) (1,048,574) (2,759,590) (5,927,410) (6,006,462) (7,725,319) 54,903,795$ 71,578,469$ 70,146,889$ 61,877,333$ 57,063,255$ 51,779,971$
10,964,993$ 13,969,140$ 3,633,257$ (5,293,651)$ 7,513,778$ (5,046,252)$ 13,032,734 729,163 (3,479,849) (4,430,936) 5,223,060 (2,504,739) 23,997,727$ 14,698,303$ 153,408$ (9,724,587)$ 12,736,838$ (7,550,991)$
Fiscal Year
III-7
III-7
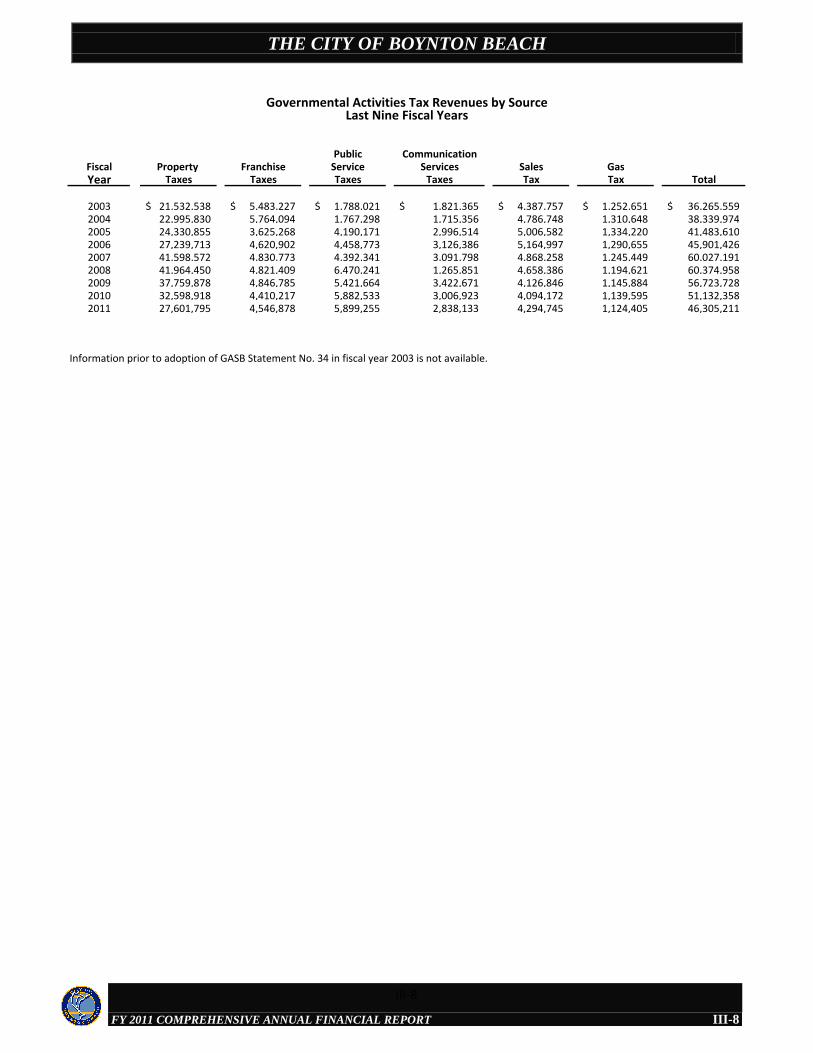
THE CITY OF BOYNTON BEACH
FY 2011 COMPREHENSIVE ANNUAL FINANCIAL REPORT
Public CommunicationFiscal Property Franchise Service Services Sales GasYear Taxes Taxes Taxes Taxes Tax Tax Total
2003 21,532,538$ 5,483,227$ 1,788,021$ 1,821,365$ 4,387,757$ 1,252,651$ 36,265,559$ 2004 22,995,830 5,764,094 1,767,298 1,715,356 4,786,748 1,310,648 38,339,974 2005 24,330,855 3,625,268 4,190,171 2,996,514 5,006,582 1,334,220 41,483,610 2006 27,239,713 4,620,902 4,458,773 3,126,386 5,164,997 1,290,655 45,901,426 2007 41,598,572 4,830,773 4,392,341 3,091,798 4,868,258 1,245,449 60,027,191 2008 41,964,450 4,821,409 6,470,241 1,265,851 4,658,386 1,194,621 60,374,958 2009 37,759,878 4,846,785 5,421,664 3,422,671 4,126,846 1,145,884 56,723,728 2010 32,598,918 4,410,217 5,882,533 3,006,923 4,094,172 1,139,595 51,132,358 2011 27,601,795 4,546,878 5,899,255 2,838,133 4,294,745 1,124,405 46,305,211
Information prior to adoption of GASB Statement No. 34 in fiscal year 2003 is not available.
Governmental Activities Tax Revenues by SourceLast Nine Fiscal Years
III-8
III-8
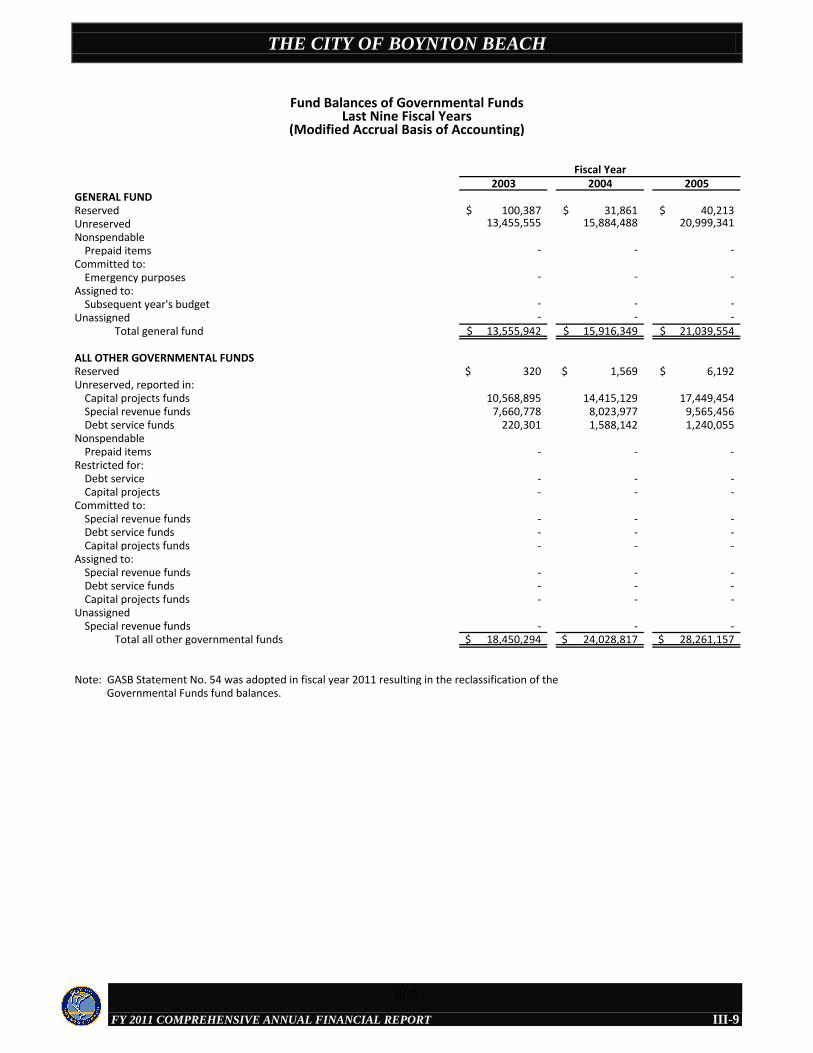
THE CITY OF BOYNTON BEACH
FY 2011 COMPREHENSIVE ANNUAL FINANCIAL REPORT
2003 2004 2005GENERAL FUNDReserved 100,387$ 31,861$ 40,213$ Unreserved 13,455,555 15,884,488 20,999,341 Nonspendable
Prepaid items - - - Committed to:
Emergency purposes - - - Assigned to:
Subsequent year's budget - - - Unassigned - - -
Total general fund 13,555,942$ 15,916,349$ 21,039,554$
ALL OTHER GOVERNMENTAL FUNDSReserved 320$ 1,569$ 6,192$ Unreserved, reported in:
Capital projects funds 10,568,895 14,415,129 17,449,454 Special revenue funds 7,660,778 8,023,977 9,565,456 Debt service funds 220,301 1,588,142 1,240,055
NonspendablePrepaid items - - -
Restricted for:Debt service - - - Capital projects - - -
Committed to:Special revenue funds - - - Debt service funds - - - Capital projects funds - - -
Assigned to:Special revenue funds - - - Debt service funds - - - Capital projects funds - - -
UnassignedSpecial revenue funds - - -
Total all other governmental funds 18,450,294$ 24,028,817$ 28,261,157$
Note: GASB Statement No. 54 was adopted in fiscal year 2011 resulting in the reclassification of the Governmental Funds fund balances.
Fund Balances of Governmental FundsLast Nine Fiscal Years
(Modified Accrual Basis of Accounting)
Fiscal Year
III-9
III-9
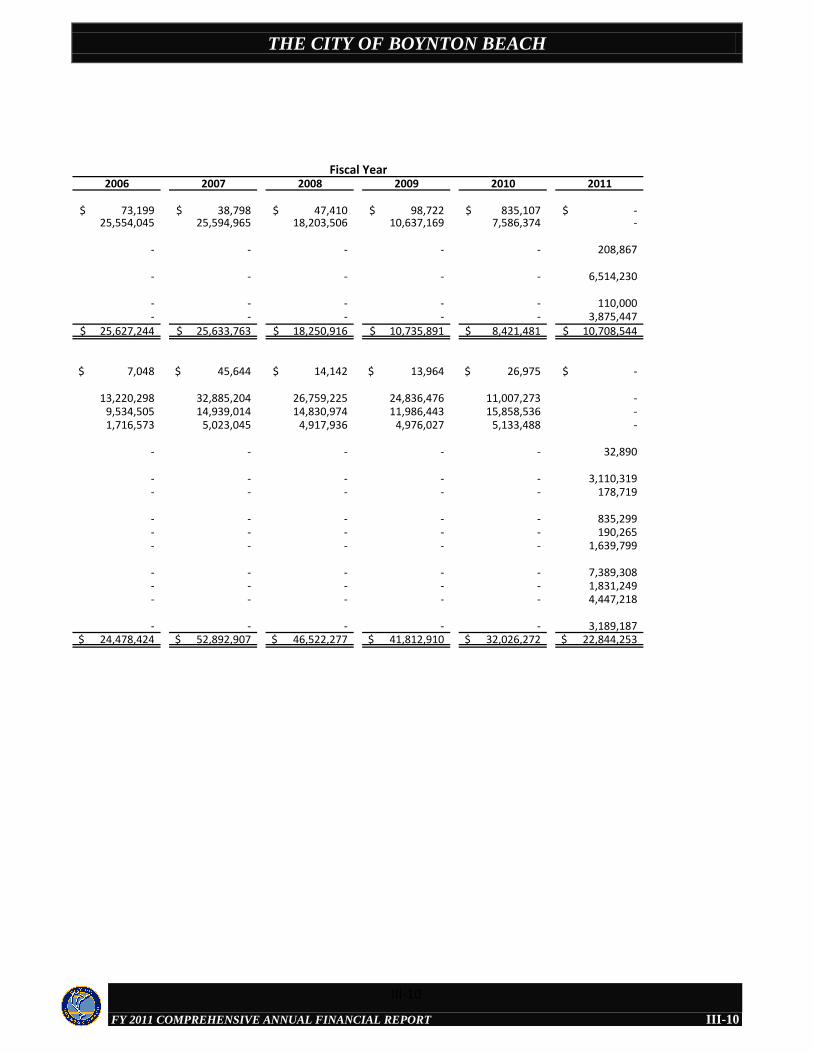
THE CITY OF BOYNTON BEACH
FY 2011 COMPREHENSIVE ANNUAL FINANCIAL REPORT
2006 2007 2008 2009 2010 2011
73,199$ 38,798$ 47,410$ 98,722$ 835,107$ -$ 25,554,045 25,594,965 18,203,506 10,637,169 7,586,374 -
- - - - - 208,867
- - - - - 6,514,230
- - - - - 110,000 - - - - - 3,875,447
25,627,244$ 25,633,763$ 18,250,916$ 10,735,891$ 8,421,481$ 10,708,544$
7,048$ 45,644$ 14,142$ 13,964$ 26,975$ -$
13,220,298 32,885,204 26,759,225 24,836,476 11,007,273 - 9,534,505 14,939,014 14,830,974 11,986,443 15,858,536 - 1,716,573 5,023,045 4,917,936 4,976,027 5,133,488 -
- - - - - 32,890
- - - - - 3,110,319 - - - - - 178,719
- - - - - 835,299 - - - - - 190,265 - - - - - 1,639,799
- - - - - 7,389,308 - - - - - 1,831,249 - - - - - 4,447,218
- - - - - 3,189,187 24,478,424$ 52,892,907$ 46,522,277$ 41,812,910$ 32,026,272$ 22,844,253$
Fiscal Year
III-10
III-10
THE CITY OF BOYNTON BEACH
FY 2011 COMPREHENSIVE ANNUAL FINANCIAL REPORT
2003 2004 2005REVENUESTaxes 33,231,213$ 34,827,856$ 36,477,029$ Licenses and permits 3,076,313 6,648,957 8,202,385 Intergovernmental 9,923,376 12,349,492 15,508,471 Charges for services 3,516,694 4,116,407 5,184,379 Special assessment 2,702,616 2,310,637 2,353,373 Fines and forfeitures 442,563 456,949 531,187 Rents and royalties 176,299 204,178 171,371 Interest 982,255 682,446 1,268,077 Donations 724,552 874,822 1,380,715 Miscellaneous 322,448 233,676 596,781
Total revenues 55,098,329 62,705,420 71,673,768
EXPENDITURESCurrent:
General government 9,833,510 11,125,828 11,973,822 Public safety 26,878,331 32,074,384 33,362,716 Physical environment 1,162,926 1,172,279 1,181,189 Economic environment 1,537,740 1,502,523 1,408,051 Culture and recreation 7,518,816 8,650,446 7,866,825
Capital outlay 6,776,362 11,200,162 6,628,752 Debt service:
Principal 2,284,863 2,401,200 1,509,790 Interest and other fiscal charges 719,280 2,476,505 778,985
Total expenditures 56,711,828 70,603,327 64,710,130 Revenues over (under) expenditures (1,613,499) (7,897,907) 6,963,638
OTHER FINANCING SOURCES (USES)Transfers in 8,956,942 18,453,651 7,943,468 Transfers out (7,609,909) (16,387,290) (5,551,561) Bonds issued - 17,540,000 - Bonds premium/discount - 832,794 - Payment to refunded bond escrow agent - (6,582,337) -
Total other financing sources (uses) 1,347,033 13,856,818 2,391,907
SPECIAL ITEMSRefund of permit fee - - -
Net change in fund balances (266,466)$ 5,958,911$ 9,355,545$
Debt service as a percentage of non-capital expenditures 6.40% 8.95% 4.10%
Changes in Fund Balances of Governmental FundsLast Nine Fiscal Years
(Modified Accrual Basis of Accounting)
Fiscal Year
III-11
III-11
THE CITY OF BOYNTON BEACH
FY 2011 COMPREHENSIVE ANNUAL FINANCIAL REPORT
2006 2007 2008 2009 2010 2011
40,736,429$ 55,158,934$ 55,716,572$ 49,152,673$ 43,964,625$ 38,855,159$ 8,951,992 6,705,011 5,662,843 5,617,035 5,683,270 6,089,525
16,087,898 13,070,265 13,977,838 11,217,201 13,058,225 14,250,887 5,338,981 6,098,521 7,045,665 6,904,712 7,107,236 7,408,143 2,559,313 2,623,375 2,673,263 3,787,127 3,740,170 3,703,024
661,746 535,971 665,211 614,624 394,888 1,074,116 298,709 224,223 224,971 215,668 231,853 344,189
2,697,766 5,448,820 2,645,415 1,790,545 1,457,025 862,490 523,996 225,129 607,440 58,497 94,909 63,130 951,179 1,151,731 1,684,756 664,320 499,170 751,004
78,808,009 91,241,980 90,903,974 80,022,402 76,231,371 73,401,667
14,450,752 15,916,502 18,818,406 16,005,431 15,472,894 14,530,115 38,553,101 45,522,116 47,271,216 49,673,851 50,006,789 49,338,788
3,586,141 1,343,141 1,243,138 1,217,842 1,351,332 1,101,867 2,212,906 4,240,603 4,847,516 3,837,226 5,728,592 4,604,398 8,636,946 9,452,764 9,393,082 9,690,494 9,030,334 8,398,393
10,256,222 30,757,779 14,765,396 9,024,022 7,531,836 5,088,656
1,605,113 2,638,604 2,879,461 2,983,649 2,990,151 2,623,120 710,292 3,076,520 3,045,095 2,940,694 2,825,933 2,716,951
80,011,473 112,948,029 102,263,310 95,373,209 94,937,861 88,402,288 (1,203,464) (21,706,049) (11,359,336) (15,350,807) (18,706,490) (15,000,621)
7,688,858 56,798,027 30,069,546 26,032,894 31,349,899 31,519,453 (5,680,437) (55,253,286) (25,781,558) (22,906,479) (24,490,157) (22,870,189)
- 21,985,000 - - - - - 388,655 - - - - - - - - - -
2,008,421 23,918,396 4,287,988 3,126,415 6,859,742 8,649,264
- - - - (254,300) -
804,957$ 2,212,347$ (7,071,348)$ (12,224,392)$ (12,101,048)$ (6,351,357)$
3.43% 7.47% 7.26% 7.37% 7.13% 6.85%
Fiscal Year
III-12
III-12
THE CITY OF BOYNTON BEACH
FY 2011 COMPREHENSIVE ANNUAL FINANCIAL REPORT
FiscalYear Residential Commercial Industrial Other Personal
2002 1,675,937,119$ 554,030,196$ 176,928,582$ 32,485,036$ 296,199,467$ 2003 1,827,526,363 577,246,080 185,323,112 33,724,758 272,473,272 2004 2,134,737,593 594,520,063 206,869,860 43,568,062 252,311,204 2005 2,423,973,983 647,175,110 251,605,670 45,569,008 248,907,486 2006 2,896,518,399 770,213,540 249,268,290 63,289,031 245,499,671 2007 3,889,779,949 994,425,877 323,286,953 73,332,627 265,095,457 2008 4,398,185,545 1,035,507,575 346,781,499 70,030,393 281,252,184 2009 3,828,426,828 1,034,836,419 366,505,515 66,655,045 271,582,088 2010 2,873,401,905 942,488,812 403,538,771 74,638,431 277,848,816 2011 2,385,181,626 825,539,209 347,592,426 57,732,386 273,434,050
Source: Palm Beach County Property Appraiser
Property Types
Assessed Value and Estimated Actual Value of Taxable PropertyLast Ten Fiscal Years
$2,385,181,626
$825,539,209
$347,592,426
$57,732,386
$273,434,050
-
500,000,000
1,000,000,000
1,500,000,000
2,000,000,000
2,500,000,000
3,000,000,000
Residential Commercial Industrial Other Personal
Assessed Value of Taxable PropertyFiscal Year 2011
III-13
III-13

THE CITY OF BOYNTON BEACH
FY 2011 COMPREHENSIVE ANNUAL FINANCIAL REPORT
Total Total TotalFiscal Taxable Direct ActualYear Value(1) Tax Rate(2) Value(3)
2002 2,735,580,400$ 8.2270 3,523,217,698$ 77.64 %
2003 2,896,296,585 7.9950 3,853,890,068 75.152004 3,232,006,782 7.8800 4,438,435,345 72.822005 3,617,231,257 7.6800 5,046,791,600 71.672006 4,224,788,931 7.6300 6,147,670,940 68.722007 5,545,920,863 7.1400 8,250,578,044 67.222008 6,131,757,196 6.4803 8,592,612,415 71.362009 5,568,005,895 6.4553 7,980,262,576 69.772010 4,571,916,735 6.7626 6,392,264,269 71.522011 3,889,477,697 6.7626 5,380,721,213 72.29
Value
TaxableValue as a
% of Actual
(1) Actual value less all exemptions (governmental, institutional, widow’s/widower’s, disability/blind, and homestead) and homestead assessment differential (just value minus capped value)
(2)Includes debt service
(3) Actual Value = Just Value
Source: Palm Beach County Property Appraiser
III-14
III-14
THE CITY OF BOYNTON BEACH
FY 2011 COMPREHENSIVE ANNUAL FINANCIAL REPORT
Fiscal Operating Debt Total Operating Debt Total Operating Debt TotalYear Millage Service City Millage Service County Millage Service Schools Total
2002 7.8160 0.4110 8.2270 4.5500 0.3850 4.9350 8.5470 0.4010 8.9480 2.4560 24.56602003 7.6000 0.3950 7.9950 4.5000 0.3080 4.8080 8.4270 0.3520 8.7790 2.4890 24.07102004 7.5000 0.3800 7.8800 4.5000 0.2910 4.7910 8.2510 0.3200 8.5710 2.5560 23.79802005 7.5000 0.1800 7.6800 4.5000 0.2680 4.7680 8.1580 0.2740 8.4320 2.5250 23.40502006 7.5000 0.1300 7.6300 4.4500 0.2690 4.7190 7.8840 0.2220 8.1060 2.5040 22.95902007 7.1000 0.0400 7.1400 4.2800 0.1980 4.4780 7.7120 0.1600 7.8720 2.3250 21.81502008 6.4553 0.0250 6.4803 3.7810 0.2000 3.9810 7.3560 0.0000 7.3560 2.1310 19.94832009 6.4553 0.0000 6.4553 3.7810 0.1850 3.9660 7.2510 0.0000 7.2510 2.2570 19.92932010 6.7626 0.0000 6.7626 4.7500 0.2460 4.9960 8.1540 0.0000 8.1540 2.5550 22.46762011 6.7626 0.0000 6.7626 4.7500 0.2460 4.9960 8.1540 0.0000 8.1540 2.5549 22.4675
Source: Palm Beach County Property Appraiser
Other(1)
Property Tax RatesDirect and Overlapping Governments
Last Ten Fiscal Years(Per $1,000 of Assessed Value)
City of Boynton Beach Palm Beach County Schools
Tax rate limits - Ten mills per Florida Statute 200.081Scope of tax rate limit - No municipality shall levy ad valorem taxes for real and tangible personal property in
excess of ten mills of the assessed value, except for special benefits and debt service on obligations issued with the approval of those taxpayers subject to ad valorem taxes.
Taxes due - March 31Taxes delinquent - April 1Discounts allowed - 4% November, 3% December, 2% January, 1% MarchPenalties for delinquency - 2.5% after April 1, increasing .5% each ten days to maximum of 5.0%Tax collector - Palm Beach CountyTax collector’s commission - None
(1)Other rates include the South Florida Water Management District, Florida Inland Navigation District, Palm Beach County Health Care District, and the Children’s Services Council.
III-15
III-15
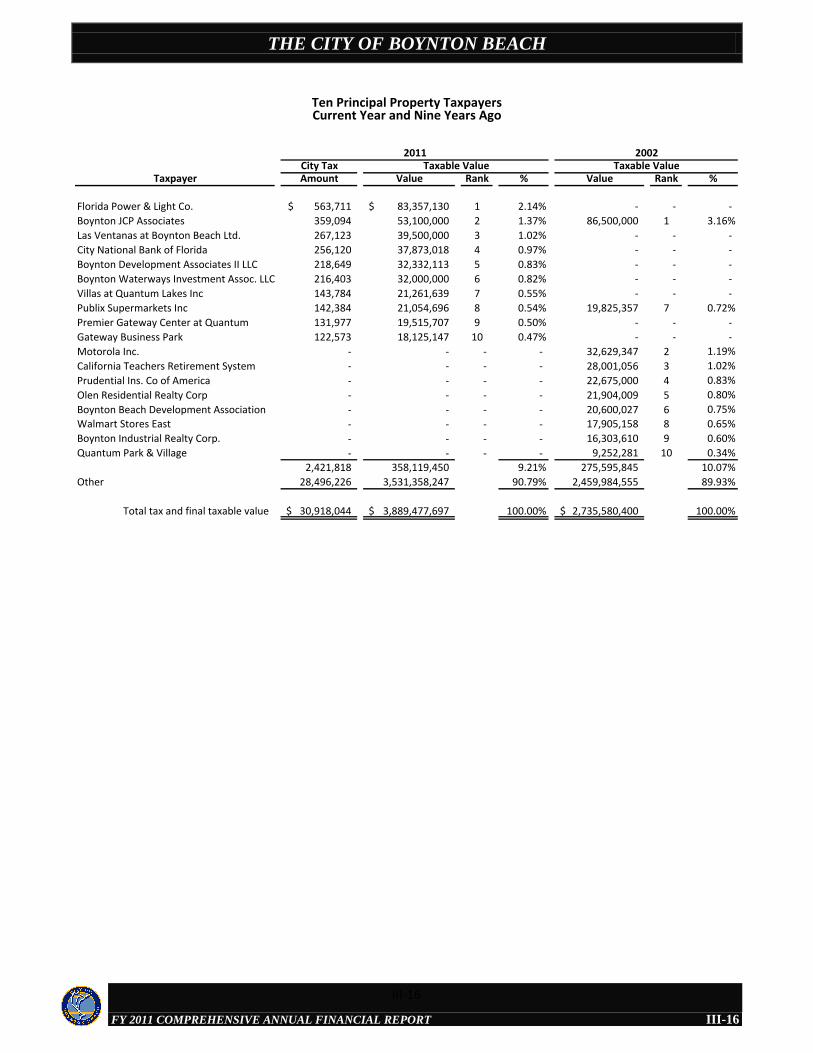
THE CITY OF BOYNTON BEACH
FY 2011 COMPREHENSIVE ANNUAL FINANCIAL REPORT
City TaxTaxpayer Amount Value Rank % Value Rank %
Florida Power & Light Co. 563,711$ 83,357,130$ 1 2.14% - - -
Boynton JCP Associates 359,094 53,100,000 2 1.37% 86,500,000 1 3.16%
Las Ventanas at Boynton Beach Ltd. 267,123 39,500,000 3 1.02% - - -
City National Bank of Florida 256,120 37,873,018 4 0.97% - - -
Boynton Development Associates II LLC 218,649 32,332,113 5 0.83% - - -
Boynton Waterways Investment Assoc. LLC 216,403 32,000,000 6 0.82% - - -
Villas at Quantum Lakes Inc 143,784 21,261,639 7 0.55% - - -
Publix Supermarkets Inc 142,384 21,054,696 8 0.54% 19,825,357 7 0.72%
Premier Gateway Center at Quantum 131,977 19,515,707 9 0.50% - - -
Gateway Business Park 122,573 18,125,147 10 0.47% - - -
Motorola Inc. - - - - 32,629,347 2 1.19%
California Teachers Retirement System - - - - 28,001,056 3 1.02%
Prudential Ins. Co of America - - - - 22,675,000 4 0.83%
Olen Residential Realty Corp - - - - 21,904,009 5 0.80%
Boynton Beach Development Association - - - - 20,600,027 6 0.75%
Walmart Stores East - - - - 17,905,158 8 0.65%
Boynton Industrial Realty Corp. - - - - 16,303,610 9 0.60%
Quantum Park & Village - - - - 9,252,281 10 0.34%
2,421,818 358,119,450 9.21% 275,595,845 10.07%
Other 28,496,226 3,531,358,247 90.79% 2,459,984,555 89.93%
Total tax and final taxable value 30,918,044$ 3,889,477,697$ 100.00% 2,735,580,400$ 100.00%
Ten Principal Property TaxpayersCurrent Year and Nine Years Ago
Taxable Value2011
Taxable Value2002
III-16
III-16
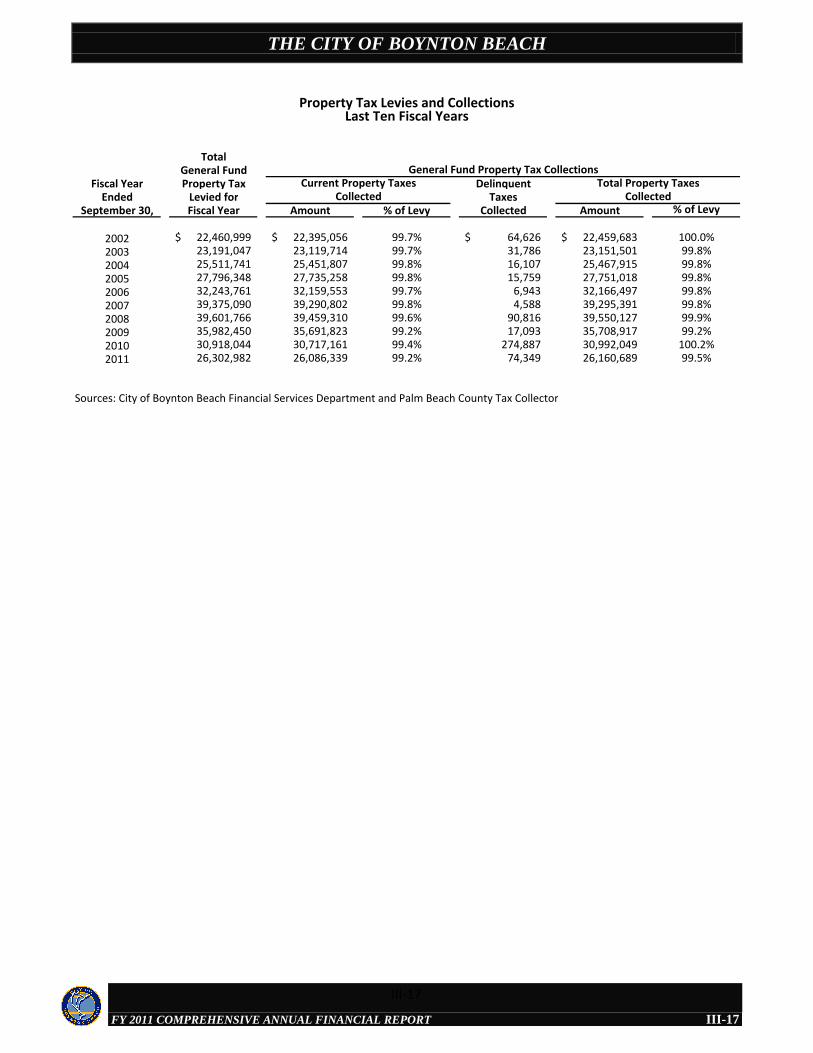
THE CITY OF BOYNTON BEACH
FY 2011 COMPREHENSIVE ANNUAL FINANCIAL REPORT
TotalGeneral Fund
Fiscal Year Property Tax DelinquentEnded Levied for Taxes
September 30, Fiscal Year Amount % of Levy Collected Amount % of Levy
2002 22,460,999$ 22,395,056$ 99.7% 64,626$ 22,459,683$ 100.0%2003 23,191,047 23,119,714 99.7% 31,786 23,151,501 99.8%2004 25,511,741 25,451,807 99.8% 16,107 25,467,915 99.8%2005 27,796,348 27,735,258 99.8% 15,759 27,751,018 99.8%2006 32,243,761 32,159,553 99.7% 6,943 32,166,497 99.8%2007 39,375,090 39,290,802 99.8% 4,588 39,295,391 99.8%2008 39,601,766 39,459,310 99.6% 90,816 39,550,127 99.9%2009 35,982,450 35,691,823 99.2% 17,093 35,708,917 99.2%2010 30,918,044 30,717,161 99.4% 274,887 30,992,049 100.2%2011 26,302,982 26,086,339 99.2% 74,349 26,160,689 99.5%
Sources: City of Boynton Beach Financial Services Department and Palm Beach County Tax Collector
Property Tax Levies and CollectionsLast Ten Fiscal Years
Collected CollectedCurrent Property Taxes Total Property Taxes
General Fund Property Tax Collections
III-17
III-17
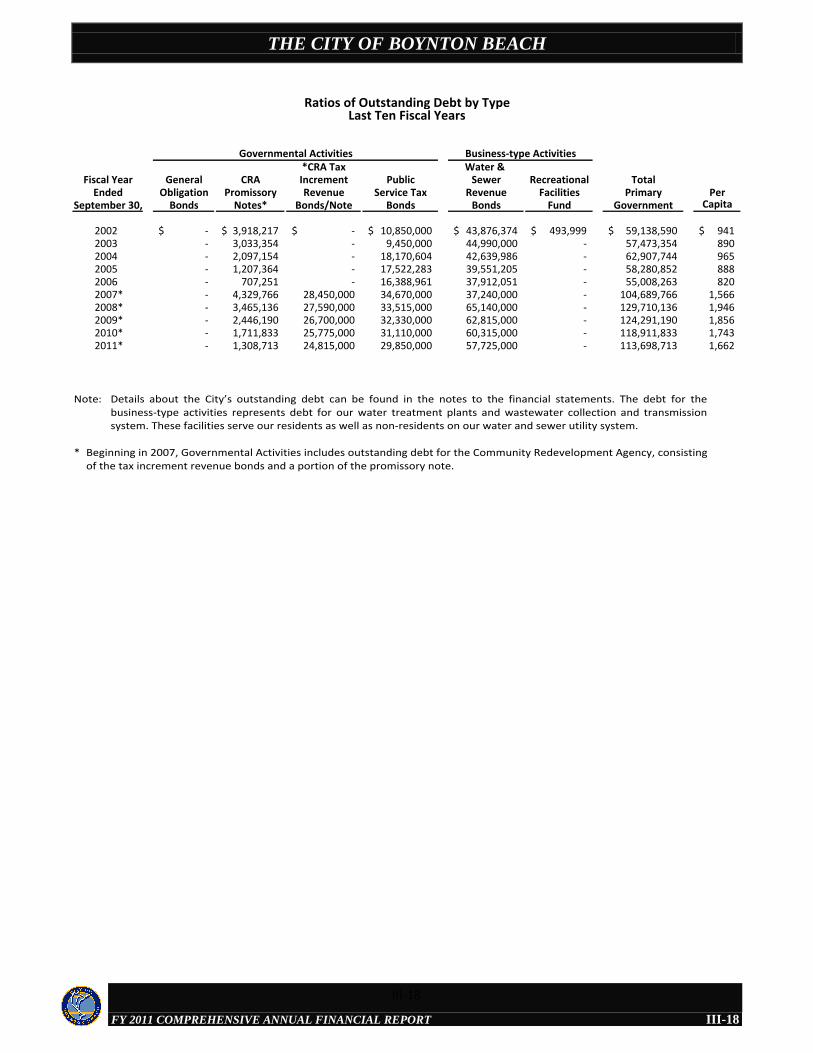
THE CITY OF BOYNTON BEACH
FY 2011 COMPREHENSIVE ANNUAL FINANCIAL REPORT
*CRA Tax Water & Fiscal Year General CRA Increment Public Sewer Recreational Total
Ended Obligation Promissory Revenue Service Tax Revenue Facilities Primary PerSeptember 30, Bonds Notes* Bonds/Note Bonds Bonds Fund Government Capita
2002 -$ 3,918,217$ -$ 10,850,000$ 43,876,374$ 493,999$ 59,138,590$ 941$ 2003 - 3,033,354 - 9,450,000 44,990,000 - 57,473,354 890 2004 - 2,097,154 - 18,170,604 42,639,986 - 62,907,744 965 2005 - 1,207,364 - 17,522,283 39,551,205 - 58,280,852 888 2006 - 707,251 - 16,388,961 37,912,051 - 55,008,263 820 2007* - 4,329,766 28,450,000 34,670,000 37,240,000 - 104,689,766 1,566 2008* - 3,465,136 27,590,000 33,515,000 65,140,000 - 129,710,136 1,946 2009* - 2,446,190 26,700,000 32,330,000 62,815,000 - 124,291,190 1,856 2010* - 1,711,833 25,775,000 31,110,000 60,315,000 - 118,911,833 1,743 2011* - 1,308,713 24,815,000 29,850,000 57,725,000 - 113,698,713 1,662
Governmental Activities Business-type Activities
Ratios of Outstanding Debt by TypeLast Ten Fiscal Years
Note: Details about the City’s outstanding debt can be found in the notes to the financial statements. The debt for the business-type activities represents debt for our water treatment plants and wastewater collection and transmission system. These facilities serve our residents as well as non-residents on our water and sewer utility system.
* Beginning in 2007, Governmental Activities includes outstanding debt for the Community Redevelopment Agency, consisting of the tax increment revenue bonds and a portion of the promissory note.
III-18
III-18
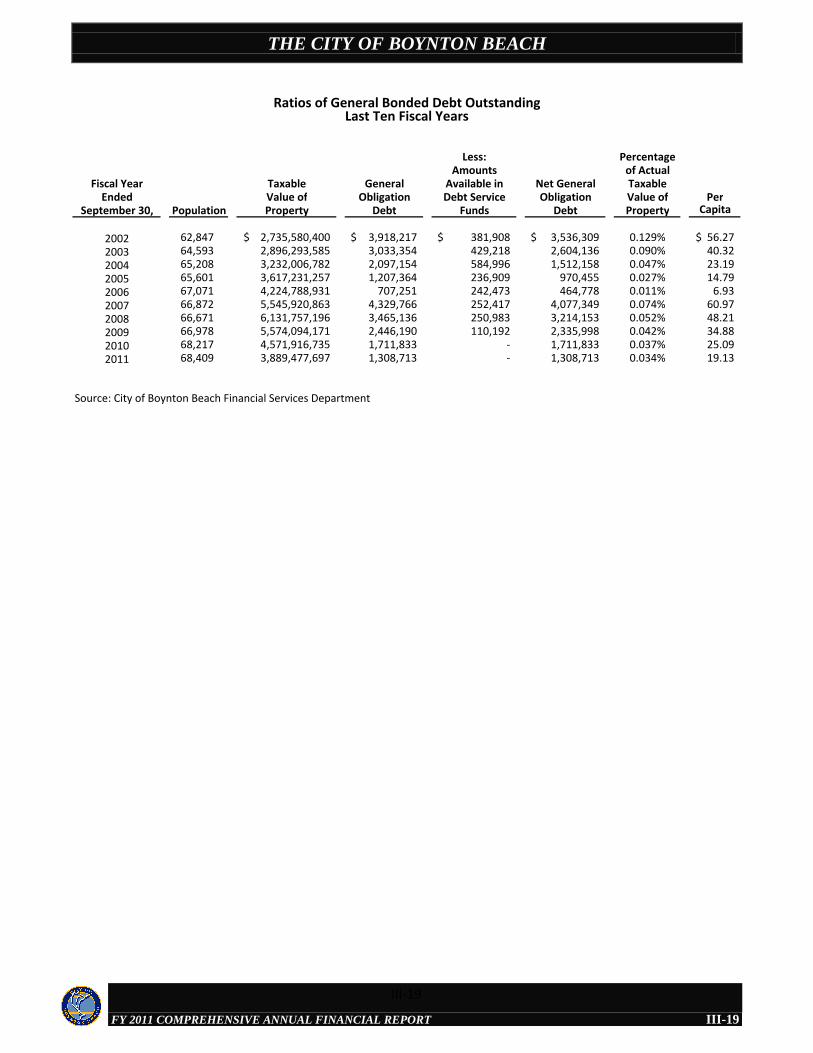
THE CITY OF BOYNTON BEACH
FY 2011 COMPREHENSIVE ANNUAL FINANCIAL REPORT
Less: PercentageAmounts of Actual
Fiscal Year Taxable General Available in Net General TaxableEnded Value of Obligation Debt Service Obligation Value of Per
September 30, Population Property Debt Funds Debt Property Capita
2002 62,847 2,735,580,400$ 3,918,217$ 381,908$ 3,536,309$ 0.129% 56.27$ 2003 64,593 2,896,293,585 3,033,354 429,218 2,604,136 0.090% 40.32 2004 65,208 3,232,006,782 2,097,154 584,996 1,512,158 0.047% 23.19 2005 65,601 3,617,231,257 1,207,364 236,909 970,455 0.027% 14.79 2006 67,071 4,224,788,931 707,251 242,473 464,778 0.011% 6.93 2007 66,872 5,545,920,863 4,329,766 252,417 4,077,349 0.074% 60.97 2008 66,671 6,131,757,196 3,465,136 250,983 3,214,153 0.052% 48.21 2009 66,978 5,574,094,171 2,446,190 110,192 2,335,998 0.042% 34.88 2010 68,217 4,571,916,735 1,711,833 - 1,711,833 0.037% 25.09 2011 68,409 3,889,477,697 1,308,713 - 1,308,713 0.034% 19.13
Source: City of Boynton Beach Financial Services Department
Ratios of General Bonded Debt OutstandingLast Ten Fiscal Years
III-19
III-19
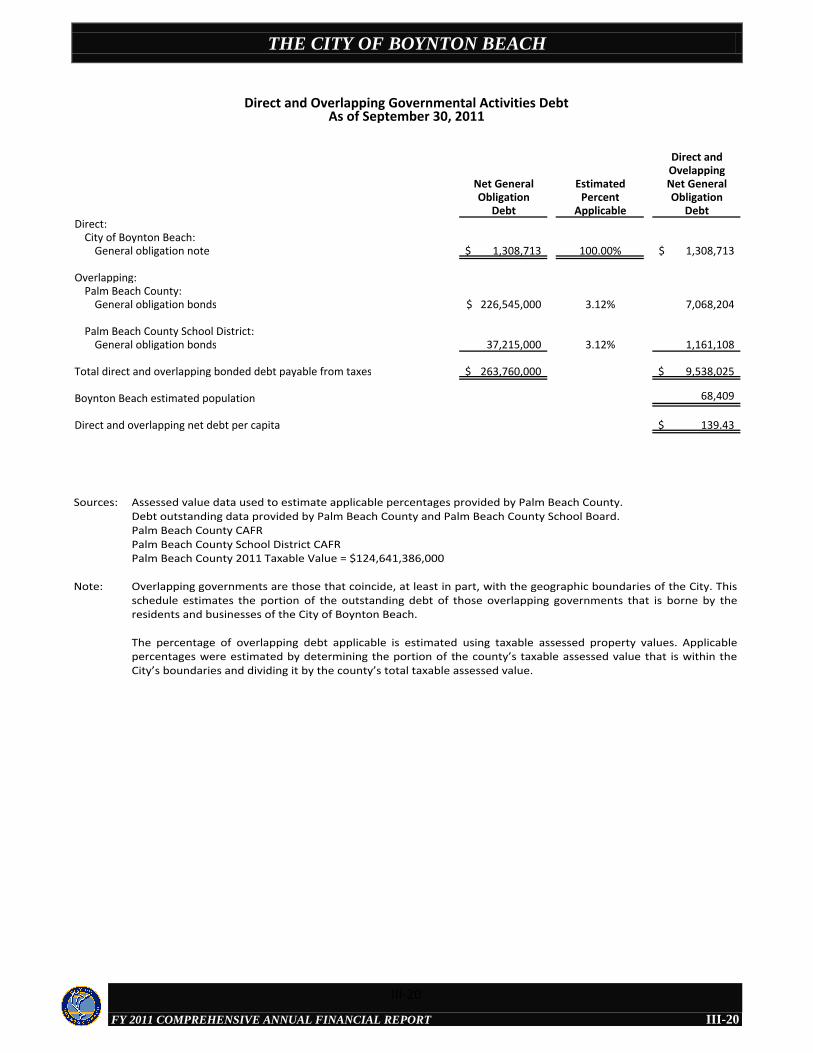
THE CITY OF BOYNTON BEACH
FY 2011 COMPREHENSIVE ANNUAL FINANCIAL REPORT
Direct andOvelapping
Net General Estimated Net GeneralObligation Percent Obligation
Debt Applicable DebtDirect:
City of Boynton Beach:General obligation note 1,308,713$ 100.00% 1,308,713$
Overlapping:Palm Beach County:
General obligation bonds 226,545,000$ 3.12% 7,068,204
Palm Beach County School District:General obligation bonds 37,215,000 3.12% 1,161,108
Total direct and overlapping bonded debt payable from taxes 263,760,000$ 9,538,025$
Boynton Beach estimated population 68,409
Direct and overlapping net debt per capita 139.43$
Direct and Overlapping Governmental Activities DebtAs of September 30, 2011
Sources: Assessed value data used to estimate applicable percentages provided by Palm Beach County. Debt outstanding data provided by Palm Beach County and Palm Beach County School Board.Palm Beach County CAFRPalm Beach County School District CAFRPalm Beach County 2011 Taxable Value = $124,641,386,000
Note: Overlapping governments are those that coincide, at least in part, with the geographic boundaries of the City. This schedule estimates the portion of the outstanding debt of those overlapping governments that is borne by the residents and businesses of the City of Boynton Beach.
The percentage of overlapping debt applicable is estimated using taxable assessed property values. Applicable percentages were estimated by determining the portion of the county’s taxable assessed value that is within the City’s boundaries and dividing it by the county’s total taxable assessed value.
III-20
III-20
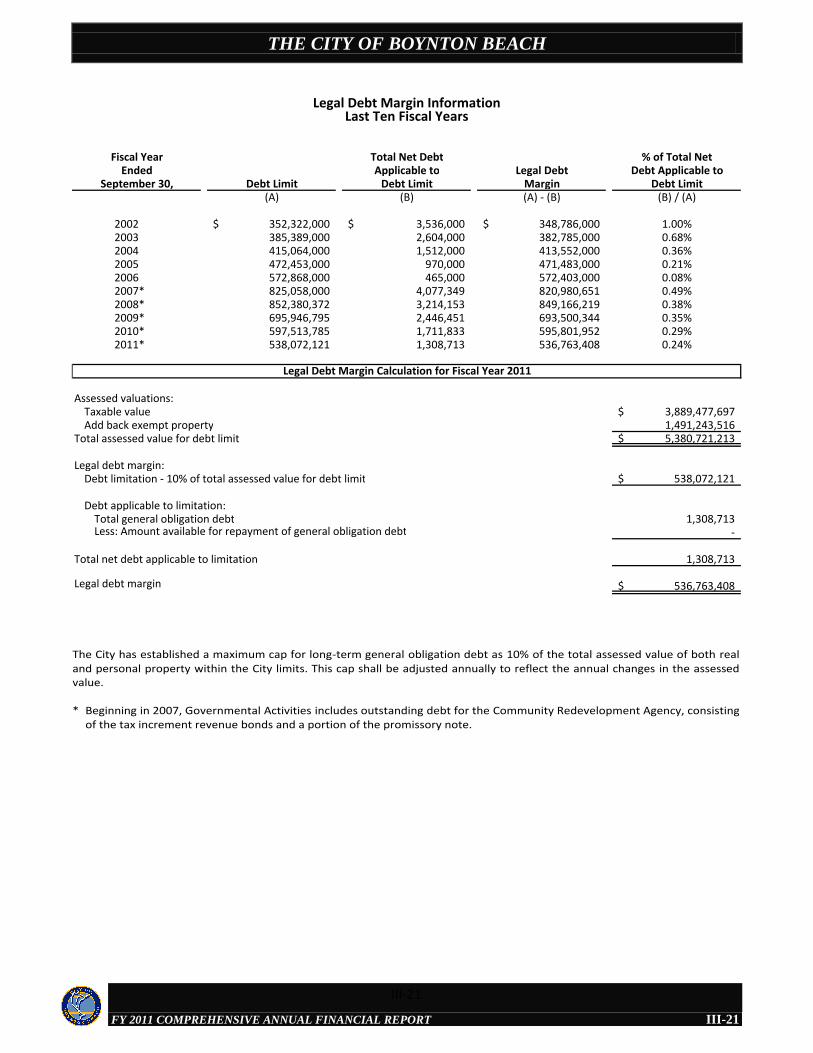
THE CITY OF BOYNTON BEACH
FY 2011 COMPREHENSIVE ANNUAL FINANCIAL REPORT
Fiscal Year Total Net Debt % of Total NetEnded Applicable to Legal Debt Debt Applicable to
September 30, Debt Limit Debt Limit Margin Debt Limit(A) (B) (A) - (B) (B) / (A)
2002 352,322,000$ 3,536,000$ 348,786,000$ 1.00%2003 385,389,000 2,604,000 382,785,000 0.68%2004 415,064,000 1,512,000 413,552,000 0.36%2005 472,453,000 970,000 471,483,000 0.21%2006 572,868,000 465,000 572,403,000 0.08%2007* 825,058,000 4,077,349 820,980,651 0.49%2008* 852,380,372 3,214,153 849,166,219 0.38%2009* 695,946,795 2,446,451 693,500,344 0.35%2010* 597,513,785 1,711,833 595,801,952 0.29%2011* 538,072,121 1,308,713 536,763,408 0.24%
Assessed valuations:Taxable value 3,889,477,697$ Add back exempt property 1,491,243,516
Total assessed value for debt limit 5,380,721,213$
Legal debt margin:Debt limitation - 10% of total assessed value for debt limit 538,072,121$
Debt applicable to limitation:Total general obligation debt 1,308,713 Less: Amount available for repayment of general obligation debt -
Total net debt applicable to limitation 1,308,713
Legal debt margin 536,763,408$
Legal Debt Margin Calculation for Fiscal Year 2011
Legal Debt Margin InformationLast Ten Fiscal Years
The City has established a maximum cap for long-term general obligation debt as 10% of the total assessed value of both real and personal property within the City limits. This cap shall be adjusted annually to reflect the annual changes in the assessed value.
* Beginning in 2007, Governmental Activities includes outstanding debt for the Community Redevelopment Agency, consisting of the tax increment revenue bonds and a portion of the promissory note.
III-21
III-21
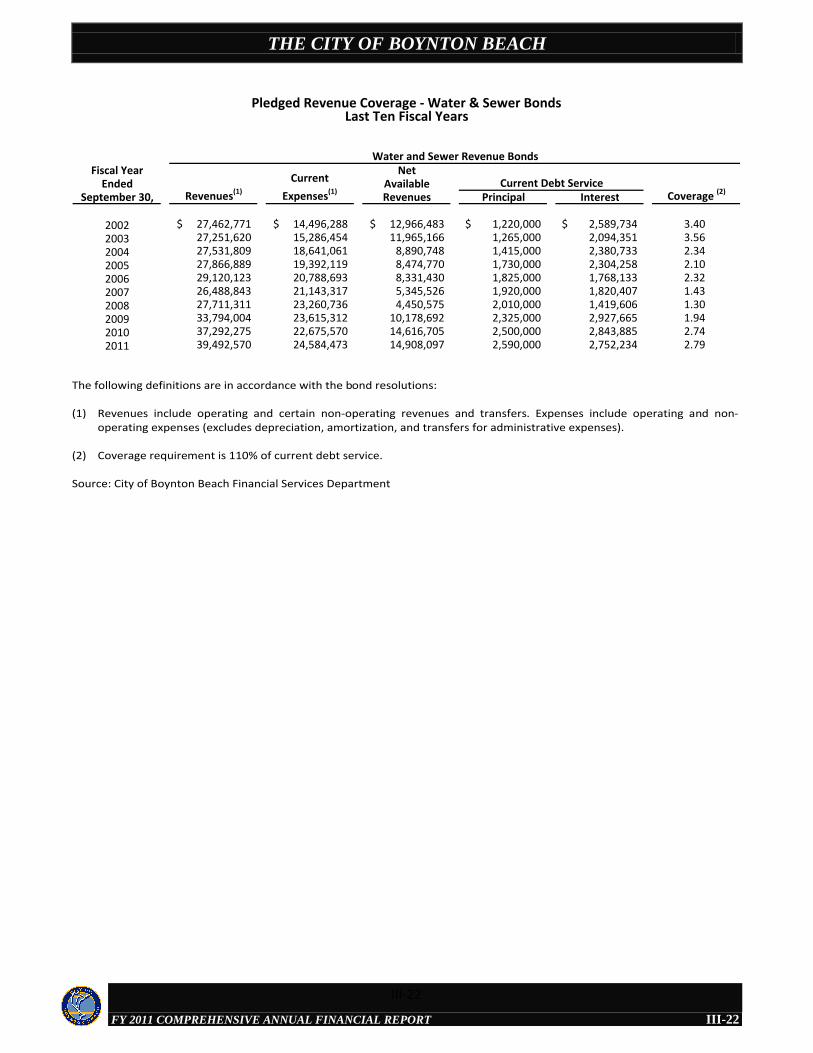
THE CITY OF BOYNTON BEACH
FY 2011 COMPREHENSIVE ANNUAL FINANCIAL REPORT
Fiscal Year NetEnded Available
September 30, Revenues Principal Interest
2002 27,462,771$ 14,496,288$ 12,966,483$ 1,220,000$ 2,589,734$ 3.402003 27,251,620 15,286,454 11,965,166 1,265,000 2,094,351 3.562004 27,531,809 18,641,061 8,890,748 1,415,000 2,380,733 2.342005 27,866,889 19,392,119 8,474,770 1,730,000 2,304,258 2.102006 29,120,123 20,788,693 8,331,430 1,825,000 1,768,133 2.322007 26,488,843 21,143,317 5,345,526 1,920,000 1,820,407 1.432008 27,711,311 23,260,736 4,450,575 2,010,000 1,419,606 1.302009 33,794,004 23,615,312 10,178,692 2,325,000 2,927,665 1.942010 37,292,275 22,675,570 14,616,705 2,500,000 2,843,885 2.742011 39,492,570 24,584,473 14,908,097 2,590,000 2,752,234 2.79
Pledged Revenue Coverage - Water & Sewer BondsLast Ten Fiscal Years
Water and Sewer Revenue Bonds
Revenues(1)
Current
Expenses(1) Coverage (2)Current Debt Service
The following definitions are in accordance with the bond resolutions:
(1) Revenues include operating and certain non-operating revenues and transfers. Expenses include operating and non-operating expenses (excludes depreciation, amortization, and transfers for administrative expenses).
(2) Coverage requirement is 110% of current debt service.
Source: City of Boynton Beach Financial Services Department
III-22
III-22
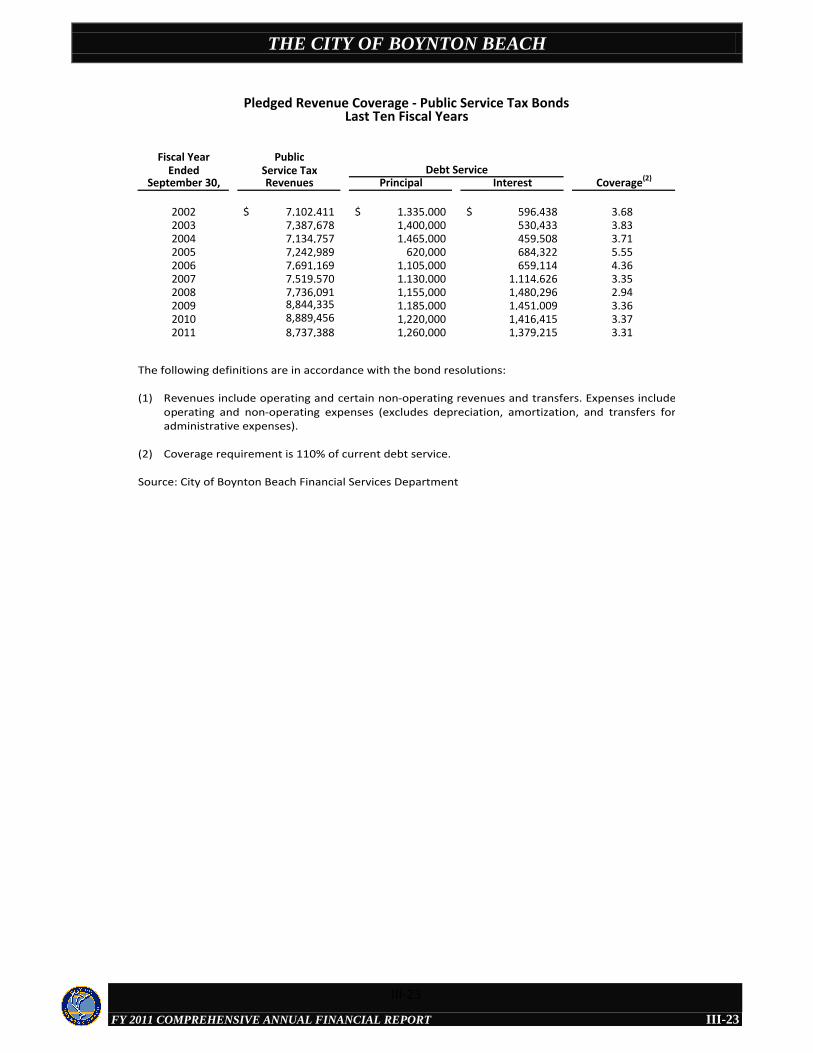
THE CITY OF BOYNTON BEACH
FY 2011 COMPREHENSIVE ANNUAL FINANCIAL REPORT
Fiscal Year PublicEnded Service Tax
September 30, Revenues Principal Interest
2002 7,102,411$ 1,335,000$ 596,438$ 3.682003 7,387,678 1,400,000 530,433 3.832004 7,134,757 1,465,000 459,508 3.712005 7,242,989 620,000 684,322 5.552006 7,691,169 1,105,000 659,114 4.362007 7,519,570 1,130,000 1,114,626 3.352008 7,736,091 1,155,000 1,480,296 2.942009 8,844,335 1,185,000 1,451,009 3.362010 8,889,456 1,220,000 1,416,415 3.372011 8,737,388 1,260,000 1,379,215 3.31
Pledged Revenue Coverage - Public Service Tax BondsLast Ten Fiscal Years
Debt ServiceCoverage(2)
The following definitions are in accordance with the bond resolutions:
(1) Revenues include operating and certain non-operating revenues and transfers. Expenses include operating and non-operating expenses (excludes depreciation, amortization, and transfers for administrative expenses).
(2) Coverage requirement is 110% of current debt service.
Source: City of Boynton Beach Financial Services Department
III-23
III-23
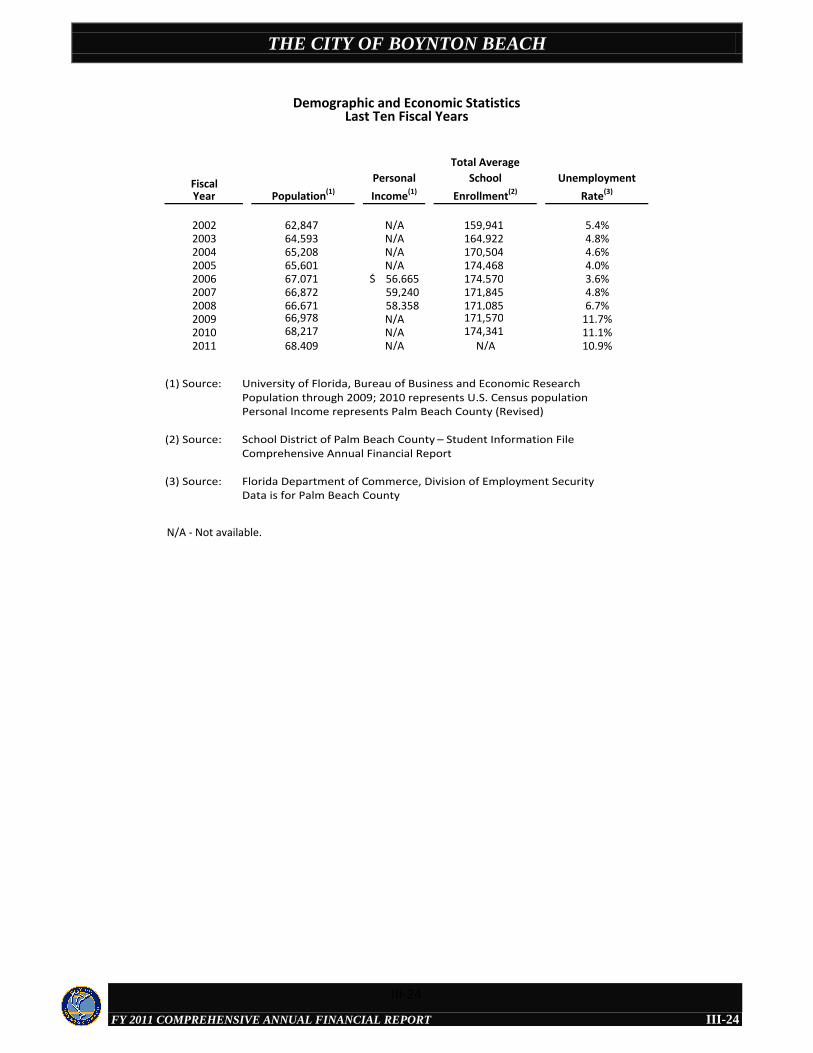
THE CITY OF BOYNTON BEACH
FY 2011 COMPREHENSIVE ANNUAL FINANCIAL REPORT
FiscalYear
2002 62,847 N/A 159,941 5.4%2003 64,593 N/A 164,922 4.8%2004 65,208 N/A 170,504 4.6%2005 65,601 N/A 174,468 4.0%2006 67,071 56,665$ 174,570 3.6%2007 66,872 59,240 171,845 4.8%2008 66,671 58,358 171,085 6.7%2009 66,978 N/A 171,570 11.7%2010 68,217 N/A 174,341 11.1%2011 68,409 N/A N/A 10.9%
N/A - Not available.
Personal
Income(1)
Total Average
School
Enrollment(2)
Unemployment
Rate(3)Population(1)
Demographic and Economic StatisticsLast Ten Fiscal Years
(1) Source: University of Florida, Bureau of Business and Economic ResearchPopulation through 2009; 2010 represents U.S. Census populationPersonal Income represents Palm Beach County (Revised)
(2) Source: School District of Palm Beach County – Student Information FileComprehensive Annual Financial Report
(3) Source: Florida Department of Commerce, Division of Employment SecurityData is for Palm Beach County
III-24
III-24
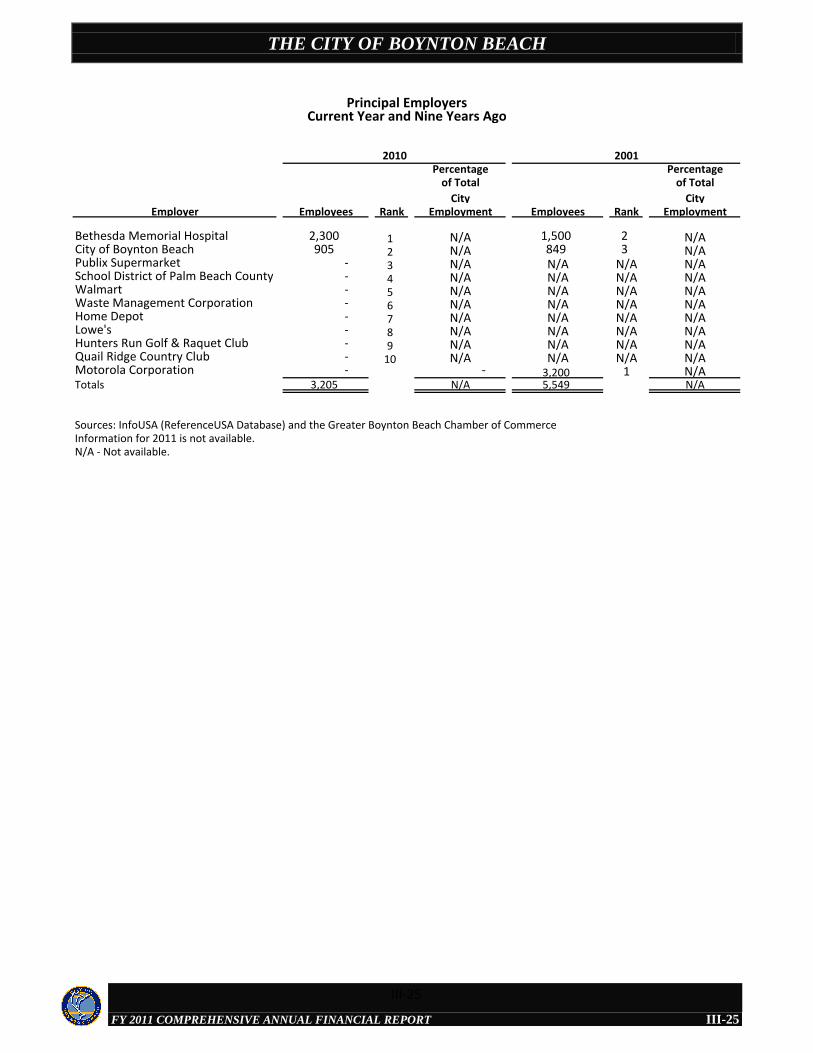
THE CITY OF BOYNTON BEACH
FY 2011 COMPREHENSIVE ANNUAL FINANCIAL REPORT
Percentage Percentageof Total of Total
City CityEmployer Employees Rank Employment Employees Rank Employment
Bethesda Memorial Hospital 2,300 1 N/A 1,500 2 N/ACity of Boynton Beach 905 2 N/A 849 3 N/APublix Supermarket - 3 N/A N/A N/A N/ASchool District of Palm Beach County - 4 N/A N/A N/A N/AWalmart - 5 N/A N/A N/A N/AWaste Management Corporation - 6 N/A N/A N/A N/AHome Depot - 7 N/A N/A N/A N/ALowe's - 8 N/A N/A N/A N/AHunters Run Golf & Raquet Club - 9 N/A N/A N/A N/AQuail Ridge Country Club - 10 N/A N/A N/A N/AMotorola Corporation - - 3,200 1 N/ATotals 3,205 N/A 5,549 N/A
Sources: InfoUSA (ReferenceUSA Database) and the Greater Boynton Beach Chamber of CommerceInformation for 2011 is not available.N/A - Not available.
20012010
Principal EmployersCurrent Year and Nine Years Ago
III-25
III-25
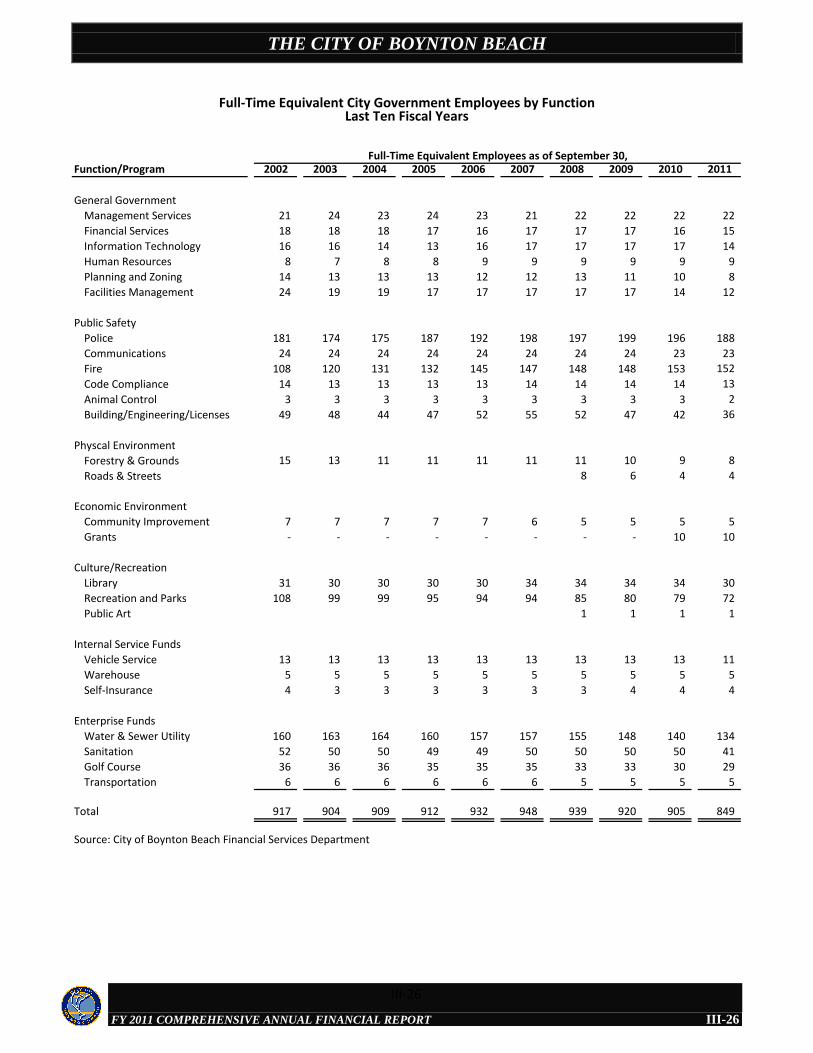
THE CITY OF BOYNTON BEACH
FY 2011 COMPREHENSIVE ANNUAL FINANCIAL REPORT
Function/Program 2002 2003 2004 2005 2006 2007 2008 2009 2010 2011
General Government
Management Services 21 24 23 24 23 21 22 22 22 22
Financial Services 18 18 18 17 16 17 17 17 16 15
Information Technology 16 16 14 13 16 17 17 17 17 14
Human Resources 8 7 8 8 9 9 9 9 9 9
Planning and Zoning 14 13 13 13 12 12 13 11 10 8
Facilities Management 24 19 19 17 17 17 17 17 14 12
Public Safety
Police 181 174 175 187 192 198 197 199 196 188
Communications 24 24 24 24 24 24 24 24 23 23
Fire 108 120 131 132 145 147 148 148 153 152
Code Compliance 14 13 13 13 13 14 14 14 14 13
Animal Control 3 3 3 3 3 3 3 3 3 2
Building/Engineering/Licenses 49 48 44 47 52 55 52 47 42 36
Physcal Environment
Forestry & Grounds 15 13 11 11 11 11 11 10 9 8
Roads & Streets 8 6 4 4
Economic Environment
Community Improvement 7 7 7 7 7 6 5 5 5 5
Grants - - - - - - - - 10 10
Culture/Recreation
Library 31 30 30 30 30 34 34 34 34 30
Recreation and Parks 108 99 99 95 94 94 85 80 79 72
Public Art 1 1 1 1
Internal Service Funds
Vehicle Service 13 13 13 13 13 13 13 13 13 11
Warehouse 5 5 5 5 5 5 5 5 5 5
Self-Insurance 4 3 3 3 3 3 3 4 4 4
Enterprise Funds
Water & Sewer Utility 160 163 164 160 157 157 155 148 140 134
Sanitation 52 50 50 49 49 50 50 50 50 41
Golf Course 36 36 36 35 35 35 33 33 30 29
Transportation 6 6 6 6 6 6 5 5 5 5
Total 917 904 909 912 932 948 939 920 905 849
Source: City of Boynton Beach Financial Services Department
Full-Time Equivalent Employees as of September 30,
Full-Time Equivalent City Government Employees by FunctionLast Ten Fiscal Years
III-26
III-26
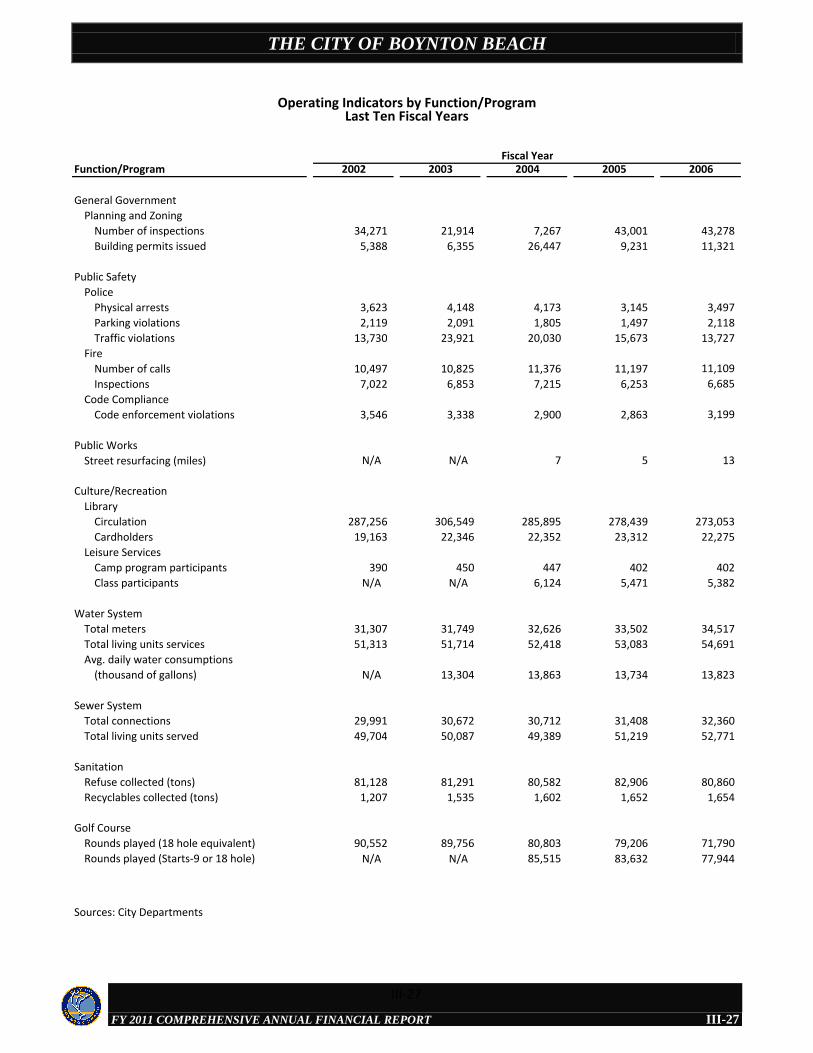
THE CITY OF BOYNTON BEACH
FY 2011 COMPREHENSIVE ANNUAL FINANCIAL REPORT
Function/Program 2002 2003 2004 2005 2006
General Government
Planning and Zoning
Number of inspections 34,271 21,914 7,267 43,001 43,278
Building permits issued 5,388 6,355 26,447 9,231 11,321
Public Safety
Police
Physical arrests 3,623 4,148 4,173 3,145 3,497
Parking violations 2,119 2,091 1,805 1,497 2,118
Traffic violations 13,730 23,921 20,030 15,673 13,727
Fire
Number of calls 10,497 10,825 11,376 11,197 11,109
Inspections 7,022 6,853 7,215 6,253 6,685
Code Compliance
Code enforcement violations 3,546 3,338 2,900 2,863 3,199
Public Works
Street resurfacing (miles) N/A N/A 7 5 13
Culture/Recreation
Library
Circulation 287,256 306,549 285,895 278,439 273,053
Cardholders 19,163 22,346 22,352 23,312 22,275
Leisure Services
Camp program participants 390 450 447 402 402
Class participants N/A N/A 6,124 5,471 5,382
Water System
Total meters 31,307 31,749 32,626 33,502 34,517
Total living units services 51,313 51,714 52,418 53,083 54,691
Avg. daily water consumptions
(thousand of gallons) N/A 13,304 13,863 13,734 13,823
Sewer System
Total connections 29,991 30,672 30,712 31,408 32,360
Total living units served 49,704 50,087 49,389 51,219 52,771
Sanitation
Refuse collected (tons) 81,128 81,291 80,582 82,906 80,860
Recyclables collected (tons) 1,207 1,535 1,602 1,652 1,654
Golf Course
Rounds played (18 hole equivalent) 90,552 89,756 80,803 79,206 71,790
Rounds played (Starts-9 or 18 hole) N/A N/A 85,515 83,632 77,944
Sources: City Departments
Fiscal Year
Operating Indicators by Function/ProgramLast Ten Fiscal Years
III-27
III-27
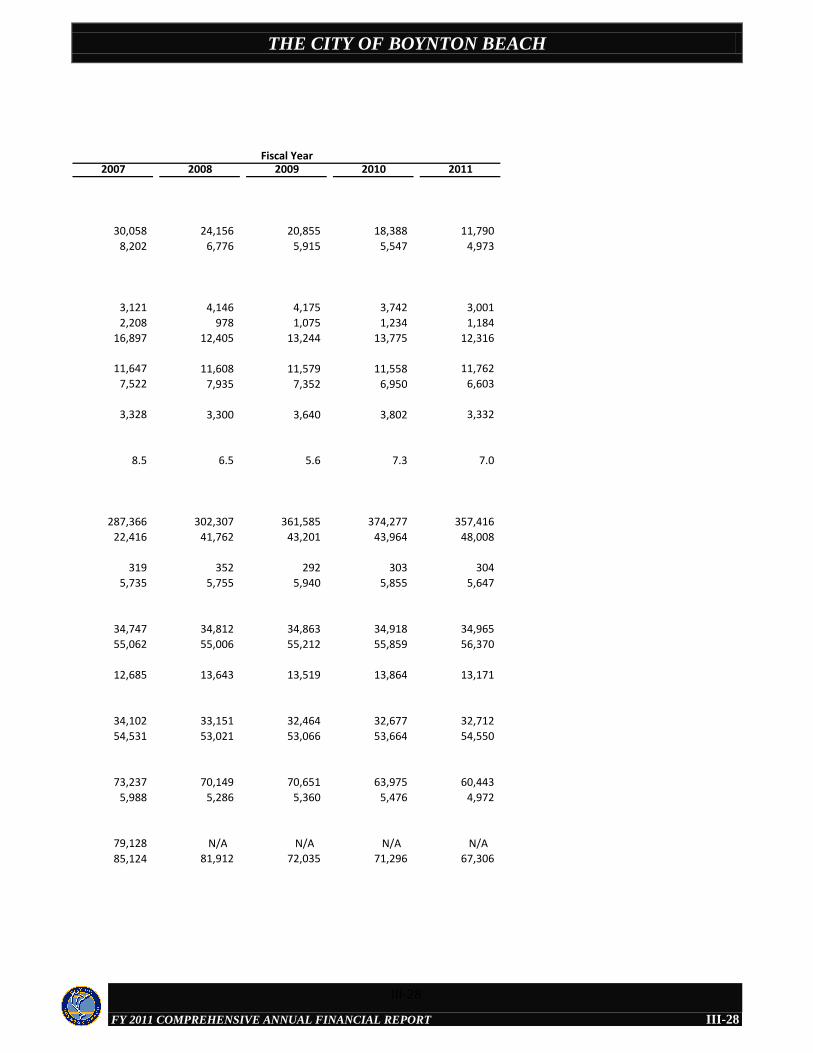
THE CITY OF BOYNTON BEACH
FY 2011 COMPREHENSIVE ANNUAL FINANCIAL REPORT
2007 2008 2009 2010 2011
30,058 24,156 20,855 18,388 11,790
8,202 6,776 5,915 5,547 4,973
3,121 4,146 4,175 3,742 3,001
2,208 978 1,075 1,234 1,184
16,897 12,405 13,244 13,775 12,316
11,647 11,608 11,579 11,558 11,762
7,522 7,935 7,352 6,950 6,603
3,328 3,300 3,640 3,802 3,332
8.5 6.5 5.6 7.3 7.0
287,366 302,307 361,585 374,277 357,416
22,416 41,762 43,201 43,964 48,008
319 352 292 303 304
5,735 5,755 5,940 5,855 5,647
34,747 34,812 34,863 34,918 34,965
55,062 55,006 55,212 55,859 56,370
12,685 13,643 13,519 13,864 13,171
34,102 33,151 32,464 32,677 32,712
54,531 53,021 53,066 53,664 54,550
73,237 70,149 70,651 63,975 60,443
5,988 5,286 5,360 5,476 4,972
79,128 N/A N/A N/A N/A
85,124 81,912 72,035 71,296 67,306
Fiscal Year
III-28
III-28
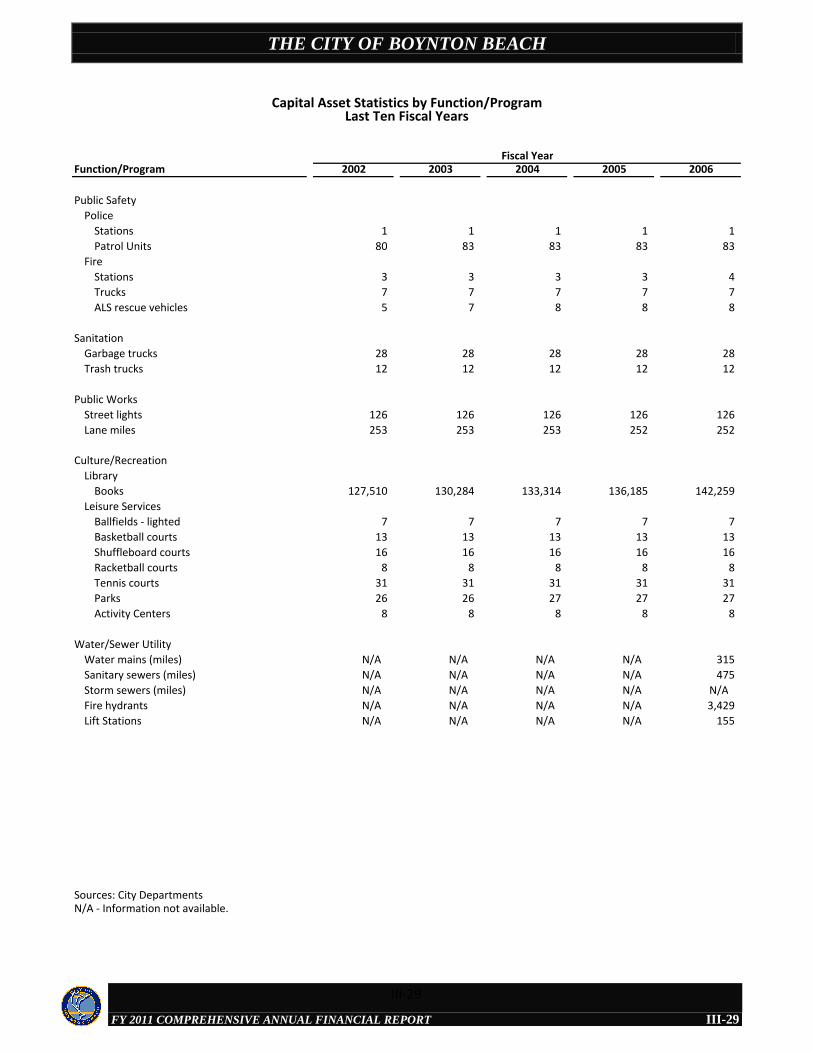
THE CITY OF BOYNTON BEACH
FY 2011 COMPREHENSIVE ANNUAL FINANCIAL REPORT
Function/Program 2002 2003 2004 2005 2006
Public Safety
Police
Stations 1 1 1 1 1
Patrol Units 80 83 83 83 83
Fire
Stations 3 3 3 3 4
Trucks 7 7 7 7 7
ALS rescue vehicles 5 7 8 8 8
Sanitation
Garbage trucks 28 28 28 28 28
Trash trucks 12 12 12 12 12
Public Works
Street lights 126 126 126 126 126
Lane miles 253 253 253 252 252
Culture/Recreation
Library
Books 127,510 130,284 133,314 136,185 142,259
Leisure Services
Ballfields - lighted 7 7 7 7 7
Basketball courts 13 13 13 13 13
Shuffleboard courts 16 16 16 16 16
Racketball courts 8 8 8 8 8
Tennis courts 31 31 31 31 31
Parks 26 26 27 27 27
Activity Centers 8 8 8 8 8
Water/Sewer Utility
Water mains (miles) N/A N/A N/A N/A 315
Sanitary sewers (miles) N/A N/A N/A N/A 475
Storm sewers (miles) N/A N/A N/A N/A N/A
Fire hydrants N/A N/A N/A N/A 3,429
Lift Stations N/A N/A N/A N/A 155
Sources: City DepartmentsN/A - Information not available.
Capital Asset Statistics by Function/ProgramLast Ten Fiscal Years
Fiscal Year
III-29
III-29
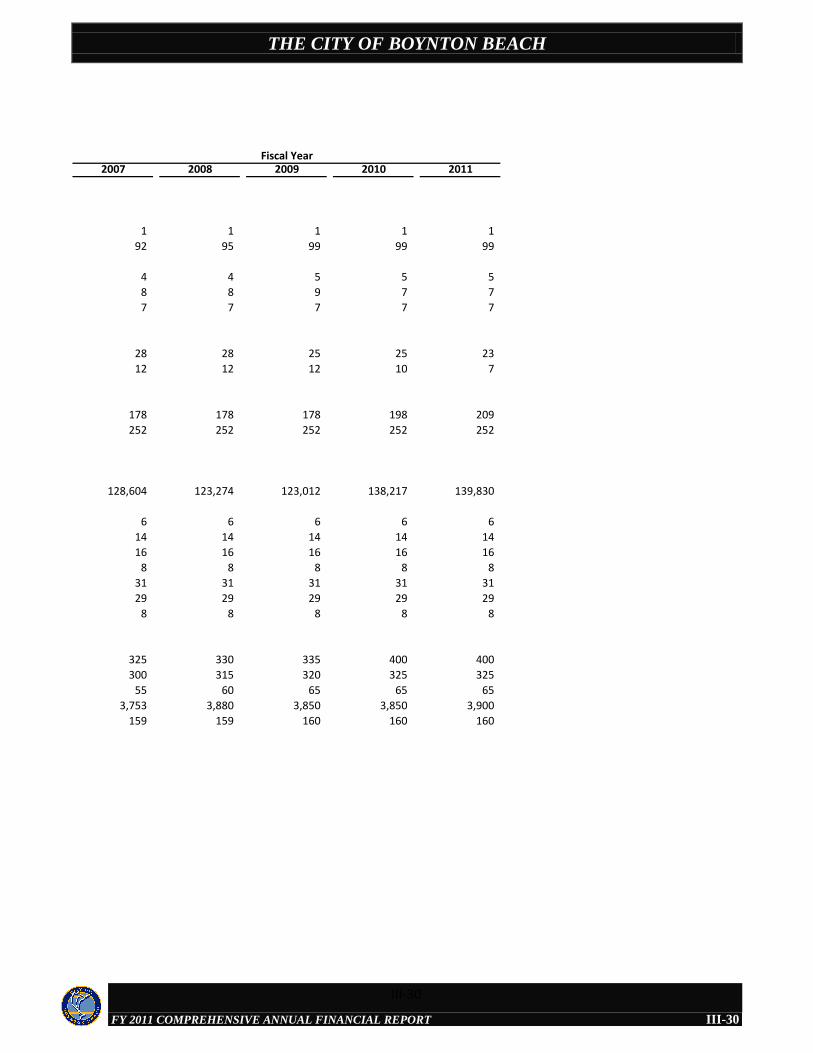
THE CITY OF BOYNTON BEACH
FY 2011 COMPREHENSIVE ANNUAL FINANCIAL REPORT
2007 2008 2009 2010 2011
1 1 1 1 1
92 95 99 99 99
4 4 5 5 5
8 8 9 7 7
7 7 7 7 7
28 28 25 25 23
12 12 12 10 7
178 178 178 198 209
252 252 252 252 252
128,604 123,274 123,012 138,217 139,830
6 6 6 6 6
14 14 14 14 14
16 16 16 16 16
8 8 8 8 8
31 31 31 31 31
29 29 29 29 29
8 8 8 8 8
325 330 335 400 400
300 315 320 325 325
55 60 65 65 65
3,753 3,880 3,850 3,850 3,900
159 159 160 160 160
Fiscal Year
III-30
III-30

THE CITY OF BOYNTON BEACH
FY 2011 COMPREHENSIVE ANNUAL FINANCIAL REPORT
COMPLIANCE SECTION
THE CITY OF BOYNTON BEACH
FY 2011 COMPREHENSIVE ANNUAL FINANCIAL REPORT
CALER,DONTEN,LEVINE, COHEN,PORTER &VEIL,P.A.
CERTIFIED PUBLIC ACCOUNTANTS
WILLIAM K CALER, JR , CPALOUIS M COHEN, CPAJOHN C COURTNEY, CPA, JDDAVID S DONTEN, CPAJAMES B HUTCHISON, CPA
JOEL H LEVINE, CPAJAMES F MULLEN, IV, CPATHOMAS A PENCE, JR , CPASCOTT L PORTER, CPAMARK D VEIL, CPA
505 SOUTH FLAGLER DRIVE, SUITE 900WEST PALM BEACH, FL 33401-5948
TELEPHONE (561) 832-9292FAX (561) 832-9455
info@cdlcpa com
MEMBERSAMERICAN INSTITUTE OF
CERTIFIED PUBLIC ACCOUNTANTS
FLORIDA INSTITUTE OF
CERTIFIED PUBLIC ACCOUNTANTS
IV-1
Independent Auditor’s Report on Internal Control Over Financial Reporting
and on Compliance and Other Matters Based on an Audit of FinancialStatements Performed in Accordance With Government Auditing Standards
To the Honorable Mayor and
City CommissionCity of Boynton Beach, Florida
We have audited the accompanying financial statements of the governmental activities, the business-type
activities, the aggregate discretely presented component units, each major fund, and the aggregate
remaining fund information of the City of Boynton Beach, Florida, as of and for the year endedSeptember 30, 2011, which collectively comprise the basic financial statements of the City of Boynton
Beach, Florida, and have issued our report thereon dated December 10, 2012. Our report was modified to include a reference to other auditors. We conducted our audit in accordance with U.S. generally accepted
auditing standards and the standards applicable to financial audits contained in Government Auditing Standards, issued by the Comptroller General of the United States. Other auditors audited the financial
statements of the Boynton Beach Community Redevelopment Agency (CRA), a major governmental fundof the City, and the City of Boynton Beach General Employees’ Pension Plan, City of Boynton Beach
Police Officers’ Pension Fund and City of Boynton Beach Firefighters’ Pension Fund, which are fiduciary
funds of the City, as described in our report on the financial statements of the City of Boynton Beach, Florida. This report does not include the results of the other auditors’ testing of internal control over
financial reporting or compliance and other matters that are reported on separately by those auditors. The financial statements of the City of Boynton Beach Police Officers’ Pension Fund and City of Boynton
Beach Firefighters’ Pension Fund were not audited in accordance with Government Auditing Standards.
Internal Control Over Financial Reporting
Management of the City of Boynton Beach, Florida, is responsible for establishing and maintaining effective internal control over financial reporting. In planning and performing our audit, we considered
the City’s internal control over financial reporting as a basis for designing our auditing procedures for the
purpose of expressing our opinions on the financial statements, but not for the purpose of expressing an opinion on the effectiveness of the internal control over financial reporting of the City of Boynton Beach,
Florida. Accordingly, we do not express an opinion on the effectiveness of the internal control over financial reporting of the City of Boynton Beach, Florida.
A deficiency in internal control exists when the design or operation of a control does not allow management
or employees, in the normal course of performing their assigned functions, to prevent, or detect and correct misstatements on a timely basis. A material weakness is a deficiency, or a combination of
deficiencies, in internal control such that there is a reasonable possibility that a material misstatement of
the entity’s financial statements will not be prevented, or detected and corrected on a timely basis.
IV-1
THE CITY OF BOYNTON BEACH
FY 2011 COMPREHENSIVE ANNUAL FINANCIAL REPORT
IV-2
Our consideration of internal control over financial reporting was for the limited purpose described in the first paragraph of this section and was not designed to identify all deficiencies in internal control over financial reporting that might be deficiencies, significant deficiencies, or material weaknesses. We did not identify any deficiencies in internal control over financial reporting that we consider to be material weaknesses, as defined previously. However, we identified one deficiency in internal control over financial reporting, described in the accompanying Schedule of Findings and Questioned Costs as item 2011-01 that we consider to be significant deficiencies in internal control over financial reporting. A significant deficiency is a deficiency, or a combination of deficiencies, in internal control that is less severe than a material weakness, yet important enough to merit attention by those charged with governance. Compliance and Other Matters As part of obtaining reasonable assurance about whether the financial statements of the City of Boynton Beach, Florida, are free of material misstatement, we performed tests of its compliance with certain provisions of laws, regulations, contracts, and grant agreements, noncompliance with which could have a direct and material effect on the determination of financial statement amounts. However, providing an opinion on compliance with those provisions was not an objective of our audit and, accordingly, we do not express such an opinion. The results of our tests disclosed no instances of noncompliance or other matters that are required to be reported under Government Auditing Standards. We noted certain additional matters that we reported to the City in a separate management letter dated December 10, 2012. The responses by the City of Boynton Beach, Florida, to the findings identified in our audit are described in the accompanying Schedule of Findings and Questioned Costs and the City’s response to our management letter. We did not audit the responses by the City of Boynton Beach, Florida, and, accordingly, we express no opinion on those responses. This report is intended solely for the information and use of the City Commission, management and others within the City of Boynton Beach, Florida, Federal awarding agencies and pass-through entities, and the Auditor General of the State of Florida and is not intended to be and should not be used by anyone other than these specified parties.
December 10, 2012
IV-2
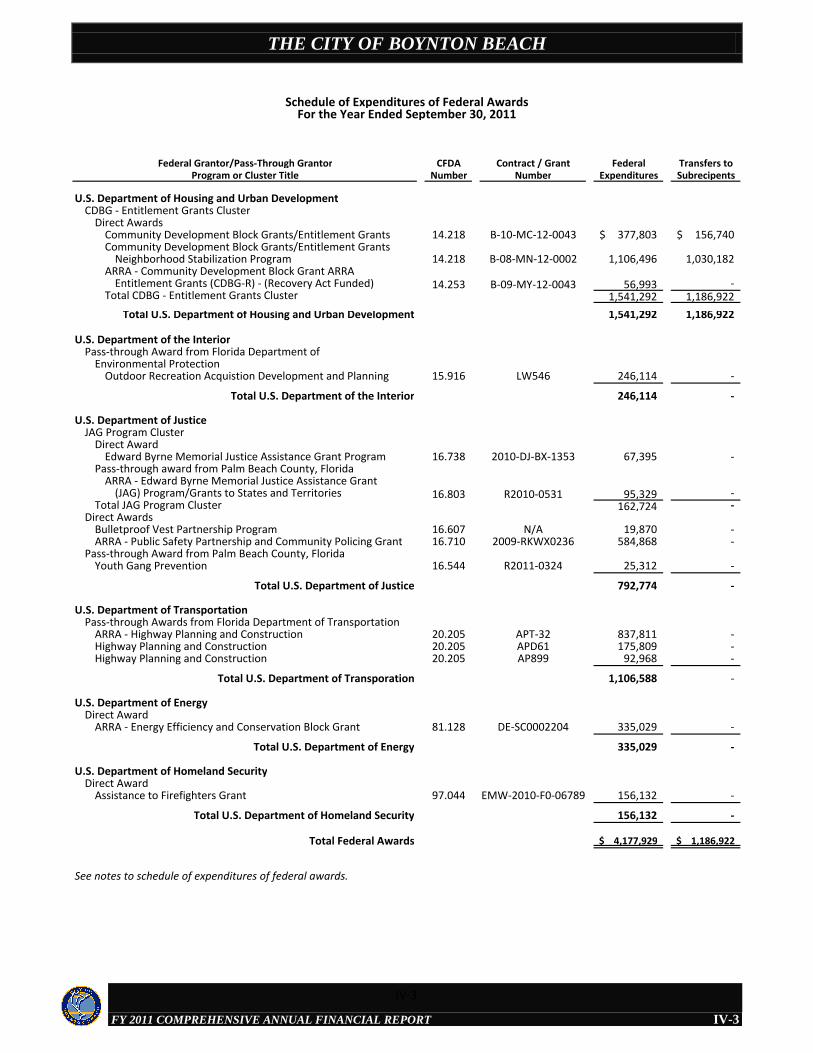
THE CITY OF BOYNTON BEACH
FY 2011 COMPREHENSIVE ANNUAL FINANCIAL REPORT
Federal Grantor/Pass-Through Grantor CFDA Contract / Grant Federal Transfers toProgram or Cluster Title Number Number Expenditures Subrecipents
U.S. Department of Housing and Urban DevelopmentCDBG - Entitlement Grants Cluster
Direct AwardsCommunity Development Block Grants/Entitlement Grants 14.218 B-10-MC-12-0043 377,803$ 156,740$ Community Development Block Grants/Entitlement Grants
Neighborhood Stabilization Program 14.218 B-08-MN-12-0002 1,106,496 1,030,182 ARRA - Community Development Block Grant ARRA
Entitlement Grants (CDBG-R) - (Recovery Act Funded) 14.253 B-09-MY-12-0043 56,993 - Total CDBG - Entitlement Grants Cluster 1,541,292 1,186,922
Total U.S. Department of Housing and Urban Development 1,541,292 1,186,922
U.S. Department of the InteriorPass-through Award from Florida Department of
Environmental ProtectionOutdoor Recreation Acquistion Development and Planning 15.916 LW546 246,114 -
Total U.S. Department of the Interior 246,114 -
U.S. Department of Justice JAG Program Cluster
Direct AwardEdward Byrne Memorial Justice Assistance Grant Program 16.738 2010-DJ-BX-1353 67,395 -
Pass-through award from Palm Beach County, FloridaARRA - Edward Byrne Memorial Justice Assistance Grant
(JAG) Program/Grants to States and Territories 16.803 R2010-0531 95,329 - Total JAG Program Cluster 162,724 -
Direct AwardsBulletproof Vest Partnership Program 16.607 N/A 19,870 - ARRA - Public Safety Partnership and Community Policing Grant 16.710 2009-RKWX0236 584,868 -
Pass-through Award from Palm Beach County, FloridaYouth Gang Prevention 16.544 R2011-0324 25,312 -
Total U.S. Department of Justice 792,774 -
U.S. Department of TransportationPass-through Awards from Florida Department of Transportation
ARRA - Highway Planning and Construction 20.205 APT-32 837,811 - Highway Planning and Construction 20.205 APD61 175,809 - Highway Planning and Construction 20.205 AP899 92,968 -
Total U.S. Department of Transporation 1,106,588 -
U.S. Department of EnergyDirect Award
ARRA - Energy Efficiency and Conservation Block Grant 81.128 DE-SC0002204 335,029 -
Total U.S. Department of Energy 335,029 -
U.S. Department of Homeland SecurityDirect Award
Assistance to Firefighters Grant 97.044 EMW-2010-F0-06789 156,132 -
Total U.S. Department of Homeland Security 156,132 -
Total Federal Awards 4,177,929$ 1,186,922$
See notes to schedule of expenditures of federal awards.
Schedule of Expenditures of Federal AwardsFor the Year Ended September 30, 2011
IV-3
IV-3
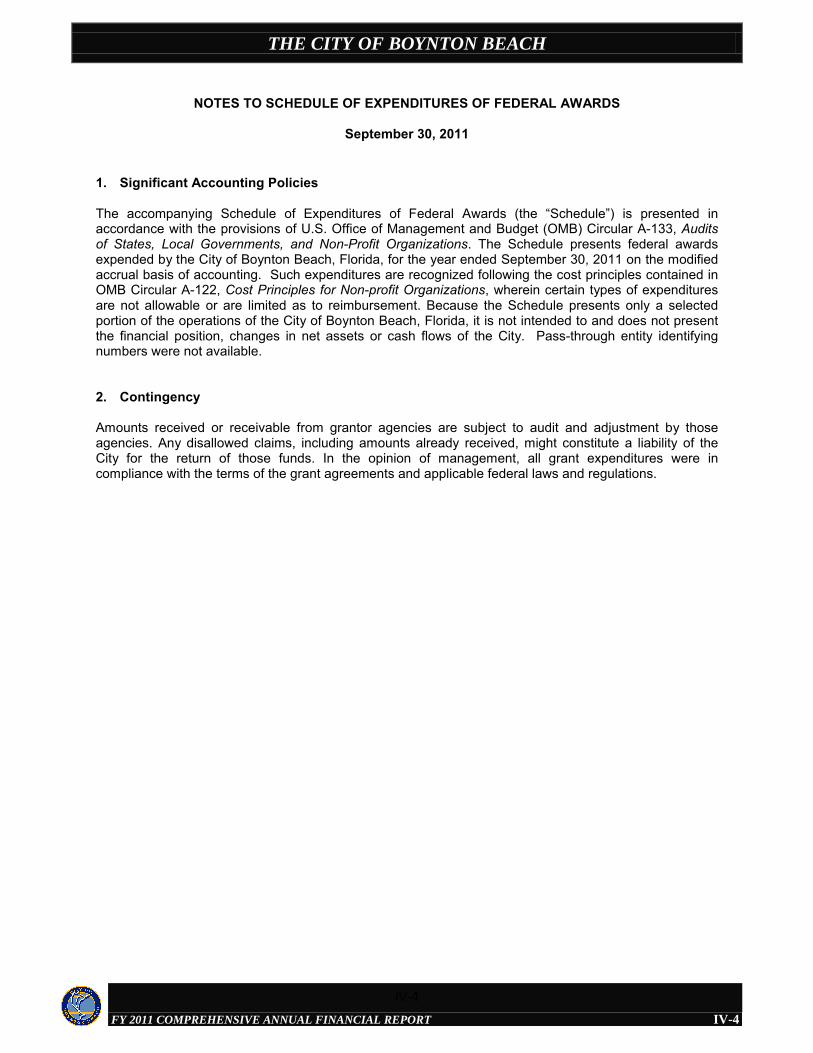
THE CITY OF BOYNTON BEACH
FY 2011 COMPREHENSIVE ANNUAL FINANCIAL REPORT
NOTES TO SCHEDULE OF EXPENDITURES OF FEDERAL AWARDS
September 30, 2011
IV-4
1. Significant Accounting Policies
The accompanying Schedule of Expenditures of Federal Awards (the “Schedule”) is presented in accordance with the provisions of U.S. Office of Management and Budget (OMB) Circular A-133, Auditsof States, Local Governments, and Non-Profit Organizations. The Schedule presents federal awards expended by the City of Boynton Beach, Florida, for the year ended September 30, 2011 on the modified accrual basis of accounting. Such expenditures are recognized following the cost principles contained in OMB Circular A-122, Cost Principles for Non-profit Organizations, wherein certain types of expenditures are not allowable or are limited as to reimbursement. Because the Schedule presents only a selected portion of the operations of the City of Boynton Beach, Florida, it is not intended to and does not present the financial position, changes in net assets or cash flows of the City. Pass-through entity identifying numbers were not available.
2. Contingency
Amounts received or receivable from grantor agencies are subject to audit and adjustment by those agencies. Any disallowed claims, including amounts already received, might constitute a liability of the City for the return of those funds. In the opinion of management, all grant expenditures were in compliance with the terms of the grant agreements and applicable federal laws and regulations.
IV-4
THE CITY OF BOYNTON BEACH
FY 2011 COMPREHENSIVE ANNUAL FINANCIAL REPORT
CALER,DONTEN,LEVINE, COHEN,PORTER &VEIL,P.A.
CERTIFIED PUBLIC ACCOUNTANTS
WILLIAM K CALER, JR , CPALOUIS M COHEN, CPAJOHN C COURTNEY, CPA, JDDAVID S DONTEN, CPAJAMES B HUTCHISON, CPA
JOEL H LEVINE, CPAJAMES F MULLEN, IV, CPATHOMAS A PENCE, JR , CPASCOTT L PORTER, CPAMARK D VEIL, CPA
505 SOUTH FLAGLER DRIVE, SUITE 900WEST PALM BEACH, FL 33401-5948
TELEPHONE (561) 832-9292FAX (561) 832-9455
info@cdlcpa com
MEMBERSAMERICAN INSTITUTE OF
CERTIFIED PUBLIC ACCOUNTANTS
FLORIDA INSTITUTE OF
CERTIFIED PUBLIC ACCOUNTANTS
IV-5
Independent Auditor’s Report on Compliance With Requirements That
Could Have a Direct and Material Effect on Each Major Federal Program andon Internal Control Over Compliance in Accordance With OMB Circular A-133
To the Honorable Mayor and
City CommissionCity of Boynton Beach, Florida
Compliance
We have audited the compliance of the City of Boynton Beach, Florida, with the types of compliance
requirements described in the OMB Circular A-133 Compliance Supplement that could have a direct and material effect on each of the major federal programs of the City of Boynton Beach, Florida, for the year
ended September 30, 2011. The major federal programs of the City of Boynton Beach, Florida, are identified in the summary of auditor’s results section of the accompanying Schedule of Findings and
Questioned Costs. Compliance with the requirements of laws, regulations, contracts, and grants applicable to each of its major Federal programs is the responsibility of the management of the City of
Boynton Beach, Florida. Our responsibility is to express an opinion on compliance by the City of Boynton Beach, Florida, based on our audit.
We conducted our audit of compliance in accordance with U.S. generally accepted auditing standards;the standards applicable to financial audits contained in Government Auditing Standards, issued by the
Comptroller General of the United States; and OMB Circular A-133, Audits of States, Local Governments, and Non-Profit Organizations. Those standards and OMB Circular A-133 require that we plan and perform
the audit to obtain reasonable assurance about whether noncompliance with the types of compliance requirements referred to above that could have a direct and material effect on a major Federal program
occurred. An audit includes examining, on a test basis, evidence about compliance by the City of Boynton Beach, Florida, with those requirements and performing such other procedures as we
considered necessary in the circumstances. We believe that our audit provides a reasonable basis for our
opinion. Our audit does not provide a legal determination on compliance by the City of Boynton Beach, Florida, with those requirements.
In our opinion, the City of Boynton Beach, Florida, complied, in all material respects, with the compliance
requirements referred to above that could have a direct and material effect on each of its major Federal programs for the year ended September 30, 2011. However, the results of our auditing procedures
disclosed instances of noncompliance with those requirements, which are required to be reported in accordance with OMB Circular A-133 and which are described in the accompanying Schedule of Findings
and Questioned Costs as items 2011-02, 2011-03, 2011-04 and 2011-05.
IV-5
THE CITY OF BOYNTON BEACH
FY 2011 COMPREHENSIVE ANNUAL FINANCIAL REPORT
IV-6
Internal Control Over Compliance Management of the City of Boynton Beach, Florida, is responsible for establishing and maintaining effective internal control over compliance with the requirements of laws, regulations, contracts, and grants applicable to Federal programs. In planning and performing our audit, we considered the City’s internal control over compliance with requirements that could have a direct and material effect on a major Federal program to determine the auditing procedures for the purpose of expressing our opinion on compliance and to test and report on internal control over compliance in accordance with OMB Circular A-133, but not for the purpose of expressing an opinion on the effectiveness of internal control over compliance. Accordingly, we do not express an opinion on the effectiveness of the City’s internal control over compliance. A deficiency in internal control over compliance exists when the design or operation of a control over compliance does not allow management or employees, in the normal course of performing their assigned functions, to prevent, or detect and correct, noncompliance with a type of compliance requirement of a Federal program on a timely basis. A material weakness in internal control over compliance is a deficiency, or combination of deficiencies, in internal control over compliance, such that there is a reasonable possibility that material noncompliance with a type of compliance requirement of a Federal program will not be prevented, or detected and corrected, on a timely basis. Our consideration of internal control over compliance was for the limited purpose described in the first paragraph of this section and was not designed to identify all deficiencies in internal control over compliance that might be deficiencies, significant deficiencies, or material weaknesses. We did not identify any deficiencies in internal control over compliance that we considered to be material weaknesses, as defined above. The City’s responses to the findings identified in our audit are described in the accompanying Schedule of Findings and Questioned Costs. We did not audit the City’s responses and, accordingly, we express no opinion on the responses. This report is intended solely for the information and use of the City Commission, management and others within the City of Boynton Beach, Florida, Federal awarding agencies and pass-through entities, and the Auditor General of the State of Florida and is not intended to be and should not be used by anyone other than these specified parties.
December 10, 2012
IV-6
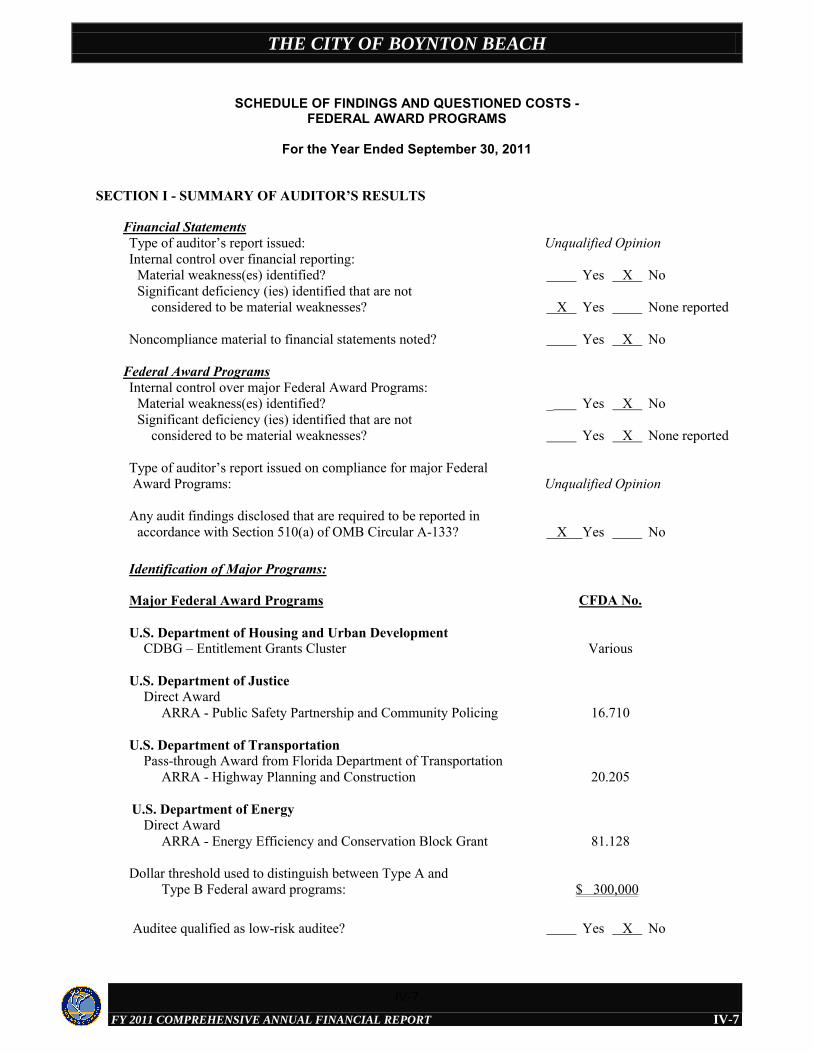
THE CITY OF BOYNTON BEACH
FY 2011 COMPREHENSIVE ANNUAL FINANCIAL REPORT
SCHEDULE OF FINDINGS AND QUESTIONED COSTS -FEDERAL AWARD PROGRAMS
For the Year Ended September 30, 2011
IV-7
SECTION I - SUMMARY OF AUDITOR’S RESULTS
Financial StatementsType of auditor’s report issued:Internal control over financial reporting:
Material weakness(es) identified?Significant deficiency (ies) identified that are not
considered to be material weaknesses?
Noncompliance material to financial statements noted?
Unqualified Opinion
Yes X No
X Yes None reported
Yes X No
Federal Award ProgramsInternal control over major Federal Award Programs:
Material weakness(es) identified?Significant deficiency (ies) identified that are not
considered to be material weaknesses?
Type of auditor’s report issued on compliance for major FederalAward Programs:
Any audit findings disclosed that are required to be reported inaccordance with Section 510(a) of OMB Circular A-133?
_ Yes X No
Yes X None reported
Unqualified Opinion
X Yes No
Identification of Major Programs:
Major Federal Award Programs CFDA No.
U.S. Department of Housing and Urban DevelopmentCDBG – Entitlement Grants Cluster
U.S. Department of Justice Direct Award
ARRA - Public Safety Partnership and Community Policing
U.S. Department of TransportationPass-through Award from Florida Department of Transportation
ARRA - Highway Planning and Construction
U.S. Department of EnergyDirect Award
ARRA - Energy Efficiency and Conservation Block Grant
Various
16.710
20.205
81.128
Dollar threshold used to distinguish between Type A andType B Federal award programs: $ 300,000
Auditee qualified as low-risk auditee? Yes X No
IV-7
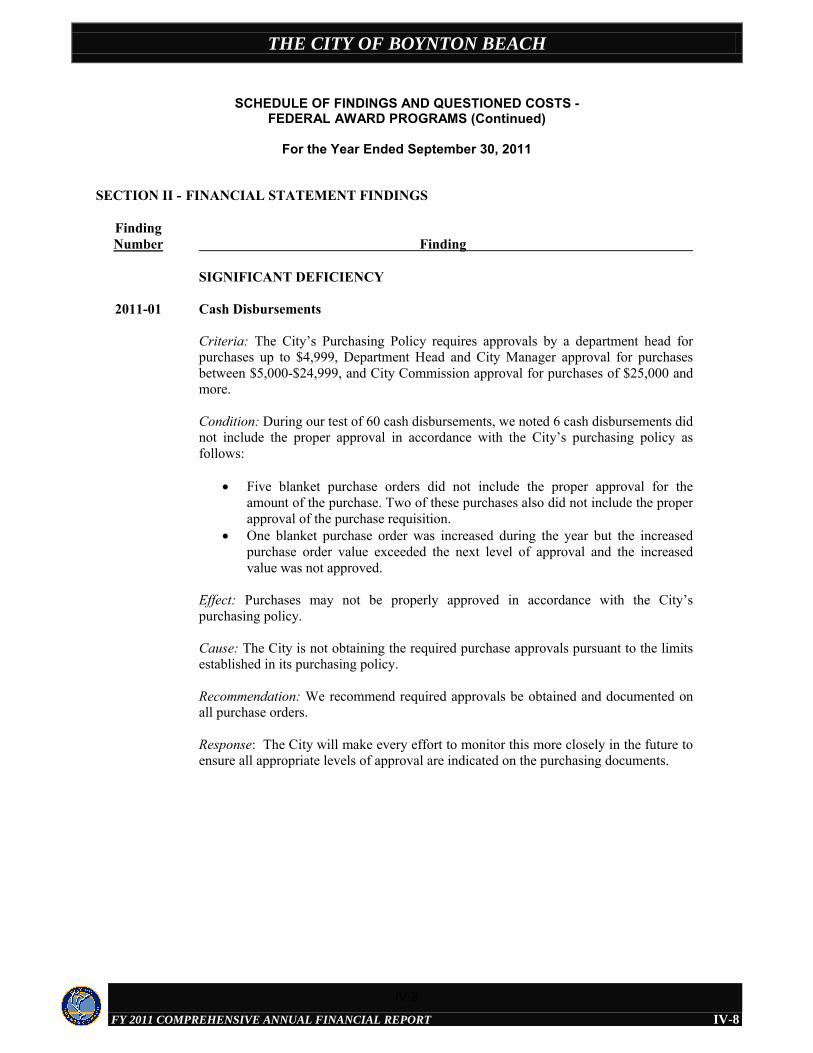
THE CITY OF BOYNTON BEACH
FY 2011 COMPREHENSIVE ANNUAL FINANCIAL REPORT
SCHEDULE OF FINDINGS AND QUESTIONED COSTS -FEDERAL AWARD PROGRAMS (Continued)
For the Year Ended September 30, 2011
IV-8
SECTION II - FINANCIAL STATEMENT FINDINGS
FindingNumber Finding
2011-01
SIGNIFICANT DEFICIENCY
Cash Disbursements
Criteria: The City’s Purchasing Policy requires approvals by a department head for purchases up to $4,999, Department Head and City Manager approval for purchases between $5,000-$24,999, and City Commission approval for purchases of $25,000 and more.
Condition: During our test of 60 cash disbursements, we noted 6 cash disbursements did not include the proper approval in accordance with the City’s purchasing policy as follows:
Five blanket purchase orders did not include the proper approval for the amount of the purchase. Two of these purchases also did not include the proper approval of the purchase requisition.
One blanket purchase order was increased during the year but the increased purchase order value exceeded the next level of approval and the increased value was not approved.
Effect: Purchases may not be properly approved in accordance with the City’s purchasing policy.
Cause: The City is not obtaining the required purchase approvals pursuant to the limits established in its purchasing policy.
Recommendation: We recommend required approvals be obtained and documented on all purchase orders.
Response: The City will make every effort to monitor this more closely in the future to ensure all appropriate levels of approval are indicated on the purchasing documents.
IV-8
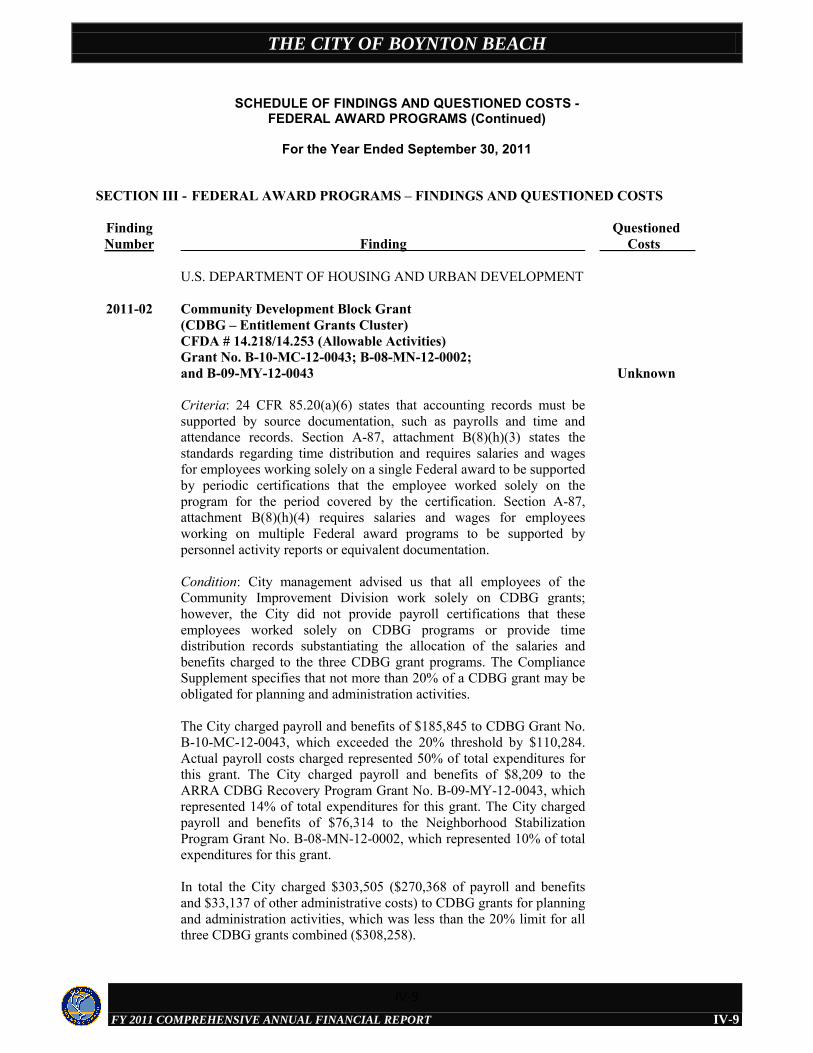
THE CITY OF BOYNTON BEACH
FY 2011 COMPREHENSIVE ANNUAL FINANCIAL REPORT
SCHEDULE OF FINDINGS AND QUESTIONED COSTS -FEDERAL AWARD PROGRAMS (Continued)
For the Year Ended September 30, 2011
IV-9
SECTION III - FEDERAL AWARD PROGRAMS – FINDINGS AND QUESTIONED COSTS
FindingNumber Finding
Questioned Costs
2011-02
U.S. DEPARTMENT OF HOUSING AND URBAN DEVELOPMENT
Community Development Block Grant(CDBG – Entitlement Grants Cluster)CFDA # 14.218/14.253 (Allowable Activities)Grant No. B-10-MC-12-0043; B-08-MN-12-0002; and B-09-MY-12-0043
Criteria: 24 CFR 85.20(a)(6) states that accounting records must be supported by source documentation, such as payrolls and time and attendance records. Section A-87, attachment B(8)(h)(3) states the standards regarding time distribution and requires salaries and wages for employees working solely on a single Federal award to be supported by periodic certifications that the employee worked solely on the program for the period covered by the certification. Section A-87, attachment B(8)(h)(4) requires salaries and wages for employees working on multiple Federal award programs to be supported by personnel activity reports or equivalent documentation.
Condition: City management advised us that all employees of the Community Improvement Division work solely on CDBG grants; however, the City did not provide payroll certifications that these employees worked solely on CDBG programs or provide time distribution records substantiating the allocation of the salaries and benefits charged to the three CDBG grant programs. The Compliance Supplement specifies that not more than 20% of a CDBG grant may be obligated for planning and administration activities.
The City charged payroll and benefits of $185,845 to CDBG Grant No. B-10-MC-12-0043, which exceeded the 20% threshold by $110,284.Actual payroll costs charged represented 50% of total expenditures for this grant. The City charged payroll and benefits of $8,209 to the ARRA CDBG Recovery Program Grant No. B-09-MY-12-0043, which represented 14% of total expenditures for this grant. The City charged payroll and benefits of $76,314 to the Neighborhood Stabilization Program Grant No. B-08-MN-12-0002, which represented 10% of total expenditures for this grant.
In total the City charged $303,505 ($270,368 of payroll and benefits and $33,137 of other administrative costs) to CDBG grants for planning and administration activities, which was less than the 20% limit for all three CDBG grants combined ($308,258).
Unknown
IV-9
THE CITY OF BOYNTON BEACH
FY 2011 COMPREHENSIVE ANNUAL FINANCIAL REPORT
SCHEDULE OF FINDINGS AND QUESTIONED COSTS -FEDERAL AWARD PROGRAMS (Continued)
For the Year Ended September 30, 2011
IV-10
SECTION III - FEDERAL AWARD PROGRAMS – FINDINGS AND QUESTIONED COSTS (Continued)
FindingNumber Finding
Questioned Costs
2011-02(Continued)
Community Development Block Grant(CDBG – Entitlement Grants Cluster)CFDA # 14.218/14.253 (Allowable Activities)Grant No. B-10-MC-12-0043; B-08-MN-12-0002; and B-09-MY-12-0043
Effect: The City may be overcharging some grants and undercharging other grants.
Cause: The City’s Community Improvement Division does not believe it is necessary to document the allocation of payroll to each program or to certify payroll because the Community Improvement Division is fully funded by the CDBG grants.
Population and Items Tested: Auditor tested payroll and benefits charged to the three CDBG programs. We also reviewed the general ledger detail and client summary reports for CDBG expenditures to determine the amount of administrative expenses charged to the programs.
Recommendation: We recommend that the City utilize a time reporting system to document the salaries and wages chargeable to each Federal program as required by 24 CFR 85.20(a)(6). We also recommend that the City assess the amount of each employee’s time charged or certify payroll for each applicable grant program.
Grantee Response: The City’s Community Improvement Division has charged payroll and related expenses to the individual CDBG grants in the same manner over the past several years and have not been questioned on this approach by the grantor, therefore the City believes that they are charging the individual grants appropriately. The City currently manages the time charged to each grant by a spreadsheet but will review the method used to document the salaries and related benefits charged to each grant.
IV-10
THE CITY OF BOYNTON BEACH
FY 2011 COMPREHENSIVE ANNUAL FINANCIAL REPORT
SCHEDULE OF FINDINGS AND QUESTIONED COSTS -FEDERAL AWARD PROGRAMS (Continued)
For the Year Ended September 30, 2011
IV-11
SECTION III - FEDERAL AWARD PROGRAMS – FINDINGS AND QUESTIONED COSTS (Continued)
FindingNumber Finding
Questioned Costs
2011-03 Community Development Block GrantNeighborhood Stabilization ProgramCFDA # 14.218 (Program Income)Grant No. B-08-MN-12-0002
Criteria: The grantee must accurately account for program income generated from the use of CDBG funds and treat such income asadditional CDBG funds subject to all program rules.
Condition: The City contracts with the Boynton Beach Faith Based Community Development Corporation (the “CDC”) to facilitate implementation of the Neighborhood Stabilization Program (“NSP”).The CDC holds title to property acquired under the NSP program. The CDC sold three NSP homes for $313,000 during the fiscal year ended September 30, 2011, which was not reported as program income by the CDC or City. The revenue generated from the sale of the NSP properties is considered additional CDBG funding and these proceeds are required to be accounted for and put back into the NSP program.
Effect: The City and CDC have $313,000 of additional funds that mustbe used for the NSP program.
Cause: Program income from NSP home sales are not separately identified or recorded by the City in its accounting records or reported by the CDC in its annual audit report.
Population and Items Tested: Auditor received a schedule of homessold in the NSP program from the City and reviewed the audited financial statements of the CDC.
Recommendation: We recommend that the City require the CDC to properly account for NSP home sales as program income and develop a process to reconcile and account for program income as additional CDBG funding for the NSP program.
Grantee Response: The City will address the issue of NSP home sales and program income with the CDC and their auditors.
Unknown
IV-11
THE CITY OF BOYNTON BEACH
FY 2011 COMPREHENSIVE ANNUAL FINANCIAL REPORT
SCHEDULE OF FINDINGS AND QUESTIONED COSTS -FEDERAL AWARD PROGRAMS (Continued)
For the Year Ended September 30, 2011
IV-12
SECTION III - FEDERAL AWARD PROGRAMS – FINDINGS AND QUESTIONED COSTS (Continued)
FindingNumber Finding
Questioned Costs
2011-04 Community Development Block GrantNeighborhood Stabilization ProgramCFDA # 14.218 (Subrecipient Monitoring)Grant No. B-08-MN-12-0002
Criteria: The grantee must ensure that subrecipient’s are in compliance with grant requirements and are monitored. The City is responsible for the activity of the subrecipient and its compliance with grant provisions.
Condition: The City contracts with the Boynton Beach Faith Based Community Development Corporation (the “CDC”) to facilitate implementation of the Neighborhood Stabilization Program (“NSP”).The CDC did not complete its audit or submit the Data Collection Form (Form SF-SAC) for the year ended December 31, 2010 within the required time frame. The audit report and data collection form were due by September 30, 2011.
There were also differences between the amount of property held for resale, developer fees paid and the total funding provided to the CDC as reported in the audited CDC financial statements and the City’s records.The CDC reports on a calendar year end and the City reports on a September 30 fiscal year end. The City has reported $1,029,667 for property held for resale as compared to $982,000 reported by the CDC at December 31, 2011, a difference of $47,667. Developer fees reported by the City were $58,896 and $39,254 at December 31, 2010 and 2011, respectively, as compared to $73,765 and $50,177 reported by the CDC at December 31, 2010 and 2011, a difference of $14,869 and $10,923 at December 31, 2010 and 2011, respectively. The amount of total grant funding through December 31, 2011 reported by the City was$2,168,454 as compared to $2,362,344 reported by the CDC, a difference of $193,890.
The City was not able to provide explanations for the differences between the amounts reported by the City and the amounts reported in the CDC’s audited financial statements.
Effect: The CDC and/or the City may not be accurately reporting grant activity.
Cause: The City is not reconciling activity with the records of the CDC.
Unknown
IV-12
THE CITY OF BOYNTON BEACH
FY 2011 COMPREHENSIVE ANNUAL FINANCIAL REPORT
SCHEDULE OF FINDINGS AND QUESTIONED COSTS -FEDERAL AWARD PROGRAMS (Continued)
For the Year Ended September 30, 2011
IV-13
SECTION III - FEDERAL AWARD PROGRAMS – FINDINGS AND QUESTIONED COSTS (Continued)
FindingNumber Finding
Questioned Costs
2011-04(Continued)
Community Development Block GrantNeighborhood Stabilization ProgramCFDA # 14.218 (Subrecipient Monitoring)Grant No. B-08-MN-12-0002
Population and Items Tested: Auditor received an audited financialstatement from the CDC and various schedules of the amount of homes acquired and sold which were provided by the City.
Recommendation: We recommend that the City reconcile activity of homes acquired and sold, assets held for resale, developer fees and other activity with the CDC. We also recommend that the CDC prepare audited financial statements and compliance reports, including the data collection form, on a timely basis and submit the statements and reports to oversight agencies by the required deadline.
Grantee Response: The City will meet with the CDC to address this comment and develop a process/procedure to reconcile the activity on homes acquired and sold, assets held for resale and developer fees of the CDC. The City will also direct the CDC to file the required statements and reports with the appropriate oversight agencies.
IV-13
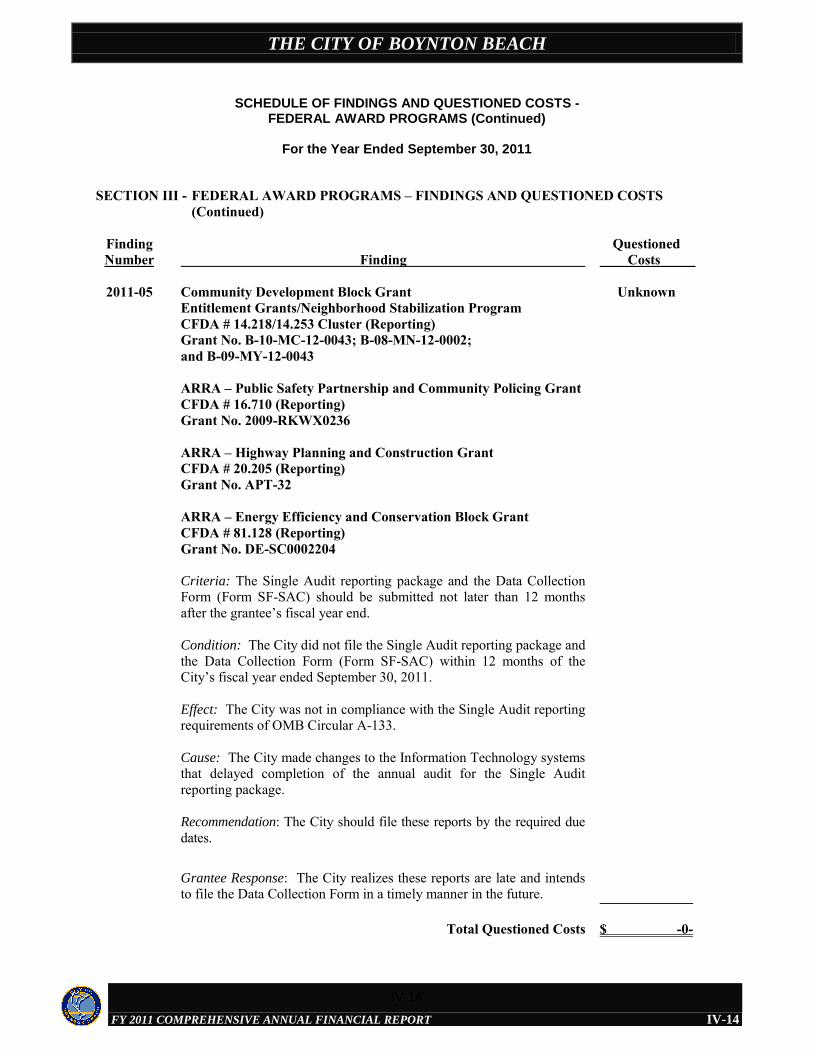
THE CITY OF BOYNTON BEACH
FY 2011 COMPREHENSIVE ANNUAL FINANCIAL REPORT
SCHEDULE OF FINDINGS AND QUESTIONED COSTS - FEDERAL AWARD PROGRAMS (Continued)
For the Year Ended September 30, 2011
IV-14
SECTION III - FEDERAL AWARD PROGRAMS – FINDINGS AND QUESTIONED COSTS (Continued)
Finding Number
Finding
Questioned Costs
2011-05
Community Development Block Grant Entitlement Grants/Neighborhood Stabilization Program CFDA # 14.218/14.253 Cluster (Reporting) Grant No. B-10-MC-12-0043; B-08-MN-12-0002; and B-09-MY-12-0043 ARRA – Public Safety Partnership and Community Policing Grant CFDA # 16.710 (Reporting) Grant No. 2009-RKWX0236 ARRA – Highway Planning and Construction Grant CFDA # 20.205 (Reporting) Grant No. APT-32 ARRA – Energy Efficiency and Conservation Block Grant CFDA # 81.128 (Reporting) Grant No. DE-SC0002204 Criteria: The Single Audit reporting package and the Data Collection Form (Form SF-SAC) should be submitted not later than 12 months after the grantee’s fiscal year end. Condition: The City did not file the Single Audit reporting package and the Data Collection Form (Form SF-SAC) within 12 months of the City’s fiscal year ended September 30, 2011. Effect: The City was not in compliance with the Single Audit reporting requirements of OMB Circular A-133. Cause: The City made changes to the Information Technology systems that delayed completion of the annual audit for the Single Audit reporting package. Recommendation: The City should file these reports by the required due dates.
Grantee Response: The City realizes these reports are late and intends to file the Data Collection Form in a timely manner in the future.
Unknown
Total Questioned Costs
$ -0-
IV-14
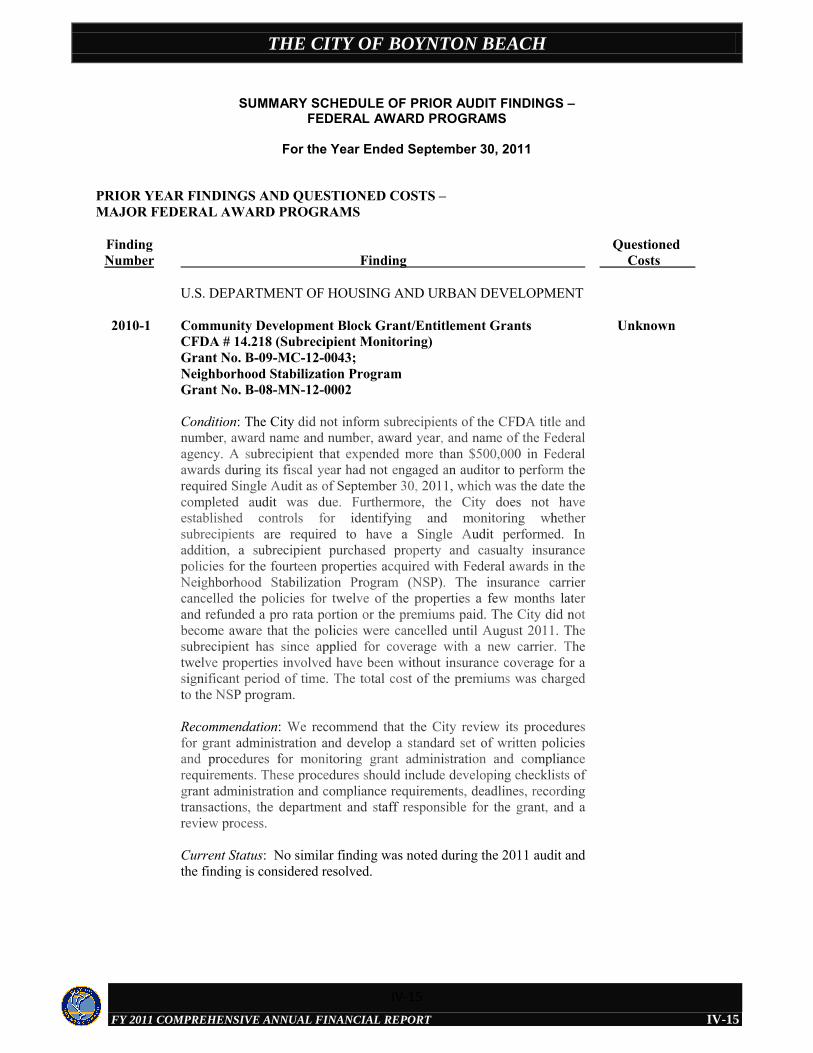
THE CITY OF BOYNTON BEACH
FY 2011 COMPREHENSIVE ANNUAL FINANCIAL REPORT
SUMMARY SCHEDULE OF PRIOR AUDIT FINDINGS –FEDERAL AWARD PROGRAMS
For the Year Ended September 30, 2011
IV-15
PRIOR YEAR FINDINGS AND QUESTIONED COSTS –MAJOR FEDERAL AWARD PROGRAMS
FindingNumber Finding
Questioned Costs
2010-1
U.S. DEPARTMENT OF HOUSING AND URBAN DEVELOPMENT
Community Development Block Grant/Entitlement GrantsCFDA # 14.218 (Subrecipient Monitoring)Grant No. B-09-MC-12-0043; Neighborhood Stabilization Program Grant No. B-08-MN-12-0002
Condition: The City did not inform subrecipients of the CFDA title and number, award name and number, award year, and name of the Federal agency. A subrecipient that expended more than $500,000 in Federal awards during its fiscal year had not engaged an auditor to perform the required Single Audit as of September 30, 2011, which was the date the completed audit was due. Furthermore, the City does not have established controls for identifying and monitoring whethersubrecipients are required to have a Single Audit performed. In addition, a subrecipient purchased property and casualty insurance policies for the fourteen properties acquired with Federal awards in the Neighborhood Stabilization Program (NSP). The insurance carrier cancelled the policies for twelve of the properties a few months later and refunded a pro rata portion or the premiums paid. The City did not become aware that the policies were cancelled until August 2011. The subrecipient has since applied for coverage with a new carrier. The twelve properties involved have been without insurance coverage for a significant period of time. The total cost of the premiums was charged to the NSP program.
Recommendation: We recommend that the City review its procedures for grant administration and develop a standard set of written policies and procedures for monitoring grant administration and compliance requirements. These procedures should include developing checklists of grant administration and compliance requirements, deadlines, recording transactions, the department and staff responsible for the grant, and areview process.
Current Status: No similar finding was noted during the 2011 audit and the finding is considered resolved.
Unknown
IV-15
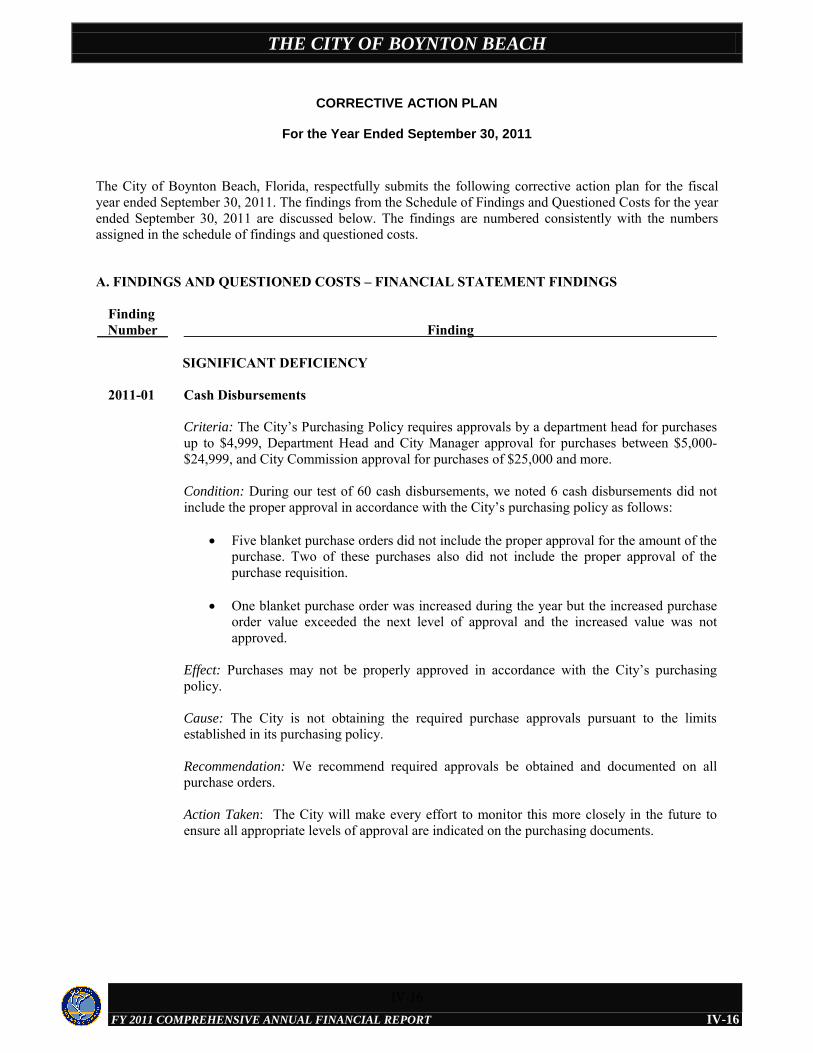
THE CITY OF BOYNTON BEACH
FY 2011 COMPREHENSIVE ANNUAL FINANCIAL REPORT
CORRECTIVE ACTION PLAN
For the Year Ended September 30, 2011
IV-16
The City of Boynton Beach, Florida, respectfully submits the following corrective action plan for the fiscal year ended September 30, 2011. The findings from the Schedule of Findings and Questioned Costs for the year ended September 30, 2011 are discussed below. The findings are numbered consistently with the numbers assigned in the schedule of findings and questioned costs. A. FINDINGS AND QUESTIONED COSTS – FINANCIAL STATEMENT FINDINGS
Finding Number
Finding
2011-01
SIGNIFICANT DEFICIENCY Cash Disbursements Criteria: The City’s Purchasing Policy requires approvals by a department head for purchases up to $4,999, Department Head and City Manager approval for purchases between $5,000-$24,999, and City Commission approval for purchases of $25,000 and more.
Condition: During our test of 60 cash disbursements, we noted 6 cash disbursements did not include the proper approval in accordance with the City’s purchasing policy as follows:
Five blanket purchase orders did not include the proper approval for the amount of the purchase. Two of these purchases also did not include the proper approval of the purchase requisition.
One blanket purchase order was increased during the year but the increased purchase
order value exceeded the next level of approval and the increased value was not approved.
Effect: Purchases may not be properly approved in accordance with the City’s purchasing policy.
Cause: The City is not obtaining the required purchase approvals pursuant to the limits established in its purchasing policy.
Recommendation: We recommend required approvals be obtained and documented on all purchase orders.
Action Taken: The City will make every effort to monitor this more closely in the future to ensure all appropriate levels of approval are indicated on the purchasing documents.
IV-16
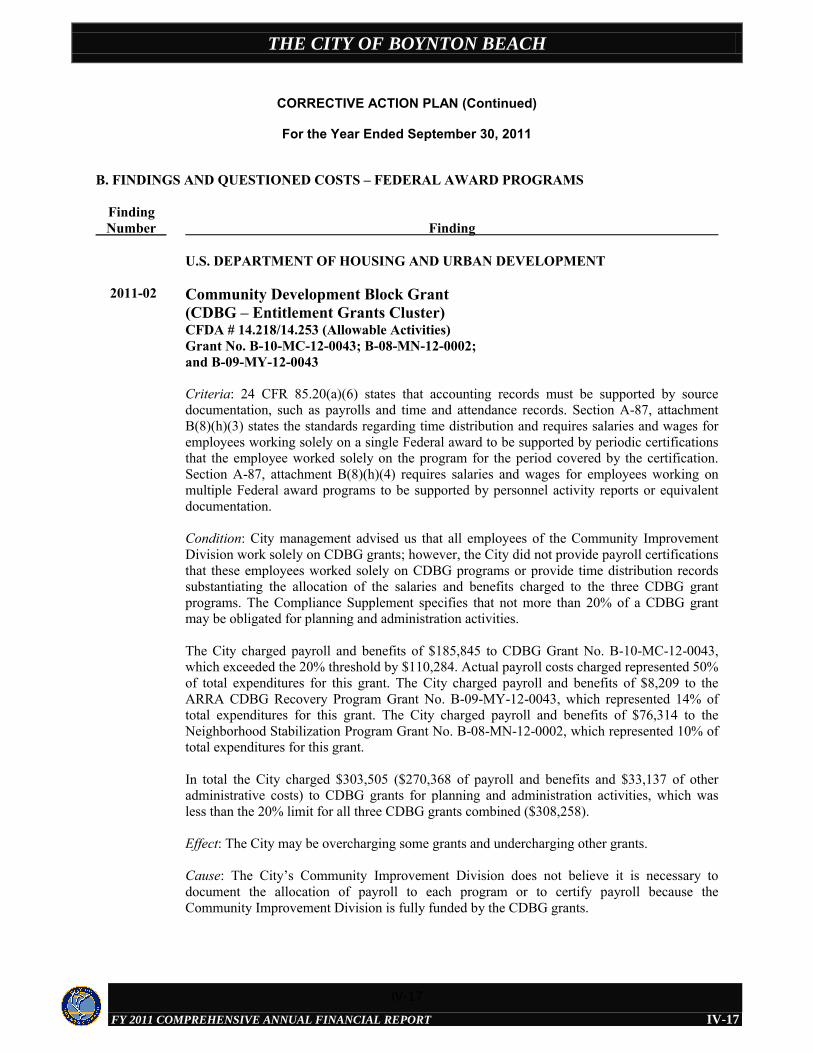
THE CITY OF BOYNTON BEACH
FY 2011 COMPREHENSIVE ANNUAL FINANCIAL REPORT
CORRECTIVE ACTION PLAN (Continued)
For the Year Ended September 30, 2011
IV-17
B. FINDINGS AND QUESTIONED COSTS – FEDERAL AWARD PROGRAMS
FindingNumber Finding
2011-02
U.S. DEPARTMENT OF HOUSING AND URBAN DEVELOPMENT
Community Development Block Grant (CDBG – Entitlement Grants Cluster)CFDA # 14.218/14.253 (Allowable Activities)Grant No. B-10-MC-12-0043; B-08-MN-12-0002; and B-09-MY-12-0043
Criteria: 24 CFR 85.20(a)(6) states that accounting records must be supported by source documentation, such as payrolls and time and attendance records. Section A-87, attachment B(8)(h)(3) states the standards regarding time distribution and requires salaries and wages for employees working solely on a single Federal award to be supported by periodic certifications that the employee worked solely on the program for the period covered by the certification.Section A-87, attachment B(8)(h)(4) requires salaries and wages for employees working on multiple Federal award programs to be supported by personnel activity reports or equivalent documentation.
Condition: City management advised us that all employees of the Community Improvement Division work solely on CDBG grants; however, the City did not provide payroll certificationsthat these employees worked solely on CDBG programs or provide time distribution records substantiating the allocation of the salaries and benefits charged to the three CDBG grant programs. The Compliance Supplement specifies that not more than 20% of a CDBG grant may be obligated for planning and administration activities.
The City charged payroll and benefits of $185,845 to CDBG Grant No. B-10-MC-12-0043,which exceeded the 20% threshold by $110,284. Actual payroll costs charged represented 50% of total expenditures for this grant. The City charged payroll and benefits of $8,209 to the ARRA CDBG Recovery Program Grant No. B-09-MY-12-0043, which represented 14% of total expenditures for this grant. The City charged payroll and benefits of $76,314 to the Neighborhood Stabilization Program Grant No. B-08-MN-12-0002, which represented 10% of total expenditures for this grant.
In total the City charged $303,505 ($270,368 of payroll and benefits and $33,137 of other administrative costs) to CDBG grants for planning and administration activities, which was less than the 20% limit for all three CDBG grants combined ($308,258).
Effect: The City may be overcharging some grants and undercharging other grants.
Cause: The City’s Community Improvement Division does not believe it is necessary to document the allocation of payroll to each program or to certify payroll because the Community Improvement Division is fully funded by the CDBG grants.
IV-17
THE CITY OF BOYNTON BEACH
FY 2011 COMPREHENSIVE ANNUAL FINANCIAL REPORT
CORRECTIVE ACTION PLAN (Continued)
For the Year Ended September 30, 2011
IV-18
B. FINDINGS AND QUESTIONED COSTS – FEDERAL AWARD PROGRAMS (Continued)
FindingNumber Finding
2011-02(Continued)
2011-03
Community Development Block Grant(CDBG – Entitlement Grants Cluster)CFDA # 14.218/14.253 (Allowable Activities)Grant No. B-10-MC-12-0043; B-08-MN-12-0002; and B-09-MY-12-0043
Population and Items Tested: Auditor tested payroll and benefits charged to the three CDBG programs. We also reviewed the general ledger detail and client summary reports for CDBGexpenditures to determine the amount of administrative expenses charged to the programs.
Recommendation: We recommend that the City utilize a time reporting system to document the salaries and wages chargeable to each Federal program as required by 24 CFR 85.20(a)(6). We also recommend that the City assess the amount of each employee’s time charged or certify payroll for each applicable grant program.
Action Taken: The City manages the time charged to each grant by a spreadsheet but will review the method used to document the salaries and related benefits charged to each grant.
Community Development Block GrantNeighborhood Stabilization ProgramCFDA # 14.218 (Program Income)Grant No. B-08-MN-12-0002
Criteria: The grantee must accurately account for program income generated from the use of CDBG funds and treat such income as additional CDBG funds subject to all program rules.
Condition: The City contracts with the Boynton Beach Faith Based Community Development Corporation (the “CDC”) to facilitate implementation of the Neighborhood Stabilization Program (“NSP”). The CDC holds title to property acquired under the NSP program. The CDC sold three NSP homes for $313,000 during the fiscal year ended September 30, 2011, whichwas not reported as program income by the CDC or City. The revenue generated from the sale of the NSP properties is considered additional CDBG funding and these proceeds are required to be accounted for and put back into the NSP program.
Effect: The City and CDC have $313,000 of additional funds that must be used for the NSP program.
Cause: Program income from NSP home sales are not separately identified or recorded by the City in its accounting records or reported by the CDC in its annual audit report.
Population and Items Tested: Auditor received a schedule of homes sold in the NSP program from the City and reviewed the audited financial statements of the CDC.
IV-18
THE CITY OF BOYNTON BEACH
FY 2011 COMPREHENSIVE ANNUAL FINANCIAL REPORT
CORRECTIVE ACTION PLAN (Continued)
For the Year Ended September 30, 2011
IV-19
B. FINDINGS AND QUESTIONED COSTS – FEDERAL AWARD PROGRAMS (Continued)
FindingNumber Finding
2011-03(Continued)
2011-04
Community Development Block GrantNeighborhood Stabilization ProgramCFDA # 14.218 (Program Income)Grant No. B-08-MN-12-0002
Recommendation: We recommend that the City require the CDC to properly account for NSP home sales as program income and develop a process to reconcile and account for program income as additional CDBG funding for the NSP program
Action Taken: The City will address the issue of NSP home sales and program income with the CDC and their auditors.
Community Development Block GrantNeighborhood Stabilization ProgramCFDA # 14.218 (Subrecipient Monitoring)Grant No. B-08-MN-12-0002
Criteria: The grantee must ensure that subrecipient’s are in compliance with grant requirements and are monitored. The City is responsible for the activity of the subrecipient and its compliance with grant provisions.
Condition: The City contracts with the Boynton Beach Faith Based Community Development Corporation (the “CDC”) to facilitate implementation of the Neighborhood Stabilization Program (“NSP”). The CDC did not complete its audit or submit the Data Collection Form (Form SF-SAC) for the year ended December 31, 2010 within the required time frame. The audit report and data collection form were due by September 30, 2011.
There were also differences between the amount of property held for resale, developer fees paid and the total funding provided to the CDC as reported in the audited CDC financial statements and the City’s records. The CDC reports on a calendar year end and the City reports on a September 30 fiscal year end. The City has reported $1,029,667 for property held for resale as compared to $982,000 reported by the CDC at December 31, 2011, a difference of $47,667. Developer fees reported by the City were $58,896 and $39,254 at December 31, 2010 and 2011, respectively, as compared to $73,765 and $50,177 reported by the CDC at December 31, 2010 and 2011, a difference of $14,869 and $10,923 at December 31, 2010 and 2011, respectively. The amount of total grant funding through December 31, 2011 reported by the City was $2,168,454 as compared to $2,362,344 reported by the CDC, a difference of $193,890.
The City was not able to provide explanations for the differences between the amounts reported by the City and the amounts reported in the CDC’s audited financial statements.
Effect: The CDC and/or the City may not be accurately reporting grant activity.
IV-19
THE CITY OF BOYNTON BEACH
FY 2011 COMPREHENSIVE ANNUAL FINANCIAL REPORT
CORRECTIVE ACTION PLAN (Continued)
For the Year Ended September 30, 2011
IV-20
B. FINDINGS AND QUESTIONED COSTS – FEDERAL AWARD PROGRAMS (Continued)
FindingNumber Finding
2011-04(Continued)
2011-05
Community Development Block GrantNeighborhood Stabilization ProgramCFDA # 14.218 (Subrecipient Monitoring)Grant No. B-08-MN-12-0002
Cause: The City is not reconciling activity with the records of the CDC.
Population and Items Tested: Auditor received an audited financial statement from the CDC and various schedules of the amount of homes acquired and sold which were provided by the City.
Recommendation: We recommend that the City reconcile activity of homes acquired and sold, assets held for resale, developer fees and other activity with the CDC. We also recommend that the CDC prepare audited financial statements and compliance reports, including the data collection form, on a timely basis and submit the statements and reports to oversight agencies by the required deadline.
Action Taken: The City will meet with the CDC to address this comment and develop a process/procedure to reconcile the activity on homes acquired and sold, assets held for resale and developer fees of the CDC. The City will also direct the CDC to file the required statements and reports with the appropriate oversight agencies.
Community Development Block GrantEntitlement Grants/Neighborhood Stabilization ProgramCFDA # 14.218/14.253 Cluster (Reporting)Grant No. B-10-MC-12-0043; B-08-MN-12-0002; and B-09-MY-12-0043
ARRA – Public Safety Partnership and Community Policing GrantCFDA # 16.710 (Reporting)Grant No. 2009-RKWX0236
ARRA – Highway Planning and Construction Grant CFDA # 20.205 (Reporting)Grant No. APT-32
ARRA – Energy Efficiency and Conservation Block GrantCFDA # 81.128 (Reporting)Grant No. DE-SC0002204
Criteria: The Single Audit reporting package and the Data Collection Form (Form SF-SAC) should be submitted not later than 12 months after the grantee’s fiscal year end.
IV-20
THE CITY OF BOYNTON BEACH
FY 2011 COMPREHENSIVE ANNUAL FINANCIAL REPORT
CORRECTIVE ACTION PLAN (Continued)
For the Year Ended September 30, 2011
IV-21
B. FINDINGS AND QUESTIONED COSTS – FEDERAL AWARD PROGRAMS (Continued)
FindingNumber Finding
2011-05(Continued)
Community Development Block GrantEntitlement Grants/Neighborhood Stabilization ProgramCFDA # 14.218/14.253 Cluster (Reporting)Grant No. B-10-MC-12-0043; B-08-MN-12-0002; and B-09-MY-12-0043
ARRA – Public Safety Partnership and Community Policing GrantCFDA # 16.710 (Reporting)Grant No. 2009-RKWX0236
ARRA – Highway Planning and Construction Grant CFDA # 20.205 (Reporting)Grant No. APT-32
ARRA – Energy Efficiency and Conservation Block GrantCFDA # 81.128 (Reporting)Grant No. DE-SC0002204
Condition: The City did not file the Single Audit reporting package and the Data Collection Form (Form SF-SAC) within 12 months of the City’s fiscal year ended September 30, 2011.
Effect: The City was not in compliance with the Single Audit reporting requirements of OMB Circular A-133.
Cause: The City made changes to the Information Technology systems that delayed completion of the annual audit for the Single Audit reporting package.
Recommendation: The City should file these reports by the required due dates.
Action Taken: The City realizes these reports are late and intends to file the Data CollectionForm in a timely manner in the future.
If you have any additional questions concerning this corrective action plan adopted by the City, please call me at (561) 742-6310.
Sincerely,
E. Barrett Atwood, Sr., CPADirector of Financial Services
IV-21
THE CITY OF BOYNTON BEACH
FY 2011 COMPREHENSIVE ANNUAL FINANCIAL REPORT
CALER,DONTEN,LEVINE,COHEN,PORTER &VEIL,P.A.
CERTIFIED PUBLIC ACCOUNTANTS
WILLIAM K CALER, JR , CPALOUIS M COHEN, CPAJOHN C COURTNEY, CPA, JDDAVID S DONTEN, CPAJAMES B HUTCHISON, CPA
JOEL H LEVINE, CPAJAMES F MULLEN, IV, CPATHOMAS A PENCE, JR , CPASCOTT L PORTER, CPAMARK D VEIL, CPA
505 SOUTH FLAGLER DRIVE, SUITE 900WEST PALM BEACH, FL 33401-5948
TELEPHONE (561) 832-9292FAX (561) 832-9455
info@cdlcpa com
MEMBERSAMERICAN INSTITUTE OF
CERTIFIED PUBLIC ACCOUNTANTS
FLORIDA INSTITUTE OF
CERTIFIED PUBLIC ACCOUNTANTS
IV-22
Management Letter
To the Honorable Mayor and City Commission
City of Boynton Beach, Florida
We have audited the financial statements of the City of Boynton Beach, Florida, as of and for the fiscal year ended September 30, 2011, and have issued our report thereon dated December 10, 2012. Our report
was modified to include references to other auditors.
We conducted our audit in accordance with U.S. generally accepted auditing standards; the standards
applicable to financial audits contained in Government Auditing Standards, issued by the Comptroller General of the United States; and OMB Circular A-133, Audits of States, Local Governments, and Non-Profit
Organizations. We have issued our Independent Auditor’s Report on Internal Control over Financial Reporting and on Compliance and Other Matters, Independent Auditor’s Report on Compliance with
Requirements That Could Have a Direct and Material Effect on Each Major Federal Program and on Internal Control Over Compliance, and Schedule of Findings and Questioned Costs. Disclosures in those
reports and schedule, which are dated December 10, 2012, should be considered in conjunction with this management letter.
Additionally, our audit was conducted in accordance with Chapter 10.550, Rules of the Auditor General, which governs the conduct of local governmental entity audits performed in the State of Florida. This
letter includes the following information, which is not included in the aforementioned auditor’s reports or schedule:
1. Section 10.554(1)(i)1., Rules of the Auditor General, requires that we determine whether or not
corrective actions have been taken to address findings and recommendations made in the preceding annual financial audit report.
We noted that the previous auditor’s recommendations related to comments 2010-1 Community Development Block Grants/Entitlement Grants; Timely Submission of Reports (Comment not
Numbered); Service Organization Control Reports (Comment not Numbered); and Service Organization Control Procedures (Comment not Numbered) as reported in the predecessor
auditor’s management letter dated December 7, 2011 have been implemented by the City or no longer apply.
The following comments reported in the predecessor auditor’s management letter dated
December 7, 2011 continue to apply and require further action. Note: The comments reported in the predecessor auditor’s management letter dated December 7, 2011 were not numbered as required by Chapter 10.550, Rules of the Auditor General. Accordingly, for future reference purposes we have assigned comment numbers for matters that continue to apply based on the year we believe the comment originated and the number of the comment in the order presented in the audit for the year the comment originated.
IV-22
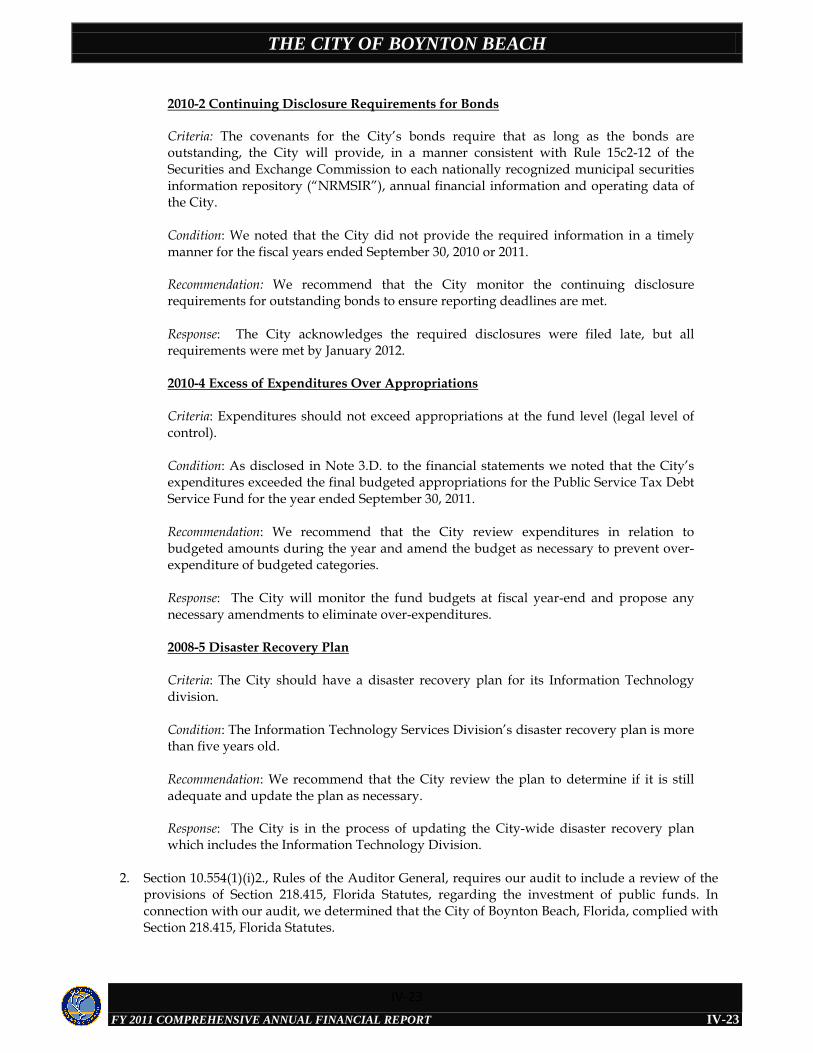
THE CITY OF BOYNTON BEACH
FY 2011 COMPREHENSIVE ANNUAL FINANCIAL REPORT
IV-23
2010-2 Continuing Disclosure Requirements for Bonds
Criteria: The covenants for the City’s bonds require that as long as the bonds are outstanding, the City will provide, in a manner consistent with Rule 15c2-12 of the
Securities and Exchange Commission to each nationally recognized municipal securities
information repository (“NRMSIR”), annual financial information and operating data of the City.
Condition: We noted that the City did not provide the required information in a timely
manner for the fiscal years ended September 30, 2010 or 2011.
Recommendation: We recommend that the City monitor the continuing disclosure requirements for outstanding bonds to ensure reporting deadlines are met.
Response: The City acknowledges the required disclosures were filed late, but all requirements were met by January 2012.
2010-4 Excess of Expenditures Over Appropriations
Criteria: Expenditures should not exceed appropriations at the fund level (legal level of
control).
Condition: As disclosed in Note 3.D. to the financial statements we noted that the City’sexpenditures exceeded the final budgeted appropriations for the Public Service Tax Debt
Service Fund for the year ended September 30, 2011.
Recommendation: We recommend that the City review expenditures in relation to
budgeted amounts during the year and amend the budget as necessary to prevent over-expenditure of budgeted categories.
Response: The City will monitor the fund budgets at fiscal year-end and propose any
necessary amendments to eliminate over-expenditures.
2008-5 Disaster Recovery Plan
Criteria: The City should have a disaster recovery plan for its Information Technology
division.
Condition: The Information Technology Services Division’s disaster recovery plan is more than five years old.
Recommendation: We recommend that the City review the plan to determine if it is still
adequate and update the plan as necessary.
Response: The City is in the process of updating the City-wide disaster recovery plan which includes the Information Technology Division.
2. Section 10.554(1)(i)2., Rules of the Auditor General, requires our audit to include a review of the provisions of Section 218.415, Florida Statutes, regarding the investment of public funds. In
connection with our audit, we determined that the City of Boynton Beach, Florida, complied with Section 218.415, Florida Statutes.
IV-23
THE CITY OF BOYNTON BEACH
FY 2011 COMPREHENSIVE ANNUAL FINANCIAL REPORT
IV-24
3. Section 10.554(1)(i)3., Rules of the Auditor General, requires that we address in the management
letter any recommendations to improve financial management. In connection with our audit, we have the following recommendations:
2011-06 Bank Reconciliation
Criteria: During our testing of bank statement reconciliations, we noted the September
2011 bank reconciliation for the City’s primary pooled cash account was not completed until January 11, 2012 and there was no physical evidence (signature or initials) of review
or approval of the reconciliation.
Condition: Bank reconciliations should be prepared timely and reviewed by separate
individuals and approval should be documented with a signature or initials.
Effect: Bank reconciliations are a way of providing review of bank activity and if they are
not performed timely, it is possible that the City will not detect any errors or possible
fraudulent activity in a timely manner.
Cause: Limited staff available to prepare and review reconciliations.
Recommendation: We recommend that bank reconciliations be performed in a timely manner, generally within 30 days of month end. In addition, we recommend that the
bank reconciliations be reviewed and evidence of this review by signature or initials be documented.
Response: The City completed the bank reconciliation for this account on January 11, 2012
as part of the year-end closing. This was the only bank account reconciliation that lacked
review and approval documentation, which the City believes was an isolated oversight.The City will endeavor to complete this reconciliation more timely in the future.
2011-07 Litigation Claims
Criteria: FASB Accounting Standards Codification (ASC) Section 450, Contingencies,
requires an accrual of a liability when the liability is probable and can be reasonablyestimated.
Condition: We noted that the City has not accrued certain pending legal claims. The City
records pending claims in its Self Insurance Fund, but claims that are referred to outside legal counsel are not included in the overall claim liability calculation. We noted certain
legal claims estimated at approximately $245,000 that met the criteria for accrual were
not recorded at September 30, 2011.
Effect: The City’s claims expenses and liability amounts are understated.
Cause: The City does not record the pending claims in the accounting information software until the claim is settled and paid.
Recommendation: We recommend that management analyze legal claims that have been
referred to outside legal counsel and recognize a liability at fiscal year-end for any claims deemed probable by the attorneys.
Response: The City believes this was an isolated oversight and will make every effort to analyze any pending claims at year-end and make the appropriate adjustments.
IV-24
THE CITY OF BOYNTON BEACH
FY 2011 COMPREHENSIVE ANNUAL FINANCIAL REPORT
IV-25
2011-08 Ambulance/EMS Accounts Receivable
Criteria: The City should reduce its accounts receivable balances to their estimated net
realizable value.
Condition: We noted the City does not have a formal policy for writing off uncollectible balances for ambulance services receivables and only reconciles the account at the fiscal
year-end.
Effect: Because the accounts are not adjusted during the year, any interim financial statements prepared from the general ledger will not accurately reflect the allowance or
net receivable balance, or account balances which should be written off completely.
Cause: The City’s Ambulance/EMS billing software, which is designed to allow claims
submission, patient billing and account management, is not designed to interface directly with the City’s accounting information software. As a result, the City does not have an
easy mechanism by which the transactions can be recorded in the detailed general ledger.
Recommendation: We recommend the City reconcile the Ambulance/EMS receivables as indicated in the billing software to the accounting information software, at least
quarterly, and properly record the change in estimated uncollectible allowance based on the aging of the receivables and write off any balances that the City does not consider
collectible.
Response: The City has reconciled this account on an annual basis in prior years but
agrees that it would be beneficial to reconcile on a quarterly basis. The City is working on a formal policy for write-offs of uncollectible balances.
2011-09 Utility Accounts Receivable
Criteria: The City is expected to maximize the collection of utility revenue that has been
recorded as receivable, within appropriate cost/benefit considerations. The City should reduce its utility receivable balances to their estimated net realizable value.
Condition: During the fiscal years ending September 30, 2010 and 2011, the City did not
submit delinquent utilities receivable accounts to a collection agency and did not write
off any uncollectible balances as had been their previous procedure. The City has not written off any of the delinquent balances for the past two years.
Effect: The City may have been able to collect additional receivables through the timely
use of a collection agency. Although 100% of the uncollected balances over sixty days old have been included in the allowance for doubtful accounts and the net receivable is the
same as if they had been written off, the gross accounts receivable and the allowance are both overstated by the amount that should have been completely written off as
uncollectible.
Cause: The City migrated to a hosted system for the utility billing software during the fiscal year ending September 30, 2011. After the migration, the City experienced difficulty
generating the necessary reports identifying delinquent accounts.
Recommendation: We recommend the City consult with a collection agency or similar
organization as soon as possible to determine what they can do to maximize collections of delinquent balances and implement any recommended procedures as soon as possible.
IV-25
THE CITY OF BOYNTON BEACH
FY 2011 COMPREHENSIVE ANNUAL FINANCIAL REPORT
IV-26
We also recommend writing off any balances that the agency does not consider
collectible or which are unlikely to provide additional benefit in excess of the cost to collect them.
Response: The City’s IT department is currently working on this issue with the host
vendor and expects it will be resolved in the near future.
2011-10 Capital Assets
Criteria: GASB 34 requires the City to capitalize and report capital assets above anadopted capitalization threshold on the government-wide financial statements. Disposals
should be properly authorized and approved.
Conditions: We noted the following matters related to capital assets.
Disposals: The City’s Disposition of Surplus and Obsolete Property policy indicates that“prior to the actual transfer of any surplus property to storage, the requesting
department shall obtain approval from the City Manager and Finance Department.”
The policy also requires that the City Commission approve all capital asset disposals, other than vehicles. Currently, the Finance department does not sign the Fixed Asset
Transfer/ Disposition Request form to properly document their approval of capital asset disposals. We also noted that documents regarding capital asset disposals are not
forwarded to the City Manager for approval. Additionally, capital asset disposals are not being approved by the City Commission as required by City policy.
Policies: We noted that the City has not adopted a formal policy for the capitalization
of capital assets. This leaves the City open to the possibility that capital assets will not be properly recorded, depreciated, or reported for accounting purposes.
Inventory: The City should conduct an annual inventory of capital assets pursuant to the Rules of the Auditor General.
Effect: Capital asset balances reflected on the financial statements could potentially be
overstated or understated.
Cause: The City did not adhere to the purchasing and disposal policies.
Recommendation: The City should develop and adopt a written capitalization policy that addresses a minimum dollar threshold for capitalization within the various capital asset
accounts, useful lives and depreciation methods. Additionally, the capitalization policy
should provide written guidelines for proper account classification of all routine capital asset additions (furniture and fixtures, leasehold improvements, etc.) and procedures to
differentiate between maintenance and repair items and long-term improvement items.
We recommend the City ensure that only those items that qualify as a capital purchase be capitalized to ensure compliance with the City’s policy. We also recommend that the City
record all capital asset purchases in the appropriate general ledger capital outlay accounts to ensure that all capital assets are being properly captured and reported.
For disposals of capital assets, we recommend that the City Manager and Finance department document their approval of capital asset disposals by signing the Fixed Asset
Transfer/Disposition Request form. In addition, we recommend that applicable capital asset disposals be approved by the City Commission in accordance with City policy.
IV-26
THE CITY OF BOYNTON BEACH
FY 2011 COMPREHENSIVE ANNUAL FINANCIAL REPORT
IV-27
We recommend that the City conduct an annual inventory of its capital assets.
Response: The City is currently in the process of reviewing and updating the policies
related to capital assets and expects these issues will be addressed through that process.
2011-11 Housing Program Expenditures
Criteria: The City’s purchasing policy documents expenditure approval levels for all disbursements.
Condition: The Community Housing Division contracts and pays vendors for housing
expenditures as part of the community housing programs for rehabilitation to homes.
The City’s purchasing policy requires City Manager approval for non-construction purchases over $5,000 and City Commission approval of all purchases over $25,000.
We noted that three out of the 25 disbursements tested for the Community Development
Block Grant program exceeded the $25,000 threshold for City Commission approval butwere not authorized by the City Commission. The Community Housing Division
provided a copy of Commission minutes from August 15, 1989, which included a consent agenda item authorizing the City Manager to approve expenditures for housing
programs without approval of the City Commission. This exemption for the Community
Housing Division purchases is not documented in the City’s purchasing policy and the legal authorization level for these expenditures is not clear.
Effect: Unauthorized expenditures or unapproved purchases may occur.
Cause: The City’s purchasing policy is inconsistent with the expenditure authorization
requirements being followed by the City for Community Housing Division purchases.
Recommendation: We recommend that the City clarify the expenditure authorization requirements for Community Housing Division purchases and update the purchasing
policy accordingly.
Response: The City is currently reviewing the authorization requirements for the
Community Housing Division and believes these issues will be addressed in that process.
2011-12 Inventory
Criteria: The City should properly reflect the balance of inventory on hand within the
accounting information software.
Condition: We noted the inventory reported on the detailed ledgers within the warehouse did not agree to the balances reflected on the City’s accounting information software. The
inventory balance reflected in the accounting information software was approximately
$81,000 less than the amount reported on the warehouse ledgers.
Effect: The City may not be reporting inventory properly.
Cause: The City did not perform a reconciliation of the ledgers maintained in the warehouse to the accounting information software.
Recommendation: We recommend the City periodically reconcile the subsidiary ledgers
IV-27
THE CITY OF BOYNTON BEACH
FY 2011 COMPREHENSIVE ANNUAL FINANCIAL REPORT
IV-28
maintained at the warehouse to the accounting information software and the physical
inventory counts at the end of the fiscal year.
Response: The City realized this was an oversight and has begun reconciling the warehouse ledgers to the accounting information software.
2011-13 Travel
Criteria: The City travel policy states that a travel expense report must be completed
within 15 days from the return of the trip.
Condition: Out of ten travel reimbursements tested, two individuals did not submit a
travel expense report within the 15 day period. One individual traveled on October 27-29, 2010, and submitted the travel expense report on February 24, 2011, and another
individual traveled on June 9-11, 2010, and submitted the travel expense report on October 13, 2010.
Effect: The City is not complying with its approved travel policy.
Cause: The City is not enforcing its internal policies regarding submission of travel
expense reports.
Recommendation: We recommend the City enforce its travel policy or consider amending
the policy to provide a longer time frame to submit travel expense reports.
Response: The City will consider amending the travel policy timeline for submission of the travel expense reports.
2011-14 Information Technology Systems
Criteria: Internal controls should provide for access security, protection and recovery of computer data.
Condition: Our review of the City’s Information Technology Systems (ITS) identified
certain areas where the existing practices could be improved, which are as follows:
Physical FacilitiesThe server room has a water-based sprinkler system which could completely cripple
the network rather than save it in the event of a fire. An appropriate server room fire
system should be installed and the existing water-based system should be removed.We understand that an appropriate system has been requested by the ITS Manager;
however, it has not yet been implemented.
Backup Reporting and StorageAlthough detailed backup reports are received daily, long-term logs are not
maintained. A running historical log should be maintained to look for sudden changes in the amount of data or time the backup takes. Additionally, the City
should consider encrypting backups to protect in the event of theft or loss. While we
understand that the City’s backup tapes are stored in a secured location separate from the central server facility and the tapes are under the control of the ITS
department at all times, there have been a rash of highly and embarrassing public incidents in which government data has been disclosed to unauthorized parties
because it was not encrypted..
IV-28
THE CITY OF BOYNTON BEACH
FY 2011 COMPREHENSIVE ANNUAL FINANCIAL REPORT
IV-29
Access and Security
When performing non-administrative level tasks, the ITS staff should be utilizing non-network administrator accounts. Thus, any issues such as mistakes, viruses or
spyware are contained.
User AccountsA list of all active user accounts should regularly be provided to each department
head to be reviewed, signed off and returned to the ITS department. Any user accounts found to be active for individuals who no longer work for the City, should
be formally documented, inactivated and reviewed to determine why they were not previously identified.
Protection and RecoveryA regularly scheduled audit of all, or at least randomly selected, workstations should
be performed to identify current virus patterns, critical patches, spyware and unauthorized software. Any item identified that was able to bypass the system
should be documented as well as determine a possible solution for preventing the issue from reoccurring in the future. We understand that unauthorized software is
removed when it is discovered; however, regularly scheduled audits are not performed. Additionally, critical patches and malware protections are centrally
managed and monitored; however, the results are not audited or otherwise verified.
The City should consider blocking access to web mail because it skips many levels of
virus protection and offers a much greater opportunity for viruses and malware to penetrate the City’s system.
Regularly scheduled restores of all the City’s servers, including the operating system
applications and data, should be documented. Spare closely configured servers should be maintained on site.
A forced policy of logoff screensavers should be implemented to lock a workstation after a certain period of inactivity.
There should be a formal “Acceptable Use” document that all current employees
should be required to sign and all new hires should sign before being given computer access. In addition to signing the Acceptable Use policy, we recommend
that each major section be initialed to ensure the user has fully read the document.Suggested items to be addressed in the Acceptable Use policy include: users not
sharing passwords or writing them down; logging off when away from the
computer; the use of personal e-mail; attempts to install or download software; personal use; remote access; compliance with ITS department policies; etc. We
understand that the City has an Acceptable Use document; however, consideration should be given to updating the policy to be more comprehensive.
Users should not be classified as local administrators on workstations or laptops. We
understand that most users are not local administrators; however, several ITS staff are utilizing domain administration level accounts which also provides local
administrator access.
The City should consider logon legal warnings or notifications. At a minimum, such
a warning should be provided on the City’s VPN access.
IV-29
THE CITY OF BOYNTON BEACH
FY 2011 COMPREHENSIVE ANNUAL FINANCIAL REPORT
IV-30
Accounting System
Consider locking down USB and other removable media. Additionally, permission reports of all users who have access to payroll, accounts payable, utility rates and
other key systems should be generated on a regular schedule. The reports should be provided to the Finance Director to review, sign off that all permissions are correct
and necessary and then return the reports to the ITS department to be maintained on file for the next audit.
Effect: The security and stability of the City’s information technology systems may be
comprised.
Cause: Certain controls and/or procedures surrounding information technology systems have not been implemented by the City.
Recommendation: We recommend that the City consider the above changes to further enhance the access security, protection and recovery of computer data.
Response: The City’s IT department will consider the recommendations and discuss them
with the host vendor to determine the appropriate action.
4. Section 10.554(1)(i)4., Rules of the Auditor General, requires that we address violations of provisions of contracts or grant agreements, or abuse, that have occurred, or are likely to have
occurred, that have an effect on the financial statements that is less than material but more than
inconsequential. The results of our procedures disclosed no such matters, except as reported in the Schedule of Findings and Questioned Costs.
5. Section 10.554(1)(i)5., Rules of the Auditor General, provides that the auditor may, based on
professional judgment, report the following matters that have an inconsequential effect on financial statements, considering both quantitative and qualitative factors: (1) violations of
provisions of contracts or grant agreements, fraud, illegal acts, or abuse, and (2) deficiencies in
internal control that are not significant deficiencies. In connection with our audit, we did not have any such findings.
6. Section 10.554(1)(i)6., Rules of the Auditor General, requires that the name or official title and
legal authority for the primary government and each component unit of the reporting entity be disclosed in this management letter, unless disclosed in the notes to the financial statements. This
information is disclosed in Note 1 to the financial statements.
7. Section 10.554(1)(i)7.a., Rules of the Auditor General, requires a statement be included as to
whether or not the local governmental entity has met one or more of the conditions described in Section 218.503(1), Florida Statutes, and identification of the specific condition(s) met. In
connection with our audit, we determined that the City did not meet any of the conditions described in Section 218.503(1), Florida Statutes.
8. Section 10.554(1)(i)7.b., Rules of the Auditor General, requires that we determine whether the
annual financial report for the City for the fiscal year ended September 30, 2011, filed with the Florida Department of Financial Services pursuant to Section 218.32(1)(a), Florida Statutes, is in
agreement with the annual financial audit report for the fiscal year ended September 30, 2011. We
noted that the amounts reported in the Annual Financial Report were in substantial agreement with the audited financial statements for the year ended September 30, 2011.
IV-30
THE CITY OF BOYNTON BEACH
FY 2011 COMPREHENSIVE ANNUAL FINANCIAL REPORT
IV-31
9. Pursuant to Sections 10.554(1)(i)7.c. and 10.556(7), Rules of the Auditor General, we applied financial condition assessment procedures. It is management’s responsibility to monitor the City’s financial condition, and our financial condition assessment was based in part on representations made by management and the review of financial information provided by same. The results of our procedures disclosed no matters that are required to be reported.
This report is intended solely for the information and use of the City Commission, management and others within the City of Boynton Beach, Florida, Federal awarding agencies and pass-through entities, and the Auditor General of the State of Florida and is not intended to be and should not be used by anyone other than these specified parties. Pursuant to Chapter 119, Florida Statutes, this management letter is a public record and its distribution is not limited. U.S. generally accepted auditing standards require us to indicate that this report is intended solely for the information and use of the City Commission, management and others within the City of Boynton Beach, Florida, federal and pass-through entities, and the Auditor General of the State of Florida, and is not intended to be and should not be used by anyone other than these specified parties.
December 10, 2012
IV-31
THE CITY OF BOYNTON BEACH
FY 2011 COMPREHENSIVE ANNUAL FINANCIAL REPORT
IV-32
December 12, 2012
Auditor General’s OfficeLocal Government Audits/342Claude Pepper Building, Room 401111 West Madison StreetTallahassee, FL 32399-1450
Subject: Response to the Management Letter CommentsComprehensive Annual Financial Report – September 30, 2011
Our response to the comments and recommendations reported in the management letter for the current year are as follows:
2010-2 Continuing Disclosure Requirements for Bonds - Management concurs and the City will make every effort to monitor this more closely in the future to ensure all appropriate levels of approval are indicated on the purchasing documents.
2010-4 Excess of Expenditures Over Appropriations - Management concurs the budget needs to be amended to prevent over-expenditure of fund budgets.
2008-5 Disaster Recovery Plan - The City is in the process of updating the City-wide disaster recovery plan which includes the Information Technology Division.
2011-06 Bank Reconciliation - The City completed the bank reconciliation for this account on January 11, 2012 as part of the year-end closing. This was the only bank account reconciliation that lacked review and approval documentation, which the City believes was an isolated oversight. The City will endeavor to complete this reconciliation more timely in the future.
2011-07 Litigation Claims - The City believes this was an isolated oversight and will make every effort to analyze any pending claims at year-end and make the appropriate adjustments.
2011-08 Ambulance/EMS Accounts Receivable - The City has reconciled this account on an annual basis in prior years but agrees that it would be beneficial to reconcile on a quarterly basis. The City is working on a formal policy for write-offs of uncollectible balances.
2011-09 Utility Accounts Receivable - The City’s IT department is currently working on this issue with the host vendor and expects it will be resolved in the near future.
2011-10 Capital Assets - The City concurs with the comments and is currently in the process of reviewing and updating the policies related to capital assets and expects these issues will be addressed through that process.2011-11 Housing Program Expenditures - The City is currently reviewing the authorization requirements for the Community Housing Division and believes these issues will be addressed in that process.
100 East Boynton Beach Boulevard, Boynton Beach, L 33 35Phone: (561) 742-6310 Internet: www.boynton-beach.org
City of Boynton Beach, Florida
IV-32
THE CITY OF BOYNTON BEACH
FY 2011 COMPREHENSIVE ANNUAL FINANCIAL REPORT
IV-33
2011-12 Inventory - The City realized this was an oversight and has begun reconciling the warehouse ledgers to the accounting information software.
2011-14 Information Technology Systems - The City’s IT department will consider the recommendations and discuss them with the host vendor to determine the appropriate action.
Sincerely,
.Tim W. HowardDeputy Director of Financial Services
IV-33