comprehensive inorganic chemistry ii || fischer–tropsch synthesis: catalysts and chemistry
TRANSCRIPT
Co
7.20 Fischer–Tropsch Synthesis: Catalysts and ChemistryJ van de Loosdrecht, Sasol Technology Pty (Ltd), Sasolburg, South Africa; Eindhoven University of Technology, Eindhoven,The NetherlandsFG Botes, Sasol Technology Pty (Ltd), Sasolburg, South AfricaIM Ciobica, Eindhoven University of Technology, Eindhoven, The NetherlandsA Ferreira, P Gibson, DJ Moodley, AM Saib, and JL Visagie, Sasol Technology Pty (Ltd), Sasolburg, South AfricaCJ Weststrate and JW (Hans) Niemantsverdriet, Eindhoven University of Technology, Eindhoven, The Netherlands
ã 2013 Elsevier Ltd. All rights reserved.
7.20.1 Introduction: Processes, Catalysts, and Recent History 5267.20.1.1 ‘Anything’-to-liquids Technology: Syngas Production, FTS, and Product Workup 5267.20.1.2 FTS, the Product Distribution 5267.20.1.3 Fischer–Tropsch Catalysts and Modes of Operation 5277.20.1.4 Historical Development of the FTS 5297.20.2 Iron-Based FTS Catalysts 5317.20.2.1 Introduction 5317.20.2.2 Commercial Applications 5317.20.2.3 Iron Fischer–Tropsch Catalyst Preparation 5317.20.2.3.1 Fusion 5327.20.2.3.2 Precipitation 5337.20.2.3.3 Improving iron Fischer–Tropsch catalyst precursors by promoters 5347.20.2.3.4 Activation and reduction procedures 5347.20.2.4 Selectivity Manipulation of Iron Catalysts 5357.20.2.5 Catalyst Stability During FTS 5357.20.2.6 Spent Catalyst Management 5367.20.3 Cobalt-Based FTS Catalysts 5377.20.3.1 Introduction 5377.20.3.2 Composition of Cobalt Catalysts 5377.20.3.3 Preparation of Cobalt Fischer–Tropsch Catalysts 5397.20.3.3.1 Precipitation 5397.20.3.3.2 Preparation methods involving pre-shaped supports 5407.20.3.3.3 Calcination 5417.20.3.3.4 Reduction 5417.20.3.4 Cobalt Catalyst Fischer–Tropsch Performance 5417.20.3.5 Deactivation and Regeneration of Cobalt Fischer–Tropsch Catalysts 5447.20.4 Mechanisms and Kinetics of FTS Over Iron and Cobalt Catalysts 5467.20.4.1 Introduction 5467.20.4.2 Surface Science Studies and Model Reactions 5477.20.4.2.1 Adsorption of CO and hydrogen on model surfaces 5477.20.4.2.2 C–O bond scission 5487.20.4.2.3 Hydrogenation and the stability of C1Hx species 5497.20.4.3 DFT Modeling 5497.20.4.3.1 CO Dissociation 5497.20.4.3.2 CþH reactions 5507.20.4.3.3 Chain growth 5517.20.4.4 Macrokinetic Observations and Models 5517.20.4.4.1 General observations regarding kinetics 5517.20.4.4.2 Simple macrokinetic models 5527.20.4.4.3 Selectivity modeling 5527.20.4.5 Mechanistic and Kinetic Implications 5537.20.5 Conclusion 554References 554
mprehensive Inorganic Chemistry II http://dx.doi.org/10.1016/B978-0-08-097774-4.00729-4 525
526 Fischer–Tropsch Synthesis: Catalysts and Chemistry
7.20.1 Introduction: Processes, Catalysts,and Recent History
The Fischer–Tropsch synthesis (FTS) represents technology
from the 1920s1,2 that has continuously been revived to pro-
vide synthetic hydrocarbon fuels and chemicals from initially
coal, later natural gas, and nowadays also biomass. Virtually
any source of (hydro)carbon feedstock can be converted to a
mixture of synthesis gas, or syngas (CO and H2), which is in
fact a key intermediate on which theoretically the entire chem-
ical industry could be based. FTS stands for the reaction(s) of
synthesis gas to predominantly straight-chain hydrocarbons,
which can be paraffins from CH4 to waxes (CnH2nþ2 with n
from 1 to over 100), olefins from ethylene to much longer
molecules (CnH2n, with n�2), and to a lesser extent oxygen-
ated products such as alcohols. It produces as main by-
products water and/or carbon dioxide, that is, due to the
water-gas shift (WGS) reaction. Being a highly exothermic
reaction, it generates large amounts of heat. The process is
represented by the simplified reaction equations
FTS : COþ 2H2 ! �CH2 �þH2O � 165kJmol�1 [1]
WGS : COþH2O⇄H2 þ CO2 � 42kJmol�1 [2]
Reaction [1] represents in essence a polymerization, imply-
ing that the product will be a mixture of hydrocarbons with
a distribution in molecular weights. Selectivity and control
thereof are therefore of key importance in FTS technology.
Fischer–Tropsch technology represents a subject of inten-
sive research both in industry and in academia. Many excellent
reviews are available.3–9
In this chapter, we first describe the general aspects of the
technology in which the FTS features, then the more chemical
aspects of the process in relation to the iron and cobalt catalysts
that are used in practical applications, and finally mechanistic
insight, on the basis of kinetics, surface science, and computa-
tional modeling.
7.20.1.1 ‘Anything’-to-liquids Technology: SyngasProduction, FTS, and Product Workup
The overall process from original carbon source for the syngas
to the FTS product is named after the feedstock employed,
hence the terminology ‘coal-to-liquids’ (CTL), ‘gas-to-liquids’
(GTL) and ‘biomass-to-liquids’ (BTL), collectively known as
XTL (‘anything’-to-liquids).
In all instances, the carbon source is first converted to
synthesis gas (or ‘syngas’ for short), which is a mixture of CO
and H2. Solid feedstocks such as coal or biomass are gasified,
usually noncatalytically, by partial oxidation with oxygen (sup-
plying the heat for the endothermic gasification reactions) and
reaction with steam (which acts as a gasification agent, hydro-
gen source, and coolant).
When the starting material is natural gas, it can also be
adiabatically reformed in the presence of oxygen and steam.
There are different embodiments of this approach, such as
autothermal reforming (ATR), noncatalytic partial oxidation
(POX), and catalytic partial oxidation (CPOX), but in essence
the chemistry of all is the same and very similar to that of coal
gasification. Alternatively, heat can be supplied externally, in
which case the gas is reformed only with steam and/or CO2,
but no oxygen is added. Examples of this approach include
steam reforming (where mainly steam is added), dry reforming
(where mainly CO2 is added), and heat exchange reforming
(where process heat is supplied to the reformer tubes). Typical
reforming catalysts are based on nickel as the active metal.10
The second step in the XTL process is to catalytically convert
the syngas to a range of hydrocarbons via the FT synthesis,
which mainly yields linear alkanes and 1-alkenes, and which
will be the main subject of this chapter hereafter.
The third and last step is usually the workup of the
hydrocarbons to final products, which are typically fuels, but
optionally also chemicals. A popular application at present is
to target the production of long chain waxes in the FT synthe-
sis, followed by hydrocracking to middle distillate range
components, such as diesel (C9–C22) and jet fuel (C9–C15).
Hydrocracking catalysts are bifunctional in nature, with either
a noble metal (e.g., Pt) or sulfided base metals (e.g., Ni/W or
Co/Mo) as the hydrogenation function on a catalytically active
acidic support, such as a silica–alumina. We refer to the liter-
ature for further information on this subject.11,12
7.20.1.2 FTS, the Product Distribution
At the chemistry level, the FT synthesis is both a CO hydroge-
nation reaction and a polymerization reaction. The former is
reflected by the fact that the C–O bond must be broken and
new C–H bonds formed. Additionally, C–C bonds must be
formed in order to effect hydrocarbon chain growth. Since the
product carbon number distribution approximately follows a
statistical function called the Anderson–Schulz–Flory relation-
ship, it is widely accepted that chain growth occurs one carbon
atom at a time via a polymerization mechanism. Proposals for
the monomer of chain growth, which is produced in situ, have
included adsorbed CO, an enol species and a CHx species,7,13–15
and will be discussed further in the section on mechanism and
kinetics.
The competition between chain growth (yielding a surface
intermediate with one higher carbon number) and chain ter-
mination (yielding a desorbed final product) is determined by
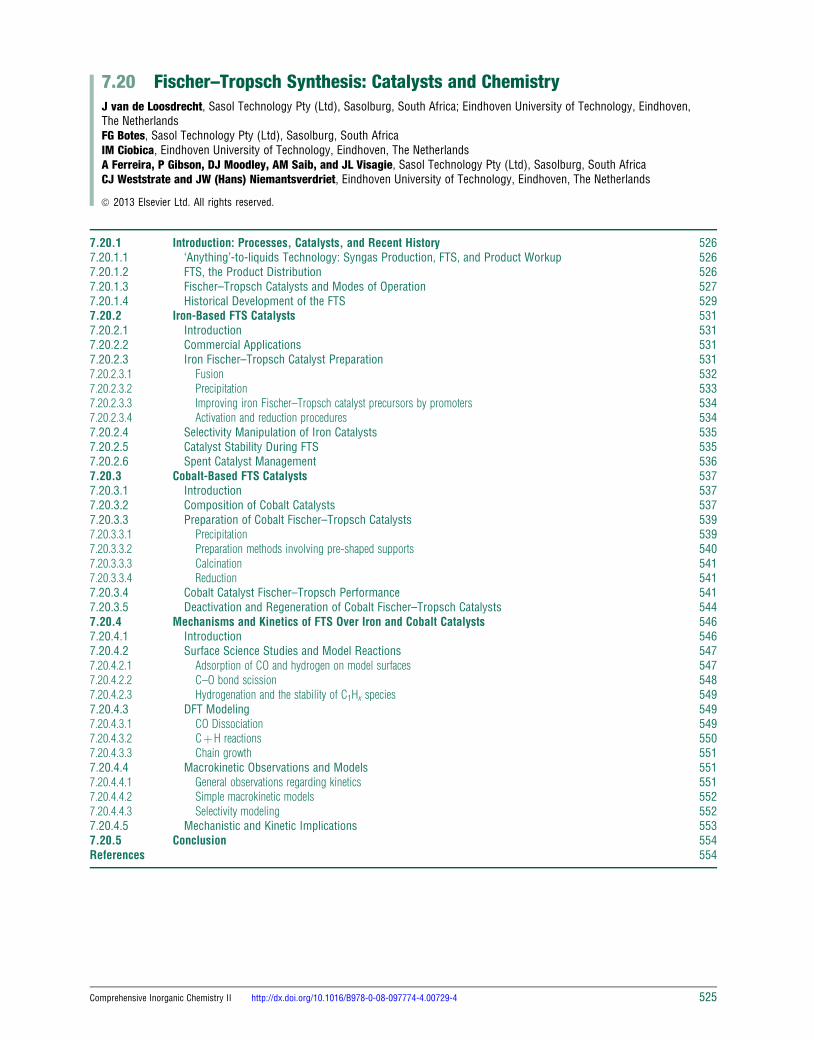
the probability for growth, called the a-value. A higher a-valuewill result in longer hydrocarbons and thus a heavier product
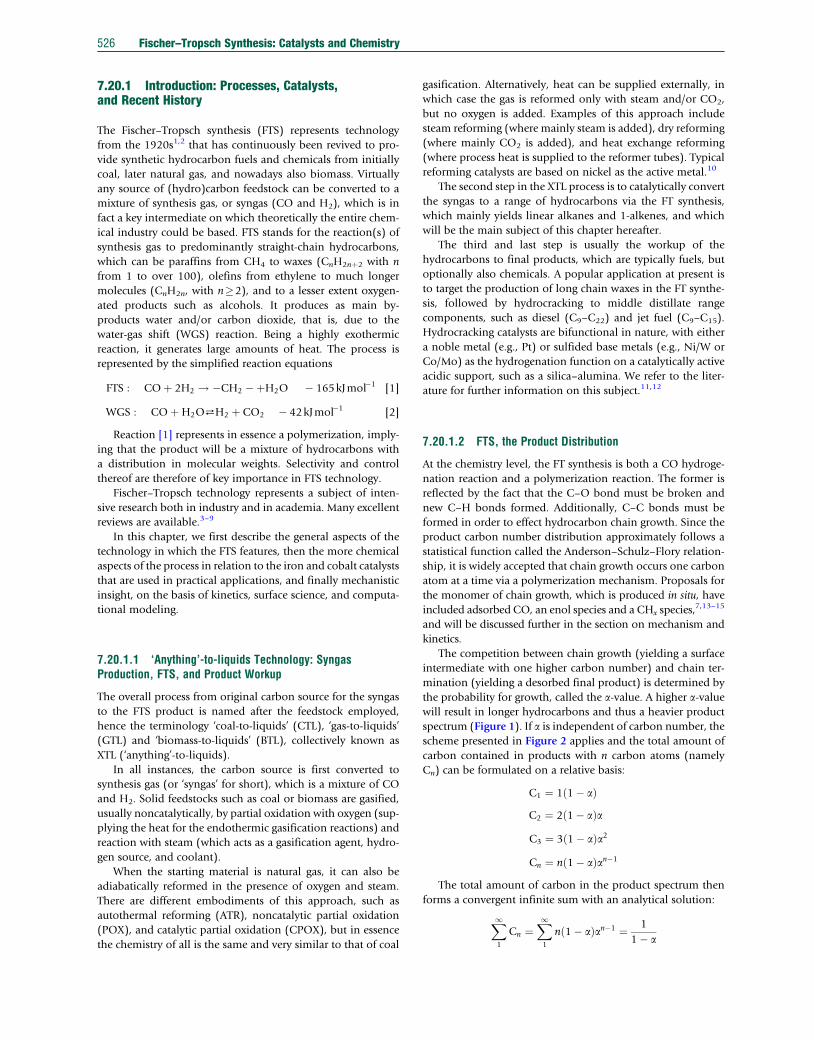
spectrum (Figure 1). If a is independent of carbon number, the
scheme presented in Figure 2 applies and the total amount of
carbon contained in products with n carbon atoms (namely
Cn) can be formulated on a relative basis:
C1 ¼ 1 1� að ÞC2 ¼ 2 1� að ÞaC3 ¼ 3 1� að Þa2
Cn ¼ n 1� að Þan�1
The total amount of carbon in the product spectrum then
forms a convergent infinite sum with an analytical solution:
X11
Cn ¼X11
n 1� að Þan�1 ¼ 1
1� a
C* → C1* → C2* → C3* → …..Intermediates
Products
C1 C2 C3
a a a
1-a 1-a 1-a
Figure 2 Carbon chain growth and termination scheme for thederivation of the Anderson–Schulz–Flory equation, with a the chaingrowth probability factor, Cn (n¼1, 2, 3, . . .) the final products with ncarbon atoms, and Cn* the intermediates with n carbon atoms.
0 0.1 0.2 0.3 0.4 0.5 0.6 0.7 0.8 0.9 1
Chain-growth probability, a
Car
bon
ato
m s
elec
tivity
(%)
100
90
80
70
60
50
40
30
20
10
0
CH4 C5+
C2–C4 C5–C11gasoline
C20+waxes
C9–C22diesel-
distillates
HTFT LTFT
Figure 1 Hydrocarbon product spectrum that is produced during Fischer–Tropsch synthesis for varying chain growth probability a. High-temperatureFischer–Tropsch technology (HTFT) corresponds approximately to 0.70<a<0.75, and low-temperature Fischer–Tropsch (LTFT) to about0.85<a<0.95.
Fischer–Tropsch Synthesis: Catalysts and Chemistry 527
This means that the selectivity toward products with n
carbon atoms on a carbon atom basis, namely Sn, can be
expressed as follows:
Sn ¼ CnX11Cn
¼ n 1� að Þ2an�1
After converting this equation to the logarithmic domain
and rearranging, it is found that
lnSnn
� �¼ n ln aþ ln
1� að Þ2a
[3]
As a result, a plot of ln(Sn/n) versus carbon number (n) gives
rise to a straight line with a slope equal to ln(a). However,
deviations in the actual FT product spectrum from the ideal
Anderson–Schulz–Florydistributionareusually observed.4,14,16,17
These include a higher methane and a lower C2 selectivity than
predicted by the equation. There is also an increase in the chain
growth probability factor and concomitant decrease in the
olefin/paraffin ratio with hydrocarbon chain length. In addi-
tion to linear alkanes and 1-alkenes, a variety of other products
are also formed, including branched aliphatic compounds,
alcohols, aldehydes, ketones, acids, and (at sufficiently high
operating temperatures) even aromatics. This alludes to the
complexity of the reaction and many unresolved issues remain
regarding the reaction mechanism. A further complicating
factor is that it is not always clear which of these compounds
are primary FT products and which are formed subsequently by
secondary reactions. For example, olefins and alcohols can
undergo a range of secondary reactions, such as hydrogenation,
double bond isomerization, skeletal isomerization, and con-
version to heavier compounds.4,16
7.20.1.3 Fischer–Tropsch Catalysts and Modes of Operation
Metals known to catalyze the FT reaction mainly include iron,
cobalt, ruthenium, and nickel.6 Ruthenium is a scarce and
expensive metal, whereas nickel only forms methane at reac-
tion temperatures sufficiently high to suppress nickel carbonyl
formation (note that methanation is the reverse reaction of
methane reforming, for which nickel-based catalysts are com-
monly used10). As a result, only iron- and cobalt-based FT
catalysts have found commercial application.18–20 Iron gener-
ally produces more olefins and oxygenates than cobalt (i.e., a
less hydrogenated product spectrum), which may be related to
the lower hydrogenating ability of iron. While cobalt is active
in the metallic state,19 iron catalysts change under Fischer–
Tropsch conditions to a complex mixture of iron carbides
and oxides.20,21
Byproducts of the FTS originate from the way oxygen from
CO is removed. With cobalt catalysts, essentially all oxygen
from CO dissociation (typically around 99%) is discarded as
water. Iron catalysts differ in this respect, as a significant por-
tion of the oxygen is also discarded as CO2. The latter is often
visualized as a separate, consecutive reaction, namely theWGS.
Stoichiometrically, the overall process can be represented by
reactions [1] and [2], which we repeat here:
FTS : COþ 2H2 ! �CH2 �þH2O � 165kJmol�1 [1]
WGS : COþH2O⇄H2 þ CO2 � 42kJmol�1 [2]
The net rate of hydrogen conversion divided by CO conver-
sion (sometimes referred to as the ‘usage ratio’) is extremely
important for the gas loop design around an FT reactor. In the
one extreme, where virtually no WGS takes place, the usage
528 Fischer–Tropsch Synthesis: Catalysts and Chemistry
ratio is only determined by the FT reaction (with a high selec-
tivity to long hydrocarbons and a low selectivity to methane)
and assumes a value of around 2. In the other extreme, where
almost all water is shifted to CO2, the usage ratio can approach
a value of 0.5. The low propensity of cobalt catalysts for the
WGS makes them the preferred catalysts for GTL application,
since the H2/CO ratio of syngas derived from natural gas is
already close to or above the usage ratio. Any additional WGS
will result in an excess of hydrogen that would not be fully
consumed by the FT reaction, even if CO is converted to
extinction. Conversely, the WGS is more facile over iron
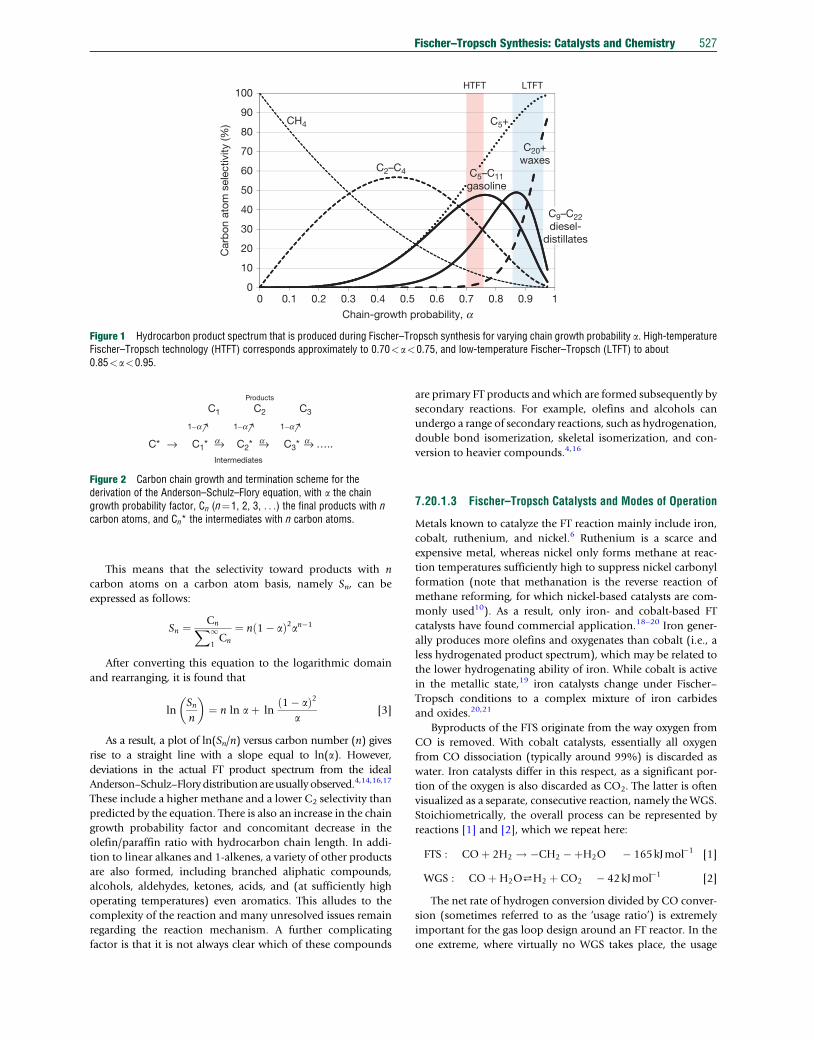
Table 1 Fischer–Tropsch synthesis, current commercial plants and plant
Company Location Carbon feedstock Catalyst
Sasol Sasolburg, SouthAfrica
Initially coal, currentlynatural gas
Fused Fe
Precipita
Precipita(spray
Sasol Secunda, SouthAfrica
Mostly coal, nowsupplemented bynatural gas
Fused Fe
Shell Bintulu, Malaysia Natural gas Co/SiO2
Co/TiOPetroSA Mosselbay, South
AfricaNatural gas Fused Fe
Sasol-QP (Oryx) Ras Laffan, Qatar Natural gas Co/Al2O3
Shell (Pearl) Ras Laffan, Qatar Natural gas Co/TiO2
Chevron-Sasol Escravos, Nigeria Natural gas Co/Al2O3
aSAS: Sasol Advanced Synthol, fixed fluidized bed.
Moving bed1–200 μm particles
LTFT, 200–250 ∞C• 3-phase system: gas–liquid–solid• a = 0.85–0.95• Products: wax, diesel, naphta• Catalysts: supported cobalt or precipitated iron
HTFT, 320–350 ∞C• 2-phase:gas–solid• a = 0.70–0.75• Products: petrol and chemicals• Catalysts: fused iron, K-promoted
Circulatingfluid bed
7000 barrels per day 20 0
Slurry bubbcolumn,
filled with w24 000 barr
per day
Figure 3 Overview of Fischer–Tropsch technology with reactors (figure mic
catalysts, yielding amuch lower overall usage ratio that is better
suited to syngas feeds with a low H2/CO ratio, such as that
generally obtained from coal gasifiers.
Table 1 presents the current commercial application of the
FTS. There are two important aspects to note from this table.
First, the worldwide FTS capacity is expected to reach a total of
just over 400000 barrels per day by 2013 (1 barrel¼159 l),
which is very small compared to the total crude oil production
of around 80–85 million barrels per day. Second, the FTS has
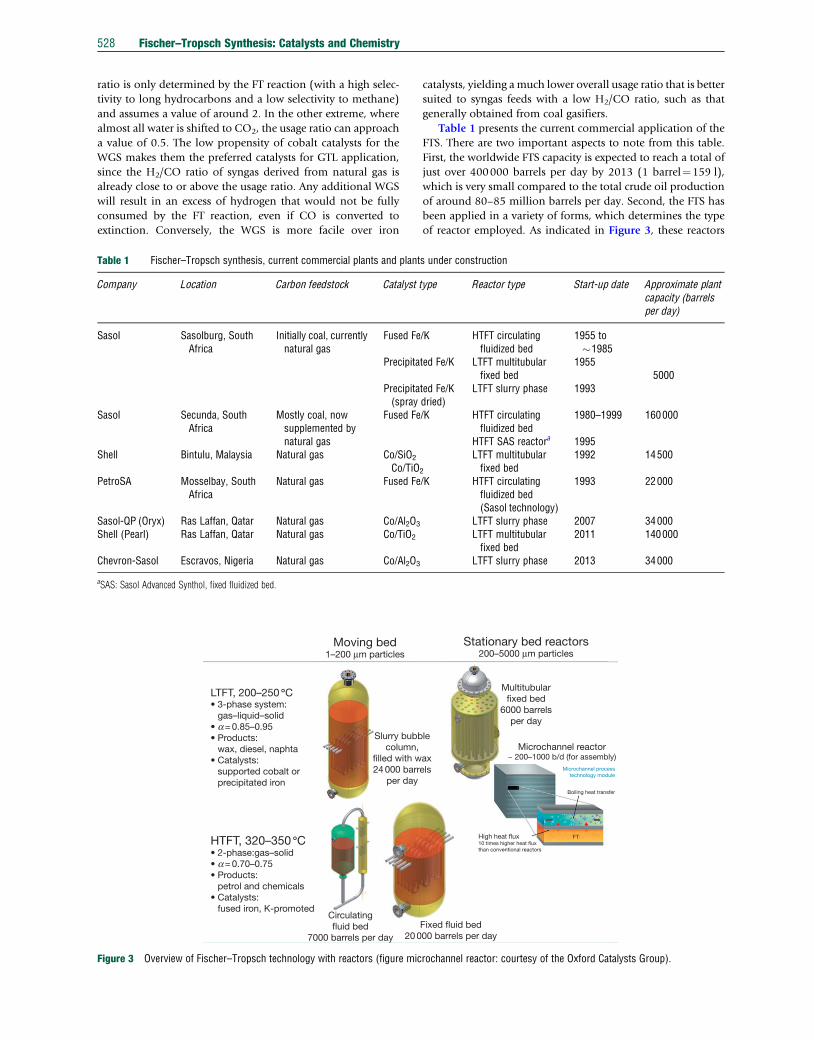
been applied in a variety of forms, which determines the type
of reactor employed. As indicated in Figure 3, these reactors
s under construction
type Reactor type Start-up date Approximate plantcapacity (barrelsper day)
/K HTFT circulatingfluidized bed
1955 to�1985
ted Fe/K LTFT multitubularfixed bed
19555000
ted Fe/Kdried)
LTFT slurry phase 1993
/K HTFT circulatingfluidized bed
HTFT SAS reactora
1980–1999
1995
160000
2
LTFT multitubularfixed bed
1992 14500
/K HTFT circulatingfluidized bed(Sasol technology)
1993 22000
LTFT slurry phase 2007 34000LTFT multitubularfixed bed
2011 140000
LTFT slurry phase 2013 34000
Stationary bed reactors200–5000 μm particles
High heat flux10 times higher heat fluxthan conventional reactors
Fixed fluid bed00 barrels per day
le
axels
Multitubularfixed bed
6000 barrelsper day
Microchannel reactor~ 200–1000 b/d (for assembly)
Microchannel processtechnology module
Boiling heat transfer
FT
rochannel reactor: courtesy of the Oxford Catalysts Group).
Fischer–Tropsch Synthesis: Catalysts and Chemistry 529
can broadly be classified in two classes, namely two-phase or
three-phase reactors, and moving or stationary catalyst bed
reactors.22–24
The high-temperature Fischer–Tropsch (HTFT) synthesis
process is characterized by operating temperatures of about
320–350 �C and the products are essentially only in the gas
phase under reaction conditions, giving rise to a gas–solid
system without any bulk liquid phase. Originally, this process
was operated in circulating fluidized bed reactors and more
recently in fixed fluidized bed reactors. Cobalt catalysts would
essentially only produce methane at these temperatures, mak-
ing alkali-promoted iron catalysts the only option for this
application. Due to the mechanical demand that these moving
bed reactors place on the catalyst, particle strength is an impor-
tant consideration; consequently, only fused bulk iron catalysts
have been employed commercially. The light product spectrum
is best suited to the production of gasoline, but the high
selectivity toward linear 1-olefins and (to a lesser extent) oxy-
genates allows for the extraction of chemicals from the product
slate. These include monomers such as ethylene and propyl-
ene, co-monomers such as 1-hexene and 1-octene, and sol-
vents (e.g., propanol, butanol, methyl ethyl ketone (MEK),
and acetaldehyde).25
The low-temperature Fischer–Tropsch (LTFT) synthesis is
operated between 200 and 250 �C.26,27 Both cobalt and iron
catalysts are suitable for this application, although cobalt cat-
alysts would typically be used toward the lower half of the
quoted temperature range. The heavy product spectrum
extends well into the domain of waxes, which are liquid
under reaction conditions. The presence of a bulk liquid phase
gives rise to a three-phase gas–liquid–solid system. Originally,
only fixed-bed reactors operating in a trickle bed mode were
employed for this synthesis. In order to limit the pressure
drop over the stationary catalyst bed, catalyst particle sizes
must be in the millimeter range, which brings about signifi-
cant intra-particle diffusion limitations. This not only limits
catalyst utilization, but also adversely affects product selectiv-
ities due to the differences in diffusion rates between hydro-
gen and CO that causes higher H2/CO ratios toward the
center of the particles. The highly exothermic nature of
the FT reaction causes axial and radial temperature profiles
in the catalyst bed.
More recently, slurry bubble-column reactors have been
developed to overcome some of these drawbacks. Syngas is
bubbled through a suspension of fine catalyst particles in the
liquid product phase. The catalyst particle sizes are usually less
than about 100 mm, which is sufficiently small to prevent intra-
particle diffusion limitations, while the well-mixed liquid phase
ensures virtual isothermal operation of the reactor. There are,
however, certain technical challenges associated with FTS slurry
reactors. A prerequisite of a slurry process is the development of
an efficient solid–liquid separation step to remove product wax
from the reactor. It is extremely important to ensure the
mechanical integrity of the catalyst to limit the extent of break-
up and attrition in the moving bed environment.
Of late there have been some new reactor developments for
FTS application, but none of these have been commercially
applied yet. Microchannel reactors can support very high heat
and mass transfer rates and thereby address the problems of
traditional fixed-bed reactors, while the stationary bed circum-
vents the challenges of slurry reactors. This approach shows
promise, especially with respect to the small-scale application
of a few hundred or a few thousand barrels per day production
capacity, and some relatively new commercial companies are
actively pursuing this technology.28
Structured reactors (monolith type reactors) for FT applica-
tion have also attracted the attention of mainly academia,
although there has been some limited interest from commer-
cial companies as well.29 In this approach, the active FT metal
(e.g., cobalt) is coated onto a large structure with a specific
geometry, which is then inserted into a reactor tube.
The LTFT synthesis is ideally suited for the production of
high-quality middle distillates (diesel and jet fuel) after hydro-
cracking of the long chain waxes. In addition, the heavy prod-
uct spectrum provides chemical opportunities in the form of
speciality waxes and base oils. The naphtha from the process is
also a high-quality feedstock for naphtha steam crackers that
produce mainly ethylene, but also some propylene.
7.20.1.4 Historical Development of the FTS
Historically, the first syngas conversion results were pub-
lished by Sabatier30 in 1902 where it was shown that a mix-
ture of carbon monoxide and hydrogen could be converted
into methane over nickel and cobalt catalysts. In the 1920s,
Franz Fischer and Hans Tropsch took this process a step
further and showed that syngas could be converted into a
mixture of higher hydrocarbons that could be used as petrol
or diesel (i.e., FTS).1,2 In their first patent,31 they described
the production of higher hydrocarbons using iron- and
cobalt-based catalysts operated at atmospheric pressure and
at temperatures below 300 �C. Further research in Germany
led to improved versions of this process. The first commercial
plant started in 1936. Several others followed and provided
Germany and Japan with synthetic fuel during the Second
World War. These plants used mainly cobalt catalysts
supported on kieselguhr (i.e., silica-based supports) and pro-
moted by magnesia and thoria, in fixed-bed reactors. Further,
China had FTS plants in the 1940 through 1960s, all based on
cobalt catalysts.32
After the war, the German FT technology came in the hands
of the Allied Forces. Many scientists and engineers who con-
tributed to the German developments were interrogated and
the entire Fischer–Tropsch technology was extensively investi-
gated at the US Bureau of Mines, which resulted in new two-
phase HTFT technology. The classical textbook by Storch,
Golumbic, and Anderson originates from this period.3 Small
plants were built in the US and operated in the 1950s.
Large-scale FTS developments mainly occurred in South
Africa.33 Sasol started an FTS plant in 1955 based on HTFT to
make petrol and on LTFT to produce wax. Both HTFT and LTFT
used iron-based catalysts. The HTFT technology formed the
basis for the large expansion of Sasol in the late 1970s/early
1980s when Sasol 2 and 3 were built in Secunda (see Table 1).
The main reasons for this expansion were the oil crises in the
1970s, which led to a significant increase in the crude oil price
(see Figure 4).
These oil crises also initiated renewed interest in FTS from
other companies like BP, ExxonMobil, Gulf, Shell, and Statoil,
which was mainly based on cobalt FTS catalysts.34,35 In the last
20 years, this has led to new commercial GTL plants by PetroSA
(South Africa; 1993), Shell (Malaysia; 1992), Sasol-Qatar

19700
50
100
150
200
250
Num
ber
of a
rtic
les/
pat
ents
US
cru
de
oil p
rice
($)
300
350
400 Patents
Patents
Oil price
Articles
US crude oil price
450
1975 1980 1985 1990
Publication year
1995 2000
Articles
2005 20100
10
20
30
40
50
60
70
80
90
100
Figure 4 Patents and articles per year compared with the crude oil price (figure inspired by de Smit and Weckhuysen21).
FTS
ATRASU
Figure 5 Photo of the Sasol-QP Oryx GTL plant in Qatar, showing the air separation units (ASUs), the auto-thermal reformers (ATRs), and theFischer–Tropsch synthesis (FTS) slurry reactors. The product work-up section located behind the FTS reactors is not visible (photo courtesy of Sasol).
530 Fischer–Tropsch Synthesis: Catalysts and Chemistry
Petroleum (Qatar; 2007; see Figure 5), Shell (Qatar; 2011),
and Sasol Chevron (Nigeria; under construction – start-up
2013). An overview of the current commercial operations
using FTS technology is shown in Table 1.
The investment decision to build the Sasol-Qatar Petroleum
Oryx-GTL plant was taken in 2003 when the oil price was $25/
barrel. The facility was built at a cost of $1 billion. Currently, a
yearly profit is generated of about $500 million.36 Sasol’s
much larger Secunda CTL facility is generating currently
about $2 billion profit annually.36 Shell’s Pearl plant (both
the FTS production – 140000 barrels per day – and the
upstream natural gas condensates – 120000 barrels per day –
together) was built at a cost of $20 billion,37 and Shell
announced to make annually $4 billion cash when Pearl is at
full production with the oil price at $70/barrel. It is clear that
new GTL/CTL facilities require large capital investments, and
are heavily dependent on the prevailing crude oil price. How-
ever, over the long term these large-scale GTL/CTL facilities do
make economic sense.
A new challenge to the GTL/CTL technology is global warm-
ing and the emission of CO2. Fuel products from GTL facilities
have a similar environmental footprint compared to crude
oil-derived fuels. However, products from CTL facilities have
a much larger CO2 impact, which is immediately clear from the
overall stoichiometric equations [1] and [2]. In the hypothet-
ical limit of using a carbon feedstock which does not contain
any hydrogen, one CO2 molecule is formed for every carbon
atom that ends up in a hydrocarbon. A large portion of the
CO2 produced in CTL plants is removed and concentrated, and
is therefore ideally suited for capturing, that is, ‘capture ready’.
At the same time new focus on products from biomass can
stimulate interest in FTS further, as biomass can be used as a
carbon source for syngas generation. Recently, Oxford Cata-
lysts has demonstrated their FTS technology using syngas made
from wood chips.28
Other opportunities for GTL applications in the future
might be the use of associated natural gas in small-scale plants
(<1000 barrels per day, as Oxford Catalysts and CompactGTL
are pursuing), as well as the use of shale gas in large-scale
facilities (as pursued by Sasol).
From an academic point of view, renewed interest in FTS
was clearly observed in twomain waves (see Figure 4). The first
wave occurred in the late 1970s, while the second one started
around 1995 and is still gaining momentum. The latter
Fischer–Tropsch Synthesis: Catalysts and Chemistry 531
observation is also matched by an increase in patenting activ-
ity. Of course, this revived activity is related to the increase in
the crude oil price, although the present academic interest is
certainly also inspired by the notion that crude oil resources are
limited. Typical topics in Fischer–Tropsch research with a high
academic interest are catalyst preparation methods, deactiva-
tion studies, and mechanistic and kinetic studies, in which
sophisticated tools such as in situ catalyst characterization,
surface science, molecular modeling, and transient kinetic
studies are the common ingredients. The increased interest
from both the academic as well as the commercial world has
created excellent scientific interactions and discussions, which
enabled further progress on this exciting topic of FTS. Many
questions are still outstanding, such as the state of the catalyt-
ically active surface under reaction conditions, and the reaction
mechanism in terms of elementary steps.
7.20.2 Iron-Based FTS Catalysts
7.20.2.1 Introduction
The iron-catalyzed FTS process is, along with ammonia synthe-
sis, one of the most studied systems in the field of heteroge-
neous catalysis. The reason for this is possibly the fact that the
application of the process is so versatile. Not only can iron FTS
produce a light hydrocarbon product stream ideal for the fuel
and chemical industry, it can also produce heavier hydrocar-
bons (C35þ) suited for the waxes market. Iron is also a cheap
raw material when compared to its cobalt counterpart (cobalt
is on average 250 times more expensive than iron raw mate-
rials) and it has been commercially applied since the late 1950s
by Sasol38 (Table 1). Iron is believed to be more tolerant of
poisons, for example, sulfur in synthesis gas than cobalt. It is
also known to be responsive to selectivity manipulation by the
addition of promoters and a variation of typical process param-
eters, for example, temperature, pressure, and H2/CO ratio. The
disadvantage, however, is the fact that iron FTS catalysts deac-
tivate rather quickly (activity or selectivity loss) and this will be
discussed in more detail later in this section. As already men-
tioned the iron FTS process can be manipulated to produce a
range of carbon number distributions with the final product
stream depending mainly on the temperature applied during
FTS. At lower temperatures, for example, 220–250 �C the chain
growth probability (a) of the catalyst is approximately 0.94
indicating that the bulk of the products will consist of hydro-
carbons longer than C21. In the case of higher temperatures, for
example, 320–350 �C, the chain growth probability decreases
to 0.7 and even lower with the main products being light
hydrocarbons utilized for the production of transportation
fuel and chemical feedstocks. Figure 1 shows the carbon
chain length as a function of chain growth probability. The
influence of promoters on selectivity will be discussed later in
this section.
Although there are many advantages with regard to iron-
catalyzed FTS, the transformations of the iron catalyst during
activation and FTS are rather complex and still not fully under-
stood. During catalyst preparation, iron oxides (e.g., hematite
(Fe2O3) and magnetite (Fe3O4)) are produced and these are
transformed to either a-Fe or iron carbides during activation
depending on the conditions.
7.20.2.2 Commercial Applications
Sasol is a leader in the field when it comes to commercializing
iron-catalyzed FTS processes. In the early 1950s, Sasol com-
mercialized Fe-catalyzed FTS based on the Ruhrchemie process
to produce a variety of synthetic petroleum products using the
Arge Tubular Fixed bed reactors (see Table 1 and Figure 3).
Later on, they developed the slurry-bed reactor and this reactor
together with the Arge reactors are used to produce high-
molecular-weight hydrocarbons for the wax industry.38 In the
late 1950s, Sasol also commercialized a circulating fluidized
bed reactor at their Sasolburg facilities in which fused iron
catalyst is fluidized at high temperatures to produce lighter
hydrocarbons ideally suited for producing fuel and chemical
feedstock. In the late 1970s/early 1980s Sasol’s Secunda plant
was built using this circulating fluidized bed technology, which
was replaced in the late 1990s by the improved fixed fluidized
bed technology. Subsequent to Sasol’s successful commercial-
ization of iron-catalyzed FTS, South Africa’s national oil
company (PetroSA) commercialized a GTL facility using
previous-generation high-temperature FTS technology (Sasol
licensed technology). This technology is based on a fused
iron catalyst operated in a fluidized bed reactor at high tem-
perature (330–350 �C). In 2010, it was still recognized as one
of the world’s largest GTL refineries, producing about 22000
barrels per day of high-quality FTS-derived fuels.
Rentech, based in Colorado, USA has long been investing in
iron-based FTS research. Rentech demonstrated their iron-
based FTS technology in their Product Demonstration Unit
(PDU) in the middle of 2008. The PDU produces approxi-
mately ten barrels per day of ultra-clean diesel, aviation fuels,
and naphtha.39
Synfuels China has recently emerged as an important player
in the Fischer–Tropsch industry.32 Their development of a so-
called high-temperature slurry-phase technology (HTSFTP™)
and associated iron-based catalyst is novel to the industry. The
integrated technology promises improvements in process ther-
mal efficiency and a highly active catalyst. This technology has
been demonstrated in a 4000 barrels per day semi-commercial
CTL facility owned by the YiTai Coal Liquefaction Company in
Xue JiaWan, Erdos, Inner Mongolia.
7.20.2.3 Iron Fischer–Tropsch Catalyst Preparation
There are several preparation methods available in the litera-
ture for the synthesis of Fe FTS catalysts, like precipitation and
fusion. Iron catalysts prepared commercially are actually iron
oxides, hydroxides, or oxy-hydroxides, which undergo an acti-
vation step such as reduction or pre-treatment in syngas prior
to FTS. General requirements for the catalysts are, among
others, selectivity (low for methane; high for the targeted
hydrocarbon fraction), activity and stability, and mechanical
robustness. The operation conditions, for example, high or low
temperature (HTFT and LTFT), and the type of reactor
employed put specific demands on the catalyst synthesis
procedure. For a tubular fixed-bed-type reactor, minimization
of mass transfer limitations is an important consideration, and
here catalyst strength is less important than catalyst shape
and form. For a fluidized bed reactor, however, catalyst
strength as well as particle size and density are very important.40

532 Fischer–Tropsch Synthesis: Catalysts and Chemistry
Table 2 summarizes the typical preparation methods used for
the various applications.
Key factors when choosing an iron source are cost and
availability. Although most of the iron oxides, hydroxides,
and oxy-hydroxides are readily available in nature, precursors
for iron catalysts are rather chemical grade raw materials.41
This is done to ensure that impurities that can influence
the catalyst are either removed or carefully controlled. It
is typical for commercial manufacturers of iron catalysts to
produce chemical grade iron(III)nitrate from sufficiently
pure scrap iron on site as part of the preparation. Large-scale
fusion preparation methods use iron ores or mill scale from
steel mills. Complex preparation methodologies that involve
novel chemicals and/or intricate transformations are rarely
commercially viable when compared to the tried and trusted
methods of precipitation and fusion. The gains from such
novel preparations must be truly unique to justify the addi-
tional expense.
Table 2 Catalyst preparation methods used for high and low temperature
Reactor Important catalyst properties
HTFTCirculating or fixed fluidized bed reactors,320–350 �C
Low surface area (<10 g m�2), hhigh strength
LTFTTubular fixed bed reactor, 220–250 �C High surface area, sufficient stre
Slurry bed reactors, 220–250 �C High surface area, small particle(50–250 mm)
Promoters
Mill scale Oxidation Arc furnace
Figure 6 Catalyst preparation diagram for the HTFT fused iron catalyst. Mil
80 mm
Inclusion
(a)
Figure 7 (a) SEM image of a HTFT Fe catalyst cast ingot, showing inclusions
7.20.2.3.1 FusionFusion produces oxidic iron particles of low surface area, high
density, and high strength, which are ideally suited for appli-
cation in circulating fluidized bed reactors (Figure 3). During
the fusion process, the iron oxide raw material together with
the promoters are fed into an arc furnace where it is subjected
to temperatures above 1000 �C. After fusion, the molten mate-
rial is cast into flat bars (ingots) and cooled. These ingots are
milled to a specified particle-size range to ensure optimum
fluidization (Figure 6).
The disadvantage of fusion is the fact that the inorganic
impurities, for example, silica and alumina oxides present in
the raw mill scale starting material, form inclusions during
cooling of the ingot. The alkali promoters migrate and bind
during cooling to these inclusions, which negates the promo-
tion effect. Figure 7(a) is a scanning electron microscopy
(SEM) image of a fused ingot showing clearly the inclusions
and with scanning electron microscopy energy-dispersive X-ray
iron-based Fischer–Tropsch processes
Raw material Synthesis method
igh density, Mill scale Fusion followed by crushing andmilling
ngth Fe(NO3)3 and silicasource
Precipitation followed byextrusion/shaping
s Fe(NO3)3 and silicasource
Precipitation followed by spraydrying and calcination
Coolingstep
Sizereduction(milling)
Reduction
l scale means iron metal pieces from the steel industry.
FeSiAlkali 1Alkali 2
(b)
of silica and alkali and (b) SEM EDX mapping on one of these inclusions.
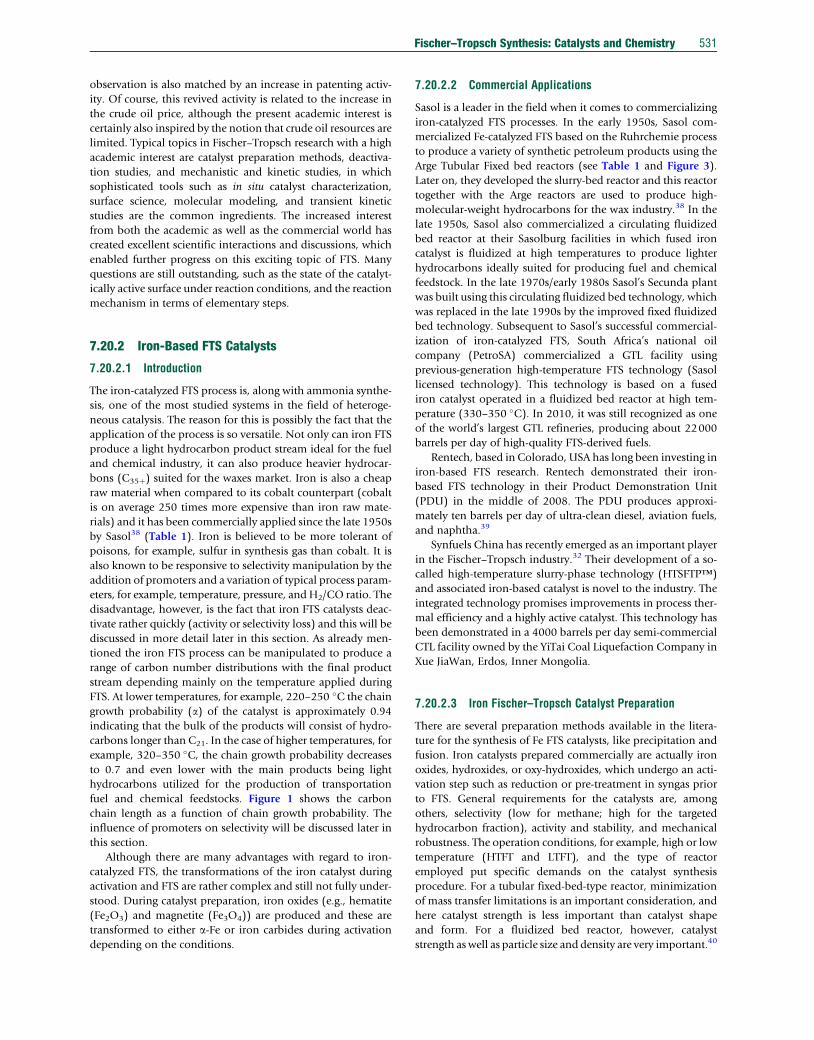
Goethite: 8 – 200 m2g-1
Ferrihydrite: 100 – 700 m2g-1
Magnetite: 4 – 100 m2g-1Degree
ofcrystallinity
Hematite: 12 – 27 m2g-1
Figure 8 Degree of crystallinity is decreasing with an increased surfacearea for various iron oxides.
Fischer–Tropsch Synthesis: Catalysts and Chemistry 533
spectroscopy (SEM EDX)(Figure 7(b)) one can see the pres-
ence of the alkali in these inclusions.
The development of fixed fluidized bed reactors diminished
the need for particles of high mechanical strength, and permit-
ted the use of catalysts with lower density and higher surface
area. One of the prospective routes to alternative HT FTS
catalyst precursors is the precipitation of high-density, low-
surface-area iron oxides, hydroxides, and (oxy)hydroxides
from solutions of iron(III) salts followed by calcination.
7.20.2.3.2 PrecipitationPrecipitation of iron(III)oxides from iron(III)nitrate solutions
was one of the first methods reported in the literature for the
preparation of iron FTS catalysts.42 In the late 1930s, Ruhrch-
emie developed a large-scale preparation based on pre-
cipitation. In this procedure, the iron(III) salt is reacted with
a base to form an iron(III) oxide–(oxy)hydroxide precipitate.
By variation in process conditions, for example, pH, precipita-
tion rate, and temperature, catalyst properties such as surface
area and crystallite size can be controlled. Figure 8 illustrates
the decrease of crystallinity versus surface area for the various
iron oxides known as precursors for Fe FTS catalysts.
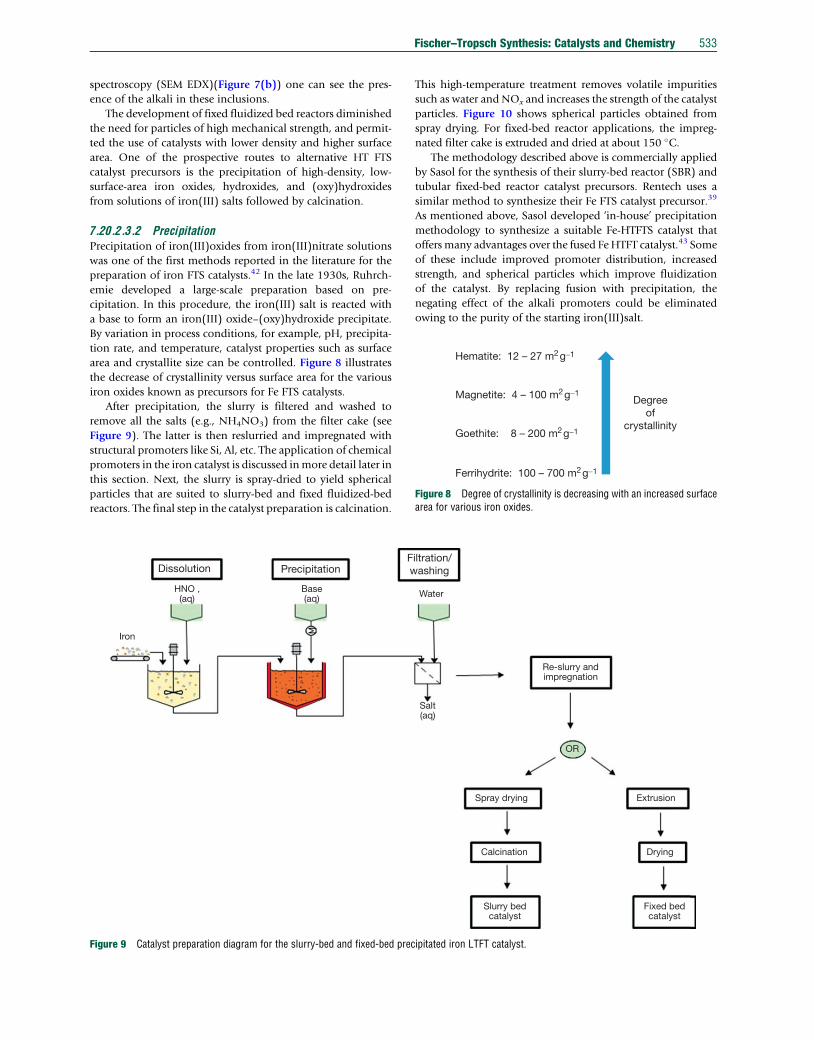
After precipitation, the slurry is filtered and washed to
remove all the salts (e.g., NH4NO3) from the filter cake (see
Figure 9). The latter is then reslurried and impregnated with
structural promoters like Si, Al, etc. The application of chemical
promoters in the iron catalyst is discussed inmore detail later in
this section. Next, the slurry is spray-dried to yield spherical
particles that are suited to slurry-bed and fixed fluidized-bed
reactors. The final step in the catalyst preparation is calcination.
Dissolution PrecipitationFw
HNO ,(aq)
Base(aq)
Iron
Figure 9 Catalyst preparation diagram for the slurry-bed and fixed-bed prec
This high-temperature treatment removes volatile impurities
such as water and NOx and increases the strength of the catalyst
particles. Figure 10 shows spherical particles obtained from
spray drying. For fixed-bed reactor applications, the impreg-
nated filter cake is extruded and dried at about 150 �C.The methodology described above is commercially applied
by Sasol for the synthesis of their slurry-bed reactor (SBR) and
tubular fixed-bed reactor catalyst precursors. Rentech uses a
similar method to synthesize their Fe FTS catalyst precursor.39
As mentioned above, Sasol developed ‘in-house’ precipitation
methodology to synthesize a suitable Fe-HTFTS catalyst that
offers many advantages over the fused FeHTFT catalyst.43 Some
of these include improved promoter distribution, increased
strength, and spherical particles which improve fluidization
of the catalyst. By replacing fusion with precipitation, the
negating effect of the alkali promoters could be eliminated
owing to the purity of the starting iron(III)salt.
iltration/ashing
Salt(aq)
Re-slurry andimpregnation
OR
Spray drying
Calcination
Slurry bedcatalyst
Extrusion
Drying
Fixed bedcatalyst
Water
ipitated iron LTFT catalyst.
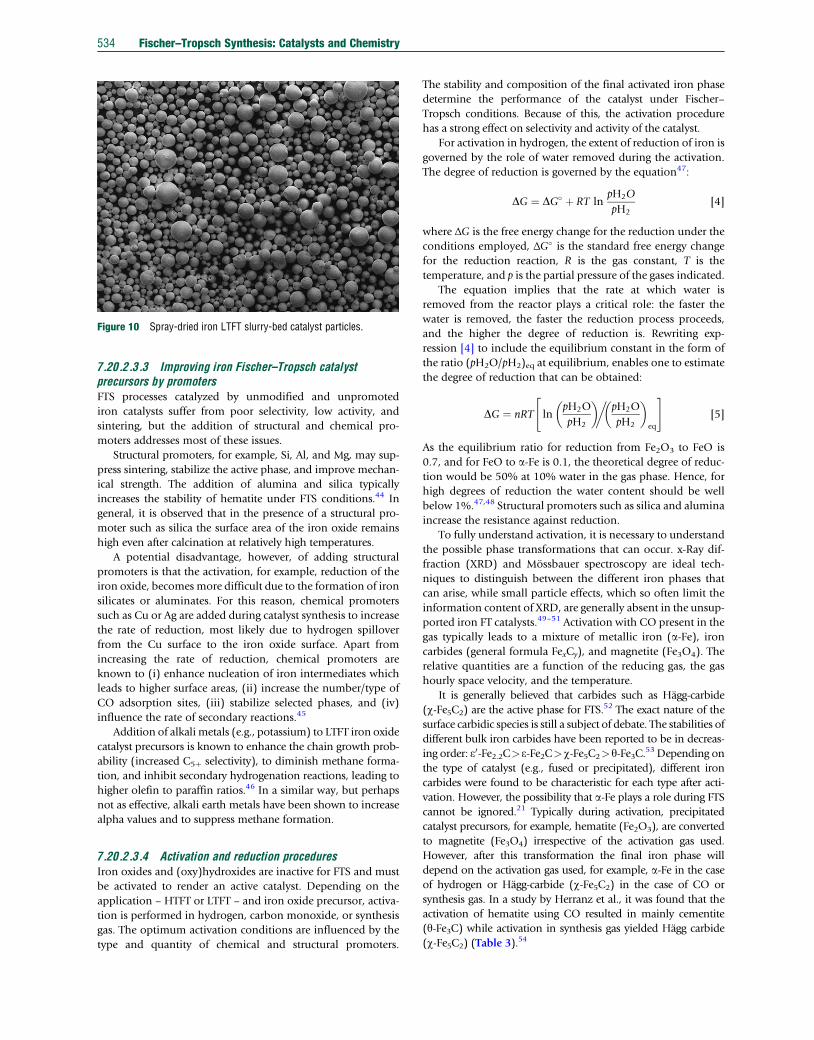
Figure 10 Spray-dried iron LTFT slurry-bed catalyst particles.
534 Fischer–Tropsch Synthesis: Catalysts and Chemistry
7.20.2.3.3 Improving iron Fischer–Tropsch catalystprecursors by promotersFTS processes catalyzed by unmodified and unpromoted
iron catalysts suffer from poor selectivity, low activity, and
sintering, but the addition of structural and chemical pro-
moters addresses most of these issues.
Structural promoters, for example, Si, Al, and Mg, may sup-
press sintering, stabilize the active phase, and improve mechan-
ical strength. The addition of alumina and silica typically
increases the stability of hematite under FTS conditions.44 In
general, it is observed that in the presence of a structural pro-
moter such as silica the surface area of the iron oxide remains
high even after calcination at relatively high temperatures.
A potential disadvantage, however, of adding structural
promoters is that the activation, for example, reduction of the
iron oxide, becomes more difficult due to the formation of iron
silicates or aluminates. For this reason, chemical promoters
such as Cu or Ag are added during catalyst synthesis to increase
the rate of reduction, most likely due to hydrogen spillover
from the Cu surface to the iron oxide surface. Apart from
increasing the rate of reduction, chemical promoters are
known to (i) enhance nucleation of iron intermediates which
leads to higher surface areas, (ii) increase the number/type of
CO adsorption sites, (iii) stabilize selected phases, and (iv)
influence the rate of secondary reactions.45
Addition of alkali metals (e.g., potassium) to LTFT iron oxide
catalyst precursors is known to enhance the chain growth prob-
ability (increased C5þ selectivity), to diminish methane forma-
tion, and inhibit secondary hydrogenation reactions, leading to
higher olefin to paraffin ratios.46 In a similar way, but perhaps
not as effective, alkali earth metals have been shown to increase
alpha values and to suppress methane formation.
7.20.2.3.4 Activation and reduction proceduresIron oxides and (oxy)hydroxides are inactive for FTS and must
be activated to render an active catalyst. Depending on the
application – HTFT or LTFT – and iron oxide precursor, activa-
tion is performed in hydrogen, carbon monoxide, or synthesis
gas. The optimum activation conditions are influenced by the
type and quantity of chemical and structural promoters.
The stability and composition of the final activated iron phase
determine the performance of the catalyst under Fischer–
Tropsch conditions. Because of this, the activation procedure
has a strong effect on selectivity and activity of the catalyst.
For activation in hydrogen, the extent of reduction of iron is
governed by the role of water removed during the activation.
The degree of reduction is governed by the equation47:
DG ¼ DG� þ RT lnpH2O
pH2[4]
where ΔG is the free energy change for the reduction under the
conditions employed, ΔG� is the standard free energy change
for the reduction reaction, R is the gas constant, T is the
temperature, and p is the partial pressure of the gases indicated.
The equation implies that the rate at which water is
removed from the reactor plays a critical role: the faster the
water is removed, the faster the reduction process proceeds,
and the higher the degree of reduction is. Rewriting exp-
ression [4] to include the equilibrium constant in the form of
the ratio (pH2O/pH2)eq at equilibrium, enables one to estimate
the degree of reduction that can be obtained:
DG ¼ nRT lnpH2O
pH2
� ��pH2O
pH2
� �eq
" #[5]
As the equilibrium ratio for reduction from Fe2O3 to FeO is
0.7, and for FeO to a-Fe is 0.1, the theoretical degree of reduc-tion would be 50% at 10% water in the gas phase. Hence, for
high degrees of reduction the water content should be well
below 1%.47,48 Structural promoters such as silica and alumina
increase the resistance against reduction.
To fully understand activation, it is necessary to understand
the possible phase transformations that can occur. x-Ray dif-
fraction (XRD) and Mossbauer spectroscopy are ideal tech-
niques to distinguish between the different iron phases that
can arise, while small particle effects, which so often limit the
information content of XRD, are generally absent in the unsup-
ported iron FT catalysts.49–51 Activation with CO present in the
gas typically leads to a mixture of metallic iron (a-Fe), ironcarbides (general formula FexCy), and magnetite (Fe3O4). The
relative quantities are a function of the reducing gas, the gas
hourly space velocity, and the temperature.
It is generally believed that carbides such as Hagg-carbide
(w-Fe5C2) are the active phase for FTS.52 The exact nature of the
surface carbidic species is still a subject of debate. The stabilities of
different bulk iron carbides have been reported to be in decreas-
ing order: e0-Fe2.2C>e-Fe2C>w-Fe5C2>y-Fe3C.53 Depending on
the type of catalyst (e.g., fused or precipitated), different iron
carbides were found to be characteristic for each type after acti-
vation. However, the possibility that a-Fe plays a role during FTScannot be ignored.21 Typically during activation, precipitated
catalyst precursors, for example, hematite (Fe2O3), are converted
to magnetite (Fe3O4) irrespective of the activation gas used.
However, after this transformation the final iron phase will
depend on the activation gas used, for example, a-Fe in the case
of hydrogen or Hagg-carbide (w-Fe5C2) in the case of CO or
synthesis gas. In a study by Herranz et al., it was found that the
activation of hematite using CO resulted in mainly cementite
(y-Fe3C) while activation in synthesis gas yielded Hagg carbide
(w-Fe5C2) (Table 3).54
Fischer–Tropsch Synthesis: Catalysts and Chemistry 535
The fused magnetite HTFT catalyst is reduced with hydrogen
at temperatures between 350 and 450 �C and high linear flow
rates to avoid re-oxidation by water, as explained above. During
reduction, oxygen atoms are removed from the lattice leading to
an increase in surface area from <1 g m�2 to �5–8 g m�2 55.
The extent of reduction under these conditions was measured at
about 80% (a-Fe). Under CO or synthesis gas, virtually no
reduction of the nonporous magnetite was observed.
In the case of precipitated iron oxide catalyst precursors for
LTFT catalysts, the activation is usually done under muchmilder
conditions than for fused catalysts. These catalysts are more
amorphous with a high pore volume and surface area and the
oxide crystallites can sinter under too harsh activation condi-
tions. It is important to note that the success of activation of
precipitated iron catalyst precursors is coupled to FTS activity,
stability, and selectivity. This is dependent not only on the type
of reduction gas but also on process conditions, for example,
temperature and pressure. From the literature, it seems as
though activation under CO yields the optimally activated pre-
cipitated iron catalyst for FTS synthesis, as these gave the best
syngas conversion and lowest methane selectivity when com-
pared to catalysts activated with H2 or synthesis gas.56 However,
the final catalyst also had a relatively high WGS activity.
7.20.2.4 Selectivity Manipulation of Iron Catalysts
A key advantage of iron-catalyzed FTS is the fact that the
selectivity of the process can be manipulated, either by process
conditions (less responsive) or by catalyst composition (more
responsive). Lowering the temperature shifts the selectivity
Table 3 Names of the various iron phases
a-Fe2O3 Hematitea-FeOOH GoethiteFe3O4 MagnetiteFeO Wustitew-Fe5C2 Hagg carbidey-Fe3C Cementite
0 5
Ln (X
)
Alpha 1(LT FT) = 0.80
LT
HT
Alpha (H
10 15 20 2
Carbon
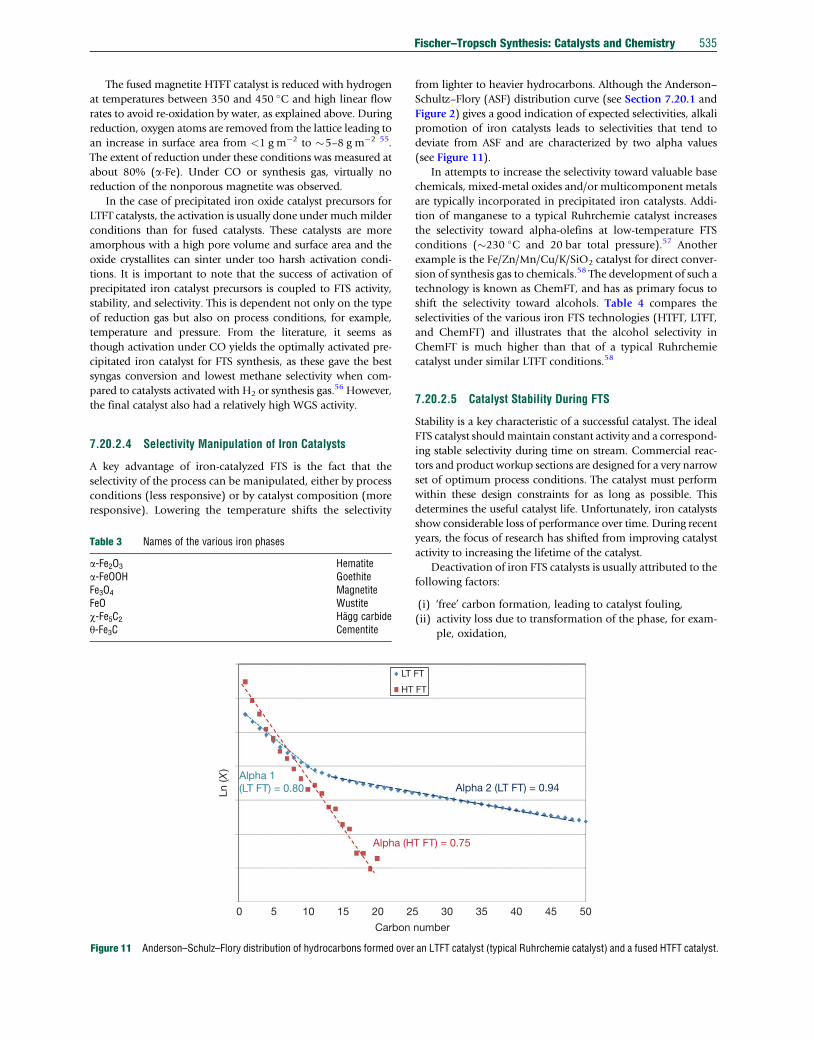
Figure 11 Anderson–Schulz–Flory distribution of hydrocarbons formed over
from lighter to heavier hydrocarbons. Although the Anderson–
Schultz–Flory (ASF) distribution curve (see Section 7.20.1 and
Figure 2) gives a good indication of expected selectivities, alkali
promotion of iron catalysts leads to selectivities that tend to
deviate from ASF and are characterized by two alpha values
(see Figure 11).
In attempts to increase the selectivity toward valuable base
chemicals, mixed-metal oxides and/or multicomponent metals
are typically incorporated in precipitated iron catalysts. Addi-
tion of manganese to a typical Ruhrchemie catalyst increases
the selectivity toward alpha-olefins at low-temperature FTS
conditions (�230 �C and 20 bar total pressure).57 Another
example is the Fe/Zn/Mn/Cu/K/SiO2 catalyst for direct conver-
sion of synthesis gas to chemicals.58 The development of such a
technology is known as ChemFT, and has as primary focus to
shift the selectivity toward alcohols. Table 4 compares the
selectivities of the various iron FTS technologies (HTFT, LTFT,
and ChemFT) and illustrates that the alcohol selectivity in
ChemFT is much higher than that of a typical Ruhrchemie
catalyst under similar LTFT conditions.58
7.20.2.5 Catalyst Stability During FTS
Stability is a key characteristic of a successful catalyst. The ideal
FTS catalyst shouldmaintain constant activity and a correspond-
ing stable selectivity during time on stream. Commercial reac-
tors and product workup sections are designed for a very narrow
set of optimum process conditions. The catalyst must perform
within these design constraints for as long as possible. This
determines the useful catalyst life. Unfortunately, iron catalysts
show considerable loss of performance over time. During recent
years, the focus of research has shifted from improving catalyst
activity to increasing the lifetime of the catalyst.
Deactivation of iron FTS catalysts is usually attributed to the
following factors:
(i) ‘free’ carbon formation, leading to catalyst fouling,
(ii) activity loss due to transformation of the phase, for exam-
ple, oxidation,
Alpha 2 (LT FT) = 0.94
FT
FT
T FT) = 0.75
5
number
30 35 40 45 50
an LTFT catalyst (typical Ruhrchemie catalyst) and a fused HTFT catalyst.
536 Fischer–Tropsch Synthesis: Catalysts and Chemistry
(iii) mechanical break-up of the catalyst,
(iv) deposition of poisons in the synthesis gas on the catalyst’s
surface, and
(v) sintering.
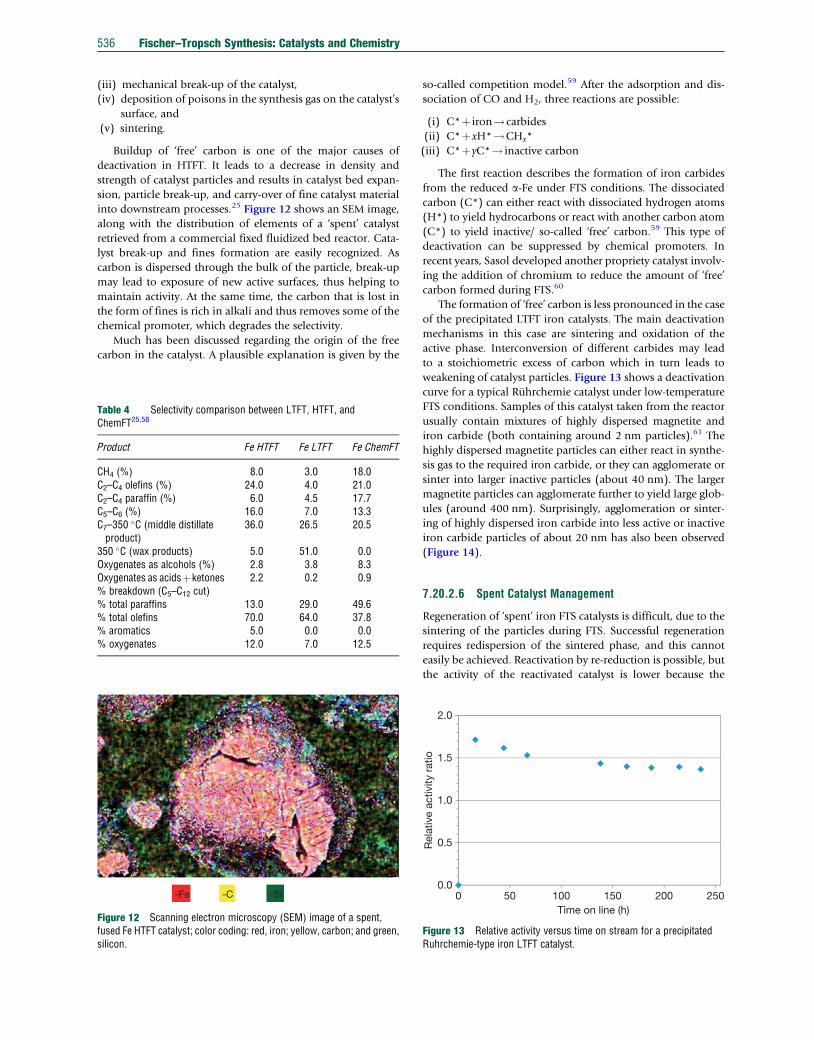
Buildup of ‘free’ carbon is one of the major causes of
deactivation in HTFT. It leads to a decrease in density and
strength of catalyst particles and results in catalyst bed expan-
sion, particle break-up, and carry-over of fine catalyst material
into downstream processes.25 Figure 12 shows an SEM image,
along with the distribution of elements of a ‘spent’ catalyst
retrieved from a commercial fixed fluidized bed reactor. Cata-
lyst break-up and fines formation are easily recognized. As
carbon is dispersed through the bulk of the particle, break-up
may lead to exposure of new active surfaces, thus helping to
maintain activity. At the same time, the carbon that is lost in
the form of fines is rich in alkali and thus removes some of the
chemical promoter, which degrades the selectivity.
Much has been discussed regarding the origin of the free
carbon in the catalyst. A plausible explanation is given by the
Table 4 Selectivity comparison between LTFT, HTFT, andChemFT25,58
Product Fe HTFT Fe LTFT Fe ChemFT
CH4 (%) 8.0 3.0 18.0C2–C4 olefins (%) 24.0 4.0 21.0C2–C4 paraffin (%) 6.0 4.5 17.7C5–C6 (%) 16.0 7.0 13.3C7–350
�C (middle distillateproduct)
36.0 26.5 20.5
350 �C (wax products) 5.0 51.0 0.0Oxygenates as alcohols (%) 2.8 3.8 8.3Oxygenates as acidsþketones 2.2 0.2 0.9% breakdown (C5–C12 cut)% total paraffins 13.0 29.0 49.6% total olefins 70.0 64.0 37.8% aromatics 5.0 0.0 0.0% oxygenates 12.0 7.0 12.5
-Fe -C -Si
Figure 12 Scanning electron microscopy (SEM) image of a spent,fused Fe HTFT catalyst; color coding: red, iron; yellow, carbon; and green,silicon.
so-called competition model.59 After the adsorption and dis-
sociation of CO and H2, three reactions are possible:
(i) C*þ iron!carbides
(ii) C*þxH*!CHx*
(iii) C*þ yC*! inactive carbon
The first reaction describes the formation of iron carbides
from the reduced a-Fe under FTS conditions. The dissociated
carbon (C*) can either react with dissociated hydrogen atoms
(H*) to yield hydrocarbons or react with another carbon atom
(C*) to yield inactive/ so-called ‘free’ carbon.59 This type of
deactivation can be suppressed by chemical promoters. In
recent years, Sasol developed another propriety catalyst involv-
ing the addition of chromium to reduce the amount of ‘free’
carbon formed during FTS.60
The formation of ‘free’ carbon is less pronounced in the case
of the precipitated LTFT iron catalysts. The main deactivation
mechanisms in this case are sintering and oxidation of the
active phase. Interconversion of different carbides may lead
to a stoichiometric excess of carbon which in turn leads to
weakening of catalyst particles. Figure 13 shows a deactivation
curve for a typical Ruhrchemie catalyst under low-temperature
FTS conditions. Samples of this catalyst taken from the reactor
usually contain mixtures of highly dispersed magnetite and
iron carbide (both containing around 2 nm particles).61 The
highly dispersed magnetite particles can either react in synthe-
sis gas to the required iron carbide, or they can agglomerate or
sinter into larger inactive particles (about 40 nm). The larger
magnetite particles can agglomerate further to yield large glob-
ules (around 400 nm). Surprisingly, agglomeration or sinter-
ing of highly dispersed iron carbide into less active or inactive
iron carbide particles of about 20 nm has also been observed
(Figure 14).
7.20.2.6 Spent Catalyst Management
Regeneration of ‘spent’ iron FTS catalysts is difficult, due to the
sintering of the particles during FTS. Successful regeneration
requires redispersion of the sintered phase, and this cannot
easily be achieved. Reactivation by re-reduction is possible, but
the activity of the reactivated catalyst is lower because the
0.0
0.5
1.0
1.5
2.0
0 50 100 150 200 250
Rel
ativ
e ac
tivity
rat
io
Time on line (h)
Figure 13 Relative activity versus time on stream for a precipitatedRuhrchemie-type iron LTFT catalyst.
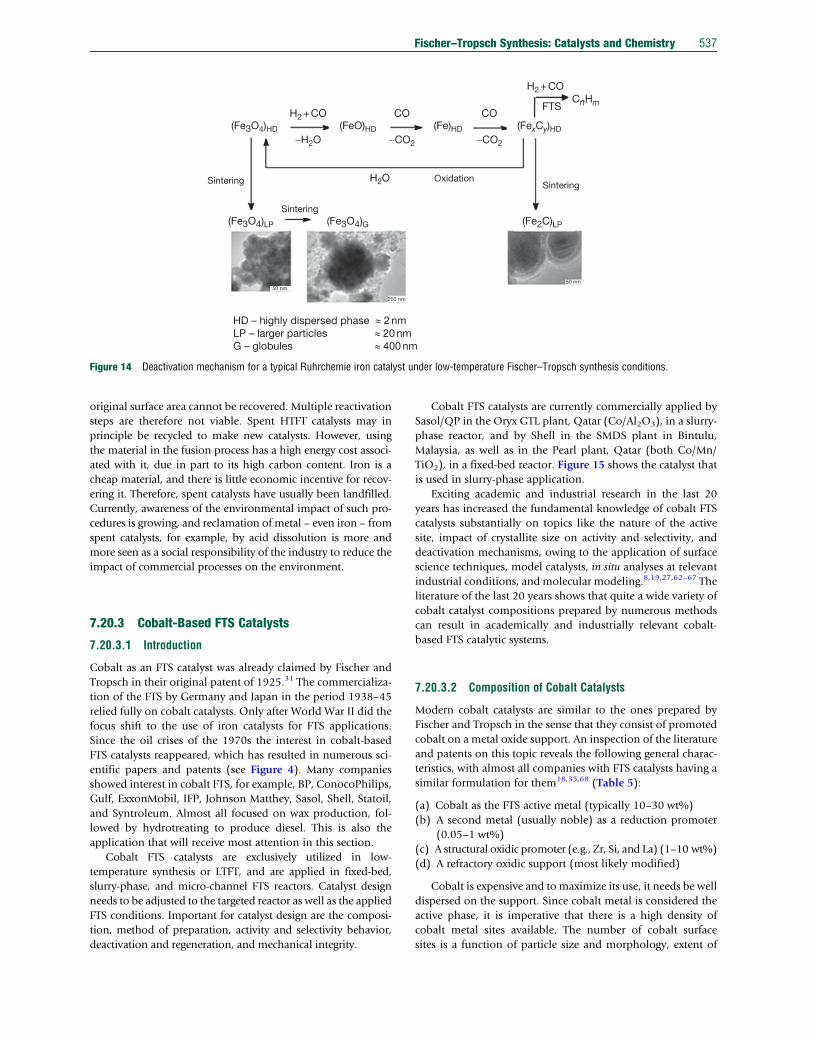
(Fe3O4)HD (FexCy)HD
(Fe2C)LP(Fe3O4)G
HD – highly dispersed phase » 2 nmLP – larger particles » 20 nmG – globules » 400 nm
50 nm
200 nm
50 nm
(Fe3O4)LP
CnHm
(FeO)HD (Fe)HD
H2 + CO
H2 + CO
FTS
-H2O
H2O OxidationSintering
Sintering
Sintering
CO
-CO2
CO
-CO2
Figure 14 Deactivation mechanism for a typical Ruhrchemie iron catalyst under low-temperature Fischer–Tropsch synthesis conditions.
Fischer–Tropsch Synthesis: Catalysts and Chemistry 537
original surface area cannot be recovered. Multiple reactivation
steps are therefore not viable. Spent HTFT catalysts may in
principle be recycled to make new catalysts. However, using
the material in the fusion process has a high energy cost associ-
ated with it, due in part to its high carbon content. Iron is a
cheap material, and there is little economic incentive for recov-
ering it. Therefore, spent catalysts have usually been landfilled.
Currently, awareness of the environmental impact of such pro-
cedures is growing, and reclamation of metal – even iron – from
spent catalysts, for example, by acid dissolution is more and
more seen as a social responsibility of the industry to reduce the
impact of commercial processes on the environment.
7.20.3 Cobalt-Based FTS Catalysts
7.20.3.1 Introduction
Cobalt as an FTS catalyst was already claimed by Fischer and
Tropsch in their original patent of 1925.31 The commercializa-
tion of the FTS by Germany and Japan in the period 1938–45
relied fully on cobalt catalysts. Only after World War II did the
focus shift to the use of iron catalysts for FTS applications.
Since the oil crises of the 1970s the interest in cobalt-based
FTS catalysts reappeared, which has resulted in numerous sci-
entific papers and patents (see Figure 4). Many companies
showed interest in cobalt FTS, for example, BP, ConocoPhilips,
Gulf, ExxonMobil, IFP, Johnson Matthey, Sasol, Shell, Statoil,
and Syntroleum. Almost all focused on wax production, fol-
lowed by hydrotreating to produce diesel. This is also the
application that will receive most attention in this section.
Cobalt FTS catalysts are exclusively utilized in low-
temperature synthesis or LTFT, and are applied in fixed-bed,
slurry-phase, and micro-channel FTS reactors. Catalyst design
needs to be adjusted to the targeted reactor as well as the applied
FTS conditions. Important for catalyst design are the composi-
tion, method of preparation, activity and selectivity behavior,
deactivation and regeneration, and mechanical integrity.
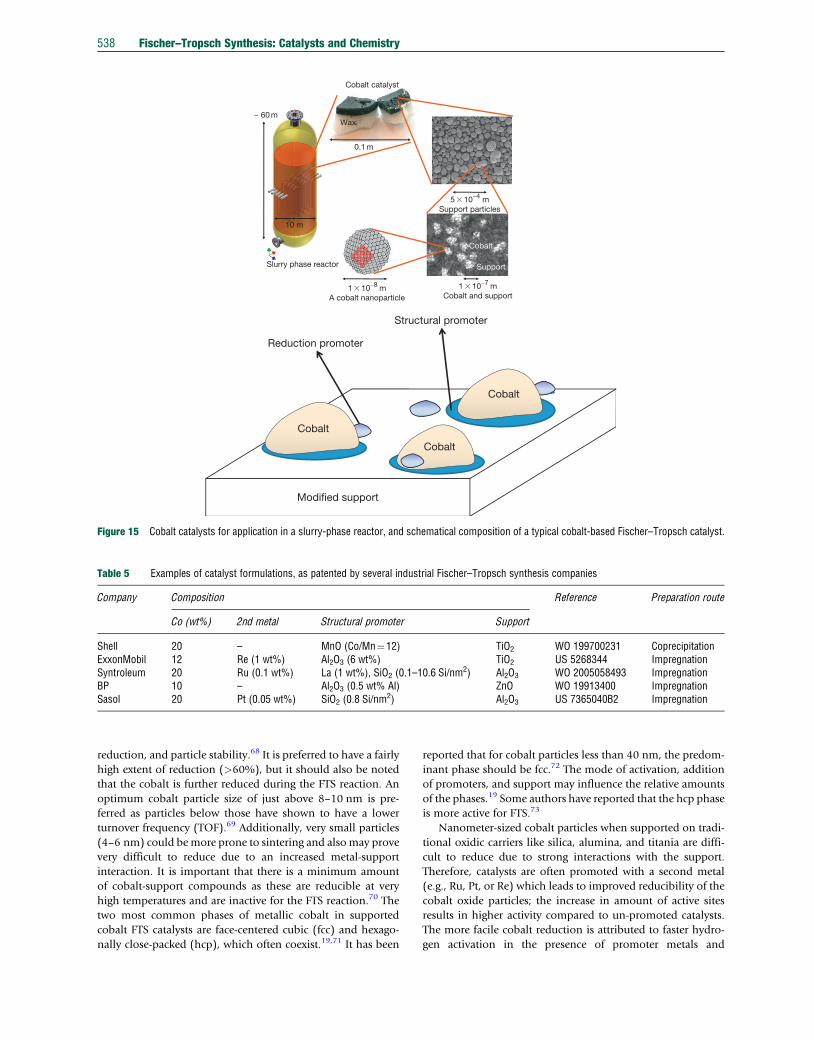
Cobalt FTS catalysts are currently commercially applied by
Sasol/QP in the Oryx GTL plant, Qatar (Co/Al2O3), in a slurry-
phase reactor, and by Shell in the SMDS plant in Bintulu,
Malaysia, as well as in the Pearl plant, Qatar (both Co/Mn/
TiO2), in a fixed-bed reactor. Figure 15 shows the catalyst that
is used in slurry-phase application.
Exciting academic and industrial research in the last 20
years has increased the fundamental knowledge of cobalt FTS
catalysts substantially on topics like the nature of the active
site, impact of crystallite size on activity and selectivity, and
deactivation mechanisms, owing to the application of surface
science techniques, model catalysts, in situ analyses at relevant
industrial conditions, and molecular modeling.8,19,27,62–67 The
literature of the last 20 years shows that quite a wide variety of
cobalt catalyst compositions prepared by numerous methods
can result in academically and industrially relevant cobalt-
based FTS catalytic systems.
7.20.3.2 Composition of Cobalt Catalysts
Modern cobalt catalysts are similar to the ones prepared by
Fischer and Tropsch in the sense that they consist of promoted
cobalt on a metal oxide support. An inspection of the literature
and patents on this topic reveals the following general charac-
teristics, with almost all companies with FTS catalysts having a
similar formulation for them18,35,68 (Table 5):
(a) Cobalt as the FTS active metal (typically 10–30 wt%)
(b) A second metal (usually noble) as a reduction promoter
(0.05–1 wt%)
(c) A structural oxidic promoter (e.g., Zr, Si, and La) (1–10 wt%)
(d) A refractory oxidic support (most likely modified)
Cobalt is expensive and to maximize its use, it needs be well
dispersed on the support. Since cobalt metal is considered the
active phase, it is imperative that there is a high density of
cobalt metal sites available. The number of cobalt surface
sites is a function of particle size and morphology, extent of
Slurry phase reactor
Cobalt catalyst
Wax
10 m
0.1 m
5 � 10-4 mSupport particles
1 � 10-7 mCobalt and support
Support
Cobalt
~ 60 m
1 � 10-8 m
A cobalt nanoparticle
Cobalt
Cobalt
Cobalt
Modified support
Structural promoter
Reduction promoter
Figure 15 Cobalt catalysts for application in a slurry-phase reactor, and schematical composition of a typical cobalt-based Fischer–Tropsch catalyst.
Table 5 Examples of catalyst formulations, as patented by several industrial Fischer–Tropsch synthesis companies
Company Composition Reference Preparation route
Co (wt%) 2nd metal Structural promoter Support
Shell 20 – MnO (Co/Mn¼12) TiO2 WO 199700231 CoprecipitationExxonMobil 12 Re (1 wt%) Al2O3 (6 wt%) TiO2 US 5268344 ImpregnationSyntroleum 20 Ru (0.1 wt%) La (1 wt%), SiO2 (0.1–10.6 Si/nm
2) Al2O3 WO 2005058493 ImpregnationBP 10 – Al2O3 (0.5 wt% Al) ZnO WO 19913400 ImpregnationSasol 20 Pt (0.05 wt%) SiO2 (0.8 Si/nm
2) Al2O3 US 7365040B2 Impregnation
538 Fischer–Tropsch Synthesis: Catalysts and Chemistry
reduction, and particle stability.68 It is preferred to have a fairly
high extent of reduction (>60%), but it should also be noted
that the cobalt is further reduced during the FTS reaction. An
optimum cobalt particle size of just above 8–10 nm is pre-
ferred as particles below those have shown to have a lower
turnover frequency (TOF).69 Additionally, very small particles
(4–6 nm) could bemore prone to sintering and alsomay prove
very difficult to reduce due to an increased metal-support
interaction. It is important that there is a minimum amount
of cobalt-support compounds as these are reducible at very
high temperatures and are inactive for the FTS reaction.70 The
two most common phases of metallic cobalt in supported
cobalt FTS catalysts are face-centered cubic (fcc) and hexago-
nally close-packed (hcp), which often coexist.19,71 It has been
reported that for cobalt particles less than 40 nm, the predom-
inant phase should be fcc.72 The mode of activation, addition
of promoters, and support may influence the relative amounts
of the phases.19 Some authors have reported that the hcp phase
is more active for FTS.73
Nanometer-sized cobalt particles when supported on tradi-
tional oxidic carriers like silica, alumina, and titania are diffi-
cult to reduce due to strong interactions with the support.
Therefore, catalysts are often promoted with a second metal
(e.g., Ru, Pt, or Re) which leads to improved reducibility of the
cobalt oxide particles; the increase in amount of active sites
results in higher activity compared to un-promoted catalysts.
The more facile cobalt reduction is attributed to faster hydro-
gen activation in the presence of promoter metals and
Fischer–Tropsch Synthesis: Catalysts and Chemistry 539
subsequent spillover of hydrogen to cobalt oxides and reduc-
tion of cobalt species.19,68 In many cases, the promotion with
noble metals leads to a smaller average size of either cobalt
oxide or cobalt metal particles. Promotion with noble metal
may also play a role during the decomposition of the cobalt
precursors and can lead to crystallization of smaller cobalt
oxide particles. This increased dispersion is most likely due to
a higher rate of nucleation, enabled by the promoter.68
Promoter metals such as Ru have also been claimed to lead
to the formation of bimetallic particles and alloys. This influ-
ences catalyst activity and selectivity, may inhibit deactivation
by keeping the surface clean, and allows easier regeneration of
the cobalt surface.74 The metal promoter is usually present at
levels of 0.1–0.5 wt%. At these low concentrations reduction is
efficiently promoted, and the hydrocarbon selectivity is hardly
negatively affected.
Structural promoters affect the formation and stability of the
active phase of a catalyst material. For Co/silica catalysts, it has
been shown that promotionwith Zr results in a decreased cobalt–
silica interaction, which in turn leads to a higher degree of cobalt
reduction and increase in the metallic atoms on the surface.19,75
Zr promotion of cobalt/alumina catalysts has been claimed to
prevent formation of cobalt aluminate.76 Incorporation of ele-
ments such as B77 and Ni78 increases the stability of cobalt
catalysts by suppressing carbon formation. Irreducible oxides
such as MnO and CeO2 may also slow down cobalt sintering.63
Awide range of promoters has been studied; the reader is referred
to a detailed review by Morales and Weckhuysen.63
The support provides mechanical strength and thermal sta-
bility to the cobalt crystallites, while facilitating high cobalt
dispersion. The properties of the support are an important
factor. For alumina, high purity, low acidity, and relatively
high surface area (150–250 m2g�1) are required, according to
patents from the 1980s.79–81 More recently, however, alumina-
based supports of relatively low surface area (50 m2 g�1), such
as Ni-promoted a-Al2O3, have been reported to have a positive
effect on both mechanical strength and C5þ selectivity.82 The
pore size of the support can also influence the size of the cobalt
crystallites, as shown by Saib et al. for SiO2-supported
catalysts.83 Van Steen and Claeys reported that the desired
pore size of the support for the optimum cobalt crystallite
size should be around 12–16 nm.61
The support needs to be robust under FTS conditions, imply-
ing that it should be able to cope with the presence of several
bars of steam that occur at high conversion levels. Van Berge
et al. found that an unprotected alumina-supported cobalt FTS
catalyst was susceptible to hydrothermal attack during realistic
FTS conditions, which resulted in contamination of product wax
with ultra-fine, cobalt-rich particulates.23,84,85 This problem was
solved by pre-coating the support with silica as structural pro-
moter. TiO2 seems to be the support of choice for both Exxon
and Shell based on the most recent patents (Table 5). An advan-
tage of TiO2 is that it has a high hydrothermal stability and can
withstand high water partial pressures. The rutile/anatase ratio
can be tailored, which influences the surface area and mechan-
ical properties.
Supported cobalt catalysts should also be resistant to attrition
especially if applied in a slurry bubble-column environment.
Wei et al.86 noted that the attrition resistance of supported cobalt
catalysts follows the sequence: Co/Al2O3>Co/SiO2>Co/TiO2.
There has also been work conducted on less conventional
supports such as MCM-41, SBA-16, and carbon nanofibers,
nanotubes, and spheres.19,69,87 These studies are mainly aca-
demic in nature but further fundamental understanding of
cobalt FTS catalysts considerably. Carbon supports interact
weakly with cobalt and allow for a high degree of cobalt reduc-
tion, thus enabling the study of cobalt particle-size effects.69,87
7.20.3.3 Preparation of Cobalt Fischer–Tropsch Catalysts
The preparation of cobalt FTS catalysts aims to achieve the
optimal crystallite size distribution in a particle that is optimal
for its application in a specific fixed-bed, bubble-column, or
microchannel reactor. As the optimum size range of catalyst
particles for the different reactor types varies (see Figure 3),
preparation methods and equipment depend on the targeted
reactor application. Important considerations for choosing a
particular method of preparation and starting components are
to minimize poisons (e.g., Na, S, Cl) in the catalyst and the
type of waste streams resulting from the chosen method.
A number of procedures for preparing cobalt FT-catalyst
precursor exist:
• coprecipitation of cobalt, promoters, and support, followed
by catalyst particle shaping. In a variation of this method,
the support is added just before particle shaping,
• precipitation or impregnation of cobalt and promoters
onto pre-shaped support particles, and
• impregnation of cobalt (oxide or metal) particles onto pre-
shaped supports.
7.20.3.3.1 PrecipitationMost of the initial FTS-catalysts (e.g., Co/ThO2/kieselguhr)
were made by coprecipitation.88 This method has been applied
for some of the modern cobalt catalysts as well, for example,
for Co/Mn catalysts,89 Co/Mg/SiO2 and Co/ZnO2.90
Catalyst preparation based on coprecipitation usually con-
sists of three steps: precipitation, washing and drying, and
shaping. Selection of chemicals is of course an important con-
sideration in view of the associated waste streams.
Chemical precipitation of the cobalt, promoter, and sup-
port by a precipitation agent can be done batchwise or contin-
uously at constant pH. The cobalt precipitates as a hydroxide,
which can exist as green a-Co(OH)2 or pink b-Co(OH)2 poly-
morphs. The former is metastable and readily transforms into
the stable b-phase. Crystallite size and composition of the
precipitate are controlled by temperature, precipitation agent,
precursor salts, structure directing or organic hydrolysis
reagents, aging time, and reaction atmosphere (air or N2).
Using Na2CO3 or KOH as precipitation agents in the prepara-
tion of Co/SiO2 catalysts would lead to cobalt silicate
formation.91 To prevent formation of the inactive cobalt sili-
cate, the silica is added after the precipitation.
Filtration and washing of the precipitate is required to
remove excess chemicals. Even low levels of alkali metals and
halogens left in the washed precipitate can severely degrade the
catalyst’s performance.
Shaping of the catalyst precursor depends on the reactor
application. For bubble beds, the precipitate is usually reslurried
and spray-dried to obtain the required particle-size distribution.
540 Fischer–Tropsch Synthesis: Catalysts and Chemistry
For fixed-bed reactors, the precipitate is extruded or pelletized.
Addition of acids to the washed and dried precipitate is done to
improve the final catalyst’s particle strength.92
7.20.3.3.2 Preparation methods involving pre-shapedsupportsSupport morphology and characteristics play an important role
in optimizing the preparation of cobalt catalysts on pre-shaped
support particles. As the aim is to get a desired amount of
cobalt crystallites onto the support and maintain a crystallite
size of around 8–10 nm, the following support characteristics
need consideration:
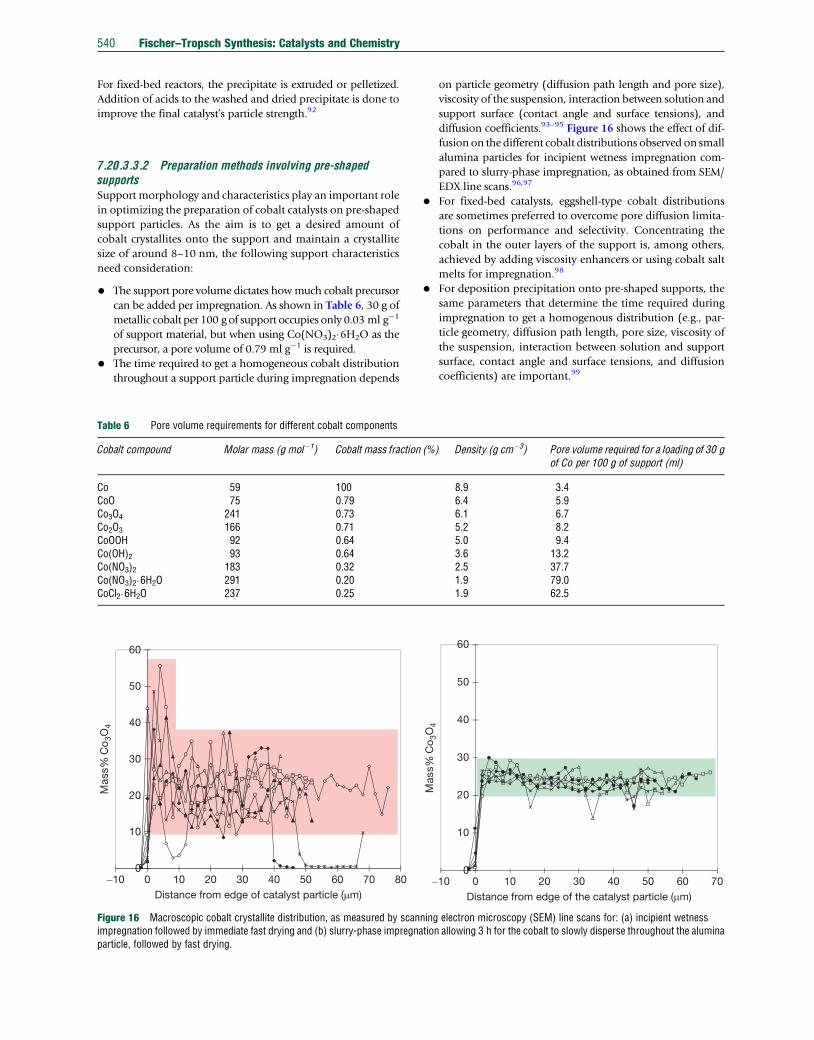
• The support pore volume dictates howmuch cobalt precursor
can be added per impregnation. As shown in Table 6, 30 g of
metallic cobalt per 100 g of support occupies only 0.03 ml g�1
of support material, but when using Co(NO3)2�6H2O as the
precursor, a pore volume of 0.79 ml g�1 is required.
• The time required to get a homogeneous cobalt distribution
throughout a support particle during impregnation depends
0
10
20
30
40
50
60
-10 0 10 20 30 40 50 60 70 80
Mas
s% C
o3O
4
Distance from edge of catalyst particle (mm)
Figure 16 Macroscopic cobalt crystallite distribution, as measured by scanimpregnation followed by immediate fast drying and (b) slurry-phase impregnaparticle, followed by fast drying.
Table 6 Pore volume requirements for different cobalt components
Cobalt compound Molar mass (g mol�1) Cobalt mass fraction
Co 59 100CoO 75 0.79Co3O4 241 0.73Co2O3 166 0.71CoOOH 92 0.64Co(OH)2 93 0.64Co(NO3)2 183 0.32Co(NO3)2�6H2O 291 0.20CoCl2�6H2O 237 0.25
on particle geometry (diffusion path length and pore size),
viscosity of the suspension, interaction between solution and
support surface (contact angle and surface tensions), and
diffusion coefficients.93–95 Figure 16 shows the effect of dif-
fusion on the different cobalt distributions observed on small
alumina particles for incipient wetness impregnation com-
pared to slurry-phase impregnation, as obtained from SEM/
EDX line scans.96,97
• For fixed-bed catalysts, eggshell-type cobalt distributions
are sometimes preferred to overcome pore diffusion limita-
tions on performance and selectivity. Concentrating the
cobalt in the outer layers of the support is, among others,
achieved by adding viscosity enhancers or using cobalt salt
melts for impregnation.98
• For deposition precipitation onto pre-shaped supports, the
same parameters that determine the time required during
impregnation to get a homogenous distribution (e.g., par-
ticle geometry, diffusion path length, pore size, viscosity of
the suspension, interaction between solution and support
surface, contact angle and surface tensions, and diffusion
coefficients) are important.99
0
10
20
30
40
50
60
-10 0 10 20 30 40 50 60 70
Mas
s% C
o3O
4
Distance from edge of the catalyst particle (mm)
ning electron microscopy (SEM) line scans for: (a) incipient wetnesstion allowing 3 h for the cobalt to slowly disperse throughout the alumina
(%) Density (g cm�3) Pore volume required for a loading of 30 gof Co per 100 g of support (ml)
8.9 3.46.4 5.96.1 6.75.2 8.25.0 9.43.6 13.22.5 37.71.9 79.01.9 62.5
Fischer–Tropsch Synthesis: Catalysts and Chemistry 541
• In addition, diffusion differences between the precipitation
agent and cobalt will impact the final cobalt distribution
during precipitation. When depositing bulky cobalt
hydroxide crystallites or cobalt metal particles100 onto pre-
shaped support particles, the important parameters are pore
size, particle diameter, and bulkiness of the precipitate.
• During the drying of the catalyst precursor, the same
parameters as highlighted above for impregnation and
deposition should be taken into account to prevent the
cobalt precursor (if not chemically fixed to the support)
from migrating out of the particle again. In addition, heat
transfer coefficients, evaporation enthalpies, and particle
outer surface area need consideration for optimizing the
drying phase of the cobalt catalyst preparation.
Each preparation method needs to be optimized carefully,
and one cannot assume that the optimum procedures for one
type of support and support particle shape will be the same for
all other supports and support particle shapes.
7.20.3.3.3 CalcinationUsually, drying is not fully accomplished and therefore the first
stages of calcination actually complete the drying phase. To
maintain the cobalt distribution achieved by impregnation or
precipitation during drying and calcination, the cobalt compo-
nent mobility must be hindered. One way of achieving this is
to ensure that the cobalt component stays in a viscous or solid
form. For catalysts obtained by impregnation from cobalt
nitrate solutions, this implies that during calcination the com-
bination of heating rate and air flow must be such that water
and NOx are immediately removed.101 As the mobility of the
cobalt phase can be minimized by fast calcination, heat flow
into the system is also important as both the drying and nitrate
decomposition are endothermic.
Performing calcination under different atmospheres pro-
vides a way to affect the dispersion of the cobalt phase. NO
addition during calcination leads to the formation of a less
mobile cobalt hydroxyl nitrate.102 Using H2 or CO as decom-
positionmedium at temperatures below those where reduction
takes place also gives catalysts with good cobalt dispersions.103
Adding organic additives during impregnation is another
method to influence cobalt nitrate decomposition. Oxidation
of the additive is an exothermic process, which provides heat
for the endothermic nitrate decomposition, and thus acceler-
ates its decomposition.
The transmission electron microscopy (TEM) images in
Figure 17 illustrate how cobalt distributions change when
different calcination conditions are applied.
7.20.3.3.4 ReductionCobalt catalysts are usually reduced in hydrogen or a diluted
hydrogen atmosphere. Examples of CO reductions are also
found, but carbon formation on the cobalt crystallites should
be avoided. Reduction of cobalt oxide to cobalt metal occurs in
two exothermic steps:
Co3O4 þH2 ! 3CoOþH2O [6]
CoOþH2 ! CoþH2O [7]
For optimal reduction, care must be taken to optimize heat
transfer, minimize hydrogen diffusion and mass transfer limi-
tations, and to remove water effectively. The latter benefits
from high hydrogen space velocities and application of low
heating rates.104 Figure 18 shows the impact of the water
partial pressure during reduction of a 30 g Co/0.075 g
Pt/100 g alumina catalyst on the starting FTS performance,
indicating that low water content should be targeted for max-
imum activity, in agreement with the thermodynamics of
reduction as expressed in eqn [5]. Hence, the hydrogen stream
used for reduction must be as dry as possible. For small catalyst
particles as used in slurry-bed reactors, fluidized bed reduction
reactors are preferred and the above requirements are easily
met. For reductions in fixed-bed reactors, more care must be
taken to overcome the limitations especially toward the reduc-
tion reactor outlet.
The maximum temperature required for reduction of cobalt
catalysts depends on the level of reduction promoter present
(Pt, Ru, Pd, etc.), the presence of other promoters (e.g., alkali
metals make reduction more difficult), the support, the sup-
port modifiers, and the catalyst precursor used in the prepara-
tion. Reduction temperatures that are too high can cause
sintering and loss of cobalt metal surface area. In the case of
Co/SiO2 catalysts, cobalt silicate formation has been reported
for temperatures higher than 350 �C.Catalyst performance depends critically on the reduction
procedure.105 Application of reduction–oxidation–reduction
(ROR) cycles has been reported to improve the FTS perfor-
mance of cobalt catalysts by up to 30%.106 Some of the reasons
given in the literature for this improved performance from
ROR treatment are: (1) rougher (more steps on the surface)
cobalt crystallites, (2) higher degree of reduction, and (3) re-
dispersion of the cobalt on the support surface.
7.20.3.4 Cobalt Catalyst Fischer–Tropsch Performance
Both activity and selectivity are of course important parameters
for cobalt-based FTS catalysts. High activity is important for
slurry-phase catalysts, while for fixed-bed catalyst the heat
removal capacity needs to be balanced with the activity of the
catalyst. From a selectivity point of view, a low methane selec-
tivity is normally desired, combined with a high C5þ selectivity
or a high chain growth probability (a). Determining the intrin-
sic catalytic performance of cobalt FTS catalysts is not a
straightforward exercise, as it is influenced by the choice of
reactor and conditions. Khodakov et al.19 summarize a num-
ber of issues and choices related to the testing of FTS catalysts,
for example: (i) reactor choice: fixed-bed, slurry-bed (or con-
tinuous stirred-tank reactor, CSTR), or high-throughput reac-
tors, (ii) hydrodynamics, (iii) heat transfer and hot spots, (iv)
intra particle and external mass-transfer limitations, and (v)
atmospheric or elevated pressure. As testing catalysts under
different FTS conditions (H2/CO ratio, T, and P) will result in
different catalyst performances35,107 and therefore possibly
selection of different catalysts, it is important in the early stages
of research to understand the long-term scaling-up view, with
respect to reactor choice and FTS conditions. Taking the same
cobalt catalyst and testing it in different manners can result in
very different catalytic activity behavior. Figure 19(a) clearly
shows that the FTS activity is influenced by the water partial

0.5 μm
(a) (b)
(c) (d)
0.5 μm
0.5 μm 0.5 μm
Figure 17 Cobalt crystallite distributions as measured with STEM for cobalt alumina catalysts calcined in different manners. (a) Cobalt oxidemicroglobical formation of a 30 g Co/100 g alumina catalysts using a heating rate of 1 �C min�1 and an air space velocity of 1mn
3 per kg Co(NO3)2.6H2Oper hour. (b) Cobalt oxide distribution of a 30 g Co/100 g alumina catalysts using optimized heating rate and air space velocity to ensure optimumcalcination. (c) Cobalt oxide distribution on a 30 g Co/100 g alumina catalysts using carbon coated alumina , using the same heating rate and air flow rateas in (a). (d) Cobalt oxide distribution on 30 g Co/100 g alumina catalysts using the same heating rate and flow rate as (a) but with 1% NO in He ascalcination atmosphere.
542 Fischer–Tropsch Synthesis: Catalysts and Chemistry
pressure applied during the test, which possibly impacts factors
such as sintering and carbon deposition, as well as surface and
active site reconstruction.65 The selectivity behavior of cobalt
catalysts is also strongly influenced by parameters such as
temperature, hydrogen and carbonmonoxide partial pressures,
and conversion. Comparing catalysts tested at different condi-
tions should thus be done with care.
Figure 19(a) clearly shows that cobalt catalysts are more
active in fixed-bed than in slurry-bed reactors. However, cobalt
catalysts in slurry-phase reactors are normally applied at tem-
peratures around 230 �C, while in fixed-bed reactors they are
normally used at temperatures around 210 �C. The productiv-ity per gram of catalyst is therefore higher in slurry-phase
reactors (Figure 19(b)).
For heterogeneous catalysts the activity often increases with
smaller particle size, as the metal surface area increases. This
was confirmed by Iglesia108 who showed that the activity of
cobalt catalysts is directly proportional to the amount of cobalt
metal surface in the catalyst. The TOF or the reaction rate per
unit of cobalt surface area was stable over the range of cobalt
particles that was investigated (9–200 nm). FTS over cobalt
catalysts was therefore regarded to be structure insensitive.
Thereafter, a number of authors have investigated the effect
of cobalt metal particle size on the intrinsic activity of sup-
ported cobalt catalysts for smaller cobalt particles, that is, well
below 10 nm.69,87,109–112 Bian et al.110 using Co/SiO2 con-
firmed Iglesia’s results for samples with cobalt particles
between 11 and 29 nm, but Barbier et al.,109 Bezemer et al.,69
Martinez and Prieto,111 Coville and coworkers87 all showed
that the TOF was stable for catalysts with cobalt particles above
8–10 nm, while it decreased sharply for catalyst with smaller
particles. Only Borg et al.113 reported no sensitivity for the
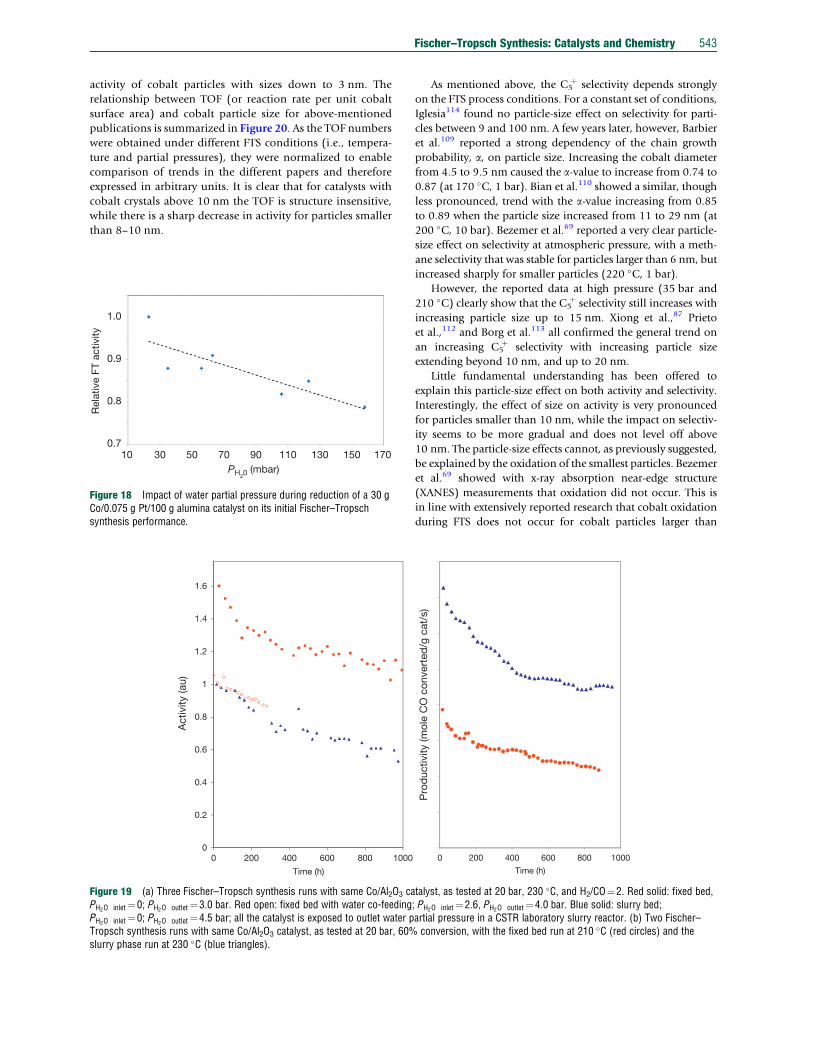
Fischer–Tropsch Synthesis: Catalysts and Chemistry 543
activity of cobalt particles with sizes down to 3 nm. The
relationship between TOF (or reaction rate per unit cobalt
surface area) and cobalt particle size for above-mentioned
publications is summarized in Figure 20. As the TOF numbers
were obtained under different FTS conditions (i.e., tempera-
ture and partial pressures), they were normalized to enable
comparison of trends in the different papers and therefore
expressed in arbitrary units. It is clear that for catalysts with
cobalt crystals above 10 nm the TOF is structure insensitive,
while there is a sharp decrease in activity for particles smaller
than 8–10 nm.
0
0.2
0.4
0.6
0.8
1
1.2
1.4
1.6
0 200 400 600 800 1000
Act
ivity
(au)
Time (h)
Figure 19 (a) Three Fischer–Tropsch synthesis runs with same Co/Al2O3 caPH2O inlet¼0; PH2O outlet¼3.0 bar. Red open: fixed bed with water co-feedingPH2O inlet¼0; PH2O outlet¼4.5 bar; all the catalyst is exposed to outlet water pTropsch synthesis runs with same Co/Al2O3 catalyst, as tested at 20 bar, 60%slurry phase run at 230 �C (blue triangles).
100.7
0.8
0.9
Rel
ativ
e FT
act
ivity
1.0
30 50 70 90PH20
(mbar)110 130 150 170
Figure 18 Impact of water partial pressure during reduction of a 30 gCo/0.075 g Pt/100 g alumina catalyst on its initial Fischer–Tropschsynthesis performance.
As mentioned above, the C5þ selectivity depends strongly
on the FTS process conditions. For a constant set of conditions,
Iglesia114 found no particle-size effect on selectivity for parti-
cles between 9 and 100 nm. A few years later, however, Barbier
et al.109 reported a strong dependency of the chain growth
probability, a, on particle size. Increasing the cobalt diameter
from 4.5 to 9.5 nm caused the a-value to increase from 0.74 to
0.87 (at 170 �C, 1 bar). Bian et al.110 showed a similar, though
less pronounced, trend with the a-value increasing from 0.85
to 0.89 when the particle size increased from 11 to 29 nm (at
200 �C, 10 bar). Bezemer et al.69 reported a very clear particle-
size effect on selectivity at atmospheric pressure, with a meth-
ane selectivity that was stable for particles larger than 6 nm, but
increased sharply for smaller particles (220 �C, 1 bar).
However, the reported data at high pressure (35 bar and
210 �C) clearly show that the C5þ selectivity still increases with
increasing particle size up to 15 nm. Xiong et al.,87 Prieto
et al.,112 and Borg et al.113 all confirmed the general trend on
an increasing C5þ selectivity with increasing particle size
extending beyond 10 nm, and up to 20 nm.
Little fundamental understanding has been offered to
explain this particle-size effect on both activity and selectivity.
Interestingly, the effect of size on activity is very pronounced
for particles smaller than 10 nm, while the impact on selectiv-
ity seems to be more gradual and does not level off above
10 nm. The particle-size effects cannot, as previously suggested,
be explained by the oxidation of the smallest particles. Bezemer
et al.69 showed with x-ray absorption near-edge structure
(XANES) measurements that oxidation did not occur. This is
in line with extensively reported research that cobalt oxidation
during FTS does not occur for cobalt particles larger than
0 200 400 600 800 1000
Pro
duc
tivity
(mol
e C
O c
onve
rted
/g c
at/s
)
Time (h)
talyst, as tested at 20 bar, 230 �C, and H2/CO¼2. Red solid: fixed bed,; PH2O inlet¼2.6, PH2O outlet¼4.0 bar. Blue solid: slurry bed;artial pressure in a CSTR laboratory slurry reactor. (b) Two Fischer–conversion, with the fixed bed run at 210 �C (red circles) and the
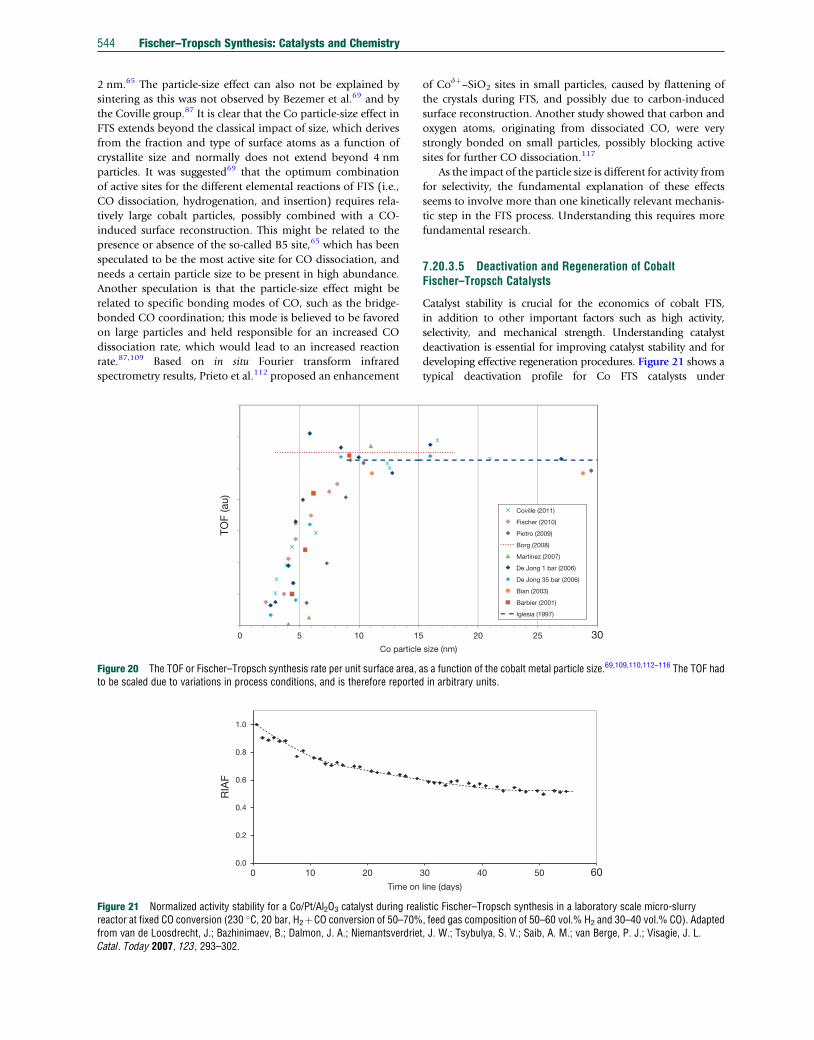
544 Fischer–Tropsch Synthesis: Catalysts and Chemistry
2 nm.65 The particle-size effect can also not be explained by
sintering as this was not observed by Bezemer et al.69 and by
the Coville group.87 It is clear that the Co particle-size effect in
FTS extends beyond the classical impact of size, which derives
from the fraction and type of surface atoms as a function of
crystallite size and normally does not extend beyond 4 nm
particles. It was suggested69 that the optimum combination
of active sites for the different elemental reactions of FTS (i.e.,
CO dissociation, hydrogenation, and insertion) requires rela-
tively large cobalt particles, possibly combined with a CO-
induced surface reconstruction. This might be related to the
presence or absence of the so-called B5 site,65 which has been
speculated to be the most active site for CO dissociation, and
needs a certain particle size to be present in high abundance.
Another speculation is that the particle-size effect might be
related to specific bonding modes of CO, such as the bridge-
bonded CO coordination; this mode is believed to be favored
on large particles and held responsible for an increased CO
dissociation rate, which would lead to an increased reaction
rate.87,109 Based on in situ Fourier transform infrared
spectrometry results, Prieto et al.112 proposed an enhancement
0 5 10 15
TOF
(au)
Co particle
Figure 20 The TOF or Fischer–Tropsch synthesis rate per unit surface area, ato be scaled due to variations in process conditions, and is therefore reported
0.0
0.2
0.4
0.6
0.8
1.0
0 10 20
Time on
RIA
F
Figure 21 Normalized activity stability for a Co/Pt/Al2O3 catalyst during reareactor at fixed CO conversion (230 �C, 20 bar, H2þCO conversion of 50–70%from van de Loosdrecht, J.; Bazhinimaev, B.; Dalmon, J. A.; NiemantsverdrieCatal. Today 2007, 123, 293–302.
of Codþ–SiO2 sites in small particles, caused by flattening of
the crystals during FTS, and possibly due to carbon-induced
surface reconstruction. Another study showed that carbon and
oxygen atoms, originating from dissociated CO, were very
strongly bonded on small particles, possibly blocking active
sites for further CO dissociation.117
As the impact of the particle size is different for activity from
for selectivity, the fundamental explanation of these effects
seems to involve more than one kinetically relevant mechanis-
tic step in the FTS process. Understanding this requires more
fundamental research.
7.20.3.5 Deactivation and Regeneration of CobaltFischer–Tropsch Catalysts
Catalyst stability is crucial for the economics of cobalt FTS,
in addition to other important factors such as high activity,
selectivity, and mechanical strength. Understanding catalyst
deactivation is essential for improving catalyst stability and for
developing effective regeneration procedures. Figure 21 shows a
typical deactivation profile for Co FTS catalysts under
20 25 30 size (nm)
Coville (2011)
Fischer (2010)
Pietro (2009)
Borg (2008)
Martinez (2007)
De Jong 1 bar (2006)
De Jong 35 bar (2006)
Bian (2003)
Barbier (2001)
Iglesia (1997)
s a function of the cobalt metal particle size.69,109,110,112–116 The TOF hadin arbitrary units.
30 40 50 60 line (days)
listic Fischer–Tropsch synthesis in a laboratory scale micro-slurry, feed gas composition of 50–60 vol.% H2 and 30–40 vol.% CO). Adaptedt, J. W.; Tsybulya, S. V.; Saib, A. M.; van Berge, P. J.; Visagie, J. L.
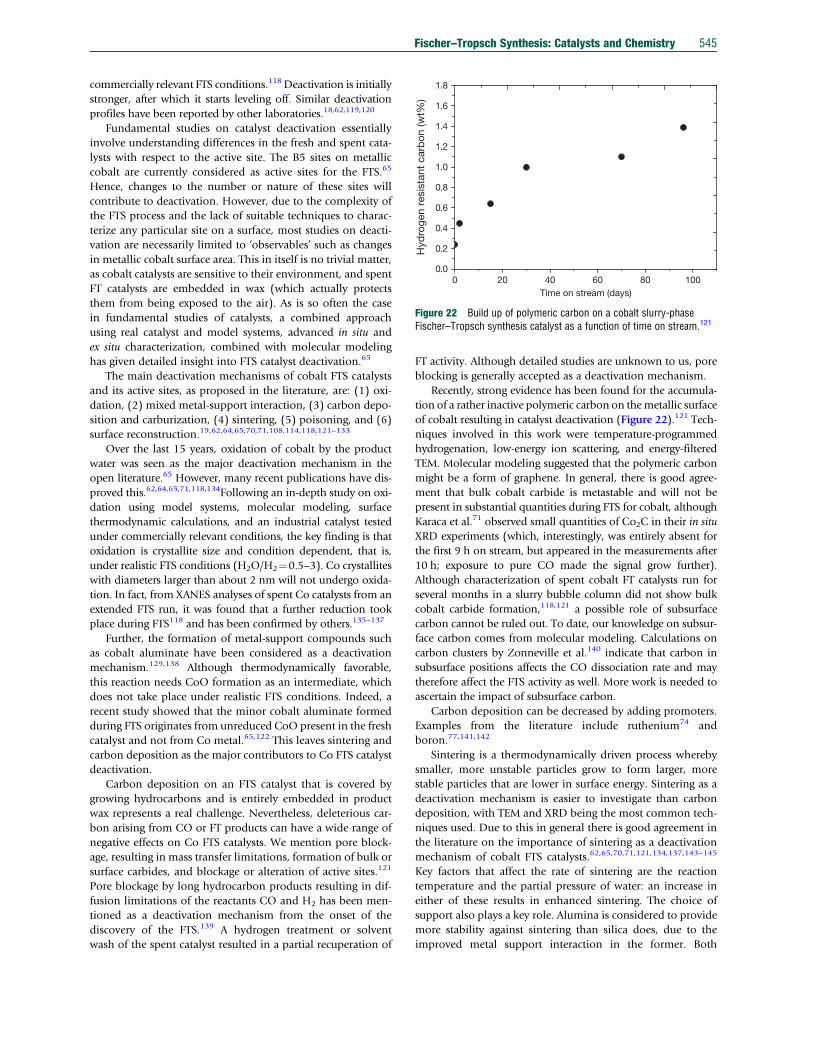
0 20 40 60 80 1000.0
0.2
0.4
0.6
0.8
1.0
1.2
1.4
1.6
1.8
Hyd
roge
n re
sist
ant
carb
on (w
t%)
Time on stream (days)
Figure 22 Build up of polymeric carbon on a cobalt slurry-phaseFischer–Tropsch synthesis catalyst as a function of time on stream.121
Fischer–Tropsch Synthesis: Catalysts and Chemistry 545
commercially relevant FTS conditions.118 Deactivation is initially
stronger, after which it starts leveling off. Similar deactivation
profiles have been reported by other laboratories.18,62,119,120
Fundamental studies on catalyst deactivation essentially
involve understanding differences in the fresh and spent cata-
lysts with respect to the active site. The B5 sites on metallic
cobalt are currently considered as active sites for the FTS.65
Hence, changes to the number or nature of these sites will
contribute to deactivation. However, due to the complexity of
the FTS process and the lack of suitable techniques to charac-
terize any particular site on a surface, most studies on deacti-
vation are necessarily limited to ‘observables’ such as changes
in metallic cobalt surface area. This in itself is no trivial matter,
as cobalt catalysts are sensitive to their environment, and spent
FT catalysts are embedded in wax (which actually protects
them from being exposed to the air). As is so often the case
in fundamental studies of catalysts, a combined approach
using real catalyst and model systems, advanced in situ and
ex situ characterization, combined with molecular modeling
has given detailed insight into FTS catalyst deactivation.65
The main deactivation mechanisms of cobalt FTS catalysts
and its active sites, as proposed in the literature, are: (1) oxi-
dation, (2) mixed metal-support interaction, (3) carbon depo-
sition and carburization, (4) sintering, (5) poisoning, and (6)
surface reconstruction.19,62,64,65,70,71,108,114,118,121–133
Over the last 15 years, oxidation of cobalt by the product
water was seen as the major deactivation mechanism in the
open literature.65 However, many recent publications have dis-
proved this.62,64,65,71,118,134Following an in-depth study on oxi-
dation using model systems, molecular modeling, surface
thermodynamic calculations, and an industrial catalyst tested
under commercially relevant conditions, the key finding is that
oxidation is crystallite size and condition dependent, that is,
under realistic FTS conditions (H2O/H2¼0.5–3). Co crystallites
with diameters larger than about 2 nm will not undergo oxida-
tion. In fact, from XANES analyses of spent Co catalysts from an
extended FTS run, it was found that a further reduction took
place during FTS118 and has been confirmed by others.135–137
Further, the formation of metal-support compounds such
as cobalt aluminate have been considered as a deactivation
mechanism.129,138 Although thermodynamically favorable,
this reaction needs CoO formation as an intermediate, which
does not take place under realistic FTS conditions. Indeed, a
recent study showed that the minor cobalt aluminate formed
during FTS originates from unreduced CoO present in the fresh
catalyst and not from Co metal.65,122 This leaves sintering and
carbon deposition as the major contributors to Co FTS catalyst
deactivation.
Carbon deposition on an FTS catalyst that is covered by
growing hydrocarbons and is entirely embedded in product
wax represents a real challenge. Nevertheless, deleterious car-
bon arising from CO or FT products can have a wide range of
negative effects on Co FTS catalysts. We mention pore block-
age, resulting in mass transfer limitations, formation of bulk or
surface carbides, and blockage or alteration of active sites.121
Pore blockage by long hydrocarbon products resulting in dif-
fusion limitations of the reactants CO and H2 has been men-
tioned as a deactivation mechanism from the onset of the
discovery of the FTS.139 A hydrogen treatment or solvent
wash of the spent catalyst resulted in a partial recuperation of
FT activity. Although detailed studies are unknown to us, pore
blocking is generally accepted as a deactivation mechanism.
Recently, strong evidence has been found for the accumula-
tion of a rather inactive polymeric carbon on themetallic surface
of cobalt resulting in catalyst deactivation (Figure 22).121 Tech-
niques involved in this work were temperature-programmed
hydrogenation, low-energy ion scattering, and energy-filtered
TEM. Molecular modeling suggested that the polymeric carbon
might be a form of graphene. In general, there is good agree-
ment that bulk cobalt carbide is metastable and will not be
present in substantial quantities during FTS for cobalt, although
Karaca et al.71 observed small quantities of Co2C in their in situ
XRD experiments (which, interestingly, was entirely absent for
the first 9 h on stream, but appeared in the measurements after
10 h; exposure to pure CO made the signal grow further).
Although characterization of spent cobalt FT catalysts run for
several months in a slurry bubble column did not show bulk
cobalt carbide formation,118,121 a possible role of subsurface
carbon cannot be ruled out. To date, our knowledge on subsur-
face carbon comes from molecular modeling. Calculations on
carbon clusters by Zonneville et al.140 indicate that carbon in
subsurface positions affects the CO dissociation rate and may
therefore affect the FTS activity as well. More work is needed to
ascertain the impact of subsurface carbon.
Carbon deposition can be decreased by adding promoters.
Examples from the literature include ruthenium74 and
boron.77,141,142
Sintering is a thermodynamically driven process whereby
smaller, more unstable particles grow to form larger, more
stable particles that are lower in surface energy. Sintering as a
deactivation mechanism is easier to investigate than carbon
deposition, with TEM and XRD being the most common tech-
niques used. Due to this in general there is good agreement in
the literature on the importance of sintering as a deactivation
mechanism of cobalt FTS catalysts.62,65,70,71,121,134,137,143–145
Key factors that affect the rate of sintering are the reaction
temperature and the partial pressure of water: an increase in
either of these results in enhanced sintering. The choice of
support also plays a key role. Alumina is considered to provide
more stability against sintering than silica does, due to the
improved metal support interaction in the former. Both
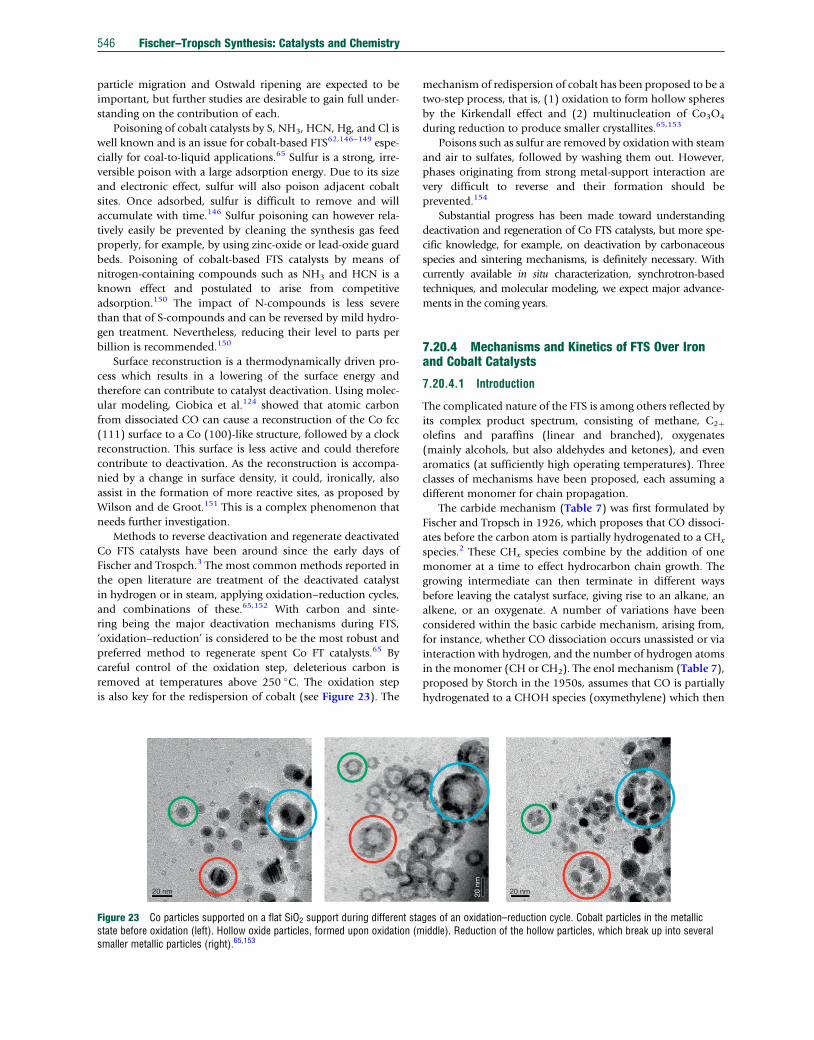
546 Fischer–Tropsch Synthesis: Catalysts and Chemistry
particle migration and Ostwald ripening are expected to be
important, but further studies are desirable to gain full under-
standing on the contribution of each.
Poisoning of cobalt catalysts by S, NH3, HCN, Hg, and Cl is
well known and is an issue for cobalt-based FTS62,146–149 espe-
cially for coal-to-liquid applications.65 Sulfur is a strong, irre-
versible poison with a large adsorption energy. Due to its size
and electronic effect, sulfur will also poison adjacent cobalt
sites. Once adsorbed, sulfur is difficult to remove and will
accumulate with time.146 Sulfur poisoning can however rela-
tively easily be prevented by cleaning the synthesis gas feed
properly, for example, by using zinc-oxide or lead-oxide guard
beds. Poisoning of cobalt-based FTS catalysts by means of
nitrogen-containing compounds such as NH3 and HCN is a
known effect and postulated to arise from competitive
adsorption.150 The impact of N-compounds is less severe
than that of S-compounds and can be reversed by mild hydro-
gen treatment. Nevertheless, reducing their level to parts per
billion is recommended.150
Surface reconstruction is a thermodynamically driven pro-
cess which results in a lowering of the surface energy and
therefore can contribute to catalyst deactivation. Using molec-
ular modeling, Ciobica et al.124 showed that atomic carbon
from dissociated CO can cause a reconstruction of the Co fcc
(111) surface to a Co (100)-like structure, followed by a clock
reconstruction. This surface is less active and could therefore
contribute to deactivation. As the reconstruction is accompa-
nied by a change in surface density, it could, ironically, also
assist in the formation of more reactive sites, as proposed by
Wilson and de Groot.151 This is a complex phenomenon that
needs further investigation.
Methods to reverse deactivation and regenerate deactivated
Co FTS catalysts have been around since the early days of
Fischer and Trospch.3 The most common methods reported in
the open literature are treatment of the deactivated catalyst
in hydrogen or in steam, applying oxidation–reduction cycles,
and combinations of these.65,152 With carbon and sinte-
ring being the major deactivation mechanisms during FTS,
‘oxidation–reduction’ is considered to be the most robust and
preferred method to regenerate spent Co FT catalysts.65 By
careful control of the oxidation step, deleterious carbon is
removed at temperatures above 250 �C. The oxidation step
is also key for the redispersion of cobalt (see Figure 23). The
20 nm
Figure 23 Co particles supported on a flat SiO2 support during different stastate before oxidation (left). Hollow oxide particles, formed upon oxidation (msmaller metallic particles (right).65,153
mechanism of redispersion of cobalt has been proposed to be a
two-step process, that is, (1) oxidation to form hollow spheres
by the Kirkendall effect and (2) multinucleation of Co3O4
during reduction to produce smaller crystallites.65,153
Poisons such as sulfur are removed by oxidation with steam
and air to sulfates, followed by washing them out. However,
phases originating from strong metal-support interaction are
very difficult to reverse and their formation should be
prevented.154
Substantial progress has been made toward understanding
deactivation and regeneration of Co FTS catalysts, but more spe-
cific knowledge, for example, on deactivation by carbonaceous
species and sintering mechanisms, is definitely necessary. With
currently available in situ characterization, synchrotron-based
techniques, and molecular modeling, we expect major advance-
ments in the coming years.
7.20.4 Mechanisms and Kinetics of FTS Over Ironand Cobalt Catalysts
7.20.4.1 Introduction
The complicated nature of the FTS is among others reflected by
its complex product spectrum, consisting of methane, C2þolefins and paraffins (linear and branched), oxygenates
(mainly alcohols, but also aldehydes and ketones), and even
aromatics (at sufficiently high operating temperatures). Three
classes of mechanisms have been proposed, each assuming a
different monomer for chain propagation.
The carbide mechanism (Table 7) was first formulated by
Fischer and Tropsch in 1926, which proposes that CO dissoci-
ates before the carbon atom is partially hydrogenated to a CHx
species.2 These CHx species combine by the addition of one
monomer at a time to effect hydrocarbon chain growth. The
growing intermediate can then terminate in different ways
before leaving the catalyst surface, giving rise to an alkane, an
alkene, or an oxygenate. A number of variations have been
considered within the basic carbide mechanism, arising from,
for instance, whether CO dissociation occurs unassisted or via
interaction with hydrogen, and the number of hydrogen atoms
in the monomer (CH or CH2). The enol mechanism (Table 7),
proposed by Storch in the 1950s, assumes that CO is partially
hydrogenated to a CHOH species (oxymethylene) which then
20 nm20 n
m
ges of an oxidation–reduction cycle. Cobalt particles in the metalliciddle). Reduction of the hollow particles, which break up into several
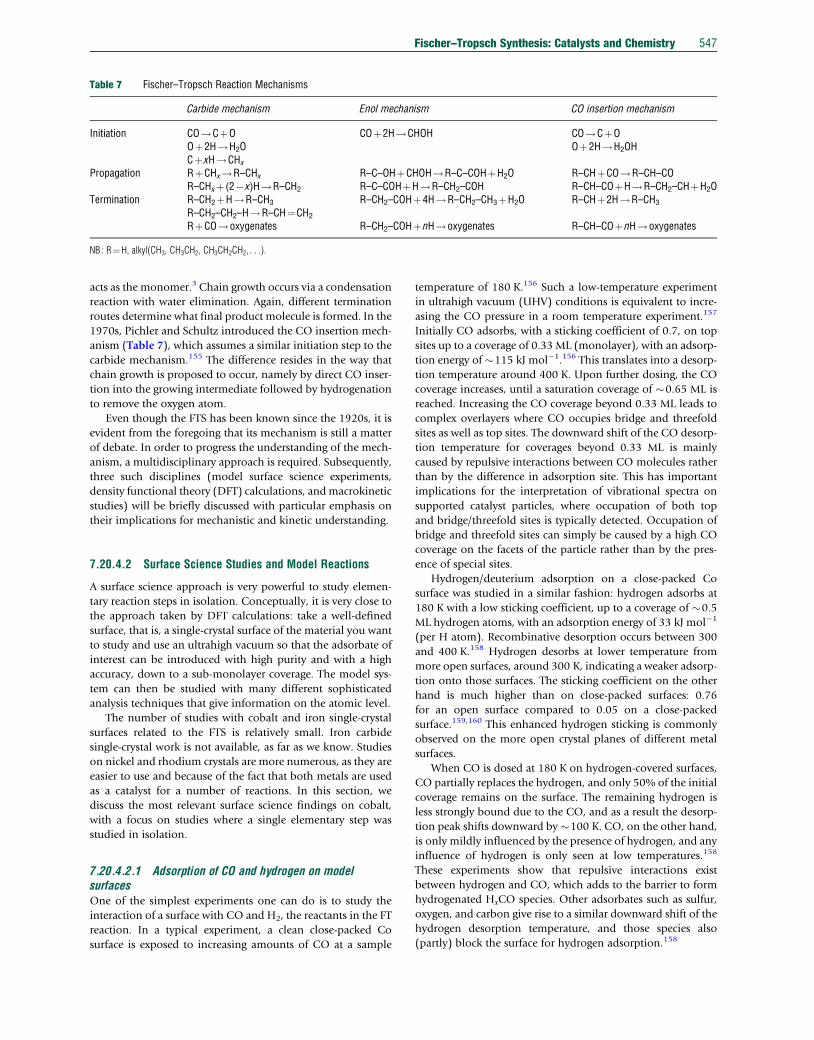
Table 7 Fischer–Tropsch Reaction Mechanisms
Carbide mechanism Enol mechanism CO insertion mechanism
Initiation CO!CþO COþ2H!CHOH CO!CþOOþ2H!H2O Oþ2H!H2OHCþxH!CHx
Propagation RþCHx!R–CHx R–C–OHþCHOH!R–C–COHþH2O R–CHþCO!R–CH–COR–CHxþ (2�x)H!R–CH2 R–C–COHþH!R–CH2–COH R–CH–COþH!R–CH2–CHþH2O
Termination R–CH2þH!R–CH3 R–CH2–COHþ4H!R–CH2–CH3þH2O R–CHþ2H!R–CH3
R–CH2–CH2–H!R–CH¼CH2
RþCO!oxygenates R–CH2–COHþnH!oxygenates R–CH–COþnH!oxygenates
NB : R¼H, alkyl(CH3, CH3CH2, CH3CH2CH2, . . .).
Fischer–Tropsch Synthesis: Catalysts and Chemistry 547
acts as the monomer.3 Chain growth occurs via a condensation
reaction with water elimination. Again, different termination
routes determine what final product molecule is formed. In the
1970s, Pichler and Schultz introduced the CO insertion mech-
anism (Table 7), which assumes a similar initiation step to the
carbide mechanism.155 The difference resides in the way that
chain growth is proposed to occur, namely by direct CO inser-
tion into the growing intermediate followed by hydrogenation
to remove the oxygen atom.
Even though the FTS has been known since the 1920s, it is
evident from the foregoing that its mechanism is still a matter
of debate. In order to progress the understanding of the mech-
anism, a multidisciplinary approach is required. Subsequently,
three such disciplines (model surface science experiments,
density functional theory (DFT) calculations, andmacrokinetic
studies) will be briefly discussed with particular emphasis on
their implications for mechanistic and kinetic understanding.
7.20.4.2 Surface Science Studies and Model Reactions
A surface science approach is very powerful to study elemen-
tary reaction steps in isolation. Conceptually, it is very close to
the approach taken by DFT calculations: take a well-defined
surface, that is, a single-crystal surface of the material you want
to study and use an ultrahigh vacuum so that the adsorbate of
interest can be introduced with high purity and with a high
accuracy, down to a sub-monolayer coverage. The model sys-
tem can then be studied with many different sophisticated
analysis techniques that give information on the atomic level.
The number of studies with cobalt and iron single-crystal
surfaces related to the FTS is relatively small. Iron carbide
single-crystal work is not available, as far as we know. Studies
on nickel and rhodium crystals are more numerous, as they are
easier to use and because of the fact that both metals are used
as a catalyst for a number of reactions. In this section, we
discuss the most relevant surface science findings on cobalt,
with a focus on studies where a single elementary step was
studied in isolation.
7.20.4.2.1 Adsorption of CO and hydrogen on modelsurfacesOne of the simplest experiments one can do is to study the
interaction of a surface with CO and H2, the reactants in the FT
reaction. In a typical experiment, a clean close-packed Co
surface is exposed to increasing amounts of CO at a sample
temperature of 180 K.156 Such a low-temperature experiment
in ultrahigh vacuum (UHV) conditions is equivalent to incre-
asing the CO pressure in a room temperature experiment.157
Initially CO adsorbs, with a sticking coefficient of 0.7, on top
sites up to a coverage of 0.33 ML (monolayer), with an adsorp-
tion energy of �115 kJ mol�1.156 This translates into a desorp-
tion temperature around 400 K. Upon further dosing, the CO
coverage increases, until a saturation coverage of �0.65 ML is
reached. Increasing the CO coverage beyond 0.33 ML leads to
complex overlayers where CO occupies bridge and threefold
sites as well as top sites. The downward shift of the CO desorp-
tion temperature for coverages beyond 0.33 ML is mainly
caused by repulsive interactions between CO molecules rather
than by the difference in adsorption site. This has important
implications for the interpretation of vibrational spectra on
supported catalyst particles, where occupation of both top
and bridge/threefold sites is typically detected. Occupation of
bridge and threefold sites can simply be caused by a high CO
coverage on the facets of the particle rather than by the pres-
ence of special sites.
Hydrogen/deuterium adsorption on a close-packed Co
surface was studied in a similar fashion: hydrogen adsorbs at
180 K with a low sticking coefficient, up to a coverage of �0.5
ML hydrogen atoms, with an adsorption energy of 33 kJ mol�1
(per H atom). Recombinative desorption occurs between 300
and 400 K.158 Hydrogen desorbs at lower temperature from
more open surfaces, around 300 K, indicating a weaker adsorp-
tion onto those surfaces. The sticking coefficient on the other
hand is much higher than on close-packed surfaces: 0.76
for an open surface compared to 0.05 on a close-packed
surface.159,160 This enhanced hydrogen sticking is commonly
observed on the more open crystal planes of different metal
surfaces.
When CO is dosed at 180 K on hydrogen-covered surfaces,
CO partially replaces the hydrogen, and only 50% of the initial
coverage remains on the surface. The remaining hydrogen is
less strongly bound due to the CO, and as a result the desorp-
tion peak shifts downward by �100 K. CO, on the other hand,
is only mildly influenced by the presence of hydrogen, and any
influence of hydrogen is only seen at low temperatures.158
These experiments show that repulsive interactions exist
between hydrogen and CO, which adds to the barrier to form
hydrogenated HxCO species. Other adsorbates such as sulfur,
oxygen, and carbon give rise to a similar downward shift of the
hydrogen desorption temperature, and those species also
(partly) block the surface for hydrogen adsorption.158

548 Fischer–Tropsch Synthesis: Catalysts and Chemistry
7.20.4.2.2 C–O bond scissionA key step in any FT mechanism is the cleavage of the C–O
bond. The close-packed surface of cobalt, Co (0001), is unable
to cleave the CO bond: CO desorbs as a molecule with the CO
bond intact.156 Some open surfaces of cobalt, such as Co
1012� �
161,162 and Co 1120� �
,163 and cobalt foils are capable
of cleaving the CO molecule directly: after a CO thermal
desorption experiment161,162 or a prolonged exposure to CO
at elevated temperature,163 carbon and oxygen are found to be
left on the surface. CO dissociation stops when enough carbon
and oxygen has built up to block all the active sites for disso-
ciation. UHV studies on 2-nm Co particles on alumina show
that CO dissociates during a CO thermal desorption experi-
ment, which can be explained by the high defect density on
such small nanoparticles.164 These studies did not report exact
temperatures or activation barriers for CO dissociation, but in
all cases a typical reaction temperature in the order of 400 K
can be deduced. In short, surface science shows that direct CO
dissociation is possible, but not on the (most abundant) close-
packed surface.
As direct CO dissociation is not possible on the close-packed
surfaces of cobalt, one might consider if the CO molecule is
(partly) hydrogenated before the C–O bond breaks. When CO
and hydrogen are co-adsorbed onto a close-packed surface at
low temperature, the molecules just desorb upon heating, with-
out reaction.158,160 An alternative experimental approach is to
study the decomposition of (partly) hydrogenated CO mole-
cules such as methanol and formaldehyde. Methanol adsorbs as
methoxy (H3CO) when dosed at 165 K. During heating this
methoxy species is stable up to �300 K, after which it decom-
poses to CO and H2.165,166 Experimentally, this is seen as a
single step, indicating that the first dehydrogenation is rate-
limiting. The intermediate species, H2CO and HCO, decompose
534 532
O1shv = 650 eV
O1s, TP-XPShv = 650 eV
O–CH2–CH3
370 K
Oad
250
K30
0K
350
K
250 K
530 528Binding energy (eV)
Pho
to-e
mis
sion
inte
nsity
(a.u
.)
Binding energy532 530 528
Figure 24 Ethanol decomposition on a close-packed cobalt surface, followespectroscopy (XPS). At low temperature, the ethoxy intermediate is found. Dand C2Hx (acetylene) on the surface, showing clear evidence for C–O bond clCiobica, I. M.; Saib, A. M.; Niemantsverdriet, J. W. J. Phys. Chem. Lett. 2010
rapidly and are not observed in significant concentrations on
the surface. This is in line with the finding that formaldehyde
(H2CO) decomposes with 100% selectivity to CO and H2
between 100 and 200 K.160 The experiments show that partially
hydrogenated species such as HCO andH2CO are very unstable,
and the barrier to decompose via dehydrogenation is obviously
much smaller than that of (Hx)C–O bond cleavage. Similar
experiments have been reported on 2-nm cobalt particles sup-
ported on alumina. In those experiments, 60% of the methanol
that was present dehydrogenated, while 40% underwent C–O
bond cleavage.164 In this experiment, it was not clear whether
the C–O bond scissionwas assisted by the presence of hydrogen,
as CO (produced by methanol dehydrogenation in the metha-
nol experiment) also dissociates on those particles in the
absence of hydrogen.
In the CO insertion mechanism (Table 7), a COmolecule is
inserted into a CxHy, after which the C–O bond has to be
cleaved to generate a Cxþ1Hz intermediate that can insert
another CO molecule. In other words, the CO molecule is
chemically modified by insertion of an alkyl group on the
C-end of the molecule. Experiments using ethanol on a close-
packed Co surface gave information about the effect of alkyl
modification on the C–O bond cleavage.166 Figure 24 shows
the result of such an experiment: ethanol adsorbs as an ethoxy
species at 160 K. This ethoxy species decomposes around
350 K, via an acetaldehyde intermediate, with an activation
barrier of �70 kJ mol�1. The products of this dissociation
step are atomic O and a C2Hx species, demonstrating C–O
bond cleavage. This means that alkyl insertion in the CO
molecule facilitates C–O bond scission. For the CO insertion
mechanism, it implies that after the CO is inserted the C–O
bond can be readily broken and a Cxþ1Hy species is formed that
can undergo further chain growth.
C1s, TP-XPShv = 380 eV
C1s (high res.)hv = 321 eV
O–CH2–CH3
250 K
370 K
C2H2
Photo-em
ission intensity (a.u.)
Binding energy (eV)286 285 284 283 287 286 285 284 283 282
d with temperature programmed (TP) synchrotron x-ray photoelectronuring heating ethoxy decomposes around 350 K, yielding atomic oxygeneavage. Adapted from Weststrate, C. J.; Gericke, H. J.; Verhoeven, M.;, 1, 1767–1770.
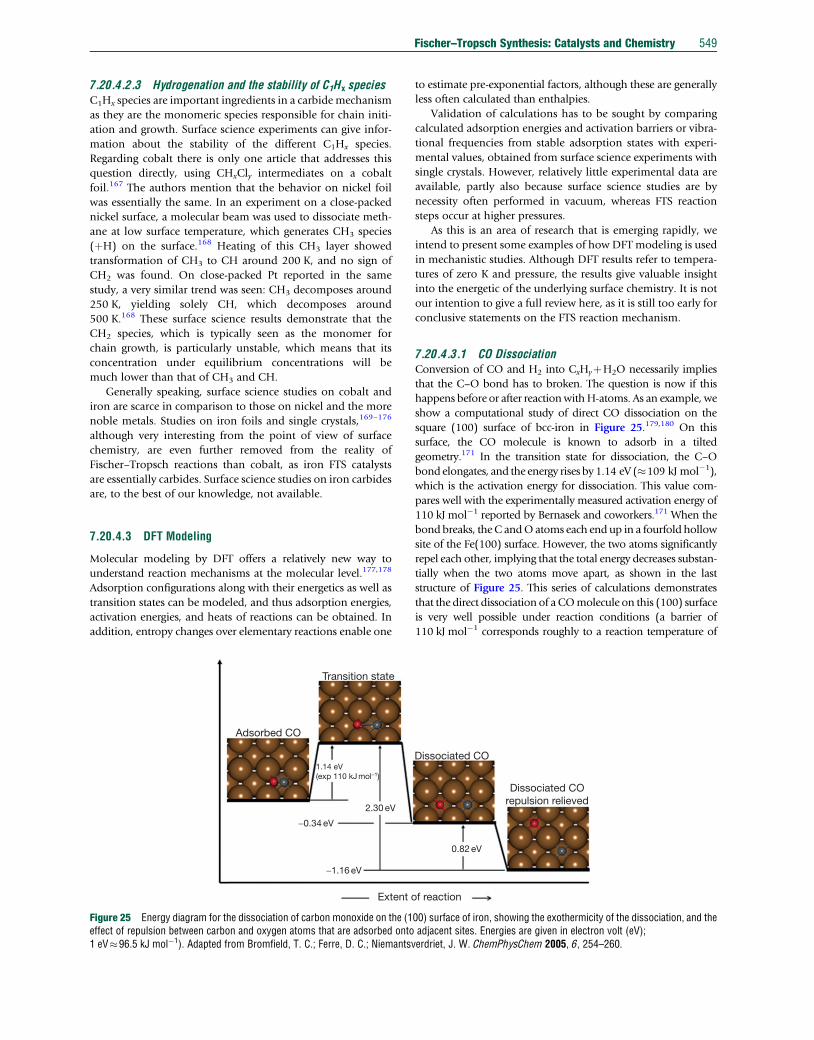
Fischer–Tropsch Synthesis: Catalysts and Chemistry 549
7.20.4.2.3 Hydrogenation and the stability of C1Hx speciesC1Hx species are important ingredients in a carbide mechanism
as they are the monomeric species responsible for chain initi-
ation and growth. Surface science experiments can give infor-
mation about the stability of the different C1Hx species.
Regarding cobalt there is only one article that addresses this
question directly, using CHxCly intermediates on a cobalt
foil.167 The authors mention that the behavior on nickel foil
was essentially the same. In an experiment on a close-packed
nickel surface, a molecular beam was used to dissociate meth-
ane at low surface temperature, which generates CH3 species
(þH) on the surface.168 Heating of this CH3 layer showed
transformation of CH3 to CH around 200 K, and no sign of
CH2 was found. On close-packed Pt reported in the same
study, a very similar trend was seen: CH3 decomposes around
250 K, yielding solely CH, which decomposes around
500 K.168 These surface science results demonstrate that the
CH2 species, which is typically seen as the monomer for
chain growth, is particularly unstable, which means that its
concentration under equilibrium concentrations will be
much lower than that of CH3 and CH.
Generally speaking, surface science studies on cobalt and
iron are scarce in comparison to those on nickel and the more
noble metals. Studies on iron foils and single crystals,169–176
although very interesting from the point of view of surface
chemistry, are even further removed from the reality of
Fischer–Tropsch reactions than cobalt, as iron FTS catalysts
are essentially carbides. Surface science studies on iron carbides
are, to the best of our knowledge, not available.
7.20.4.3 DFT Modeling
Molecular modeling by DFT offers a relatively new way to
understand reaction mechanisms at the molecular level.177,178
Adsorption configurations along with their energetics as well as
transition states can be modeled, and thus adsorption energies,
activation energies, and heats of reactions can be obtained. In
addition, entropy changes over elementary reactions enable one
Adsorbed CO
Extent
1.14 eV(exp 110 kJ mol-1)
-0.34 eV
2.30 eV
-1.16 eV
Transition state
Figure 25 Energy diagram for the dissociation of carbon monoxide on the (1effect of repulsion between carbon and oxygen atoms that are adsorbed onto1 eV�96.5 kJ mol�1). Adapted from Bromfield, T. C.; Ferre, D. C.; Niemants
to estimate pre-exponential factors, although these are generally
less often calculated than enthalpies.
Validation of calculations has to be sought by comparing
calculated adsorption energies and activation barriers or vibra-
tional frequencies from stable adsorption states with experi-
mental values, obtained from surface science experiments with
single crystals. However, relatively little experimental data are
available, partly also because surface science studies are by
necessity often performed in vacuum, whereas FTS reaction
steps occur at higher pressures.
As this is an area of research that is emerging rapidly, we
intend to present some examples of how DFT modeling is used
in mechanistic studies. Although DFT results refer to tempera-
tures of zero K and pressure, the results give valuable insight
into the energetic of the underlying surface chemistry. It is not
our intention to give a full review here, as it is still too early for
conclusive statements on the FTS reaction mechanism.
7.20.4.3.1 CO DissociationConversion of CO and H2 into CxHyþH2O necessarily implies
that the C–O bond has to broken. The question is now if this
happens before or after reactionwithH-atoms. As an example, we
show a computational study of direct CO dissociation on the
square (100) surface of bcc-iron in Figure 25.179,180 On this
surface, the CO molecule is known to adsorb in a tilted
geometry.171 In the transition state for dissociation, the C–O
bond elongates, and the energy rises by 1.14 eV (�109 kJ mol�1),
which is the activation energy for dissociation. This value com-
pares well with the experimentally measured activation energy of
110 kJ mol�1 reported by Bernasek and coworkers.171 When the
bondbreaks, theC andOatoms each end up in a fourfold hollow
site of the Fe(100) surface. However, the two atoms significantly
repel each other, implying that the total energy decreases substan-
tially when the two atoms move apart, as shown in the last
structure of Figure 25. This series of calculations demonstrates
that the direct dissociation of a COmolecule on this (100) surface
is very well possible under reaction conditions (a barrier of
110 kJ mol�1 corresponds roughly to a reaction temperature of
Dissociated CO
Dissociated COrepulsion relieved
of reaction
0.82 eV
00) surface of iron, showing the exothermicity of the dissociation, and theadjacent sites. Energies are given in electron volt (eV);
verdriet, J. W. ChemPhysChem 2005, 6, 254–260.
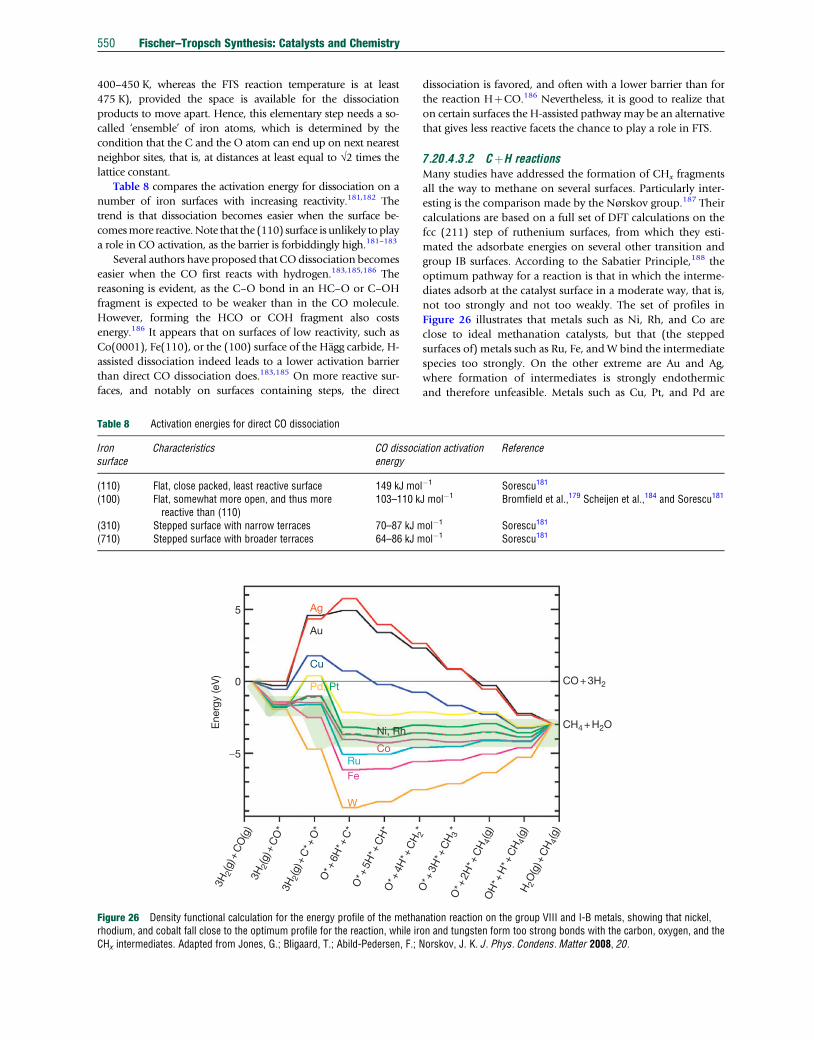
550 Fischer–Tropsch Synthesis: Catalysts and Chemistry
400–450 K, whereas the FTS reaction temperature is at least
475 K), provided the space is available for the dissociation
products to move apart. Hence, this elementary step needs a so-
called ‘ensemble’ of iron atoms, which is determined by the
condition that the C and the O atom can end up on next nearest
neighbor sites, that is, at distances at least equal to √2 times the
lattice constant.
Table 8 compares the activation energy for dissociation on a
number of iron surfaces with increasing reactivity.181,182 The
trend is that dissociation becomes easier when the surface be-
comesmore reactive.Note that the (110) surface is unlikely to play
a role in CO activation, as the barrier is forbiddingly high.181–183
Several authors have proposed that COdissociation becomes
easier when the CO first reacts with hydrogen.183,185,186 The
reasoning is evident, as the C–O bond in an HC–O or C–OH
fragment is expected to be weaker than in the CO molecule.
However, forming the HCO or COH fragment also costs
energy.186 It appears that on surfaces of low reactivity, such as
Co(0001), Fe(110), or the (100) surface of the Hagg carbide, H-
assisted dissociation indeed leads to a lower activation barrier
than direct CO dissociation does.183,185 On more reactive sur-
faces, and notably on surfaces containing steps, the direct
Au
5
3H2(g
) + C
O(g
)3H
2(g
) + C
O*
3H2(g
) + C
* + O
*O
* + 6
H* +
C*
O* +
5H
* + C
H*
O* +
4H
* + C
H
0
-5
Ene
rgy
(eV
)
Ag
Cu
Ni, Rh
CoRuFe
W
Pd, Pt
Figure 26 Density functional calculation for the energy profile of the metharhodium, and cobalt fall close to the optimum profile for the reaction, while irCHx intermediates. Adapted from Jones, G.; Bligaard, T.; Abild-Pedersen, F.; N
Table 8 Activation energies for direct CO dissociation
Ironsurface
Characteristics CO dissocienergy
(110) Flat, close packed, least reactive surface 149 kJ mo(100) Flat, somewhat more open, and thus more
reactive than (110)103–110 k
(310) Stepped surface with narrow terraces 70–87 kJ m(710) Stepped surface with broader terraces 64–86 kJ m
dissociation is favored, and often with a lower barrier than for
the reaction HþCO.186 Nevertheless, it is good to realize that
on certain surfaces the H-assisted pathway may be an alternative
that gives less reactive facets the chance to play a role in FTS.
7.20.4.3.2 CþH reactionsMany studies have addressed the formation of CHx fragments
all the way to methane on several surfaces. Particularly inter-
esting is the comparison made by the Nørskov group.187 Their
calculations are based on a full set of DFT calculations on the
fcc (211) step of ruthenium surfaces, from which they esti-
mated the adsorbate energies on several other transition and
group IB surfaces. According to the Sabatier Principle,188 the
optimum pathway for a reaction is that in which the interme-
diates adsorb at the catalyst surface in a moderate way, that is,
not too strongly and not too weakly. The set of profiles in
Figure 26 illustrates that metals such as Ni, Rh, and Co are
close to ideal methanation catalysts, but that (the stepped
surfaces of) metals such as Ru, Fe, andW bind the intermediate
species too strongly. On the other extreme are Au and Ag,
where formation of intermediates is strongly endothermic
and therefore unfeasible. Metals such as Cu, Pt, and Pd are
CO + 3H2
CH4 + H2O
2*
O* +
3H
* + C
H 3*
O* +
2H
* + C
H 4(g
)O
H* +
H* +
CH 4
(g)
H 2O
(g) +
CH 4
(g)
nation reaction on the group VIII and I-B metals, showing that nickel,on and tungsten form too strong bonds with the carbon, oxygen, and theorskov, J. K. J. Phys. Condens. Matter 2008, 20.
ation activation Reference
l�1 Sorescu181
J mol�1 Bromfield et al.,179 Scheijen et al.,184 and Sorescu181
ol�1 Sorescu181
ol�1 Sorescu181
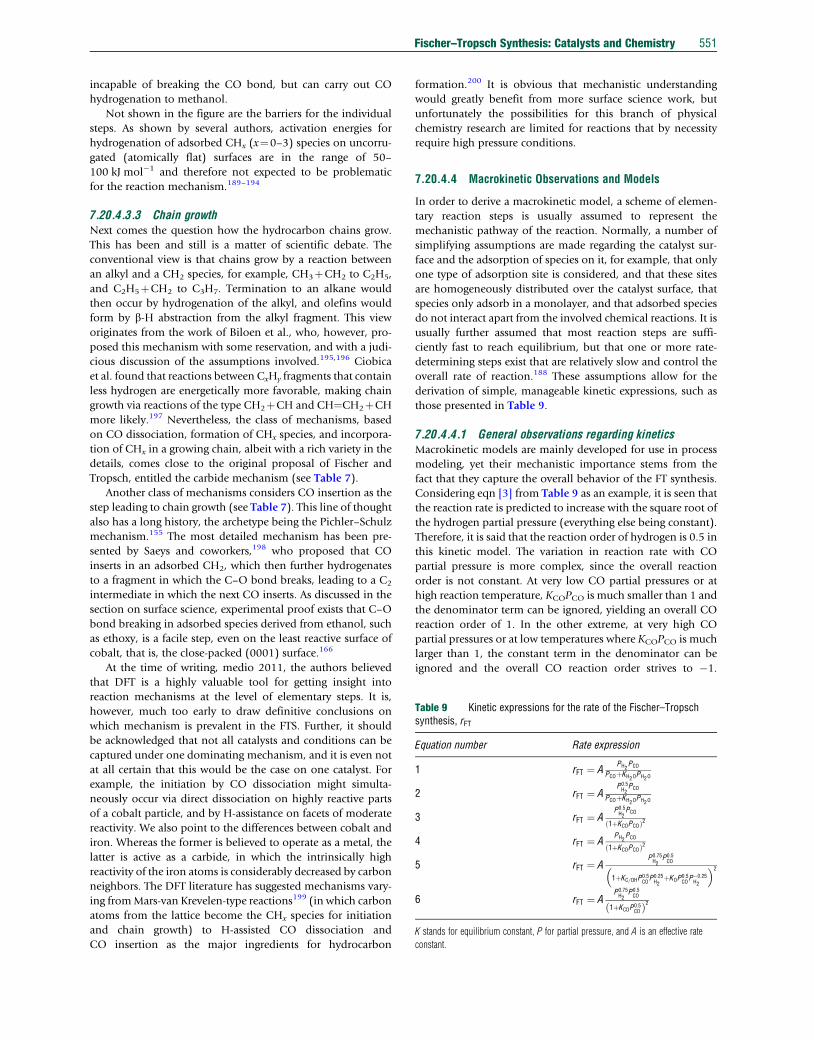
Table 9 Kinetic expressions for the rate of the Fischer–Tropschsynthesis, rFT
Equation number Rate expression
1 rFT ¼ APH2 PCO
PCOþKH2OPH2O
2 rFT ¼ AP0:5H2
PCO
PCOþKH2OPH2O
3 rFT ¼ AP0:5H2
PCO
1þKCOPCOð Þ2
4 rFT ¼ APH2 PCO
1þKCOPCOð Þ2
5 rFT ¼ AP0:75H2
P0:5CO
1þKC=OHP0:5CO
P0:25H2
þKOP0:5CO
P�0:25H2
� �2
6 rFT ¼ AP0:75H2
P0:5CO
1þKCOP0:5COð Þ2
K stands for equilibrium constant, P for partial pressure, and A is an effective rate
constant.
Fischer–Tropsch Synthesis: Catalysts and Chemistry 551
incapable of breaking the CO bond, but can carry out CO
hydrogenation to methanol.
Not shown in the figure are the barriers for the individual
steps. As shown by several authors, activation energies for
hydrogenation of adsorbed CHx (x¼0–3) species on uncorru-
gated (atomically flat) surfaces are in the range of 50–
100 kJ mol�1 and therefore not expected to be problematic
for the reaction mechanism.189–194
7.20.4.3.3 Chain growthNext comes the question how the hydrocarbon chains grow.
This has been and still is a matter of scientific debate. The
conventional view is that chains grow by a reaction between
an alkyl and a CH2 species, for example, CH3þCH2 to C2H5,
and C2H5þCH2 to C3H7. Termination to an alkane would
then occur by hydrogenation of the alkyl, and olefins would
form by b-H abstraction from the alkyl fragment. This view
originates from the work of Biloen et al., who, however, pro-
posed this mechanism with some reservation, and with a judi-
cious discussion of the assumptions involved.195,196 Ciobica
et al. found that reactions between CxHy fragments that contain
less hydrogen are energetically more favorable, making chain
growth via reactions of the type CH2þCH and CH¼CH2þCH
more likely.197 Nevertheless, the class of mechanisms, based
on CO dissociation, formation of CHx species, and incorpora-
tion of CHx in a growing chain, albeit with a rich variety in the
details, comes close to the original proposal of Fischer and
Tropsch, entitled the carbide mechanism (see Table 7).
Another class of mechanisms considers CO insertion as the
step leading to chain growth (see Table 7). This line of thought
also has a long history, the archetype being the Pichler–Schulz
mechanism.155 The most detailed mechanism has been pre-
sented by Saeys and coworkers,198 who proposed that CO
inserts in an adsorbed CH2, which then further hydrogenates
to a fragment in which the C–O bond breaks, leading to a C2
intermediate in which the next CO inserts. As discussed in the
section on surface science, experimental proof exists that C–O
bond breaking in adsorbed species derived from ethanol, such
as ethoxy, is a facile step, even on the least reactive surface of
cobalt, that is, the close-packed (0001) surface.166
At the time of writing, medio 2011, the authors believed
that DFT is a highly valuable tool for getting insight into
reaction mechanisms at the level of elementary steps. It is,
however, much too early to draw definitive conclusions on
which mechanism is prevalent in the FTS. Further, it should
be acknowledged that not all catalysts and conditions can be
captured under one dominating mechanism, and it is even not
at all certain that this would be the case on one catalyst. For
example, the initiation by CO dissociation might simulta-
neously occur via direct dissociation on highly reactive parts
of a cobalt particle, and by H-assistance on facets of moderate
reactivity. We also point to the differences between cobalt and
iron. Whereas the former is believed to operate as a metal, the
latter is active as a carbide, in which the intrinsically high
reactivity of the iron atoms is considerably decreased by carbon
neighbors. The DFT literature has suggested mechanisms vary-
ing fromMars-van Krevelen-type reactions199 (in which carbon
atoms from the lattice become the CHx species for initiation
and chain growth) to H-assisted CO dissociation and
CO insertion as the major ingredients for hydrocarbon
formation.200 It is obvious that mechanistic understanding
would greatly benefit from more surface science work, but
unfortunately the possibilities for this branch of physical
chemistry research are limited for reactions that by necessity
require high pressure conditions.
7.20.4.4 Macrokinetic Observations and Models
In order to derive a macrokinetic model, a scheme of elemen-
tary reaction steps is usually assumed to represent the
mechanistic pathway of the reaction. Normally, a number of
simplifying assumptions are made regarding the catalyst sur-
face and the adsorption of species on it, for example, that only
one type of adsorption site is considered, and that these sites
are homogeneously distributed over the catalyst surface, that
species only adsorb in a monolayer, and that adsorbed species
do not interact apart from the involved chemical reactions. It is
usually further assumed that most reaction steps are suffi-
ciently fast to reach equilibrium, but that one or more rate-
determining steps exist that are relatively slow and control the
overall rate of reaction.188 These assumptions allow for the
derivation of simple, manageable kinetic expressions, such as
those presented in Table 9.
7.20.4.4.1 General observations regarding kineticsMacrokinetic models are mainly developed for use in process
modeling, yet their mechanistic importance stems from the
fact that they capture the overall behavior of the FT synthesis.
Considering eqn [3] from Table 9 as an example, it is seen that
the reaction rate is predicted to increase with the square root of
the hydrogen partial pressure (everything else being constant).
Therefore, it is said that the reaction order of hydrogen is 0.5 in
this kinetic model. The variation in reaction rate with CO
partial pressure is more complex, since the overall reaction
order is not constant. At very low CO partial pressures or at
high reaction temperature, KCOPCO is much smaller than 1 and
the denominator term can be ignored, yielding an overall CO
reaction order of 1. In the other extreme, at very high CO
partial pressures or at low temperatures where KCOPCO is much
larger than 1, the constant term in the denominator can be
ignored and the overall CO reaction order strives to �1.

552 Fischer–Tropsch Synthesis: Catalysts and Chemistry
Similarly, it can be said for eqn [1] that the reaction order in
hydrogen is constant at 1, while the overall reaction order in
CO varies from 0 to 1 as the conversion increases from low to
high values.
There are distinct differences between the chemical reaction
kinetics over iron and cobalt FTS catalysts. The reaction rate
increases roughly linearly with pressure over iron catalysts at
constant temperature and H2/CO ratio,201 but only to an order
of around 0.5 for cobalt catalysts.202 Furthermore, CO has a
strong inhibiting influence over cobalt catalysts to the extent
that it has a significantly negative reaction order under com-
mercially relevant reaction conditions. To the contrary, CO has
a positive effect on the rate over iron catalysts in the normal
operating regime and it has been estimated that CO will only
start to negatively influence the kinetics above a partial pres-
sure of around 11 bar.203
The influence of water on the reaction kinetics has proven
to be a highly controversial topic. Historically, it was firmly
believed that water (and possibly CO2) inhibited the reaction
rate over iron catalysts via competitive adsorption, but more
recently it has been shown that there is no convincing evidence
for this notion.203 The results of water co-feeding studies over
cobalt catalysts have been inconsistent, since some have
reported a positive and some a negative influence of water on
the reaction rate, while others have found no effect at all. At
least for alumina-supported cobalt catalysts, it appears as
though water in the range of 1–6 bar has no significant influ-
ence on the overall rate of CO conversion, but that it does
decrease the methane selectivity.204
7.20.4.4.2 Simple macrokinetic modelsFor the derivation of macrokinetic models, a key question is
whether or not there is a rate-determining step involved in the
formation of the monomer of chain growth. If monomer
formation is relatively facile, then the rate of CO conversion
and the product distribution obtained are intimately linked
and must be modeled together. This typically yields a complex,
implicit type model that requires an advanced numerical rou-
tine to solve. However, in order to keep these models manage-
able, questionable simplifying assumptions are oftenmade, for
example, the assumption by Yang et al.205 that the monomer is
in thermodynamic equilibrium with the gas phase concentra-
tions of CO, H2, and water. Furthermore, such models require
a large number of parameters that are inevitably highly cross-
correlated, implying that it is virtually impossible to accurately
estimate their values. If, however, there is a rate-determining
step in the formation of the monomer, the overall reaction rate
can be decoupled from the product distribution. In such a case,
the overall rate of CO conversion is determined by the CO
hydrogenation reaction (monomer formation), while the
product distribution is determined by the polymerization
part of the FT reaction (i.e., the competition between chain
growth and desorption). The steady state isotopic transient
kinetic analysis study of van Dijk206 has indeed provided
microkinetic support for the notion that there is a rate-
determining step in the formation of the monomer.
The approach followed during FTS kinetic studies by Botes
et al.202,207 has been to consider different reaction schemes and
rate-determining steps in the formation of the monomer to
obtain a variety of explicit rate expressions. A systematic
experimental approach was then followed to eliminate non-
applicable models until ultimately a robust kinetic expression
remained as the preferred rate equation. A further notable
feature of the FTS kinetic studies was to operate the reaction
at a baseline condition, where the catalyst is known to be quite
stable, for most of the run. Changes to other conditions were
only made for short intervals sufficient to allow for hydrody-
namic steady state inside the reactor, but insufficient to effect
changes in the intrinsic catalyst behavior. The importance of
this approach is related to the fact that FT catalysts, especially
those based on iron, readily respond to changes in operating
conditions. It is imperative to avoid reversible and irreversible
changes in the catalyst when chemical reaction kinetics is
studied.
Originally within Sasol, the rate equation [1] in Table 9, by
Anderson201 was used to describe the FTS over iron. Following
a systematic in-house study focusing on the reaction order of
hydrogen, its exponent was later reduced to a value of 0.5,
yielding eqn [2] (Table 9). The most recent study on iron-FT
kinetics has considered the implications of the historic rate
equations, specifically the single order denominator which
implies that hydrogen reacts directly from the gas phase. By
applying a second order denominator to obtain a more appro-
priate Langmuir–Hinshelwood–Hougen–Watson-type equa-
tion where both CO and H2 first absorb onto the surface
before reaction, and also including a constant term in the
denominator to provide for the possibility of vacant sites, it
could in fact be shown that there is no statistical justification
for including a water term in the kinetic model.207 Experiments
were designed to conclusively show that eqn [3] (Table 9) is
more accurate than the foregoing expressions. This study
highlighted the fact that the historic perception regarding the
effect of water on iron-FT kinetics was self-specified by the old
models, but never tested. Furthermore, the CO order of unity is
consistent with a mechanism where CO interacts with a hydro-
gen atom before being dissociated.
The most recent cobalt kinetic study involved the derivation
of several rate equations to cover various reaction schemes of
CO hydrogenation.202 Models assuming hydrogen-assisted CO
dissociation, such as eqn [4] that was originally proposed by
Yates and Satterfield,208 generally described the measured data
poorly and could be eliminated early on in the study. Figure 27
illustrates that eqn [4] underestimates the reaction rate at low
CO partial pressure, but overestimates it at higher CO partial
pressures. Ultimately, after further work to distinguish between
those models where CO first dissociates before it is hydroge-
nated, eqn [5] (Table 9) was the only rate expression that could
not be eliminated. Therefore, it was selected as the most appro-
priate kinetic model. It should be noted that this expression can
be very closely approximated by eqn [6], which contains one
model parameter less and is thus preferably used from a practi-
cal perspective. Figure 27 shows that the preferred equation [6]
does not suffer from the same systematic errors as eqn [4], since
it is reasonably accurate across a range of CO partial pressures.
7.20.4.4.3 Selectivity modelingThe vast number of components in the FT product slate does
not allow for the prediction of individual product selectivities;
consequently, the product spectrum is rather represented by a
product characterization model with a limited number of
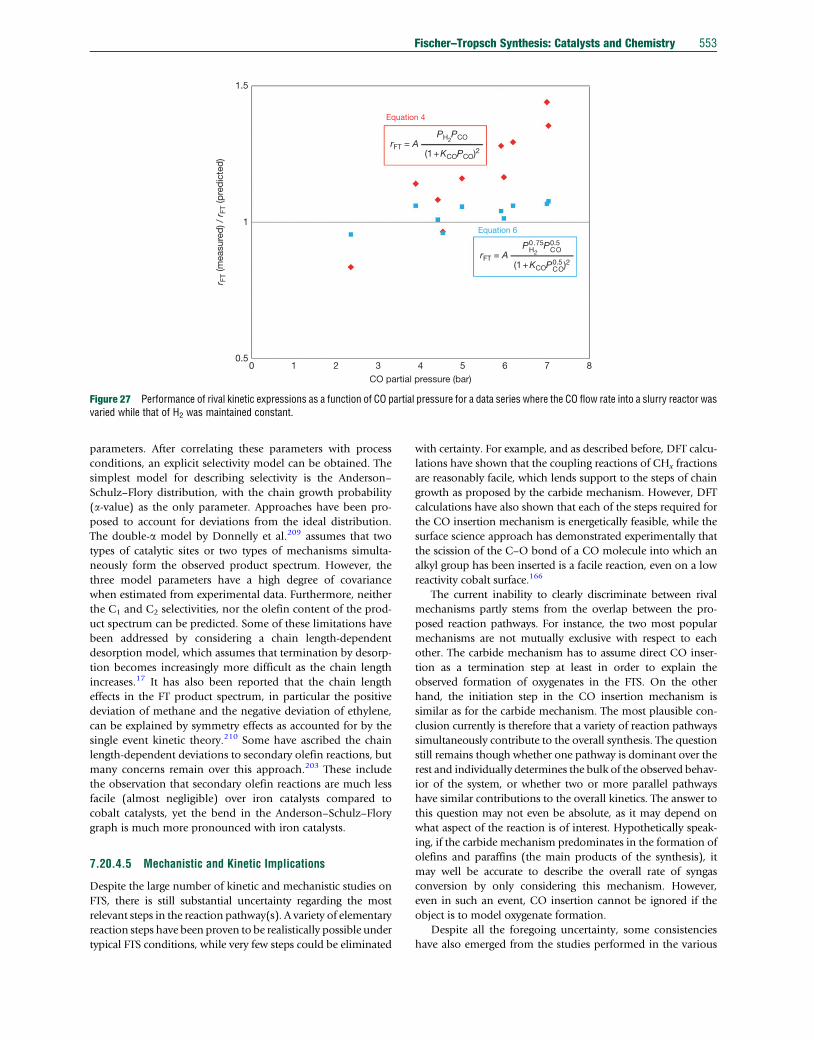
00.5
1r F
T (m
easu
red
) / r
FT (p
red
icte
d)
1.5
Equation 4
Equation 6
PH2PCO
(1 + KCOPCO)2rFT = A
P0H
.2
75PC0.5
O
(1 + KCOPC0.5
O)2rFT = A
1 2 3 4CO partial pressure (bar)
5 6 7 8
Figure 27 Performance of rival kinetic expressions as a function of CO partial pressure for a data series where the CO flow rate into a slurry reactor wasvaried while that of H2 was maintained constant.
Fischer–Tropsch Synthesis: Catalysts and Chemistry 553
parameters. After correlating these parameters with process
conditions, an explicit selectivity model can be obtained. The
simplest model for describing selectivity is the Anderson–
Schulz–Flory distribution, with the chain growth probability
(a-value) as the only parameter. Approaches have been pro-
posed to account for deviations from the ideal distribution.
The double-a model by Donnelly et al.209 assumes that two
types of catalytic sites or two types of mechanisms simulta-
neously form the observed product spectrum. However, the
three model parameters have a high degree of covariance
when estimated from experimental data. Furthermore, neither
the C1 and C2 selectivities, nor the olefin content of the prod-
uct spectrum can be predicted. Some of these limitations have
been addressed by considering a chain length-dependent
desorption model, which assumes that termination by desorp-
tion becomes increasingly more difficult as the chain length
increases.17 It has also been reported that the chain length
effects in the FT product spectrum, in particular the positive
deviation of methane and the negative deviation of ethylene,
can be explained by symmetry effects as accounted for by the
single event kinetic theory.210 Some have ascribed the chain
length-dependent deviations to secondary olefin reactions, but
many concerns remain over this approach.203 These include
the observation that secondary olefin reactions are much less
facile (almost negligible) over iron catalysts compared to
cobalt catalysts, yet the bend in the Anderson–Schulz–Flory
graph is much more pronounced with iron catalysts.
7.20.4.5 Mechanistic and Kinetic Implications
Despite the large number of kinetic and mechanistic studies on
FTS, there is still substantial uncertainty regarding the most
relevant steps in the reaction pathway(s). A variety of elementary
reaction steps have been proven to be realistically possible under
typical FTS conditions, while very few steps could be eliminated
with certainty. For example, and as described before, DFT calcu-
lations have shown that the coupling reactions of CHx fractions
are reasonably facile, which lends support to the steps of chain
growth as proposed by the carbide mechanism. However, DFT
calculations have also shown that each of the steps required for
the CO insertion mechanism is energetically feasible, while the
surface science approach has demonstrated experimentally that
the scission of the C–O bond of a CO molecule into which an
alkyl group has been inserted is a facile reaction, even on a low
reactivity cobalt surface.166
The current inability to clearly discriminate between rival
mechanisms partly stems from the overlap between the pro-
posed reaction pathways. For instance, the two most popular
mechanisms are not mutually exclusive with respect to each
other. The carbide mechanism has to assume direct CO inser-
tion as a termination step at least in order to explain the
observed formation of oxygenates in the FTS. On the other
hand, the initiation step in the CO insertion mechanism is
similar as for the carbide mechanism. The most plausible con-
clusion currently is therefore that a variety of reaction pathways
simultaneously contribute to the overall synthesis. The question
still remains though whether one pathway is dominant over the
rest and individually determines the bulk of the observed behav-
ior of the system, or whether two or more parallel pathways
have similar contributions to the overall kinetics. The answer to
this question may not even be absolute, as it may depend on
what aspect of the reaction is of interest. Hypothetically speak-
ing, if the carbide mechanism predominates in the formation of
olefins and paraffins (the main products of the synthesis), it
may well be accurate to describe the overall rate of syngas
conversion by only considering this mechanism. However,
even in such an event, CO insertion cannot be ignored if the
object is to model oxygenate formation.
Despite all the foregoing uncertainty, some consistencies
have also emerged from the studies performed in the various

554 Fischer–Tropsch Synthesis: Catalysts and Chemistry
disciplines. For example, the results of DFT calculations suggest
that unassisted CO dissociation readily occurs on the more
open (high reactivity) metal surfaces, while hydrogen-assisted
CO dissociation would be required on the close packed (low
reactivity) surfaces.179,181,183,185,186 As described in the section
on surface science above, unassisted CO dissociation is not
easy on close packed surfaces, while it is facile over open
surfaces. It has further been found that HxCO species are
more inclined to dehydrogenate than to undergo C–O bond
cleavage on cobalt surfaces. During a macrokinetic study on an
actual cobalt-FT catalyst, models assuming hydrogen-assisted
CO dissociation failed comprehensively, while the preferred
model based on unassisted CO dissociation could describe the
experimental data over a range of commercially relevant con-
ditions. Together all these findings suggest that, in the case of
the cobalt-based FT synthesis, the main pathway in the conver-
sion of CO to a CHx species proceeds via unassisted cleavage of
the C–O bond.
To the contrary, it is known that the carbiding of iron cata-
lysts substantially decreases the reactivity of iron surfaces. There-
fore, one may well expect hydrogen-assisted CO dissociation to
predominate over iron-FT catalysts,199 which are in the carbided
state under actual synthesis conditions. The most preferred
macrokinetic model for iron is indeed consistent with a CO
dissociation step that occurs via interaction with hydrogen.
A further consistency that is steadily emerging relates to the
most likely nature of the species responsible for chain propaga-
tion in terms of the carbide mechanism. Originally, it was
believed (not necessarily based on strong evidence) that these
species are quite saturated with hydrogen, that is, that the grow-
ing intermediate is a CH3–CH2� � �CH2 species, while the mono-
mer being added is a CH2 species.195 DFT calculations have
shown that reactions between intermediates that are leaner in
hydrogen (e.g., CH¼CH2 and CH) are energetically more favor-
able than reactions between more hydrogen-saturated
species.197 In line with this, it has been found during surface
science experiments the coupling of two CH species to from
acetylene is facile over nickel catalysts.168,211Further support is
provided by the steady state isotopic transient kinetic analysis
(SSITKA) study of Govender,212 who concluded from H–D
switching experiments that the C2H species is the only abundant
C2 intermediate on the fully carbided, working iron-FT catalyst
surface. Therefore, even though the carbide mechanism as a
whole cannot be discarded as a prominent reaction pathway
for the FTS, it seems unlikely that it proceeds in the form that
was originally proposed. This has particular significance for the
termination toward olefins, since it implies that a hydrogen
abstraction is not required (possibly even a hydrogen addition).
7.20.5 Conclusion
The FTS represents proven technology, which has secured its
position in modern energy technology. Originally used to
convert coal into liquid fuels, nowadays the emphasis is on
monetizing natural gas, by converting it to diesel fuel, waxes,
and naphtha. It is expected that some 500000 barrels of fuel
per day will be produced using Fischer–Tropsch technology by
2013. Although small in comparison to the 85 million barrels
of crude oil that are produced daily, the 0.5 million daily
barrels of synfuels is undoubtedly significant, particularly
locally where the production takes place.
The technology has much potential for wider use, for exam-
ple, in emerging economies, or at a smaller scale in the utili-
zation of biomass. Interesting applications of FTS have been
proposed for conversion of remote natural gas at off-shore oil
production locations.
Both GTL and BTL can be important tools in strategies
aimed at reduction of CO2 emissions. CTL technology is clearly
disadvantaged here, and will in the future have to be combined
with CO2 sequestration technology. The rapid increase in dis-
coveries of shale gas (in, for example, USA and Canada) can
also provide the GTL industry with a significant boost.
Although proven technology, FTS continues to pose chal-
lenges from an industrial perspective. Stability improvement of
the catalysts is an important aspect, but also selectivity
improvement would be very advantageous. Economically one
would like to have the highest possible C5þ and the lowest
possible CH4 selectivity, because recycling of CH4 means that
the carbon atoms involved have to go through the expensive
syngas generation more than once, with the associated effi-
ciency losses. Syngas production is the most expensive part of
a GTL plant; it accounts for 40–60% of the capital investments.
Increased research efforts on reducing the costs of syngas pro-
duction will make XTL projects even more viable. Although
new XTL facilities require large capital investments and are
dependent on the price ratio of crude oil to natural gas, in
the long term they are expected to be economically successful.
From a more academic perspective, understanding the
mechanism of the FTS has been and will be a challenge. It is
more and more realized that mechanisms may differ with
conditions and catalysts. It is highly unlikely that one unique
mechanism can account for all different forms of FTS. Molec-
ular modeling represents a very important tool for getting
mechanistic insight, but the problem is that experimental val-
idation of its predictions at the level of elementary steps is very
difficult to achieve, as the opportunities for relevant surface
science experiments are limited. Mechanistic studies aimed at
describing FTS selectivity from first principles are in their
infancy and have a long way to go before accurate predictions
can be expected.
Describing the physical/chemical state of the catalysts
under reaction conditions is another field where significant
progress has been booked, but major advances would still be
very welcome. The advent of in situ imaging tools in combina-
tion with realistic catalysts,213 as well as the use of planar
model catalysts in simulated environments,153 has proven
promising and will almost certainly lead to improved insight
in the relation between catalyst properties on the nanoscale
and performance in the reaction.
The FTS is therefore expected to remain an inspiring source
of industrial and academic research for many years to come.
For a related chapter in this Comprehensive, we refer to
Chapter 7.01
References
1. Fischer, F.; Tropsch, H. Brennst. Chem. 1923, 4, 276–285.2. Fischer, F.; Tropsch, H. Brennst. Chem. 1926, 7, 97–104.
Fischer–Tropsch Synthesis: Catalysts and Chemistry 555
3. Storch, H.; Golumbic, N.; Anderson, R. B. The Fischer–Tropsch and RelatedSyntheses. Wiley: New York, 1951.
4. van der Laan, G. P.; Beenackers, A. A. C. M. Catal. Rev. 1999, 41, 255–318.5. Kolbel, H.; Ralek, M. Catal. Rev. 1980, 21, 225–274.6. Dry, M. E.; Hoogendoorn, J. C. Catal. Rev. 1981, 23, 265–278.7. Roferdepoorter, C. K. Chem. Rev. 1981, 81, 447–474.8. Iglesia, E., Reyes, S. C., Madon, R. J., Soled, S. L., Eds.; Advances in Catalysis;
1993; Vol. 39, pp 221–302.9. Steynberg, A. P.; Dry, M. E. Fischer–Tropsch Technology; Elsevier: Amsterdam,
2004; Vol. 152.10. Rostrup-Nielsen, J. R., Sehested, J., Norskov, J. K., Eds.; Advances in Catalysis;
2002; Vol. 47, pp 65–139.11. Dancuart, L. P.; de Haan, R.; de Klerk, A. In Studies in Surface Science and
Catalysis; Steynberg, A. P., Dry, M. E., Eds.; 152, Elsevier, 2004; pp 482–532.12. De Klerk, A. Fischer–Tropsch Refining. Wiley-VCH: Weinheim, 2011.13. Claeys, M.; van Steen, E. Fischer–Tropsch Technology; Elsevier: Amsterdam,
2004; Vol. 152.14. Schulz, H.; Vansteen, E.; Claeys, M. In Natural Gas Conversion II 1994; Vol. 81,
pp 455–460.15. Claeys, M.; Van Steen, E. In Fischer–Tropsch Technology; Studies in Surface
Science: An Catalysis; Steynberg, A. P., Dry, M. E., Eds.; Elsevier: Amsterdam,2004; Vol. 152, Chapter 8.
16. Botes, F. G.; Govender, N. S. Energy Fuel 2007, 21, 3095–3101.17. Botes, F. G. Energy Fuel 2007, 21, 1379–1389.18. Davis, B. H. Ind. Eng. Chem. Res. 2007, 46, 8938–8945.19. Khodakov, A. Y.; Chu, W.; Fongarland, P. Chem. Rev. 2007, 107, 1692–1744.20. Dry, M. E. Catal. Lett. 1991, 7, 241–251.21. de Smit, E.; Weckhuysen, B. M. Chem. Soc. Rev. 2008, 37, 2758–2781.22. Steynberg, A. P.; Dry, M. E.; Davis, M. E.; Davis, B. H.; Breman, B. B. Stud. Surf.
Sci. Catal. 2004, 152, 64–195.23. Van Berge, P. J.; Van De Loosdrecht, J.; Caricato, E. A.; Barradas, S. Process for
Producing Hydrocarbons from a Synthesis Gas, and Catalysts Therefore. PatentWO 9942214A1, 1999.
24. Davis, B. H. Catal. Today 2002, 71, 249–300.25. Steynberg, A. P.; Espinoza, R. L.; Jager, B.; Vosloo, A. C. Appl. Catal. A: Gen.
1999, 186, 41–54.26. Espinoza, R. L.; Steynberg, A. P.; Jager, B.; Vosloo, A. C. Appl. Catal. A: Gen.
1999, 186, 13–26.27. Geerlings, J. J. C.; Wilson, J. H.; Kramer, G. J.; Kuipers, H.; Hoek, A.;
Huisman, H. M. Appl. Catal. A: Gen. 1999, 186, 27–40.28. Deshmukh, S. R.; Tonkovich, A. L. Y.; McDaniel, J. S.; Schrader, L. D.;
Burton, C. D.; Jarosch, K. T.; Simpson, A. M.; Kilanowski, D. R.; LeViness, S.Biofuels 2011, 2, 315–324.
29. Visconti, C. G.; Tronconi, E.; Lietti, L.; Groppi, G.; Forzatti, P.; Cristiani, C.;Zennaro, R.; Rossini, S. Appl. Catal. A: Gen. 2009, 370, 93–101.
30. Sabatier, P.; Senderens, J. B. Hebd. Seances Acad. Sci. 1902, 134, 514.31. Fischer, F.; Tropsch, H. Patent DE 484 337, 1925.32. Liu, Z.; Shi, S.; Li, Y. Chem. Eng. Sci. 2010, 65, 12–17.33. Dry, M. E. Catal. Today 2002, 71, 227–241.34. Sie, S. T. Rev. Chem. Eng. 1998, 14, 109–157.35. Oukaci, R.; Singleton, A. H.; Goodwin, J. G. Appl. Catal. A: Gen. 1999, 186,
129–144.36. Sasol Financial Report July–December 2010. http://www.sasol.com.37. Brown, A. Pearl GTL Presentation, XTL Summit, June 2011.38. Steynberg, A. P. In Studies in Surface Science and Catalysis; Steynberg, A. P.,
Dry, M. E., Eds.; 152, Elsevier: Amsterdam, 2004; pp 1–63.39. Penning, R. In New Developments in Synthetic Fuels, CTL/GTL Conference 2010,
Brisbane, Australia.40. Davis, B. H. Catal. Today 2003, 84, 83–98.41. Schwertmann, U.; Cornell, R. M. Iron Oxides in the Laboratory, Preparation and
Characterization. Wiley-VCH: Weinheim, 2000.42. Smith, D. F.; Hawk, C. O.; Golden, P. L. J. Am. Chem. Soc. 1930, 52,
3221–3232.43. Bromfield, T. C.; Botes, F. G.; Visagie, R.; Espinoza, R.; Gibson, P.; Van Lawson,
K. H. Hydrocarbon Synthesis Catalyst and Process. US Patent 6844370, 2002.44. Hayakawa, H.; Tanaka, H.; Fujimoto, K. Appl. Catal. A: Gen. 2006, 310,
24–30.45. O’Brien, R. J.; Xu, L. G.; Spicer, R. L.; Bao, S. Q.; Milburn, D. R.; Davis, B. H.
Catal. Today 1997, 36, 325–334.46. Luo, M. S.; O’Brien, R. J.; Bao, S. Q.; Davis, B. H. Appl. Catal. A: Gen. 2003, 239,
111–120.47. Niemantsverdriet, J. W. Spectroscopy in Catalysis; An Introduction, 3rd ed.;
Wiley-VCH: Weinheim, 2007.
48. Kock, A. J. H. M.; Geus, J. W. Prog. Surf. Sci. 1985, 20, 165–272.49. de Smit, E.; Cinquini, F.; Beale, A. M.; Safonova, O. V.; van Beek, W.; Sautet, P.;
Weckhuysen, B. M. J. Am. Chem. Soc. 2010, 132, 14928–14941.50. Raupp, G. B.; Delgass, W. N. J. Catal. 1979, 58, 348–360.51. Niemantsverdriet, J. W.; Van der Kraan, A. M.; Van Dijk, W. L.; Van der Baan, H. S.
J. Phys. Chem. 1980, 84, 3363–3370.52. Dry, M. E. In Studies in Surface Science and Catalysis; Steynberg, A. P.,
Dry, M. E., Eds.; 152, Elsevier: Amsterdam, 2004; pp 533–600.53. Luo, M. S.; Hamdeh, H.; Davis, B. H. Catal. Today 2009, 140, 127–134.54. Herranz, T.; Rojas, S.; Perez-Alonso, F. J.; Ojeda, M.; Terreros, P.; Fierro, J. L. G.
J. Catal. 2006, 243, 199–211.55. Dry, M. E. In Catalysis, Science and Technology; Anderson, J. R., Boudart, M.,
Eds.; Springer-Verlag: New York, 1981; Vol. 1, pp 159–255.56. Luo, M. S.; Davis, B. H. Fuel Process. Technol. 2003, 83, 49–65.57. Fiato, R. A.; Soled, S. L. Fischer–Tropsch Hydrocarbon Synthesis with High
Surface Area Copper and Potassium Promoted Reduced-Carbided Iron/Manganese Spinels. US Patent 4621102A, 1986.
58. Du Toit, E. Ph.D. Thesis, University of the North West, 2002.59. Niemantsverdriet, J. W.; van der Kraan, A. M. J. Catal. 1981, 72, 385–388.60. Bromfield, T. C.; Visagie, R. Chromium Oxide Incorporation into Precipitated Iron-
Based Fischer–Tropsch Catalysts for Increased Production of Oxygenates andBranched Hydrocarbons. Patent WO 2005049765A1, 2005.
61. van Steen, E.; Claeys, M. Chem. Eng. Technol. 2008, 31, 655–666.62. Tsakoumis, N. E.; Ronning, M.; Borg, O.; Rytter, E.; Holmen, A. Catal. Today
2010, 154, 162–182.63. Morales, F.; Weckhuysen, B. M. Catalysis 2006, 19, 1–40.64. van de Loosdrecht, J.; Bazhinimaev, B.; Dalmon, J. A.; Niemantsverdriet, J. W.;
Tsybulya, S. V.; Saib, A. M.; van Berge, P. J.; Visagie, J. L. Catal. Today 2007,123, 293–302.
65. Saib, A. M.; Moodley, D. J.; Ciobica, I. M.; Hauman, M. M.; Sigwebela, B. H.;Weststrate, C. J.; Niemantsverdriet, J. W.; van de Loosdrecht, J. Catal. Today2010, 154, 271–282.
66. Claeys, M.; van Steen, E. In Studies in Surface Science and Catalysis;Steynberg, A. P., Dry, M. E., Eds.; 152, Elsevier: Amsterdam, 2004;pp 601–680.
67. Iglesia, E.; Reyes, S. C.; Madon, R. J.; Soled, S. L. Adv. Catal. 1993, 39,221–302.
68. Diehl, F.; Khodakov, A. Y. Oil Gas Sci. Technol. 2009, 64, 11–24.69. Bezemer, G. L.; Bitter, J. H.; Kuipers, H.; Oosterbeek, H.; Holewijn, J. E.; Xu, X. D.;
Kapteijn, F.; van Dillen, A. J.; de Jong, K. P. J. Am. Chem. Soc. 2006,128, 3956–3964.
70. Jacobs, G.; Patterson, P. M.; Zhang, Y. Q.; Das, T.; Li, J. L.; Davis, B. H. Appl.Catal. A: Gen. 2002, 233, 215–226.
71. Karaca, H.; Hong, J. P.; Fongarland, P.; Roussel, P.; Griboval-Constant, A.;Lacroix, M.; Hortmann, K.; Safonova, O. V.; Khodakov, A. Y. Chem. Commun.2010, 46, 788–790.
72. Kitakami, O.; Sato, H.; Shimada, Y.; Sato, F.; Tanaka, M. Phys. Rev. B 1997, 56,13849–13854.
73. Enache, D. I.; Rebours, B.; Roy-Auberger, M.; Revel, R. J. Catal. 2002, 205,346–353.
74. Iglesia, E.; Soled, S. L.; Fiato, R. A.; Via, G. H. J. Catal. 1993, 143, 345–368.75. Feller, A.; Claeys, M.; van Steen, E. J. Catal. 1999, 185, 120–130.76. Moradi, G. R.; Basir, M. M.; Taeb, A.; Kiennemann, A. Catal. Commun. 2003,
4, 27–32.77. Tan, K. F.; Chang, J.; Borgna, A.; Saeys, M. J. Catal. 2011, 280, 50–59.78. Rytter, E.; Skagseth, T. H.; Eri, S.; Sjastad, A. O. Ind. Eng. Chem. Res. 2010,
49, 4140–4148.79. Beuther, H.; Kobylinski, T. P.; Kibby, C. L.; Pannell, R. B. Synthesis Gas
Conversion Using Ruthenium-Promoted Cobalt Catalyst Prepared byNonaqueous Impregnation. US Patent 4585798A, 1986.
80. Beuther, H.; Kibby, C. L.; Kobylinski, T. P.; Pannell, R. B. Fluid Bed Catalyst forSynthesis Gas Conversion and Its Utilization for Preparation of Diesel Fuel. USPatent 4413064A, 1983.
81. Beuther, H.; Kibby, C. L.; Kobylinski, T. P.; Pannell, R. B. Conversion of SynthesisGas to Diesel Fuel and Gasoline. US Patent 4605680A, 1986.
82. Eri, S.; Kinnari, K. J.; Schanke, D.; Hilmen, A.-M. Preparation and Use ofPromoted Cobalt Catalyst with Low Surface Area Alumina for Fischer–TropschReaction with High Olefin Selectivity. Patent WO 2002047816A1, 2002.
83. Saib, A. M.; Claeys, M.; van Steen, E. Catal. Today 2002,71, 395–402.
84. Van Berge, P. J.; Van De Loosdrecht, J.; Barradas, S. Method of Treating anUntreated Catalyst Support, and Forming a Catalyst Precursor and Catalyst fromthe Treated Support. Patent EP 1 303 350 B1, 2000.
556 Fischer–Tropsch Synthesis: Catalysts and Chemistry
85. Van Berge, P. J.; Van De Loosdrecht, J.; Barradas, S. Production of Fischer–Tropsch Synthesis Produced Wax. Patent EP 1 432 778 B1, 2001.
86. Wei, D. G.; Goodwin, J. G.; Oukaci, R.; Singleton, A. H. Appl. Catal. A: Gen. 2001,210, 137–150.
87. Xiong, H. F.; Motchelaho, M. A. M.; Moyo, M.; Jewell, L. L.; Coville, N. J. J. Catal.2011, 278, 26–40.
88. Stranges, A. N. Germany’s Synthetic Fuel Industry 1927–1945. Presented at theAIChE 2003, New Orleans, 2003. http://www.fischertropsch.org.
89. Keyser, M. J.; Everson, R. C.; Espinoza, R. L. Appl. Catal. A: Gen. 1998, 171,99–107.
90. Co-Precipitated Cobalt–Zinc Catalysts for Fischer–Tropsch Reaction orFunctional Group Hydrogenation. Patent EP1358934A1, 2003.
91. Puskas, I.; Fleisch, T. H.; Full, P. R.; Kaduk, J. A.; Marshall, C. L.; Meyers, B. L.Appl. Catal. A: Gen. 2006, 311, 146–154.
92. Joustra, A. H.; Scheffer, B. Process for the Preparation of Alumina-BasedExtrudates. Patent EP 455307A1, 1991.
93. Neimark, A. V.; Kheifets, L. I.; Fenelonov, V. B. Ind. Eng. Chem. Prod. Res. Dev.1981, 20, 439–450.
94. Kheifets, L. I.; Neimark, A. V.; Fenelonov, V. B. Kinet. Catal. 1979, 20,626–632.
95. Neimark, A. V.; Fenelonov, V. B.; Heifets, L. I. React. Kinet. Catal. Lett. 1976, 5,67–72.
96. Van Berge, P. J. In Scaling Up of an Alumina Supported Cobalt Slurry PhaseFischer–Tropsch Catalyst Preparation, CatCon – World Wide Catalyst IndustryConference, Houston, TX, USA, June 12–13, 2000.
97. Van Berge, P. J.; Van De Loosdrecht, J.; Caricato, E. A.; Barradas, S.; Sigwebela,B. H. Impregnation Process for Catalysts. Patent WO 2000020116A1, 2000.
98. Soled, S. L.; Baumgartner, J. E.; Reyes, S. C.; Iglesia, E. In Preparation ofCatalysts VI: Scientific Bases for the Preparation of Heterogeneous Catalysts,Studies in Surface Science and Catalysis, 1995; Vol. 91, pp 989–997.
99. de Jong, K. P. Deposition Precipitation onto Pre-shaped Carrier Bodies,Possibilities and Limitations; Elsevier: Amsterdam, 1991; Vol. 63.
100. Boutonnet, M.; Jaras, S.; Logdberg, S., Method for Depositing Metal Particles ona Support. Patent EP 1 985 361, 2008.
101. van de Loosdrecht, J.; Barradas, S.; Caricato, E. A.; Ngwenya, N. G.;Nkwanyana, P. S.; Rawat, M. A. S.; Sigwebela, B. H.; van Berge, P. J.;Visagie, J. L. Top. Catal. 2003, 26, 121–127.
102. Wolters, M.; Munnik, P.; Bitter, J. H.; De Jongh, P. E.; De Jong, K. P. Method forProducing a Supported Metal Nitrate. Patent WO 2010109216A1, 2010.
103. Soled, S.L.; Baumgartner, J.E.; Reyes, S.C.; Iglesia, E.; Poncelet, G., J. M. B. D. P.A. J. a. P. G. In Studies in Surface Science and Catalysis; Elsevier, 1995; Vol. 91;pp 989–997.
104. Hoek, A.; Moors, J. H. Catalyst Activation and Rejuvenation Process. Patent WO9717137A1, 1997.
105. Behrmann, W. C.; Davis, S. M.; Mauldin, C. H. Method for Preparing Cobalt-Containing Hydrocarbon Synthesis Catalyst. Patent WO 9206784A1, 1992.
106. Oosterbeek, H. Phys. Chem. Chem. Phys. 2007, 9, 3570–3576.107. van Berge, P. J.; Barradas, S.; van de Loosdrecht, J.; Visagie, J. L. Erdol Erdgas
Kohle 2001, 117, 138–142.108. Iglesia, E. Appl. Catal. A 1997, 161, 59–78.109. Barbier, A.; Tuel, A.; Arcon, I.; Kodre, A.; Martin, G. A. J. Catal. 2001, 200,
106–116.110. Bian, G. Z.; Fujishita, N.; Mochizuki, T.; Ning, W. S.; Yamada, M. Appl. Catal. A:
Gen. 2003, 252, 251–260.111. Martinez, A.; Prieto, G. J. Catal. 2007, 245, 470–476.112. Prieto, G.; Martinez, A.; Concepcion, P.; Moreno-Tost, R. J. Catal. 2009, 266,
129–144.113. Borg, O.; Dietzel, P. D. C.; Spjelkavik, A. I.; Tveten, E. Z.; Walmsley, J. C.;
Diplas, S.; Eri, S.; Holmen, A.; Ryttera, E. J. Catal. 2008, 259, 161–164.114. Iglesia, E. Appl. Catal. A: Gen. 1997, 161, 59–78.115. Martinez, A.; Rollan, J.; Arribas, M. A.; Cerqueira, H. S.; Costa, A. F.; S-
Aguiar, E. F. J. Catal. 2007, 249, 162–173.116. Fischer, N.; van Steen, E.; Claeys, M. Catal. Today 2011, 171, 174–179.117. Yang, J.; Tveten, E. Z.; Chen, D.; Holmen, A. Langmuir 2010, 26, 16558–16567.118. Saib, A. M.; Borgna, A.; de Loosdrecht, J. V.; van Berge, P. J.;
Niemantsverdriet, J. W. Appl. Catal. A: Gen. 2006, 312, 12–19.119. Reynhout, M. J. Cobalt-Based Hydrocarbon Synthesis Catalysts Prepared from
Solid Solution Mixture of Metal Compound Precursors. Patent WO2008061970A2, 2008.
120. White Paper – Fischer–Tropsch Catalyst Test on Coal Derived Synthesis Gas,Syntroleum Corporation. http://www.syntroleum.com.
121. Moodley, D. J.; van de Loosdrecht, J.; Saib, A. M.; Overett, M. J.; Datye, A. K.;Niemantsverdriet, J. W. Appl. Catal. A: Gen. 2009, 354, 102–110.
122. Moodley, D. J.; Saib, A. M.; van de Loosdrecht, J.; Welker-Nieuwoudt, C. A.;Sigwebela, B. H.; Niemantsverdriet, J. W. Catal. Today 2011, 171, 192–200.
123. Moodley, D. J.; van de Loosdrecht, J.; Saib, A. M.; Niemantsverdriet, J. W. Chem.Ind. 2010, 128, 49–81.
124. Ciobica, I. M.; van Santen, R. A.; van Berge, P. J.; van de Loosdrecht, J. Surf. Sci.2008, 602, 17–27.
125. Soled, S. L.; Iglesia, E.; Fiato, R. A.; Baumgartner, J. E.; Vroman, H.; Miseo, S.Top. Catal. 2003, 26, 101–109.
126. Hilmen, A. M.; Schanke, D.; Holmen, A. In Natural Gas Conversion IV;dePontes, M., Espinoza, R. L., Nicolaides, C. P., Scholtz, J. H., Scurrell, M. S.,Eds.; Elsevier: Amsterdam, 1997; Vol. 107, pp 237–242.
127. Rothaemel, M.; Hanssen, K. F.; Blekkan, E. A.; Schanke, D.; Holmen, A. Catal.Today 1997, 38, 79–84.
128. Craje, M. W. J.; van der Kraan, A. M.; van de Loosdrecht, J.; van Berge, P. J. Catal.Today 2002, 71, 369–379.
129. Kiss, G.; Kliewer, C. E.; DeMartin, G. J.; Culross, C. C.; Baumgartner, J. E.J. Catal. 2003, 217, 127–140.
130. Das, T. K.; Jacobs, G.; Patterson, P. M.; Conner, W. A.; Li, J. L.; Davis, B. H. Fuel2003, 82, 805–815.
131. Li, J. L.; Jacobs, G.; Zhang, Y. Q.; Das, T.; Davis, B. H. Appl. Catal. A: Gen. 2002,223, 195–203.
132. Storsaeter, S.; Borg, O.; Blekkan, E. A.; Holmen, A. J. Catal. 2005, 231, 405–419.133. Huffman, G. P.; Shah, N.; Zhao, J. M.; Huggins, F. E.; Hoost, T. E.; Halvorsen, S.;
Goodwin, J. G. J. Catal. 1995, 151, 17–25.134. Bezemer, G. L.; Remans, T. J.; van Bavel, A. P.; Dugulan, A. I. J. Am. Chem. Soc.
2010, 132, 8540–8541.135. Yan, Z.; Wang, Z. J.; Bukur, D. B.; Goodman, D. W. J. Catal. 2009, 268, 196–200.136. den Breejen, J. P.; Sietsma, J. R. A.; Friedrich, H.; Bitter, J. H.; de Jong, K. P.
J. Catal. 2010, 270, 146–152.137. Ronning, M.; Tsakoumis, N. E.; Voronov, A.; Johnsen, R. E.; Norby, P.; van
Beek, W.; Borg, O.; Rytter, E.; Holmen, A. Catal. Today 2010, 155, 289–295.138. Li, J. L.; Zhan, X. D.; Zhang, Y. Q.; Jacobs, G.; Das, T.; Davis, B. H. Appl. Catal. A:
Gen. 2002, 228, 203–212.139. British Intelligence Objectives Sub-Committee, Interrogation of Dr Otto Roelen of
Ruhrchemie A.G., B.I.O.S. Final Report No. 447; Item no 30 (1945). http://www.fischer-tropsch.org.
140. Zonnevylle, M. C.; Geerlings, J. J. C.; van Santen, R. A. Surf. Sci. 1990, 240,253–262.
141. Tan, K. F.; Xu, J.; Chang, J.; Borgna, A.; Saeys, M. J. Catal. 2010, 274, 121–129.142. Saeys, M.; Tan, K. F.; Chang, J.; Borgna, A. Ind. Eng. Chem. Res. 2010, 49,
11098–11100.143. Jacobs, G.; Sarkar, A.; Ji, Y.; Luo, M.; Dozier, A.; Davis, B. H. Ind. Eng. Chem.
Res. 2008, 47, 672–680.144. Tavasoli, A.; Abbaslou, R. M. M.; Dalai, A. K. Appl. Catal. A: Gen. 2008, 346,
58–64.145. Zhou, W.; Chen, J. G.; Fang, K. G.; Sun, Y. H. Fuel Process. Technol. 2006, 87,
609–616.146. Bartholomew, C. H. Appl. Catal. A: Gen. 2001, 212, 17–60.147. Madon, R. J.; Shaw, H. Catal. Rev. 1977, 15, 69–106.148. Liu, Z. T.; Zhou, J. L.; Zhang, B. J. J. Mol. Catal. 1994, 94, 255–261.149. Bartholomew, C. H.; Bowman, R. M. Appl. Catal. 1985, 15, 59–67.150. Leviness, S. C.; Mart, C. J.; Behrmann, W. C.; Hsia, S. J.; Neskora, D. R. Slurry
Hydrocarbon Synthesis Process with Increased Catalyst Life. Patent WO9850487A1, 1998.
151. Wilson, J.; De Groot, C. J. Phys. Chem. 1995, 99, 7860–7866.152. Luo, M. S.; Davis, B. H. In Catalyst Deactivation 2001, Proceedings, Studies in
Surface Science and Catalysis, 2001; Vol. 139, pp 133–140.153. Thune, P. C.; Weststrate, C. J.; Moodley, P.; Saib, A. M.; van de Loosdrecht, J.;
Miller, J. T.; Niemantsverdriet, J. W. Catal. Sci. Technol. 2011, 1, 689–697.154. Reynhout, M. J. Process for Regenerating a Cobalt Catalyst. Patent EP
1920836A1, 2008.155. Pichler, H.; Schulz, H. Chemie Ingenieur Technik 1970, 42, 1162–1174.156. Lahtinen, J.; Vaari, J.; Kauraala, K. Surf. Sci. 1998, 418, 502–510.157. Beitel, G. A.; Laskov, A.; Oosterbeek, H.; Kuipers, E. W. J. Phys. Chem. 1996,
100, 12494–12502.158. Habermehl-Cwirzen, K. M. E.; Kauraala, K.; Lahtinen, J. Phys. Scripta 2004,
T108, 28–32.159. Ernst, K. H.; Schwarz, E.; Christmann, K. J. Chem. Phys. 1994, 101, 5388–5401.160. Bridge, M. E.; Comrie, C. M.; Lambert, R. M. J. Catal. 1979, 58, 28–33.161. Prior, K. A.; Schwaha, K.; Lambert, R. M. Surf. Sci. 1978, 77, 193–208.162. Geerlings, J. J. C.; Zonnevylle, M. C.; Degroot, C. P. M. Surf. Sci. 1991, 241,
315–324.163. Papp, H. Surf. Sci. 1985, 149, 460–470.

Fischer–Tropsch Synthesis: Catalysts and Chemistry 557
164. Nowitzki, T.; Borchert, H.; Jurgens, B.; Risse, T.; Zielasek, V.; Baumer, M.ChemPhysChem 2008, 9, 729–739.
165. Habermehl-Cwirzen, K.; Lahtinen, J.; Hautojarvi, P. Surf. Sci. 2005, 598,128–135.
166. Weststrate, C. J.; Gericke, H. J.; Verhoeven, M.; Ciobica, I. M.; Saib, A. M.;Niemantsverdriet, J. W. J. Phys. Chem. Lett. 2010, 1, 1767–1770.
167. Steinbach, F.; Kiss, J.; Krall, R. Surf. Sci. 1985, 157, 401–412.168. Denecke, R. Appl. Phys. Mater. Sci. Process. 2005, 80, 977–986.169. Krebs, H. J.; Bonzel, H. P.; Gafner, G. Surf. Sci. 1979, 88, 269–283.170. Dwyer, D. J.; Gland, J.; Albert, M.; Bernasek, S., Intermediates to the Dissociative
Chemisorption of Co and Ch3oh on Fe(100). Abstracts of Papers of the AmericanChemical Society 1987, 193, 30.
171. Moon, D. W.; Cameron, S.; Zaera, F.; Eberhardt, W.; Carr, R.; Bernasek, S. L.;Gland, J. L.; Dwyer, D. J. Surf. Sci. 1987, 180, L123–L128.
172. Dwyer, D. J.; Somorjai, G. A. J. Catal. 1978, 52, 291–301.173. Dwyer, D. J.; Hardenbergh, J. H. J. Catal. 1984, 87, 66–76.174. Wedler, G.; Colb, K. G.; McElhiney, G.; Heinrich, W. Appl. Surf. Sci. 1978, 2, 30–42.175. Wedler, G.; Colb, K. G.; Heinrich, W.; McElhiney, G. Appl. Surf. Sci. 1978, 2,
85–101.176. Vink, T. J.; Gijzeman, O. L. J.; Geus, J. W. Surf. Sci. 1985, 150, 14–23.177. van Santen, R. A.; Neurock, M.; Shetty, S. G. Chem. Rev. 2010, 110,
2005–2048.178. Hammer, B.; Norskov, J. K. In Advances in Catalysis, Impact of Surface Science
on Catalysis; Academic Press: San Diego, 2000; Vol. 45, pp 71–129.179. Bromfield, T. C.; Ferre, D. C.; Niemantsverdriet, J. W. ChemPhysChem 2005, 6,
254–260.180. Curulla-Ferre, D.; Govender, A.; Bromfield, T. C.; Niemantsverdriet, J. W. J. Phys.
Chem. B 2006, 110, 13897–13904.181. Sorescu, D. C. J. Phys. Chem. C 2008, 112, 10472–10489.182. Sorescu, D. C.; Thompson, D. L.; Hurley, M. M.; Chabalowski, C. F. Phys. Rev. B
2002, 66, 035416.183. Ojeda, M.; Nabar, R.; Nilekar, A. U.; Ishikawa, A.; Mavrikakis, M.; Iglesia, E.
J. Catal. 2010, 272, 287–297.184. Scheijen, F. J. E.; Ferre, D. C.; Niemantsverdriet, J. W. J. Phys. Chem. C 2009,
113, 11041–11049.185. Inderwildi, O. R.; Jenkins, S. J.; King, D. A. J. Phys. Chem. C 2008, 112,
1305–1307.186. Shetty, S.; van Santen, R. A. Phys. Chem. Chem. Phys. 2010, 12, 6330–6332.187. Jones, G.; Bligaard, T.; Abild-Pedersen, F.; Norskov, J. K. J. Phys. Condens.
Matter 2008, 20, 064239.
188. Chorkendorff, I.; Niemantsverdriet, J. W. Concepts of Modern Catalysis andKinetics. Wiley-VCH: Weinheim, 2003.
189. Ciobica, I. M.; van Santen, R. A. J. Phys. Chem. B 2002, 106, 6200–6205.190. Sorescu, D. C. Phys. Rev. B 2006, 73.191. Lo, J. M. H.; Ziegler, T. J. Phys. Chem. C 2007, 111, 11012–11025.192. Govender, A. Towards a Mechanism for the Fischer–Tropsch Synthesis on
Fe(100) Using Density Functional Theory. Ph.D. Thesis, Eindhoven University ofTechnology, Eindhoven, The Netherlands, 2010.
193. Cheng, J.; Hu, P.; Ellis, P.; French, S.; Kelly, G.; Lok, C. M. J. Phys. Chem. C2010, 114, 1085–1093.
194. Cheng, J.; Gong, X. Q.; Hu, P.; Lok, C. M.; Ellis, P.; French, S. J. Catal. 2008,254, 285–295.
195. Biloen, P.; Helle, J. N.; Sachtler, W. M. H. J. Catal. 1979, 58, 95–107.196. Biloen, P.; Sachtler, W. M. H. Adv. Catal. 1981, 30, 165–216.197. Ciobica, I. M.; Kramer, G. J.; Ge, Q.; Neurock, M.; van Santen, R. A. J. Catal.
2002, 212, 136–144.198. Zhuo, M. K.; Tan, K. F.; Borgna, A.; Saeys, M. J. Phys. Chem. C 2009, 113,
8357–8365.199. Gracia, J.M.; Prinsloo, F. F.; Niemantsverdriet, J.W.Catal. Lett.2009, 133, 257–261.200. Deng, L. J.; Huo, C. F.; Liu, X. W.; Zhao, X. H.; Li, Y. W.; Wang, J. G.; Jiao, H. J.
J. Phys. Chem. C 2010, 114, 21585–21592.201. Anderson, R. B. In Catalysis; Emmett, P. H., Ed.; Reinhold Publishing Company:
New York, 1956; Vol. IV.202. Botes, F. G.; van Dyk, B.; McGregor, C. Ind. Eng. Chem. Res. 2009, 48,
10439–10447.203. Botes, F. G. Catal. Rev.: Sci. Eng. 2008, 50, 471–491.204. Botes, F. G. Ind. Eng. Chem. Res. 2009, 48, 1859–1865.205. Yang, J.; Liu, Y.; Chang, J.; Wang, Y. N.; Bai, L.; Xu, Y. Y.; Xiang, H. W.; Li, Y. W.;
Zhong, B. Ind. Eng. Chem. Res. 2003, 42, 5066–5090.206. van Dijk, H. A. J. Ph.D. Thesis, Eindhoven University of Technology, 2001207. Botes, F. G.; Breman, B. B. Ind. Eng. Chem. Res. 2006, 45, 7415–7426.208. Yates, I. C.; Satterfield, C. N. Energy Fuel 1991, 5, 168–173.209. Donnelly, T. J.; Yates, I. C.; Satterfield, C. N. Energy Fuel 1988, 2, 734–739.210. Lozano-Blanco, G.; Thybaut, J. W.; Surla, K.; Galtier, P.; Marin, G. B. Ind. Eng.
Chem. Res. 2008, 47, 5879–5891.211. Yang, Q. Y.; Maynard, K. J.; Johnson, A. D.; Ceyer, S. T. J. Chem. Phys. 1995,
102, 7734–7749.212. Govender, N. S.; Botes, F. G.; de Croon, M.; Schouten, J. C. J. Catal. 2008, 260,
254–261.213. Weckhuysen, B. M. Angew. Chem. Int. Ed. 2009, 48, 4910–4943.