comprehensive annual financial report fy16-17...comprehensive annual financial report 2016-17 ......
TRANSCRIPT

Sacramento County Employees’ Retirement System
COMPREHENSIVE ANNUAL FINANCIAL REPORT
2016-17
For the Fiscal Years Ended June 30, 2017 and 2016
Sacramento • California


For the Fiscal Years Ended June 30, 2017 and 2016
ANNETTE ST. URBAINInterim Chief Executive Officer
KATHRYN T. REGALIA, CPA, CGMAChief Operations Officer
THUYET DANGSenior Accounting Manager
Issued by:
Introductory Section
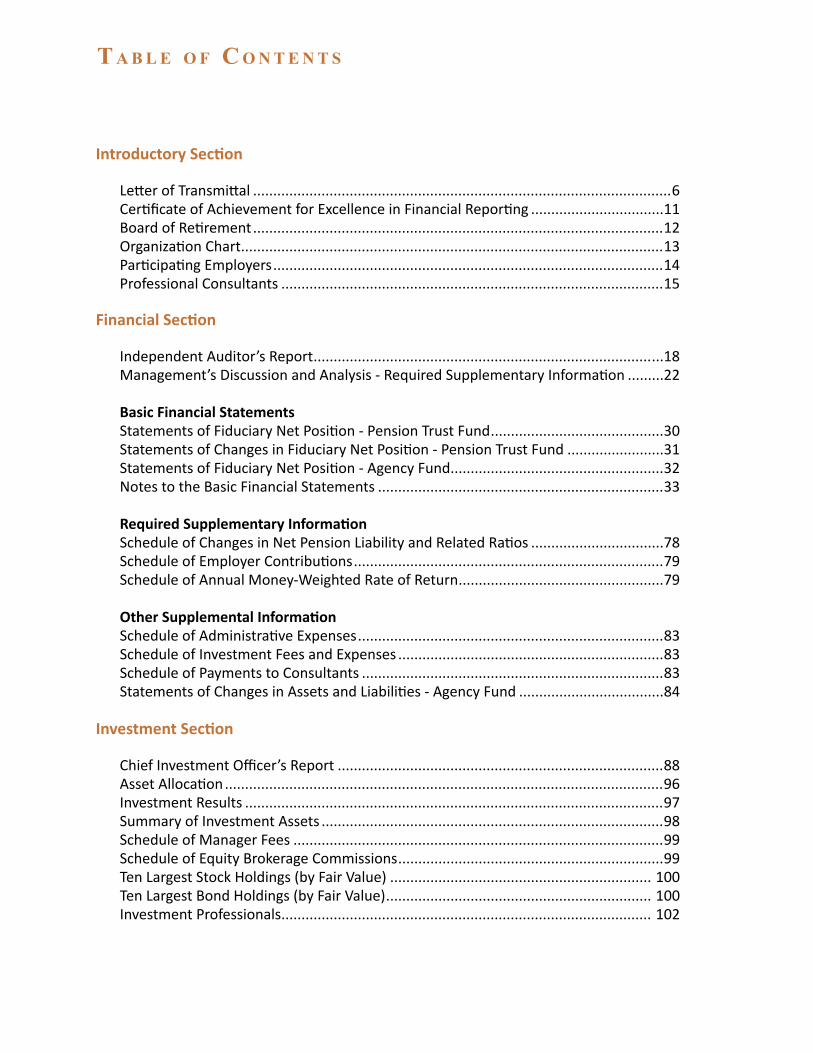
Letter of Transmittal ........................................................................................................6Certificate of Achievement for Excellence in Financial Reporting .................................11Board of Retirement ......................................................................................................12Organization Chart.........................................................................................................13Participating Employers .................................................................................................14Professional Consultants ...............................................................................................15
Financial Section
Independent Auditor’s Report .......................................................................................18Management’s Discussion and Analysis - Required Supplementary Information .........22
Basic Financial StatementsStatements of Fiduciary Net Position - Pension Trust Fund ...........................................30Statements of Changes in Fiduciary Net Position - Pension Trust Fund ........................31Statements of Fiduciary Net Position - Agency Fund .....................................................32Notes to the Basic Financial Statements .......................................................................33
Required Supplementary InformationSchedule of Changes in Net Pension Liability and Related Ratios .................................78Schedule of Employer Contributions .............................................................................79Schedule of Annual Money-Weighted Rate of Return ...................................................79
Other Supplemental InformationSchedule of Administrative Expenses ............................................................................83Schedule of Investment Fees and Expenses ..................................................................83Schedule of Payments to Consultants ...........................................................................83Statements of Changes in Assets and Liabilities - Agency Fund ....................................84
Investment Section
Chief Investment Officer’s Report .................................................................................88Asset Allocation .............................................................................................................96Investment Results ........................................................................................................97Summary of Investment Assets .....................................................................................98Schedule of Manager Fees ............................................................................................99Schedule of Equity Brokerage Commissions ..................................................................99Ten Largest Stock Holdings (by Fair Value) ................................................................. 100Ten Largest Bond Holdings (by Fair Value) .................................................................. 100Investment Professionals ............................................................................................ 102
T a b l e o f C o n T e n T s
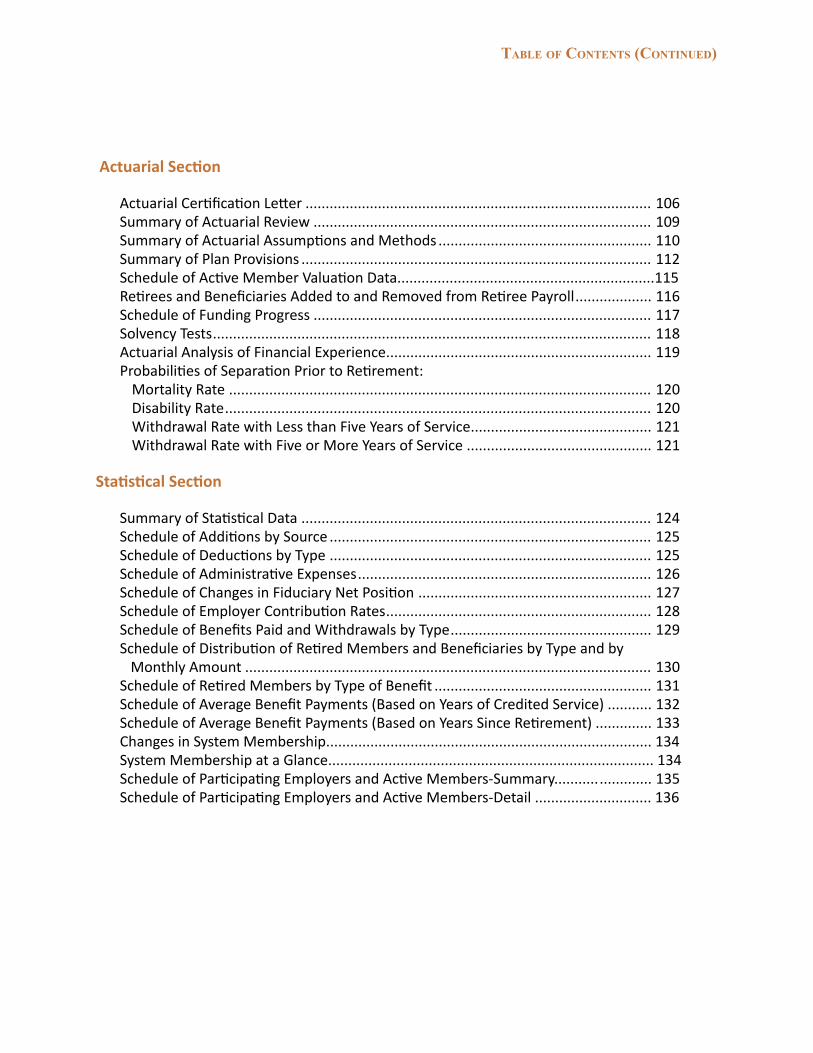
Actuarial Section
Actuarial Certification Letter ...................................................................................... 106Summary of Actuarial Review .................................................................................... 109Summary of Actuarial Assumptions and Methods ..................................................... 110Summary of Plan Provisions ....................................................................................... 112Schedule of Active Member Valuation Data................................................................115Retirees and Beneficiaries Added to and Removed from Retiree Payroll ................... 116Schedule of Funding Progress .................................................................................... 117Solvency Tests ............................................................................................................. 118Actuarial Analysis of Financial Experience.................................................................. 119Probabilities of Separation Prior to Retirement: Mortality Rate ......................................................................................................... 120 Disability Rate .......................................................................................................... 120 Withdrawal Rate with Less than Five Years of Service ............................................. 121 Withdrawal Rate with Five or More Years of Service .............................................. 121
Statistical Section
Summary of Statistical Data ....................................................................................... 124Schedule of Additions by Source ................................................................................ 125Schedule of Deductions by Type ................................................................................ 125Schedule of Administrative Expenses ......................................................................... 126Schedule of Changes in Fiduciary Net Position .......................................................... 127Schedule of Employer Contribution Rates .................................................................. 128Schedule of Benefits Paid and Withdrawals by Type .................................................. 129Schedule of Distribution of Retired Members and Beneficiaries by Type and by Monthly Amount ..................................................................................................... 130 Schedule of Retired Members by Type of Benefit ...................................................... 131Schedule of Average Benefit Payments (Based on Years of Credited Service) ........... 132Schedule of Average Benefit Payments (Based on Years Since Retirement) .............. 133Changes in System Membership................................................................................. 134System Membership at a Glance................................................................................. 134Schedule of Participating Employers and Active Members-Summary........... ............. 135Schedule of Participating Employers and Active Members-Detail ............................. 136
Table of ConTenTs (ConTinued)


INTRODUCTORY

Introductory Section | 6
l e T T e r o f T r a n s m i T T a l
Executive StaffAnnette St. Urbain
Interim Chief Executive OfficerSteve Davis
Chief Investment OfficerRobert L. GaumerGeneral Counsel
Kathryn T. RegaliaChief Operations Officer
John W. Gobel Sr.Chief Benefits Officer
Stephen HawleyChief Strategy Officer
December 7, 2017
Board of RetirementSacramento County Employees’ Retirement System980 9th Street, Suite 1900Sacramento, CA 95814
Dear Board Members:
As Interim Chief Executive Officer of the Sacramento County Employees’ Retirement System (SCERS or the System), I am pleased to present this Comprehensive Annual Financial Report (CAFR or the Report) for the fiscal years ended June 30, 2017 and 2016.
The System
SCERS is a cost-sharing multiple-employer public employee retirement system, enacted and administered in accordance with the provisions of the County Employees Retirement Law of 1937 (California Government Code Section 31450, et seq.) (1937 Act) and the California Public Employees’ Pension Reform Act of 2013 (CalPEPRA). Since its establishment by the Sacramento County Board of Supervisors in 1941, SCERS has provided retirement, disability, and survivors’ benefits to eligible participants of the System. Under Article XVI, Section 17 of the Constitution of the State of California, the SCERS Board of Retirement is vested with plenary authority and fiduciary responsibility for the investment of monies and the administration of the System. Together, the provisions of the State Constitution and the 1937 Act establish SCERS as a separate and independent governmental entity from the public employers that participate in SCERS. At June 30, 2017, the County of Sacramento; Superior Court of California, County of Sacramento; and eleven Special Districts participated in SCERS.
The Comprehensive Annual Financial Report
Responsibility for both the accuracy of the data and the completeness and fairness of the presentation in this CAFR rests with the management of the System. To the best of management’s knowledge and belief, the enclosed data is accurate in all material respects and is reported in a manner designed to present fairly the financial position and results of operations of the System.
I trust that readers of this Report and participants of the System will find this information helpful in understanding SCERS and its commitment to financial integrity and participant service.

l e T T e r o f T r a n s m i T T a l ( C o n T i n u e d )
Introductory Section | 7
SCERS Mission Statement and Core Values
We are dedicated to providing the highest level of retirement services and managing System resources in an effective and prudent manner.
In fulfilling our mission as a retirement system, we are committed to:
◊ The highest levels of professionalism and fiduciary responsibility ◊ Acting with integrity ◊ Competent, courteous and respectful service to all ◊ Open and fair processes ◊ Safeguarding confidential information ◊ Cost-effective operations ◊ Stable funding and minimal contribution volatility ◊ Effective communication and helpful education ◊ Maintaining a highly competent and committed staff ◊ Continuous improvement ◊ Planning strategically for the future
Accounting System and Reports
Management of SCERS is responsible for establishing and maintaining internal controls designed to ensure that the System’s assets are protected from loss, theft, or misuse. Responsibility for the accuracy, completeness, and fair presentation of information, and all disclosures in this CAFR and in the System’s records, rests with SCERS’ management. Brown Armstrong Accountancy Corporation, a certified public accounting firm, has audited the financial statements and related disclosures. The financial statement audit provides reasonable assurance that SCERS’ financial statements are presented in conformity with accounting principles generally accepted in the United States and are free from material misstatements. The internal controls are designed to provide reasonable, but not absolute, assurance that these objectives are met. The concept of reasonable assurance recognizes that: (1) The cost of a control should not exceed the benefits likely to be derived; and (2) The assessment of costs and benefits requires estimates and judgments by management.
This report has been prepared in accordance with generally accepted accounting principles (GAAP) as promulgated by the Governmental Accounting Standards Board (GASB). GAAP requires that management provide a narrative introduction, overview, and analysis to accompany the basic financial statements in the form of management’s discussion and analysis (MD&A). This letter of transmittal is designed to complement the MD&A and should be read in conjunction with it. The System’s MD&A can be found immediately following the independent auditor’s report.
Investments – General Authority and SCERS
Article XVI, Section 17 of the Constitution of the State of California provides that “...notwithstanding any other provisions of law or this Constitution, the Retirement Board (the Board) of a public pension or retirement system shall have plenary authority and fiduciary responsibility for investment of monies and administration of the system...” Article XVI, Section 17(a) further provides that “...the Retirement Board of a public pension or retirement system shall have sole and exclusive fiduciary responsibility over the assets…”
SCERS maintains an overall investment policy designed to achieve a diversified investment portfolio. An integral part of the investment policy is the strategic asset allocation, which is designed to provide an optimal mix of asset classes with return expectations that correspond to expected liabilities. The strategic asset allocation also emphasizes maximum diversification of the portfolio to protect the System from the possibility that a particular asset class may experience poor investment performance in a given period.

l e T T e r o f T r a n s m i T T a l ( C o n T i n u e d )
During the fiscal year, SCERS completed an asset/liability study that resulted in the approval of a revised strategic asset allocation. The SCERS’ Board identified and prioritized several investment-related plan objectives, principles and risks that played a role in the design of the strategic asset allocation which included: 1) Reducing portfolio volatility; (2) Improving the funding status of the plan; (3) Protecting against significant drawdowns; (4) Improving the cash flow generation of the portfolio; and (5) Determining a reasonable and realistic expected investment return for the portfolio.
The revised strategic asset allocation views risk exposures through multiple lenses in order to manage and maintain allocations that are aligned with SCERS’ investment philosophy and objectives. This approach used a functional framework to re-group and re-classify segments of SCERS’ prior asset allocation in order to link segments of the SCERS portfolio that are exposed to similar economic environments and risk factors, and which would be expected to have similar roles and outcomes in a portfolio. The result was reorganizing asset classes into three functional asset categories of Growth (assets that tend to perform best in a high growth and low/moderate inflationary environment, including most equity and credit investments); Diversifying (assets expected to protect capital and perform better than Growth assets during dislocated and stressed market environments, including traditional fixed income and diversifying absolute return strategies), and Real Return (assets that provide a hedge against inflation, generate cash flow, and provide further portfolio diversification including real estate, infrastructure, energy, agriculture and commodities investments).
For the fiscal year ended June 30, 2017, SCERS’ investments provided a 13.7% rate of return (gross of fees), compared to the investment policy benchmark return of 11.7%.
More detailed information regarding SCERS’ strategic asset allocation, professional investment advisors, and investment performance can be found in the Investment Section of this Report.
Actuarial Funding Status
SCERS’ overall funding objective is to meet long-term benefit promises by maintaining a well-funded plan status through a combination of superior investment returns and employer and employee contributions which are both minimized and maintained as level as possible for each generation of active members. The greater the level of overall plan funding, the larger the ratio of assets accumulated to the actuarial accrued liability and the greater the investment potential. The advantage of a well-funded plan is that the benefits earned by participants are funded during their working careers and not by future generations of taxpayers. To help reduce year-to-year volatility in employer contribution rates due to fluctuations in investment performance, SCERS smooths the calculation of actuarial assets over a rolling seven-year period. This not only stabilizes contribution rates but also improves the ability of the employer to plan for possible future increases or decreases in the rates.
SCERS engaged an independent actuarial consulting firm, Segal Consulting, to conduct its annual actuarial valuation as of June 30, 2017. Triennially, the System requests that its actuary perform an analysis of the appropriateness of all economic and non-economic assumptions. The most recent triennial analysis was performed as of June 30, 2016, and as a result of that analysis, the Board of Retirement approved certain changes to the actuarial assumptions, which were incorporated in the actuarial valuation as of June 30, 2017.
At June 30, 2017, SCERS’ funding ratio was 81.1%, with the actuarial value of assets totaling $8.665 billion and the actuarial accrued liability totaling $10.681 billion. The decrease in the funding ratio (down from 87.3% as of June 30, 2016) was mainly due to changes in actuarial assumptions, including assumed investment returns decreased from 7.5% to 7.0%. Deferred losses under the smoothing methodology exceeded deferred gains by $81.0 million as of June 30, 2017, an improvement from $555.5 million as of June 30, 2016. Deferred investment gains/(losses) are amortized over a rolling seven-year period.
Introductory Section | 8
l e T T e r o f T r a n s m i T T a l ( C o n T i n u e d )
Budget
The Board of Retirement approves SCERS’ annual administrative budget. The 1937 Act limits SCERS’ annual administrative expenses, excluding the costs of administration for computer software and hardware and computer technology consulting services (IT costs), to twenty-one hundredths of one percent (0.21%) of the System’s actuarial accrued liability. SCERS’ administrative expenses have historically been below the limitation. Administrative expenses, excluding IT costs, were $6.0 million and $5.5 million for the years ended June 30, 2017 and June 30, 2016, respectively. SCERS administrative expenses for both years were 0.06% of the System’s actuarial accrued liability.
Significant Events
The following are significant events which occurred during the fiscal year:
• Continued the implementation of the 2014-2018 Strategic Plan goals and objectives.
• Continued to assess SCERS’ information technology system requirements, modified and enhanced SCERS’ systems to accommodate operational needs and strategically planned for future information technological needs; Continued to work with Linea Solutions, Inc. (Linea) to provide SCERS with pension administration and financial systems consulting services.
• Substantially completed the assessment phase of the IT Modernization Program; Worked with Linea to issue a Request for Proposals (RFP) for Data Conversion Services and selected Icon Integration and Design, Inc. (ICON) to perform data conversion services; Worked with Linea to issue a RFP for the Pension Administration System (PAS) and received responses from five vendors.
• Made site visits to other 1937 Act retirement systems with recent PAS implementation experience to learn about the solutions, resources and organizational challenges during and post implementation.
• Worked with Sacramento County Department of Personnel Services, Department of Finance, and Department of Technology on the transition of their payroll system for special districts from Highline to COMPASS that will be effective in FY 2017-2018.
• Worked with Orangevale Recreation and Park District to complete the last phase of a 50/50 normal cost sharing arrangement in which the employees pay 50% of the combined employee and employer normal cost.
• Continued to work with Sacramento Metropolitan Fire District on a plan to pay off the unfunded actuarial accrued liability (UAAL).
• Analyzed and implemented a staffing plan to adequately support the daily business operations and the execution of the IT Modernization Program; added staff positions in benefit administration, operations and information technology; created a new functional area, Enterprise Solutions Management.
• Surveyed participating employers and developed standards and controls to ensure that SCERS employers properly enroll eligible employees in SCERS; worked with participating employers to correctly enroll eligible employees in SCERS.
• Worked with consultant to perform a compensation study for SCERS unrepresented management employees.
• Engaged a consultant to conduct the recruitment for the SCERS Chief Executive Officer position.
• Received a new Determination Letter from the Internal Revenue Service renewing SCERS’ qualified plan status.
• Completed the asset/liability study for SCERS that was initiated in FY 2015-2016, and established a revised strategic asset allocation to increase diversification, reduce the potential range of portfolio outcomes, and increase cash flow generation.
• Initiated and completed implementation plans for several asset classes within the structure of SCERS’ revised strategic asset allocation.
Introductory Section | 9
l e T T e r o f T r a n s m i T T a l ( C o n T i n u e d )
• Initiated the revision of SCERS’ Master Investment Policy Statement in support of SCERS’ revised strategic asset allocation.
• Conducted and completed a large cap international developed markets search within SCERS’ International Equity asset class.
• Identified, performed due diligence and made direct fund investments within SCERS’ Absolute Return, Private Equity, Real Assets and Opportunities asset classes.
• Presented the annual reports and annual investment plans for the Private Equity, Private Credit and Real Assets asset classes.
• Executed implementation of SCERS’ Real Estate program, including: (1) Assessments of core separate account properties and open-end commingled funds; and (2) Review of opportunities in value add and opportunistic real estate.
• Prepared and presented the 2016 Investment Year in Review report.
• Evaluated the proxies utilized within SCERS’ overlay program.
• Monitored and assessed the securities lending program.
• Continued to monitor and assess the investment manager lineup.
• Conducted investment education on private equity fund transparency and portfolio asset class construction.
Certificate of Achievement
The Government Finance Officers Association of the United States and Canada (GFOA) awarded the Certificate of Achievement for Excellence in Financial Reporting to SCERS for its comprehensive annual financial report for the fiscal years ended June 30, 2016 and 2015. In order to be granted this national award, a governmental entity must publish an easily readable and efficiently organized CAFR that meets the highest standards of governmental financial reporting. This was the eighteenth consecutive year that SCERS has received this prestigious award.
A Certificate of Achievement is valid for a period of one year. Management believes that this current comprehensive annual financial report continues to meet the requirements for earning a Certificate of Achievement, and it will be submitted to the GFOA for consideration of the award.
SCERS also received the GFOA Award for Outstanding Achievement in Popular Annual Financial Reporting for the fiscal year ended June 30, 2016. This was the eighth consecutive year SCERS has received this award.
Acknowledgements
This Report is intended to provide complete and reliable information with respect to the responsible stewardship of SCERS. The compilation of this Report is a product of the combined and dedicated effort of the System’s Staff. This Report is also a reflection of the leadership of the SCERS Board in assuring the prudent fiduciary oversight of SCERS. I would like to take this opportunity to express my thanks to the SCERS Board, Staff, and advisors for their commitment to SCERS and for working so diligently to ensure the successful operation of the System.
Respectfully submitted,
Annette St. UrbainInterim Chief Executive Officer
Introductory Section | 10

C e r T i f i C a T e o f a C h i e v e m e n T
Introductory Section | 11

b o a r d o f r e T i r e m e n T
Introductory Section | 12
PresidentRichard B. Fowler IIAppointed by Board ofSupervisorsPresent term expiresJune 30, 2019
TrusteeJames A. DiepenbrockAppointed by Board ofSupervisorsPresent term expiresJune 30, 2018
TrusteeKathy O’NeilElected by RetiredMembersPresent term expiresDecember 31, 2019
TrusteeSteven L. BairdElected by Miscellaneous MembersPresent term expiresDecember 31, 2018
Vice President John B. KellyAppointed by Board ofSupervisorsPresent term expiresDecember 31, 2018
Vice PresidentKeith DeVore Appointed by Board ofSupervisorsPresent term expiresJune 30, 2018
TrusteeChris A. PittmanElected by Safety MembersPresent term expiresDecember 31, 2018
Alternate Retiree TrusteeMartha HooverElected by RetiredMembersPresent term expiresDecember 31, 2019
Alternate Safety TrusteeJohn ConneallyElected by Safety MembersPresent term expiresDecember 31, 2018
Ex-OfficioBen LameraSacramento CountyDirector of FinanceMember mandated by law
TrusteeAlan MatréElected by Miscellaneous MembersPresent term expiresDecember 31, 2019

o r g a n i z a T i o n C h a r T
Investment policy and objectives
Investment compliance and performance reporting
Asset allocation rebalancing
Conduct manager searches
Manager due diligence
Proxy voting and corporate governance
Board education on investment issues
Steve DavisChief Investment Officer
Kathryn T. Regalia Chief Operations Officer
John W. Gobel, Sr. Chief Benefits Officer
Robert L. GaumerGeneral Counsel
Annette St. UrbainInterim Chief Executive Officer
Suzanne Likarich Retirement Services Manager
Legal representation and counsel to SCERS Board and staff
Coordinate and oversee the selection and work of outside legal counsel
Evaluation of securities litigation
Analysis of state and federal legislation
Legislative proposals, contracts, resolutions and opinions
Legal education programs
Legal service planning and budgeting
Accounting and financial reporting
Budgeting and cash flow analysis
Human resources
Facilities and safety
Information technology and telecommunications
Administration and records
Service, disability, deferred, and reciprocal retirements
Pension payroll administration
Seminar presentations and member retirement counseling
Retirement publications and communications
Death benefits and service credit purchases
Community property interest resolution
BOARD OF RETIREMENT
Introductory Section | 13
VacantDeputy
Chief Investment Officer
Thuyet Dang Senior Accounting Manager
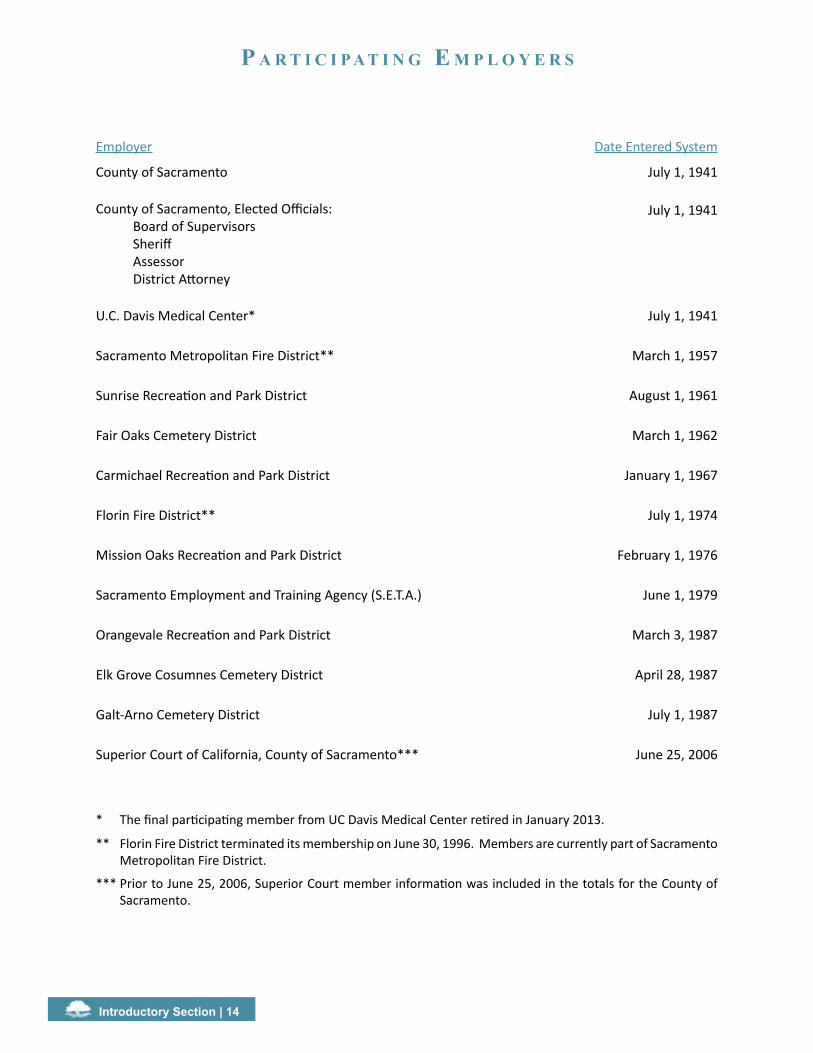
Employer Date Entered System
County of Sacramento July 1, 1941
County of Sacramento, Elected Officials: Board of Supervisors Sheriff Assessor District Attorney
July 1, 1941
U.C. Davis Medical Center* July 1, 1941
Sacramento Metropolitan Fire District** March 1, 1957
Sunrise Recreation and Park District August 1, 1961
Fair Oaks Cemetery District March 1, 1962
Carmichael Recreation and Park District January 1, 1967
Florin Fire District** July 1, 1974
Mission Oaks Recreation and Park District February 1, 1976
Sacramento Employment and Training Agency (S.E.T.A.) June 1, 1979
Orangevale Recreation and Park District March 3, 1987
Elk Grove Cosumnes Cemetery District April 28, 1987
Galt-Arno Cemetery District July 1, 1987
Superior Court of California, County of Sacramento*** June 25, 2006
* The final participating member from UC Davis Medical Center retired in January 2013.
** Florin Fire District terminated its membership on June 30, 1996. Members are currently part of Sacramento Metropolitan Fire District.
*** Prior to June 25, 2006, Superior Court member information was included in the totals for the County of Sacramento.
P a r T i C i P a T i n g e m P l o y e r s
Introductory Section | 14

P r o f e s s i o n a l C o n s u lT a n T s
Consulting ActuarySegal Consulting
Auditing ActuaryCheiron
AuditorBrown Armstrong Accountancy Corporation
CustodianState Street Corporation
Investment ConsultantCliffwater, LLC
The Townsend GroupVerus Advisory, Inc.
Legal CounselNossaman, LLP
Public Pension ConsultantsSacramento County
Office of the County Counsel
Note: In the Investment Section of this report, investment professionals are listed on pages 102 and 103, a schedule of manager fees is located on page 99, and a schedule of equity brokerage commissions is on page 99.
Introductory Section | 15


FINANCIAL
i n d e P e n d e n T a u d i T o r ’ s r e P o r T
Financial Section | 18
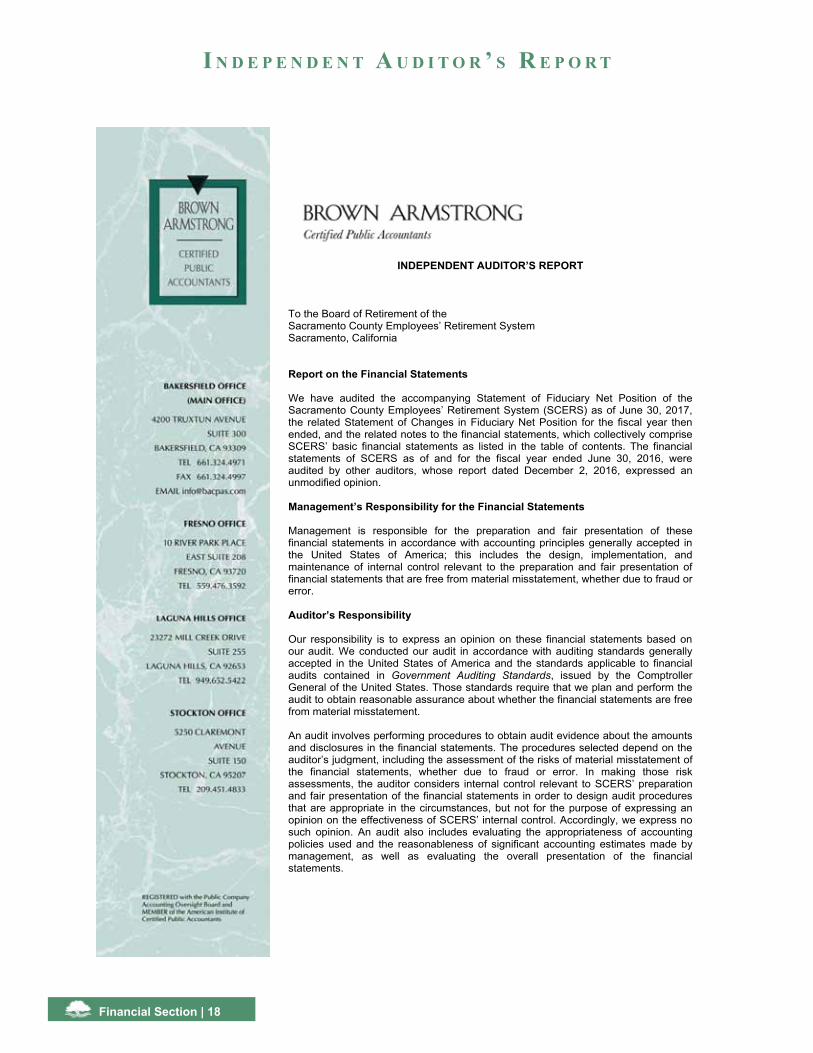
INDEPENDENT AUDITOR’S REPORT
To the Board of Retirement of the Sacramento County Employees’ Retirement System Sacramento, California
Report on the Financial Statements
We have audited the accompanying Statement of Fiduciary Net Position of the Sacramento County Employees’ Retirement System (SCERS) as of June 30, 2017, the related Statement of Changes in Fiduciary Net Position for the fiscal year then ended, and the related notes to the financial statements, which collectively comprise SCERS’ basic financial statements as listed in the table of contents. The financial statements of SCERS as of and for the fiscal year ended June 30, 2016, were audited by other auditors, whose report dated December 2, 2016, expressed an unmodified opinion.
Management’s Responsibility for the Financial Statements
Management is responsible for the preparation and fair presentation of these financial statements in accordance with accounting principles generally accepted in the United States of America; this includes the design, implementation, and maintenance of internal control relevant to the preparation and fair presentation of financial statements that are free from material misstatement, whether due to fraud or error.
Auditor’s Responsibility
Our responsibility is to express an opinion on these financial statements based on our audit. We conducted our audit in accordance with auditing standards generally accepted in the United States of America and the standards applicable to financial audits contained in Government Auditing Standards, issued by the Comptroller General of the United States. Those standards require that we plan and perform the audit to obtain reasonable assurance about whether the financial statements are free from material misstatement.
An audit involves performing procedures to obtain audit evidence about the amounts and disclosures in the financial statements. The procedures selected depend on the auditor’s judgment, including the assessment of the risks of material misstatement of the financial statements, whether due to fraud or error. In making those risk assessments, the auditor considers internal control relevant to SCERS’ preparation and fair presentation of the financial statements in order to design audit procedures that are appropriate in the circumstances, but not for the purpose of expressing an opinion on the effectiveness of SCERS’ internal control. Accordingly, we express no such opinion. An audit also includes evaluating the appropriateness of accounting policies used and the reasonableness of significant accounting estimates made by management, as well as evaluating the overall presentation of the financial statements.
indePendenT audiTor’s rePorT (ConTinued)
Financial Section | 19
We believe that the audit evidence we have obtained is sufficient and appropriate to provide a basis for our audit opinion.
Opinion
In our opinion, the financial statements referred to above present fairly, in all material respects, the fiduciary net position of SCERS as of June 30, 2017, and the changes in fiduciary net position for the fiscal year then ended in conformity with accounting principles generally accepted in the United States of America.
Other Matters
Required Supplementary Information
Accounting principles generally accepted in the United States of America require that the management’s discussion and analysis and required supplementary information as listed in the table of contents be presented to supplement the basic financial statements. Such information, although not a part of the basic financial statements, is required by the Governmental Accounting Standards Board, who considers it to be an essential part of financial reporting for placing the basic financial statements in an appropriate operational, economic, or historical context. We have applied certain limited procedures to the required supplementary information in accordance with auditing standards generally accepted in the United States of America, which consisted of inquiries of management about the methods of preparing the information and comparing the information for consistency with management’s responses to our inquiries, the basic financial statements, and other knowledge we obtained during our audit of the basic financial statements. We do not express an opinion or provide any assurance on the information because the limited procedures do not provide us with sufficient evidence to express an opinion or provide any assurance.
Other Supplemental Information
Our audit was conducted for the purpose of forming an opinion on the financial statements that collectively comprise SCERS’ basic financial statements. The other supplemental information and the introductory, investment, actuarial, and statistical sections, as listed in the table of contents, are presented for purposes of additional analysis and are not a required part of the basic financial statements.
The other supplemental information is the responsibility of management and was derived from and relates directly to the underlying accounting and other records used to prepare the basic financial statements. Such information has been subjected to the auditing procedures applied in the audit of the basic financial statements and certain additional procedures, including comparing and reconciling such information directly to the underlying accounting and other records used to prepare the basic financial statements or to the basic financial statements themselves, and other additional procedures in accordance with auditing standards generally accepted in the United States of America. In our opinion, the other supplemental information is fairly stated, in all material respects, in relation to the basic financial statements as a whole.
Additional Information
The introductory, investment, actuarial, and statistical sections have not been subjected to the auditing procedures applied in the audit of the basic financial statements and, accordingly, we do not express an opinion or provide any assurance on them.
Other Reporting Required by Government Auditing Standards
In accordance with Government Auditing Standards, we have also issued our report dated December 7, 2017, on our consideration of SCERS’ internal control over financial reporting and on our tests of its compliance with certain provisions of laws, regulations, contracts, and other matters. The purpose of that report is to describe the scope of our testing of internal control over financial reporting and compliance and the results of that testing, and not to provide an opinion on the internal control over financial reporting or on compliance. That report is an integral part of an audit performed in accordance with Government Auditing Standards in considering SCERS’ internal control over financial reporting and compliance.

indePendenT audiTor’s rePorT (ConTinued)
Financial Section | 20
Report on Summarized Comparative Information
The financial statements of SCERS as of June 30, 2016, were audited by other auditors. Those auditors expressed an unmodified opinion on those audited financial statements in their report dated December 2, 2016. In our opinion, the summarized comparative information presented herein as of and for the fiscal year ended June 30, 2016, is consistent in all material respects with the audited financial statements from which it has been derived.
BROWN ARMSTRONG ACCOUNTANCY CORPORATION
Bakersfield, California December 7, 2017

Financial Section | 21
This page intentionally left blank.

m a n a g e m e n T ’ s d i s C u s s i o n a n d a n a ly s i s
This section presents management’s discussion and analysis (MD&A) of the financial activities of the Sacramento County Employees’ Retirement System (SCERS or the System) for the years ended June 30, 2017 and 2016. Readers are encouraged to consider the narrative overview and information presented in this MD&A in conjunction with the Letter of Transmittal beginning on page 6 of this Report and the Basic Financial Statements, Notes to the Basic Financial Statements, Required Supplementary Information, and Other Supplemental Information that follows.
FINANCIAL HIGHLIGHTS
As of June 30, 2017, SCERS’ fiduciary net position restricted for pension benefits (net position) totaled $8.584 billion. This represented an increase of $903.3 million or 11.8% from the $7.681 billion in SCERS’ net position as of June 30, 2016, which, in turn, represented a decrease of $197.9 million or 2.5% over the $7.879 billion in net position as of June 30, 2015.
Additions to net position were $1,342.3 million, $214.1 million, and $449.3 million for the years ended June 30, 2017, 2016 and 2015, respectively. Strong investment performance was the primary reason for the increase in total additions for the year ended June 30, 2017, with net gain from investment activities of $1,137.8 million. Lower investment performance was the primary reason for the lower total additions for the fiscal year ended June 30, 2016 with net loss from investment activities of $12.6 million. Deductions from net position were $439.0 million and $412.0 million for the years ended June 30, 2017 and 2016. The total deductions for the year ended June 30, 2017 increased by $27.0 million or 6.6% over the year ended June 30, 2016, which in turn, saw an increase in total deductions of $31.5 million or 8.3% over the year ended June 30, 2015. Increased monthly benefit payments due to an increase in the number of retirees and the annual cost-of-living adjustment were the primary reasons for the increase in total deductions for both years.
SCERS’ funding objective is to meet long-term benefit obligations through contributions and investment income. In order to help achieve level and predictable contribution costs from one year to the next, SCERS bases the determination of contribution rates on an actuarial asset valuation method that gradually adjusts to the market value of assets (asset smoothing). Under this actuarial asset valuation methodology, any investment market returns for the year that are above or below the assumed investment return rate (7.50% for fiscal years 2016-2017 and 2015-2016) are recognized over seven years (the asset smoothing period). This smoothed value is referred to as the Actuarial Value of Assets. By using the Actuarial Value of Assets to determine the contribution rates, SCERS is able to lower the year-to-year volatility in contribution rates that would come from using the market value of assets.
As of June 30, 2017, SCERS’ total pension liability was $10.681 billion, up from $9.436 billion as of June 30, 2016. The employers’ net pension liability increased from $1.755 billion as of June 30, 2016 to $2.097 billion as of June 30, 2017. This increase in employers’ net pension liability is mainly due to changes in actuarial assumptions, including lowering the assumed investment rate of return from 7.5% to 7.0%. The fiduciary net position as a percentage of the total pension liability decreased from 81.4% to 80.4%.
Financial Section | 22

managemenT’s disCussion and analysis (ConTinued)
OVERVIEW OF THE FINANCIAL STATEMENTS
This MD&A serves as an introduction to the basic financial statements and other information accompanying the basic financial statements, which are comprised of the following components:
◊ Statements of Fiduciary Net Position - Pension Trust Fund◊ Statements of Changes in Fiduciary Net Position - Pension Trust Fund◊ Statements of Fiduciary Net Position - Agency Fund◊ Notes to the Basic Financial Statements
The Statements of Fiduciary Net Position - Pension Trust Fund are snapshots of account balances at fiscal year end. These statements reflect assets available for future payments to retirees and their beneficiaries, and liabilities owed as of fiscal year end.
The Statements of Changes in Fiduciary Net Position - Pension Trust Fund reflect all the financial transactions that occurred during the year and show the impact of those activities as additions to or deductions from the plan. The trend of additions to versus deductions from the plan will indicate whether SCERS’ financial position is improving or deteriorating over time.
The fiduciary fund statements report SCERS’ net position restricted for pension benefits. Over time, increases or decreases in net position serve as one indicator of whether SCERS’ financial health is improving or deteriorating. Other factors, such as market conditions or the System’s fiduciary net position as a percentage of the employers’ total pension liability should also be considered in measuring the System’s overall health.
The Statements of Fiduciary Net Position - Agency Fund reflect assets held by SCERS in a custodial capacity or as an agent on behalf of others and do not measure the results of operations.
The Notes to the Basic Financial Statements are an integral part of the financial reports and provide additional information that is essential for a full understanding of the data provided in the financial statements.
In addition to the financial statements and accompanying notes, this report presents certain Required Supplementary Information which includes the employers’ net pension liability, actuarially determined contributions (ADC), actuarial assumptions used to calculate the net pension liability and ADC, historical trends and other required supplementary information related to SCERS’ defined benefit pension plan as required by GASB Statement No. 67.
Schedules of administrative expenses, investment fees and expenses, payments to consultants, and statements of changes in assets and liabilities for the agency fund are presented as Other Supplemental Information following the Required Supplementary Information.
Financial Section | 23

managemenT’s disCussion and analysis (ConTinued)
FINANCIAL ANALYSIS
Assets and Employers’ Net Pension Liability
SCERS’ net position restricted for pension benefits as of June 30, 2017 totaled $8.584 billion, an increase of $903.3 million or 11.8% from the $7.681 billion in net position as of June 30, 2016, which represented a decrease of $197.9 million or 2.5% from the $7.879 billion in net position as of June 30, 2015. The increase in net position for the year ended June 30, 2017 was due to strong investment returns offset to some degree by the benefits and expenses paid during the year exceeding the contributions received. The decrease in net position for the year ended June 30, 2016 was due to investment returns being flat and the benefits and expenses paid during the year exceeding the contributions received. For the fiscal year ended June 30, 2017, the total fund return, gross of fees, of 13.7% was 2.0% higher than the return of the investment policy benchmark of 11.7%. While all asset classes generated positive absolute returns during fiscal year 2016-2017, investments in the domestic equity, international equity, fixed income, absolute return, opportunities, and real assets segments outperformed the policy benchmarks, while private equity underperformed the policy benchmarks. Fiscal year 2015-2016 investments in international equity outperformed the policy benchmarks, while the domestic equity, fixed income, absolute return, private equity, and real assets segments of the portfolio underperformed the policy benchmarks. All of the net position is available to meet SCERS’ obligations to plan participants and beneficiaries.
The decrease in cash and short-term investments as of June 30, 2017 compared to the prior year was the result of funding new investments and fulfilling capital commitments. The decrease in receivables and investment trades payable as of June 30, 2017 compared to the prior year were the result of a decrease in trading activity at the end of June by the external investment managers. The decrease in securities lending collateral and securities lending liability reflected a lower level of activity in the securities lending industry.
The decrease in cash and short-term investments as of June 30, 2016 compared to the prior year was the result of funding new investments and fulfilling capital commitments. The increase in receivables and investment trades payable as of June 30, 2016 compared to the prior year were the result of an increase in trading activity at the end of June by the external investment managers. The increase in securities lending collateral and securities lending liability reflected a higher level of activity in the securities lending industry.
Financial Section | 24
managemenT’s disCussion and analysis (ConTinued)
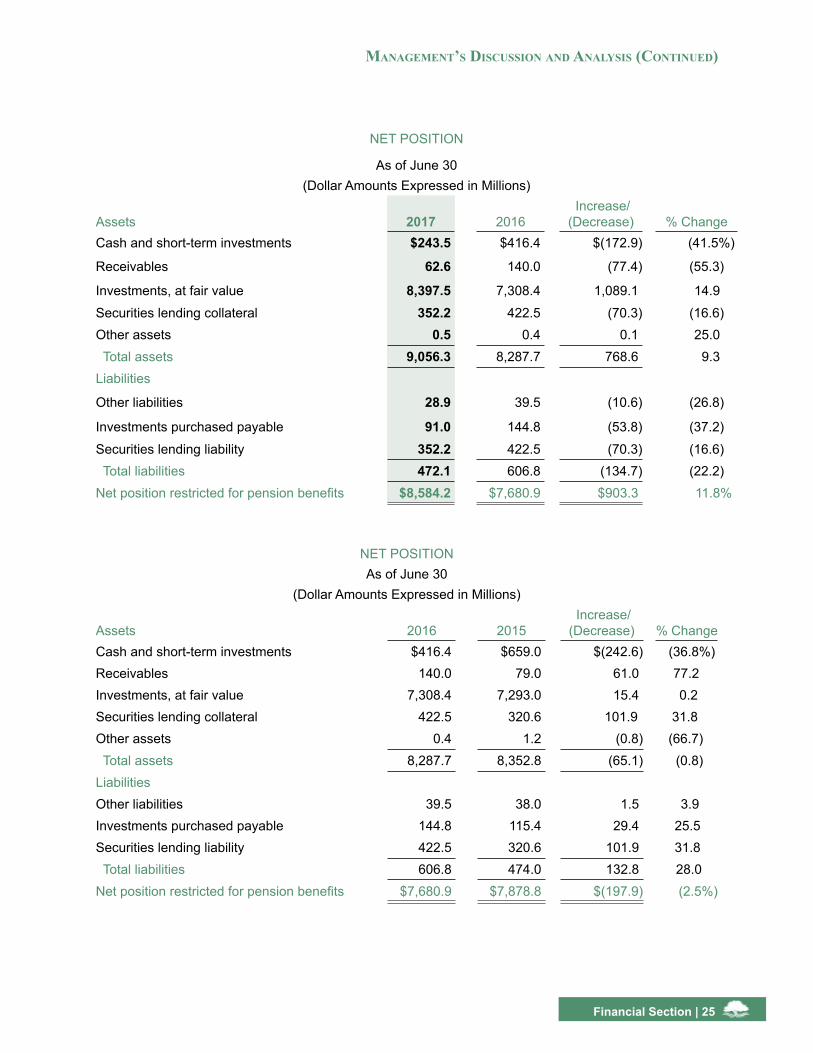
NET POSITION
As of June 30(Dollar Amounts Expressed in Millions)
Assets 2017 2016 Increase/ (Decrease) % Change
Cash and short-term investments $243.5 $416.4 $(172.9) (41.5%)
Receivables 62.6 140.0 (77.4) (55.3)
Investments, at fair value 8,397.5 7,308.4 1,089.1 14.9
Securities lending collateral 352.2 422.5 (70.3) (16.6)Other assets 0.5 0.4 0.1 25.0 Total assets 9,056.3 8,287.7 768.6 9.3Liabilities
Other liabilities 28.9 39.5 (10.6) (26.8)
Investments purchased payable 91.0 144.8 (53.8) (37.2)
Securities lending liability 352.2 422.5 (70.3) (16.6) Total liabilities 472.1 606.8 (134.7) (22.2)Net position restricted for pension benefits $8,584.2 $7,680.9 $903.3 11.8%
NET POSITIONAs of June 30
(Dollar Amounts Expressed in Millions)
Assets 2016 2015 Increase/ (Decrease) % Change
Cash and short-term investments $416.4 $659.0 $(242.6) (36.8%)Receivables 140.0 79.0 61.0 77.2Investments, at fair value 7,308.4 7,293.0 15.4 0.2Securities lending collateral 422.5 320.6 101.9 31.8Other assets 0.4 1.2 (0.8) (66.7) Total assets 8,287.7 8,352.8 (65.1) (0.8)LiabilitiesOther liabilities 39.5 38.0 1.5 3.9Investments purchased payable 144.8 115.4 29.4 25.5Securities lending liability 422.5 320.6 101.9 31.8 Total liabilities 606.8 474.0 132.8 28.0Net position restricted for pension benefits $7,680.9 $7,878.8 $(197.9) (2.5%)
Financial Section | 25

managemenT’s disCussion and analysis (ConTinued)
GASB Statement No. 67 replaced GASB Statement No. 25 and redefined pension liability and expense for financial reporting purposes but does not apply to contribution amounts for pension funding purposes. When measuring the total pension liability, GASB uses the same actuarial cost method and the same type of discount rate as SCERS uses for funding. Therefore, the employers’ total pension liability measured for financial reporting shown in this report is determined on the same basis as SCERS’ actuarial accrued liability measured for funding.
SCERS retains an independent actuarial firm, Segal Consulting, to perform annual actuarial valuations to determine the employers’ total pension liability (expected future benefits) and ADC. The annual actuarial valuation measures the current and projected assets and liabilities of the retirement system, as well as the system’s funded status. This information forms the basis for establishing the actuary’s recommendations for the employer and employee contribution rates for the upcoming fiscal year to pay the expected future benefits.
SCERS has also retained an independent actuarial firm, Cheiron, to perform an actuarial audit of the June 30, 2016 actuarial valuation and actuarial experience study. A summary of Cheiron’s review is in the Actuarial Section on page 109 of this report.
As of June 30, 2017, the employers’ total pension liability was $10.681 billion, and the net pension liability (the total pension liability less the fiduciary net position) was $2.097 billion. The plan fiduciary net position as a percentage of the total pension liability was 80.4%. In general terms, this ratio means that as of June 30, 2017, SCERS had approximately 80 cents available for each dollar of anticipated future liability. As of June 30, 2016, the employers’ total pension liability was $9.436 billion, and the net pension liability (the total pension liability less the fiduciary net position) was $1.755 billion. The plan fiduciary net position as a percentage of the total pension liability was 81.4%.
The Required Supplementary Information presents additional information regarding the net pension liability and the Actuarial Section of this report provides additional actuarial funding information. Reserves
SCERS’ reserves are established in accordance with the requirements of the 1937 Act, utilizing contributions and the accumulation of investment income, after satisfying administrative and investment expenses. Under GASB Statement No. 67, investments are stated at fair value instead of cost and include the recognition of unrealized gains and losses. However, for actuarial funding purposes, SCERS utilizes a seven-year smoothing methodology under which a portion of the market gains and losses is recognized and allocated to the reserves through interest crediting. The difference between the market value of assets (equivalent to the net position restricted for pension benefits) and the smoothed actuarial value of assets is tracked in the market stabilization reserve.
Higher-than-expected investment performance increased SCERS’ market stabilization reserve from $(555.5) million as of June 30, 2016 to $(81.0) million as of June 30, 2017.
Financial Section | 26

managemenT’s disCussion and analysis (ConTinued)
NET POSITION RESTRICTED FOR BENEFITS AT FAIR VALUE AS OF JUNE 30(Dollar Amounts Expressed in Millions)
2017 2016 2015Employee reserves $796.9 $758.4 $727.0 Employer reserves 2,800.5 2,722 .1 2,621.6 Retiree reserves 5,004.3 4,658.7 4,393.3 Retiree death benefit reserves 16.6 16.1 15.8 Contingency reserve 46.9 81.1 81.1
Total allocated reserves and designations 8,665.2 8,236.4 7,838.8 Market stabilization reserve (81.0) (555.5) 40.0 Net position restricted for benefits, at fair value $8,584.2 $7,680.9 $7,878.8
Changes in Fiduciary Net Position - Pension Trust Fund
The following tables present the changes in fiduciary net position for the fiscal years ended June 30, 2017, 2016, and 2015, respectively.
CHANGE IN FIDUCIARY NET POSITIONFor the Fiscal Years Ended June 30
(Dollar Amounts Expressed in Millions)
2017 2016Increase/
(Decrease) % ChangeAdditionsEmployee contributions $89.5 $77.5 $12.0 15.5%Employer contributions 203.9 209.0 (5.1) (2.4)Net gain/(loss) from investment activities 1,137.8 (12.6) 1,150.4 9,130.2
Net income from securities lending 2.5 1.9 0.6 31.6
Other income/(expense) (7.5) (2.3) (5.2) 226.1Investment fees and expenses (83.9) (59.4) (24.5) 41.2
Total additions 1,342.3 214.1 1,128.2 527.0DeductionsWithdrawal of contributions 2.3 2.3 - -Administrative expenses 6.9 6.4 0.5 7.8Benefits paid 429.8 403.3 26.5 6.6
Total deductions 439.0 412.0 27.0 6.6Increase/(decrease) in net position 903.3 (197.9) 1,101.2 556.4Net position restricted for pension benefits, beginning 7,680.9 7,878.8 (197.9) (2.5)Net position restricted for pension benefits, ending $8,584.2 $7,680.9 $903.3 11.8%
Financial Section | 27
managemenT’s disCussion and analysis (ConTinued)
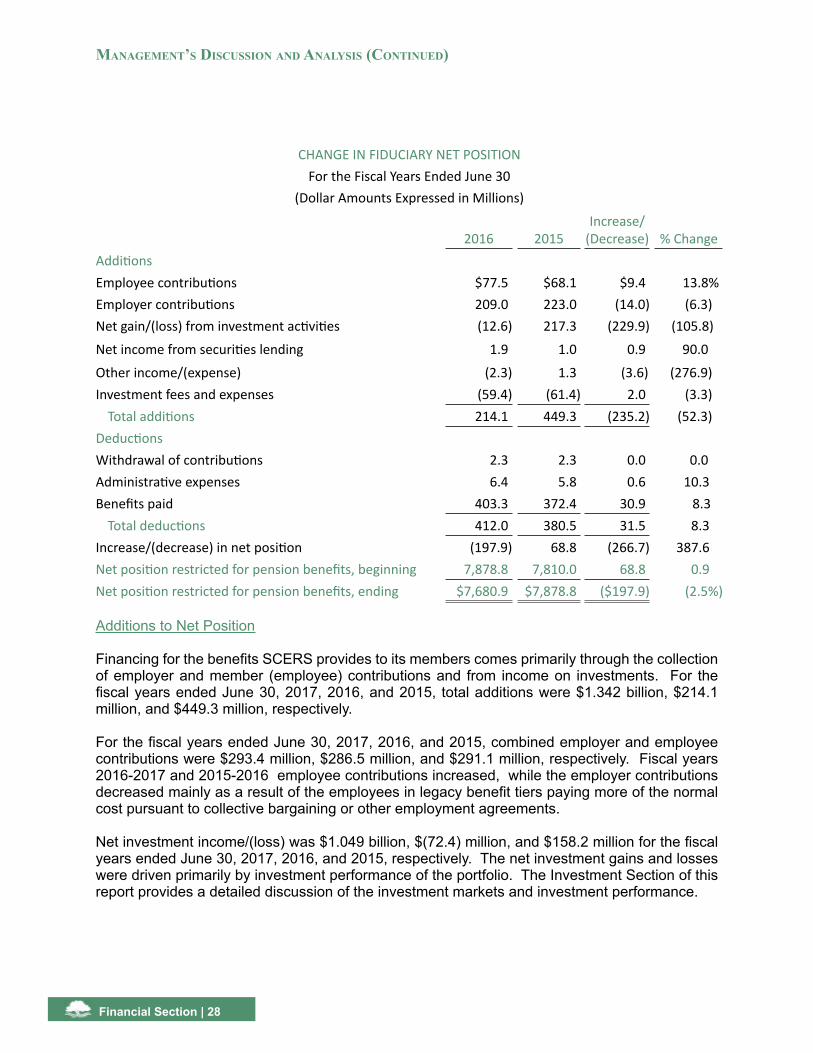
CHANGE IN FIDUCIARY NET POSITIONFor the Fiscal Years Ended June 30
(Dollar Amounts Expressed in Millions)
2016 2015Increase/
(Decrease) % ChangeAdditionsEmployee contributions $77.5 $68.1 $9.4 13.8%Employer contributions 209.0 223.0 (14.0) (6.3)Net gain/(loss) from investment activities (12.6) 217.3 (229.9) (105.8)
Net income from securities lending 1.9 1.0 0.9 90.0
Other income/(expense) (2.3) 1.3 (3.6) (276.9)Investment fees and expenses (59.4) (61.4) 2.0 (3.3)
Total additions 214.1 449.3 (235.2) (52.3)DeductionsWithdrawal of contributions 2.3 2.3 0.0 0.0Administrative expenses 6.4 5.8 0.6 10.3Benefits paid 403.3 372.4 30.9 8.3
Total deductions 412.0 380.5 31.5 8.3Increase/(decrease) in net position (197.9) 68.8 (266.7) 387.6Net position restricted for pension benefits, beginning 7,878.8 7,810.0 68.8 0.9Net position restricted for pension benefits, ending $7,680.9 $7,878.8 ($197.9) (2.5%)
Additions to Net Position
Financing for the benefits SCERS provides to its members comes primarily through the collection of employer and member (employee) contributions and from income on investments. For the fiscal years ended June 30, 2017, 2016, and 2015, total additions were $1.342 billion, $214.1 million, and $449.3 million, respectively.
For the fiscal years ended June 30, 2017, 2016, and 2015, combined employer and employee contributions were $293.4 million, $286.5 million, and $291.1 million, respectively. Fiscal years 2016-2017 and 2015-2016 employee contributions increased, while the employer contributions decreased mainly as a result of the employees in legacy benefit tiers paying more of the normal cost pursuant to collective bargaining or other employment agreements.
Net investment income/(loss) was $1.049 billion, $(72.4) million, and $158.2 million for the fiscal years ended June 30, 2017, 2016, and 2015, respectively. The net investment gains and losses were driven primarily by investment performance of the portfolio. The Investment Section of this report provides a detailed discussion of the investment markets and investment performance.
Financial Section | 28

managemenT’s disCussion and analysis (ConTinued)
Deductions from Net Position
SCERS’ net position was primarily used for the payment of benefits to members and their beneficiaries, for the payment of contribution refunds to terminated employees, and for the cost of administering the System. For the years ended June 30, 2017, 2016, and 2015, total deductions were $439.0 million, $412.0 million, and 380.5 million, respectively.
Deductions increased $27.0 million or 6.6% in the year ended June 30, 2017 and $31.5 million or 8.3% in the year ended June 30, 2016. The primary cause of the increase in deductions in both years was due to the increase in monthly benefit payments resulting from an increase in the number of retired members and the annual cost-of-living adjustment paid to retirees and beneficiaries.
The Board of Retirement approves SCERS’ annual administrative budget. The 1937 Act limits SCERS’ annual administrative expenses, excluding the costs of administration for computer software and hardware and computer technology consulting services (IT costs), to twenty-one hundredths of one percent (0.21%) of the System’s actuarial accrued liability. Administrative expenses of $6.0 million for the fiscal year ended June 30, 2017 and $5.5 million for the fiscal year ended June 30, 2016, excluding IT costs, were 0.06% of the System’s actuarial accrued liability. SCERS’ administrative expenses have historically been below the limitation. SCERS’ FIDUCIARY RESPONSIBILITIES
SCERS’ Board of Retirement and management staff are fiduciaries of the pension trust fund. Under the California Constitution and California state law, the net position must be used exclusively for the benefit of plan participants and their beneficiaries.
REQUESTS FOR INFORMATION
This report is designed to provide the Board of Retirement, SCERS members, participating employers, taxpayers, and other stakeholders and interested parties with a general overview of SCERS’ finances and to show accountability for the money SCERS receives.
Questions about this report or requests for additional financial information may be addressed to:
Sacramento County Employees’ Retirement System980 9th Street, Suite 1900Sacramento, CA 95814
Copies of this report are available at the above address and on the System’s web site at www.scers.org.
Financial Section | 29

s T a T e m e n T s o f f i d u C i a r y n e T P o s i T i o n
Financial Section | 30
PENSION TRUST FUNDAS OF JUNE 30, 2017 AND 2016
(Dollar Amounts Expressed in Thousands)
2017 2016Assets
Cash and short-term investmentsCash invested with Sacramento County Treasurer $4,065 $9,316 Other cash and cash equivalents 32,268 80,211 Short-term investments with fiscal agents 207,129 326,914
Total cash and short-term investments 243,462 416,441
Receivables
Employee and employer contributions 4,508 8,073 Accrued investment income 15,589 17,917 Securities sold 42,467 113,982
Total receivables 62,564 139,972
Investments, at fair valueDomestic equity 1,975,845 2,035,218 International equity 2,123,935 1,380,130 U.S. government and agency securities 531,534 492,250 Domestic fixed income 920,136 937,418 International fixed income 148,639 126,189 Real assets 1,123,888 973,077
Real assets - mortgages payable (63,500) (63,500)Absolute return 766,986 724,682 Private equity 693,885 537,706 Opportunities 176,176 165,182 Securities lending collateral 352,234 422,520
Total investments, at fair value 8,749,758 7,730,872
Other assets 501 378
Total assets 9,056,285 8,287,663
LiabilitiesWarrants payable 903 962 Accounts payable and other accrued liabilities 28,026 38,485 Investments purchased payable 90,897 144,831 Securities lending liability 352,234 422,520
Total liabilities 472,060 606,798
Net position restricted for pension benefits $8,584,225 $7,680,865
The notes to the basic financial statements are an integral part of these statements.

s T a T e m e n T s o f C h a n g e s i n f i d u C i a r y n e T P o s i T i o n
PENSION TRUST FUNDFOR THE FISCAL YEARS ENDED JUNE 30, 2017 AND 2016
(Dollar Amounts Expressed in Thousands)
2017 2016Additions
ContributionsEmployee $89,489 $77,494 Employer 203,928 209,020
Total contributions 293,417 286,514 Investment income
From investment activitiesNet appreciation/(depreciation) in investment fair value: Securities 707,836 (179,823) Real assets 69,432 1,126 Absolute return 66,922 (24,123) Private equity 9,999 26,693 Opportunities 95,857 4,652 Interest 41,833 38,302 Dividends 78,909 77,392 Real assets 29,309 23,708 Private equity 13,854 8,989 Opportunities 23,812 10,525 Net gain/(loss) from investment activities 1,137,763 (12,559)
From securities lending activitiesSecurities lending income 3,881 1,805 Securities lending expense
Borrower rebate income/(expense) (605) 539 Securities lending management fees (751) (489)
Net income from securities lending 2,525 1,855 Other expense (7,464) (2,317) Investment fees and expenses (83,909) (59,378)
Net investment income/(loss) 1,048,915 (72,399)
Total additions 1,342,332 214,115
DeductionsWithdrawal of contributions 2,312 2,346 Administrative expenses 6,906 6,362 Benefits paid 429,754 403,356
Total deductions 438,972 412,064
Net increase/(decrease) 903,360 (197,949)
Net position restricted for pension benefits, beginning 7,680,865 7,878,814
Net position restricted for pension benefits, ending $8,584,225 $7,680,865
The notes to the basic financial statements are an integral part of these statements.
Financial Section | 31

AGENCY FUNDAS OF JUNE 30, 2017 AND 2016
(Dollar Amounts Expressed in Thousands)
2017 2016
AssetsAccounts receivable $28 $47
Total assets $28 $47
LiabilitiesAccounts payable $28 $47
Total liabilities $28 $47
The notes to the basic financial statements are an integral part of these statements.
s T a T e m e n T s o f f i d u C i a r y n e T P o s i T i o n
Financial Section | 32

n o T e s T o T h e b a s i C f i n a n C i a l s T a T e m e n T s
NOTE 1 - PLAN DESCRIPTION
The Sacramento County Employees’ Retirement System (SCERS or the System) is a cost-sharing multiple-employer public employee retirement system which operates under the County Employees Retirement Law of 1937 (Section 31450 et seq. of the California Government Code) and the California Public Employees’ Pension Reform Act of 2013 (CalPEPRA). The System was created by resolution of the Sacramento County (the County) Board of Supervisors on July 1, 1941, to provide retirement, disability, and death benefits for qualified employees of Sacramento County and participating Special Districts (Special Districts or Member Districts). SCERS is governed by a nine member Board of Retirement. Four are appointed by the County Board of Supervisors; four are elected by the members of the System (two by the Miscellaneous members, one by the Safety members and one by the Retiree members); and the County Director of Finance serves as an Ex-Officio member. An alternate Safety member and an alternate Retiree member are also elected by those respective member groups. The System is legally and fiscally independent of the County.
At June 30, 2017 and 2016, participating local government employers consisted of the County of Sacramento; Superior Court of California, County of Sacramento (Superior Court); and eleven Special Districts.
The System’s membership consists of the following categories:
• Safety Tier 1 - Includes employees whose principal duties consist of law enforcement or fire suppression work or who occupy positions designated by law as safety positions and who have a membership start-date prior to June 25, 1995.
• Safety Tier 2 - Includes employees whose principal duties consist of law enforcement or fire suppression work or who occupy positions designated by law as safety positions and who have a membership start-date on or after June 25, 1995 but prior to January 1, 2012.
• Safety Tier 3 - Includes employees whose principal duties consist of law enforcement or fire suppression work or who occupy positions designated by law as safety positions and who have a membership start-date on or after January 1, 2012 but prior to January 1, 2013.
• Safety Tier 4 - Includes employees whose principal duties consist of law enforcement or fire suppression work or who occupy positions designated by law as safety positions and who have a membership start-date on or after January 1, 2013.
• Miscellaneous Tier 1 - Includes all members other than Safety who have a membership start-date prior to September 27, 1981.
• Miscellaneous Tier 2 - Includes all members other than Safety who have a membership start-date on or after September 27, 1981 and prior to June 27, 1993 and who elected not to become members of Miscellaneous Tier 3.
• Miscellaneous Tier 3 - Includes all members other than Safety who have a membership start-date on or after June 27, 1993, and those Miscellaneous Tier 2 members who elected to become members of this class. The Miscellaneous Tier 3 is closed to employees of Sacramento County who have a membership start-date on or after January 1, 2012.
• Miscellaneous Tier 4 - Includes members other than Safety who are employees of Sacramento County and have a membership start-date on or after January 1, 2012 but prior to January 1, 2013.
• Miscellaneous Tier 5 - Includes all members other than Safety who have a membership start-date on or after January 1, 2013.
Financial Section | 33

At June 30, 2017 and 2016, the System’s membership consisted of:
Current Members: 2017 2016
Vested
Miscellaneous Tier 1 65 83
Miscellaneous Tier 2 57 62
Miscellaneous Tier 3 7,101 7,548
Miscellaneous Tier 4 88 10
Miscellaneous Tier 5 16 10
Total Miscellaneous 7,327 7,713
Safety Tier 1 166 218
Safety Tier 2 1,280 1,325
Safety Tier 3 64 30
Safety Tier 4 33 10
Total Safety 1,543 1,583
Total Vested 8,870 9,296
Non-Vested
Miscellaneous Tier 3 105 198
Miscellaneous Tier 4 274 318
Miscellaneous Tier 5 2,871 2,134
Total Miscellaneous 3,250 2,650
Safety Tier 2 5 12
Safety Tier 3 48 72
Safety Tier 4 414 363
Total Safety 467 447
Total Non-Vested 3,717 3,097
Total Current Members 12,587 12,393
Financial Section | 34
noTes To The basiC finanCial sTaTemenTs (ConTinued)(Dollar Amounts Expressed in Thousands)

Retirees and beneficiaries currently receiving benefits: 2017 2016
Miscellaneous - Service 7,456 7,148
Miscellaneous - Beneficiary 1,203 1,176
Miscellaneous - Nonservice-Connected Disability 284 287
Miscellaneous - Service-Connected Disability 182 177
Total Miscellaneous 9,125 8,788
Safety - Service 1,647 1,562
Safety - Beneficiary 373 357
Safety - Nonservice-Connected Disability 17 17
Safety - Service-Connected Disability 234 236
Total Safety 2,271 2,172
Total Retirees and Beneficiaries 11,396 10,960
Terminated employees entitled to benefits but not yet receiving them*:
Miscellaneous Tier 1 45 48
Miscellaneous Tier 2 154 170
Miscellaneous Tier 3 2,374 2,343
Miscellaneous Tier 4 75 63
Miscellaneous Tier 5 336 221
Total Miscellaneous 2,984 2,845
Safety Tier 1 61 77
Safety Tier 2 347 356
Safety Tier 3 9 6
Safety Tier 4 24 17
Total Safety 441 456
Total Terminated Members 3,425 3,301
Grand Total 27,408 26,654
*Includes terminated members due a refund of member contributions.
Financial Section | 35
noTes To The basiC finanCial sTaTemenTs (ConTinued)(Dollar Amounts Expressed in Thousands)

noTes To The basiC finanCial sTaTemenTs (ConTinued)(Dollar Amounts Expressed in Thousands)
Pension Benefits
The System’s benefits are established by the provisions of the County Employees Retirement Law of 1937 and CalPEPRA and provide for retirement, death, and disability benefits. All permanent full-time and part-time employees of the County, Superior Court and Member Districts are eligible to participate in the System. Upon reaching five years of service, participants have earned the right to receive a retirement benefit, subject to certain restrictions if retirement is prior to attaining age 50 or if less than 10 years of service has been achieved for Miscellaneous Tiers 1, 2, 3 and 4 and Safety Tiers 1, 2, and 3, or prior to attaining age 52 or if less than 5 years of service has been achieved for Miscellaneous Tier 5, or prior to attaining age 50 or if less than 5 years of service has been achieved for Safety Tier 4.
Effective June 29, 2003, the County Board of Supervisors adopted new benefit formulas for all SCERS members, including the employees of Member Districts, for service credit prospectively from June 29, 2003, and for County employees, retroactively to service credit which precedes that date. In accordance with applicable retirement law, each SCERS Member District’s governing body determined whether or not to apply these formulas retroactively for service credit earned prior to June 29, 2003 by their employees.
Retirement benefits under Safety Tiers 1 and 2 and Miscellaneous Tiers 1, 2 and 3 are as follows:
• Members covered under Safety Tier 1 who retire at age 50, or thereafter, are entitled to a retirement benefit, payable monthly for life, equal to 3 percent of their final-average salary for each year of credited service. This benefit includes a cost-of-living adjustment of up to 4 percent annually. Final-average salary is the member’s average salary for the highest twelve consecutive months of credited service.
• Members covered under Safety Tier 2 who retire at age 50, or thereafter, are entitled to a retirement benefit, payable monthly for life, equal to 3 percent of their final-average salary for each year of credited service. This benefit includes a cost-of-living adjustment of up to 2 percent annually. Final-average salary is the member’s average salary for the highest thirty-six consecutive months of credited service.
• Members covered under Miscellaneous Tier 1 who retire at age 50 are entitled to a retirement benefit, payable monthly for life, which is equal to 1.48 percent of their final-average salary for each year of credited service. This benefit includes a cost-of-living adjustment of up to 4 percent annually. Final-average salary is the member’s average salary for the highest twelve consecutive months of credited service.
• Members covered under Miscellaneous Tier 2 who retire at age 50 are entitled to a retirement benefit, payable monthly for life, equal to 1.48 percent of their final-average salary for each year of credited service. There is no cost-of-living adjustment. Final-average salary is the member’s average salary for the highest thirty-six consecutive months of credited service.
• Members covered under Miscellaneous Tier 3 who retire at age 50 are entitled to a retirement benefit, payable monthly for life, equal to 1.48 percent of their final-average salary for each year of credited service. This benefit includes a cost-of-living adjustment of up to 2 percent annually. Final-average salary is the member’s average salary for the highest thirty-six consecutive months of credited service.
The retirement benefits of Miscellaneous Tiers 1, 2, and 3 members who retire after age 50 are increased by an age factor for each quarter year of age up to a maximum of 2.61 percent of final-average salary for each year of credited service at age 62.
Members whose employers determined not to retroactively apply the formulas to service credit earned prior to June 29, 2003 will continue to have their retirement benefits for that service calculated pursuant to the formulas in effect at the time the service was earned (i.e., Safety and Miscellaneous members who retire at age 50 earn 2 percent and 1.1 percent, respectively, of their final-average salary for each year of credited service).
Financial Section | 36

noTes To The basiC finanCial sTaTemenTs (ConTinued)(Dollar Amounts Expressed in Thousands)
Effective January 1, 2012, the County Board of Supervisors adopted new tiers for County employees hired on or after January 1, 2012, but before January 1, 2013. Retirement benefits under these tiers are as follows:
• Members covered under Safety Tier 3 who retire at age 50 are entitled to a retirement benefit, payable monthly for life, equal to 2.29 percent of their final-average salary for each year of credited service. This benefit includes a cost-of-living adjustment of up to 2 percent annually. Final-average salary is the member’s average salary for the highest thirty-six consecutive months of credited service.
• Members covered under Miscellaneous Tier 4 who retire at age 50 are entitled to a retirement benefit, payable monthly for life, equal to 1.18 percent of their final-average salary for each year of credited service. This benefit includes a cost-of-living adjustment of up to 2 percent annually. Final-average salary is the member’s average salary for the highest thirty-six consecutive months of credited service.
The retirement benefits of Safety Tier 3 members who retire after age 50 are increased by an age factor for each quarter year of age up to a maximum of 3 percent of final-average salary for each year of credited service at age 55. The retirement benefits of Miscellaneous Tier 4 members who retire after age 50 are increased by an age factor for each quarter year of age up to a maximum of 2.43 percent of final-average salary for each year of credited service at age 65.
Effective January 1, 2013, with the implementation of CalPEPRA, the County Board of Supervisors adopted new tiers for employees of the County, Superior Court and Member Districts who are eligible to participate in the System and who were hired on or after January 1, 2013. Retirement benefits under these new tiers are as follows:
• Members covered under Safety Tier 4 who retire at age 50 are entitled to a retirement benefit, payable monthly for life, equal to 2 percent of their final-average salary for each year of credited service. This benefit includes a cost-of-living adjustment of up to 2 percent annually. Final-average salary is the member’s average salary for the highest thirty-six consecutive months of credited service.
• Members covered under Miscellaneous Tier 5 who retire at age 52 are entitled to a retirement benefit, payable monthly for life, equal to 1 percent of their final-average salary for each year of credited service. This benefit includes a cost-of-living adjustment of up to 2 percent annually. Final-average salary is the member’s average salary for the highest thirty-six consecutive months of credited service.
The retirement benefits of Safety Tier 4 members who retire after age 50 are increased by an age factor for each quarter year of age up to a maximum of 2.7 percent of final-average salary for each year of credited service at age 57. The retirement benefits of Miscellaneous Tier 5 members who retire after age 52 are increased by an age factor for each quarter year of age up to a maximum of 2.5 percent of final-average salary for each year of credited service at age 67.
Member Termination
Upon separation from employment with a participating employer, members’ accumulated contributions are refundable with interest accrued through the prior six-month period ended June 30 or December 31. Interest on member accounts is credited semiannually on June 30 and December 31. Withdrawal of such accumulated contributions results in forfeiture of the related benefits.
Financial Section | 37
Financing
Benefits payable by the System are financed through member contributions, employer contributions, and earnings from investments. Member contributions are required by law. Contribution rates, which are actuarially determined, are based on age at entry into the System (a single rate is used for members entering the System after January 1, 1975). County, Superior Court and Member Districts’ contributions are actuarially determined to provide for the balance of contributions needed. All contribution rates are reviewed and revised annually. The authority for both benefit provisions and contribution obligations is derived from the County Employees Retirement Law of 1937 and CalPEPRA.
NOTE 2 – SUMMARY OF SIGNIFICANT ACCOUNTING POLICIES AND PLAN ASSET MATTERS
SCERS reports fiduciary funds at June 30, 2017 and 2016 which include pension trust and agency funds. The pension trust fund is used to report resources that are required to be held in trust for the members and the beneficiaries of the defined benefit pension plan, and the agency fund accounts for assets held by SCERS in a custodial capacity or as an agent on behalf of the participating employers to fund the Retiree Medical and Dental Insurance Program. See Note 8 for a detailed description of the program. The pension trust fund is accounted for on a flow of economic resources measurement focus and the accrual basis of accounting. The agency fund is custodial in nature and does not measure the results of operations. Assets and liabilities are recorded using the accrual basis of accounting.
Basis of Accounting
The accompanying financial statements have been prepared in accordance with accounting principles generally accepted in the United States of America and reporting guidelines set forth by the Governmental Accounting Standards Board (GASB). The major pronouncements that prescribe the System’s defined benefit pension plan are GASB Statements No. 31, 40, 51, 53, 67, 72, and 82.
Valuation of Investments
The majority of the investments held at June 30, 2017 and 2016 are in the custody of, or controlled by, State Street Bank, the System’s custodian. The System’s investment portfolio consists of domestic and international equities, domestic and international fixed income, real assets, absolute return, private equity, and opportunities. The diversity of the System’s investment portfolio requires a wide range of techniques to determine fair value. Investments are valued at their fair value in accordance with GASB Statement No. 72, Fair Value Measurement and Application, which results in the recognition of fair value gains and losses. The overall valuation processes and information sources by major asset classifications are presented in Note 3.
Contributions and Benefits
Employee and employer contributions are recognized when due pursuant to statutory requirements. Benefits and refunds are recognized when the benefits are currently due and payable in accordance with the terms of the plan.
Income and Expenses
Interest income is recognized as it accrues. Dividend income is recognized when the dividends are declared. Realized gains and losses and unrealized gains and losses on investments are combined and reported together as the net appreciation (depreciation) in the fair value of investments. Expenses are recorded when the corresponding liabilities are incurred, regardless of when payment is made. Investment purchases and sales are recorded on the trade date, not the settlement date.
noTes To The basiC finanCial sTaTemenTs (ConTinued)(Dollar Amounts Expressed in Thousands)
Financial Section | 38
noTes To The basiC finanCial sTaTemenTs (ConTinued)(Dollar Amounts Expressed in Thousands)
Securities Lending
Securities lending transactions are short-term collateralized loans of the System’s securities for the purpose of generating additional investment income. For each lending transaction, the System receives either cash collateral or non-cash collateral. The underlying securities out on loan are reported on the System’s statements of fiduciary net position as if the lending transactions had not occurred. Cash collateral received for the loaned securities is reported as securities lending liability on the statements of fiduciary net position. Cash collateral is reinvested in the lending agent’s cash collateral investment pool and is valued at fair value and is reported as securities lending collateral on the statement of fiduciary net position. Non-cash collateral held is not reported on the statements of fiduciary net position nor is there a corresponding liability reported on these financial statements as the System does not have the ability to pledge or sell them without a borrower default. Note 3 - Cash and Investments discloses the amount of securities lending non-cash collateral.
Other Assets Other assets consist of other accounts receivable, prepaid expenses, net capital assets, and security deposits.
Administrative Expenses
Administrative costs are financed through employer and employee contributions and earnings from investments.
Estimates
The preparation of financial statements in conformity with accounting principles generally accepted in the United States of America requires management to make estimates and assumptions that affect certain reported amounts and disclosures. Accordingly, actual results may differ from those estimates.
Reclassification
Certain reclassifications have been made to June 30, 2016 balances to conform to the presentation as of and for the fiscal year ended June 30, 2017.
NOTE 3 - CASH AND INVESTMENTS
SECTION 1: INVESTMENT POLICIES
Article XVI, Section 17 of the Constitution of the State of California provides that “...notwithstanding any other provisions of law or this Constitution, the Retirement Board of a public pension or retirement system shall have plenary authority and fiduciary responsibility for investment of monies and administration of the system...” Article XVI, Section 17(a) further provides that “...the Retirement Board of a public pension or retirement system shall have sole and exclusive fiduciary responsibility over the assets…”The investment authority for the System rests primarily through the “prudent person rule,” as set forth in Section 31595 of the County Employees Retirement Law of 1937, which establishes a standard for all fiduciaries, including anyone with investment authority on behalf of the System.
Financial Section | 39

noTes To The basiC finanCial sTaTemenTs (ConTinued)(Dollar Amounts Expressed in Thousands)
Asset Allocation
SCERS maintains an overall investment policy designed to achieve a diversified investment portfolio. An integral part of the investment policy is the strategic asset allocation, which is designed to provide an optimal mix of asset classes with return expectations that correspond to expected liabilities. The strategic asset allocation also emphasizes maximum diversification of the portfolio to protect the System from the possibility that a particular asset class may experience poor investment performance in a given period. The System’s adopted asset allocation policy as of June 30, 2017 and 2016 is as follows:
Asset Class Target Allocation
Domestic equities 22.5%International equities 22.5Fixed income 20.0Real assets 15.0Absolute return 10.0Private equity 10.0Opportunities 0.0Total 100.0%
SECTION 2: INVESTMENT SUMMARY
Cash Invested with Sacramento County Treasurer
The System invests cash held for benefit payments and general operations in the County Treasurer’s pool. The County Treasury Oversight Committee is responsible for regulatory oversight of the pool. The System’s share of the County Treasurer’s pool is separately accounted for, and interest earned, net of related expenses, is apportioned quarterly based on the proportion of the System’s average daily cash balance to the total of the pooled cash and investments.
Cash deposited in the Sacramento County Treasurer’s pool is stated at fair value. The value of the System’s pool shares is determined on an amortized cost basis, which approximates fair value. The fair value of the System’s cash invested with the County Treasurer totaled $4,065 and $9,316 at June 30, 2017 and 2016, respectively. The pool was not rated, and the weighted-average maturity of the pool was 277 days and 254 days at June 30, 2017 and 2016, respectively.
Interest earned but not received from the County Treasurer at year end is reported as a component of accrued investment income on the statements of fiduciary net position. Cash and investments included within the County Treasurer’s pool are described in the County’s Comprehensive Annual Financial Report.
Other Cash and Cash Equivalents
At June 30, 2017 and 2016, other cash and cash equivalents constituted balances in bank demand deposit accounts of $32,268 and $80,211, respectively.
Financial Section | 40
noTes To The basiC finanCial sTaTemenTs (ConTinued)(Dollar Amounts Expressed in Thousands)
Short-Term Investments with Fiscal Agents
Short-term investments, which include highly-liquid investments expected to be utilized by the System within 30-90 days, are reported at fair value. These investments may include securities that have a maturity in excess of 90 days but are readily marketable. At June 30, 2017 and 2016, the fair value of the System’s short-term investments with fiscal agents was $207,129 and $326,914, respectively. These totals consisted of investments in the State Street Short-Term Investment Fund (STIF). The STIF is designed to provide qualified benefit plans with an investment vehicle that may be accessed on a daily basis. The STIF is limited to investing in securities that are rated A-1 by Moody’s Investors Services and P-1 by Standard & Poor’s Corporation (S&P) at the time of issuance. The STIF is not rated by credit rating agencies. Most investments range in maturity from overnight to 90 days with up to 20% of the STIF’s value eligible for investment between 90 days and 13 months. For the fiscal years ended June 30, 2017 and 2016, the weighted-average maturities were 24 days. Investments in the STIF from all participating custodial clients of State Street were $66.8 billion and $63.9 billion on June 30, 2017 and 2016, respectively.
Fair Value of Investments
The System measures and records its investments using fair value measurement guidelines established by U.S. generally accepted accounting principles (GAAP). These guidelines recognize a three-tiered fair value hierarchy, as follows:
• Level 1: Quoted prices for identical investments in active markets;• Level 2: Observable inputs other than quoted market prices; and,• Level 3: Unobservable inputs.
Financial Section | 41

noTes To The basiC finanCial sTaTemenTs (ConTinued)(Dollar Amounts Expressed in Thousands)
The System had the following recurring fair value measurements at June 30, 2017 and 2016.
June 30, 2017 Fair Value Measurements by Using
Total
Quoted Prices in Active Markets for
Identical Assets (Level 1)
Significant Other Observable Inputs
(Level 2)
Significant Unobservable
Inputs (Level 3)
Equity SecuritiesConsumer Discretionary $480,657 $480,657 $- $- Consumer Staples 266,276 266,276 - - Energy 192,668 192,668 - - Financials 557,104 557,104 - - Health Care 399,789 399,789 - - Industrials 428,558 428,558 - - Information Technology 500,804 500,804 - - Materials 164,585 164,585 - - Real Estate 281,548 281,548 - - Telecommunication Services 49,253 49,253 - - Utilities 103,306 103,306 - - Others 2,835 2,835
Total Equity Securities 3,427,383 3,427,383 - -
Fixed Income SecuritiesSecuritized Obligations
Asset-Backed Securities 134,009 - 134,009 - Collateralized Mortgage-Backed Securities 22,180 - 22,180 -
Credit ObligationsCorporate Bonds 360,076 605 348,550 10,921Municipals 9,866 - 9,866 - Yankee 40,050 - 40,050 -
U.S. Government & Agency ObligationsAgency Securities 8,112 - 8,112 - U.S. Treasury 307,547 - 307,547 -
International Government 5,014 - 5,014 - Collateralized Mortgage Obligations 104,463 - 104,463 - Mortgage Pass-Through
FHLMC 66,061 - 66,061 - FNMA 99,417 - 99,417 - GNMA 50,397 - 50,397 -
Total Fixed Income Securities 1,207,192 605 1,195,666 10,921
Real Assets - Direct Holdings 307,294 - - 307,294 Mortgages Payable (63,500) - - (63,500)
Total Real Assets - Direct Holdings 243,794 - - 243,794
Collateral from Securities Lending 352,234 - 352,234Total Investments by Fair Value Level 5,230,603 $3,427,988 $1,547,900 $254,715
Financial Section | 42

noTes To The basiC finanCial sTaTemenTs (ConTinued)(Dollar Amounts Expressed in Thousands)
Investments Measured at the Net Asset Value (NAV)
Fair Value Unfunded
Commitments
Redemption Frequency
(If Currently Eligible)
Redemption Notice Period
Public Equity Commingled Funds $672,397 $- Daily, monthly 1 - 60 daysAbsolute Return 766,986 2,000 Monthly, quarterly 30 - 90 daysFixed Income Securities Commingled Funds 393,117 - Daily, monthly 1 - 60 daysReal Assets 816,594 377,341Private Equity 693,885 534,741Opportunities 176,176 151,654
Total Investments Measured at the NAV 3,519,155
Total Investments* $8,749,758
* Total investments exclude Rights and Warrants, which are presented in the Investment Derivative Instruments section and are excluded from disclosures.
June 30, 2017 Fair Value Measurements by Using
Investment Derivative Instruments Total
Quoted Prices in Active Markets for
Identical Assets (Level 1)
Significant Other Observable Inputs
(Level 2)
Significant Unobservable
Inputs (Level 3)
AssetsForwards $1,309 $1,309 $- $- Options 425 - 425 - Rights/Warrants 69 69 - - Swaps 1,297,608 - 1,297,608 -
LiabilitiesForwards (2,736) (2,476) (260) - Options (266) - (266) - Rights/Warrants - - - - Swaps (1,295,958) - (1,295,958) -
Total Investment Derivative Instruments $451 ($1,098) $1,549 $-
Financial Section | 43

June 30, 2016 Fair Value Measurements Using
Total
Quoted Prices in Active Markets for
Identical Assets (Level 1)
Significant Other Observable Inputs
(Level 2)
Significant Unobservable
Inputs (Level 3)
Equity SecuritiesConsumer Discretionary $370,294 $370,294 $- $- Consumer Staples 230,298 230,298 - - Energy 191,111 191,111 - - Financials 727,440 727,440 - - Health Care 307,763 307,763 - - Industrials 304,061 304,061 - - Information Technology 396,359 396,359 - - Materials 122,585 122,585 - - Private Placement 2,252 2,252 - - Telecommunication Services 80,713 80,713 - - Utilities 90,647 90,647 - - Others 497 497 - - Total Equity Securities 2,824,020 2,824,020 - -
Fixed Income Securities Securitized Obligations
Asset-Backed Securities 150,235 - 150,235 - Collateralized Mortgage-Backed Securities 72,789 403 72,386 -
Credit ObligationsCorporate Bonds 379,797 - 370,984 8,813 Municipals 7,860 - 7,860 - Yankee 28,642 - 28,642 -
U.S. Government & Agency Obligations Agency Securities 9,883 - 9,883 - U.S. Treasury 267,998 - 267,998 -
International Government 8,450 - 8,450 - Collateralized Mortgage Obligations 55,615 - 55,615 - Mortgage Pass-Through
FHLMC 68,262 - 68,262 - FNMA 104,311 - 104,311 - GNMA 41,796 - 41,796 - Total Fixed Income Securities 1,195,638 403 1,186,422 8,813
Real Assets - Direct Holdings 353,180 - - 353,180 Mortgages payable (63,500) - - (63,500)
Total Real Assets - Direct Holdings 289,680 - - 289,680 Collateral from Securities Lending 422,520 - 422,520 - Total Investments by Fair Value Level 4,731,858 $2,824,423 $1,608,942 $298,493
noTes To The basiC finanCial sTaTemenTs (ConTinued)(Dollar Amounts Expressed in Thousands)
Financial Section | 44

Investments Measured at Net Asset Value (NAV)
Fair Value Unfunded
Commitments
Redemption Frequency
(If Currently Eligible)
Redemption Notice Period
Public Equity Commingled Funds $591,279 $- Daily, monthly 1 - 60 days
Absolute Return 724,682 3,205 Monthly, quarterly 30 - 90 days
Fixed Income Securities Commingled Funds 360,219 - Daily, monthly 1 - 60 days
Real Assets 619,897 516,593
Private Equity 537,706 545,155
Opportunities 165,182 157,199
Total Investments Measured at NAV 2,998,965
Total Investments* $7,730,823
* Total investments exclude Rights, which are presented in the Investment Derivative Instruments section below and are excluded from disclosures.
June 30, 2016 Fair Value Measurements Using
Investment Derivative Instruments Total
Quoted Prices in Active Markets for
Identical Assets (Level 1)
Significant Other Observable Inputs
(Level 2)
Significant Unobservable
Inputs (Level 3)
AssetsForwards $10,428 $2,543 $7,885 $- Rights 49 49 - - Swaps 680,942 - 680,942 -
LiabilitiesForwards (13,268) (2,944) (10,324) - Swaps (700,991) - (700,991) - Total Investment Derivative Instruments ($22,840) ($352) ($22,488) $-
noTes To The basiC finanCial sTaTemenTs (ConTinued)(Dollar Amounts Expressed in Thousands)
Financial Section | 45

noTes To The basiC finanCial sTaTemenTs (ConTinued)(Dollar Amounts Expressed in Thousands)
Equity SecuritiesThe majority of the System’s domestic and international equity securities are actively traded on major stock exchanges or over-the-counter. Investments listed or traded on a securities exchange are valued at fair value as of the close of trading on the valuation day. Fair value is determined based on the last reported trade price on the exchange considered to be the primary market for such security. Listed investments that are not traded on a particular day are valued at the last known price which is deemed best to reflect their fair value. Equity securities classified in Level 1 are valued using prices quoted in active markets for those securities.
Fixed Income SecuritiesDebt securities consist of investments in customized separate accounts and commingled funds which primarily invest in negotiable obligations of the U.S. Government and U.S. Government-sponsored agencies, U.S. and non-U.S. corporations, securitized offerings backed by residential and commercial mortgages, and non-dollar denominated sovereign states. Debt securities that are not actively traded are valued by pricing vendors, which use modeling techniques that include market observable inputs required to develop a fair value, are classified in Level 2. Typical inputs include recent trades, yields, price quotes, cash flows, maturity, credit ratings and other assumptions based upon the specifics of the asset type.
Real Assets - Direct Real Estate HoldingsDirect investments in real estate include offices, apartments, retail and industrial properties, which are classified in Level 3. Properties owned directly are subject to annual independent third party appraisals performed in accordance with the Uniform Standards of Professional Appraisal Practice. The fair value for each property is calculated by discounting the future cash flows (including the projected sales proceeds), using an appropriate discount rate. The significant unobservable inputs used in the fair value measurement of the investments in real estate are discount rate, exit capitalization rates, and revenue growth rates. These rates are based on the location, type and nature of each property, and current and anticipated market conditions, which are derived from appraisers, industry publications and from the experience of the advisor’s valuations, acquisitions, asset management and capital markets departments. Certain real estate investments are leveraged, and the loan amount is recorded in the statements of fiduciary net position. Refer to Note 9 for disclosures regarding mortgage obligations. As of June 30, 2017 and 2016, total Level 3 real asset investments were $307,294 and $353,180 respectively. In the opinion of management, the reported amounts fairly represent the estimated fair value as of June 30, 2017 and 2016. However, the estimated fair value may differ significantly from that which could be realized in the marketplace.
Investment Derivative InstrumentsThe fair values of derivative contracts can be affected by changes in interest rates, foreign exchange rates, commodity prices, credit spreads, market volatility, expected return, liquidity and other factors. The majority of the System’s derivative instruments are traded in the over-the-counter (OTC) derivative market and are classified within Level 2. OTC derivatives classified within Level 2 are valued using models that utilize actively quoted or observable market input values from external market data providers, third-party pricing vendors and/or recent trading activity. The fair values of OTC derivatives for swaps and forward contracts are determined using discounted cash flow models. The fair values of option contracts and warrants are determined using Black-Scholes option pricing models. These models’ key inputs include the contractual terms of the respective contract along with significant observable inputs, including interest rates, currency rates, credit spreads, equity prices, index dividend yield, volatility and other factors. The fair value of rights is calculated using the same parameters used for pricing options, including the rights’ subscription price, prevailing interest rates, time to expiration, and the share price of the underlying stock, taking into consideration the level of its volatility. Futures positions are settled in cash on a daily basis and thus have no fair value.
Financial Section | 46

noTes To The basiC finanCial sTaTemenTs (ConTinued)(Dollar Amounts Expressed in Thousands)
Investments Measured at the Net Asset Value (NAV)Investments valued using the net asset value (NAV) per share (or its equivalent) are investments in non-governmental pooled investment vehicles (i.e., limited partner or non-managing member interest (LP/LLC Interest). These alternative investments, unlike more traditional investments, generally do not have readily obtainable market values and are generally valued at the most recent net asset value per unit or based on capital account information available from the general partners of such vehicles. If June 30 valuations are not available, the value is progressed from the most recently available valuation taking into account subsequent calls and distributions.
Absolute ReturnAbsolute return investments are made both on a direct basis in limited partnerships, commingled funds, and separate accounts, and through externally managed customized separate accounts (CSA). Each CSA manager’s investments consist of portfolio funds and co-investments as well as marketable securities held from time to time as a result of a distribution from a portfolio fund.
As of June 30, 2017, this category of investment includes limited partnerships, commingled funds and customized separate accounts that invest in domestic and international investment strategies including: (1) Market neutral strategies such as equity or fixed income market neutral, fixed income arbitrage, and convertible bond arbitrage; (2) Event driven strategies such as risk arbitrage, merger arbitrage, distressed debt, credit and other event-drivenstrategies; (3) Equity and credit long/short strategies where there is a combination of longand short positions primarily in exchange traded securities, with a net market exposure lessthan 100% of that of the overall equity or fixed income market. Strategies may be focused on U.S.,non-U.S., and/or specialty mandates; (4) Global Macro strategies such as all market portfolios, opportunistic long-only, managed futures, currency, dedicated short selling strategies or other specialty strategies; and (5) Multi-strategies where absolute return managers invest using a combination of previously described strategies.
Absolute return investments are generally less liquid as compared to equity and fixed income and more liquid as compared to private equity. Direct absolute return investments consist of securities traded on national security exchanges, as well as securities that do not have readily determinable market values (illiquid securities). The fund manager’s evaluation of the fair value of portfolio funds is based on the most recent available valuation information provided to it by the portfolio funds, adjusted for subsequent distributions from and capital contributions to such portfolio funds, if any.
Typically, the fair value of investments is determined by the fund manager in good faith and in compliance with the following guidelines:
• The value of illiquid investments is determined by the fund manager in good faith and in compliance with the definition of fair value under U.S. GAAP (Financial Accounting Standards Board (FASB) Accounting Standards Codification, Topic 820); provided, however, in some circumstances certain illiquid investments may require reporting financial information and valuations in accordance with accounting standards other than U.S. GAAP, such as under International Financial Reporting Standards.
• Securities that are traded on a national securities exchange are valued at their last reported sales prices on the valuation date on the national securities exchange on which such securities are principally traded or on a consolidated tape which includes such exchange, or, if there are no sales on such date on such exchange or consolidated tape, at the mean between the last “bid” and “asked” prices at the close of trading on such date on the largest national securities exchange on which such securities are traded.
Financial Section | 47
noTes To The basiC finanCial sTaTemenTs (ConTinued)(Dollar Amounts Expressed in Thousands)
• Securities not traded on a national securities exchange, but traded over the counter, are valued at the last reported sales price as reported by the Nasdaq National Market of the Nasdaq Stock Market, or if such prices are not reported by the Nasdaq Stock Market, as reported by the National Quotation Bureau, Inc.; or if such prices are not reported by the National Quotation Bureau, the valuation of options or notional principal contracts not traded on a national securities exchange may be determined in good faith by a reliable source selected by the fund manager.
• Commodity interests traded on a United States or foreign exchange are valued at their last reported
settlement price on the valuation date on the exchange on which such interests were purchased or sold. Commodity interests not traded on a United States or foreign exchange are valued at the mean between their last “bid” and “asked” prices on the date as of which the value is being determined, as reported by a reliable source selected in good faith by the fund manager.
• Short-term money market instruments and bank deposits are valued at cost plus accrued interest to the date of valuation.
These funds generally have monthly or quarterly redemption frequency and require between 30 and 90 days’ prior written notice, limiting the System’s ability to respond quickly to changes in market conditions.
Public Equity and Fixed Income Commingled FundsThe majority of assets within separate accounts for public equities and fixed income are custodied with State Street, however, a portion of the assets in a separate account can be invested in a commingled fund to provide dedicated exposure to a specific segment of the market. An example would be a core plus fixed income mandate where SCERS’ receives the high yield credit exposure through a commingled fund that is managed by the investment manager, and all other exposures through custodied assets. Withdrawals from such funds may be made after valuation has been determined either daily or monthly and require up to 60 days advance notice.
Real AssetsCore and core plus real estate is held either directly via a real estate holding entity or as a limited partner in a commingled fund. Limited partner interest in commingled funds is valued using the NAV of the partnership. The most significant input into the NAV of such an entity is the value of its investment holdings. These holdings are valued by the general partners on a continuous basis, audited annually and periodically appraised by an independent third party. The valuation assumptions are based upon both market and property specific inputs which are not observable and involve a certain degree of expert judgment. Real estate investments in a closed-end commingled fund are long-term and illiquid in nature. As a result, investors are subject to redemption restrictions which generally limit distributions and restrict the ability of limited partners to exit a partnership investment. These investments can never be redeemed with the funds unless sold in a secondary market. Distributions from each fund will be received as the underlying investments of the funds are liquidated. It is expected that the underlying assets of the funds will be liquidated over the next 8 to 12 years.
Private EquityPrivate Equity investments include limited partnerships, commingled funds and fund of funds (FoF) that invest in domestic and international private buyouts, venture capital, mezzanine capital, direct lending, and distressed debt. Private equity investments are made both on a direct basis in limited partnerships, commingled funds, and separate accounts, and through externally managed FoF’s. Each FoF manager’s investments consist of portfolio funds and co-investments as well as marketable securities held from time to time as a result of a distribution from a portfolio fund.
Financial Section | 48

noTes To The basiC finanCial sTaTemenTs (ConTinued)(Dollar Amounts Expressed in Thousands)
Private equity investments are long-term and illiquid in nature. As a result, limited partners are limited in their ability to exit a partnership investment prior to its dissolution, other than selling their interest in a private equity secondary market. Distributions are received through the liquidation of the underlying assets of the fund. It is expected that the underlying assets of the fund would be liquidated over 7 to 10 years.
Limited partner interest in commingled funds is valued by using the NAV of the partnership. The most significant input into the NAV of such an entity is the value of its investment holdings. These holdings are valued by the general partners on a continuous basis, audited annually and periodically appraised by an independent third party.
Typically, the fair value of all investments is determined by the fund manager in good faith and in compliance with the definition of fair value under U.S. GAAP (FASB Accounting Standards Codification, Topic 820, Fair Value Measures and Disclosures). In some circumstances, partnership agreements require reporting financial information and valuations in accordance with accounting standards other than GAAP, such as under International Financial Reporting Standards. The measure of fair value by the fund manager is typically conducted on a quarterly basis. Marketable securities are valued according to the most recent public market price with appropriate discounts to reflect any contractual or regulatory restriction upon sale.
The fair value of each investment as reported does not necessarily represent the amount that may ultimately be realized, since such amounts depend upon future circumstances that cannot reasonably be determined until the position is actually liquidated. The evaluation of the fair value of portfolio funds is based on the most recent available valuation information provided to it by the portfolio funds, adjusted for subsequent distributions from and capital contributions to such portfolio funds, if any. The evaluation of the fair value of co-investments is based on the most recent information available at the time of valuation ascribed to such investments by the sponsor partnership. If the manager does not agree with this valuation, holds different securities than the sponsor partnership, is unable to obtain the sponsor partnership’s valuation, or has information that results in a different valuation, it may use its own internal evaluation of fair value. The assumptions are based upon the nature of the investment and the underlying business. The valuation techniques vary based upon investment type and involve a certain degree of expert judgment.
OpportunitiesOpportunities investments are tactical investments that can be made in any allowable asset class and investment vehicle, including securities traded on national exchanges and investments that do not have a readily determinable fair value. The allocation to tactical investment opportunities is 0% to 5% of the total fund. Once an opportunities investment is made, capital to fund the opportunity is drawn from the asset class with the closest risk and return profile (equity, fixed income, absolute return, private equity or real assets). Accordingly, opportunities investments are valued by the methodology of the underlying asset class as described above. The System’s interest in these commingled funds is valued by using the NAV of the partnership similar to investments in real assets or private equity. These investments can never be redeemed with the funds unless sold on a secondary market. Distributions from each fund will be received as the underlying investments of the funds are liquidated. It is expected that the underlying assets of the funds will be liquidated over the next 7 to 10 years.
Annual Money-Weighted Rate of Return
The money-weighted rate of return expresses investment performance, net of investment expenses, adjusted for the changing amounts actually invested. For the year ended June 30, 2017, the annual money-weighted rate of return on pension plan investments, net of pension plan investment expenses, was 13.6%. The annual money-weighted rate of return for the year ended June 30, 2016 was (0.97%).
Financial Section | 49

SECTION 3: SECURITIES LENDING
State statutes permit the System to participate in securities lending transactions and, pursuant to a Securities Lending Authorization Agreement, the System has authorized State Street Bank and Trust Company (State Street) to act as its agent in lending the System’s securities to broker-dealers and banks pursuant to an approved loan agreement.
During the years ended June 30, 2017 and 2016, on behalf of the System, State Street loaned securities held by State Street as custodian, including U.S. government and agency obligations, domestic corporate bonds, and domestic and international equities and received, as collateral, U.S. and foreign currency, securities issued or guaranteed by the U.S. government, sovereign debt of foreign countries, and irrevocable bank letters of credit. The System does not have the ability to pledge or sell collateral securities absent a borrower default. Borrowers are required to deliver collateral for each loan equal to a minimum of 100% of the market value of the loaned security.
In accordance with GASB Statement No. 28, Accounting and Financial Reporting for Securities Lending Transactions, securities lending collateral reported in the statement of fiduciary net position represents only cash collateral which is invested in the lending agent’s cash collateral investment pool. During the fiscal years ended June 30, 2017 and 2016, SCERS did not impose any restrictions on the amount of the loans that State Street made on its behalf. During the fiscal years ended June 30, 2017 and 2016, there were no failures to return loaned securities or pay distributions thereon by any borrowers. Moreover, there were no losses resulting from a default of the borrowers or State Street.
During the fiscal years ended June 30, 2017 and 2016, SCERS and the borrowers maintained the right to terminate all securities lending transactions on demand. The cash collateral received on each loan was invested, together with the cash collateral of other qualified tax-exempt plan lenders, in a collective investment pool. Because the loans were terminable at will, their duration did not generally match the duration of the investments made with cash collateral. Since the collateral received from the borrowers was greater than the amounts borrowed, on June 30, 2017 and 2016, the System had minimal credit risk exposure to the borrowers. Furthermore, the lending agreement with the custodian requires the custodian to indemnify the System if the borrower fails to return the securities. The total collateral held and the fair value of the securities on loan as of June 30, 2017 were $380,418 and $371,148, respectively. The total collateral held and the fair value of the securities on loan as of June 30, 2016 were $481,087 and $472,397, respectively.
Additional information regarding the cash collateral investment pool (collateral pool) follows:
Method for Determining Fair Value. The fair value of investments held by the collateral pool is based upon valuations provided by a recognized pricing service.
Policy for Utilizing Amortized Cost Method. Because the collateral pool does not meet the requirements of Rule 2a-7 of the Investment Company Act of 1940, State Street has valued the collateral pool investments at fair value for reporting purposes.
Regulatory Oversight. The collateral pool is not registered with the Securities and Exchange Commission. State Street, and consequently the investment vehicles it sponsors (including the collateral pool), are subject to the oversight of the Federal Reserve Board and the Massachusetts Commissioner of Banks. The fair value of the System’s position in the collateral pool is the same as the value of the collateral pool shares.
Financial Section | 50
noTes To The basiC finanCial sTaTemenTs (ConTinued)(Dollar Amounts Expressed in Thousands)

Collateral and related securities on loan at June 30, 2017 and 2016 were as follows:
2017
Security on Loan DescriptionCash Collateral
Value Non-Cash
Collateral ValueFair Value of
Securities on LoanU.S. government and agency obligations $138,040 $14,109 $148,871 Domestic corporate bonds 30,657 - 29,991 Common and preferred stock – domestic 153,952 9,545 160,093 Common and preferred stock – international 29,585 4,530 32,193 Total $352,234 $28,184 $371,148
2016
Security on Loan DescriptionCash Collateral
Value Non-Cash
Collateral ValueFair Value of
Securities on LoanU.S. government and agency obligations $127,578 $17,605 $142,229 Domestic corporate bonds 46,467 - 45,592 Common and preferred stock – domestic 210,522 30,832 238,572 Common and preferred stock – international 37,953 10,130 46,004 Total $422,520 $58,567 $472,397
Securities Lending Collateral Credit Risk
All of the cash collateral received for securities lending is invested in the State Street Quality D Short-Term Investment Fund (STIF), which is not rated by credit rating agencies. At the time of purchase, all securities with maturities of 13 months or less must be rated at least A1, P1 or F1 and all securities with maturities in excess of 13 months must be rated A- or A3 by any two of the nationally-recognized statistical rating organizations or, if unrated, be of comparable quality. The fund may invest in other State Street managed vehicles provided they conform to the guidelines. As of June 30, 2017 and 2016, the STIF investments had a rating of at least A or A1/P1, and since the collateral received from borrowers was greater than the amounts borrowed, the System had minimal credit risk exposure to the borrowers.
Securities Lending Collateral Interest Rate Risk
Quality D’s Investment Policy Guidelines provide that the lending agent shall maintain the dollar-weighted average maturity of the Quality D fund in a manner that the lending agent believes is appropriate to the objective of the Quality D Fund; provided that (i) in no event shall any Eligible Security be acquired with a remaining legal final maturity of greater than 18 months, (ii) the lending agent shall maintain a dollar-weighted average maturity of the Quality D Fund not to exceed 75 calendar days and (iii) the lending agent shall maintain a dollar-weighted average maturity to final of the Quality D Fund not to exceed 180 calendar days. As of June 30, 2017 and 2016, the weighted average maturity was 29 days and 43 days, respectively.
Financial Section | 51
noTes To The basiC finanCial sTaTemenTs (ConTinued)(Dollar Amounts Expressed in Thousands)

SECTION 4: DEPOSIT AND INVESTMENT RISKS
Pursuant to GASB Statement No. 40, Deposit and Investment Risk Disclosure, the following schedules disclose the System’s investments subject to certain types of risk.
Credit Risk
Credit risk is the risk that an issuer or other counterparty to a debt instrument will not fulfill its obligations. This is measured by the assignment of ratings by nationally-recognized statistical rating organizations.
SCERS utilizes external investment managers to manage its portfolios. SCERS’ Investment Policy specifies that fixed income investments will include both active and enhanced index investments in U.S. Treasury and agency securities, corporate bonds, mortgage-backed and asset-backed securities and non-dollar denominated sovereign and corporate debt.
SCERS’ portfolio has two actively-managed investment strategies, which have a minimum average credit quality rating of A2 by Moody’s Investor Services or A by Standard and Poor’s Corporation for strategy 1, and a minimum average credit quality rating of Baa1/BBB+ by a Nationally Recognized Statistical Rating Organization (NRSRO) for strategy 2. Portfolio diversification is constrained by the following parameters in order to minimize overall market and credit risk:
• For strategy 2, securities rated below B-/B3 by an NRSRO are limited to 10% of the portfolio, at the time of purchase, while securities rated below CCC- or Caa3 by an NRSRO are prohibited.
• No more than 10% and 5% of the portfolio will be concentrated in any one issuer except U.S. Government and agency securities for strategies 1 and 2, respectively.
• No more than 20% and 25% of the portfolio will be invested in high yield or below investment grade straight securities for strategies 1 and 2, respectively.
• No more than 15% and 10% of the portfolio will be invested in convertible securities, which include bonds and preferred issues, for strategies 1 and 2, respectively.
• No more than 20% of the portfolio will be invested in non-U.S. dollar bonds for each strategy.
• No more than 15% of the portfolio will be invested in Emerging Markets, at the time of purchase, for strategy 2.
• Net exposure to interest rate derivatives will be limited to 25% of the duration of the portfolio for strategy 2.
• Net exposure to credit derivatives (CDS, CDX) will be limited to 25% of the market value of the portfolio for strategy 2.
• Gross notional exposure to credit derivatives (CDS, CDX) will be limited to 50% of the market value of the portfolio for strategy 2.
Financial Section | 52
noTes To The basiC finanCial sTaTemenTs (ConTinued)(Dollar Amounts Expressed in Thousands)

The following tables depict the fixed income assets by credit rating as of June 30, 2017 and 2016: Fixed IncomeAs of June 30, 2017
S&P Quality Rating Total
Securitized Obligations
Credit Obligations
Commingled Funds
U.S. Government
& Agency Obligations
International Government
Collateralized Mortgage
Obligations
Mortgage Pass-Through
FHLMC FNMA GNMA AAA $146,028 $97,282 $6,381 $- $- $- $42,365 $- $- $-
AA+ 207,190 20,633 5,216 - - - 15,863 66,061 99,417 -
AA 7,073 3,236 3,066 - - - 771 - - -
AA- 18,441 - 17,038 - - - 1,403 - - -
A+ 38,811 11,086 18,789 - - 928 8,008 - - -
A 31,921 1,724 30,197 - - - - - - -
A- 32,927 - 32,563 - - - 364 - - -
BBB+ 91,546 - 89,013 - - - 2,533 - - -
BBB 70,808 2,717 67,630 - - 232 229 - - -
BBB- 62,685 851 55,973 - - 3,853 2,008 - - -
BB+ 23,665 8,273 12,133 - - - 3,259 - - -
BB 8,836 - 8,836 - - - - - - -
BB- 14,141 - 14,141 - - - - - - -
B+ 7,495 1,163 6,269 - - - 63 - - -
B 4,357 - 4,219 - - - 138 - - -
B- 6,442 - 1,655 - - - 4,787 - - -
CCC+ 2,556 - 2,556 - - - - - - -
CCC 3,104 2,960 - - - - 144 - - -
D 2,707 1,188 - - - - 1,519 - - -
NA 366,056 - - - 315,659 - - - - 50,397
NR 453,520 5,076 - 427,435 - - 21,009 - - -
Total $1,600,309 $156,189 $375,675 $427,435 $315,659 $5,013 $104,463 $66,061 $99,417 $50,397
NA represents securities explicitly guaranteed by the U.S. government, which are not subject to the GASB Statement No. 40 credit risk disclosure requirements. NR represents those securities that are not rated.
Financial Section | 53
noTes To The basiC finanCial sTaTemenTs (ConTinued)(Dollar Amounts Expressed in Thousands)

Fixed IncomeAs of June 30, 2016
S&P Quality Rating Total
Securitized Obligations
Credit Obligations
Commingled Funds
U.S. Government
& Agency Obligations
International Government
Collateralized
Mortgage Obligations
Mortgage Pass-Through
FHLMC FNMA GNMA AAA $140,346 $127,489 $5,015 $- $- $- $7,842 $- $- $-
AA+ 223,852 30,960 10,680 - - - 9,639 68,262 104,311 -
AA 19,710 13,863 5,679 - - - 168 - - -
AA- 12,773 755 12,018 - - - - - - -
A+ 30,611 13,531 13,698 - - - 3,382 - - -
A 35,194 4,644 29,170 - - 1,380 - - - -
A- 33,373 884 32,489 - - - - - - -
BBB+ 90,003 828 86,317 - - 474 2,384 - - -
BBB 62,346 1,530 60,288 - - 237 291 - - -
BBB- 64,060 1,557 60,968 - - - 1,535 - - -
BB+ 31,288 8,852 13,567 - - 5,953 2,916 - - -
BB 16,036 1,483 14,277 - - - 276 - - -
BB- 13,488 2,536 10,952 - - - - - - -
B+ 37,289 1,078 36,211 - - - - - - -
B 6,963 214 6,749 - - - - - - -
B- 12,355 943 5,910 - - 406 5,096 - - -
CCC+ 1,507 - 1,507 - - - - - - -
CCC 611 - - - - - 611 - - -
D 2,957 1,113 - - - - 1,844 - - -
NA 319,677 - - - 277,881 - - - - 41,796
NR 401,418 10,764 1,991 369,032 - - 19,631 - - - Total $1,555,857 $223,024 $407,486 $369,032 $277,881 $8,450 $55,615 $68,262 $104,311 $41,796
NA represents securities explicitly guaranteed by the U.S. government, which are not subject to the GASB Statement No. 40 credit risk disclosure requirements. NR represents those securities that are not rated.
Concentration of Credit Risk
Concentration of credit risk is the risk of loss attributed to the magnitude of a government’s investment in a single issuer. As of June 30, 2017 and 2016, the System had no single issuer that exceeds 5% of total investments per GASB Statement No. 40 disclosure requirements or any one issuer which represents 5% or more of total fiduciary net position in accordance with GASB Statement No. 67. Investments issued or explicitly guaranteed by the U.S. government and investments in mutual funds, external investment pools, and other pooled investments are exempt from the disclosure requirements.
The System’s investment policy does not allow more than 5% of the total portfolio fair value to be invested in any one issuer, and as of June 30, 2017 and 2016, the System had no issuer that exceeds 5% of total portfolio market value. As noted in the previous discussion of credit risk, manager investment guidelines place limitations on the maximum holdings in any one issuer.
Financial Section | 54
noTes To The basiC finanCial sTaTemenTs (ConTinued)(Dollar Amounts Expressed in Thousands)

Financial Section | 55
noTes To The basiC finanCial sTaTemenTs (ConTinued)(Dollar Amounts Expressed in Thousands)
Custodial Credit Risk
Custodial credit risk is the risk that in the event a financial institution or counterparty fails, the System would not be able to recover the value of its deposits, investments, or securities. As of June 30, 2017 and 2016, the bank balance of cash and cash equivalents on deposit with SCERS’ custodian bank and financial institutions totaled $18,243 and $19,128, respectively, of which $15,523 and $15,896 were not insured by Federal Depository Insurance Corporation (FDIC) and were exposed to custodial credit risk. The System believes that the risk is not significant because the cash is held with major financial institutions.
As of June 30, 2017 and 2016, deposits held in the System’s name for the margin accounts of $12,372 and $58,771, respectively, were not insured or not collateralized, and these deposits were exposed to custodial credit risk.
As of June 30, 2017 and 2016, 100% of the System’s investments held with the custodian were held in the System’s name, and the System is not exposed to custodial credit risk related to these investments. There are no general policies relating to custodial credit risk.
Interest Rate Risk
Interest rate risk is the risk that changes in interest rates will adversely affect the fair value of an investment. The investment guidelines negotiated with the actively-managed external portfolio managers give the managers the discretion to deviate within +/-20% and +/-30%, for strategies 1 and 2, respectively, from the effective duration of the relevant Barclays Capital Aggregate benchmark based on the portfolio total. The following tables depict the duration in years of the long-term fixed income portfolio vs. the benchmark. Long-Term Fixed Income Investments DurationAs of June 30, 2017 Effective BenchmarkType of Securities Fair Value Duration Duration DifferenceSecuritized Obligations
Asset-Backed Securities $134,009 0.40 2.08 (1.68)Collateralized Mortgage-Backed Securities 22,180 4.63 4.38 0.25
Credit ObligationsCorporate Bonds 325,758 6.41 7.35 (0.94)Municipals 9,867 12.07 11.57 0.50 Yankee 40,050 6.16 5.81 0.35
U.S. Government & Agency ObligationsAgency Securities 8,112 5.63 3.96 1.67 U.S. Treasury 307,547 7.03 6.15 0.88
International Government 5,013 4.62 7.40 (2.78)Collateralized Mortgage Obligations 104,463 3.32 5.59 (2.27)Mortgage Pass-Through
FHLMC 66,061 4.21 3.72 0.49 FNMA 99,417 4.13 3.83 0.30 GNMA 50,397 4.71 4.28 0.43
No Effective DurationCommingled Fund 427,435 NA NA NA
Total Fair Value with Weighted Average $1,600,309 5.21 5.76 (0.55)

Financial Section | 56
noTes To The basiC finanCial sTaTemenTs (ConTinued)(Dollar Amounts Expressed in Thousands)
Long-Term Fixed Income Investments DurationAs of June 30, 2016 Effective BenchmarkType of Securities Fair Value Duration Duration DifferenceSecuritized Obligations
Asset-Backed Securities $150,235 0.60 2.28 (1.68)Collateralized Mortgage-Backed Securities 72,789 4.41 5.05 (0.64)
Credit ObligationsCorporate Bonds 344,338 6.53 7.19 (0.66)Municipals 7,860 14.53 12.55 1.98Yankee 28,642 7.74 6.15 1.59
U.S. Government & Agency ObligationsAgency Securities 9,883 3.92 3.59 0.33U.S. Treasury 267,998 7.09 6.21 0.88
International Government 8,450 6.07 13.48 (7.41)Collateralized Mortgage Obligations 55,615 1.59 5.86 (4.27)Mortgage Pass-Through
FHLMC 68,262 2.71 2.20 0.51FNMA 104,311 2.77 2.28 0.49GNMA 41,796 3.31 2.68 0.63
No Effective DurationCommingled Funds 395,678 NA NA NA
Total Fair Value with Weighted Average $1,555,857 4.90 5.35 (0.45)
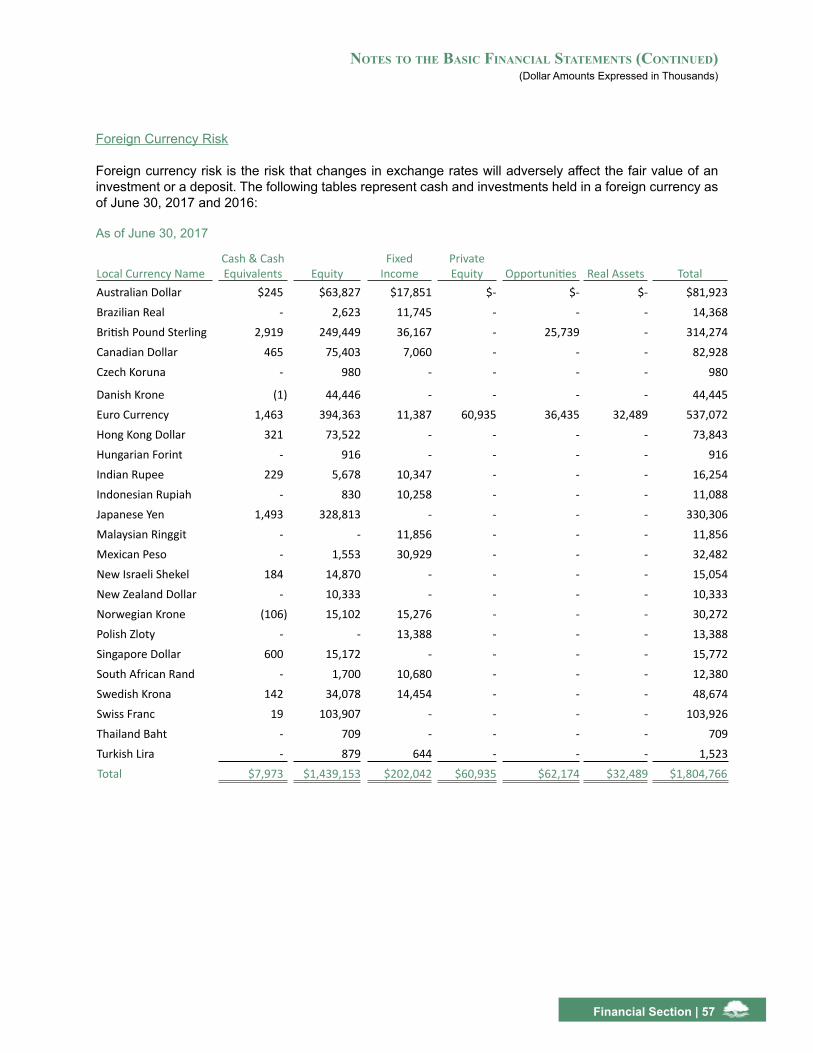
Financial Section | 57
noTes To The basiC finanCial sTaTemenTs (ConTinued)(Dollar Amounts Expressed in Thousands)
Foreign Currency Risk Foreign currency risk is the risk that changes in exchange rates will adversely affect the fair value of an investment or a deposit. The following tables represent cash and investments held in a foreign currency as of June 30, 2017 and 2016: As of June 30, 2017
Local Currency NameCash & Cash Equivalents Equity
Fixed Income
Private Equity Opportunities Real Assets Total
Australian Dollar $245 $63,827 $17,851 $- $- $- $81,923 Brazilian Real - 2,623 11,745 - - - 14,368 British Pound Sterling 2,919 249,449 36,167 - 25,739 - 314,274 Canadian Dollar 465 75,403 7,060 - - - 82,928 Czech Koruna - 980 - - - - 980
Danish Krone (1) 44,446 - - - - 44,445 Euro Currency 1,463 394,363 11,387 60,935 36,435 32,489 537,072 Hong Kong Dollar 321 73,522 - - - - 73,843 Hungarian Forint - 916 - - - - 916 Indian Rupee 229 5,678 10,347 - - - 16,254 Indonesian Rupiah - 830 10,258 - - - 11,088 Japanese Yen 1,493 328,813 - - - - 330,306 Malaysian Ringgit - - 11,856 - - - 11,856 Mexican Peso - 1,553 30,929 - - - 32,482 New Israeli Shekel 184 14,870 - - - - 15,054 New Zealand Dollar - 10,333 - - - - 10,333 Norwegian Krone (106) 15,102 15,276 - - - 30,272 Polish Zloty - - 13,388 - - - 13,388 Singapore Dollar 600 15,172 - - - - 15,772 South African Rand - 1,700 10,680 - - - 12,380 Swedish Krona 142 34,078 14,454 - - - 48,674 Swiss Franc 19 103,907 - - - - 103,926 Thailand Baht - 709 - - - - 709 Turkish Lira - 879 644 - - - 1,523 Total $7,973 $1,439,153 $202,042 $60,935 $62,174 $32,489 $1,804,766

noTes To The basiC finanCial sTaTemenTs (ConTinued)(Dollar Amounts Expressed in Thousands)
Financial Section | 58
As of June 30, 2016
Local Currency NameCash & Cash Equivalents Equity
Fixed Income
Private Equity Opportunities Real Assets Total
Australian Dollar $844 $58,349 $15,563 $- $- $- $74,756 Brazilian Real - 842 12,789 - - - 13,631 British Pound Sterling 946 146,806 13,062 - 29,955 - 190,769 Canadian Dollar 156 47,642 - - - - 47,798 Colombian Peso (113) - - - - - (113)
Chilean Peso - - 14,335 - - - 14,335 Danish Krone 561 12,332 - - - - 12,893 Euro Currency 2,550 222,819 27,455 40,938 30,645 30,835 355,242 Hong Kong Dollar 331 26,791 - - - - 27,122 Hungarian Forint - 484 8,512 - - - 8,996 Indian Rupee 15 1,942 9,909 - - - 11,866 Indonesian Rupiah - 536 10,058 - - - 10,594 Japanese Yen 2,123 192,955 - - - - 195,078 Malaysian Ringgit - - 9,422 - - - 9,422 Mexican Peso 243 3,813 29,326 - - - 33,382 New Israeli Shekel - 7,662 - - - - 7,662 New Zealand Dollar 9 10,702 7,813 - - - 18,524 Norwegian Krone 12 18,613 6,162 - - - 24,787 Philippine Peso - 596 - - - - 596 Polish Zloty - - 4,574 - - - 4,574 Singapore Dollar 241 12,989 - - - - 13,230 South African Rand 98 1,978 7,030 - - - 9,106 South Korean Won - 651 - - - - 651 Swedish Krona 304 30,509 14,399 - - - 45,212 Swiss Franc 12 42,809 - - - - 42,821 Thailand Baht - 1,014 - - - - 1,014 Turkish Lira - 1,491 - - - - 1,491 Total $8,332 $844,325 $190,409 $40,938 $60,600 $30,835 $1,175,439 Foreign currency is comprised of international investment proceeds and income to be repatriated into U.S. dollars and funds available to purchase international securities. The System does not have a foreign currency risk policy.
SECTION 5: HIGHLY SENSITIVE INVESTMENTS
As of June 30, 2017 and 2016, SCERS’ investments included Collateralized Mortgage Obligations and Mortgage Pass-Through securities totaling $320,338 and $269,984 respectively. These securities are highly sensitive to interest rate fluctuations in that they are subject to early payment in a period of declining interest rates. The resulting reduction in expected total cash flows affects the fair value of these securities.
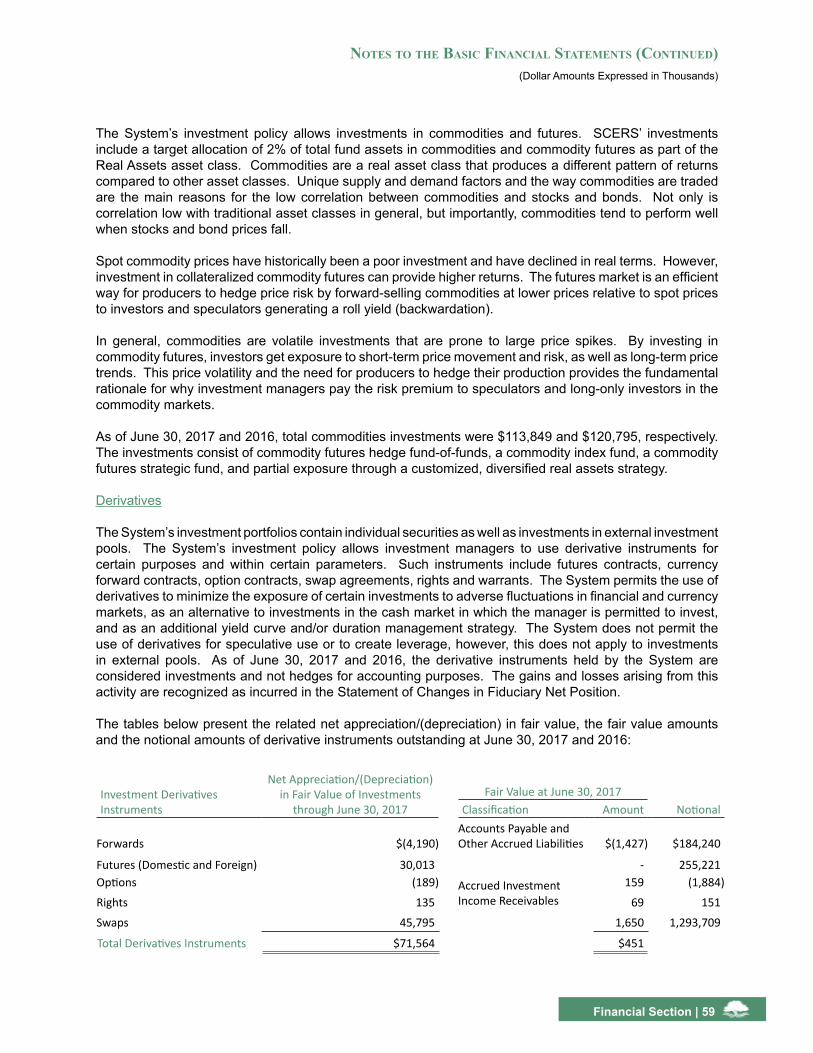
noTes To The basiC finanCial sTaTemenTs (ConTinued)(Dollar Amounts Expressed in Thousands)
Financial Section | 59
The System’s investment policy allows investments in commodities and futures. SCERS’ investments include a target allocation of 2% of total fund assets in commodities and commodity futures as part of the Real Assets asset class. Commodities are a real asset class that produces a different pattern of returns compared to other asset classes. Unique supply and demand factors and the way commodities are traded are the main reasons for the low correlation between commodities and stocks and bonds. Not only is correlation low with traditional asset classes in general, but importantly, commodities tend to perform well when stocks and bond prices fall.
Spot commodity prices have historically been a poor investment and have declined in real terms. However, investment in collateralized commodity futures can provide higher returns. The futures market is an efficient way for producers to hedge price risk by forward-selling commodities at lower prices relative to spot prices to investors and speculators generating a roll yield (backwardation).
In general, commodities are volatile investments that are prone to large price spikes. By investing in commodity futures, investors get exposure to short-term price movement and risk, as well as long-term price trends. This price volatility and the need for producers to hedge their production provides the fundamental rationale for why investment managers pay the risk premium to speculators and long-only investors in the commodity markets.
As of June 30, 2017 and 2016, total commodities investments were $113,849 and $120,795, respectively. The investments consist of commodity futures hedge fund-of-funds, a commodity index fund, a commodity futures strategic fund, and partial exposure through a customized, diversified real assets strategy.
Derivatives
The System’s investment portfolios contain individual securities as well as investments in external investment pools. The System’s investment policy allows investment managers to use derivative instruments for certain purposes and within certain parameters. Such instruments include futures contracts, currency forward contracts, option contracts, swap agreements, rights and warrants. The System permits the use of derivatives to minimize the exposure of certain investments to adverse fluctuations in financial and currency markets, as an alternative to investments in the cash market in which the manager is permitted to invest, and as an additional yield curve and/or duration management strategy. The System does not permit the use of derivatives for speculative use or to create leverage, however, this does not apply to investments in external pools. As of June 30, 2017 and 2016, the derivative instruments held by the System are considered investments and not hedges for accounting purposes. The gains and losses arising from this activity are recognized as incurred in the Statement of Changes in Fiduciary Net Position.
The tables below present the related net appreciation/(depreciation) in fair value, the fair value amounts and the notional amounts of derivative instruments outstanding at June 30, 2017 and 2016:
Investment Derivatives Instruments
Net Appreciation/(Depreciation) in Fair Value of Investments
through June 30, 2017Fair Value at June 30, 2017
Classification Amount Notional
Forwards $(4,190)Accounts Payable and Other Accrued Liabilities $(1,427) $184,240
Futures (Domestic and Foreign) 30,013
Accrued Investment Income Receivables
- 255,221 Options (189) 159 (1,884)
Rights 135 69 151
Swaps 45,795 1,650 1,293,709
Total Derivatives Instruments $71,564 $451

Investment Derivatives Instruments
Net Appreciation/(Depreciation) in Fair Value of Investments
through June 30, 2016Fair Value at June 30, 2016
Classification Amount NotionalForwards $(425) Accounts Payable and
Other Accrued Liabilities $(2,840) $222,804
Swaps (43,698) (20,049) (16,626)Futures (Domestic and Foreign) (12,904) Accrued Investment
Income Receivables - (95,209)
Options 3 - -
Rights 186 Equity Securities
49 151
Warrants (211) - -
Total Derivatives Instruments $(57,049) $(22,840) Futures contracts are financial instruments that derive their value from underlying indices or reference rates and are marked-to-market at the end of each trading day. Daily settlement of gains and losses occur on the following business day. As a result, the instruments themselves have no fair value at June 30, 2017 or 2016 or at the end of any trading day. Daily settlement of gains and losses is a risk control measure to limit counterparty credit risk. Futures variation margin amounts are settled each trading day and recognized in the financial statements under net appreciation/(depreciation) in fair value of investments as they are incurred.
Forward contracts are obligations to buy or sell a currency or other commodity at a specified exchange rate and quantity on a specific future date. The fair value of the foreign currency forwards is the unrealized gain or loss calculated based on the difference between the specified exchange rate and the closing exchange rate at June 30, 2017 and 2016.
Counterparty Credit RiskBelow is a schedule showing the counterparty credit ratings of the System’s non-exchange traded investment derivative instruments outstanding and subject to loss at June 30, 2017 and 2016:
June 30, 2017
S&P Rating Forwards Swaps Total
AA- $3 $- $3
A+ 1,127 68 1,195
A 13 - 13
A- - 510 510
BBB+ - 1,328 1,328
Investments in Asset Position 1,143 1,906 3,049
Investments in Liability Position (2,251) (810) (3,061)
Total Investments in Asset/(Liability) Position $(1,108) $1,096 $(12)
noTes To The basiC finanCial sTaTemenTs (ConTinued)(Dollar Amounts Expressed in Thousands)
Financial Section | 60

noTes To The basiC finanCial sTaTemenTs (ConTinued)(Dollar Amounts Expressed in Thousands)
Financial Section | 61
June 30, 2016S&P Rating Forwards Swaps Total
AA- $32 $- $32
A+ 739 - 739
A 1,128 1 1,129
A- 18 1,817 1,835
BBB+ 296 507 803
Investments in Asset Position 2,213 2,325 4,538
Investments in Liability Position (5,053) (22,374) (27,427)
Total Investments in Asset/(Liability) Position $(2,840) $(20,049) $(22,889)
The System could be exposed to risk if the counterparties to derivative contracts are unable to meet the terms of the contracts. The System’s investment managers seek to control this risk through counterparty credit evaluations and approvals, counterparty credit limits, and exposure monitoring procedures. The System anticipates that the counterparties will be able to satisfy their obligations under the contracts.
The aggregate fair value of investment derivative instruments in an asset position subject to counterparty risk at June 30, 2017 and 2016 were $3,049 and $4,538, respectively. This represents the maximum loss that would be recognized at the reporting date if all counterparties failed to perform as contracted. The System did not have any master netting agreements with its counterparties at June 30, 2017 and 2016, except that certain investment managers used netting arrangements at their discretion to minimize counterparty risks. The above schedules present exposure for similar instruments with the same counterparty on a net basis.
At June 30, 2017 and 2016, the System did not have any significant exposure to counterparty credit risk with any single party.
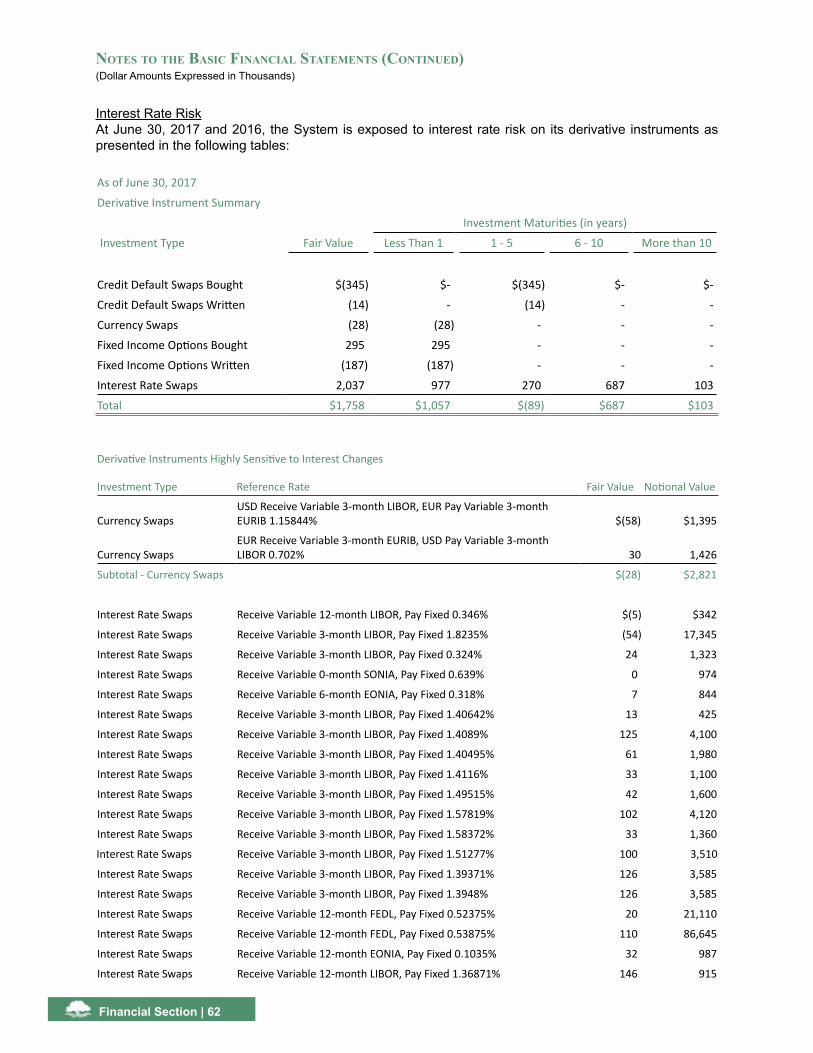
Financial Section | 62
noTes To The basiC finanCial sTaTemenTs (ConTinued)(Dollar Amounts Expressed in Thousands)
Interest Rate RiskAt June 30, 2017 and 2016, the System is exposed to interest rate risk on its derivative instruments as presented in the following tables:
As of June 30, 2017
Derivative Instrument Summary
Investment Maturities (in years)
Investment Type Fair Value Less Than 1 1 - 5 6 - 10 More than 10
Credit Default Swaps Bought $(345) $- $(345) $- $-
Credit Default Swaps Written (14) - (14) - -
Currency Swaps (28) (28) - - -
Fixed Income Options Bought 295 295 - - -
Fixed Income Options Written (187) (187) - - -
Interest Rate Swaps 2,037 977 270 687 103
Total $1,758 $1,057 $(89) $687 $103
Derivative Instruments Highly Sensitive to Interest Changes
Investment Type Reference Rate Fair Value Notional Value
Currency SwapsUSD Receive Variable 3-month LIBOR, EUR Pay Variable 3-month EURIB 1.15844% $(58) $1,395
Currency SwapsEUR Receive Variable 3-month EURIB, USD Pay Variable 3-month LIBOR 0.702% 30 1,426
Subtotal - Currency Swaps $(28) $2,821
Interest Rate Swaps Receive Variable 12-month LIBOR, Pay Fixed 0.346% $(5) $342
Interest Rate Swaps Receive Variable 3-month LIBOR, Pay Fixed 1.8235% (54) 17,345
Interest Rate Swaps Receive Variable 3-month LIBOR, Pay Fixed 0.324% 24 1,323
Interest Rate Swaps Receive Variable 0-month SONIA, Pay Fixed 0.639% 0 974
Interest Rate Swaps Receive Variable 6-month EONIA, Pay Fixed 0.318% 7 844
Interest Rate Swaps Receive Variable 3-month LIBOR, Pay Fixed 1.40642% 13 425
Interest Rate Swaps Receive Variable 3-month LIBOR, Pay Fixed 1.4089% 125 4,100
Interest Rate Swaps Receive Variable 3-month LIBOR, Pay Fixed 1.40495% 61 1,980
Interest Rate Swaps Receive Variable 3-month LIBOR, Pay Fixed 1.4116% 33 1,100
Interest Rate Swaps Receive Variable 3-month LIBOR, Pay Fixed 1.49515% 42 1,600
Interest Rate Swaps Receive Variable 3-month LIBOR, Pay Fixed 1.57819% 102 4,120
Interest Rate Swaps Receive Variable 3-month LIBOR, Pay Fixed 1.58372% 33 1,360
Interest Rate Swaps Receive Variable 3-month LIBOR, Pay Fixed 1.51277% 100 3,510
Interest Rate Swaps Receive Variable 3-month LIBOR, Pay Fixed 1.39371% 126 3,585
Interest Rate Swaps Receive Variable 3-month LIBOR, Pay Fixed 1.3948% 126 3,585
Interest Rate Swaps Receive Variable 12-month FEDL, Pay Fixed 0.52375% 20 21,110
Interest Rate Swaps Receive Variable 12-month FEDL, Pay Fixed 0.53875% 110 86,645
Interest Rate Swaps Receive Variable 12-month EONIA, Pay Fixed 0.1035% 32 987
Interest Rate Swaps Receive Variable 12-month LIBOR, Pay Fixed 1.36871% 146 915
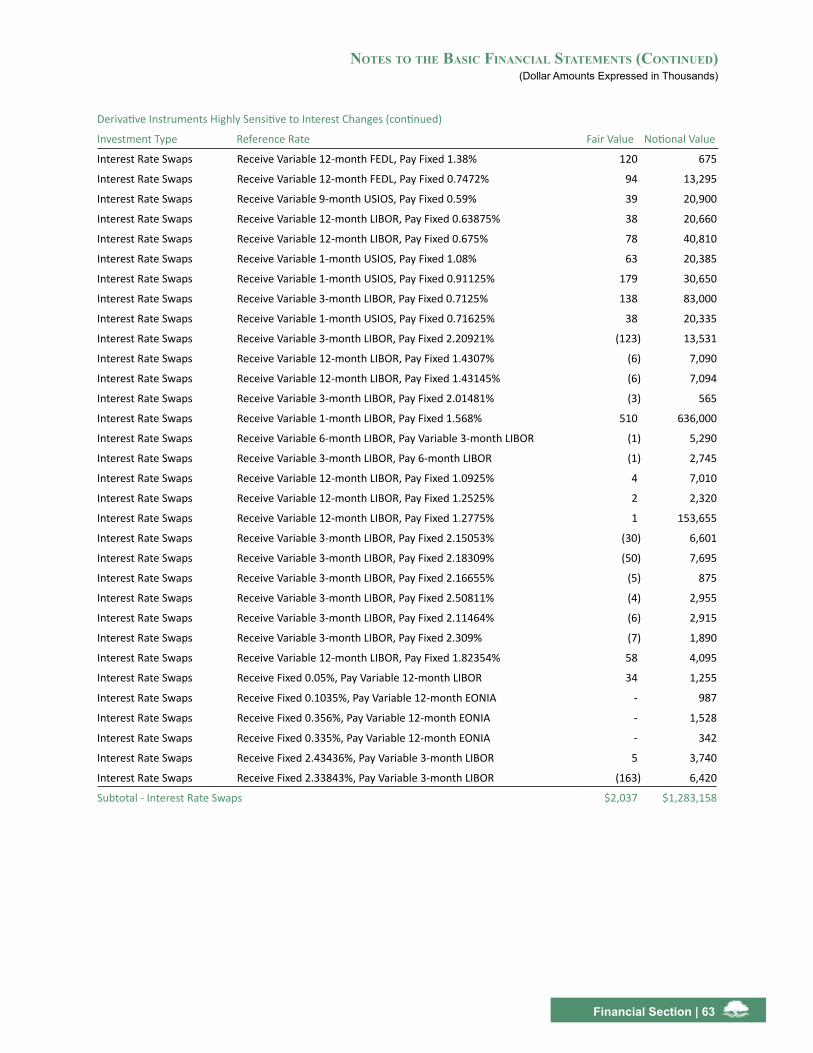
Derivative Instruments Highly Sensitive to Interest Changes (continued)
Investment Type Reference Rate Fair Value Notional Value
Interest Rate Swaps Receive Variable 12-month FEDL, Pay Fixed 1.38% 120 675
Interest Rate Swaps Receive Variable 12-month FEDL, Pay Fixed 0.7472% 94 13,295
Interest Rate Swaps Receive Variable 9-month USIOS, Pay Fixed 0.59% 39 20,900
Interest Rate Swaps Receive Variable 12-month LIBOR, Pay Fixed 0.63875% 38 20,660
Interest Rate Swaps Receive Variable 12-month LIBOR, Pay Fixed 0.675% 78 40,810
Interest Rate Swaps Receive Variable 1-month USIOS, Pay Fixed 1.08% 63 20,385
Interest Rate Swaps Receive Variable 1-month USIOS, Pay Fixed 0.91125% 179 30,650
Interest Rate Swaps Receive Variable 3-month LIBOR, Pay Fixed 0.7125% 138 83,000
Interest Rate Swaps Receive Variable 1-month USIOS, Pay Fixed 0.71625% 38 20,335
Interest Rate Swaps Receive Variable 3-month LIBOR, Pay Fixed 2.20921% (123) 13,531
Interest Rate Swaps Receive Variable 12-month LIBOR, Pay Fixed 1.4307% (6) 7,090
Interest Rate Swaps Receive Variable 12-month LIBOR, Pay Fixed 1.43145% (6) 7,094
Interest Rate Swaps Receive Variable 3-month LIBOR, Pay Fixed 2.01481% (3) 565
Interest Rate Swaps Receive Variable 1-month LIBOR, Pay Fixed 1.568% 510 636,000
Interest Rate Swaps Receive Variable 6-month LIBOR, Pay Variable 3-month LIBOR (1) 5,290
Interest Rate Swaps Receive Variable 3-month LIBOR, Pay 6-month LIBOR (1) 2,745
Interest Rate Swaps Receive Variable 12-month LIBOR, Pay Fixed 1.0925% 4 7,010
Interest Rate Swaps Receive Variable 12-month LIBOR, Pay Fixed 1.2525% 2 2,320
Interest Rate Swaps Receive Variable 12-month LIBOR, Pay Fixed 1.2775% 1 153,655
Interest Rate Swaps Receive Variable 3-month LIBOR, Pay Fixed 2.15053% (30) 6,601
Interest Rate Swaps Receive Variable 3-month LIBOR, Pay Fixed 2.18309% (50) 7,695
Interest Rate Swaps Receive Variable 3-month LIBOR, Pay Fixed 2.16655% (5) 875
Interest Rate Swaps Receive Variable 3-month LIBOR, Pay Fixed 2.50811% (4) 2,955
Interest Rate Swaps Receive Variable 3-month LIBOR, Pay Fixed 2.11464% (6) 2,915
Interest Rate Swaps Receive Variable 3-month LIBOR, Pay Fixed 2.309% (7) 1,890
Interest Rate Swaps Receive Variable 12-month LIBOR, Pay Fixed 1.82354% 58 4,095
Interest Rate Swaps Receive Fixed 0.05%, Pay Variable 12-month LIBOR 34 1,255
Interest Rate Swaps Receive Fixed 0.1035%, Pay Variable 12-month EONIA - 987
Interest Rate Swaps Receive Fixed 0.356%, Pay Variable 12-month EONIA - 1,528
Interest Rate Swaps Receive Fixed 0.335%, Pay Variable 12-month EONIA - 342
Interest Rate Swaps Receive Fixed 2.43436%, Pay Variable 3-month LIBOR 5 3,740
Interest Rate Swaps Receive Fixed 2.33843%, Pay Variable 3-month LIBOR (163) 6,420
Subtotal - Interest Rate Swaps $2,037 $1,283,158
noTes To The basiC finanCial sTaTemenTs (ConTinued)(Dollar Amounts Expressed in Thousands)
Financial Section | 63

Financial Section | 64
As of June 30, 2016
Derivative Instrument Summary
Investment Maturities (in years)
Investment Type Fair Value Less Than 1 1 - 5 6 - 10 More than 10
Credit Default Swaps Bought $(592) $- $(592) $- $-
Credit Default Swaps Written (45) - (45) - -
Currency Swaps (544) 148 - (692) -
Fixed Interest Rate Swaps (8,475) - (320) (8,137) (18)
Total Return Swaps Equity (10,393) (10,393) - - -
Total $(20,049) $(10,245) $(957) $(8,829) $(18)
Derivative Instruments Highly Sensitive to Interest Changes
Investment Type Reference Rate Fair Value Notional Value
Currency Swaps USD Receive Variable 3-month LIBOR, JPY Pay Variable 3-month LIBOR $(255) $806
Currency Swaps JPY Receive Variable 3-month LIBOR, USD Pay Variable 3-month LIBOR 240 926
Currency Swaps USD Receive Variable 3-month LIBOR, JPY Pay Variable 3-month LIBOR (1,042) 3,219
Currency Swaps JPY Receive Variable 3-month LIBOR, USD Pay Variable 3-month LIBOR 972 3,704
Currency Swaps JPY Receive Variable 3-month LIBOR, USD Pay Fixed 0.23435% 120 926
Currency Swaps USD Receive Fixed 1.00%, JPY Pay Variable 3-month LIBOR (120) 806
Currency Swaps USD Receive Fixed 0.714%, JPY Pay Variable 3-month LIBOR (485) 3,219
Currency Swaps JPY Receive Variable 3-month LIBOR, USD Pay Fixed 0.714% 485 3,704
Currency Swaps USD Receive Variable 3-month LIBOR, EUR Pay Variable 3-month EURIB (375) 2,528
Currency Swaps EUR Receive Variable 3-month LIBOR, USD Pay Fixed 0.187% (84) 2,444
Subtotal - Currency Swaps $(544) $22,282
Interest Rate Swaps Receive Variable 12-month LIBOR, Pay Fixed 0.346% $(9) $333
Interest Rate Swaps Receive Variable 3-month LIBOR, Pay Fixed 1.8235% (601) 17,345
Interest Rate Swaps Receive Variable 3-month LIBOR, Pay Fixed 1.85042% (513) 11,600
Interest Rate Swaps Receive Variable 3-month LIBOR, Pay Fixed 1.78695% (1,702) 41,720
Interest Rate Swaps Receive Variable 3-month LIBOR, Pay Fixed 2.23662% (2,574) 34,790
Interest Rate Swaps Receive Variable 3-month LIBOR, Pay Fixed 1.74090% (769) 19,850
Interest Rate Swaps Receive Variable 3-month LIBOR, Pay Fixed 2.01273% (1,226) 22,000
Interest Rate Swaps Receive Variable 3-month LIBOR, Pay Fixed 1.78784% (339) 8,050
Interest Rate Swaps Receive Variable 3-month LIBOR, Pay Fixed 1.9822% (189) 3,480
Interest Rate Swaps Receive Variable 3-month LIBOR, Pay Fixed 0.324% (42) 1,489
Interest Rate Swaps Receive Variable 0-month SONIA, Pay Fixed 0.639% (21) 1,003
Interest Rate Swaps Receive Variable 6-month EONIA, Pay Fixed 0.318% (5) 822
Interest Rate Swaps Receive Variable 3-month LIBOR, Pay Fixed 1.416% (83) 4,400
Interest Rate Swaps Receive Variable 3-month LIBOR, Pay Fixed 1.40642% (40) 2,200
noTes To The basiC finanCial sTaTemenTs (ConTinued)(Dollar Amounts Expressed in Thousands)

noTes To The basiC finanCial sTaTemenTs (ConTinued)(Dollar Amounts Expressed in Thousands)
Derivative Instruments Highly Sensitive to Interest Changes (continued)
Investment Type Reference Rate Fair Value Notional Value
Interest Rate Swaps Receive Variable 6-month LIBOR, Pay Fixed 1.4089% (75) 4,100
Interest Rate Swaps Receive Variable 3-month LIBOR, Pay Fixed 1.40495% (53) 2,900
Interest Rate Swaps Receive Variable 3-month LIBOR, Pay Fixed 1.4116% (20) 1,100
Interest Rate Swaps Receive Variable 3-month LIBOR, Pay Fixed 1.49515% (38) 1,600
Interest Rate Swaps Receive Variable 6-month EURIB, Pay Fixed 1.357% (91) 1,733
Interest Rate Swaps Receive Variable 3-month LIBOR, Pay Fixed 1.57819% (179) 6,830
Interest Rate Swaps Receive Variable 3-month LIBOR, Pay Fixed 1.58372% (36) 1,360
Interest Rate Swaps Receive Variable 3-month LIBOR, Pay Fixed 1.51277% (77) 3,510
Interest Rate Swaps Receive Variable 3-month LIBOR, Pay Fixed 1.39860% (104) 7,170
Interest Rate Swaps Receive Variable 3-month LIBOR, Pay Fixed 1.39371% (51) 3,585
Interest Rate Swaps Receive Variable 3-month LIBOR, Pay Fixed 1.39480% (51) 3,585
Interest Rate Swaps Receive Variable 6-month EURIB, Pay Fixed 0.79200% 1 444
Interest Rate Swaps Receive Variable 6-month LIBOR, Pay Variable 6-month LIBOR - 822
Interest Rate Swaps Receive Variable 6-month LIBOR, Pay Variable 6-month LIBOR - 444
Interest Rate Swaps Receive Fixed 6.72000%, Pay Variable 0-month MXIBT 3 271
Interest Rate Swaps Receive Fixed 6.12000%, Pay Variable 0-month MXIBT 27 1,837
Interest Rate Swaps Receive Fixed 5.11000%, Pay Variable 0-month MXIBT (7) 1,873
Interest Rate Swaps Receive Fixed 8.18000%, Pay Variable 3-month JIBAR (11) 707
Interest Rate Swaps Receive Fixed 5.79500%, Pay Variable 0-month MXIBT (8) 789
Interest Rate Swaps Receive Fixed 7.43000%, Pay Variable 3-month JIBAR (5) 102
Interest Rate Swaps Receive Fixed 7.44000%, Pay Variable 3-month JIBAR (30) 608
Interest Rate Swaps Receive Fixed 7.43000%, Pay Variable 3-month JIBAR (12) 246
Interest Rate Swaps Receive Fixed 4.63000%, Pay Variable 1-month TIIE (12) 2,266
Interest Rate Swaps Receive Fixed 7.85500%, Pay Variable 3-month LIBOR 3 1,659
Interest Rate Swaps Receive Fixed 9.33000%, Pay Variable 3-month JIBAR 21 300
Interest Rate Swaps Receive Fixed 1.75500%, Pay Variable 3-month LIBOR 333 13,840
Interest Rate Swaps Receive Fixed 9.33000%, Pay Variable 3-month ZIB 21 294
Interest Rate Swaps Receive Fixed 1.58700%, Pay Variable 6-month EURIB 80 2,744
Interest Rate Swaps Receive Fixed 1.47710%, Pay Variable 6-month LIBOR 18 388
Interest Rate Swaps Receive Fixed 0.05000%, Pay Variable 12-month LIBOR (8) 1,222
Interest Rate Swaps Receive Fixed 0.45800%, Pay Variable 12-month LIBOR (1) 3,033
Interest Rate Swaps Receive Fixed 0.67800%, Pay Variable 6-month EURIB - 822
Subtotal - Interest Rate Swaps $(8,475) $241,266
Total Return Swaps Equity Receive MSCI World ex-US, Pay Variable 3-month LIBOR $(3,621) $(113,942)
Total Return Swaps Equity Receive MSCI World ex-US, Pay Variable 3-month LIBOR (3,211) (110,687)
Total Return Swaps Equity Receive MSCI World ex-US, Pay Variable 3-month LIBOR (3,561) (114,431)
Subtotal - Total Return Swaps Equity $(10,393) $(339,060)
Financial Section | 65
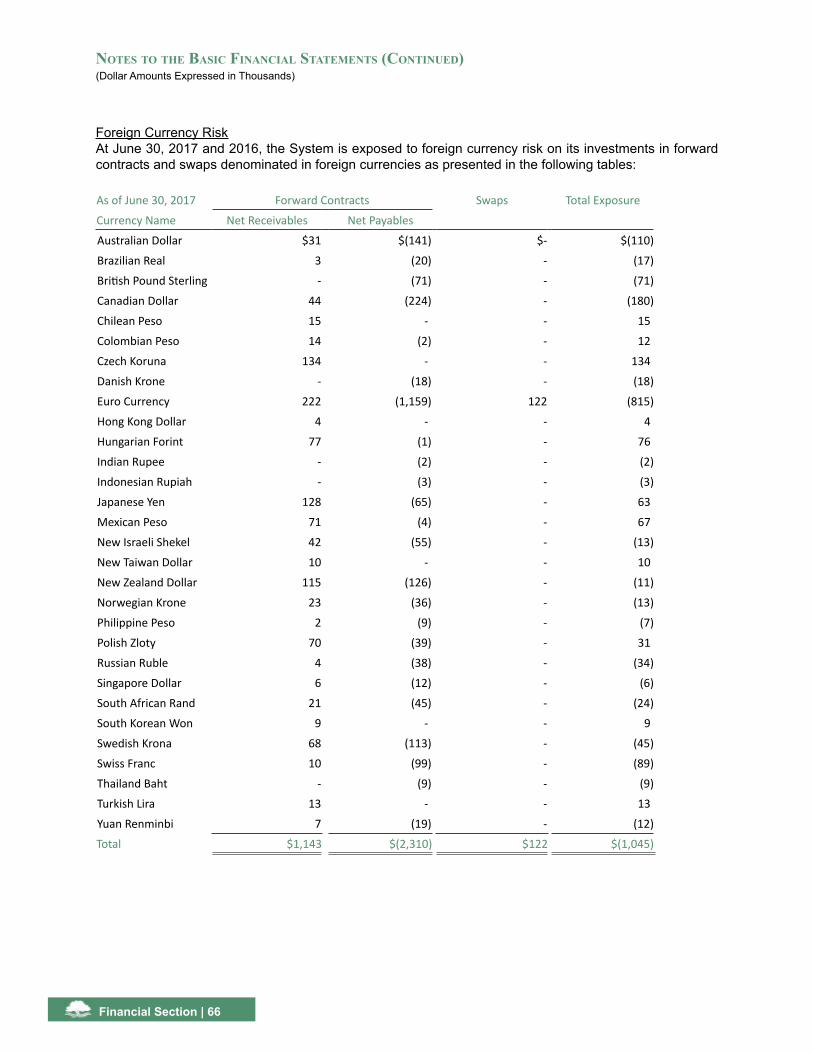
Foreign Currency RiskAt June 30, 2017 and 2016, the System is exposed to foreign currency risk on its investments in forward contracts and swaps denominated in foreign currencies as presented in the following tables:
As of June 30, 2017 Forward Contracts Swaps Total Exposure
Currency Name Net Receivables Net Payables
Australian Dollar $31 $(141) $- $(110)
Brazilian Real 3 (20) - (17)
British Pound Sterling - (71) - (71)
Canadian Dollar 44 (224) - (180)
Chilean Peso 15 - - 15
Colombian Peso 14 (2) - 12
Czech Koruna 134 - - 134
Danish Krone - (18) - (18)
Euro Currency 222 (1,159) 122 (815)
Hong Kong Dollar 4 - - 4
Hungarian Forint 77 (1) - 76
Indian Rupee - (2) - (2)
Indonesian Rupiah - (3) - (3)
Japanese Yen 128 (65) - 63
Mexican Peso 71 (4) - 67
New Israeli Shekel 42 (55) - (13)
New Taiwan Dollar 10 - - 10
New Zealand Dollar 115 (126) - (11)
Norwegian Krone 23 (36) - (13)
Philippine Peso 2 (9) - (7)
Polish Zloty 70 (39) - 31
Russian Ruble 4 (38) - (34)
Singapore Dollar 6 (12) - (6)
South African Rand 21 (45) - (24)
South Korean Won 9 - - 9
Swedish Krona 68 (113) - (45)
Swiss Franc 10 (99) - (89)
Thailand Baht - (9) - (9)
Turkish Lira 13 - - 13
Yuan Renminbi 7 (19) - (12)
Total $1,143 $(2,310) $122 $(1,045)
noTes To The basiC finanCial sTaTemenTs (ConTinued)(Dollar Amounts Expressed in Thousands)
Financial Section | 66

As of June 30, 2016 Forward Contracts Swaps Total Exposure
Currency Name Net Receivables Net Payables
Australian Dollar $43 $(51) $- $(8)
British Pound Sterling (996) 708 (2) (290)
Canadian Dollar (119) 12 - (107)
Colombian Peso - (19) - (19)
Czech Koruna (62) - - (62)
Danish Krone (4) - - (4)
Euro Currency (3) 152 (159) (10)
Hungarian Forint - 10 - 10
Indian Rupee (4) (2) - (6)
Japanese Yen 373 (174) 1,817 2,016
Malaysian Ringgit 3 - - 3
Mexican Peso (52) 10 2 (40)
New Israeli Shekel (2) - - (2)
New Taiwan Dollar (2) (9) - (11)
New Zealand Dollar 243 (210) - 33
Norwegian Krone (148) 23 - (125)
Philippine Peso - 2 - 2
Polish Zloty (24) 12 - (12)
Russian Ruble 30 (24) - 6
Singapore Dollar 15 (31) - (16)
South African Rand - (31) (14) (45)
Swedish Krona (177) 49 - (128)
Swiss Franc - 28 - 28
Turkish Lira 20 - - 20
Yuan Renminbi (3) 13 - 10
Total $(869) $468 $1,644 $1,243
The System has investments in futures contracts. As indicated on the preceding pages, futures variation margin accounts are settled each trading day and recognized as realized gains/(losses) as they are incurred. As a result, the foreign futures contracts have no fair value at June 30, 2017 and 2016.
noTes To The basiC finanCial sTaTemenTs (ConTinued)(Dollar Amounts Expressed in Thousands)
Financial Section | 67

noTes To The basiC finanCial sTaTemenTs (ConTinued)(Dollar Amounts Expressed in Thousands)
Financial Section | 68
NOTE 4 – PENSION LIABILITY AND SIGNIFICANT ASSUMPTIONS The employers’ net pension liabilities (i.e. the total pension liability determined in accordance with GASB Statement No. 67 less the System’s fiduciary net position) as of June 30, 2017 and 2016, are shown below:
Year Ending June 30
(1)Total
Pension Liability
(2)Fiduciary
Net Position
(3)Net Pension
Liability(1) - (2)
(4)Fiduciary Net
Position as a % of Total Pension
Liability(2)/(1)
2017 $10,680,998 $8,584,225 $2,096,773 80.4%2016 9,436,090 7,680,865 1,755,225 81.4%
The actuarial valuation of the System involves estimates of the amounts reported and assumptions about the probability of occurrence of events far into the future. Some examples include future salary increases and future employee mortality. The net pension liability is subject to continual revision as actual results are compared with past expectations and new estimates are made about the future. Triennially, the System requests that its actuary, Segal Consulting, perform an analysis of the appropriateness of all economic and non-economic assumptions. The most recent triennial analysis was performed as of June 30, 2016, and as a result of that analysis, the Board of Retirement approved certain changes to the actuarial assumptions, which were incorporated in the actuarial valuation as of June 30, 2017. The actuarial assumptions used for June 30, 2016 actuarial valuation were based on the June 30, 2013 triennial analysis.
Disclosure of Information about Actuarial Methods and Assumptions
The required Schedule of Changes in Net Pension Liability and Related Ratios immediately following the Notes to the Financial Statements presents multi-year trend information about whether the employers’ net pension liability is increasing or decreasing over time.
The projection of benefits for financial reporting purposes does not explicitly incorporate the potential effects of legal or contractual funding limitations.
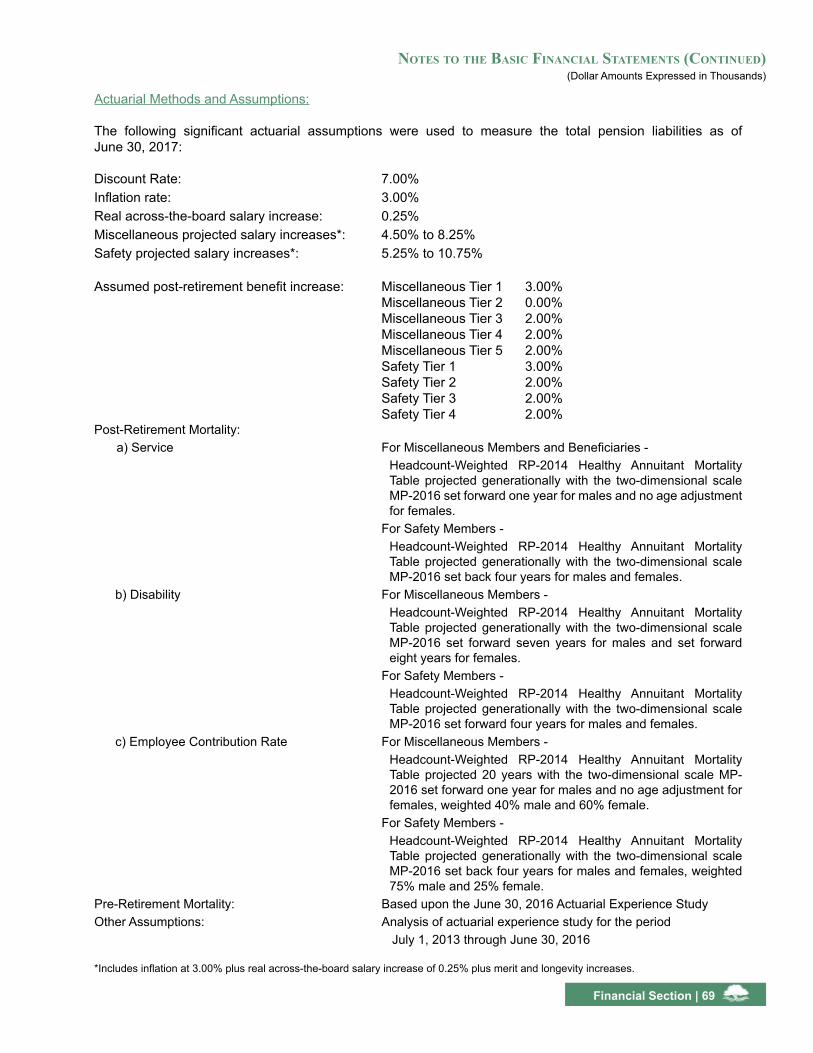
Financial Section | 69
Actuarial Methods and Assumptions:
The following significant actuarial assumptions were used to measure the total pension liabilities as of June 30, 2017:
Discount Rate: 7.00%Inflation rate: 3.00%Real across-the-board salary increase: 0.25%Miscellaneous projected salary increases*: 4.50% to 8.25%Safety projected salary increases*: 5.25% to 10.75%
Assumed post-retirement benefit increase: Miscellaneous Tier 1 3.00% Miscellaneous Tier 2 0.00% Miscellaneous Tier 3 2.00% Miscellaneous Tier 4 2.00% Miscellaneous Tier 5 2.00% Safety Tier 1 3.00% Safety Tier 2 2.00% Safety Tier 3 2.00% Safety Tier 4 2.00%Post-Retirement Mortality: a) Service For Miscellaneous Members and Beneficiaries -
Headcount-Weighted RP-2014 Healthy Annuitant Mortality Table projected generationally with the two-dimensional scale MP-2016 set forward one year for males and no age adjustment for females.
For Safety Members - Headcount-Weighted RP-2014 Healthy Annuitant Mortality Table projected generationally with the two-dimensional scale MP-2016 set back four years for males and females.
b) Disability For Miscellaneous Members - Headcount-Weighted RP-2014 Healthy Annuitant Mortality Table projected generationally with the two-dimensional scale MP-2016 set forward seven years for males and set forward eight years for females.
For Safety Members - Headcount-Weighted RP-2014 Healthy Annuitant Mortality Table projected generationally with the two-dimensional scale MP-2016 set forward four years for males and females.
c) Employee Contribution Rate For Miscellaneous Members - Headcount-Weighted RP-2014 Healthy Annuitant Mortality Table projected 20 years with the two-dimensional scale MP-2016 set forward one year for males and no age adjustment for females, weighted 40% male and 60% female.
For Safety Members - Headcount-Weighted RP-2014 Healthy Annuitant Mortality Table projected generationally with the two-dimensional scale MP-2016 set back four years for males and females, weighted 75% male and 25% female.
Pre-Retirement Mortality: Based upon the June 30, 2016 Actuarial Experience StudyOther Assumptions: Analysis of actuarial experience study for the period July 1, 2013 through June 30, 2016
*Includes inflation at 3.00% plus real across-the-board salary increase of 0.25% plus merit and longevity increases.
noTes To The basiC finanCial sTaTemenTs (ConTinued)(Dollar Amounts Expressed in Thousands)

Actuarial Methods and Assumptions:
The following significant actuarial assumptions were used to measure the total pension liabilities as of June 30, 2016:
Discount Rate: 7.50%Inflation rate: 3.25%Real across-the-board salary increase: 0.25%Miscellaneous projected salary increases*: 4.50% to 8.50%Safety projected salary increases*: 5.25% to 11.50%
Assumed post-retirement benefit increase: Miscellaneous Tier 1 3.25% Miscellaneous Tier 2 0.00% Miscellaneous Tier 3 2.00% Miscellaneous Tier 4 2.00% Miscellaneous Tier 5 2.00% Safety Tier 1 3.25% Safety Tier 2 2.00% Safety Tier 3 2.00% Safety Tier 4 2.00%Post-Retirement Mortality: a) Service For Miscellaneous Members and Beneficiaries - RP-2000 Combined Healthy Mortality Table projected with Scale BB to 2022 For Safety Members - RP-2000 Combined Healthy Mortality Table projected with Scale BB to 2022 set back one year for males and set forward two years for females b) Disability For Miscellaneous Members - RP-2000 Disabled Retiree Mortality Table projected with Scale BB to 2022 with no age adjustment for males and set forward three years for females For Safety Members - RP-2000 Combined Healthy Mortality Table projected with Scale BB to 2022 set forward two years c) Employee Contribution Rate For Miscellaneous Members - RP-2000 Combined Healthy Mortality Table projected with Scale BB to 2022 weighted 40% male and 60% female For Safety Members - RP-2000 Combined Healthy Mortality Table projected with Scale BB to 2022 set back one year for males and set forward two years for females, weighted 70% male and 30% femalePre-Retirement Mortality: Based upon the June 30, 2013 Actuarial Experience Study Other Assumptions: Analysis of actuarial experience study for the period July 1, 2010 through June 30, 2013
*Includes inflation at 3.25% plus real across-the-board salary increase of 0.25% plus merit and longevity increases.
noTes To The basiC finanCial sTaTemenTs (ConTinued)(Dollar Amounts Expressed in Thousands)
Financial Section | 70

noTes To The basiC finanCial sTaTemenTs (ConTinued)(Dollar Amounts Expressed in Thousands)
Assumed Asset Allocation
The long-term expected rate of return on pension plan investments was determined using a building-block method in which expected future real rates of return (expected returns, net of pension plan investment expense and inflation) are developed for each major asset class. These ranges are combined to produce the long-term expected rate of return by weighting the expected future real rates of return by the target asset allocation percentage and by adding expected inflation. The target allocation and projected arithmetic real rates of return for each major asset class, used in the derivation of the long-term expected investment rate of return assumption, as of June 30, 2017 and 2016 are summarized in the table below:
As of June 30, 2017
Asset ClassTarget
AllocationReal Rate of
ReturnLong-Term Expected
Portfolio Rate of ReturnU.S. large cap equity 17.0% 3.80% 5.61%U.S. small cap equity 4.0 4.90 6.37International developed equity 16.0 9.20 6.96Emerging markets equity 4.0 9.70 9.28High yield bonds 1.0 3.10 3.65Bank loans 1.0 3.00 2.96Growth oriented absolute return 3.0 4.97 4.97Private equity 9.0 8.70 8.70Private credit/private debt 4.0 5.10 5.10Core/core plus bonds 10.0 1.40 1.06Global bonds 3.0 0.20 0.07U.S. treasury 5.0 0.60 0.16Diversifying absolute return 7.0 3.04 3.04Real estate 7.0 3.00 4.37Real assets 7.0 7.74 7.74Commodities 2.0 3.40 3.76Total portfolio 100.0% 5.11% 5.15%
Inflation 3.00Investment expense adjustment (0.65)Risk adjustment (0.50)
Total long-term expected rate of return 7.00%
As of June 30, 2016
Asset ClassTarget
AllocationReal Rate of
ReturnLong-Term Expected
Portfolio Rate of ReturnDomestic equities 22.5% 6.83% 5.98%International equities 22.5 8.38 7.23Fixed income 20.0 1.24 1.25Absolute return 10.0 3.20 3.20Private equity 10.0 12.82 12.82Real assets 15.0 6.17 5.64Opportunities 0.0 0.00 0.00Total portfolio 100.0% 6.19% 5.67%
Inflation 3.25Investment expense adjustment (0.40)Risk adjustment (1.02)
Total long-term expected rate of return 7.50%
Financial Section | 71

Sensitivity of the Net Pension Liability to Changes in the Discount Rate
The discount rates used to measure the total pension liability were 7.00% and 7.50% as of June 30, 2017 and 2016, respectively. The projection of cash flows used to determine the discount rate assumed that plan member contributions will be made based on the current contribution rate and that employer contributions will be made at the end of each pay period based on the actuarially determined contribution rates. For this purpose, only the employer contributions that are intended to fund benefits for current plan members and their beneficiaries are included. Projected employer contributions that are intended to fund the service cost for future plan members and their beneficiaries, as well as projected contributions from future plan members, are not included. Based on those assumptions, the System’s fiduciary net position was projected to be available to make all the projected future benefit payments for current plan members. Therefore, the long-term expected rate of return on pension plan investments was applied to all periods of projected benefit payments to determine the total pension liability.
In accordance with GASB Statement No. 67 regarding the disclosure of the sensitivity of the net pension liability to changes in the discount rate, the table below presents the employers’ net pension liabilities as of June 30, 2017 and 2016, calculated using the discount rate, as well as what the employers’ net pension liability would be if it were calculated using a discount rate that is 1.00% lower or 1.00% higher than the current rate.
1% Decrease (6.0%)
Current Discount Rate (7.0%)
1% Increase (8.0%)
Net pension liability as of June 30, 2017 $3,611,235 $2,096,773 $860,712
1% Decrease (6.5%)
Current Discount Rate (7.5%)
1% Increase (8.5%)
Net pension liability as of June 30, 2016 $2,983,885 $1,755,225 $737,575
NOTE 5 - CONTRIBUTIONS REQUIRED AND CONTRIBUTIONS MADE Contributions to the plan are made pursuant to Section 31584 of the County Employees Retirement Law of 1937. The System’s funding policy provides for periodic contributions at actuarially-determined rates that, expressed as percentages of annual covered payroll, are sufficient to accumulate adequate assets to pay benefits when due. Members of the System are required to contribute, and such contributions range from 2.30% to 21.86% of annual covered salary for fiscal year 2016-2017 and from 2.30% to 21.78% of annual covered salary for fiscal year 2015-2016 depending on the member’s tier, employer, and bargaining unit. Each employer of the System is obligated by state law to make all required contributions to the plan and depending on the participating employer and their employees’ tiers, such contribution rates range from 13.18% to 41.93% of covered payroll for fiscal year 2016-2017 and from 14.87% to 43.65% of covered payroll for fiscal year 2015-2016. The required contributions include current service cost and amortization of any unfunded prior service cost as of June 30, 2012 over a period of 23 years from June 30, 2012, amortization of any unfunded service costs resulting in actuarial gains or losses and amortization of any unfunded service costs resulting from changes in actuarial assumptions and methods over a 20-year period, amortization of any unfunded service costs resulting from plan amendments over a 15 year period and amortization of any unfunded service costs resulting from retirement incentive programs over a period of up to 5 years.
noTes To The basiC finanCial sTaTemenTs (ConTinued)(Dollar Amounts Expressed in Thousands)
Financial Section | 72

Employer contribution rates are determined using the entry age normal cost method based on a level percentage of payroll. The System also uses this actuarial method to amortize the unfunded liability, if applicable. Contributions for the years ended June 30, 2017 and 2016 totaled $293,417 and $286,514, respectively. Included in this total are employer contributions of $203,928 and $209,020 in fiscal years 2016-2017 and 2015-2016, respectively, of which $184,608 and $190,936 were made by the County of Sacramento. Member contributions were $89,489 and $77,494 in fiscal years 2016-2017 and 2015-2016, respectively. All contributions were made in accordance with actuarially-determined contribution requirements based on the actuarial valuations performed as of June 30, 2015 and 2014, respectively.
NOTE 6 – RESERVES
Member and employer contributions are allocated to various legally required reserve accounts based on actuarial determinations. Descriptions of the purpose for the reserve and designated accounts are provided below.
Employee reserves represent the balance of member contributions. Additions include member contributions and interest earnings. Deductions include refunds of member contributions and transfers to retiree reserves.
Employer reserves represent the balance of employer contributions for future retirement payments to current active members. Additions include contributions from the employer and interest earnings. Deductions include transfers to retiree reserves, lump sum death benefits, and payments under California Government Code Sections 31725.5 and 31725.6 related to alternative employment for members otherwise entitled to disability retirement benefits.
Retiree reserves represent the balance of transfers from employee reserves, employer reserves, and interest earnings, less payments to retired members.
Retiree death benefit reserves represent the balance of funds for lump sum death benefits for retirees. Additions include interest earnings and, if necessary, employer contributions. Deductions include payments to beneficiaries of retired members who are deceased.
Contingency reserve was created to serve as a reserve against deficiencies in future earnings and unexpected expenses.
Investment gains and losses are recognized (smoothed) over a seven-year period. Total allocated reserves and designations represents the smoothed actuarial value of assets (the fair value of assets less the unrecognized/deferred gains and losses) and is the sum of the preceding reserves. As of June 30, 2017 and 2016, total allocated reserves were $8,665,226 and $8,236,402, respectively.
Market stabilization reserve represents the unrecognized/deferred gains and losses and is the difference between the smoothed actuarial value of assets and the net position restricted for pension benefits at fair value.
noTes To The basiC finanCial sTaTemenTs (ConTinued)(Dollar Amounts Expressed in Thousands)
Financial Section | 73
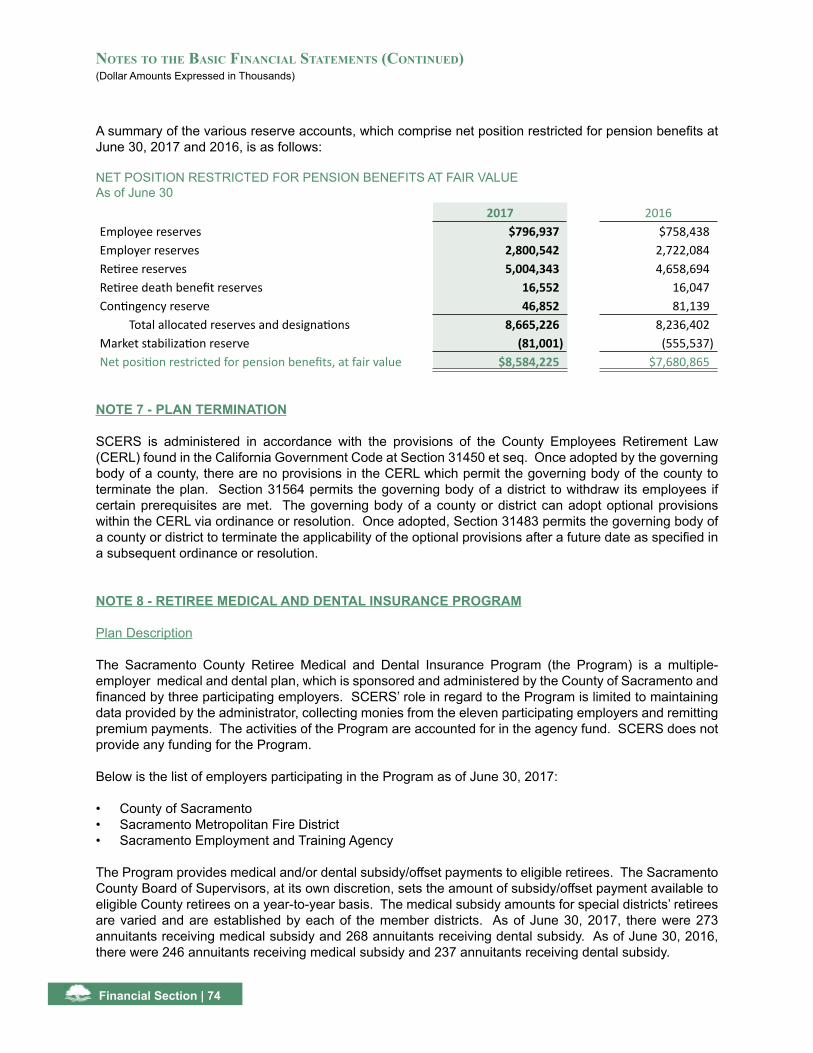
A summary of the various reserve accounts, which comprise net position restricted for pension benefits at June 30, 2017 and 2016, is as follows:
NET POSITION RESTRICTED FOR PENSION BENEFITS AT FAIR VALUE As of June 30
2017 2016Employee reserves $796,937 $758,438Employer reserves 2,800,542 2,722,084 Retiree reserves 5,004,343 4,658,694 Retiree death benefit reserves 16,552 16,047 Contingency reserve 46,852 81,139
Total allocated reserves and designations 8,665,226 8,236,402Market stabilization reserve (81,001) (555,537) Net position restricted for pension benefits, at fair value $8,584,225 $7,680,865
NOTE 7 - PLAN TERMINATION
SCERS is administered in accordance with the provisions of the County Employees Retirement Law (CERL) found in the California Government Code at Section 31450 et seq. Once adopted by the governing body of a county, there are no provisions in the CERL which permit the governing body of the county to terminate the plan. Section 31564 permits the governing body of a district to withdraw its employees if certain prerequisites are met. The governing body of a county or district can adopt optional provisions within the CERL via ordinance or resolution. Once adopted, Section 31483 permits the governing body of a county or district to terminate the applicability of the optional provisions after a future date as specified in a subsequent ordinance or resolution.
NOTE 8 - RETIREE MEDICAL AND DENTAL INSURANCE PROGRAM
Plan Description
The Sacramento County Retiree Medical and Dental Insurance Program (the Program) is a multiple-employer medical and dental plan, which is sponsored and administered by the County of Sacramento and financed by three participating employers. SCERS’ role in regard to the Program is limited to maintaining data provided by the administrator, collecting monies from the eleven participating employers and remitting premium payments. The activities of the Program are accounted for in the agency fund. SCERS does not provide any funding for the Program.
Below is the list of employers participating in the Program as of June 30, 2017: • County of Sacramento • Sacramento Metropolitan Fire District • Sacramento Employment and Training Agency
The Program provides medical and/or dental subsidy/offset payments to eligible retirees. The Sacramento County Board of Supervisors, at its own discretion, sets the amount of subsidy/offset payment available to eligible County retirees on a year-to-year basis. The medical subsidy amounts for special districts’ retirees are varied and are established by each of the member districts. As of June 30, 2017, there were 273 annuitants receiving medical subsidy and 268 annuitants receiving dental subsidy. As of June 30, 2016, there were 246 annuitants receiving medical subsidy and 237 annuitants receiving dental subsidy.
noTes To The basiC finanCial sTaTemenTs (ConTinued)(Dollar Amounts Expressed in Thousands)
Financial Section | 74

Eligibility
County annuitants who retired after May 31, 2007 - According to the Program’s Administrative Policy, only County annuitants from bargaining units 003, who retired after May 31, 2007, may be eligible for a premium subsidy/offset depending on the annuitant’s credited service hours and type of retirement. For calendar years 2017 and 2016, the monthly dental subsidy is $25, and the monthly medical subsidy amounts range from $122 to $244 depending on the annuitant’s credited service hours.
Special Districts’ annuitants - The medical subsidy amounts for special districts’ annuitants are varied and are established by each of the member districts.
There are no vested benefits associated with the Program. The Program does not create any contractual, regulatory, or other vested entitlement to present or future retirees, their spouses, or dependents for medical and/or dental benefits, or subsidy/offset payments at any particular level, or at all. Sacramento County and other participating employers may, in their sole discretion, amend or terminate, in whole or in part, the Program by Resolution of the Board of Supervisors.
Contributions and Reserves
The System does not have any authority to establish or amend the obligations of the plan members and employers to contribute to the Program. SCERS does not determine the contribution rate or collect the required contributions from employers. SCERS’ role in regards to the Program is limited to collecting monies from Sacramento County and paying the premiums when due. Monies received by the System in excess of liabilities to pay premiums are recognized as liabilities payable to the County. There are no net position or legally required reserve accounts for the Program.
In accordance with GASB Statement No. 45, Accounting and Financial Reporting by Employers for Postemployment Benefits Other Than Pensions, each participating employer is required to disclose the Program information with regard to funding policy, the employer’s annual Other Postemployment Benefits cost and contributions made, the funded status and funding progress, and actuarial methods and assumptions used. Request for Information
Requests for additional financial information regarding the Program may be addressed to:
County of Sacramento, Department of FinanceAuditor-Controller Division700 H Street, Room 3650Sacramento, CA 95814
Financial Section | 75
noTes To The basiC finanCial sTaTemenTs (ConTinued)(Dollar Amounts Expressed in Thousands)

NOTE 9 – MORTGAGES PAYABLE
The System has real estate investments secured by long-term mortgage obligations which are not recourse loans against the System’s assets. Activities related to such mortgages were as follows for the years ended June 30:
2017 2016Beginning Balance $63,500 $111,350Additions - - Deductions - (47,850)Ending Balance $63,500 $63,500
Future debt service requirements for outstanding mortgages are as follows:
Year EndingJune 30 Interest Principal Total2018 $2,293 $- $2,293 2019 1,746 13,500 15,246 2020 1,747 - 1,747 2021 930 39,000 39,9302022 289 11,000 11,289Total $7,005 $63,500 $70,505
NOTE 10 – LEASE OBLIGATIONS
SCERS has commitments under operating lease agreements for office facilities and equipment. Minimum future rental payments as of June 30, 2017 were as follows:
Year Ending June 30:2018 $588 2019 596 2020 600 2021 505 Total $2,289
Rental costs during the years ended June 30, 2017 and 2016 were $590 and $593, respectively.
NOTE 11 – SUBSEQUENT EVENTS
The potential for subsequent events were evaluated from the year-end report date of June 30, 2017 through December 7, 2017, which is the date the financial statements were available to be issued. Management did not identify any subsequent events that would require disclosure.
Financial Section | 76
noTes To The basiC finanCial sTaTemenTs (ConTinued)(Dollar Amounts Expressed in Thousands)

NOTE 12 – FUTURE ACCOUNTING PRONOUNCEMENTS
In January 2017, GASB issued Statement No. 84, Fiduciary Activities, which establishes criteria for identifying and reporting fiduciary activities of all state and local governments. The requirements of this statement are effective for financial statements for periods beginning after December 15, 2018.
In June 2017, GASB issued Statement No. 87, Leases, which establishes a single model for lease accounting based on the foundational principle that leases are financings of the right to use an underlying asset. This statement improves accounting and financial reporting for leases by governments by requiring recognition of certain lease assets and liabilities for leases that previously were classified as operating leases and recognized as inflows of resources or outflows of resources based on the payment provisions of the contract. The requirements of this statement are effective for financial statements for periods beginning after December 15, 2019.
noTes To The basiC finanCial sTaTemenTs (ConTinued)(Dollar Amounts Expressed in Thousands)
Financial Section | 77
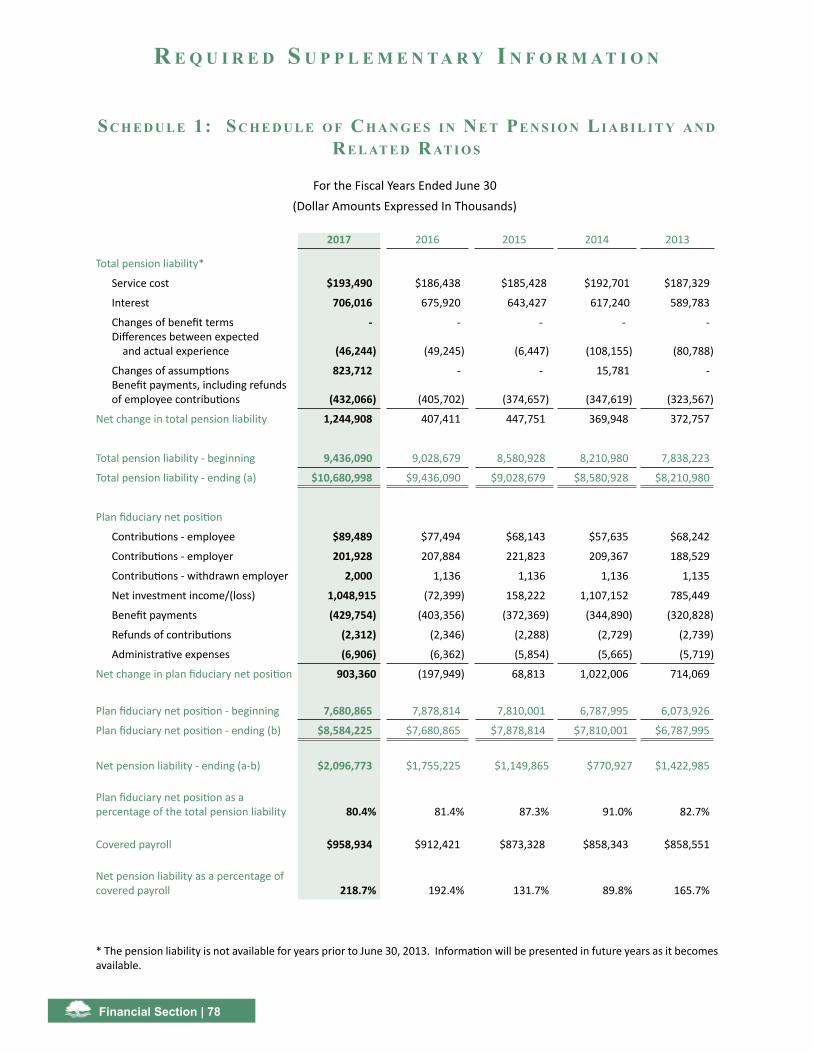
Financial Section | 78
r e q u i r e d s u P P l e m e n T a r y i n f o r m a T i o n
For the Fiscal Years Ended June 30(Dollar Amounts Expressed In Thousands)
2017 2016 2015 2014 2013
Total pension liability*
Service cost $193,490 $186,438 $185,428 $192,701 $187,329
Interest 706,016 675,920 643,427 617,240 589,783
Changes of benefit terms - - - - -Differences between expected and actual experience (46,244) (49,245) (6,447) (108,155) (80,788)
Changes of assumptions 823,712 - - 15,781 -Benefit payments, including refunds of employee contributions (432,066) (405,702) (374,657) (347,619) (323,567)
Net change in total pension liability 1,244,908 407,411 447,751 369,948 372,757
Total pension liability - beginning 9,436,090 9,028,679 8,580,928 8,210,980 7,838,223
Total pension liability - ending (a) $10,680,998 $9,436,090 $9,028,679 $8,580,928 $8,210,980
Plan fiduciary net position
Contributions - employee $89,489 $77,494 $68,143 $57,635 $68,242
Contributions - employer 201,928 207,884 221,823 209,367 188,529
Contributions - withdrawn employer 2,000 1,136 1,136 1,136 1,135
Net investment income/(loss) 1,048,915 (72,399) 158,222 1,107,152 785,449
Benefit payments (429,754) (403,356) (372,369) (344,890) (320,828)
Refunds of contributions (2,312) (2,346) (2,288) (2,729) (2,739)
Administrative expenses (6,906) (6,362) (5,854) (5,665) (5,719)
Net change in plan fiduciary net position 903,360 (197,949) 68,813 1,022,006 714,069
Plan fiduciary net position - beginning 7,680,865 7,878,814 7,810,001 6,787,995 6,073,926
Plan fiduciary net position - ending (b) $8,584,225 $7,680,865 $7,878,814 $7,810,001 $6,787,995
Net pension liability - ending (a-b) $2,096,773 $1,755,225 $1,149,865 $770,927 $1,422,985
Plan fiduciary net position as a percentage of the total pension liability 80.4% 81.4% 87.3% 91.0% 82.7%
Covered payroll $958,934 $912,421 $873,328 $858,343 $858,551
Net pension liability as a percentage of covered payroll 218.7% 192.4% 131.7% 89.8% 165.7%
* The pension liability is not available for years prior to June 30, 2013. Information will be presented in future years as it becomes available.
sC h e d u l e 1: sC h e d u l e o f Ch a n g e s i n ne T Pe n s i o n li a b i l i T y a n d re l aT e d raT i o s
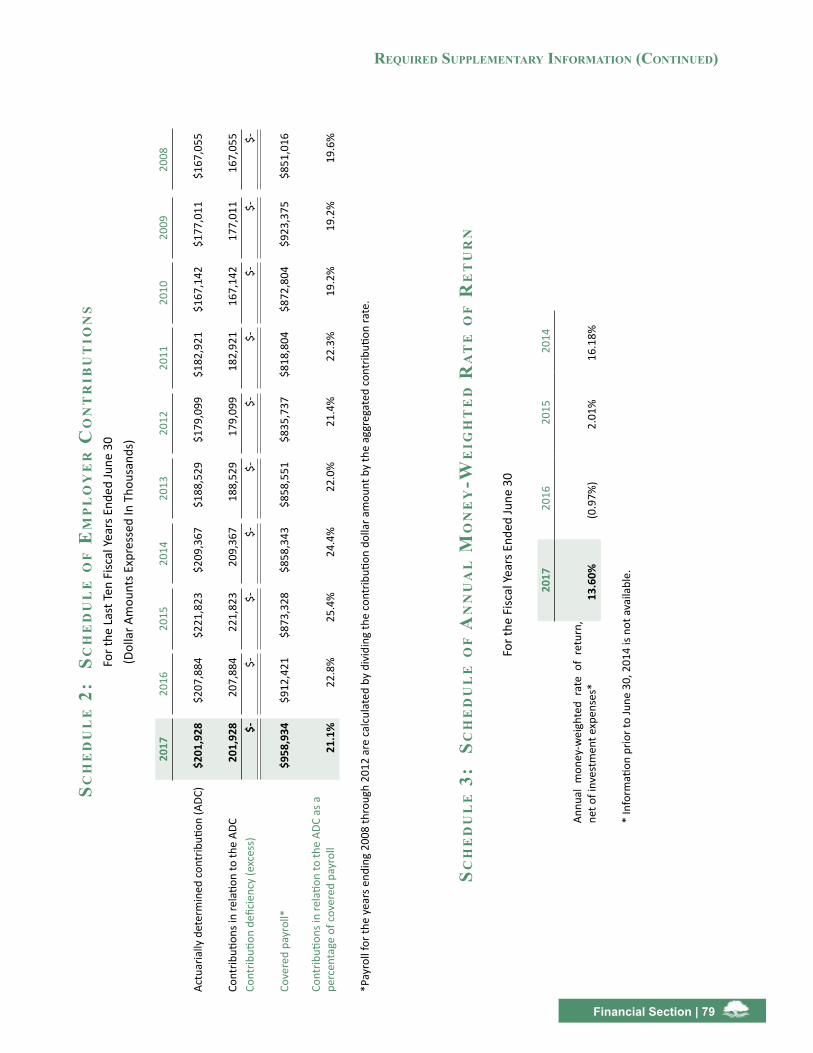
Financial Section | 79
required suPPlemenTary informaTion (ConTinued)
sCh
ed
ul
e 2
: s
Ch
ed
ul
e o
f e
mP
lo
ye
r C
on
Tr
ibu
Tio
ns
For t
he L
ast T
en F
iscal
Yea
rs E
nded
June
30
(Dol
lar A
mou
nts E
xpre
ssed
In T
hous
ands
)
2017
2016
2015
2014
2013
2012
2011
2010
2009
2008
Actu
aria
lly d
eter
min
ed c
ontr
ibuti
on (A
DC)
$201
,928
$207
,884
$22
1,82
3 $
209,
367
$18
8,52
9 $
179,
099
$18
2,92
1 $
167,
142
$17
7,01
1 $
167,
055
Cont
ributi
ons i
n re
latio
n to
the
ADC
201,
928
207,
884
221
,823
209
,367
188
,529
1
79,0
99
182
,921
1
67,1
42
177
,011
1
67,0
55
Cont
ributi
on d
efici
ency
(exc
ess)
$-$-
$-
$-
$-
$-
$-
$-
$-
$-
Cove
red
payr
oll*
$958
,934
$912
,421
$87
3,32
8 $
858,
343
$85
8,55
1 $
835,
737
$81
8,80
4 $
872,
804
$92
3,37
5 $
851,
016
Cont
ributi
ons i
n re
latio
n to
the
ADC
as a
pe
rcen
tage
of c
over
ed p
ayro
ll21
.1%
22.8
%25
.4%
24.4
%22
.0%
21.4
%22
.3%
19.2
%19
.2%
19.6
%
*Pay
roll
for t
he y
ears
end
ing
2008
thro
ugh
2012
are
cal
cula
ted
by d
ivid
ing
the
cont
ributi
on d
olla
r am
ount
by
the
aggr
egat
ed c
ontr
ibuti
on ra
te.
sCh
ed
ul
e 3
: s
Ch
ed
ul
e o
f a
nn
ua
l m
on
ey
-We
igh
Te
d r
aT
e o
f r
eT
ur
n
For t
he F
iscal
Yea
rs E
nded
June
30
2017
2016
2015
2014
Annu
al m
oney
-wei
ghte
d ra
te o
f re
turn
, ne
t of i
nves
tmen
t exp
ense
s*13
.60%
(0.9
7%)
2.01
%16
.18%
* In
form
ation
prio
r to
June
30,
201
4 is
not a
vaila
ble.

Financial Section | 80
The schedules presented in the Required Supplementary Information provide information to help promote an understanding of the employers’ net pension liability over time on a market value of assets basis. The Schedule of Changes in Net Pension Liability and Related Ratios includes historical trend information about the System’s total pension liability and the progress made in accumulating sufficient assets to pay benefits when due.
The Schedule of Employer Contributions presents historical trend information about the actuarially determined contribution and the actual contributions made. The Schedule of Annual Money-Weighted Rate of Return presents investment performance, net of pension plan investment expense, adjusted for the changing amounts actually invested.
CHANGE OF ASSUMPTIONS
Triennially, the System requests that its actuary perform an analysis of the appropriateness of all economic and non-economic assumptions. The most recent triennial analysis was performed as of June 30, 2016. As a result of that analysis, the Board of Retirement approved the following changes to the actuarial assumptions, which were first incorporated in the June 30, 2017 valuation:
• The inflation rate was reduced from 3.25% to 3.0% to reflect the gradual decline of average inflation rates over the last several years.
• The investment rate of return was reduced from 7.50% to 7.00% to reflect the projected real rate of return for the next 10-15 years based on SCERS’ asset allocation model and risk tolerance.
• The salary increase assumption was adjusted slightly to reflect past experience.• The retirement rates were adjusted to be more in line with the experience.• The mortality rates were adjusted and a generational approach was used to reflect a slight mortality
improvement. • Termination rates were adjusted to reflect lower incidence of termination, with a lower proportion
electing to receive a deferred vested benefit.• The disability rates were adjusted to reflect slightly lower incidence of disability for Miscellaneous and
Safety members.• An assumption was introduced for new Miscellaneous disabled retirees to anticipate conversions of
unused sick leave at retirement.• The June 30, 2017 actuarial valuation establishes the funding requirements for FY 2018-2019 and
analyzes the FY 2016-2017 experience. As a result, while the total pension liability and future funding requirements are measured using these assumption changes, FY 2016-2017 experience (i.e., differences between expected and actuarial experience) were based on assumptions used in the June 30, 2016 valuation.
required suPPlemenTary informaTion (ConTinued)

Financial Section | 81
METHODS AND ASSUMPTIONS USED TO ESTABLISH ACTUARIALLY DETERMINED CONTRIBUTION RATES
The following actuarial methods and assumptions were used to determine contribution rates reported in the Schedule of Employer Contributions:
Valuation date: Actuarially determined contribution rates are calculated as of June 30, two years prior to the end of the fiscal year in
which contributions are reported.Actuarial cost method: Entry Age Cost MethodAmortization method: Level percent of payroll (3.50% payroll growth assumed) Remaining amortization period: Effective with the June 30, 2013 valuation, the System’s
remaining outstanding balance of the June 30, 2012 UAAL is being amortized over a declining 23-year period (20 years as of June 30, 2015). The UAAL established as a result of the Early Retirement Incentive Program for LEMA members is amortized over a 10-year period beginning June 30, 2010. The change in UAAL that arises due to actuarial gains or losses or from changes in actuarial assumptions or methods at each valuation is amortized over its own declining 20-year period. Any change in UAAL that arises due to plan amendments will be amortized over its own declining 15-year period and any change in UAAL due to retirement incentive programs will be amortized over its own declining period of up to 5 years.
Asset valuation method: The market value of assets less unrecognized returns in each of the last six years. Unrecognized return is equal to the difference between actual and expected returns on a market value basis and is recognized over a rolling seven-year period. The deferred return is further adjusted, if necessary, so that the actuarial value of assets will stay within 30% of the market value of assets. Deferred gains and losses as of June 30, 2013 have been combined and will be recognized in equal amounts over a six-year period starting July 1, 2013.
Actuarial assumptions: Investment rate of return: 7.50%, net of pension plan investment expense, including
inflation Inflation rate: 3.25% Projected salary increases: 4.50% - 11.50% varying by service, including inflation Assumed post-retirement benefit increase: Miscellaneous Tier 1 3.25% Miscellaneous Tier 2 0.00% Miscellaneous Tier 3 2.00% Miscellaneous Tier 4 2.00% Miscellaneous Tier 5 2.00% Safety Tier 1 3.25% Safety Tier 2 2.00% Safety Tier 3 2.00% Safety Tier 4 2.00% Other assumptions: Same as those used in June 30, 2015 funding actuarial
valuation. Other information: All members with membership dates on or after
January 1, 2013 enter the new tiers created by the California Public Employees’ Pension Reform Act of 2013 (PEPRA).
required suPPlemenTary informaTion (ConTinued)

Changes in Methods and Assumptions Used
Valuation date as of June 30:
2006 • Employee contribution crediting rate is equal to 5-year Treasury rate, assuming sufficient net earnings.
2007 • Investment return assumption increased from 7.75% to 7.875%.• Salary increase assumption increased from 5.45% to 5.65%.
2010 • Investment return assumption decreased from 7.875% to 7.75%.
2011 • Modification in non-economic assumptions.
2012• Investment return assumption decreased from 7.75% to 7.50%; • Inflation assumption decreased from 3.50% to 3.25%;• Salary increase assumption decreased from 5.65% to 5.40%;• Cost-of-living adjustment increase assumption for Tier 1 decrease from 3.40% to
3.25%.2013 • Actuarial cost method changed from Aggregate Entry Age Normal Cost Method to
Individual Entry Age Normal Cost Method.• Changes to the amortization periods used for various future changes in liability:
• UAAL established as a result of Early Retirement Incentive Program for Sacramento County Law Enforcement Managers Association (LEMA) is amortized over a 10-year period beginning June 30, 2010;
• UAAL as a result of actuarial gains or losses as of June 30 will be amortized over a 20-year period;
• UAAL as a result of changes in actuarial assumptions or methods to be amortized over a 20-year period;
• Change in UAAL as a result of plan amendments to be amortized over a 15-year period;
• UAAL as a result from retirement incentive programs will be amortized over a period up to 5 years.
2014• The retirement rates were adjusted to reflect slightly later retirements.• The mortality rates were adjusted to reflect a slight mortality improvement.• Termination rates were adjusted to reflect lower incidence of termination, with a higher
proportion electing to receive a deferred vested benefit.• Years of service instead of age was used in determining and applying the merit and
promotional rates of salary increase.
required suPPlemenTary informaTion (ConTinued)
Financial Section | 82
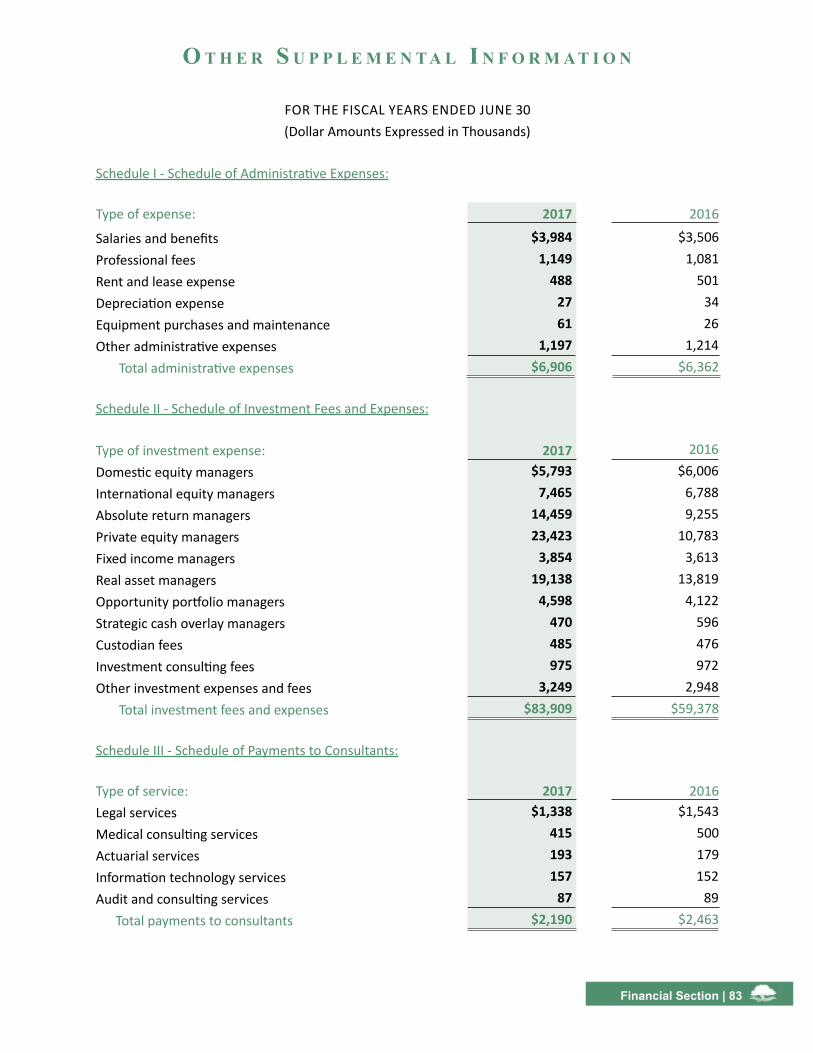
Financial Section | 83
o T h e r s u P P l e m e n T a l i n f o r m a T i o n
FOR THE FISCAL YEARS ENDED JUNE 30(Dollar Amounts Expressed in Thousands)
Schedule I - Schedule of Administrative Expenses:
Type of expense: 2017 2016
Salaries and benefits $3,984 $3,506 Professional fees 1,149 1,081 Rent and lease expense 488 501 Depreciation expense 27 34 Equipment purchases and maintenance 61 26 Other administrative expenses 1,197 1,214 Total administrative expenses $6,906 $6,362
Schedule II - Schedule of Investment Fees and Expenses:
Type of investment expense: 2017 2016Domestic equity managers $5,793 $6,006 International equity managers 7,465 6,788 Absolute return managers 14,459 9,255 Private equity managers 23,423 10,783 Fixed income managers 3,854 3,613 Real asset managers 19,138 13,819 Opportunity portfolio managers 4,598 4,122 Strategic cash overlay managers 470 596 Custodian fees 485 476 Investment consulting fees 975 972 Other investment expenses and fees 3,249 2,948 Total investment fees and expenses $83,909 $59,378
Schedule III - Schedule of Payments to Consultants:
Type of service: 2017 2016Legal services $1,338 $1,543 Medical consulting services 415 500 Actuarial services 193 179 Information technology services 157 152 Audit and consulting services 87 89 Total payments to consultants $2,190 $2,463

sTaT e m e n T s o f Ch a n g e s i n as s e T s a n d li a b i l i T i e sA G E N C Y F U N D
FOR THE FISCAL YEARS ENDED JUNE 30, 2017 AND 2016
(Dollar Amounts Expressed in Thousands)
Assets 2017 2016
Beginning accounts receivable balance $47 $31
Additions 27,891 26,545
Deductions (27,910) (26,529)
Ending accounts receivable balance $28 $47
Liabilities
Beginning accounts payable balance $47 $31
Additions 27,891 26,545
Deductions (27,910) (26,529)
Ending accounts payable balance $28 $47
Financial Section | 84

Financial Section | 85
This page intentionally left blank.


INVESTMENT

C h i e f i n v e s T m e n T o f f i C e r ’ s r e P o r T
Investment Section | 88
Introduction
For the fiscal year ended June 30, 2017, the Sacramento County Employees’ Retirement System (SCERS or the System) generated a robust 13.7% gross return, benefitting from strong returns across most market segments. This was a welcome change after near flat performance over the past two fiscal years. Despite valuation concerns across many market segments, asset prices marched higher during the fiscal year, with the strongest returns coming from the public equity asset classes. While there were short-lived spikes in volatility, markets were generally calm for most of the year.
SCERS’ gross return of 13.7% was also impressive on a relative basis, exceeding its policy index return of 11.7%, by 2%. Contributors to the generation of excess returns relative to SCERS’ policy index were the Domestic and International Equity, Fixed Income, Absolute Return, Real Assets and Opportunities asset classes. Assets under management ended the current fiscal year at $8.6 billion, which is a historical peak level for SCERS, and well ahead of the prior fiscal year’s assets of $7.7 billion.
SCERS’ general investment consultant, Verus Advisory (Verus), prepared the investment returns cited in this transmittal using information it receives from SCERS’ custodian bank and investment managers. Market Overview
Global financial markets generated strong returns during the 2016-2017 fiscal year, with global equities leading the way. Credit markets also performed well, while the broader bond markets including Treasuries generated slightly negative returns. The year was marked generally by market tranquility, with implied volatility residing near historical lows throughout; though there were several short-lived surges in volatility mixed in. These surges were mostly sparked by political elections, particularly the ‘Brexit’ vote early in the fiscal year, the election of President Trump late in calendar year 2016, and the potential for an increasing focus on ‘populist politics’ going forward. However, the election of Emmanuel Macron in the French presidential election early in 2017 went against this trend, and markets were calm for most of the second half of the fiscal year. Benchmark returns across SCERS’ asset and sub asset classes were as follows: Domestic equity markets (Russell 3000 Index) returned 18.5%; International developed equity markets (MSCI EAFE Index) returned 20.8%; Emerging equity markets (MSCI Emerging Markets Index) returned 23.2%; Fixed income markets (SCERS custom benchmark) returned 0.4%; Real estate markets (NFI-ODCE Index) returned 7.9%; Absolute return markets (HFRI Fund of Funds Composite Index) returned 6.4%; and Commodities markets (Bloomberg Commodity Index) returned (6.5%).
Within equities during the year, there were fewer divergences compared to prior years, with all segments and markets delivering double digit returns. Within the U.S., small capitalization stocks at 24.6% outperformed large capitalization stocks at 18.0%, and growth stocks at 20.4% outperformed value stocks at 15.5%, driven by strong performance within the information technology sector. Value stock returns were driven by the financial sector on news that most major U.S. banks passed Federal Reserve stress tests late in the year. International equity stocks delivered robust returns of 20.3% during the year, benefitting from strong growth and reasonable valuation levels. International stocks are trading at lower valuation multiples than U.S. stocks, so if earnings growth persists, most market participants are forecasting that international stocks will outperform U.S. stocks going forward. The international equity markets also benefited from a weakening U.S. dollar against other major currencies, as unhedged international equities outperformed hedged international equities. Emerging market equities also benefitted from these same international equity themes, delivering very strong returns of 23.7%, especially during the first and second quarters of calendar year 2017. Coming off of lower valuations, emerging market corporate earnings have improved, and forecasted earnings have increased materially, particularly compared to developed markets.
Fixed income markets were generally weak during the fiscal year, with Treasuries generating negative returns of 2.3% due to moderately rising interest rates, while high yield credit generated strong returns at

Chief invesTmenT offiCer’s rePorT (ConTinued)
Investment Section | 89
12.7%. The broad based Bloomberg Barclays Aggregate index, which contains an equal mix of Treasuries, agency mortgages and investment grade credit, was for the most part flat at (0.3%) during the year.
Commodities struggled during the year, returning (6.5%), fueled by range bound but volatile energy prices. The nine years since the global financial crisis (GFC) has been marked by aggressive and coordinated global monetary policy easing measures, which has translated to strong market returns, and positive growth rates across the globe. The U.S. economy is growing at 2.1%, with inflation hovering around 1.6%, and unemployment at 4.4%. Europe and Japan are demonstrating more muted but positive growth trends, while China is growing at 6.9%. Developed market inflation levels sit within a normal range, though slightly below central bank targets. These trends translated to a more hawkish stance from central bank policy makers compared to prior years. Within the U.S., the Federal Reserve (Fed) moderately accelerated interest rate increases during the fiscal year, with several 25 basis point increases, and ended the year within a target range of 1.00% - 1.25%. Going forward, the Fed is forecasting approximately three rate hikes per year over the next few years, normalizing at 3% at the end of 2019, though many market participants expect the Fed to undershoot this target, especially if the U.S. and/or global economy demonstrate signs of weakness. The Fed also announced plans to begin reducing its balance sheet during the upcoming year, by letting its Treasury and mortgage-backed-securities positions run off. The European Central Bank (ECB) increased its level of hawkish comments during the year, and expects to gradually ease monetary policy in 2018. The Bank of Japan raised its economic forecasts during the year, but plans to maintain lower interest rates until inflation gets closer to its 2.0% target.
Looking forward, with the economy growing at a reasonable rate, strong corporate earnings, decreasing unemployment levels and moderate inflation, there doesn’t appear to be many specific events up ahead to derail the markets. However, volatility remains near historic lows, and most asset classes are priced to perfection with valuations near or above historic levels. This has made it more challenging to find attractive investment opportunities in many parts of the market, highlighting the importance of maintaining investment discipline, while seeking those opportunities which offer better relative value. In addition, the markets have already priced in the potential for growth friendly initiatives from the Trump administration, which, if they don’t materialize, could lead to increasing volatility. This environment continues to call for a portfolio with sufficient levels of diversification, and a balance of portfolio exposures across multiple economic environments and risk factors.
Asset Allocation
SCERS’ investment program is structured around a strategic asset allocation model established by SCERS’ Board with the assistance of SCERS’ investment staff, general investment consultant Verus, alternative assets consultant Cliffwater LLC (Cliffwater), and real estate consultant Townsend Holdings LLC (Townsend). The objective of the asset allocation model is to ensure the diversification of investments in a manner that generates a desired rate of investment return with an acceptable level of investment risk. To achieve this, the asset allocation is broadly diversified between asset classes and within asset classes to provide consistent long term performance. The asset allocation targets are not tactical, but rather, are long term in nature, consistent with the long term nature of SCERS’ benefit obligations. The asset allocation model is typically reviewed every three to five years, but the long term capital market assumptions for the various asset classes and sub-asset classes are reviewed and adjusted as appropriate each year. Research has shown that the asset allocation mix is the largest driver of investment performance.
During the fiscal year, SCERS completed an asset/liability modeling (ALM) study that resulted in the approval of a new strategic asset allocation. During the ALM study, SCERS’ Board identified and prioritized several investment-related plan objectives, principles and risks that played a role in the design of the new strategic asset allocation. These included: (1) Reducing portfolio volatility; (2) Improving the funding status of the plan; (3) Protecting against significant drawdowns; (4) Improving the cash flow generation of the portfolio; and (5) Determining a reasonable and realistic expected investment return for the portfolio. During the

Chief invesTmenT offiCer’s rePorT (ConTinued)
Investment Section | 90
ALM study, potential asset allocation mixes were compared for optimal results relative to a variety of risk measures, including:
• Volatility or standard deviation
• Risk factor exposures
• Performance in different economic environments
• Stress tests
• Liquidity and cash flow analysis
A significant component of the new strategic asset allocation was to view risk exposures through multiple lenses, including functional and common factor exposures, in order to manage and maintain allocations that are aligned with SCERS’ investment philosophy and objectives. This multiple lens approach used a functional framework to re-group and re-classify segments of SCERS’ prior asset allocation in order to link segments of the SCERS portfolio that are exposed to similar economic environments and risk factors, and which would be expected to have similar roles and outcomes in a portfolio. The functional regrouping took a simplified approach at the asset category level, by breaking the portfolio into three asset categories, with greater complexity reserved at the sub-asset class level. These asset categories include: (1) Growth; (2) Diversifying; and (3) Real Return.
The Growth asset category includes those segments of the portfolio that tend to perform best in a high growth and low/moderate inflationary environment, including most equity and credit investments. In contrast, they tend to perform poorly during recessionary periods, when GDP growth is contracting, or during certain periods when unexpected inflation arises. Growth assets tend to comprise the dominant allocation within most institutional investment portfolios, including that of SCERS. The Diversifying asset category includes those segments of the portfolio which are expected to protect capital and perform better than the Growth asset category during dislocated and stressed market environments, including traditional fixed income and diversifying absolute return strategies. The Real Return asset category includes those segments of the portfolio that protect against inflation, generate cash flow and provide further portfolio diversification, including real estate, infrastructure, energy, agriculture and commodities investments.
The changes to SCERS’ strategic asset allocation are summarized in the table below:
Asset Category/Asset ClassPrior
Target AllocationNew
Target Allocation ChangeGrowth 63.0% 59.0% (4.0%)
Domestic Equity 22.5 21.0 (1.5)International Equity 22.5 20.0 (2.5)Private Equity 10.0 9.0 (1.0)Public Credit 2.0 2.0 0.0Private Credit 0.0 4.0 4.0Growth Absolute Return 6.0 3.0 (3.0)
Diversifying 22.0 25.0 3.0Core/Core Plus Fixed Income 15.0 10.0 (5.0)US Treasury 0.0 5.0 5.0Global Fixed Income 3.0 3.0 0.0Diversifying Absolute Return 4.0 7.0 3.0
Real Return 15.0 16.0 1.0Real Estate 7.0 7.0 0.0Real Assets 6.0 7.0 1.0Commodities 2.0 2.0 0.0
Opportunities 0.0 0.0 0.0100.0% 100.0%

Chief invesTmenT offiCer’s rePorT (ConTinued)
Investment Section | 91
The key changes between the new strategic asset allocation and the prior are:
• A reduction in Growth assets, including public equities
• An increase in Diversifying assets, including principal protecting fixed income investments (Treasuries) and diversifying Absolute Return strategies
• An increase to cash flowing investments including Private Credit and Real Assets
The new strategic asset allocation is a more risk balanced portfolio than the prior policy portfolio with a similar expected return profile, but with lower expected volatility (standard deviation), and a narrower range of potential outcomes, making it less susceptible to negative returns during down markets. It also increases diversification, especially to investment strategies with low and negative correlations to equity markets, and is expected to generate a greater level of cash flow for SCERS’ plan.
The process of transitioning SCERS’ portfolio to the new strategic asset allocation targets began during the fiscal year, including making structural modifications to underlying asset classes and adjusting policy benchmarks, but the majority of changes will likely occur over the following fiscal years. As a result, the investment section in the current CAFR report investment information using the prior strategic asset allocation. This will be modified in future years to report investment information consistent with the new strategic asset allocation.
Investment Portfolio Implementation
In addition to providing assistance to the Board in establishing the asset allocation model, SCERS’ investment staff and consultants assist in developing investment policy statements; conduct searches for and recommend the selection of investment managers; monitor investment manager performance and compliance; advise on developments in the investment markets; and analyze and develop recommendations for possible tactical adjustments and new investment initiatives.
SCERS utilizes external investment managers to invest the System’s assets. As of June 30, 2017, SCERS’ assets were invested across: (1) Domestic Equity - nine separate account portfolios and one commingled fund; (2) International Equity - five separate account portfolios and five commingled fund partnerships; (3) Fixed Income - four separate account portfolios and one global fixed income fund; (4) Absolute Return – two separate portfolios and ten fund partnerships; (5) Private Equity - four fund-of-funds partnerships and thirty seven fund partnerships; (6) Private Credit – four fund partnerships; (7) Real Estate – two separate account portfolios, seven core real estate funds, nine value-added real estate partnerships and four opportunistic real estate partnerships; (8) Real Assets – two separate account portfolios and twelve fund partnerships; (9) Commodities - two commodity fund partnerships; (10) Opportunities - one opportunistic credit fund partnership; and (11) A portfolio overlay program, including a real assets strategy commingled fund.
Portfolio activity during the fiscal year included the following:
• In Domestic Equity, no significant changes were made during the fiscal year.
• In International Equity, SCERS engaged an investment manager to manage an international developed growth mandate, which represented a replacement search for a manager whose engagement was terminated in fiscal year 2014-2015.
• In Fixed Income, no significant changes were made during the fiscal year.
• In Absolute Return, SCERS continued implementation of the direct absolute return portfolio by making two new fund investments and increasing an investment with an existing fund during the fiscal year. An engagement with an existing absolute return fund was terminated.
•
•

Chief invesTmenT offiCer’s rePorT (ConTinued)
Investment Section | 92
• In Private Equity, SCERS continued implementation of the direct private equity investment platform, making five fund commitments during the fiscal year. SCERS also approved the annual report and annual investment plan for the Private Equity asset class for calendar year 2017.
• In Private Credit, SCERS initiated implementation of the direct private credit investment platform, making one fund commitment during the fiscal year. SCERS also approved the initial annual investment plan for the Private Credit asset class for calendar year 2017.
• In Real Estate, SCERS increased investments with two existing core real estate funds during the fiscal year, and approved the annual report and annual investment plan for the Real Estate asset class for calendar year 2017.
• In Real Assets, SCERS continued implementation of the direct real assets investment platform, making two fund commitments and increasing an investment with an existing fund during the fiscal year. SCERS also approved the annual report and annual investment plan for the Real Assets asset class for calendar year 2017.
• In the Opportunities segment, no significant changes were made during the fiscal year.
Due to the longer investment period for private market commitments, the importance of maintaining vintage year diversification, and only investing with top tier managers, it takes several years for target allocation levels to be reached in the Private Equity, Private Credit and Real Assets asset classes.
SCERS’ custodial bank is State Street Bank and Trust (State Street). In addition to asset custody services (including performance measurement), State Street provides securities lending services to SCERS and, through State Street Global Advisors and State Street Global Markets, administers a portfolio overlay program and a brokerage commission recapture program, respectively. The portfolio overlay program assures that SCERS’ portfolio exposures are consistent with the strategic asset allocation targets through cost-effective rebalancing, using investment proxies to close gaps relative to target allocation levels and to eliminate ‘cash drag’. For the fiscal year ended June 30, 2017, SCERS earned a net income of $2.5 million from securities lending and received commission recapture income of $0.05 million.
SCERS’ primary legal services regarding the investment program are provided by specialized outside legal counsel and fiduciary counsel.
During the fiscal year, investment educational sessions were provided to the Board by SCERS’ staff, investment consultants and various investment managers to assist the Board in making decisions regarding new asset classes and possible new investment mandates. The educational sessions included presentations regarding: (1) Energy infrastructure investment strategies; (2) Approaches to the development of asset classes within SCERS’ investment portfolio; and (3) Asset class construction and its impact on investment performance, funded ratio and contribution rates.
SCERS Investment Objectives
SCERS’ investment objectives are set forth in the Board’s Investment Policy Statement (Investment Policy) and through customized investment policy statements for each asset class. The Investment Policy was recently restated by the SCERS Board.
At the highest level, SCERS’ investment objectives are:
Over-arching Plan Objectives:
• Provide for current and future benefit payments to plan participants and their beneficiaries, and sustain the plan over its useful life.
Investment Section | 93
Chief invesTmenT offiCer’s rePorT (ConTinued)
• Diversify plan assets as its main defense against large market drawdowns.
• Preserve a degree of liquidity ample to meet benefit payments and capital calls, without incurring substantial transaction costs or “fire sales” of illiquid holdings.
• Incur costs that are reasonable and consistent with industry standards.
• Achieve funding goals, including the maintenance of funded status and manageable, consistent contribution rates.
• Maintain risk exposure required to meet return requirements, while limiting drawdown exposure.
Investment Performance Objectives:
• Generate returns in excess of policy benchmarks at the total fund and asset class levels over rolling three-year periods.
• Achieve real (after inflation) returns at the total fund level that are at or above the actuarial real return (assumed return less per capita pay growth) over complete market cycles.
• For asset classes and actively managed portfolios, achieve net returns that exceed policy benchmarks, and rank in the top half of a competitive, after-fee universe.
Proxy Voting Guidelines and Procedures
As a fiduciary, the Board has an obligation to manage SCERS’ assets in the best interests of the plan participants. The Board has established a Proxy Voting and Corporate Governance Policy to assist with this goal. This policy provides guidance for voting proxies and acting on corporate actions, such as mergers and acquisitions. For the fiscal year ended June 30, 2017, a majority of proxies were voted through an electronic voting platform provided by Institutional Shareholder Services, with the assistance of research and analysis provided by Institutional Shareholder Services and Glass Lewis & Co.
Summary of Investment Results
SCERS monitors capital market investment returns through reference to recognized and easily obtainable market indices, which are used as asset class benchmarks. The benchmark index performance by asset class for one, three and five years is shown on the Investment Results schedule. The asset class benchmark returns are weighted by the asset allocation to provide a policy-weighted return based on SCERS’ asset allocation. SCERS presents its returns using a time-weighted rate of return methodology based upon market values. SCERS’ general investment consultant, Verus, prepared the investment returns cited in this section using information it received from SCERS’ custodian bank and investment managers.
SCERS’ investment performance for the fiscal year ended June 30, 2017 was strong, with all major asset classes generating positive returns. International Equity, Domestic Equity and Private Equity generated the strongest positive absolute returns.
For the period, SCERS’ total fund return was 13.7%, gross of investment management fees, and 13.4%, net of investment management fees. The gross return for the fiscal year was 2.0% above SCERS’ policy weighted benchmark return of 11.7%, and was well above the actuarial return objective of 7.5%. Over the trailing three-year period, SCERS’ annualized investment return was 5.0% gross and 4.7% net. This three-year annualized return was below the actuarial return objective of 7.5%, and SCERS’ policy benchmark return of 5.3%. Over the trailing five-year period, SCERS’ annualized investment return was 8.8% gross and 8.5% net. This five-year annualized return was above the actuarial return objective of 7.5% and SCERS’ policy benchmark return of 8.4%.
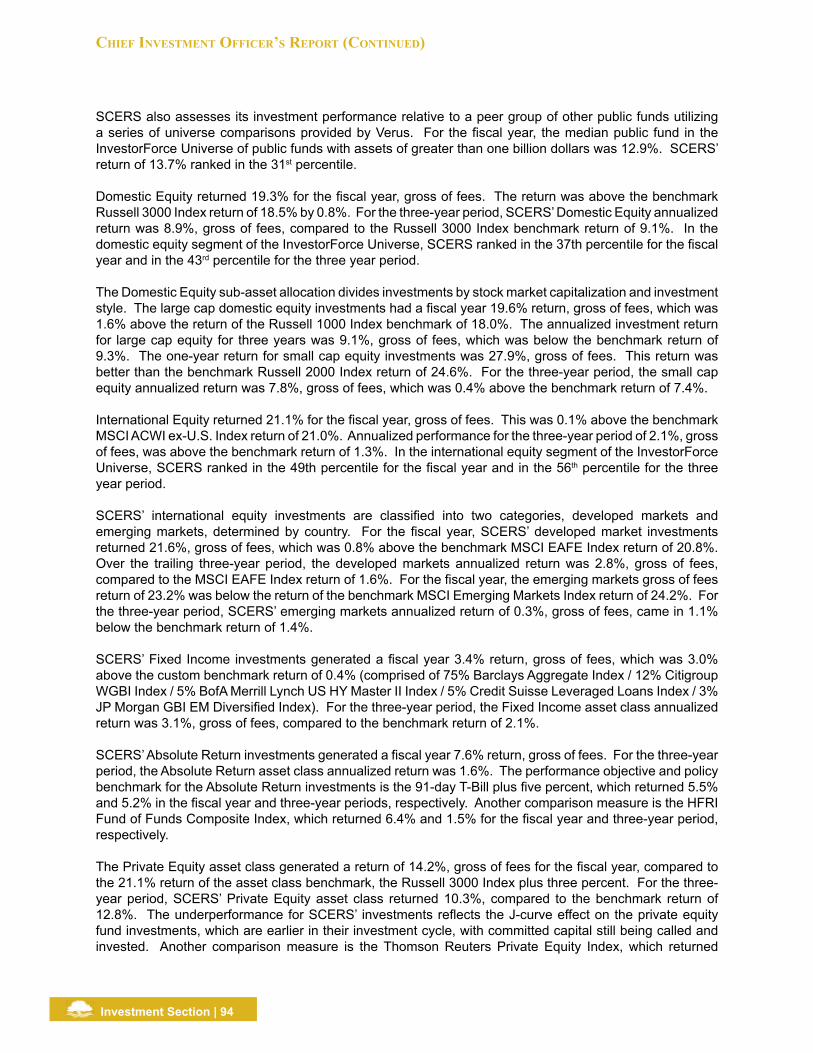
Chief invesTmenT offiCer’s rePorT (ConTinued)
Investment Section | 94
SCERS also assesses its investment performance relative to a peer group of other public funds utilizing a series of universe comparisons provided by Verus. For the fiscal year, the median public fund in the InvestorForce Universe of public funds with assets of greater than one billion dollars was 12.9%. SCERS’ return of 13.7% ranked in the 31st percentile. Domestic Equity returned 19.3% for the fiscal year, gross of fees. The return was above the benchmark Russell 3000 Index return of 18.5% by 0.8%. For the three-year period, SCERS’ Domestic Equity annualized return was 8.9%, gross of fees, compared to the Russell 3000 Index benchmark return of 9.1%. In the domestic equity segment of the InvestorForce Universe, SCERS ranked in the 37th percentile for the fiscal year and in the 43rd percentile for the three year period.
The Domestic Equity sub-asset allocation divides investments by stock market capitalization and investment style. The large cap domestic equity investments had a fiscal year 19.6% return, gross of fees, which was 1.6% above the return of the Russell 1000 Index benchmark of 18.0%. The annualized investment return for large cap equity for three years was 9.1%, gross of fees, which was below the benchmark return of 9.3%. The one-year return for small cap equity investments was 27.9%, gross of fees. This return was better than the benchmark Russell 2000 Index return of 24.6%. For the three-year period, the small cap equity annualized return was 7.8%, gross of fees, which was 0.4% above the benchmark return of 7.4%.
International Equity returned 21.1% for the fiscal year, gross of fees. This was 0.1% above the benchmark MSCI ACWI ex-U.S. Index return of 21.0%. Annualized performance for the three-year period of 2.1%, gross of fees, was above the benchmark return of 1.3%. In the international equity segment of the InvestorForce Universe, SCERS ranked in the 49th percentile for the fiscal year and in the 56th percentile for the three year period.
SCERS’ international equity investments are classified into two categories, developed markets and emerging markets, determined by country. For the fiscal year, SCERS’ developed market investments returned 21.6%, gross of fees, which was 0.8% above the benchmark MSCI EAFE Index return of 20.8%. Over the trailing three-year period, the developed markets annualized return was 2.8%, gross of fees, compared to the MSCI EAFE Index return of 1.6%. For the fiscal year, the emerging markets gross of fees return of 23.2% was below the return of the benchmark MSCI Emerging Markets Index return of 24.2%. For the three-year period, SCERS’ emerging markets annualized return of 0.3%, gross of fees, came in 1.1% below the benchmark return of 1.4%.
SCERS’ Fixed Income investments generated a fiscal year 3.4% return, gross of fees, which was 3.0% above the custom benchmark return of 0.4% (comprised of 75% Barclays Aggregate Index / 12% Citigroup WGBI Index / 5% BofA Merrill Lynch US HY Master II Index / 5% Credit Suisse Leveraged Loans Index / 3% JP Morgan GBI EM Diversified Index). For the three-year period, the Fixed Income asset class annualized return was 3.1%, gross of fees, compared to the benchmark return of 2.1%.
SCERS’ Absolute Return investments generated a fiscal year 7.6% return, gross of fees. For the three-year period, the Absolute Return asset class annualized return was 1.6%. The performance objective and policy benchmark for the Absolute Return investments is the 91-day T-Bill plus five percent, which returned 5.5% and 5.2% in the fiscal year and three-year periods, respectively. Another comparison measure is the HFRI Fund of Funds Composite Index, which returned 6.4% and 1.5% for the fiscal year and three-year period, respectively.
The Private Equity asset class generated a return of 14.2%, gross of fees for the fiscal year, compared to the 21.1% return of the asset class benchmark, the Russell 3000 Index plus three percent. For the three-year period, SCERS’ Private Equity asset class returned 10.3%, compared to the benchmark return of 12.8%. The underperformance for SCERS’ investments reflects the J-curve effect on the private equity fund investments, which are earlier in their investment cycle, with committed capital still being called and invested. Another comparison measure is the Thomson Reuters Private Equity Index, which returned

Investment Section | 95
16.7% and 11.7% for the fiscal year and three-year period, respectively. Please note that the returns of the Private Equity asset class and benchmark are lagged one quarter.
The Real Assets asset class (which includes real estate, real assets and commodities allocations under the prior asset allocation) generated a fiscal year 8.5% return, gross of fees, which was 1.9% above the benchmark CPI-U Headline Inflation Index + 5% return of 6.6%. For the three-year period, the Real Assets asset class annualized return was 3.2%, compared to the benchmark return of 5.6%. The Real Assets return includes the SSGA Real Assets Strategy, which is the proxy used within SCERS’ Overlay Program to replicate exposure while the asset class is implemented.
The Real Assets sub-asset allocation under the prior asset allocation divides investments into four categories, including: (1) Core and core plus real estate; (2) Private real assets such as infrastructure, energy, timber, agriculture or other natural resources; (3) Commodities; and (4) Treasury Inflation Protected Securities (TIPS). SCERS’ core real estate separate accounts produced an 11.8% return, gross of fees, which was 3.9% above the benchmark return of 7.9%. SCERS’ core open-ended real estate funds achieved an 8.7% gross return compared to the benchmark return of 7.9%. SCERS’ private real assets segment produced a 22.3% return, gross of fees, which was 15.7% above the benchmark return of 6.6%. SCERS’ commodities funds returned (6.9%), which was 0.4% below the benchmark return of (6.5%). During the fiscal year, SCERS did not have any allocations to TIPS.
The Opportunities investments are tactical investments across SCERS’ investable asset classes and universe. When an Opportunities investment is made, its capital is drawn from the asset class which best fits the risk and return characteristics of the underlying investments. For the fiscal year, SCERS’ Opportunities investments collectively achieved a 13.2% gross return, which was 1.5% above SCERS’ policy index 11.7% benchmark return.
Additional information regarding SCERS’ investment program can be found on the pages immediately following this report.
Respectfully submitted,
Steve DavisChief Investment Officer
Chief invesTmenT offiCer’s rePorT (ConTinued)

Investment Section | 96
a s s e T a l l o C a T i o n
Actual Asset Allocation as of June 30, 2017
US Equity 23.0%
International Equity 24.0%
Fixed Income 18.0%
Absolute Return 9.0%
Private Equity 7.8%
Real Assets 13.6%
Opportunities 2.0%
Cash and Other 2.6%
The 2017 Actual Asset Allocation is based upon the Investment Summary net of $63.5 million in real asset investment leverage.
Target Asset Allocation
US Equity 22.5%
International Equity 22.5%
Fixed Income 20.0%
Absolute Return 10.0%
Private Equity 10.0%
Real Assets 15.0%
Opportunities 0.0%
Cash and Other 0.0%
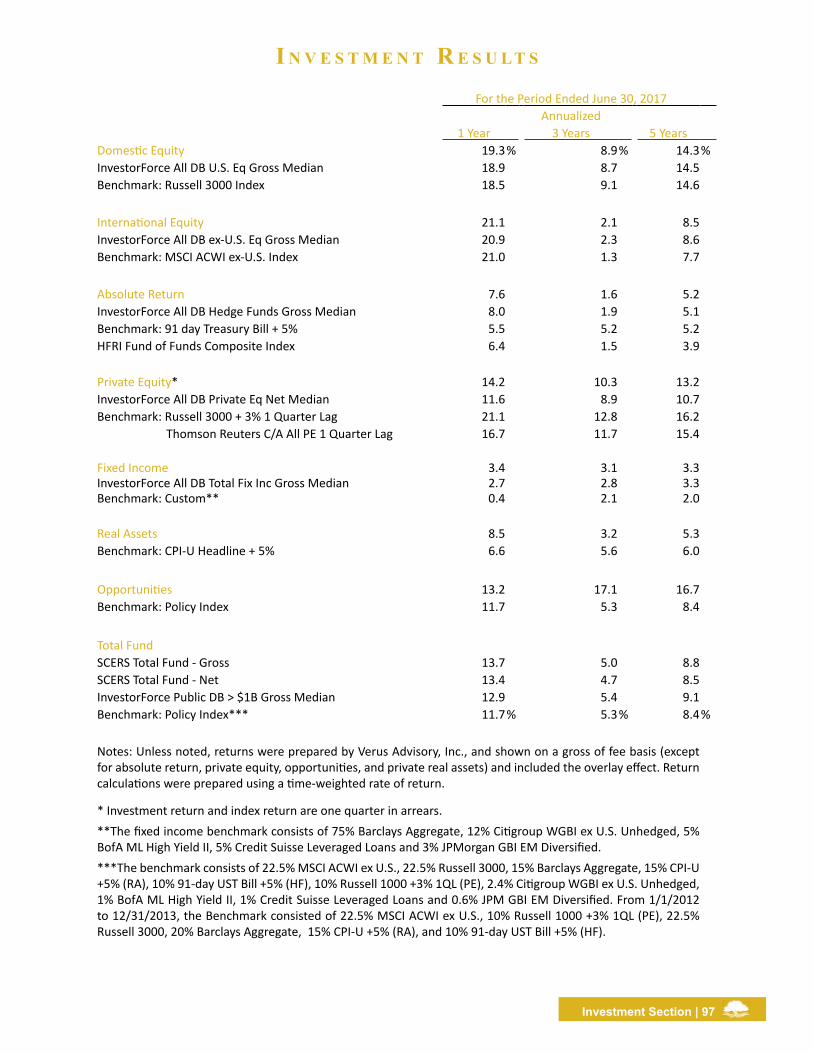
i n v e s T m e n T r e s u lT s
Investment Section | 97
For the Period Ended June 30, 2017Annualized
1 Year 3 Years 5 YearsDomestic Equity 19.3% 8.9% 14.3%InvestorForce All DB U.S. Eq Gross Median 18.9 8.7 14.5Benchmark: Russell 3000 Index 18.5 9.1 14.6
International Equity 21.1 2.1 8.5InvestorForce All DB ex-U.S. Eq Gross Median 20.9 2.3 8.6Benchmark: MSCI ACWI ex-U.S. Index 21.0 1.3 7.7
Absolute Return 7.6 1.6 5.2InvestorForce All DB Hedge Funds Gross Median 8.0 1.9 5.1Benchmark: 91 day Treasury Bill + 5% 5.5 5.2 5.2HFRI Fund of Funds Composite Index 6.4 1.5 3.9
Private Equity* 14.2 10.3 13.2InvestorForce All DB Private Eq Net Median 11.6 8.9 10.7Benchmark: Russell 3000 + 3% 1 Quarter Lag 21.1 12.8 16.2 Thomson Reuters C/A All PE 1 Quarter Lag 16.7 11.7 15.4
Fixed Income 3.4 3.1 3.3InvestorForce All DB Total Fix Inc Gross Median 2.7 2.8 3.3Benchmark: Custom** 0.4 2.1 2.0
Real Assets 8.5 3.2 5.3Benchmark: CPI-U Headline + 5% 6.6 5.6 6.0
Opportunities 13.2 17.1 16.7Benchmark: Policy Index 11.7 5.3 8.4
Total FundSCERS Total Fund - Gross 13.7 5.0 8.8SCERS Total Fund - Net 13.4 4.7 8.5InvestorForce Public DB > $1B Gross Median 12.9 5.4 9.1Benchmark: Policy Index*** 11.7% 5.3% 8.4%
Notes: Unless noted, returns were prepared by Verus Advisory, Inc., and shown on a gross of fee basis (except for absolute return, private equity, opportunities, and private real assets) and included the overlay effect. Return calculations were prepared using a time-weighted rate of return.
* Investment return and index return are one quarter in arrears.**The fixed income benchmark consists of 75% Barclays Aggregate, 12% Citigroup WGBI ex U.S. Unhedged, 5% BofA ML High Yield II, 5% Credit Suisse Leveraged Loans and 3% JPMorgan GBI EM Diversified.***The benchmark consists of 22.5% MSCI ACWI ex U.S., 22.5% Russell 3000, 15% Barclays Aggregate, 15% CPI-U +5% (RA), 10% 91-day UST Bill +5% (HF), 10% Russell 1000 +3% 1QL (PE), 2.4% Citigroup WGBI ex U.S. Unhedged, 1% BofA ML High Yield II, 1% Credit Suisse Leveraged Loans and 0.6% JPM GBI EM Diversified. From 1/1/2012 to 12/31/2013, the Benchmark consisted of 22.5% MSCI ACWI ex U.S., 10% Russell 1000 +3% 1QL (PE), 22.5% Russell 3000, 20% Barclays Aggregate, 15% CPI-U +5% (RA), and 10% 91-day UST Bill +5% (HF).

s u m m a r y o f i n v e s T m e n T a s s e T s As of June 30, 2017
(Dollar Amounts Expressed in Thousands)
Investment Section | 98
Fair Value
Percentage of Total Cash & Investments
Type of investmentsDomestic equity $2,045,526 23.65%International equity 2,049,228 23.72 Absolute return 766,986 8.88Private equity 693,885 8.02Fixed income 1,605,244 18.58Real assets 1,165,424 13.51Opportunities 176,176 2.04Overlay 71,952 0.83
Total investments at fair value 8,574,421
CashCash (Unallocated) 62,500 0.72Other cash & cash equivalents 4,065 0.05Total cash 66,565 0.77Total cash & investments 8,640,986 100.0 %
Other assetsReceivables 62,564 Other assets 501 Securities lending collateral 352,234 Total other assets 415,299 Total assets 9,056,285
LiabilitiesAccounts payable 28,026 Investment trades payable 90,897 Warrants payable 903 Securities lending liability 352,234 Total liabilities 472,060
Net position restricted for pension benefits $8,584,225

Investment Section | 99
s C h e d u l e o f e q u i T y b r o k e r a g e C o m m i s s i o n sFor the Year Ended June 30, 2017
Broker Name Commission per Share Shares/Par Value
Total Commission
State Street Bank and Trust Company $0.0095 22,005,191 $209,062Capital Institutional Svcs Inc. Equities 0.0339 1,384,810 46,892Merrill Lynch International 0.0099 4,640,829 45,729Liquidnet Inc. 0.0273 1,547,340 42,286Morgan Stanley Co. Incorporated 0.0068 6,063,726 41,495UBS Securities LLC 0.0131 3,394,977 44,383Investment Technology Group Inc. 0.0359 1,122,835 40,303Credit Suisse Securities (USA) LLC 0.0057 5,441,243 30,889Citigroup Global Markets Inc. 0.0032 7,923,219 25,504Themis Trading LLC 0.0306 1,037,354 31,707Societe Generale London Branch 0.0076 2,915,042 22,285Deutsche Bank Securities Inc. 0.0079 3,054,997 24,211Macquarie Bank Limited 0.0038 6,773,450 25,879J.P. Morgan Securities Inc. 0.0357 619,646 22,106Credit Suisse Securities (Europe) Ltd. 0.0096 1,992,369 19,044Goldman Sachs & Co. 0.0092 2,174,968 20,071Ubs Securities Asia Ltd. 0.0036 4,639,559 16,536Citigroup Global Markets Inc. 0.0245 681,164 16,687Barclays Capital 0.0042 2,708,574 11,498All Other Brokerage Firms* 0.0109 46,463,562 508,104Total Brokerage Commissions $0.0098 126,584,855 $1,244,671Brokerage Commission Recapture (55,732)Net Brokerage Commissions $1,188,939
*All other brokerage firms is comprised of approximately 203 additional firms, each receiving less than 1% of total commissions. A complete listing of brokerage fees is available.
s C h e d u l e o f m a n a g e r f e e sFor the Year Ended June 30, 2017
(Dollar Amounts Expressed in Thousands)
Type of investments AmountDomestic equity $5,793 International equity 7,465 Absolute return 14,459 Private equity 23,423 Fixed income 3,854 Real assets 19,138 Opportunities 4,598 Overlay 470 Total manager fees $72,200
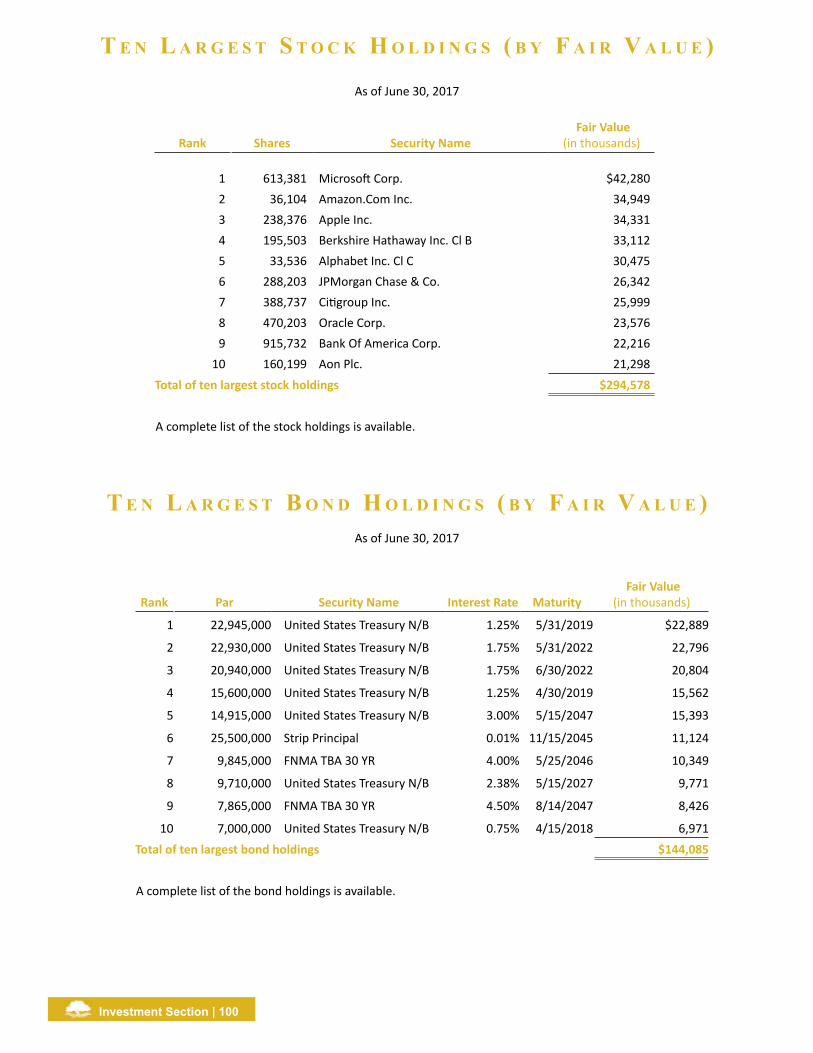
Investment Section | 100
Rank Par Security Name Interest Rate Maturity Fair Value
(in thousands)
1 22,945,000 United States Treasury N/B 1.25% 5/31/2019 $22,889
2 22,930,000 United States Treasury N/B 1.75% 5/31/2022 22,796
3 20,940,000 United States Treasury N/B 1.75% 6/30/2022 20,804
4 15,600,000 United States Treasury N/B 1.25% 4/30/2019 15,562
5 14,915,000 United States Treasury N/B 3.00% 5/15/2047 15,393
6 25,500,000 Strip Principal 0.01% 11/15/2045 11,124
7 9,845,000 FNMA TBA 30 YR 4.00% 5/25/2046 10,349
8 9,710,000 United States Treasury N/B 2.38% 5/15/2027 9,771
9 7,865,000 FNMA TBA 30 YR 4.50% 8/14/2047 8,426
10 7,000,000 United States Treasury N/B 0.75% 4/15/2018 6,971 Total of ten largest bond holdings $144,085
A complete list of the bond holdings is available.
T e n l a r g e s T b o n d h o l d i n g s ( b y f a i r v a l u e )As of June 30, 2017
Rank Shares Security Name Fair Value
(in thousands)
1 613,381 Microsoft Corp. $42,280 2 36,104 Amazon.Com Inc. 34,949 3 238,376 Apple Inc. 34,331 4 195,503 Berkshire Hathaway Inc. Cl B 33,112 5 33,536 Alphabet Inc. Cl C 30,475 6 288,203 JPMorgan Chase & Co. 26,342 7 388,737 Citigroup Inc. 25,999 8 470,203 Oracle Corp. 23,576 9 915,732 Bank Of America Corp. 22,216
10 160,199 Aon Plc. 21,298 Total of ten largest stock holdings $294,578
A complete list of the stock holdings is available.
T e n l a r g e s T s T o C k h o l d i n g s ( b y f a i r v a l u e )
As of June 30, 2017

Investment Section | 101
This page intentionally left blank.

Investment Section | 102
i n v e s T m e n T P r o f e s s i o n a l s As of June 30, 2017
Domestic Equity
AllianceBernstein L.P.
Brown Advisory
CenterSquare Investment Management, LLC
Dalton, Greiner, Hartman, Maher & Co. , LLC
Eagle Capital Management
Huber Capital Management
JP Morgan Asset Management
UBS Global Asset Management
Weatherbie Capital, LLC
Wedge Capital Management, LLP
International Equity
Baillie Gifford & Co.
CBRE Clarion Securities
Lazard Asset Management
LSV Asset Management
Mondrian Emerging Markets Equity Fund, L.P.
Mondrian Emerging Markets Small Cap Equity Fund, L.P.
Mondrian International Small Cap Equity Fund, L.P.
Walter Scott
William Blair Emerging Markets Small Cap Growth Fund
William Blair International Small Cap Growth Portfolio
Absolute Return
AQR Delta Fund II, L.P.
Brevan Howard, L.P.
Claren Road Credit Partners, L.P.
Elliott International Limited
Graham Global Investment Fund II SPC LTD
Grosvenor Capital Management
Jana Partners Qualified, L.P.
Lakewood Capital Partners, L.P.
Laurion Capital Ltd.
OZ Domestic Partners II, L.P.
SC Absolute Return Fund, LLC
SC Absolute Return Fund, LLC- Series B
Third Point Partners Qualified, L.P.
Winton Diversified Futures Fund, L.P.
Private Equity
Abbott Capital Private Equity Fund VI, L.P.
Accel-KKR Capital Partners IV, L.P.
Accel-KKR Capital Partners V, L.P.
Accel-KKR Growth Capital Partners II, L.P.
Atalaya Special Opportunities Fund VI, L.P.
Athyrium Opportunities Fund II, L.P.
Athyrium Opportunities Fund III, L.P.
Dyal II U.S. Investors, L.P.
Dyal Capital Partners III, L.P.
Garrison Opportunity Fund III A LLC
H.I.G. Bayside Loan Opportunity Fund III (Europe-U.S.$), L.P.
H.I.G. Capital Partners V, L.P.
H.I.G. Europe Capital Partners II, L.P.
HarbourVest International Private Equity Partners VI-Partnership Fund L.P.
HarbourVest Partners VIII, L.P.
Khosla Ventures IV, L.P.
Khosla Ventures V, L.P.
Linden Capital Partners III, L.P.
Marlin Equity IV, L.P.
Marlin Heritage, L.P.
New Enterprise Associates 14, L.P.
New Enterprise Associates 15, L.P.
New Enterprise Associates 16, L.P.
Private Equity Partners X, L.P.
RRJ Capital Master Fund II, L.P.
RRJ Capital Master Fund III, L.P.
Spectrum Equity VII, L.P.
Summit Partners Credit Fund, L.P.
Summit Partners Credit Fund II, L.P.
Summit Partners Venture Capital Fund III-A, L.P.
Summit Partners Venture Capital Fund IV, L.P.
Thoma Bravo Fund XI, L.P.
Thoma Bravo Fund XII, L.P.
TPG Opportunities Partners III, L.P.
Trinity Ventures XI, L.P.
Trinity Ventures XII, L.P.
TSG7 A, L.P.
TSG7 B, L.P.
Waterland Private Equity Fund V C.V.
Waterland Private Equity Fund VI, C.V.
Waterland Private Equity Fund VI Overflow Fund, C.V.
Wayzata Opportunities Fund III, L.P.

Investment Section | 103
invesTmenT Professionals (ConTinued)
Fixed Income
Brandywine Global Investment Management, LLC
Metwest Asset Management
Neuberger Berman Fixed Income, LLC
Prudential Investment Management
SC Credit Opportunities Mandate, LLC
Real Assets
ACM Fund II, LLC
ArcLight Energy Partners Fund VI, L.P.
Atalaya SCERS SMA, LLC
Barings Real Estate Advisors - Separate Accounts
BlackRock Realty Advisors - Seperate Accounts
Blackstone Resources Select Offshore Fund
Brookfield Infrastructure Fund III, L.P.
Carlyle Power Partners II, L.P.
EnCap Energy Capital Fund IX, L.P.
EnCap Energy Capital Fund X, L.P.
EnCap Flatrock Midstrem Fund III, L.P.
Global Energy & Power Infrastructure Fund II, L.P.
IFM Global Infrastructure Fund, L.P.
Jamestown Premier Property Fund, L.P.
MetLife Core Property Fund, L.P.
Pantheon SCERS SIRF MM, LLC
Prime Property Fund, LLC
Principal U.S. Property Account
Prologis Targeted Europe Logistics Fund, L.P.
Prologis Targeted US Logistics Fund, L.P.
Quantum Energy Partners VI, L.P.
State Street Global Advisors - Real Asset Strategy
Strategic Commodities Fund Ltd.
Townsend Real Estate Fund, L.P.
Wastewater Opportunity Fund, LLC
Opportunities
AEW Value Investors II, L.P.
Allegis Value Trust
Atalaya Special Opportunities Fund V, L.P.
Carlyle China Realty, L.P.
Carlyle China Rome Logistics, L.P.
CIM Fund VIII, L.P.
ECE European Prime Shopping Centre Fund II, SCS-SIF
European Real Estate Debt Fund II, L.P.
Hammes Partners II, L.P.
Hines U.S. Office Value Fund II, L.P.
KKR Real Estate Partners Americas, L.P.
NREP Nordic Strategies Fund, FCP-FIS
NREP Nordic Strategies Fund II, SCSp
Och-Ziff Real Estate Fund III, L.P.
Overlay
State Street Global Advisors
Investment Consultant
Cliffwater, LLC
Verus Advisory, Inc.
The Townsend Group
Proxy Advisor
Glass Lewis & Co.
Institutional Shareholder Services, Inc.
Legal Counsel
Foley & Lardner LLP
Nossaman LLP
Public Pension Consultants
Stroock & Stroock & Lavan LLP


ACTUARIAL
a C T u a r i a l C e r T i f i C a T i o n l e T T e r
Actuarial Section | 106
100 Montgomery Street Suite 500 San Francisco, CA 94104-4308 T 415.263.8200 www.segalco.com
Benefits, Compensation and HR Consulting. Member of The Segal Group. Offices throughout the United States and Canada
November 7, 2017 Board of Retirement Sacramento County Employees’ Retirement System 980 9th Street, Suite 1900 Sacramento, CA 95814 Re: Actuarial Valuation for the Sacramento County Employees’ Retirement System
Dear Members of the Board:
Segal Consulting (Segal) prepared the June 30, 2017 annual actuarial valuation of the Sacramento County Employees’ Retirement System. We certify that the valuation was performed in accordance with generally accepted actuarial principles and practices and SCERS’ funding policy that was last reviewed with the Board in 2013. In particular, it is our understanding that the assumptions and methods used for funding purposes meet the parameters set by Actuarial Standards of Practice (ASOPs).
As part of the June 30, 2017 actuarial valuation, Segal conducted an examination of all participant data for reasonableness. Summaries of the employee data used in performing the actuarial valuations over the past several years are provided in our valuation report. We did not audit the System’s financial statements. For actuarial valuation purposes, Plan assets are valued at Actuarial Value. Under this method, the assets used to determine employer contribution rates take into account market value by recognizing the differences between the total actual investment return at market value and the expected investment return from the prior six years. Deferred gains and losses as of June 30, 2013 have been combined and will be recognized over a six-year period starting July 1, 2013. Investment gains/losses established after July 1, 2013 will be recognized over a seven-year period and the deferred return is further adjusted, if necessary, so that the actuarial value of assets will stay within 30% of the market value of assets.
One of the general goals of an actuarial valuation is to establish contribution rates which, over time, will remain level as a percentage of payroll unless Plan benefit provisions are changed. Actuarial funding is based on the Entry Age Cost Method. Under this method, the employer contribution rate provides for current cost (normal cost) plus a level percentage of payroll to amortize any unfunded actuarial accrued liability (UAAL). The UAAL is amortized over different periods depending on the source.

aCTuarial CerTifiCaTion leTTer (ConTinued)
Actuarial Section | 107
Board of Retirement Sacramento County Employees’ Retirement System November 7, 2017 Page 2
5514332v1/05750.002
The UAAL established as a result of the Early Retirement Incentive Program for members of the Sacramento County Law Enforcement Managers Association (LEMA) is amortized as a level percentage of payroll over a 10-year period beginning June 30, 2010. The System’s remaining outstanding balance of the June 30, 2012 UAAL is amortized as a level percentage of payroll over a declining 23-year period (with 18 years remaining as of June 30, 2017). Effective with the June 30, 2013 valuation, the change in UAAL that arises due to actuarial gains or losses or from changes in actuarial assumptions or methods at each valuation is amortized as a level percentage of payroll over its own declining 20-year period. Any change in UAAL that arises due to plan amendments will be amortized as a level percentage of payroll over its own declining 15-year period and any change in UAAL due to retirement incentive programs will be amortized as a level percentage of payroll over its own declining period of up to 5 years. A 5-year period (with 1 year remaining as of June 30, 2017) is used to amortize the increase in UAAL as a result of earlier than expected retirement for members of the Deputy Sheriffs’ Association who submitted an application to retire before June 30, 2015. The progress being made towards meeting the funding objective through June 30, 2017 is illustrated in the Schedule of Funding Progress.
Notes number 1, 4 and 5 to the Basic Financial Statements and the Required Supplemental Information (RSI) included in the Financial Section were prepared by the System based on the results of the Governmental Accounting Standards Board Statement 67 (GASBS 67) actuarial valuation as of June 30, 2017 prepared by Segal. For the Financial Section of the Comprehensive Annual Financial Report (CAFR), Segal provided the Schedule of Changes in Net Pension Liability and Schedule of Employer Contributions as shown in the RSI. A listing of the other supporting schedules Segal prepared for inclusion in the Actuarial and Statistical Sections of the System’s CAFR is provided below. These schedules were prepared based on the results of the actuarial valuation as of June 30, 2017 for funding purposes. All other schedules in the Actuarial and Statistical Sections of the System’s CAFR were prepared by the System.
1. Retirees and beneficiaries added to and removed from retiree payroll; 2. Solvency test; and 3. Schedule of retiree members by type of benefit.
The valuation assumptions included in the Actuarial Section were adopted by the Retirement Board based on the June 30, 2016 Actuarial Experience Study. It is our opinion that the assumptions used in the June 30, 2017 valuation produce results, which, in the aggregate, anticipate the future experience of the Plan. Actuarial valuations are performed on an annual basis. An experience analysis is performed every three years. The next experience analysis is due to be performed as of June 30, 2019 and assumptions approved in that analysis will be applied in the June 30, 2020 valuation.
In the June 30, 2017 valuation, the ratio of the valuation assets to actuarial accrued liabilities decreased from 87.3% to 81.1%. The employer’s rate has increased from 20.82% of payroll to 28.41% of payroll before the three-year phase-in of the change in UAAL rate due to changes in

aCTuarial CerTifiCaTion leTTer (ConTinued)
Actuarial Section | 108
Board of Retirement Sacramento County Employees’ Retirement System November 7, 2017 Page 3
5514332v1/05750.002
actuarial assumptions, while the employee’s rate has increased from 9.91% of payroll to 11.84% of payroll. The increase in the employer’s rate and the increase in the employee’s rate is primarily a result of the changes in actuarial assumptions adopted for the June 30, 2017 valuation.
Note that the Board adopted a three-year phase-in of the change in UAAL rate due to changes in actuarial assumptions for the employer contribution rates. After reflecting the three-year phase-in, the employer’s rate calculated in this valuation is 24.53% of payroll.
In the June 30, 2017 valuation, the actuarial value of assets excluded $81.0 million in deferred investment losses, which represented about 1% of the market value of assets. If these deferred investment losses were recognized immediately in the actuarial value of assets, the funded percentage would decrease from 81.1% to 80.4% and the aggregate employer contribution rate (after reflecting the three-year phase-in), expressed as a percent of payroll, would increase from about 24.5% to 25.1%.
The undersigned are Members of the American Academy of Actuaries and we meet the Qualification Standards of the American Academy of Actuaries to render the actuarial opinion contained herein. Sincerely, Paul Angelo, FSA, MAAA, FCA, EA Andy Yeung, ASA, MAAA, FCA, EA Senior Vice President and Actuary Vice President and Actuary MYM/gxk Enclosures
Actuarial Section | 109
s u m m a r y o f a C T u a r i a l r e v i e W
In 2017, SCERS engaged Cheiron to perform a complete independent replication of SCERS June 30, 2016 actuarial valuation and reviewed the actuarial methods underlying that valuation. Cheiron reviewed the census data provided by SCERS staff, and compared to the information used by SCERS’ actuary Segal in their valuation. Cheiron then performed a full parallel valuation, including the calculation of the projected benefits, accrued liability, and normal cost for all SCERS members, and compared the results to those shown in Segal’s actuarial valuation report.
Additionally, SCERS engaged Cheiron to perform a review of the assumptions recommended by Segal for the June 30, 2017 valuation, as reflected in the actuarial experience study covering the period from July 1, 2013 through June 30, 2016. This review did not constitute a full replication of the experience study. It was focused on a review of the recommendations and communications from Segal, based on the information provided within the study.
The purpose of the actuarial audit is to provide SCERS confirmation that:
• The results reported by Segal are reliable.
• Segal’s actuarial valuation report, assumptions, and methods comply with Actuarial Standards of Practice (ASOPs).
• The communication of the actuarial valuation results is complete and reasonable.
• The SCERS Retirement Board and Segal have considered Cheiron’s recommendations that may improve the valuation and experience study.
Key Findings and Recommendations
As presented in Cheiron’s Actuarial Review of the June 30, 2016 Actuarial Valuation and Actuarial Experience Study, Cheiron has:
• Confirmed that the liabilities and costs computed by Segal in the SCERS valuation as of June 30, 2016 were reasonably accurate and were computed in accordance with generally accepted actuarial principles.
• Reviewed the economic and demographic assumptions recommended in SCERS’ most recent Actuarial Experience Study prepared by Segal and have found them to be reasonable and in accordance with generally accepted actuarial principles.
• Recommended Segal review Cheiron’s recommendations regarding rates of retirement and mortality to determine whether additional analysis is merited.

s u m m a r y o f a C T u a r i a l a s s u m P T i o n s a n d m e T h o d s
GASB Statement No. 67 rules only redefine pension liability and expense for financial reporting purposes, and do not apply to contribution amounts for pension funding purposes. Employers and plans can still develop and adopt funding policies under current practices. SCERS’ Board of Retirement and management staff are responsible for establishing and maintaining the System’s funding policy. When measuring the total pension liability, GASB uses the same actuarial cost method (Entry Age Method) and the same type of discount rate (expected return on assets) as SCERS uses for funding. This means that the Normal Cost component of the annual plan cost is determined on the same basis for funding and financial reporting.
The following assumptions and methods were adopted by the Board for the June 30, 2017 valuation on November 7, 2017.
Assumptions:Valuation Interest Rate and
Rate of Return on Investments: 7.00% net of administration and investment expensesInflation Assumption: 3.00%Cost-of-Living Adjustment: 3.00% for Miscellaneous and Safety Tier 1 Members 0.00% for Miscellaneous Tier 2 Members 2.00% for Miscellaneous Tier 3, Tier 4 and Tier 5 and Safety Tier 2, Tier 3 and Tier 4 MembersEmployee Contribution Crediting
Rate: 5-year Treasury rate, assuming sufficient net investment earnings
Post-Retirement Mortality: a) Service For Miscellaneous Members and Beneficiaries -
Headcount-Weighted RP-2014 Healthy Annuitant Mortality Table projected generationally with the two-dimensional scale MP-2016 set forward one year for males and no age adjustment for females.
For Safety Members - Headcount-Weighted RP-2014 Healthy Annuitant Mortality Table projected generationally with the two-dimensional scale MP-2016 set back four years for males and females.
b) Disability For Miscellaneous Members - Headcount-Weighted RP-2014 Healthy Annuitant Mortality Table projected generationally with the two-dimensional scale MP-2016 set forward seven years for males and set forward eight years for females.
For Safety Members - Headcount-Weighted RP-2014 Healthy Annuitant Mortality Table projected generationally with the two-dimensional scale MP-2016 set forward four years for males and females.
c) Employee Contribution Rate For Miscellaneous Members - Headcount-Weighted RP-2014 Healthy Annuitant Mortality Table projected 20 years with the two-dimensional scale MP-2016 set forward one year for males and no age adjustment for females, weighted 40% male and 60% female.
For Safety Members - Headcount-Weighted RP-2014 Healthy Annuitant Mortality Table projected generationally with the two-dimensional scale MP-2016 set back four years for males and females, weighted 75% male and 25% female.
Actuarial Section | 110
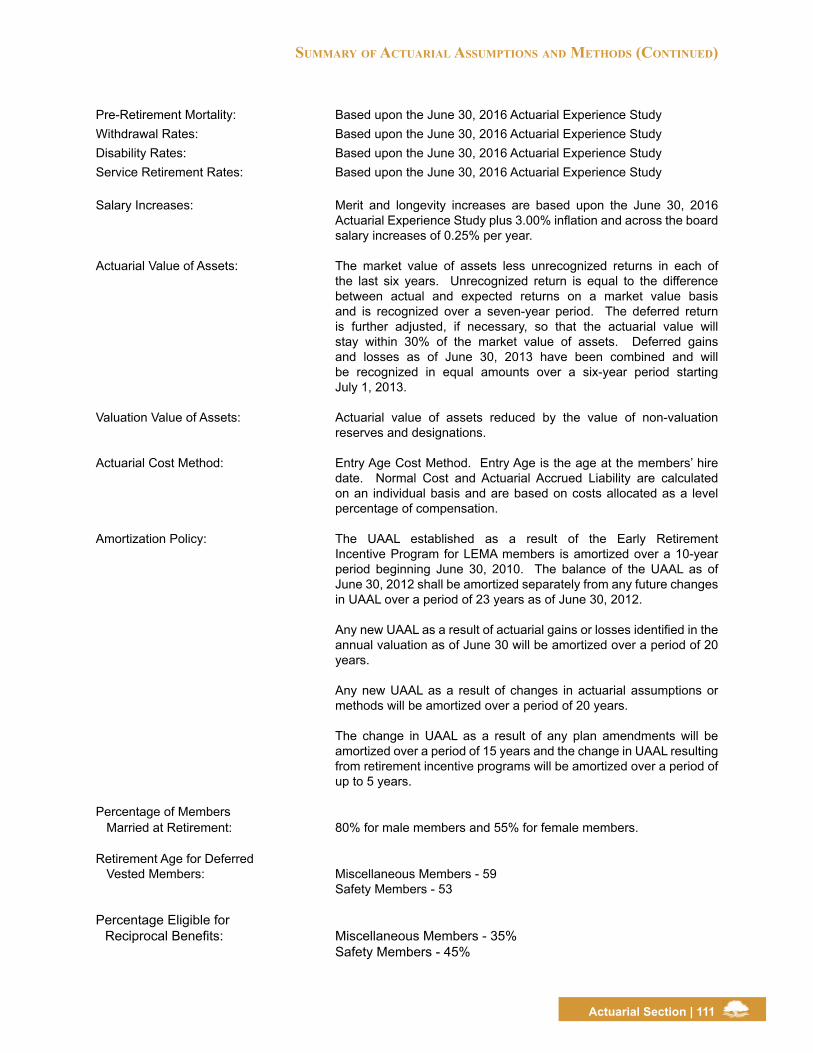
summary of aCTuarial assumPTions and meThods (ConTinued)
Pre-Retirement Mortality: Based upon the June 30, 2016 Actuarial Experience StudyWithdrawal Rates: Based upon the June 30, 2016 Actuarial Experience StudyDisability Rates: Based upon the June 30, 2016 Actuarial Experience StudyService Retirement Rates: Based upon the June 30, 2016 Actuarial Experience Study
Salary Increases: Merit and longevity increases are based upon the June 30, 2016 Actuarial Experience Study plus 3.00% inflation and across the board salary increases of 0.25% per year.
Actuarial Value of Assets: The market value of assets less unrecognized returns in each of the last six years. Unrecognized return is equal to the difference between actual and expected returns on a market value basis and is recognized over a seven-year period. The deferred return is further adjusted, if necessary, so that the actuarial value will stay within 30% of the market value of assets. Deferred gains and losses as of June 30, 2013 have been combined and will be recognized in equal amounts over a six-year period starting July 1, 2013.
Valuation Value of Assets: Actuarial value of assets reduced by the value of non-valuation reserves and designations.
Actuarial Cost Method: Entry Age Cost Method. Entry Age is the age at the members’ hire date. Normal Cost and Actuarial Accrued Liability are calculated on an individual basis and are based on costs allocated as a level percentage of compensation.
Amortization Policy: The UAAL established as a result of the Early Retirement Incentive Program for LEMA members is amortized over a 10-year period beginning June 30, 2010. The balance of the UAAL as of June 30, 2012 shall be amortized separately from any future changes in UAAL over a period of 23 years as of June 30, 2012.
Any new UAAL as a result of actuarial gains or losses identified in the annual valuation as of June 30 will be amortized over a period of 20 years.
Any new UAAL as a result of changes in actuarial assumptions or methods will be amortized over a period of 20 years.
The change in UAAL as a result of any plan amendments will be amortized over a period of 15 years and the change in UAAL resulting from retirement incentive programs will be amortized over a period of up to 5 years.
Percentage of MembersMarried at Retirement: 80% for male members and 55% for female members.
Retirement Age for Deferred Vested Members: Miscellaneous Members - 59
Safety Members - 53
Percentage Eligible for Reciprocal Benefits: Miscellaneous Members - 35%
Safety Members - 45%
Actuarial Section | 111

s u m m a r y o f P l a n P r o v i s i o n s
Briefly summarized below are the major provisions of the County Employees’ Retirement Law of 1937, as amended through June 30, 2017, that are applicable to the Sacramento County Employees’ Retirement System.
Membership
Miscellaneous employees entering before September 27, 1981 are Tier 1 members. Miscellaneous employees entering on or after September 27, 1981 and June 27, 1993 are members of Tier 2 or Tier 3, respectively. County Miscellaneous employees entering on or after January 1, 2012 but prior to January 1, 2013 are members of Tier 4. Miscellaneous employees entering on or after January 1, 2013 are members of Tier 5. Safety members entering before June 25, 1995 are Tier 1 members. Safety members entering on or after June 25, 1995 are Tier 2 members. County Safety employees entering on or after January 1, 2012 but prior to January 1, 2013 are members of Tier 3. Safety members entering on or after January 1, 2013 are members of Tier 4.
Final Average Salary
Final average salary (FAS) is defined as the highest 12 consecutive months of compensation earnable for Miscellaneous Tier 1 and Safety Tier 1 and highest 36 consecutive months for Miscellaneous Tier 2, Tier 3, Tier 4 and Tier 5 and Safety Tier 2, Tier 3 and Tier 4.
Return of Contributions
Upon separation from service, a member may elect to leave his or her contributions on deposit. If the member has five or more years of service, he or she may elect to receive a deferred benefit when eligible for retirement. If the member has less than five years of service, he or she may request a return of contributions, plus interest, at any time.
Service Retirement Benefit
Miscellaneous Tier 1, Tier 2, Tier 3 and Tier 4 and Safety Tier 1, Tier 2 and Tier 3 members with 10 years of service who have attained the age of 50 are eligible to retire. All members with 30 years of service (20 years for Safety), regardless of age, are eligible to retire.
Miscellaneous Tier 5 and Safety Tier 4 members with 5 years of service who have attained the age of 52 (age 50 for Safety) are eligible to retire.
The benefit expressed as a percentage of monthly FAS per year of service, depending on age at retirement, is illustrated below for typical ages. For members whose benefits are integrated with Social Security, the benefit is reduced by one-third of the percentage shown below times the first $350 of monthly FAS per year of service after January 1, 1956.
Age Miscellaneous Tier 1, 2 and 3
Miscellaneous Tier 4
Miscellaneous Tier 5
Safety Tier 1 and 2 Safety Tier 3 Safety Tier 4
50 1.48% 1.18% N/A 3.00% 2.29% 2.00%52 1.67% 1.30% 1.00% 3.00% 2.54% 2.20%55 1.95% 1.49% 1.30% 3.00% 3.00% 2.50%57 2.18% 1.64% 1.50% 3.00% 3.00% 2.70%60 2.44% 1.92% 1.80% 3.00% 3.00% 2.70%62 2.61% 2.09% 2.00% 3.00% 3.00% 2.70%65 2.61% 2.43% 2.30% 3.00% 3.00% 2.70%67 and over 2.61% 2.43% 2.50% 3.00% 3.00% 2.70%
Actuarial Section | 112

summary of Plan Provisions (ConTinued)
Disability Benefit
Members with five years of service, regardless of age, are eligible for nonservice-connected disability. For Miscellaneous Tier 1 members, the benefit is 1.5% (1.8% for Safety Tier 1 members) of FAS for each year of service. If this benefit does not equal one-third of FAS, the benefit is increased by the same percentage of FAS for the years which would have been credited to age 65 (age 55 for Safety members), but the total benefit in this case cannot be more than one-third of FAS.
For Tier 2, Tier 3, Tier 4 and Tier 5 members, the benefit is 20% of FAS for the first five years of service plus 2% for each additional year for a maximum of 40% of FAS.
If the disability is service connected, the member may retire regardless of length of service, with a benefit of 50% of FAS or 100% Service Retirement benefit, if greater.
Death Benefit (Before Retirement)
In addition to the return of contributions, a death benefit is payable to the member’s beneficiary or estate equal to one month’s salary for each completed year of service under the retirement system, based on the final year’s average salary, but not to exceed six (6) month’s salary.
If a member dies while eligible for service retirement or nonservice-connected disability, the spouse receives 60% of the allowance that the member would have received for retirement.
If a member dies in the performance of duty, the spouse or minor child receives 50% of the member’s final average salary or 100% of Service Retirement benefit, if greater.
Death Benefit (After Retirement)
If a member dies after retirement, a $4,000 lump sum burial allowance is paid to the beneficiary or estate.
If the retirement was for service-connected disability, 100% of the member’s allowance as it was at death is continued to the eligible spouse for life.
If the retirement was for other than service-connected disability and the member elected the unmodified option, 60% of the member’s allowance is continued to an eligible spouse for life.
An eligible spouse is a surviving spouse who was married to the member at least one year prior to the date of retirement.
Maximum Benefit
The maximum benefit payable to a member or beneficiary is 100% of FAS for Miscellaneous Tier 1, Tier 2, Tier 3 and Tier 4 and Safety Tier 1, Tier 2 and Tier 3. There is no maximum benefit for Miscellaneous Tier 5 and Safety Tier 4 members.
Cost-of-Living
The maximum increase in retirement allowance is 4% per year for Miscellaneous Tier 1 and Safety Tier 1 members and 2% for Safety Tier 2, Tier 3 and Tier 4, and Miscellaneous Tier 3, Tier 4 and Tier 5 members.
Actuarial Section | 113

summary of Plan Provisions (ConTinued)
Miscellaneous Tier 2 members have no cost-of-living benefit. The cost-of-living increases effective in the month of April are based on the average annual change in the Consumer Price Index for the calendar year preceding April.
Contribution Rates
Basic member contribution rates are based on the age-nearest birthday at entry into the System (single rate for entrants after January 1, 1975). The rates are designed to provide an average annuity at age 55 equal to 1/240 of FAS for Miscellaneous Tier 1, 2 and 3 members, at age 60 equal to 1/120 of FAS for Miscellaneous Tier 4 members and 1/100 of FAS at age 50 for Safety Tier 1, Tier 2 and Tier 3 members. For Miscellaneous Tier 5 and Safety Tier 4 members, the rates are 50% of the Normal Cost rate. For members integrated with Social Security, the above contributions are reduced by one-third of that portion of such contribution payable with respect to the first $350 of monthly salary. Cost-of-living contribution rates are designed to pay for one-half of the future cost-of-living costs. Member contributions are refundable upon termination from the system.
The employer contribution rates are actuarially determined to provide for the balance of the contributions needed to fund the benefits promised by the System.
Actuarial Section | 114
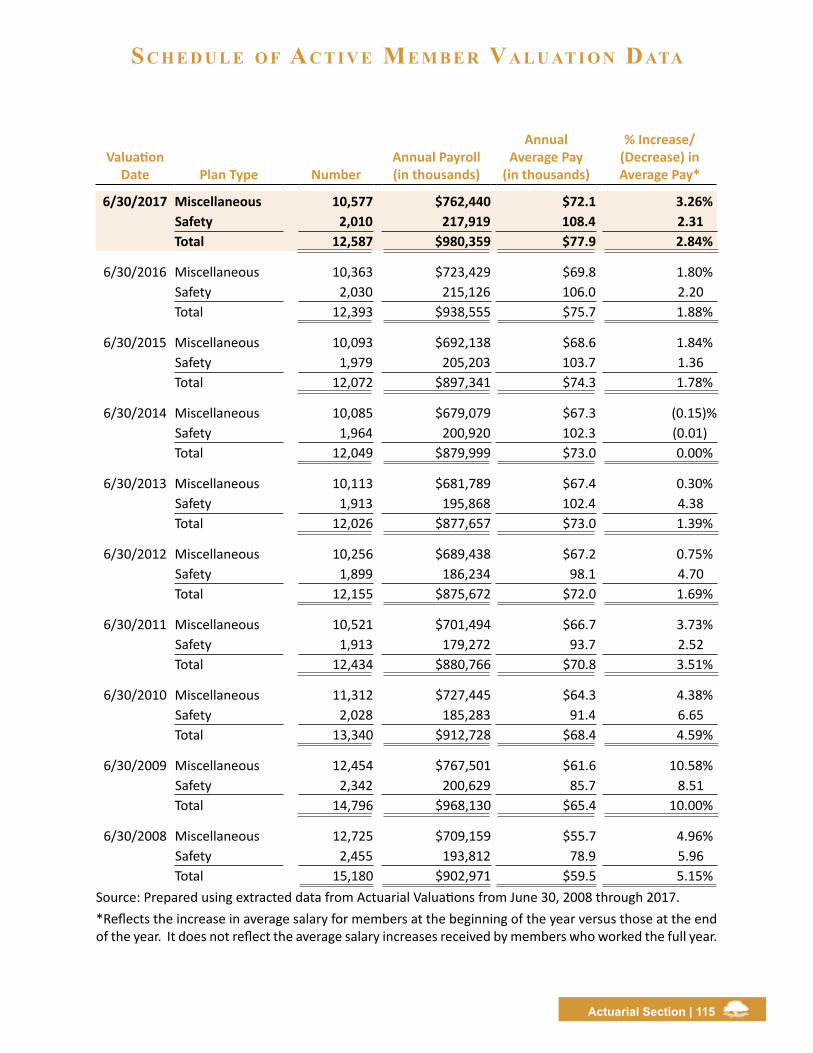
sC h e d u l e o f aC T i v e me m b e r va l u aT i o n daTa
Valuation Date Plan Type Number
Annual Payroll (in thousands)
Annual Average Pay
(in thousands)
% Increase/(Decrease) in Average Pay*
6/30/2017 Miscellaneous 10,577 $762,440 $72.1 3.26%Safety 2,010 217,919 108.4 2.31 Total 12,587 $980,359 $77.9 2.84%
6/30/2016 Miscellaneous 10,363 $723,429 $69.8 1.80%Safety 2,030 215,126 106.0 2.20Total 12,393 $938,555 $75.7 1.88%
6/30/2015 Miscellaneous 10,093 $692,138 $68.6 1.84%Safety 1,979 205,203 103.7 1.36Total 12,072 $897,341 $74.3 1.78%
6/30/2014 Miscellaneous 10,085 $679,079 $67.3 (0.15)%Safety 1,964 200,920 102.3 (0.01)Total 12,049 $879,999 $73.0 0.00%
6/30/2013 Miscellaneous 10,113 $681,789 $67.4 0.30%Safety 1,913 195,868 102.4 4.38Total 12,026 $877,657 $73.0 1.39%
6/30/2012 Miscellaneous 10,256 $689,438 $67.2 0.75%Safety 1,899 186,234 98.1 4.70Total 12,155 $875,672 $72.0 1.69%
6/30/2011 Miscellaneous 10,521 $701,494 $66.7 3.73%Safety 1,913 179,272 93.7 2.52Total 12,434 $880,766 $70.8 3.51%
6/30/2010 Miscellaneous 11,312 $727,445 $64.3 4.38%Safety 2,028 185,283 91.4 6.65Total 13,340 $912,728 $68.4 4.59%
6/30/2009 Miscellaneous 12,454 $767,501 $61.6 10.58%Safety 2,342 200,629 85.7 8.51Total 14,796 $968,130 $65.4 10.00%
6/30/2008 Miscellaneous 12,725 $709,159 $55.7 4.96%Safety 2,455 193,812 78.9 5.96Total 15,180 $902,971 $59.5 5.15%
Source: Prepared using extracted data from Actuarial Valuations from June 30, 2008 through 2017.*Reflects the increase in average salary for members at the beginning of the year versus those at the end of the year. It does not reflect the average salary increases received by members who worked the full year.
Actuarial Section | 115

re
Tir
ee
s a
nd
be
ne
fiC
iar
ies a
dd
ed
To
an
d r
em
ov
ed
fr
om
re
Tir
ee
Pa
yr
ol
l
Aver
age
Annu
al
Allo
wan
ce
$39,
126
37,8
75
36,8
61
35,4
0334
,376
33,3
5832
,197
31,0
5830
,695
29,1
44
Sour
ce: P
repa
red
by S
egal
Con
sulti
ng
Not
e: P
artic
ipan
ts a
re c
ount
ed o
nce
for e
ach
bene
fit re
ceiv
ed.
% In
crea
se
In A
nnua
l Re
tiree
Pa
yrol
l
7.41
%6.
83
9.22
7.42
7.46
8.51
9.57
5.
988.
868.
60
Payr
oll
Rem
oved
Du
ring
Year
(in
thou
sand
s)
$9,3
328,
591
7,84
9
6,74
66,
431
5,51
15,
009
4,63
95,
440
4,74
5
Payr
oll a
dded
Du
ring
Year
(in
thou
sand
s)
$40,
102
35,1
44
40,6
36
31,3
3529
,416
29,6
9329
,805
19,2
7625
,347
22,5
27
Annu
al
Retir
ee P
ayro
ll
(in th
ousa
nds)
$445
,875
415,
105
388,
552
355,
765
331,
176
308,
191
284,
009
259,
213
244,
576
224,
669
At E
nd o
f Ye
ar
11,3
9610
,960
10,5
41
10,0
499,
634
9,2
39 8
,821
8,3
46 7
,968
7,70
9
Rem
oved
Du
ring
Year 31
430
8
284
259
240
242
224
221
2
44
245
Adde
d Du
ring
Year 75
072
7
776
674
635
660
699
5
99
503
4
90
At
Begi
nnin
g of
Yea
r
10,9
6010
,541
10,0
49
9,63
49,
239
8,8
21
8,3
46
7,9
68
7,7
09
7,46
4
Plan
Yea
r End
6/30
/201
76/
30/2
016
6/30
/201
5
6/30
/201
46/
30/2
013
6/30
/201
26/
30/2
011
6/30
/201
06/
30/2
009
6/30
/200
8
Actuarial Section | 116

Actuarial Section | 117
sCh
ed
ul
e o
f f
un
din
g P
ro
gr
es
s (D
olla
r A
mou
nts
Exp
ress
ed i
n T
hous
ands
)
UAAL
as a
Per
cent
age
of C
over
ed P
ayro
ll
((b
- a)
/ c)
205.
6%12
7.8
132.
6
144.
1
161.
014
9.4
109.
2 9
5.7
96.
2 4
7.9
*Inc
lude
s con
tinge
ncy
rese
rve
and
retir
ee d
eath
ben
efit r
eser
ves.
** T
he Ju
ne 3
0, 2
010
resu
lts h
ave
been
revi
sed
to re
flect
the
corr
ect a
ctua
rial a
ccru
ed li
abili
ty w
hich
was
ove
rsta
ted
in th
e Ju
ne 3
0, 2
010
valu
ation
.
See
Sche
dule
2:
Sche
dule
of E
mpl
oyer
Con
trib
ution
s pro
vide
d as
Req
uire
d Su
pple
men
tary
Info
rmati
on fo
r act
uaria
lly d
eter
min
ed a
nd a
ctua
l con
trib
ution
s.
Cove
red
Payr
oll
(c)
$980
,359
93
8,55
5 89
7,34
1
879,
999
877,
657
875,
672
880,
766
912,
644
968,
130
902,
971
Sour
ce: P
repa
red
usin
g ex
trac
ted
data
from
Act
uaria
l Val
uatio
ns fr
om Ju
ne 3
0, 2
008
thro
ugh
2017
.
Fund
ed R
atio
(a
/ b) 81
.1%
87.3
86.8
85.2
82.8
83.3
87.0
87.7
86.0
93.2
Unf
unde
d AA
L (U
AAL)
(b
-a)
$2,0
15,7
72
1,19
9,68
8 1,
189,
854
1,26
7,93
5
1,41
3,22
3 1,
308,
328
962,
073
873,
503
931,
778
432,
597
Actu
aria
l Acc
rued
Li
abili
ty (A
AL)*
(b
)
$10,
680,
998
9,43
6,09
09,
028,
679
8,58
0,92
8
8,21
0,98
07,
838,
223
7,38
2,89
7 7,
090,
497
6,66
1,99
3 6,
363,
355
Actu
aria
l Val
ue o
f As
sets
* (a
) $8,6
65,2
26
8,23
6,40
2 7,
838,
825
7,31
2,99
3
6,79
7,75
7 6,
529,
895
6,42
0,82
4 6,
216,
994
5,7
30,2
15
5,93
0,75
8
Actu
aria
l Va
luati
on D
ate
6/30
/201
76/
30/2
016
6/30
/201
5
6/30
/201
4
6/30
/201
36/
30/2
012
6/30
/201
16/
30/2
010*
*6/
30/2
009
6/30
/200
8
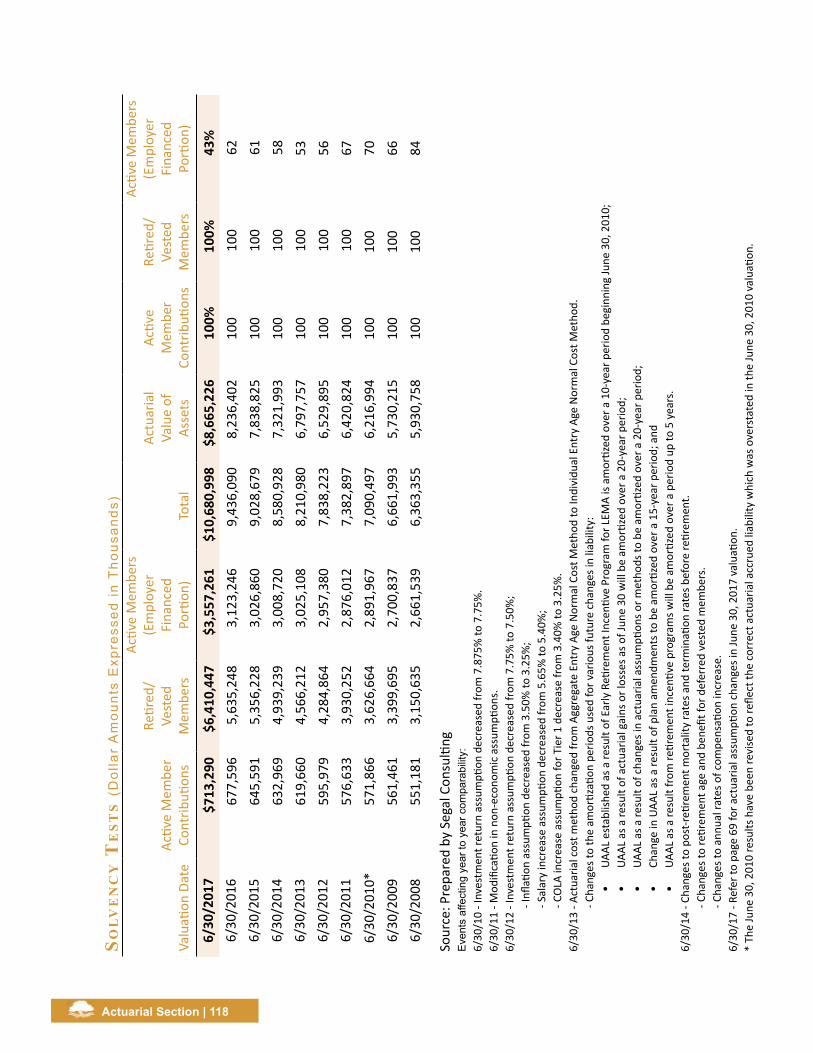
Actuarial Section | 118
sol
ve
nC
y T
es
Ts (D
olla
r A
mou
nts
Exp
ress
ed i
n T
hous
ands
)Ac
tive
Mem
bers
(E
mpl
oyer
Fi
nanc
ed
Porti
on)
43%
62 61 58 53 56 67 70 66 84
Sour
ce: P
repa
red
by S
egal
Con
sulti
ngE
vent
s af
fect
ing
year
to y
ear c
ompa
rabi
lity:
6/30
/10
- Inv
estm
ent r
etur
n as
sum
ption
dec
reas
ed fr
om 7
.875
% to
7.7
5%.
6/30
/11
- Mod
ifica
tion
in n
on-e
cono
mic
ass
umpti
ons.
6/30
/12
- Inv
estm
ent r
etur
n as
sum
ption
dec
reas
ed fr
om 7
.75%
to 7
.50%
;
- In
flatio
n as
sum
ption
dec
reas
ed fr
om 3
.50%
to 3
.25%
;
- Sa
lary
incr
ease
ass
umpti
on d
ecre
ased
from
5.6
5% to
5.4
0%;
-
COLA
incr
ease
ass
umpti
on fo
r Tie
r 1 d
ecre
ase
from
3.4
0% to
3.2
5%.
6/30
/13
- Act
uaria
l cos
t met
hod
chan
ged
from
Agg
rega
te E
ntry
Age
Nor
mal
Cos
t Met
hod
to In
divi
dual
Ent
ry A
ge N
orm
al C
ost M
etho
d.
- Ch
ange
s to
the
amor
tizati
on p
erio
ds u
sed
for v
ario
us fu
ture
cha
nges
in li
abili
ty:
• UA
AL e
stab
lishe
d as
a re
sult
of E
arly
Reti
rem
ent I
ncen
tive
Prog
ram
for L
EMA
is am
ortiz
ed o
ver a
10-
year
per
iod
begi
nnin
g Ju
ne 3
0, 2
010;
• UA
AL a
s a re
sult
of a
ctua
rial g
ains
or l
osse
s as o
f Jun
e 30
will
be
amor
tized
ove
r a 2
0-ye
ar p
erio
d;•
UAAL
as a
resu
lt of
cha
nges
in a
ctua
rial a
ssum
ption
s or m
etho
ds to
be
amor
tized
ove
r a 2
0-ye
ar p
erio
d;•
Chan
ge in
UAA
L as
a re
sult
of p
lan
amen
dmen
ts to
be
amor
tized
ove
r a 1
5-ye
ar p
erio
d; a
nd•
UAAL
as a
resu
lt fr
om re
tirem
ent i
ncen
tive
prog
ram
s will
be
amor
tized
ove
r a p
erio
d up
to 5
yea
rs.
6/30
/14
- Cha
nges
to p
ost-r
etire
men
t mor
talit
y ra
tes a
nd te
rmin
ation
rate
s bef
ore
retir
emen
t.
- Ch
ange
s to
retir
emen
t age
and
ben
efit f
or d
efer
red
vest
ed m
embe
rs.
-
Chan
ges t
o an
nual
rate
s of c
ompe
nsati
on in
crea
se.
6/30
/17
- Ref
er to
pag
e 69
for a
ctua
rial a
ssum
ption
cha
nges
in Ju
ne 3
0, 2
017
valu
ation
.*
The
June
30,
201
0 re
sults
hav
e be
en re
vise
d to
refle
ct th
e co
rrec
t act
uaria
l acc
rued
liab
ility
whi
ch w
as o
vers
tate
d in
the
June
30,
201
0 va
luati
on.
Retir
ed/
Vest
ed
Mem
bers
100%
100
100
100
100
100
100
100
100
100
Activ
e M
embe
r Co
ntrib
ution
s
100%
100
100
100
100
100
100
100
100
100
Actu
aria
l Va
lue
of
Asse
ts
$8,6
65,2
268,
236,
402
7,83
8,82
57,
321,
993
6,79
7,75
76,
529,
895
6,42
0,82
46,
216,
994
5,73
0,21
55,
930,
758
Tota
l
$10,
680,
998
9,43
6,09
09,
028,
679
8,58
0,92
88,
210,
980
7,83
8,22
37,
382,
897
7,09
0,49
76,
661,
993
6,36
3,35
5
Activ
e M
embe
rs
(Em
ploy
er
Fina
nced
Po
rtion
)
$3,5
57,2
613,
123,
246
3,02
6,86
03,
008,
720
3,02
5,10
82,
957,
380
2,87
6,01
22,
891,
967
2,70
0,83
72,
661,
539
Retir
ed/
Vest
ed
Mem
bers
$6,4
10,4
475,
635,
248
5,35
6,22
84,
939,
239
4,56
6,21
24,
284,
864
3,93
0,25
23,
626,
664
3,39
9,69
53,
150,
635
Activ
e M
embe
r Co
ntrib
ution
s
$713
,290
677,
596
645,
591
632,
969
619,
660
595,
979
576,
633
571,
866
561,
461
551,
181
Valu
ation
Dat
e
6/30
/201
76/
30/2
016
6/30
/201
56/
30/2
014
6/30
/201
36/
30/2
012
6/30
/201
1
6/30
/201
0*6/
30/2
009
6/30
/200
8

Actuarial Section | 119
aC
Tu
ar
ial
an
al
ys
is o
f f
ina
nC
ial
ex
Pe
rie
nC
e (D
olla
r A
mou
nts
Exp
ress
ed i
n M
illio
ns)
Plan
Yea
rs E
nded
June
30
2008
$382 55 9
(13) -
$433
* Th
e Ju
ne 3
0, 2
010
resu
lts h
ave
been
revi
sed
to re
flect
the
corr
ect a
ctua
rial a
ccru
ed li
abili
ty w
hich
was
ove
rsta
ted
in th
e Ju
ne 3
0, 2
010
valu
ation
.
2009
$433 42 44
5 12 -$9
32
2010
*
$932
(110
) 3(5
9)10
8$8
74
2011
$874 (6
8) 2
09
(31)
(22)
$962
2012
$962
(102
) 2
57
58
133
$1,3
08
Sour
ce: P
repa
red
usin
g ex
trac
ted
data
from
Act
uaria
l Val
uatio
ns fr
om Ju
ne 3
0, 2
008
thro
ugh
2017
.2013
$1,3
08 (1
13)
152
6
6 -$1
,413
2014
$1,4
13 (1
38)
(38)
15
16
$1,2
68
2015
$1,2
68 (39)
(24)
(15)
-
$1,1
90
2016
$1,1
90 (39)
62
(13)
-
$1,2
00
2017
$1,2
00 (3)
3 (8)
824
$2,0
16
Prio
r Val
uatio
n U
nfun
ded
Actu
aria
l Acc
rued
Lia
bilit
ySa
lary
Incr
ease
Gre
ater
(Les
s) th
an E
xpec
ted
Asse
t Ret
urn
Less
(Gre
ater
) tha
n Ex
pect
edO
ther
Exp
erie
nce
Econ
omic
and
Non
-Eco
nom
ic A
ssum
ption
Cha
nges
Endi
ng U
nfun
ded
Actu
aria
l Acc
rued
Lia
bilit
y

Pr o b a b i l i T i e s o f se Pa r aT i o n Pr i o r To re T i r e m e n T
Rate (%)
DisabilityAge Miscellaneous Safety
20 0.00% 0.10%25 0.01 0.1030 0.03 0.1635 0.05 0.3240 0.08 0.4345 0.13 0.5150 0.21 0.7655 0.34 0.9660 0.46 1.30
Note: For Miscellaneous, 30% of disabilities are assumed to be service-connected disabilities and the other 70% are assumed to be nonservice-connected disabilities. For Safety, 90% of disabilities are assumed to be service-connected disabilities and the other 10% are assumed to be nonservice-connected disabilities.
Rate (%)
MortalityMiscellaneous Safety
Age Male Female Male Female
25 0.03% 0.01% 0.03% 0.01%30 0.03 0.01 0.03 0.0135 0.03 0.02 0.03 0.0240 0.04 0.02 0.04 0.0245 0.06 0.04 0.06 0.0450 0.10 0.06 0.10 0.0655 0.17 0.10 0.17 0.1060 0.28 0.15 0.28 0.1565 0.49 0.22 0.49 0.22
Note: The generational projections are not reflected in the above mortality rates. All Miscellaneous pre-retirement deaths are assumed to be nonservice-connected. For Safety, 50% pre-retirement deaths are assumed to be nonservice-connected and the rest are assumed to be service-connected.
Actuarial Section | 120

ProbabiliTies of seParaTion Prior To reTiremenT (ConTinued)
Rate (%)
Withdrawal (<5 Years of Service)Years of Service Miscellaneous Safety
0 - 1 13.00% 6.00%1 - 2 8.00 5.002 - 3 7.00 4.003 - 4 6.00 3.004 - 5 5.50 3.00
Note: 65% of the Miscellaneous members and 50% of the Safety members are assumed to elect a refund of contributions upon separation, while the remaining 35% and 50% of Miscellaneous and Safety members, respectively, are assumed to elect a deferred retirement benefit. No withdrawal is assumed after a member is eligible to retire.
Withdrawal (5+ Years of Service)Age Miscellaneous Safety
20 5.50% 2.50%25 5.50 2.5030 5.20 2.2035 4.40 1.7040 3.40 1.3545 2.70 1.1050 2.44 1.0055 2.34 1.0060 2.24 1.0065 1.48 0.00
Note: 40% of the Miscellaneous members and 15% of the Safety members are assumed to elect a refund of contributions upon separation, while the remaining 60% and 85% of Miscellaneous and Safety members, respectively, are assumed to elect a deferred retirement benefit. No withdrawal is assumed after a member is eligible to retire.
Actuarial Section | 121


STATISTICAL

Statistical Section | 124
Issued in May 2004, pronouncement GASB Statement No. 44, Economic Conditioning Reporting: The Statistical Section, establishes and modifies requirements related to the supplementary information presented in this section of the report.
The pension trust fund is accounted for under the accrual basis of accounting. Information is provided for the last ten years ended June 30, 2017 for the following five objectives: financial trends; revenue capacity; debt capacity; demographic and economic; and operating.
Financial trends are presented on pages 125 to 129. The schedules contain trend information to aid in understanding how the System’s financial performance has changed over time.
Revenue capacity is presented on pages 125, 127, and 128. The schedules contain information regarding the contribution amount and rate history for the last ten years.
Demographic and economic information is presented on pages 130 to 134. These schedules offer demographic and economic indicators to enhance understanding of the environment within which the System’s financial activities take place. The schedules show the average monthly benefit payments followed by the System membership.
Operating information is presented on pages 135 and 136. These schedules contain pension plan data to assist in understanding how the information in the financial report relates to the pension plan the System administers. This section includes the schedules of principal participating employers and active members.
summary of sTaTisTiCal daTa

sC h e d u l e o f ad d i T i o n s b y so u r C e (Dollar Amounts Expressed in Thousands)
Year Ended June 30:
Employee Contributions
Employer Contributions
Net Investment Income / (Loss) Total
2017 $89,489 $203,928 $1,048,915 $1,342,332 2016 77,494 209,020 (72,399) 214,115 2015 68,143 222,959 158,222 449,324 2014 57,635 210,503 1,107,152 1,375,290 2013 68,242 189,664 785,449 1,043,355 2012 65,690 179,098 (3,414) 241,374 2011 57,151 182,921 1,206,775 1,446,847 2010 52,413 167,142 617,481 837,036 2009 54,623 177,011 (1,318,447) (1,086,813)2008 52,142 167,055 (234,086) (14,889)
Source: Audited Financial Statements from June 30, 2008 through 2017
Statistical Section | 125
sC h e d u l e o f de d u C T i o n s b y Ty P e(Dollar Amounts Expressed in Thousands)
Benefits PaidYear
Ended June 30: Service*
Survivor Benefits
Retiree Death
BenefitsAdministrative
Expenses Withdrawals Total2017 $426,292 $2,479 $983 $6,906 $2,312 $438,972 2016 399,690 2,443 1,223 6,362 2,346 412,064 2015 368,788 2,404 1,177 5,854 2,288 380,511 2014 341,756 2,116 1,018 5,665 2,729 353,284 2013 317,308 2,225 1,295 5,719 2,739 329,286 2012 295,598 2,284 882 6,288 3,040 308,092 2011 273,510 2,032 619 6,571 4,433 287,165 2010 250,553 1,993 546 5,908 4,932 263,932 2009 230,005 1,749 622 5,980 3,302 241,658 2008 212,406 1,865 621 5,866 3,177 223,935
*Amounts reported here include both service and disability retirement benefits and active death benefits.Source: Audited Financial Statements from June 30, 2008 through 2017 and SCERS Retired Member Pension Payroll Data.

sCh
ed
ul
e o
f a
dm
inis
Tr
aT
ive
ex
Pe
ns
es
For t
he L
ast T
en F
iscal
Yea
rs E
nded
June
30
(Dol
lar A
mou
nts E
xpre
ssed
in T
hous
ands
)
Type
of E
xpen
ses
2017
2016
2015
2014
2013
2012
2011
2010
2009
2008
Sala
ries a
nd B
enefi
ts$3
,984
$3
,506
$3
,445
$3
,300
$3
,284
$3
,530
$3
,755
$3
,215
$3
,184
$3
,130
Prof
essio
nal F
ees
1,14
9 1,
081
811
7
86
857
1
,146
1
,137
7
19
842
942
Rent
and
Lea
se E
xpen
se48
8 5
01
456
4
60
432
4
58
444
5
76
603
571
Depr
ecia
tion
Expe
nse
27
34
36
36
36
37
17
5
55
Equi
pmen
t Pur
chas
es a
nd M
aint
enan
ce 6
1 2
6 3
2 2
1 2
4 4
4 3
5 2
9 62
41
Oth
er A
dmin
istra
tive
Expe
nses
1,1
97
1,2
14
1,0
74
1,0
62
1,0
86
1,0
73
1,1
83
1,3
64
1,28
41,
177
Tota
l $6
,906
$6
,362
$5
,854
$5
,665
$5
,719
$6
,288
$6
,571
$5
,908
$5
,980
$5
,866
Sour
ce:
SCER
S An
nual
Bud
get f
rom
June
30,
200
8 th
roug
h 20
17
Statistical Section | 126
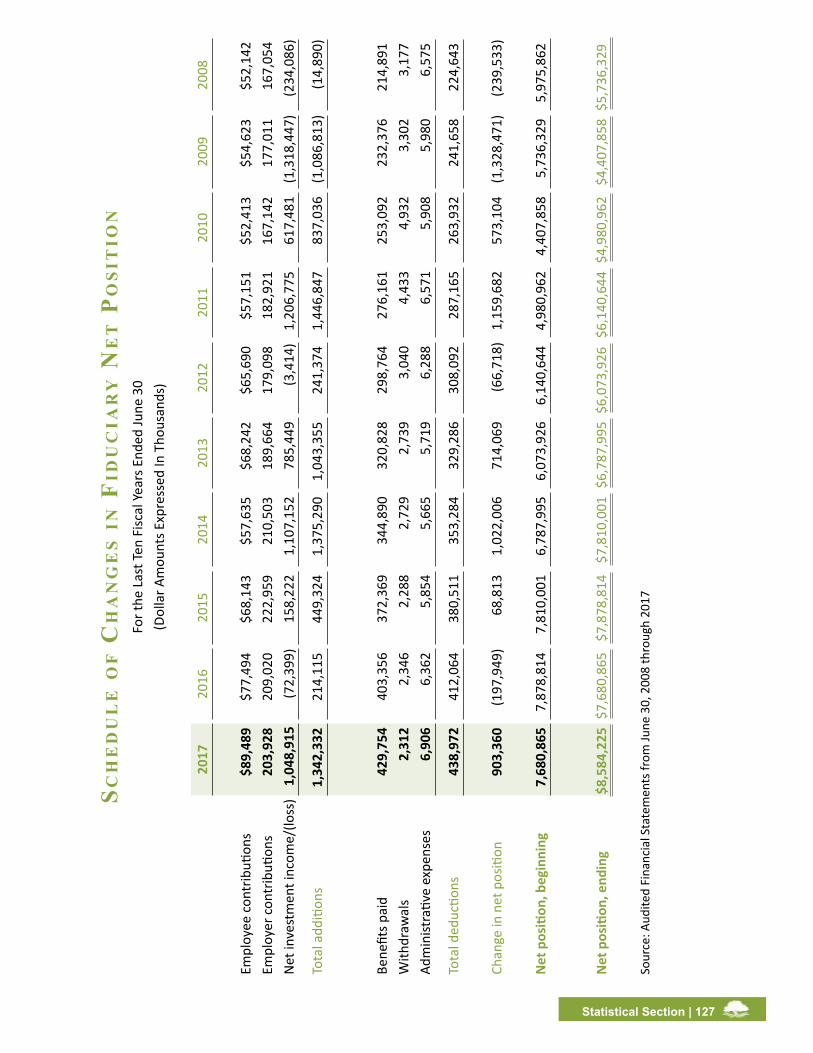
sCh
ed
ul
e o
f C
ha
ng
es i
n f
idu
Cia
ry
ne
T P
os
iTio
nFo
r the
Las
t Ten
Fisc
al Y
ears
End
ed Ju
ne 3
0(D
olla
r Am
ount
s Exp
ress
ed In
Tho
usan
ds)
2017
2016
2015
2014
2013
2012
2011
2010
2009
2008
Empl
oyee
con
trib
ution
s$8
9,48
9$7
7,49
4$6
8,14
3$5
7,63
5 $6
8,24
2 $6
5,69
0 $5
7,15
1 $5
2,41
3 $5
4,62
3 $5
2,14
2 Em
ploy
er c
ontr
ibuti
ons
203
,928
209
,020
2
22,9
59
210
,503
1
89,6
64
179
,098
1
82,9
21
167
,142
1
77,0
11
167
,054
N
et in
vest
men
t inc
ome/
(loss
) 1
,048
,915
(7
2,39
9)
158
,222
1
,107
,152
7
85,4
49
(3,4
14)
1,2
06,7
75
617
,481
(1
,318
,447
) (2
34,0
86)
Tota
l add
ition
s1,
342,
332
214
,115
4
49,3
24
1,3
75,2
90
1,0
43,3
55
241
,374
1
,446
,847
8
37,0
36
(1,0
86,8
13)
(14,
890)
Bene
fits p
aid
429
,754
4
03,3
56
372
,369
3
44,8
90
320
,828
2
98,7
64
276
,161
2
53,0
92
232
,376
2
14,8
91
With
draw
als
2,3
12
2,3
46
2,2
88
2,7
29
2,7
39
3,0
40
4,4
33
4,9
32
3,3
02
3,1
77
Adm
inist
rativ
e ex
pens
es 6
,906
6
,362
5
,854
5
,665
5
,719
6
,288
6
,571
5
,908
5
,980
6
,575
Tota
l ded
uctio
ns 4
38,9
72
412
,064
3
80,5
11
353
,284
3
29,2
86
308
,092
2
87,1
65
263
,932
2
41,6
58
224
,643
Chan
ge in
net
pos
ition
903,
360
(197
,949
) 6
8,81
3 1
,022
,006
7
14,0
69
(66,
718)
1,1
59,6
82
573
,104
(1
,328
,471
) (2
39,5
33)
Net
pos
ition
, beg
inni
ng7,
680,
865
7,87
8,81
4 7,
810,
001
6,78
7,99
5 6,
073,
926
6,14
0,64
4 4,
980,
962
4,4
07,8
58
5,7
36,3
29
5,9
75,8
62
Net
pos
ition
, end
ing
$8,5
84,2
25 $
7,68
0,86
5 $7
,878
,814
$7
,810
,001
$6,
787,
995
$6,0
73,9
26 $
6,14
0,64
4 $4
,980
,962
$4
,407
,858
$5,7
36,3
29
Sour
ce: A
udite
d Fi
nanc
ial S
tate
men
ts fr
om Ju
ne 3
0, 2
008
thro
ugh
2017
Statistical Section | 127
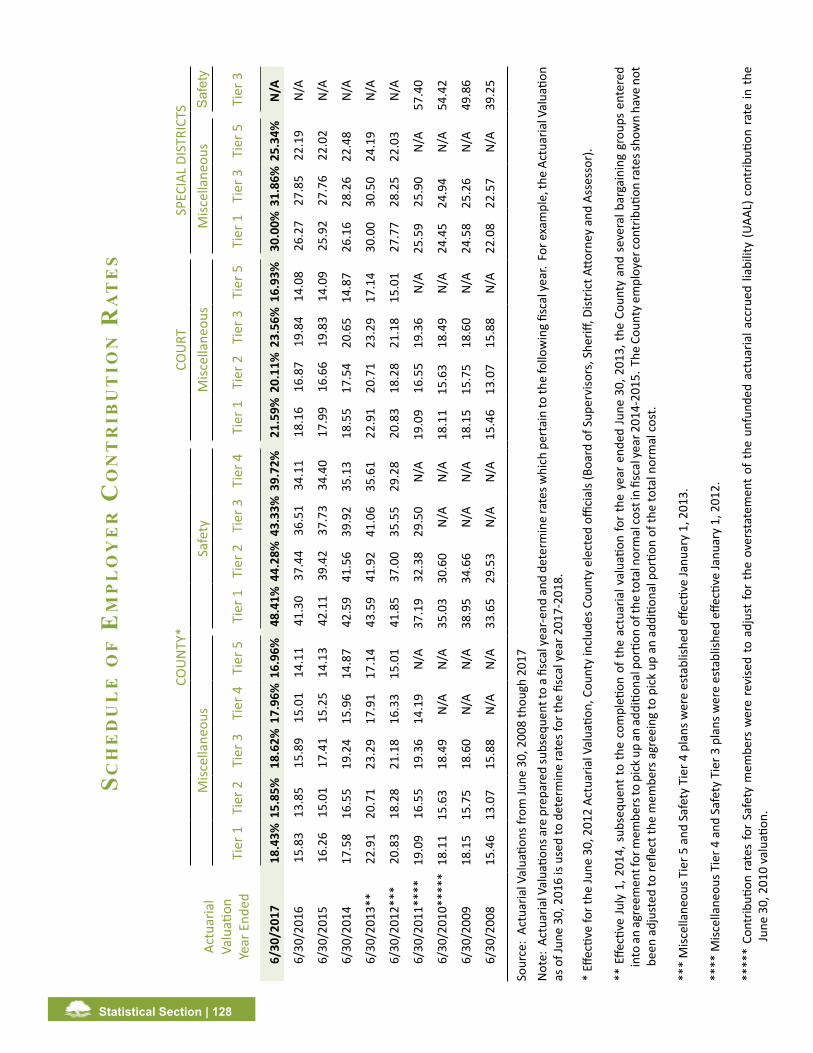
sCh
ed
ul
e o
f e
mP
lo
ye
r C
on
Tr
ibu
Tio
n r
aT
es
COU
NTY
*CO
URT
SPEC
IAL
DIST
RICT
S
Actu
aria
l Va
luati
onYe
ar E
nded
Misc
ella
neou
sSa
fety
Misc
ella
neou
sM
iscel
lane
ous
Saf
ety
Tier
1Ti
er 2
Tier
3Ti
er 4
Tier
5Ti
er 1
Tier
2Ti
er 3
Tier
4Ti
er 1
Tier
2Ti
er 3
Tier
5Ti
er 1
Tier
3Ti
er 5
Tier
3
6/30
/201
718
.43%
15.8
5%18
.62%
17.9
6%16
.96%
48.4
1%44
.28%
43.3
3%39
.72%
21.5
9%20
.11%
23.5
6%16
.93%
30.0
0%31
.86%
25.3
4%N
/A
6/30
/201
615
.83
13.8
515
.89
15.0
114
.11
41.3
037
.44
36.5
134
.11
18.1
616
.87
19.8
414
.08
26.2
727
.85
22.1
9N
/A
6/30
/201
516
.26
15.0
117
.41
15.2
514
.13
42.1
139
.42
37.7
334
.40
17.9
916
.66
19.8
314
.09
25.9
227
.76
22.0
2N
/A
6/30
/201
417
.58
16.5
519
.24
15.9
614
.87
42.5
941
.56
39.9
235
.13
18.5
517
.54
20.6
514
.87
26.1
628
.26
22.4
8N
/A
6/30
/201
3**
22.9
120
.71
23.2
917
.91
17.1
443
.59
41.9
241
.06
35.6
122
.91
20.7
123
.29
17.1
430
.00
30.5
024
.19
N/A
6/30
/201
2***
20.8
318
.28
21.1
816
.33
15.0
141
.85
37.0
035
.55
29.2
820
.83
18.2
821
.18
15.0
127
.77
28.2
522
.03
N/A
6/30
/201
1***
*19
.09
16.5
519
.36
14.1
9N
/A37
.19
32.3
829
.50
N/A
19.0
916
.55
19.3
6N
/A25
.59
25.9
0N
/A57
.40
6/30
/201
0***
**18
.11
15.6
318
.49
N/A
N/A
35.0
330
.60
N/A
N/A
18.1
115
.63
18.4
9N
/A24
.45
24.9
4N
/A54
.42
6/30
/200
918
.15
15.7
518
.60
N/A
N/A
38.9
534
.66
N/A
N/A
18.1
515
.75
18.6
0N
/A24
.58
25.2
6N
/A49
.86
6/30
/200
815
.46
13.0
715
.88
N/A
N/A
33.6
529
.53
N/A
N/A
15.4
613
.07
15.8
8N
/A22
.08
22.5
7N
/A39
.25
Sour
ce:
Actu
aria
l Val
uatio
ns fr
om Ju
ne 3
0, 2
008
thou
gh 2
017
Not
e: A
ctua
rial V
alua
tions
are
pre
pare
d su
bseq
uent
to a
fisc
al y
ear-e
nd a
nd d
eter
min
e ra
tes w
hich
per
tain
to th
e fo
llow
ing
fisca
l yea
r. F
or e
xam
ple,
the
Actu
aria
l Val
uatio
n as
of J
une
30, 2
016
is us
ed to
det
erm
ine
rate
s for
the
fisca
l yea
r 201
7-20
18.
* Eff
ectiv
e fo
r the
June
30,
201
2 Ac
tuar
ial V
alua
tion,
Cou
nty
incl
udes
Cou
nty
elec
ted
offici
als (
Boar
d of
Sup
ervi
sors
, She
riff, D
istric
t Atto
rney
and
Ass
esso
r).
** E
ffecti
ve Ju
ly 1
, 201
4, s
ubse
quen
t to
the
com
pleti
on o
f the
act
uaria
l val
uatio
n fo
r th
e ye
ar e
nded
June
30,
201
3, th
e Co
unty
and
sev
eral
bar
gain
ing
grou
ps e
nter
ed
in
to a
n ag
reem
ent f
or m
embe
rs to
pic
k up
an a
dditi
onal
por
tion
of th
e to
tal n
orm
al co
st in
fisc
al ye
ar 2
014-
2015
. The
Cou
nty e
mpl
oyer
cont
ributi
on ra
tes s
how
n ha
ve n
ot
b
een
adju
sted
to re
flect
the
mem
bers
agr
eein
g to
pic
k up
an
addi
tiona
l por
tion
of th
e to
tal n
orm
al c
ost.
***
Misc
ella
neou
s Tie
r 5 a
nd S
afet
y Ti
er 4
pla
ns w
ere
esta
blish
ed e
ffecti
ve Ja
nuar
y 1,
201
3.
****
Misc
ella
neou
s Tie
r 4 a
nd S
afet
y Ti
er 3
pla
ns w
ere
esta
blish
ed e
ffecti
ve Ja
nuar
y 1,
201
2.
****
* Co
ntrib
ution
rat
es fo
r Sa
fety
mem
bers
wer
e re
vise
d to
adj
ust
for
the
over
stat
emen
t of
the
unf
unde
d ac
tuar
ial a
ccru
ed li
abili
ty (U
AAL)
con
trib
ution
rat
e in
the
June
30,
201
0 va
luati
on.
Statistical Section | 128

sCh
ed
ul
e o
f b
en
ef
iTs P
aid
an
d W
iTh
dr
aW
al
s b
y T
yP
eFo
r the
Las
t Ten
Fisc
al Y
ears
End
ed Ju
ne 3
0(D
olla
r Am
ount
s Exp
ress
ed in
Tho
usan
ds)
2017
2016
2015
2014
2013
2012
2011
2010
2009
2008
Type
of B
enefi
t
Serv
ice
Retir
emen
t Ben
efits
$426
,292
$3
99,6
90
$368
,788
$3
41,7
56
$317
,308
$2
95,5
98
$273
,062
$2
50,1
92$2
29,6
59$2
12,0
61Su
rviv
or B
enefi
ts2,
479
2,44
32,
404
2,11
6 2
,225
2
,284
2
,032
1,
993
1,74
91,
865
Deat
h Be
nefit
s-Be
fore
Reti
rem
ent
218
352
411
312
542
1
89
448
36
134
634
5De
ath
Bene
fits-
After
Reti
rem
ent
765
871
766
706
753
6
93
619
54
662
262
1
T
otal
Ben
efits
Pai
d $
429,
754
$40
3,35
6 $
372,
369
$34
4,89
0 $
320,
828
$29
8,76
4 $
276,
161
$253
,092
$232
,376
$214
,892
Type
of W
ithdr
awal
Deat
h $
298
$52
2 $
320
$44
5 $
547
$36
5 $
463
$526
$601
$111
Sepa
ratio
n 1
,974
1
,786
1
,815
2
,211
2
,153
2,
663
3,8
98
4,30
32,
550
2,94
0M
iscel
lane
ous
40
38
153
7
3 3
9 12
7
2 10
315
112
6
T
otal
With
draw
als
$2,
312
$2,
346
$2,
288
$2,
729
$2,
739
$3,
040
$4,
433
$4,9
32$3
,302
$3,1
77
Sour
ce:
SCER
S Re
tired
Mem
ber P
ensio
n Pa
yrol
l Dat
a.
Statistical Section | 129

Statistical Section | 130
Sc
he
du
le
of
diS
tr
ibu
tio
n o
f r
et
ire
d M
eM
be
rS a
nd
be
ne
fic
iar
ieS b
y t
yp
e a
nd
by
Mo
nt
hl
y a
Mo
un
t
As o
f Jun
e 30
, 201
7
Type
of R
etire
men
t*O
ption
Sel
ecte
d**
Amou
nt o
f Mon
thly
Be
nefit
Tota
l Num
ber o
f Re
tired
Mem
bers
12
34
56
78
910
1112
1316
17U
nmod
ified
12
34
$1
-$4
99
817
5
80
20
6
5
6
89
25
9
2
22
- 3
9 -
3
11
594
6
9 1
34
8
12
500
-99
9 1
,337
9
29
35
9
--
151
7
7 5
8 4
1
9 1
5
0 -
- 4
1
,040
1
03
161
1
1 2
2 1,
000
-1,
499
1,4
10
1,0
53
66
20
4
4
122
4
1 4
4 2
1
2 2
3
7 3
-
- 1
,165
8
4 1
35
15
11
1,50
0-
1,99
9 1
,211
8
92
53
16
26
10
117
2
6 1
9 2
9
-
39
2
--
1,0
10
53
131
1
3 4
2,
000
-2,
499
1,0
53
806
3
4 1
2 4
7 1
3 8
4 7
8
1
1 1
3 1
1
6 1
-
- 8
92
50
104
2
5
2,
500
-2,
999
908
7
47
6
4
35
11
66
6
5
11
5
1
9
2
--
788
3
0 7
4 7
9
3,
000
-3,
499
721
5
69
7
3
34
24
58
2
- 6
2
-
9
6
1
- 6
11
33
65
6
6
3,50
0-
3,99
9 6
22
490
1
-
37
32
37
--
14
4
- 4
2
-
1
545
2
2 4
8 3
4
4,
000
-4,
499
555
4
49
2
- 2
9 1
9 2
9 1
-
13
2
- 2
9
-
- 4
95
15
37
1
7
4,50
0-
4,99
9 4
40
393
-
- 1
2 8
1
9 1
-
3
--
2
2
--
398
1
3 2
5 2
2
5,
000
&ov
er 2
,322
2
,195
2
-
44
16
38
2
1
15
4
- 2
3
-
- 2
,109
4
4 1
42
15
12
Tota
l 1
1,39
6 9
,103
2
26
70
273
1
43
810
1
88
144
8
3 9
2 5
20
9 3
0 4
1
6 9
,647
5
16
1,0
56
83
94
* Ty
pe o
f Reti
rem
ent:
** O
ption
Sel
ecte
d:
1Se
rvic
e Re
tirem
ent
Unm
odifi
ed:Q
ualifi
ed se
rvic
e re
tirem
ent o
r non
serv
ice-
conn
ecte
d di
sabi
lity
retir
emen
t be
nefic
iary
rece
ives
60
perc
ent c
ontin
uanc
e. Q
ualifi
ed se
rvic
e-co
nnec
ted
disa
bilit
y re
tirem
ent b
enefi
ciar
y re
ceiv
es 1
00 p
erce
nt c
ontin
uanc
e.2
Non
serv
ice-
Conn
ecte
d Di
sabi
lity,
age
55
and
olde
r
3N
onse
rvic
e-Co
nnec
ted
Disa
bilit
y, u
nder
age
55
4Se
rvic
e-Co
nnec
ted
Disa
bilit
y (S
CD),
age
55 a
nd o
lder
5Se
rvic
e-Co
nnec
ted
Disa
bilit
y, u
nder
age
55
The
follo
win
g op
tions
redu
ce th
e re
tired
mem
ber’s
mon
thly
ben
efit:
6Be
nefic
iary
of S
ervi
ce R
etire
eO
ption
1 -
Bene
ficia
ry re
ceiv
es lu
mp
sum
or m
embe
r’s u
nuse
d co
ntrib
ution
s.
7Su
rviv
or D
eath
Ben
efits
(SDB
)O
ption
2 -
Bene
ficia
ry h
avin
g an
insu
rabl
e in
tere
st in
mem
ber’s
life
rece
ives
100
per
cent
of
mem
ber’s
redu
ced
mon
thly
ben
efit.
8Be
nefic
iary
of N
onse
rvic
e-Co
nnec
ted
Disa
bilit
y Re
tiree
9Be
nefic
iary
of S
ervi
ce-C
onne
cted
Disa
bilit
y Re
tiree
Opti
on 3
-Be
nefic
iary
hav
ing
an in
sura
ble
inte
rest
in m
embe
r’s li
fe re
ceiv
es 5
0 pe
rcen
t of
mem
ber’s
redu
ced
mon
thly
ben
efit.
10Di
vorc
e-Re
ceiv
ing
Bene
fits
11In
terim
Non
serv
ice-
Conn
ecte
d Di
sabi
lity
Retir
emen
tO
ption
4 -
Bene
fits p
aid
to p
erso
n ha
ving
an
insu
rabl
e in
tere
st in
mem
ber’s
life
as
nom
inat
ed b
y m
embe
r’s w
ritten
des
igna
tion.
12N
on-M
embe
r Rec
eivi
ng B
enefi
ts
13Su
rviv
or D
eath
Ben
efits
-SCD
16Be
nefic
iary
of N
on-M
embe
r
17Be
nefic
iary
of D
ivor
ce-R
ecei
ving
Ben
efits
Sour
ce: S
CERS
Reti
red
Mem
ber P
ensio
n Pa
yrol
l Dat
a
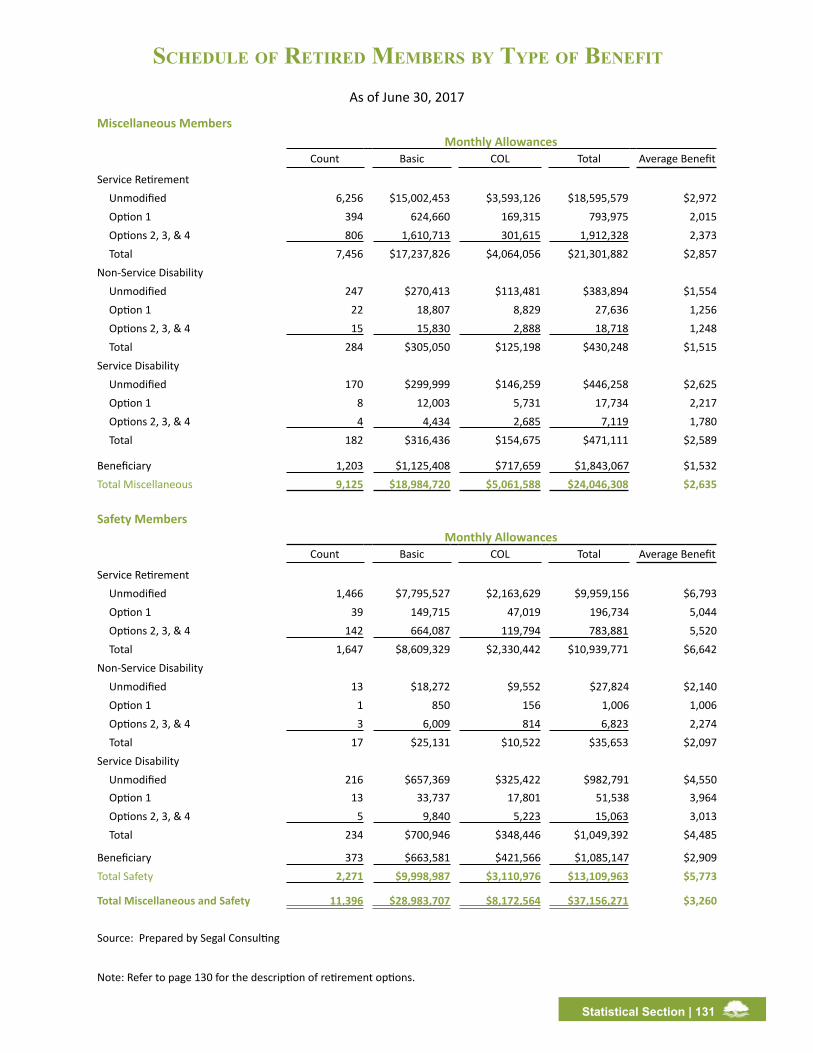
sChedule of reTired members by TyPe of benefiT
As of June 30, 2017
Miscellaneous MembersMonthly Allowances
Count Basic COL Total Average Benefit
Service RetirementUnmodified 6,256 $15,002,453 $3,593,126 $18,595,579 $2,972Option 1 394 624,660 169,315 793,975 2,015 Options 2, 3, & 4 806 1,610,713 301,615 1,912,328 2,373 Total 7,456 $17,237,826 $4,064,056 $21,301,882 $2,857
Non-Service DisabilityUnmodified 247 $270,413 $113,481 $383,894 $1,554Option 1 22 18,807 8,829 27,636 1,256 Options 2, 3, & 4 15 15,830 2,888 18,718 1,248 Total 284 $305,050 $125,198 $430,248 $1,515
Service DisabilityUnmodified 170 $299,999 $146,259 $446,258 $2,625Option 1 8 12,003 5,731 17,734 2,217 Options 2, 3, & 4 4 4,434 2,685 7,119 1,780 Total 182 $316,436 $154,675 $471,111 $2,589
Beneficiary 1,203 $1,125,408 $717,659 $1,843,067 $1,532 Total Miscellaneous 9,125 $18,984,720 $5,061,588 $24,046,308 $2,635
Safety MembersMonthly Allowances
Count Basic COL Total Average Benefit
Service RetirementUnmodified 1,466 $7,795,527 $2,163,629 $9,959,156 $6,793Option 1 39 149,715 47,019 196,734 5,044 Options 2, 3, & 4 142 664,087 119,794 783,881 5,520 Total 1,647 $8,609,329 $2,330,442 $10,939,771 $6,642
Non-Service DisabilityUnmodified 13 $18,272 $9,552 $27,824 $2,140Option 1 1 850 156 1,006 1,006 Options 2, 3, & 4 3 6,009 814 6,823 2,274 Total 17 $25,131 $10,522 $35,653 $2,097
Service DisabilityUnmodified 216 $657,369 $325,422 $982,791 $4,550Option 1 13 33,737 17,801 51,538 3,964 Options 2, 3, & 4 5 9,840 5,223 15,063 3,013 Total 234 $700,946 $348,446 $1,049,392 $4,485
Beneficiary 373 $663,581 $421,566 $1,085,147 $2,909Total Safety 2,271 $9,998,987 $3,110,976 $13,109,963 $5,773
Total Miscellaneous and Safety 11,396 $28,983,707 $8,172,564 $37,156,271 $3,260
Source: Prepared by Segal Consulting
Note: Refer to page 130 for the description of retirement options.
Statistical Section | 131
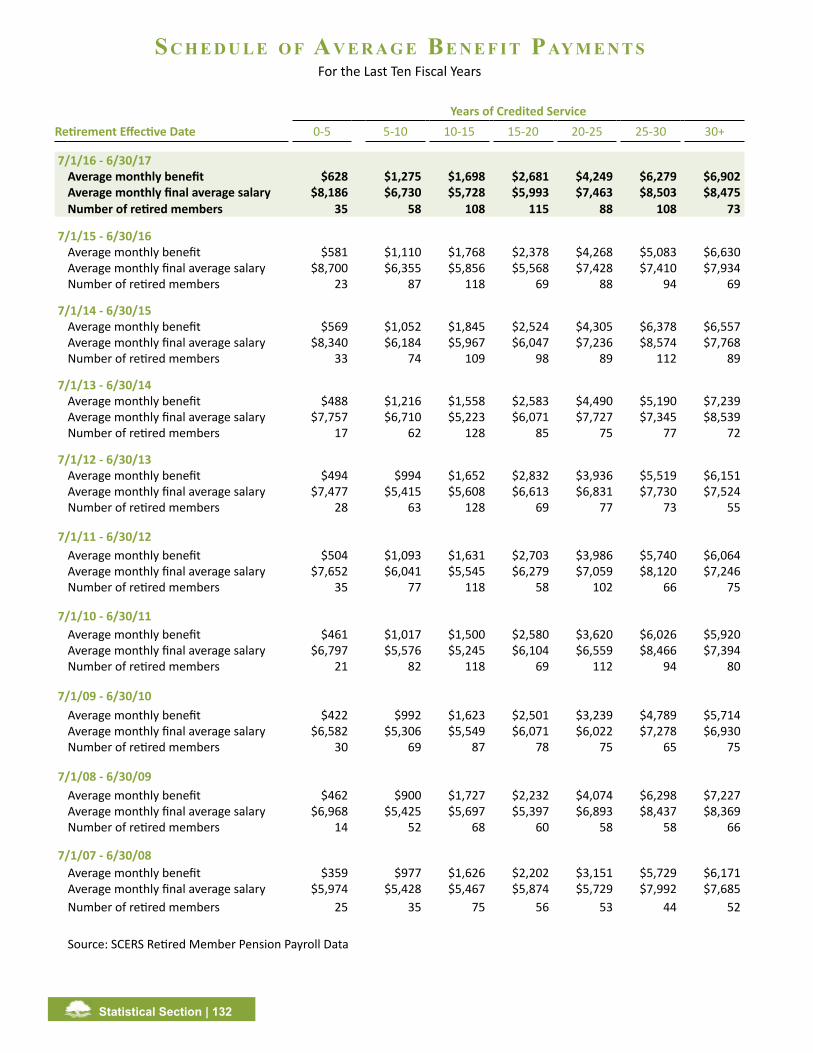
sC h e d u l e o f av e r a g e be n e f i T Pay m e n T sFor the Last Ten Fiscal Years
Years of Credited ServiceRetirement Effective Date 0-5 5-10 10-15 15-20 20-25 25-30 30+
7/1/16 - 6/30/17Average monthly benefit $628 $1,275 $1,698 $2,681 $4,249 $6,279 $6,902 Average monthly final average salary $8,186 $6,730 $5,728 $5,993 $7,463 $8,503 $8,475 Number of retired members 35 58 108 115 88 108 73
7/1/15 - 6/30/16Average monthly benefit $581 $1,110 $1,768 $2,378 $4,268 $5,083 $6,630 Average monthly final average salary $8,700 $6,355 $5,856 $5,568 $7,428 $7,410 $7,934 Number of retired members 23 87 118 69 88 94 69
7/1/14 - 6/30/15Average monthly benefit $569 $1,052 $1,845 $2,524 $4,305 $6,378 $6,557 Average monthly final average salary $8,340 $6,184 $5,967 $6,047 $7,236 $8,574 $7,768 Number of retired members 33 74 109 98 89 112 89
7/1/13 - 6/30/14Average monthly benefit $488 $1,216 $1,558 $2,583 $4,490 $5,190 $7,239 Average monthly final average salary $7,757 $6,710 $5,223 $6,071 $7,727 $7,345 $8,539 Number of retired members 17 62 128 85 75 77 72
7/1/12 - 6/30/13Average monthly benefit $494 $994 $1,652 $2,832 $3,936 $5,519 $6,151 Average monthly final average salary $7,477 $5,415 $5,608 $6,613 $6,831 $7,730 $7,524 Number of retired members 28 63 128 69 77 73 55
7/1/11 - 6/30/12Average monthly benefit $504 $1,093 $1,631 $2,703 $3,986 $5,740 $6,064 Average monthly final average salary $7,652 $6,041 $5,545 $6,279 $7,059 $8,120 $7,246 Number of retired members 35 77 118 58 102 66 75
7/1/10 - 6/30/11Average monthly benefit $461 $1,017 $1,500 $2,580 $3,620 $6,026 $5,920 Average monthly final average salary $6,797 $5,576 $5,245 $6,104 $6,559 $8,466 $7,394 Number of retired members 21 82 118 69 112 94 80
7/1/09 - 6/30/10Average monthly benefit $422 $992 $1,623 $2,501 $3,239 $4,789 $5,714Average monthly final average salary $6,582 $5,306 $5,549 $6,071 $6,022 $7,278 $6,930Number of retired members 30 69 87 78 75 65 75
7/1/08 - 6/30/09Average monthly benefit $462 $900 $1,727 $2,232 $4,074 $6,298 $7,227Average monthly final average salary $6,968 $5,425 $5,697 $5,397 $6,893 $8,437 $8,369Number of retired members 14 52 68 60 58 58 66
7/1/07 - 6/30/08Average monthly benefit $359 $977 $1,626 $2,202 $3,151 $5,729 $6,171Average monthly final average salary $5,974 $5,428 $5,467 $5,874 $5,729 $7,992 $7,685Number of retired members 25 35 75 56 53 44 52
Source: SCERS Retired Member Pension Payroll Data
Statistical Section | 132
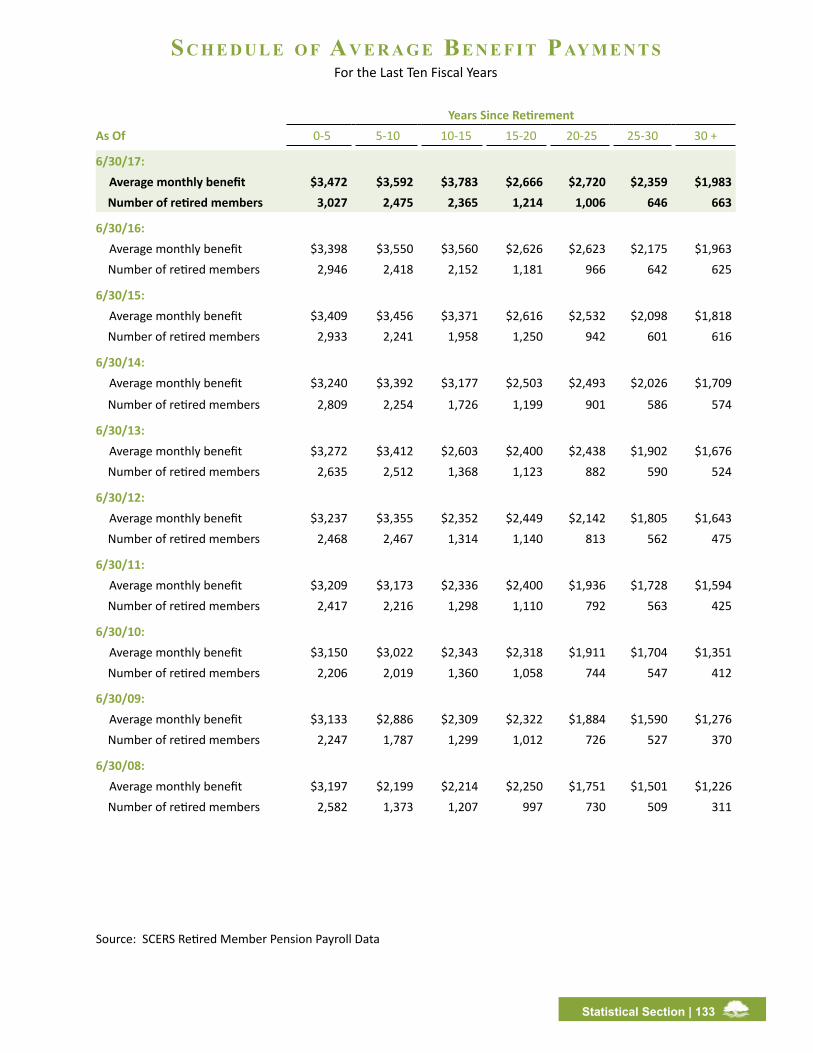
sC h e d u l e o f av e r a g e be n e f i T Pay m e n T sFor the Last Ten Fiscal Years
Years Since RetirementAs Of 0-5 5-10 10-15 15-20 20-25 25-30 30 +
6/30/17:Average monthly benefit $3,472 $3,592 $3,783 $2,666 $2,720 $2,359 $1,983
Number of retired members 3,027 2,475 2,365 1,214 1,006 646 663
6/30/16:Average monthly benefit $3,398 $3,550 $3,560 $2,626 $2,623 $2,175 $1,963
Number of retired members 2,946 2,418 2,152 1,181 966 642 625
6/30/15:Average monthly benefit $3,409 $3,456 $3,371 $2,616 $2,532 $2,098 $1,818
Number of retired members 2,933 2,241 1,958 1,250 942 601 616
6/30/14:Average monthly benefit $3,240 $3,392 $3,177 $2,503 $2,493 $2,026 $1,709
Number of retired members 2,809 2,254 1,726 1,199 901 586 574
6/30/13:Average monthly benefit $3,272 $3,412 $2,603 $2,400 $2,438 $1,902 $1,676
Number of retired members 2,635 2,512 1,368 1,123 882 590 524
6/30/12:Average monthly benefit $3,237 $3,355 $2,352 $2,449 $2,142 $1,805 $1,643
Number of retired members 2,468 2,467 1,314 1,140 813 562 475
6/30/11:Average monthly benefit $3,209 $3,173 $2,336 $2,400 $1,936 $1,728 $1,594
Number of retired members 2,417 2,216 1,298 1,110 792 563 425
6/30/10:Average monthly benefit $3,150 $3,022 $2,343 $2,318 $1,911 $1,704 $1,351
Number of retired members 2,206 2,019 1,360 1,058 744 547 412
6/30/09:Average monthly benefit $3,133 $2,886 $2,309 $2,322 $1,884 $1,590 $1,276
Number of retired members 2,247 1,787 1,299 1,012 726 527 370
6/30/08:Average monthly benefit $3,197 $2,199 $2,214 $2,250 $1,751 $1,501 $1,226
Number of retired members 2,582 1,373 1,207 997 730 509 311
Source: SCERS Retired Member Pension Payroll Data
Statistical Section | 133

Ch a n g e s i n sy s T e m me m b e r s h i P
Year Ended June 30:
ActiveMembers
RetiredMembers
Deferred Members Total
2017 12,587 11,396 3,425 27,408
2016 12,393 10,960 3,301 26,654
2015 12,072 10,541 3,261 25,874
2014 12,049 10,049 3,201 25,299
2013 12,026 9,634 3,249 24,909
2012 12,155 9,239 2,851 24,245
2011 12,434 8,821 2,710 23,965
2010 13,340 8,346 2,740 24,426
2009 14,796 7,968 2,818 25,582
2008 15,180 7,709 2,661 25,550
Statistical Section | 134
Source: Actuarial Valuations from June 30, 2008 through 2017
sy s T e m me m b e r s h i P aT a gl a n C e
-
5,000
10,000
15,000
20,000
25,000
30,000
Active Retired Deferred
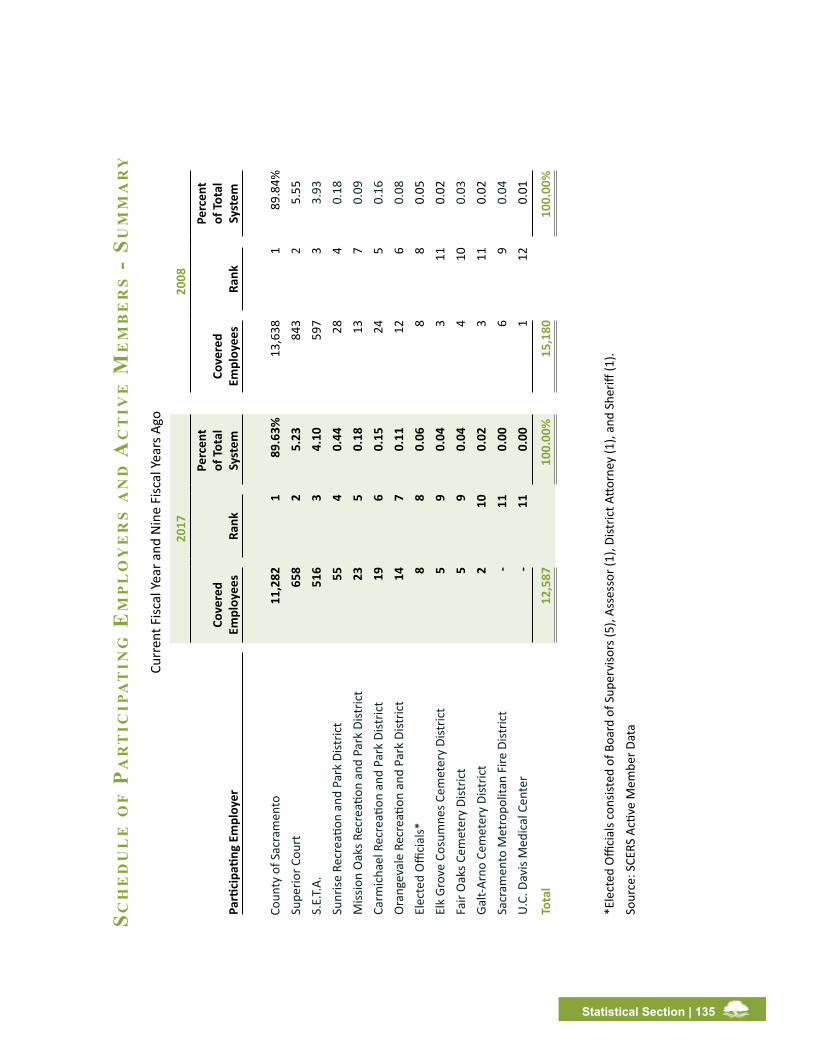
sCh
ed
ul
e o
f P
ar
TiC
iPa
Tin
g e
mP
lo
ye
rs a
nd
aC
Tiv
e m
em
be
rs -
su
mm
ar
y
Curr
ent F
iscal
Yea
r and
Nin
e Fi
scal
Yea
rs A
go
Statistical Section | 135
2017
2008
Parti
cipa
ting
Empl
oyer
Cove
red
Empl
oyee
sRa
nk
Perc
ent
of T
otal
Sy
stem
Cove
red
Empl
oyee
sRa
nk
Perc
ent
of T
otal
Sy
stem
Coun
ty o
f Sac
ram
ento
11,
282
189
.63%
13,6
381
89.8
4%Su
perio
r Cou
rt 6
58
25.
2384
32
5.5
5 S.
E.T.
A. 5
16
34.
1059
73
3.9
3 Su
nrise
Rec
reati
on a
nd P
ark
Dist
rict
55
40.
4428
4 0
.18
Miss
ion
Oak
s Rec
reati
on a
nd P
ark
Dist
rict
23
50.
1813
7 0
.09
Carm
icha
el R
ecre
ation
and
Par
k Di
stric
t 1
9 6
0.15
245
0.1
6 O
rang
eval
e Re
crea
tion
and
Park
Dist
rict
14
70.
1112
6 0
.08
Elec
ted
Offi
cial
s* 8
8
0.06
88
0.0
5 El
k Gr
ove
Cosu
mne
s Cem
eter
y Di
stric
t 5
9
0.04
311
0.0
2 Fa
ir O
aks C
emet
ery
Dist
rict
5
90.
044
10 0
.03
Galt-
Arno
Cem
eter
y Di
stric
t 2
10
0.02
311
0.0
2 Sa
cram
ento
Met
ropo
litan
Fire
Dist
rict
-11
0.00
69
0.04
U.C.
Dav
is M
edic
al C
ente
r-
110.
001
120.
01
Tota
l12
,587
100.
00%
15,1
8010
0.00
%
*Ele
cted
Offi
cial
s con
siste
d of
Boa
rd o
f Sup
ervi
sors
(5),
Asse
ssor
(1),
Dist
rict A
ttorn
ey (1
), an
d Sh
eriff
(1).
Sour
ce: S
CERS
Acti
ve M
embe
r Dat
a

Sc
he
du
le
of
pa
rt
icip
at
ing
eM
pl
oy
er
S a
nd
ac
tiv
e M
eM
be
rS -
de
ta
il
Statistical Section | 136
For t
he La
st Te
n Fisc
al Ye
ars E
nded
June
30SC
ERS
Mem
ber A
genc
yPl
an20
1720
1620
1520
1420
1320
1220
1120
1020
0920
08Ca
rmic
hael
Rec
reati
on a
nd P
ark
Dist
rict
Misc
.19
2019
2121
2022
2629
24El
k Gr
ove
Cosu
mne
s Cem
eter
y Di
stric
tM
isc.
56
46
55
23
43
Fair
Oak
s Cem
eter
y Di
stric
tM
isc.
54
44
44
34
44
Galt-
Arno
Cem
eter
y Di
stric
tM
isc.
21
11
11
11
33
Miss
ion
Oak
s Rec
reati
on a
nd P
ark
Dist
rict
Misc
.23
1112
1212
1213
1413
13O
rang
eval
e Re
crea
tion
and
Park
Dist
rict
Misc
.14
1313
1315
1515
1617
12Sa
cram
ento
Met
ropo
litan
Fire
Dist
rict
Safe
ty-
--
--
-3
34
6S.
E.T.
A.M
isc.
516
548
544
547
565
566
568
584
604
597
Sunr
ise R
ecre
ation
and
Par
k Di
stric
tM
isc.
5519
2222
2121
2326
2828
U.C.
Dav
is M
edic
al C
ente
rM
isc.
--
--
-1
11
11
Elec
ted
Offi
cial
s*M
isc.
77
77
77
77
77
Elec
ted
Offi
cial
s*Sa
fety
11
11
11
11
11
Tota
l Spe
cial
Dist
rict M
embe
rsM
isc.
646
629
626
633
651
652
655
682
710
692
Safe
ty1
11
11
14
45
7
Supe
rior C
ourt
Mem
bers
Misc
.65
865
163
162
563
269
874
576
580
784
3
Sacr
amen
to C
ount
y M
embe
rsM
isc.
9,27
39,
083
8,83
68,
827
8,83
08,
906
9,12
19,
865
10,9
3711
,190
Safe
ty2,
009
2,02
91,
978
1,96
31,
912
1,89
81,
909
2,02
42,
337
2,44
8
Tota
l Mem
bers
Misc
.10
,577
10,3
6310
,093
10,0
8510
,113
10,2
5610
,521
11,3
1212
,454
12,7
25Sa
fety
2,01
02,
030
1,97
91,
964
1,91
31,
899
1,91
32,
028
2,34
22,
455
Tota
l12
,587
12,3
9312
,072
12,0
4912
,026
12,1
5512
,434
13,3
4014
,796
15,1
80
*Ele
cted
Offi
cial
s con
siste
d of
Boa
rd o
f Sup
ervi
sors
(5),
Asse
ssor
(1),
Dist
rict A
ttorn
ey (1
), w
ho w
ere
misc
ella
neou
s mem
bers
, and
one
She
riff w
ho w
as a
safe
ty
mem
ber.
Sour
ce:
SCER
S Ac
tive
Mem
ber D
ata


980 9th Street, Suite 1900 | Sacramento, CA 95814 | www.SCERS.org