compliance, safety, accountability: truck driver perspectives · compliance, safety,...
TRANSCRIPT
Compliance, Safety, Accountability:
Truck Driver Perspectives
August 2011
Micah D. Lueck Research Associate
American Transportation Research Institute St. Paul, MN
950 N. Glebe Road, Suite 210 Arlington, Virginia 22203
www.atri-online.org
2011-2012 RESEARCH ADVISORY COMMITTEE
Mr. Steve Williams Chairman of the ATRI Board Chairman & CEO Maverick USA, Inc. Little Rock, AR Mr. Michael S. Card President Combined Transport, Inc. Central Point, OR Mr. Edward Crowell President & CEO Georgia Motor Trucking Association Atlanta, GA Mr. Hugh H. Fugleberg President & COO Great West Casualty Company South Sioux City, NE Mr. Tom Jensen Vice President UPS Washington, DC
Mr. Ludvik F. Koci Director Penske Transportation Components Bloomfield Hills, MI Mr. Chris Lofgren President & CEO Schneider National, Inc. Green Bay, WI Mr. William J. Logue President & CEO FedEx Freight Memphis, TN Ms. Judy McReynolds President & CEO Arkansas Best Corporation Fort Smith, AR Mr. Jeffrey J. McCaig President & CEO Trimac Transportation, Inc. Houston, TX
Mr. Gregory L. Owen Head Coach & CEO Ability/ Tri-Modal Transportation Services Carson, CA Mr. Tim Solso Chairman & CEO Cummins Inc. Indianapolis, IN Mr. Douglas W. Stotlar President & CEO Con-way Inc. Ann Arbor, MI Ms. Rebecca M. Brewster President & COO American Transportation Research Institute Atlanta, GA Honorable Bill Graves President & CEO American Trucking Associations Arlington, VA
ATRI BOARD OF DIRECTORS
Mr. Philip L. Byrd, Sr. RAC Chairman Bulldog Hiway Express Ms. Kendra Adams New York State Motor Truck Association Dr. Teresa M. Adams University of Wisconsin Ms. Susan Alt Volvo Trucks North America Ms. Cheryl Bynum U.S. Environmental Protection Agency Mr. LaMont Byrd International Brotherhood of Teamsters Mr. Terry Croslow Bestway Express, Inc. Mr. Ted Dahlburg Delaware Valley Regional Planning Commission
Mr. Tom DiSalvi Schneider National, Inc. Mr. Chad England C.R. England North America Mr. John Flanagan Stevens Van Lines Mr. David Foster Southeastern Freight Lines Dr. Patti Gillette Colorado Motor Carriers Association Mr. John Hancock Prime, Inc. Mr. Steve A. Keppler Commercial Vehicle Safety Alliance Ms. Jennifer Morrison National Transportation Safety Board Mr. Michael Naatz YRC Worldwide Enterprise Services, Inc.
Mr. Dean Newell Maverick USA, Inc. Mr. Steve L. Niswander Groendyke Transport, Inc. Mr. Deane H. Sager Northland Group, Inc. Mr. Brett A. Sant Knight Transportation, Inc. Mr. Jim Schultz Michigan Department of Transportation Ms. Nanci Tellam Ryder System, Inc. Ms. Denise Volmer Independent Drivers Association Foundation Mr. Scott Wombold Pilot Travel Centers Mr Greer Woodruff J.B. Hunt Transport Services, Inc.
Compliance, Safety and Accountability: Truck Driver Perspectives 1 August 2011
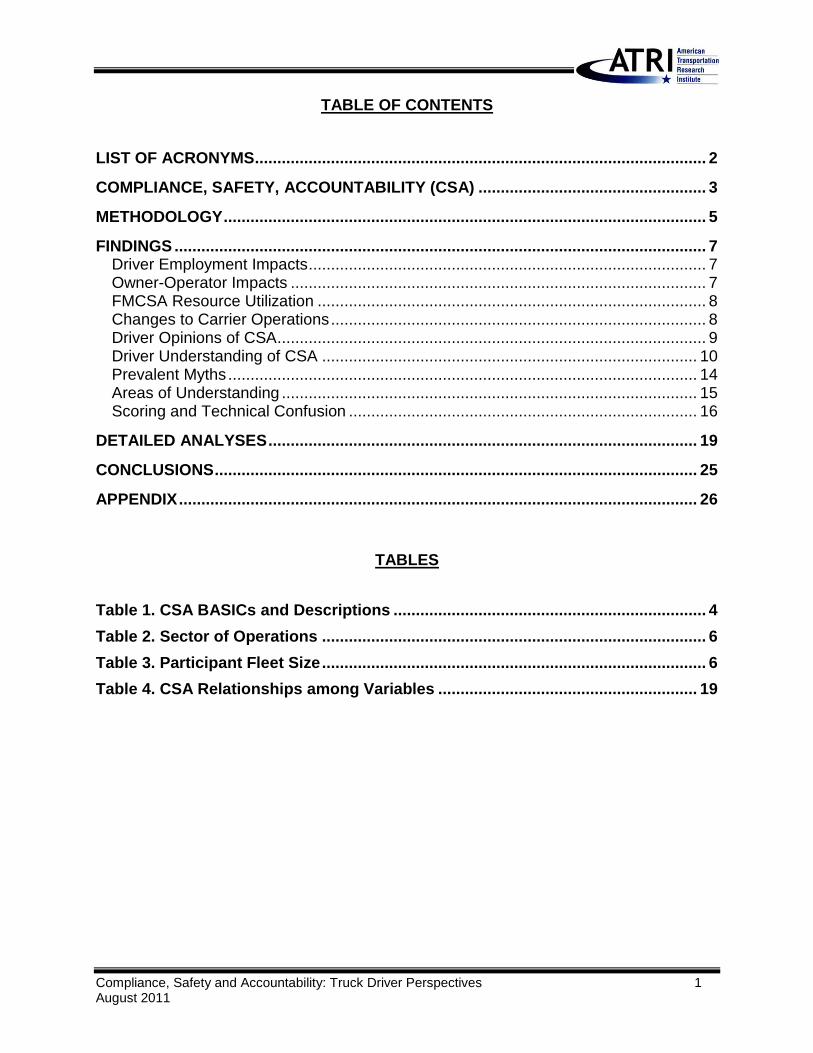
TABLE OF CONTENTS
LIST OF ACRONYMS ..................................................................................................... 2
COMPLIANCE, SAFETY, ACCOUNTABILITY (CSA) ................................................... 3
METHODOLOGY ............................................................................................................ 5
FINDINGS ....................................................................................................................... 7
Driver Employment Impacts ......................................................................................... 7
Owner-Operator Impacts ............................................................................................. 7
FMCSA Resource Utilization ....................................................................................... 8
Changes to Carrier Operations .................................................................................... 8
Driver Opinions of CSA ................................................................................................ 9
Driver Understanding of CSA .................................................................................... 10
Prevalent Myths ......................................................................................................... 14
Areas of Understanding ............................................................................................. 15
Scoring and Technical Confusion .............................................................................. 16
DETAILED ANALYSES ................................................................................................ 19
CONCLUSIONS ............................................................................................................ 25
APPENDIX .................................................................................................................... 26
TABLES
Table 1. CSA BASICs and Descriptions ...................................................................... 4
Table 2. Sector of Operations ...................................................................................... 6
Table 3. Participant Fleet Size ...................................................................................... 6
Table 4. CSA Relationships among Variables .......................................................... 19
Compliance, Safety and Accountability: Truck Driver Perspectives 2 August 2011
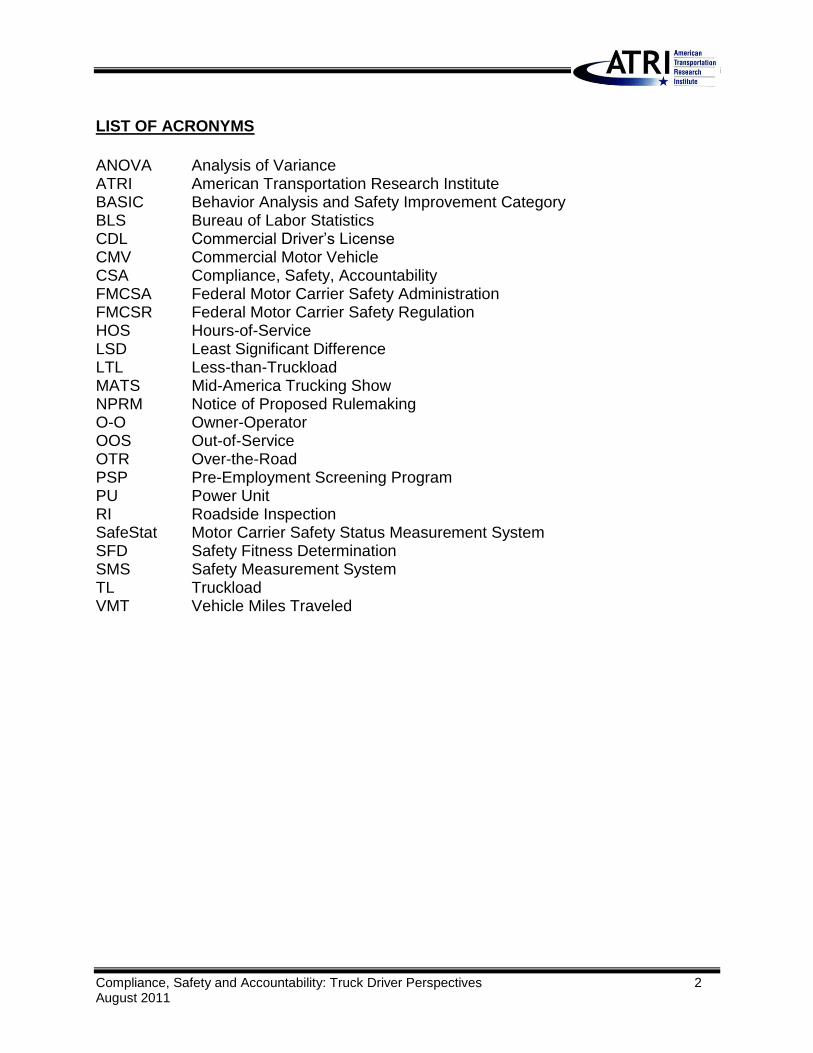
LIST OF ACRONYMS
ANOVA Analysis of Variance ATRI American Transportation Research Institute BASIC Behavior Analysis and Safety Improvement Category BLS Bureau of Labor Statistics CDL Commercial Driver’s License CMV Commercial Motor Vehicle CSA Compliance, Safety, Accountability FMCSA Federal Motor Carrier Safety Administration FMCSR Federal Motor Carrier Safety Regulation HOS Hours-of-Service LSD Least Significant Difference LTL Less-than-Truckload MATS Mid-America Trucking Show NPRM Notice of Proposed Rulemaking O-O Owner-Operator OOS Out-of-Service OTR Over-the-Road PSP Pre-Employment Screening Program PU Power Unit RI Roadside Inspection SafeStat Motor Carrier Safety Status Measurement System SFD Safety Fitness Determination SMS Safety Measurement System TL Truckload VMT Vehicle Miles Traveled
Compliance, Safety and Accountability: Truck Driver Perspectives 3 August 2011
COMPLIANCE, SAFETY, ACCOUNTABILITY (CSA) Leading up to 2011, no single issue apart from the state of the economy was of greater concern to the trucking industry than the Federal Motor Carrier Safety Administration’s (FMCSA’s) new Compliance, Safety, Accountability (CSA) initiative.1 And while many stakeholders voiced strong opinions on the potential implications of CSA, there was inadequate time to fully understand what type of effect CSA would have on the industry. Since CSA’s national rollout in December 2010, a more complete picture is beginning to emerge concerning CSA’s impact on trucking companies, truck drivers and the industry as a whole. CSA garnered heightened attention for its dramatic shift in safety measurement practices from its predecessor program, the Motor Carrier Safety Status Measurement System (SafeStat). Among the key differences, CSA utilizes all available safety violation and crash information in its Safety Measurement System (SMS) scoring algorithm, including non-out-of-service (OOS) violations for all Federal Motor Carrier Safety Regulations (FMCSRs). This information is then translated into safety scores for truck drivers and motor carriers in seven Behavior Analysis Safety Improvement Categories (BASICs) (see Table 1 for FMCSA’s description of each BASIC).2 While five of these seven BASIC scores (excluding Cargo-Related and Crash Indicator) are publicly available for carriers, driver CSA scores can only be viewed by FMCSA enforcement personnel.3 It was speculated by some analysts that the level of FMCSA scrutiny under CSA would have dramatic impacts throughout the industry, eliminating hundreds of motor carriers and thousands of drivers. Others countered that CSA and its array of enforcement tools (warning letters, on- or off-site targeted or comprehensive compliance reviews) would allow FMCSA to reach a greater number of subpar carriers and drivers and ultimately improve industry safety. This research sought to reconcile the myriad speculations that have been in circulation by taking a real-world glimpse into the operating environment of truck drivers now that CSA has been in effect for several months. Findings reveal that support for the government program is still divided and there are mixed reports of how well CSA is functioning. More must be done to improve understanding surrounding CSA’s basic tenets, which, despite modest education and training efforts, do not appear well known. The most pervasive myths are outlined in this summary report, as well as other pieces of information that can inform public understanding on the true ramifications of CSA.
1 American Transportation Research Institute. Critical Issues in the Trucking Industry – 2010. Available Online:
http://atri-online.org/ATRI_2010_Top_Industry_Issues.pdf 2 Federal Motor Carrier Safety Administration. Safety Measurement System Factsheet. Available Online:
http://csa.fmcsa.dot.gov/Documents/SMS_factsheet.pdf 3 At the time of this writing, FMCSA has vocalized an intent to make truck driver scores public in the future, although
this will be dependent on a yet to be filed Notice of Proposed Rulemaking (NPRM).

Compliance, Safety and Accountability: Truck Driver Perspectives 4 August 2011
Table 1. CSA BASICs and Descriptions4
BASIC Description
Unsafe Driving BASIC Operation of commercial motor vehicles (CMVs) in a dangerous or careless manner. Example violations: speeding, reckless driving, improper lane change, and inattention (FMCSR Parts 392 and 397)
Fatigued Driving (Hours-of-Service) BASIC
Operation of CMVs by drivers who are ill, fatigued, or in non-compliance with the Hours-of-Service (HOS) regulations. Example violations: exceeding HOS, maintaining an incomplete or inaccurate logbook, and operating a CMV while ill or fatigued (FMCSR Parts 392 and 395)
Driver Fitness BASIC
Operation of CMVs by drivers who are unfit to operate a CMV due to lack of training, experience, or medical qualifications. Example violations: failing to have a valid and appropriate commercial driver's license and being medically unqualified to operate a CMV (FMCSR Parts 383 and 391)
Controlled Substances and Alcohol BASIC
Operation of CMVs by drivers who are impaired due to alcohol, illegal drugs, and misuse of prescription or over-the-counter medications. Example violations: use or possession of controlled substances or alcohol (FMCSR Parts 382 and 392)
Vehicle Maintenance BASIC Failure to properly maintain a CMV. Example violations: brakes, lights, and other mechanical defects, and failure to make required repairs (FMCSR Parts 393 and 396)
Cargo-Related BASIC*
Failure to properly prevent shifting loads, spilled or dropped cargo, and unsafe handling of hazardous materials on a CMV. Example violations: improper load securement, cargo retention, and hazardous material handling (FMCSR Parts 392, 393, 397 and applicable DOT HM regulations)
Crash Indicator BASIC*
The Safety Measurement System (SMS) evaluates a motor carrier's crash history. Crash history is not specifically a behavior. Rather, it is a consequence of a behavior and may indicate a problem with the carrier that warrants intervention. It is based on information from State-reported crash reports and identifies histories or patterns of high crash involvement, including frequency and severity
*Scores not publicly available as of the time of this publication
4 Federal Motor Carrier Safety Administration. Safety Measurement System Factsheet. Available Online:
http://csa.fmcsa.dot.gov/Documents/SMS_factsheet.pdf
Compliance, Safety and Accountability: Truck Driver Perspectives 5 August 2011
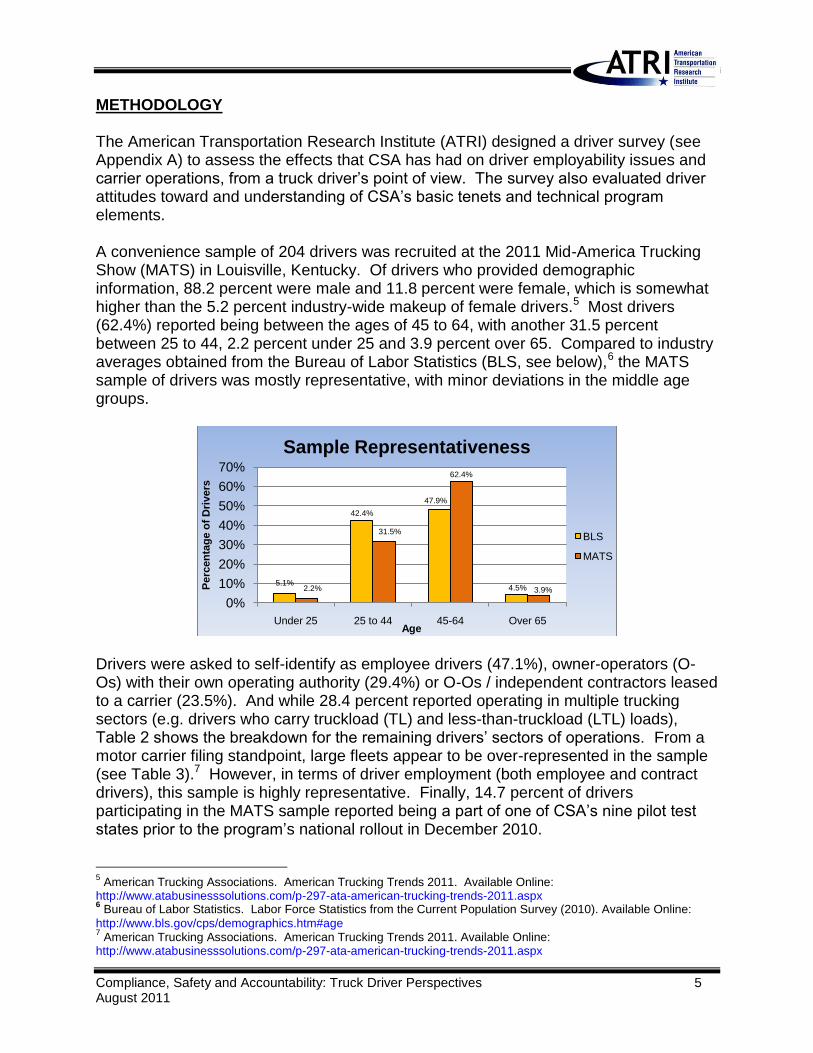
METHODOLOGY The American Transportation Research Institute (ATRI) designed a driver survey (see Appendix A) to assess the effects that CSA has had on driver employability issues and carrier operations, from a truck driver’s point of view. The survey also evaluated driver attitudes toward and understanding of CSA’s basic tenets and technical program elements. A convenience sample of 204 drivers was recruited at the 2011 Mid-America Trucking Show (MATS) in Louisville, Kentucky. Of drivers who provided demographic information, 88.2 percent were male and 11.8 percent were female, which is somewhat higher than the 5.2 percent industry-wide makeup of female drivers.5 Most drivers (62.4%) reported being between the ages of 45 to 64, with another 31.5 percent between 25 to 44, 2.2 percent under 25 and 3.9 percent over 65. Compared to industry averages obtained from the Bureau of Labor Statistics (BLS, see below),6 the MATS sample of drivers was mostly representative, with minor deviations in the middle age groups.
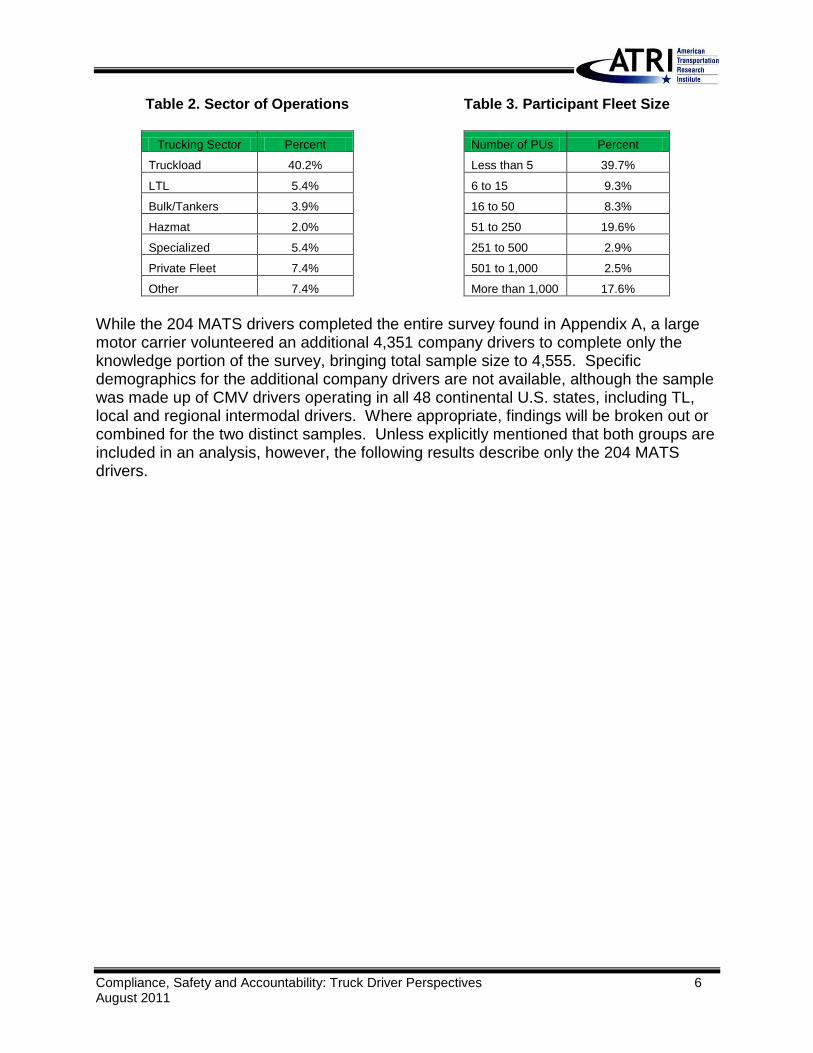
Drivers were asked to self-identify as employee drivers (47.1%), owner-operators (O-Os) with their own operating authority (29.4%) or O-Os / independent contractors leased to a carrier (23.5%). And while 28.4 percent reported operating in multiple trucking sectors (e.g. drivers who carry truckload (TL) and less-than-truckload (LTL) loads), Table 2 shows the breakdown for the remaining drivers’ sectors of operations. From a motor carrier filing standpoint, large fleets appear to be over-represented in the sample (see Table 3).7 However, in terms of driver employment (both employee and contract drivers), this sample is highly representative. Finally, 14.7 percent of drivers participating in the MATS sample reported being a part of one of CSA’s nine pilot test states prior to the program’s national rollout in December 2010.
5 American Trucking Associations. American Trucking Trends 2011. Available Online:
http://www.atabusinesssolutions.com/p-297-ata-american-trucking-trends-2011.aspx 6 Bureau of Labor Statistics. Labor Force Statistics from the Current Population Survey (2010). Available Online:
http://www.bls.gov/cps/demographics.htm#age 7 American Trucking Associations. American Trucking Trends 2011. Available Online:
http://www.atabusinesssolutions.com/p-297-ata-american-trucking-trends-2011.aspx
5.1%
42.4%
47.9%
4.5%2.2%
31.5%
62.4%
3.9%
0%
10%
20%
30%
40%
50%
60%
70%
Under 25 25 to 44 45-64 Over 65
Perc
en
tag
e o
f D
rivers
Age
Sample Representativeness
BLS
MATS
Compliance, Safety and Accountability: Truck Driver Perspectives 6 August 2011
Table 2. Sector of Operations
Trucking Sector Percent
Truckload 40.2%
LTL 5.4%
Bulk/Tankers 3.9%
Hazmat 2.0%
Specialized 5.4%
Private Fleet 7.4%
Other 7.4%
Table 3. Participant Fleet Size
Number of PUs Percent
Less than 5 39.7%
6 to 15 9.3%
16 to 50 8.3%
51 to 250 19.6%
251 to 500 2.9%
501 to 1,000 2.5%
More than 1,000 17.6%
While the 204 MATS drivers completed the entire survey found in Appendix A, a large motor carrier volunteered an additional 4,351 company drivers to complete only the knowledge portion of the survey, bringing total sample size to 4,555. Specific demographics for the additional company drivers are not available, although the sample was made up of CMV drivers operating in all 48 continental U.S. states, including TL, local and regional intermodal drivers. Where appropriate, findings will be broken out or combined for the two distinct samples. Unless explicitly mentioned that both groups are included in an analysis, however, the following results describe only the 204 MATS drivers.
Compliance, Safety and Accountability: Truck Driver Perspectives 7 August 2011
FINDINGS
Driver Employment Impacts
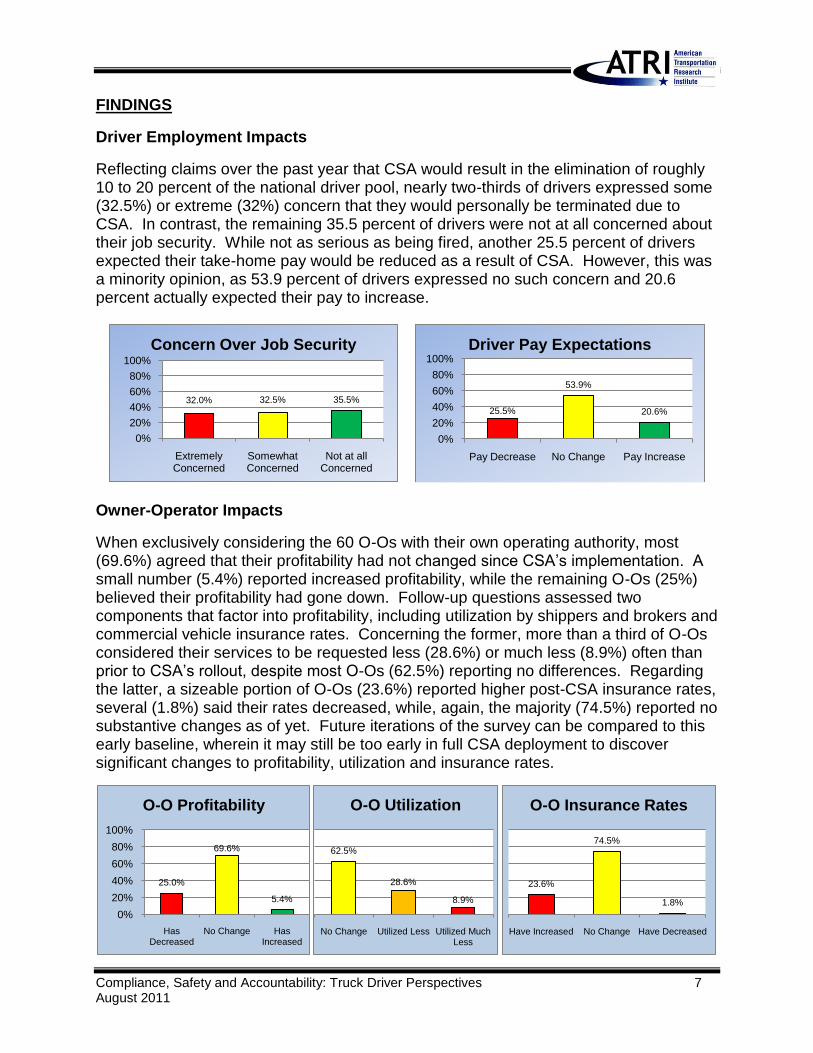
Reflecting claims over the past year that CSA would result in the elimination of roughly 10 to 20 percent of the national driver pool, nearly two-thirds of drivers expressed some (32.5%) or extreme (32%) concern that they would personally be terminated due to CSA. In contrast, the remaining 35.5 percent of drivers were not at all concerned about their job security. While not as serious as being fired, another 25.5 percent of drivers expected their take-home pay would be reduced as a result of CSA. However, this was a minority opinion, as 53.9 percent of drivers expressed no such concern and 20.6 percent actually expected their pay to increase.
Owner-Operator Impacts
When exclusively considering the 60 O-Os with their own operating authority, most (69.6%) agreed that their profitability had not changed since CSA’s implementation. A small number (5.4%) reported increased profitability, while the remaining O-Os (25%) believed their profitability had gone down. Follow-up questions assessed two components that factor into profitability, including utilization by shippers and brokers and commercial vehicle insurance rates. Concerning the former, more than a third of O-Os considered their services to be requested less (28.6%) or much less (8.9%) often than prior to CSA’s rollout, despite most O-Os (62.5%) reporting no differences. Regarding the latter, a sizeable portion of O-Os (23.6%) reported higher post-CSA insurance rates, several (1.8%) said their rates decreased, while, again, the majority (74.5%) reported no substantive changes as of yet. Future iterations of the survey can be compared to this early baseline, wherein it may still be too early in full CSA deployment to discover significant changes to profitability, utilization and insurance rates.
32.0% 32.5% 35.5%
0%
20%
40%
60%
80%
100%
Extremely Concerned
Somewhat Concerned
Not at all Concerned
Concern Over Job Security
25.5%
53.9%
20.6%
0%
20%
40%
60%
80%
100%
Pay Decrease No Change Pay Increase
Driver Pay Expectations
25.0%
69.6%
5.4%
0%
20%
40%
60%
80%
100%
Has Decreased
No Change Has Increased
O-O Profitability
62.5%
28.6%
8.9%
No Change Utilized Less Utilized Much Less
O-O Utilization
23.6%
74.5%
1.8%
Have Increased No Change Have Decreased
O-O Insurance Rates
Compliance, Safety and Accountability: Truck Driver Perspectives 8 August 2011
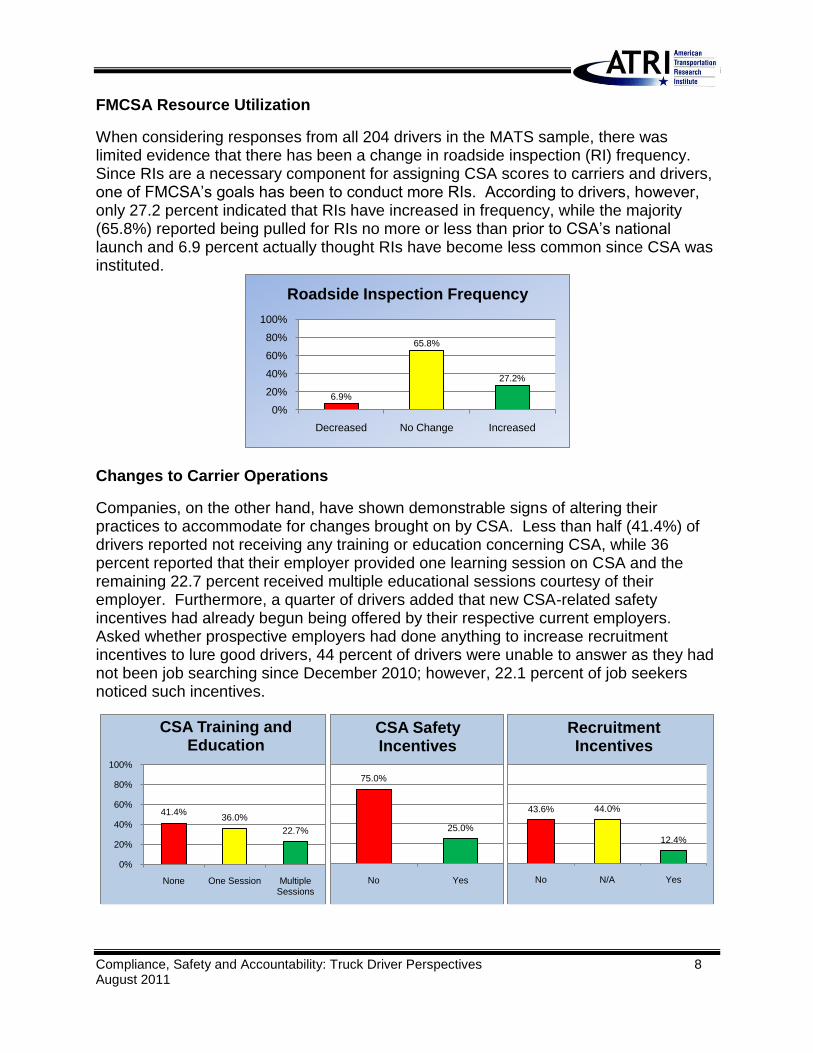
FMCSA Resource Utilization
When considering responses from all 204 drivers in the MATS sample, there was limited evidence that there has been a change in roadside inspection (RI) frequency. Since RIs are a necessary component for assigning CSA scores to carriers and drivers, one of FMCSA’s goals has been to conduct more RIs. According to drivers, however, only 27.2 percent indicated that RIs have increased in frequency, while the majority (65.8%) reported being pulled for RIs no more or less than prior to CSA’s national launch and 6.9 percent actually thought RIs have become less common since CSA was instituted.
Changes to Carrier Operations
Companies, on the other hand, have shown demonstrable signs of altering their practices to accommodate for changes brought on by CSA. Less than half (41.4%) of drivers reported not receiving any training or education concerning CSA, while 36 percent reported that their employer provided one learning session on CSA and the remaining 22.7 percent received multiple educational sessions courtesy of their employer. Furthermore, a quarter of drivers added that new CSA-related safety incentives had already begun being offered by their respective current employers. Asked whether prospective employers had done anything to increase recruitment incentives to lure good drivers, 44 percent of drivers were unable to answer as they had not been job searching since December 2010; however, 22.1 percent of job seekers noticed such incentives.
6.9%
65.8%
27.2%
0%
20%
40%
60%
80%
100%
Decreased No Change Increased
Roadside Inspection Frequency
41.4%36.0%
22.7%
0%
20%
40%
60%
80%
100%
None One Session Multiple Sessions
CSA Training and Education
75.0%
25.0%
No Yes
CSA Safety Incentives
43.6% 44.0%
12.4%
No N/A Yes
Recruitment Incentives
Compliance, Safety and Accountability: Truck Driver Perspectives 9 August 2011
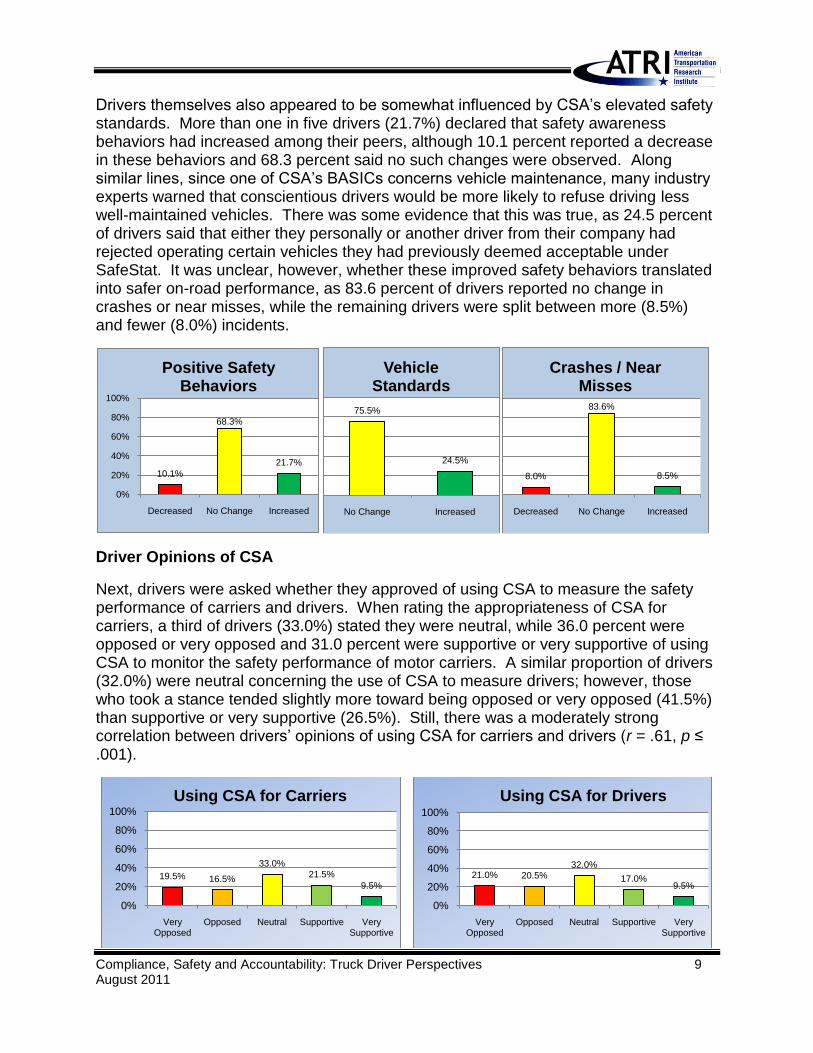
Drivers themselves also appeared to be somewhat influenced by CSA’s elevated safety standards. More than one in five drivers (21.7%) declared that safety awareness behaviors had increased among their peers, although 10.1 percent reported a decrease in these behaviors and 68.3 percent said no such changes were observed. Along similar lines, since one of CSA’s BASICs concerns vehicle maintenance, many industry experts warned that conscientious drivers would be more likely to refuse driving less well-maintained vehicles. There was some evidence that this was true, as 24.5 percent of drivers said that either they personally or another driver from their company had rejected operating certain vehicles they had previously deemed acceptable under SafeStat. It was unclear, however, whether these improved safety behaviors translated into safer on-road performance, as 83.6 percent of drivers reported no change in crashes or near misses, while the remaining drivers were split between more (8.5%) and fewer (8.0%) incidents.
Driver Opinions of CSA
Next, drivers were asked whether they approved of using CSA to measure the safety performance of carriers and drivers. When rating the appropriateness of CSA for carriers, a third of drivers (33.0%) stated they were neutral, while 36.0 percent were opposed or very opposed and 31.0 percent were supportive or very supportive of using CSA to monitor the safety performance of motor carriers. A similar proportion of drivers (32.0%) were neutral concerning the use of CSA to measure drivers; however, those who took a stance tended slightly more toward being opposed or very opposed (41.5%) than supportive or very supportive (26.5%). Still, there was a moderately strong correlation between drivers’ opinions of using CSA for carriers and drivers (r = .61, p ≤ .001).
10.1%
68.3%
21.7%
0%
20%
40%
60%
80%
100%
Decreased No Change Increased
Positive Safety Behaviors
75.5%
24.5%
No Change Increased
Vehicle Standards
8.0%
83.6%
8.5%
Decreased No Change Increased
Crashes / Near Misses
19.5% 16.5%
33.0%21.5%
9.5%
0%
20%
40%
60%
80%
100%
Very Opposed
Opposed Neutral Supportive Very Supportive
Using CSA for Carriers
21.0% 20.5%32.0%
17.0%9.5%
0%
20%
40%
60%
80%
100%
Very Opposed
Opposed Neutral Supportive Very Supportive
Using CSA for Drivers
Compliance, Safety and Accountability: Truck Driver Perspectives 10 August 2011
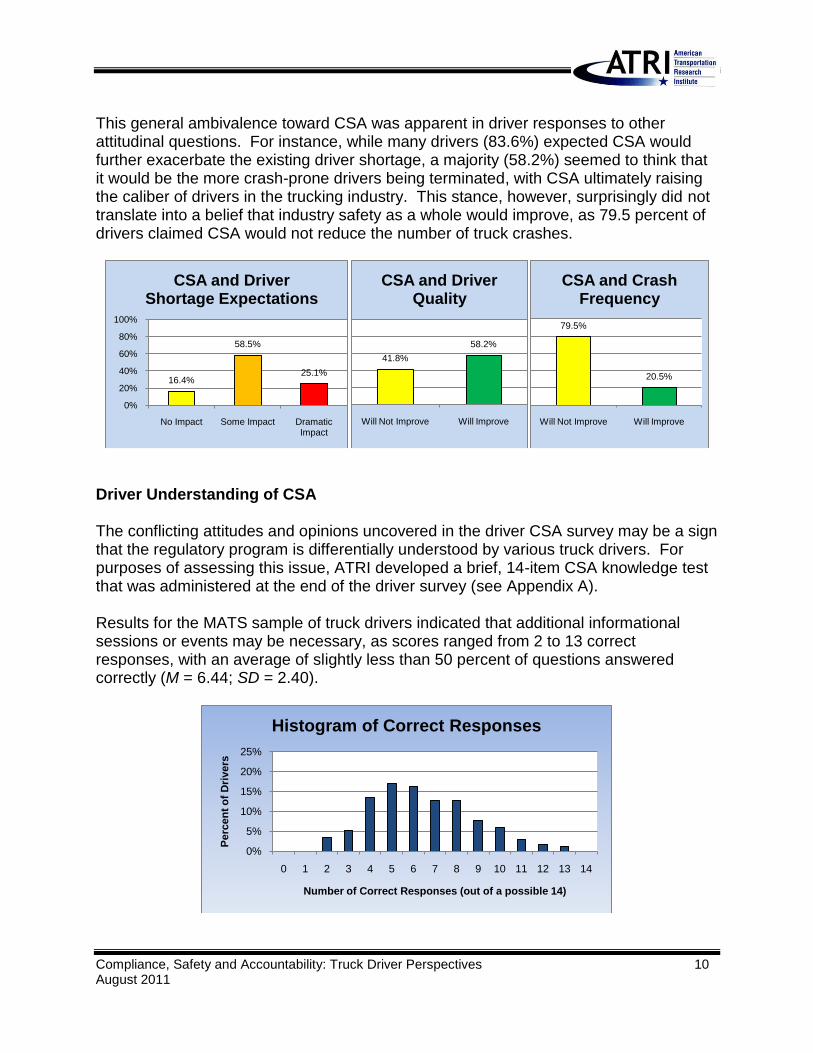
This general ambivalence toward CSA was apparent in driver responses to other attitudinal questions. For instance, while many drivers (83.6%) expected CSA would further exacerbate the existing driver shortage, a majority (58.2%) seemed to think that it would be the more crash-prone drivers being terminated, with CSA ultimately raising the caliber of drivers in the trucking industry. This stance, however, surprisingly did not translate into a belief that industry safety as a whole would improve, as 79.5 percent of drivers claimed CSA would not reduce the number of truck crashes.
Driver Understanding of CSA The conflicting attitudes and opinions uncovered in the driver CSA survey may be a sign that the regulatory program is differentially understood by various truck drivers. For purposes of assessing this issue, ATRI developed a brief, 14-item CSA knowledge test that was administered at the end of the driver survey (see Appendix A). Results for the MATS sample of truck drivers indicated that additional informational sessions or events may be necessary, as scores ranged from 2 to 13 correct responses, with an average of slightly less than 50 percent of questions answered correctly (M = 6.44; SD = 2.40).
16.4%
58.5%
25.1%
0%
20%
40%
60%
80%
100%
No Impact Some Impact Dramatic Impact
CSA and Driver Shortage Expectations
41.8%
58.2%
Will Not Improve Will Improve
CSA and Driver Quality
79.5%
20.5%
Will Not Improve Will Improve
CSA and Crash Frequency
0%
5%
10%
15%
20%
25%
0 1 2 3 4 5 6 7 8 9 10 11 12 13 14
Perc
en
t o
f D
rivers
Number of Correct Responses (out of a possible 14)
Histogram of Correct Responses
Compliance, Safety and Accountability: Truck Driver Perspectives 11 August 2011
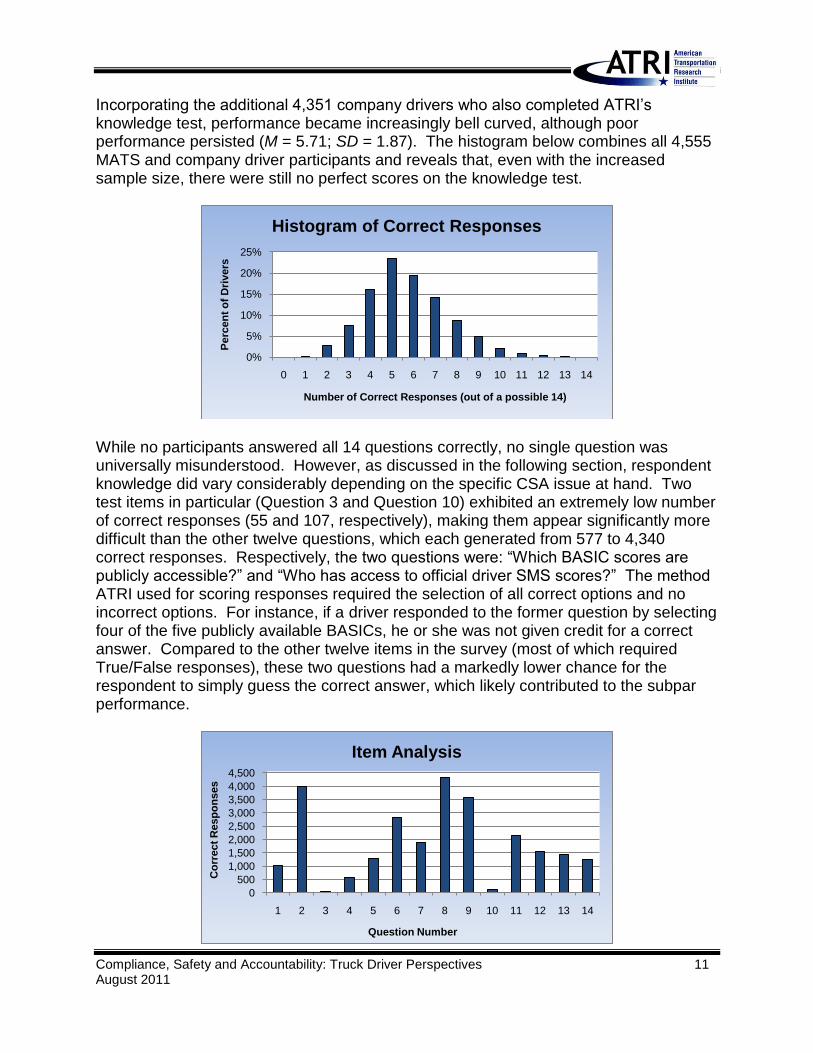
Incorporating the additional 4,351 company drivers who also completed ATRI’s knowledge test, performance became increasingly bell curved, although poor performance persisted (M = 5.71; SD = 1.87). The histogram below combines all 4,555 MATS and company driver participants and reveals that, even with the increased sample size, there were still no perfect scores on the knowledge test.
While no participants answered all 14 questions correctly, no single question was universally misunderstood. However, as discussed in the following section, respondent knowledge did vary considerably depending on the specific CSA issue at hand. Two test items in particular (Question 3 and Question 10) exhibited an extremely low number of correct responses (55 and 107, respectively), making them appear significantly more difficult than the other twelve questions, which each generated from 577 to 4,340 correct responses. Respectively, the two questions were: ―Which BASIC scores are publicly accessible?‖ and ―Who has access to official driver SMS scores?‖ The method ATRI used for scoring responses required the selection of all correct options and no incorrect options. For instance, if a driver responded to the former question by selecting four of the five publicly available BASICs, he or she was not given credit for a correct answer. Compared to the other twelve items in the survey (most of which required True/False responses), these two questions had a markedly lower chance for the respondent to simply guess the correct answer, which likely contributed to the subpar performance.
0%
5%
10%
15%
20%
25%
0 1 2 3 4 5 6 7 8 9 10 11 12 13 14
Perc
en
t o
f D
rivers
Number of Correct Responses (out of a possible 14)
Histogram of Correct Responses
0
500
1,000
1,500
2,000
2,500
3,000
3,500
4,000
4,500
1 2 3 4 5 6 7 8 9 10 11 12 13 14
Co
rrect
Resp
on
ses
Question Number
Item Analysis
Compliance, Safety and Accountability: Truck Driver Perspectives 12 August 2011
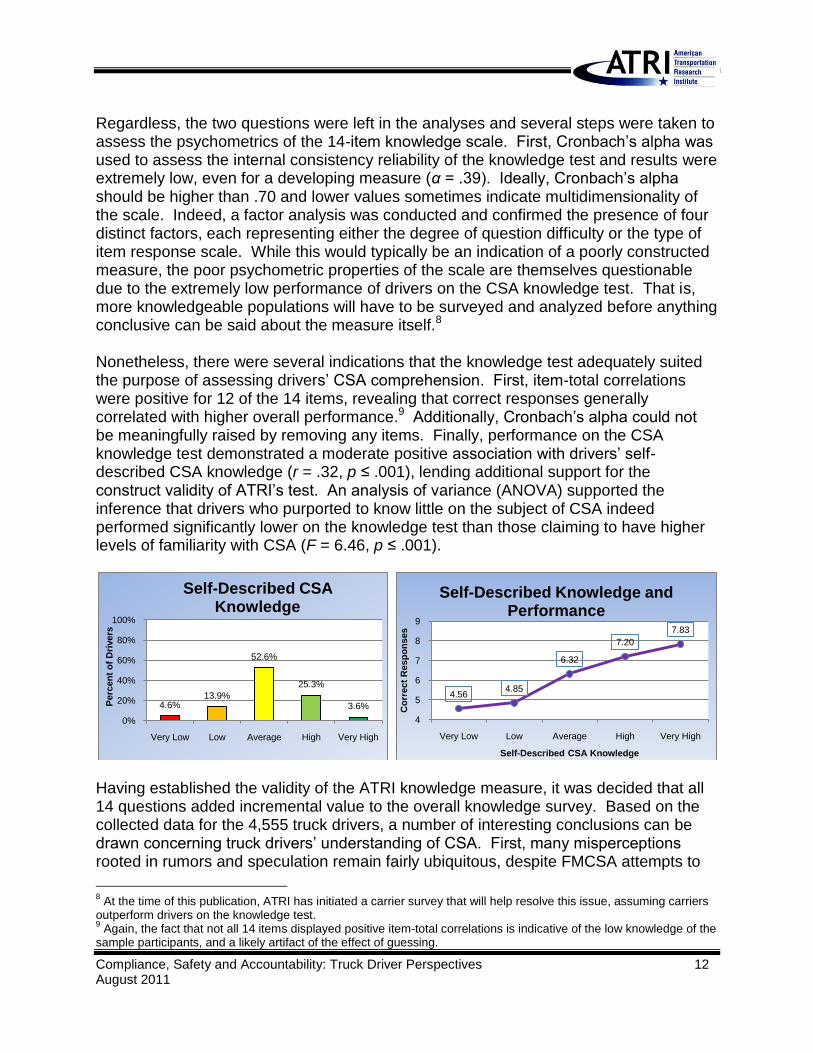
Regardless, the two questions were left in the analyses and several steps were taken to assess the psychometrics of the 14-item knowledge scale. First, Cronbach’s alpha was used to assess the internal consistency reliability of the knowledge test and results were extremely low, even for a developing measure (α = .39). Ideally, Cronbach’s alpha should be higher than .70 and lower values sometimes indicate multidimensionality of the scale. Indeed, a factor analysis was conducted and confirmed the presence of four distinct factors, each representing either the degree of question difficulty or the type of item response scale. While this would typically be an indication of a poorly constructed measure, the poor psychometric properties of the scale are themselves questionable due to the extremely low performance of drivers on the CSA knowledge test. That is, more knowledgeable populations will have to be surveyed and analyzed before anything conclusive can be said about the measure itself.8 Nonetheless, there were several indications that the knowledge test adequately suited the purpose of assessing drivers’ CSA comprehension. First, item-total correlations were positive for 12 of the 14 items, revealing that correct responses generally correlated with higher overall performance.9 Additionally, Cronbach’s alpha could not be meaningfully raised by removing any items. Finally, performance on the CSA knowledge test demonstrated a moderate positive association with drivers’ self-described CSA knowledge (r = .32, p ≤ .001), lending additional support for the construct validity of ATRI’s test. An analysis of variance (ANOVA) supported the inference that drivers who purported to know little on the subject of CSA indeed performed significantly lower on the knowledge test than those claiming to have higher levels of familiarity with CSA (F = 6.46, p ≤ .001).
Having established the validity of the ATRI knowledge measure, it was decided that all 14 questions added incremental value to the overall knowledge survey. Based on the collected data for the 4,555 truck drivers, a number of interesting conclusions can be drawn concerning truck drivers’ understanding of CSA. First, many misperceptions rooted in rumors and speculation remain fairly ubiquitous, despite FMCSA attempts to
8 At the time of this publication, ATRI has initiated a carrier survey that will help resolve this issue, assuming carriers
outperform drivers on the knowledge test. 9 Again, the fact that not all 14 items displayed positive item-total correlations is indicative of the low knowledge of the
sample participants, and a likely artifact of the effect of guessing.
4.6%13.9%
52.6%
25.3%
3.6%
0%
20%
40%
60%
80%
100%
Very Low Low Average High Very High
Perc
en
t o
f D
rivers
Self-Described CSA Knowledge
4.564.85
6.32
7.20
7.83
4
5
6
7
8
9
Very Low Low Average High Very High
Co
rrect
Resp
on
ses
Self-Described CSA Knowledge
Self-Described Knowledge and Performance
Compliance, Safety and Accountability: Truck Driver Perspectives 13 August 2011
correct these falsehoods via their website and outreach efforts. Second, the truck driver community has relatively strong comprehension of several critical aspects of CSA. Finally, the technical details of CSA, which are likely more pertinent to the daily operations of motor carrier management personnel, were (expectedly) rather poorly understood among the driver population.
Compliance, Safety and Accountability: Truck Driver Perspectives 14 August 2011
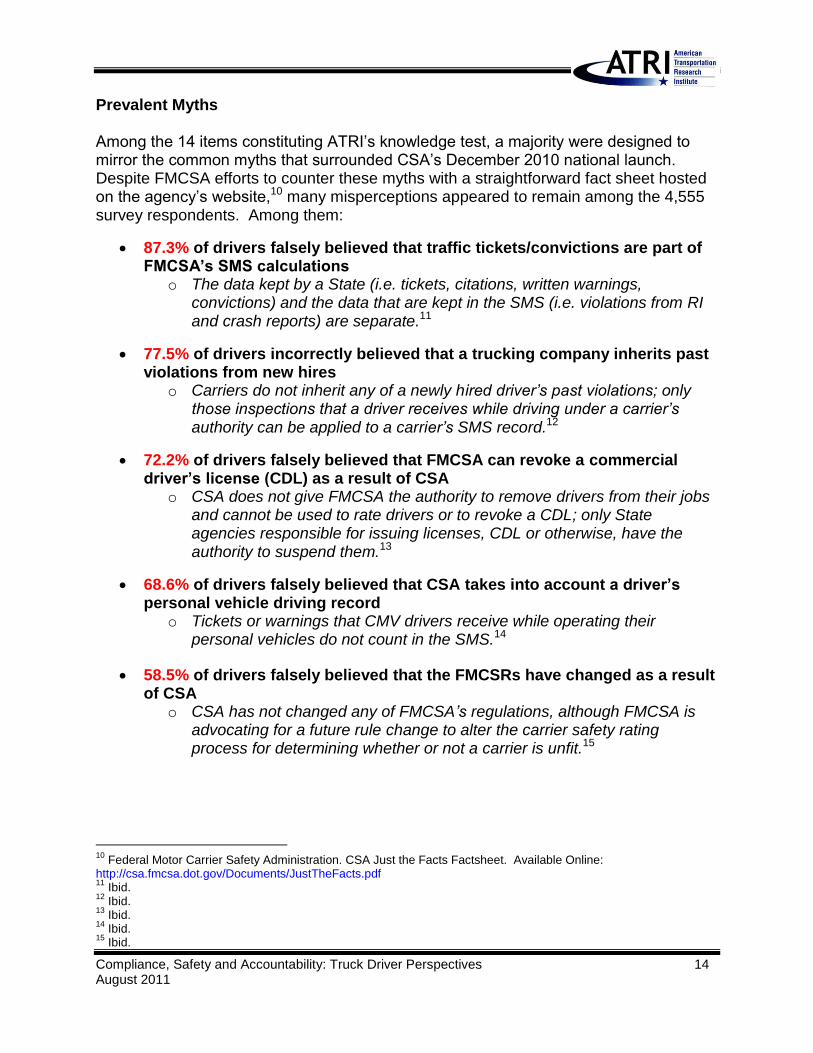
Prevalent Myths Among the 14 items constituting ATRI’s knowledge test, a majority were designed to mirror the common myths that surrounded CSA’s December 2010 national launch. Despite FMCSA efforts to counter these myths with a straightforward fact sheet hosted on the agency’s website,10 many misperceptions appeared to remain among the 4,555 survey respondents. Among them:
87.3% of drivers falsely believed that traffic tickets/convictions are part of FMCSA’s SMS calculations
o The data kept by a State (i.e. tickets, citations, written warnings, convictions) and the data that are kept in the SMS (i.e. violations from RI and crash reports) are separate.11
77.5% of drivers incorrectly believed that a trucking company inherits past violations from new hires
o Carriers do not inherit any of a newly hired driver’s past violations; only those inspections that a driver receives while driving under a carrier’s authority can be applied to a carrier’s SMS record.12
72.2% of drivers falsely believed that FMCSA can revoke a commercial driver’s license (CDL) as a result of CSA
o CSA does not give FMCSA the authority to remove drivers from their jobs and cannot be used to rate drivers or to revoke a CDL; only State agencies responsible for issuing licenses, CDL or otherwise, have the authority to suspend them.13
68.6% of drivers falsely believed that CSA takes into account a driver’s personal vehicle driving record
o Tickets or warnings that CMV drivers receive while operating their personal vehicles do not count in the SMS.14
58.5% of drivers falsely believed that the FMCSRs have changed as a result of CSA
o CSA has not changed any of FMCSA’s regulations, although FMCSA is advocating for a future rule change to alter the carrier safety rating process for determining whether or not a carrier is unfit.15
10
Federal Motor Carrier Safety Administration. CSA Just the Facts Factsheet. Available Online: http://csa.fmcsa.dot.gov/Documents/JustTheFacts.pdf 11
Ibid. 12
Ibid. 13
Ibid. 14
Ibid. 15
Ibid.
Compliance, Safety and Accountability: Truck Driver Perspectives 15 August 2011
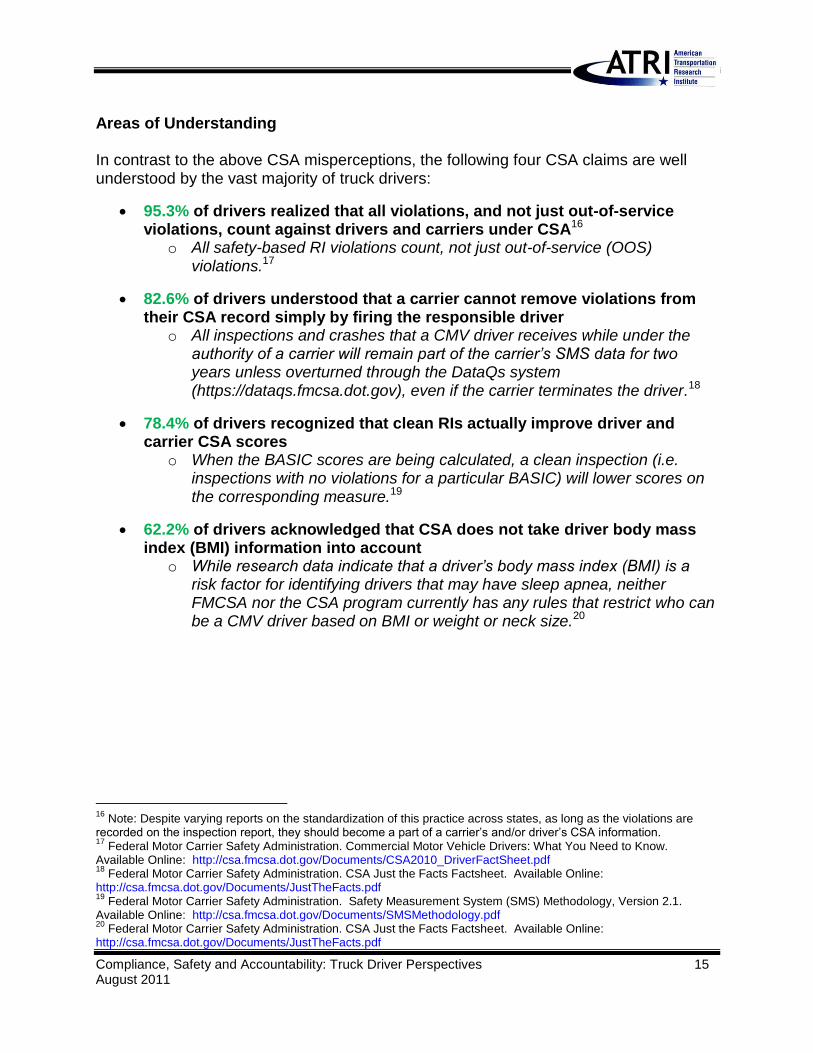
Areas of Understanding In contrast to the above CSA misperceptions, the following four CSA claims are well understood by the vast majority of truck drivers:
95.3% of drivers realized that all violations, and not just out-of-service violations, count against drivers and carriers under CSA16
o All safety-based RI violations count, not just out-of-service (OOS) violations.17
82.6% of drivers understood that a carrier cannot remove violations from their CSA record simply by firing the responsible driver
o All inspections and crashes that a CMV driver receives while under the authority of a carrier will remain part of the carrier’s SMS data for two years unless overturned through the DataQs system (https://dataqs.fmcsa.dot.gov), even if the carrier terminates the driver.18
78.4% of drivers recognized that clean RIs actually improve driver and carrier CSA scores
o When the BASIC scores are being calculated, a clean inspection (i.e. inspections with no violations for a particular BASIC) will lower scores on the corresponding measure.19
62.2% of drivers acknowledged that CSA does not take driver body mass index (BMI) information into account
o While research data indicate that a driver’s body mass index (BMI) is a risk factor for identifying drivers that may have sleep apnea, neither FMCSA nor the CSA program currently has any rules that restrict who can be a CMV driver based on BMI or weight or neck size.20
16
Note: Despite varying reports on the standardization of this practice across states, as long as the violations are recorded on the inspection report, they should become a part of a carrier’s and/or driver’s CSA information. 17
Federal Motor Carrier Safety Administration. Commercial Motor Vehicle Drivers: What You Need to Know. Available Online: http://csa.fmcsa.dot.gov/Documents/CSA2010_DriverFactSheet.pdf 18
Federal Motor Carrier Safety Administration. CSA Just the Facts Factsheet. Available Online: http://csa.fmcsa.dot.gov/Documents/JustTheFacts.pdf 19
Federal Motor Carrier Safety Administration. Safety Measurement System (SMS) Methodology, Version 2.1. Available Online: http://csa.fmcsa.dot.gov/Documents/SMSMethodology.pdf 20
Federal Motor Carrier Safety Administration. CSA Just the Facts Factsheet. Available Online: http://csa.fmcsa.dot.gov/Documents/JustTheFacts.pdf
Compliance, Safety and Accountability: Truck Driver Perspectives 16 August 2011
Scoring and Technical Confusion
In addition to testing popular misconceptions, ATRI also designed questionnaire items aimed at evaluating knowledge of the technical details of CSA. Since many of these issues are more relevant for carriers than drivers, it is not surprising that certain items were poorly understood. Among them:
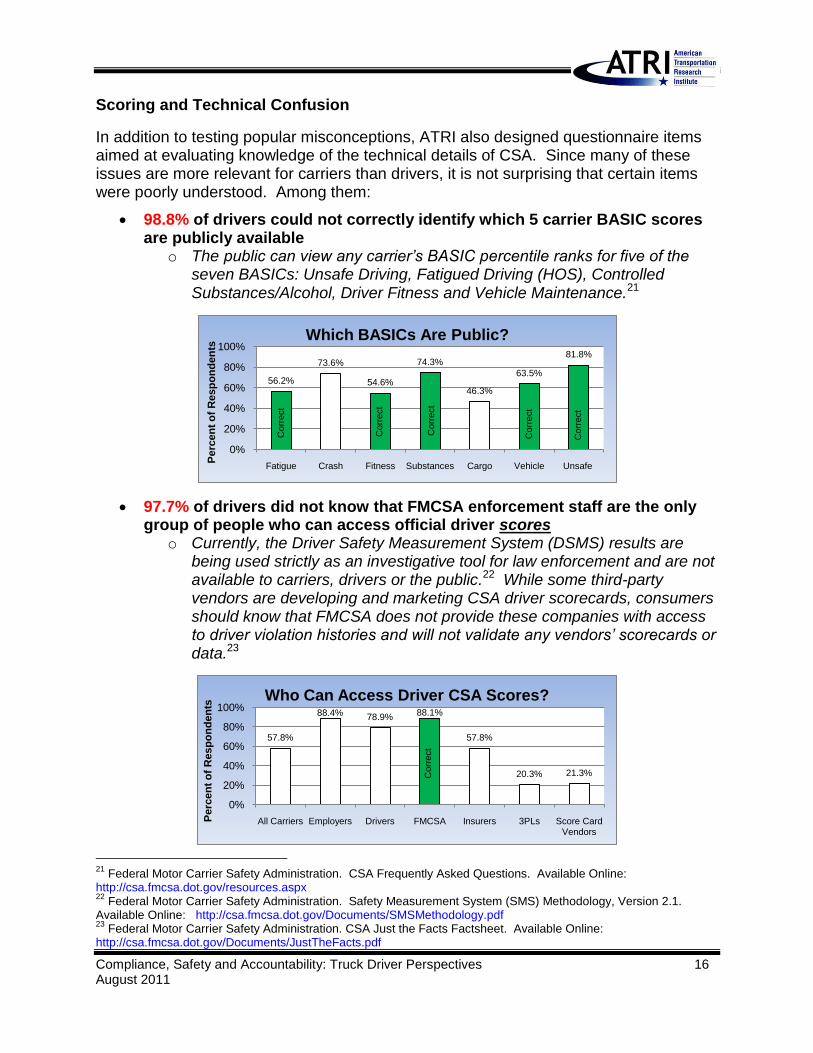
98.8% of drivers could not correctly identify which 5 carrier BASIC scores are publicly available
o The public can view any carrier’s BASIC percentile ranks for five of the seven BASICs: Unsafe Driving, Fatigued Driving (HOS), Controlled Substances/Alcohol, Driver Fitness and Vehicle Maintenance.21
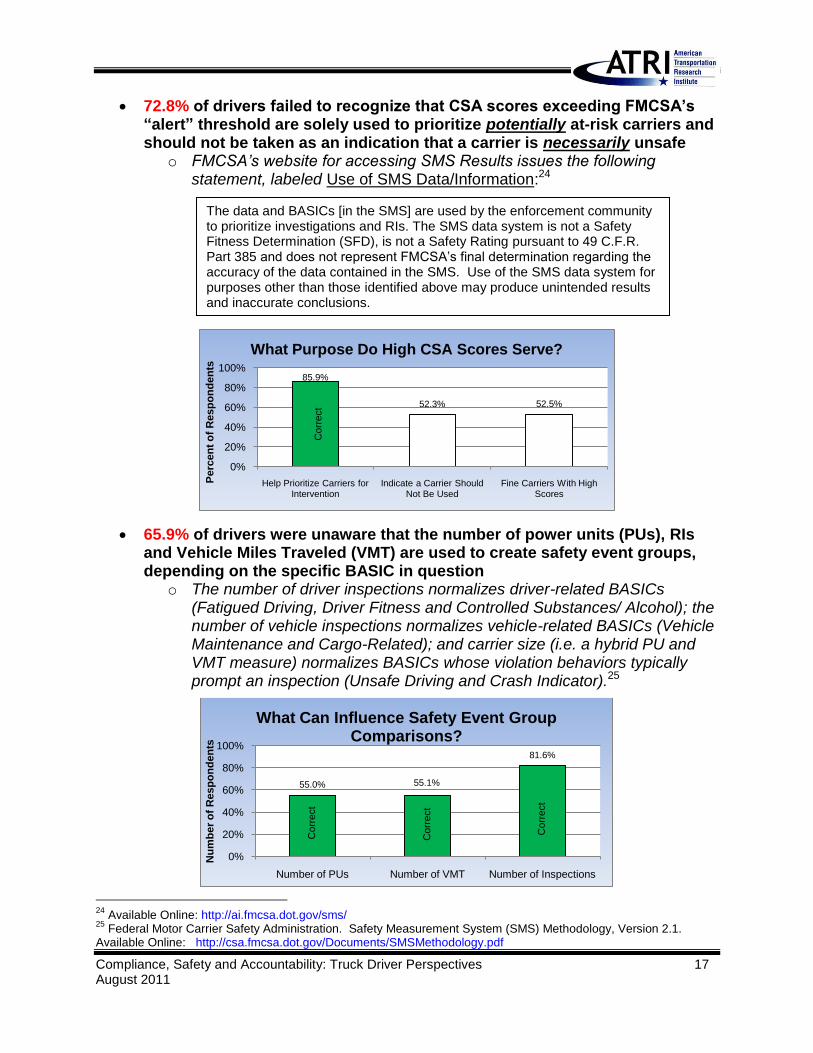
97.7% of drivers did not know that FMCSA enforcement staff are the only group of people who can access official driver scores
o Currently, the Driver Safety Measurement System (DSMS) results are being used strictly as an investigative tool for law enforcement and are not available to carriers, drivers or the public.22 While some third-party vendors are developing and marketing CSA driver scorecards, consumers should know that FMCSA does not provide these companies with access to driver violation histories and will not validate any vendors’ scorecards or data.23
21
Federal Motor Carrier Safety Administration. CSA Frequently Asked Questions. Available Online: http://csa.fmcsa.dot.gov/resources.aspx 22
Federal Motor Carrier Safety Administration. Safety Measurement System (SMS) Methodology, Version 2.1. Available Online: http://csa.fmcsa.dot.gov/Documents/SMSMethodology.pdf 23
Federal Motor Carrier Safety Administration. CSA Just the Facts Factsheet. Available Online: http://csa.fmcsa.dot.gov/Documents/JustTheFacts.pdf
56.2%
73.6%
54.6%
74.3%
46.3%
63.5%
81.8%
0%
20%
40%
60%
80%
100%
Fatigue Crash Fitness Substances Cargo Vehicle Unsafe
Perc
en
t o
f R
esp
on
den
ts
Which BASICs Are Public?
Corr
ect
Corr
ect
Corr
ect
Corr
ect
Corr
ect
57.8%
88.4% 78.9%88.1%
57.8%
20.3% 21.3%
0%
20%
40%
60%
80%
100%
All Carriers Employers Drivers FMCSA Insurers 3PLs Score Card Vendors
Perc
en
t o
f R
esp
on
den
ts
Who Can Access Driver CSA Scores?
Corr
ect
Compliance, Safety and Accountability: Truck Driver Perspectives 17 August 2011
72.8% of drivers failed to recognize that CSA scores exceeding FMCSA’s “alert” threshold are solely used to prioritize potentially at-risk carriers and should not be taken as an indication that a carrier is necessarily unsafe
o FMCSA’s website for accessing SMS Results issues the following statement, labeled Use of SMS Data/Information:24
65.9% of drivers were unaware that the number of power units (PUs), RIs and Vehicle Miles Traveled (VMT) are used to create safety event groups, depending on the specific BASIC in question
o The number of driver inspections normalizes driver-related BASICs (Fatigued Driving, Driver Fitness and Controlled Substances/ Alcohol); the number of vehicle inspections normalizes vehicle-related BASICs (Vehicle Maintenance and Cargo-Related); and carrier size (i.e. a hybrid PU and VMT measure) normalizes BASICs whose violation behaviors typically prompt an inspection (Unsafe Driving and Crash Indicator).25
24
Available Online: http://ai.fmcsa.dot.gov/sms/ 25
Federal Motor Carrier Safety Administration. Safety Measurement System (SMS) Methodology, Version 2.1. Available Online: http://csa.fmcsa.dot.gov/Documents/SMSMethodology.pdf
85.9%
52.3% 52.5%
0%
20%
40%
60%
80%
100%
Help Prioritize Carriers for Intervention
Indicate a Carrier Should Not Be Used
Fine Carriers With High Scores
Perc
en
t o
f R
esp
on
den
ts
What Purpose Do High CSA Scores Serve?
Co
rre
ct
55.0% 55.1%
81.6%
0%
20%
40%
60%
80%
100%
Number of PUs Number of VMT Number of Inspections
Nu
mb
er
of
Resp
on
den
ts
What Can Influence Safety Event Group Comparisons?
Co
rre
ct
Co
rre
ct
Co
rre
ct
The data and BASICs [in the SMS] are used by the enforcement community to prioritize investigations and RIs. The SMS data system is not a Safety Fitness Determination (SFD), is not a Safety Rating pursuant to 49 C.F.R. Part 385 and does not represent FMCSA’s final determination regarding the accuracy of the data contained in the SMS. Use of the SMS data system for purposes other than those identified above may produce unintended results and inaccurate conclusions.
Compliance, Safety and Accountability: Truck Driver Perspectives 18 August 2011
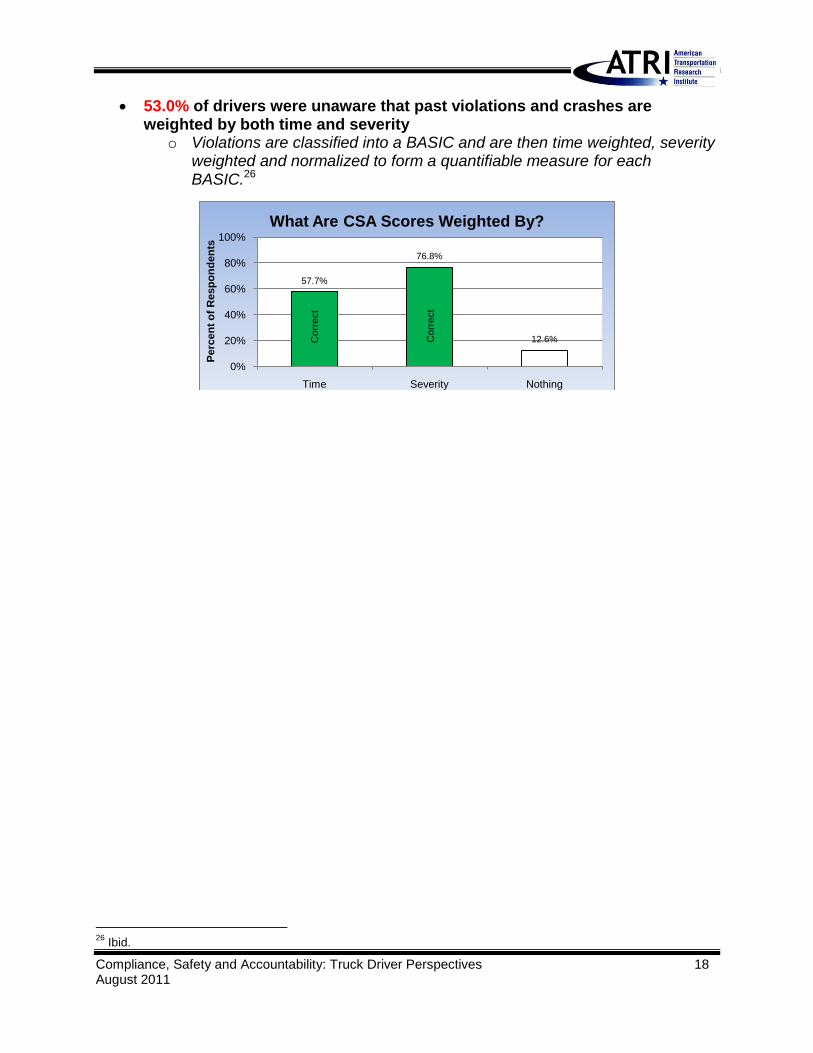
53.0% of drivers were unaware that past violations and crashes are weighted by both time and severity
o Violations are classified into a BASIC and are then time weighted, severity weighted and normalized to form a quantifiable measure for each BASIC.26
26
Ibid.
57.7%
76.8%
12.6%
0%
20%
40%
60%
80%
100%
Time Severity Nothing
Perc
en
t o
f R
esp
on
den
ts
What Are CSA Scores Weighted By?
Co
rre
ct
Co
rre
ct
Compliance, Safety and Accountability: Truck Driver Perspectives 19 August 2011
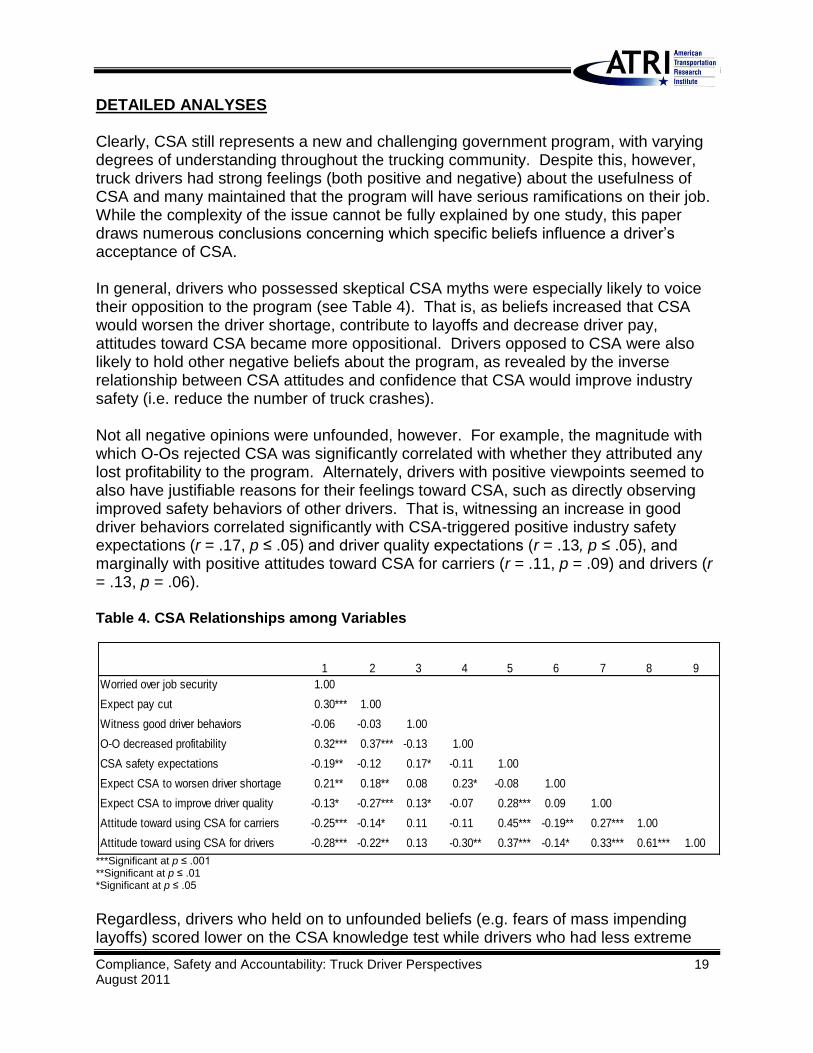
DETAILED ANALYSES Clearly, CSA still represents a new and challenging government program, with varying degrees of understanding throughout the trucking community. Despite this, however, truck drivers had strong feelings (both positive and negative) about the usefulness of CSA and many maintained that the program will have serious ramifications on their job. While the complexity of the issue cannot be fully explained by one study, this paper draws numerous conclusions concerning which specific beliefs influence a driver’s acceptance of CSA. In general, drivers who possessed skeptical CSA myths were especially likely to voice their opposition to the program (see Table 4). That is, as beliefs increased that CSA would worsen the driver shortage, contribute to layoffs and decrease driver pay, attitudes toward CSA became more oppositional. Drivers opposed to CSA were also likely to hold other negative beliefs about the program, as revealed by the inverse relationship between CSA attitudes and confidence that CSA would improve industry safety (i.e. reduce the number of truck crashes). Not all negative opinions were unfounded, however. For example, the magnitude with which O-Os rejected CSA was significantly correlated with whether they attributed any lost profitability to the program. Alternately, drivers with positive viewpoints seemed to also have justifiable reasons for their feelings toward CSA, such as directly observing improved safety behaviors of other drivers. That is, witnessing an increase in good driver behaviors correlated significantly with CSA-triggered positive industry safety expectations (r = .17, p ≤ .05) and driver quality expectations (r = .13, p ≤ .05), and marginally with positive attitudes toward CSA for carriers (r = .11, p = .09) and drivers (r = .13, p = .06). Table 4. CSA Relationships among Variables
***Significant at p ≤ .001 **Significant at p ≤ .01 *Significant at p ≤ .05
Regardless, drivers who held on to unfounded beliefs (e.g. fears of mass impending layoffs) scored lower on the CSA knowledge test while drivers who had less extreme
1 2 3 4 5 6 7 8 9
Worried over job security 1.00***
Expect pay cut 0.30*** 1.00***
Witness good driver behaviors -0.06*** -0.03*** 1.00***
O-O decreased profitability 0.32*** 0.37*** -0.13*** 1.00***
CSA safety expectations -0.19*** -0.12*** 0.17*** -0.11*** 1.00***
Expect CSA to worsen driver shortage 0.21*** 0.18*** 0.08*** 0.23*** -0.08*** 1.00***
Expect CSA to improve driver quality -0.13*** -0.27*** 0.13*** -0.07*** 0.28*** 0.09*** 1.00***
Attitude toward using CSA for carriers -0.25*** -0.14*** 0.11*** -0.11*** 0.45*** -0.19*** 0.27*** 1.00***
Attitude toward using CSA for drivers -0.28*** -0.22*** 0.13*** -0.30*** 0.37*** -0.14*** 0.33*** 0.61*** 1.00***
Compliance, Safety and Accountability: Truck Driver Perspectives 20 August 2011
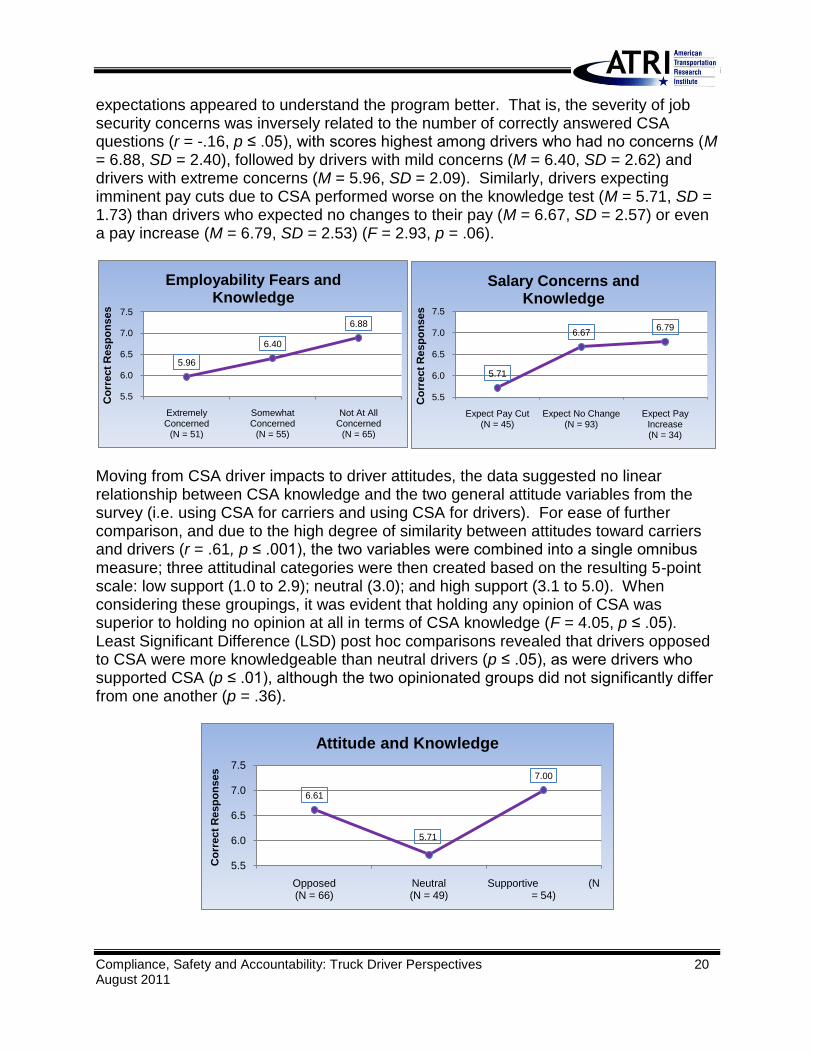
expectations appeared to understand the program better. That is, the severity of job security concerns was inversely related to the number of correctly answered CSA questions (r = -.16, p ≤ .05), with scores highest among drivers who had no concerns (M = 6.88, SD = 2.40), followed by drivers with mild concerns (M = 6.40, SD = 2.62) and drivers with extreme concerns (M = 5.96, SD = 2.09). Similarly, drivers expecting imminent pay cuts due to CSA performed worse on the knowledge test (M = 5.71, SD = 1.73) than drivers who expected no changes to their pay (M = 6.67, SD = 2.57) or even a pay increase (M = 6.79, SD = 2.53) (F = 2.93, p = .06).
Moving from CSA driver impacts to driver attitudes, the data suggested no linear relationship between CSA knowledge and the two general attitude variables from the survey (i.e. using CSA for carriers and using CSA for drivers). For ease of further comparison, and due to the high degree of similarity between attitudes toward carriers and drivers (r = .61, p ≤ .001), the two variables were combined into a single omnibus measure; three attitudinal categories were then created based on the resulting 5-point scale: low support (1.0 to 2.9); neutral (3.0); and high support (3.1 to 5.0). When considering these groupings, it was evident that holding any opinion of CSA was superior to holding no opinion at all in terms of CSA knowledge (F = 4.05, p ≤ .05). Least Significant Difference (LSD) post hoc comparisons revealed that drivers opposed to CSA were more knowledgeable than neutral drivers (p ≤ .05), as were drivers who supported CSA (p ≤ .01), although the two opinionated groups did not significantly differ from one another (p = .36).
5.96
6.40
6.88
5.5
6.0
6.5
7.0
7.5
Extremely Concerned
(N = 51)
Somewhat Concerned
(N = 55)
Not At All Concerned
(N = 65)
Co
rrect
Resp
on
ses
Employability Fears and Knowledge
5.71
6.676.79
5.5
6.0
6.5
7.0
7.5
Expect Pay Cut (N = 45)
Expect No Change (N = 93)
Expect Pay Increase (N = 34)
Co
rrect
Resp
on
ses
Salary Concerns and Knowledge
6.61
5.71
7.00
5.5
6.0
6.5
7.0
7.5
Opposed (N = 66)
Neutral (N = 49)
Supportive (N = 54)
Co
rrect
Resp
on
ses
Attitude and Knowledge
Compliance, Safety and Accountability: Truck Driver Perspectives 21 August 2011
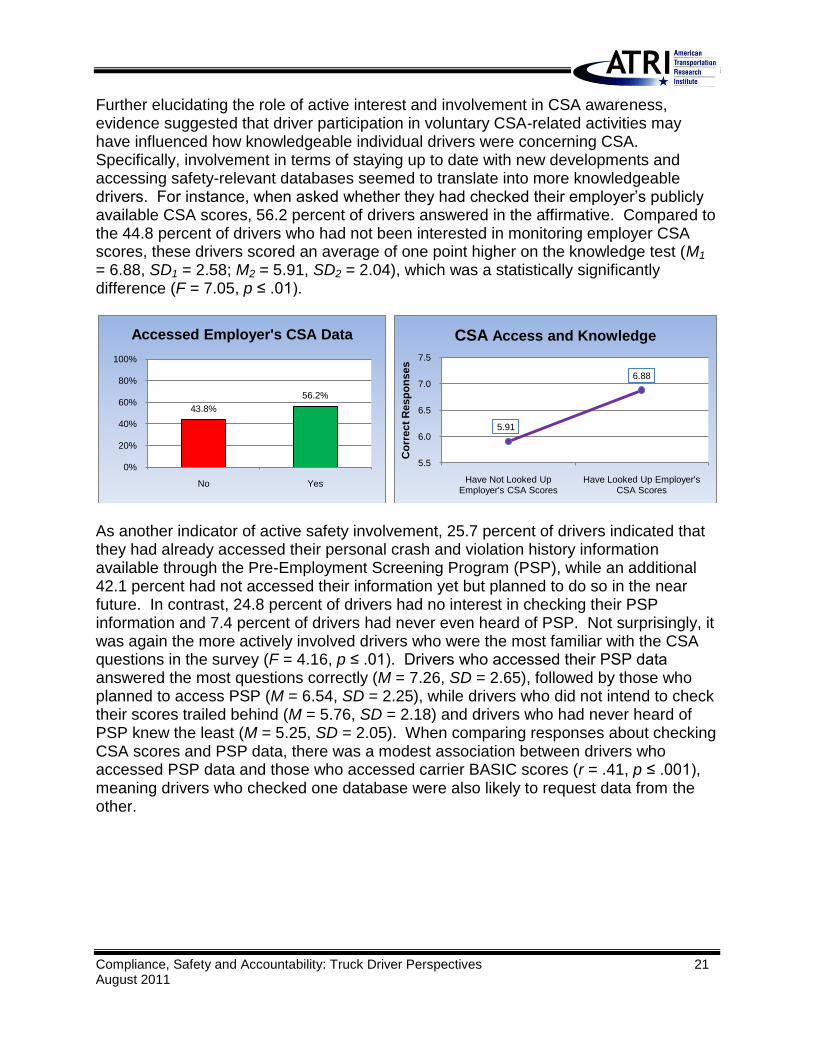
Further elucidating the role of active interest and involvement in CSA awareness, evidence suggested that driver participation in voluntary CSA-related activities may have influenced how knowledgeable individual drivers were concerning CSA. Specifically, involvement in terms of staying up to date with new developments and accessing safety-relevant databases seemed to translate into more knowledgeable drivers. For instance, when asked whether they had checked their employer’s publicly available CSA scores, 56.2 percent of drivers answered in the affirmative. Compared to the 44.8 percent of drivers who had not been interested in monitoring employer CSA scores, these drivers scored an average of one point higher on the knowledge test (M1 = 6.88, SD1 = 2.58; M2 = 5.91, SD2 = 2.04), which was a statistically significantly difference (F = 7.05, p ≤ .01).
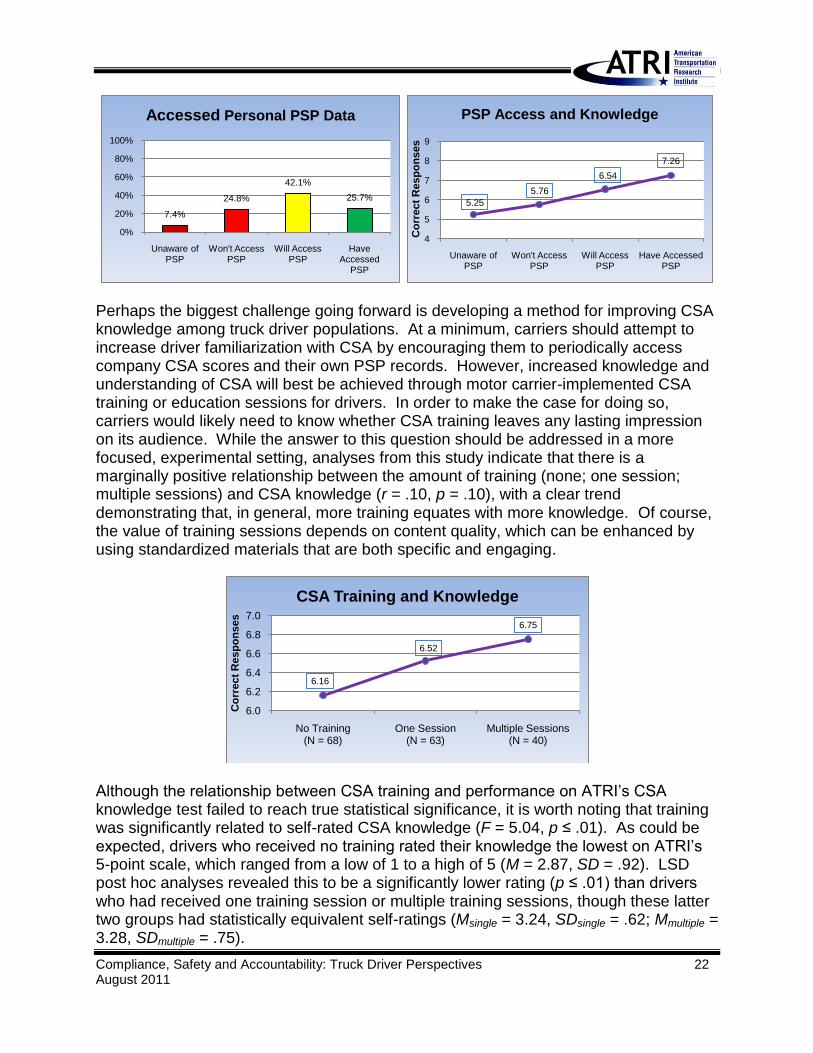
As another indicator of active safety involvement, 25.7 percent of drivers indicated that they had already accessed their personal crash and violation history information available through the Pre-Employment Screening Program (PSP), while an additional 42.1 percent had not accessed their information yet but planned to do so in the near future. In contrast, 24.8 percent of drivers had no interest in checking their PSP information and 7.4 percent of drivers had never even heard of PSP. Not surprisingly, it was again the more actively involved drivers who were the most familiar with the CSA questions in the survey (F = 4.16, p ≤ .01). Drivers who accessed their PSP data answered the most questions correctly (M = 7.26, SD = 2.65), followed by those who planned to access PSP (M = 6.54, SD = 2.25), while drivers who did not intend to check their scores trailed behind (M = 5.76, SD = 2.18) and drivers who had never heard of PSP knew the least (M = 5.25, SD = 2.05). When comparing responses about checking CSA scores and PSP data, there was a modest association between drivers who accessed PSP data and those who accessed carrier BASIC scores (r = .41, p ≤ .001), meaning drivers who checked one database were also likely to request data from the other.
43.8%
56.2%
0%
20%
40%
60%
80%
100%
No Yes
Accessed Employer's CSA Data
5.91
6.88
5.5
6.0
6.5
7.0
7.5
Have Not Looked Up Employer's CSA Scores
Have Looked Up Employer's CSA Scores
Co
rrect
Resp
on
ses
CSA Access and Knowledge
Compliance, Safety and Accountability: Truck Driver Perspectives 22 August 2011
Perhaps the biggest challenge going forward is developing a method for improving CSA knowledge among truck driver populations. At a minimum, carriers should attempt to increase driver familiarization with CSA by encouraging them to periodically access company CSA scores and their own PSP records. However, increased knowledge and understanding of CSA will best be achieved through motor carrier-implemented CSA training or education sessions for drivers. In order to make the case for doing so, carriers would likely need to know whether CSA training leaves any lasting impression on its audience. While the answer to this question should be addressed in a more focused, experimental setting, analyses from this study indicate that there is a marginally positive relationship between the amount of training (none; one session; multiple sessions) and CSA knowledge (r = .10, p = .10), with a clear trend demonstrating that, in general, more training equates with more knowledge. Of course, the value of training sessions depends on content quality, which can be enhanced by using standardized materials that are both specific and engaging.
Although the relationship between CSA training and performance on ATRI’s CSA knowledge test failed to reach true statistical significance, it is worth noting that training was significantly related to self-rated CSA knowledge (F = 5.04, p ≤ .01). As could be expected, drivers who received no training rated their knowledge the lowest on ATRI’s 5-point scale, which ranged from a low of 1 to a high of 5 (M = 2.87, SD = .92). LSD post hoc analyses revealed this to be a significantly lower rating (p ≤ .01) than drivers who had received one training session or multiple training sessions, though these latter two groups had statistically equivalent self-ratings (Msingle = 3.24, SDsingle = .62; Mmultiple = 3.28, SDmultiple = .75).
7.4%
24.8%
42.1%
25.7%
0%
20%
40%
60%
80%
100%
Unaware of PSP
Won't Access PSP
Will Access PSP
Have Accessed
PSP
Accessed Personal PSP Data
5.25
5.76
6.54
7.26
4
5
6
7
8
9
Unaware of PSP
Won't Access PSP
Will Access PSP
Have Accessed PSP
Co
rrect
Resp
on
ses
PSP Access and Knowledge
6.16
6.52
6.75
6.0
6.2
6.4
6.6
6.8
7.0
No Training (N = 68)
One Session (N = 63)
Multiple Sessions (N = 40)
Co
rrect
Resp
on
ses
CSA Training and Knowledge
Compliance, Safety and Accountability: Truck Driver Perspectives 23 August 2011
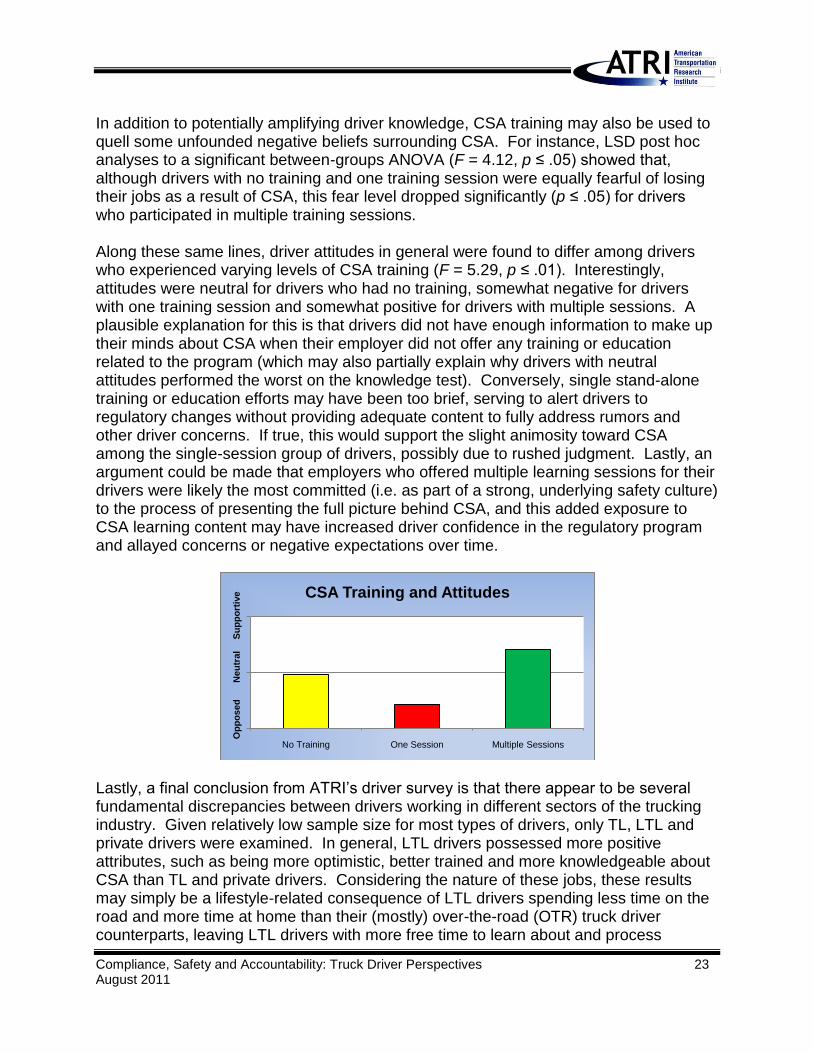
In addition to potentially amplifying driver knowledge, CSA training may also be used to quell some unfounded negative beliefs surrounding CSA. For instance, LSD post hoc analyses to a significant between-groups ANOVA (F = 4.12, p ≤ .05) showed that, although drivers with no training and one training session were equally fearful of losing their jobs as a result of CSA, this fear level dropped significantly (p ≤ .05) for drivers who participated in multiple training sessions. Along these same lines, driver attitudes in general were found to differ among drivers who experienced varying levels of CSA training (F = 5.29, p ≤ .01). Interestingly, attitudes were neutral for drivers who had no training, somewhat negative for drivers with one training session and somewhat positive for drivers with multiple sessions. A plausible explanation for this is that drivers did not have enough information to make up their minds about CSA when their employer did not offer any training or education related to the program (which may also partially explain why drivers with neutral attitudes performed the worst on the knowledge test). Conversely, single stand-alone training or education efforts may have been too brief, serving to alert drivers to regulatory changes without providing adequate content to fully address rumors and other driver concerns. If true, this would support the slight animosity toward CSA among the single-session group of drivers, possibly due to rushed judgment. Lastly, an argument could be made that employers who offered multiple learning sessions for their drivers were likely the most committed (i.e. as part of a strong, underlying safety culture) to the process of presenting the full picture behind CSA, and this added exposure to CSA learning content may have increased driver confidence in the regulatory program and allayed concerns or negative expectations over time.
Lastly, a final conclusion from ATRI’s driver survey is that there appear to be several fundamental discrepancies between drivers working in different sectors of the trucking industry. Given relatively low sample size for most types of drivers, only TL, LTL and private drivers were examined. In general, LTL drivers possessed more positive attributes, such as being more optimistic, better trained and more knowledgeable about CSA than TL and private drivers. Considering the nature of these jobs, these results may simply be a lifestyle-related consequence of LTL drivers spending less time on the road and more time at home than their (mostly) over-the-road (OTR) truck driver counterparts, leaving LTL drivers with more free time to learn about and process
No Training One Session Multiple Sessions
CSA Training and Attitudes
Neu
tral
Su
pp
ort
ive
Op
po
sed
Compliance, Safety and Accountability: Truck Driver Perspectives 24 August 2011
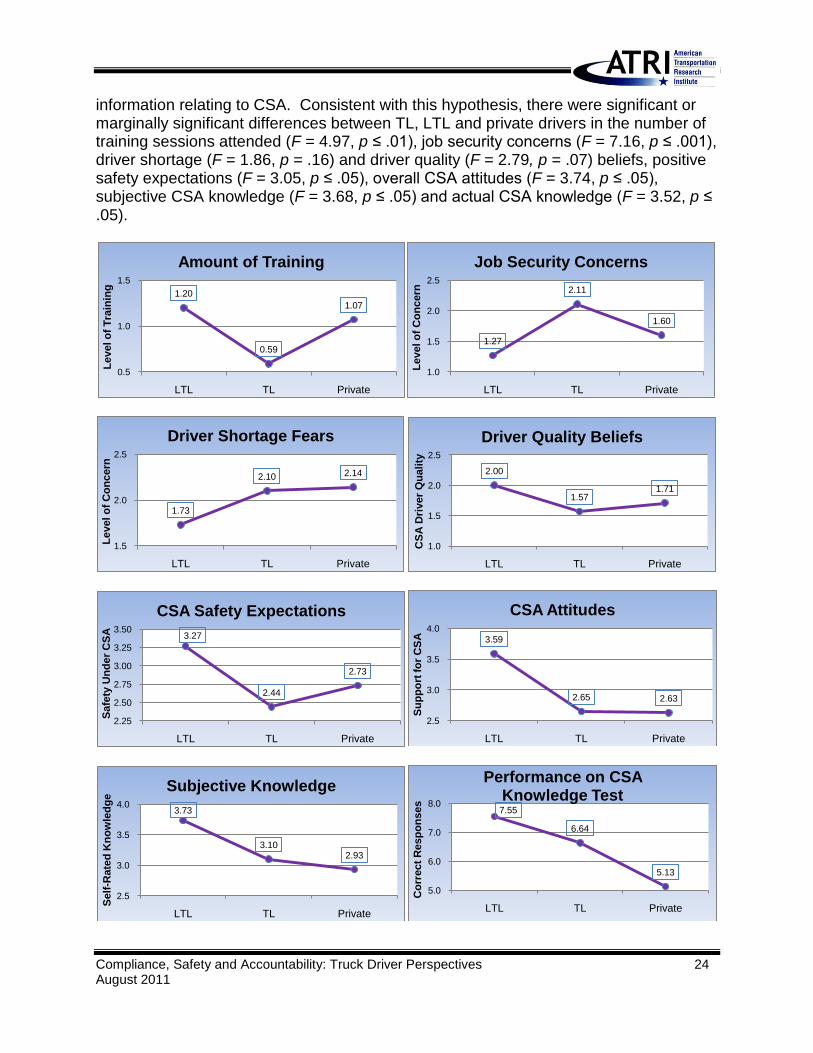
information relating to CSA. Consistent with this hypothesis, there were significant or marginally significant differences between TL, LTL and private drivers in the number of training sessions attended (F = 4.97, p ≤ .01), job security concerns (F = 7.16, p ≤ .001), driver shortage (F = 1.86, p = .16) and driver quality (F = 2.79, p = .07) beliefs, positive safety expectations (F = 3.05, p ≤ .05), overall CSA attitudes (F = 3.74, p ≤ .05), subjective CSA knowledge (F = 3.68, p ≤ .05) and actual CSA knowledge (F = 3.52, p ≤ .05).
1.20
0.59
1.07
0.5
1.0
1.5
LTL TL Private
Le
vel o
f T
rain
ing
Amount of Training
1.27
2.11
1.60
1.0
1.5
2.0
2.5
LTL TL Private
Le
vel o
f C
on
cern
Job Security Concerns
1.73
2.10 2.14
1.5
2.0
2.5
LTL TL Private
Le
vel o
f C
on
cern
Driver Shortage Fears
2.00
1.571.71
1.0
1.5
2.0
2.5
LTL TL Private
CS
A D
river
Qu
ali
ty
Driver Quality Beliefs
3.27
2.44
2.73
2.25
2.50
2.75
3.00
3.25
3.50
LTL TL Private
Safe
ty U
nd
er
CS
A
CSA Safety Expectations
3.59
2.65 2.63
2.5
3.0
3.5
4.0
LTL TL Private
Su
pp
ort
fo
r C
SA
CSA Attitudes
3.73
3.102.93
2.5
3.0
3.5
4.0
LTL TL Private
Self
-Rate
d K
no
wle
dg
e
Subjective Knowledge
7.55
6.64
5.13
5.0
6.0
7.0
8.0
LTL TL Private
Co
rrect
Resp
on
ses
Performance on CSA Knowledge Test
Compliance, Safety and Accountability: Truck Driver Perspectives 25 August 2011
CONCLUSIONS In summary, this paper discusses several key issues pertaining to FMCSA’s recently deployed regulatory program, CSA, and its perceived impacts on CMV drivers. Additionally, CSA-triggered changes that drivers have experienced in their workplace and on the road have been noted, as well as the consequent driver attitudes and opinions surrounding those changes. CSA remains a controversial topic among truck drivers, receiving almost perfectly divided support. And, while drivers who took an active interest in CSA and expressed overt approval or disapproval knew more about the program than those who had not yet formulated opinions, no group of drivers could be described as experts on the topic. Based on the general (lack of) understanding of 14 principal elements of the regulatory program, CSA is, in fact, relatively poorly understood by drivers. Even from a qualitative perspective, conversations with drivers who completed the CSA survey at MATS revealed that, in the minds of some drivers, CSA is a symbolic word synonymous with all federal regulations. For example, many drivers confused CSA with the recent (at the time of this writing) Hours-of-Service (HOS) NPRM. Recommendations are provided for increasing awareness and debunking persistent myths surrounding the program, although the passage of time is a necessary component for these processes to occur. Acceptance is predicted to gradually improve as CSA matures and the status quo shifts to accommodate the new way of complying with FMCSA regulations.
APPENDIX Compliance, Safety, Accountability:
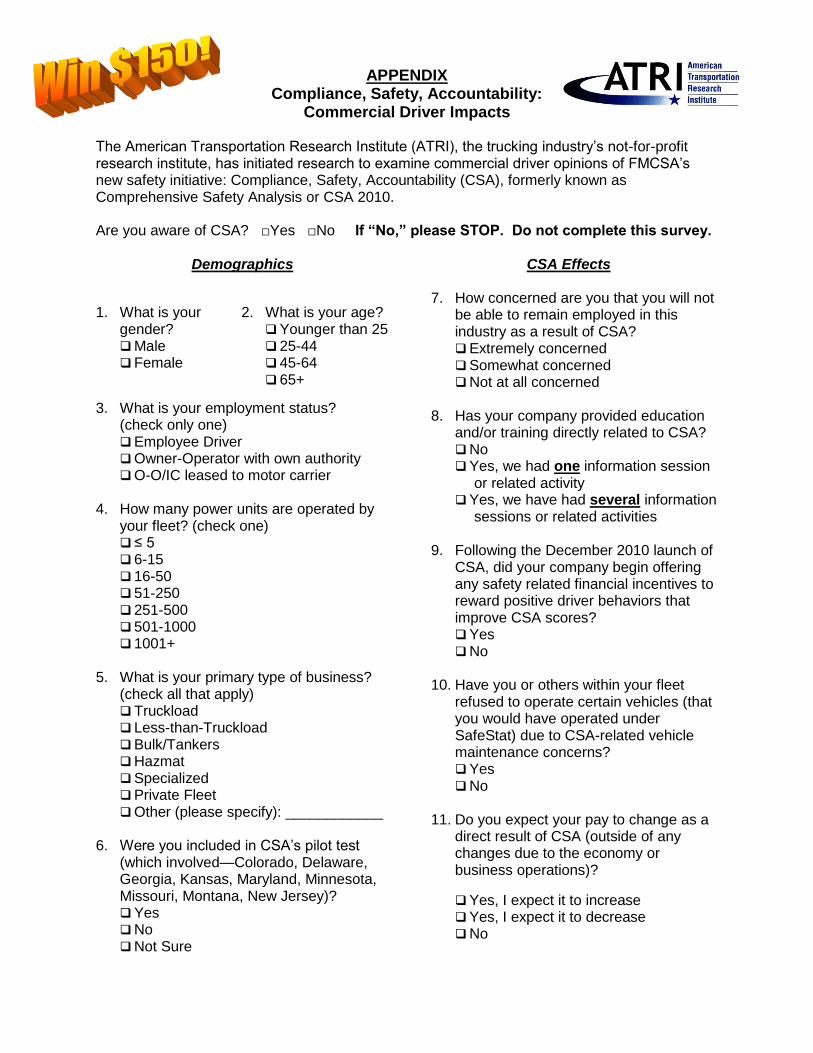
Commercial Driver Impacts The American Transportation Research Institute (ATRI), the trucking industry’s not-for-profit research institute, has initiated research to examine commercial driver opinions of FMCSA’s new safety initiative: Compliance, Safety, Accountability (CSA), formerly known as Comprehensive Safety Analysis or CSA 2010. Are you aware of CSA? □□Yes □□No If “No,” please STOP. Do not complete this survey.
Demographics CSA Effects
3. What is your employment status? (check only one) Employee Driver Owner-Operator with own authority O-O/IC leased to motor carrier
4. How many power units are operated by
your fleet? (check one) ≤ 5 6-15 16-50 51-250 251-500 501-1000 1001+
5. What is your primary type of business?
(check all that apply) Truckload Less-than-Truckload Bulk/Tankers Hazmat Specialized Private Fleet Other (please specify): ____________
6. Were you included in CSA’s pilot test
(which involved—Colorado, Delaware, Georgia, Kansas, Maryland, Minnesota, Missouri, Montana, New Jersey)? Yes No Not Sure
7. How concerned are you that you will not
be able to remain employed in this industry as a result of CSA? Extremely concerned Somewhat concerned Not at all concerned
8. Has your company provided education
and/or training directly related to CSA? No Yes, we had one information session
or related activity Yes, we have had several information
sessions or related activities 9. Following the December 2010 launch of
CSA, did your company begin offering any safety related financial incentives to reward positive driver behaviors that improve CSA scores? Yes No
10. Have you or others within your fleet
refused to operate certain vehicles (that you would have operated under SafeStat) due to CSA-related vehicle maintenance concerns? Yes No
11. Do you expect your pay to change as a
direct result of CSA (outside of any changes due to the economy or business operations)?
Yes, I expect it to increase Yes, I expect it to decrease No
1. What is your gender? Male Female
2. What is your age? Younger than 25 25-44 45-64 65+
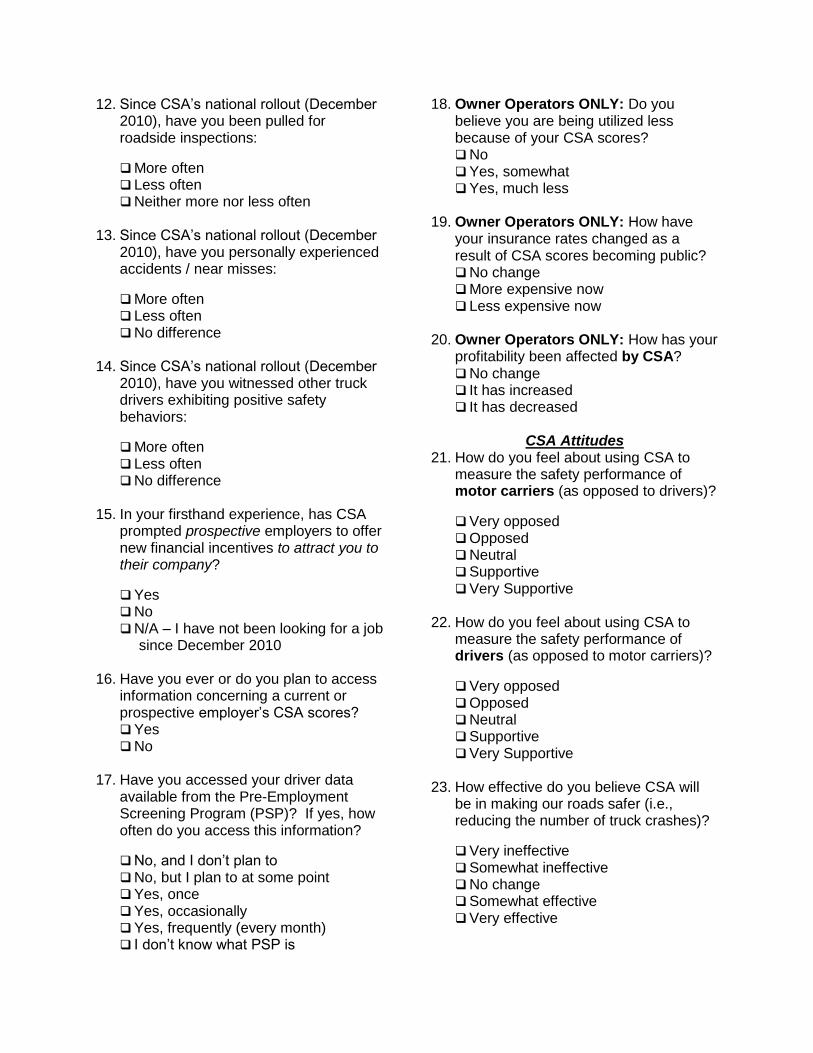
12. Since CSA’s national rollout (December 2010), have you been pulled for roadside inspections:
More often Less often Neither more nor less often
13. Since CSA’s national rollout (December
2010), have you personally experienced accidents / near misses:
More often Less often No difference
14. Since CSA’s national rollout (December
2010), have you witnessed other truck drivers exhibiting positive safety behaviors:
More often Less often No difference
15. In your firsthand experience, has CSA
prompted prospective employers to offer new financial incentives to attract you to their company?
Yes No N/A – I have not been looking for a job
since December 2010
16. Have you ever or do you plan to access information concerning a current or prospective employer’s CSA scores? Yes No
17. Have you accessed your driver data
available from the Pre-Employment Screening Program (PSP)? If yes, how often do you access this information?
No, and I don’t plan to No, but I plan to at some point Yes, once Yes, occasionally Yes, frequently (every month) I don’t know what PSP is
18. Owner Operators ONLY: Do you believe you are being utilized less because of your CSA scores? No Yes, somewhat Yes, much less
19. Owner Operators ONLY: How have
your insurance rates changed as a result of CSA scores becoming public? No change More expensive now Less expensive now
20. Owner Operators ONLY: How has your
profitability been affected by CSA? No change It has increased It has decreased
CSA Attitudes
21. How do you feel about using CSA to measure the safety performance of motor carriers (as opposed to drivers)?
Very opposed Opposed Neutral Supportive Very Supportive
22. How do you feel about using CSA to
measure the safety performance of drivers (as opposed to motor carriers)?
Very opposed Opposed Neutral Supportive Very Supportive
23. How effective do you believe CSA will
be in making our roads safer (i.e., reducing the number of truck crashes)?
Very ineffective Somewhat ineffective No change Somewhat effective Very effective
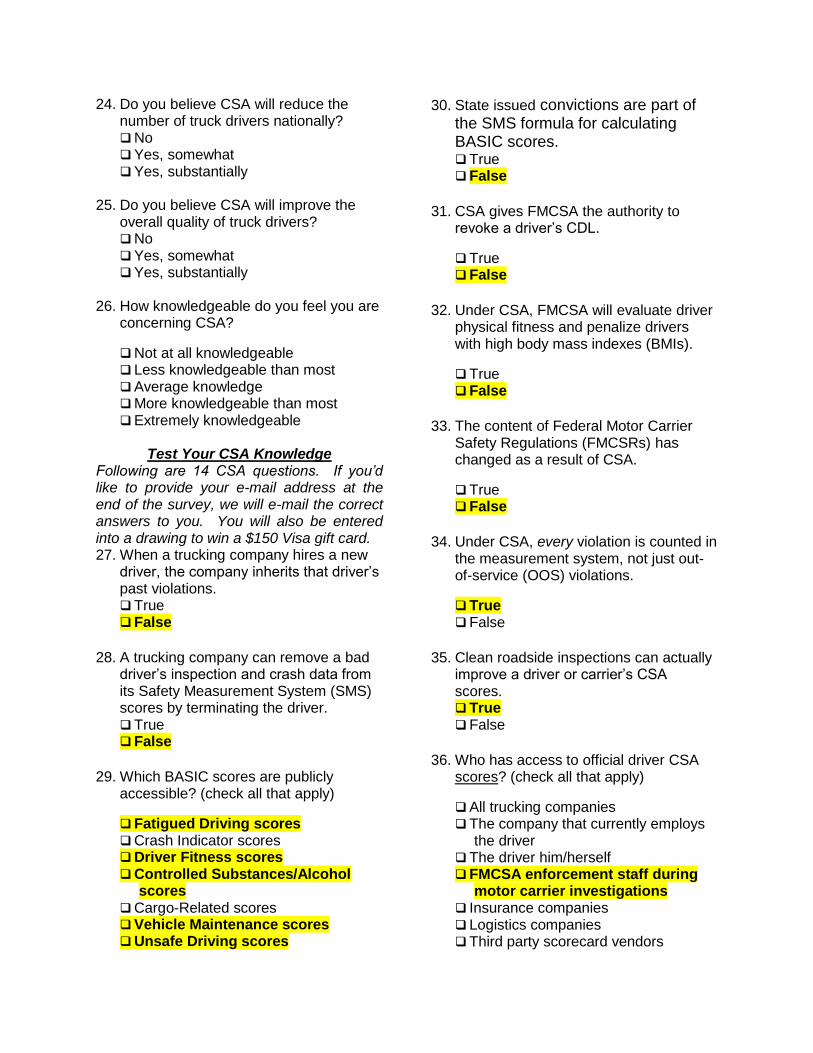
24. Do you believe CSA will reduce the number of truck drivers nationally? No Yes, somewhat Yes, substantially
25. Do you believe CSA will improve the
overall quality of truck drivers? No Yes, somewhat Yes, substantially
26. How knowledgeable do you feel you are
concerning CSA?
Not at all knowledgeable Less knowledgeable than most Average knowledge More knowledgeable than most Extremely knowledgeable
Test Your CSA Knowledge
Following are 14 CSA questions. If you’d like to provide your e-mail address at the end of the survey, we will e-mail the correct answers to you. You will also be entered into a drawing to win a $150 Visa gift card. 27. When a trucking company hires a new
driver, the company inherits that driver’s past violations. True False
28. A trucking company can remove a bad
driver’s inspection and crash data from its Safety Measurement System (SMS) scores by terminating the driver. True False
29. Which BASIC scores are publicly
accessible? (check all that apply)
Fatigued Driving scores Crash Indicator scores Driver Fitness scores Controlled Substances/Alcohol
scores Cargo-Related scores Vehicle Maintenance scores Unsafe Driving scores
30. State issued convictions are part of the SMS formula for calculating BASIC scores. True False
31. CSA gives FMCSA the authority to
revoke a driver’s CDL.
True False
32. Under CSA, FMCSA will evaluate driver
physical fitness and penalize drivers with high body mass indexes (BMIs).
True False
33. The content of Federal Motor Carrier
Safety Regulations (FMCSRs) has changed as a result of CSA.
True False
34. Under CSA, every violation is counted in
the measurement system, not just out-of-service (OOS) violations.
True False
35. Clean roadside inspections can actually
improve a driver or carrier’s CSA scores. True False
36. Who has access to official driver CSA
scores? (check all that apply)
All trucking companies The company that currently employs
the driver The driver him/herself FMCSA enforcement staff during
motor carrier investigations Insurance companies Logistics companies Third party scorecard vendors
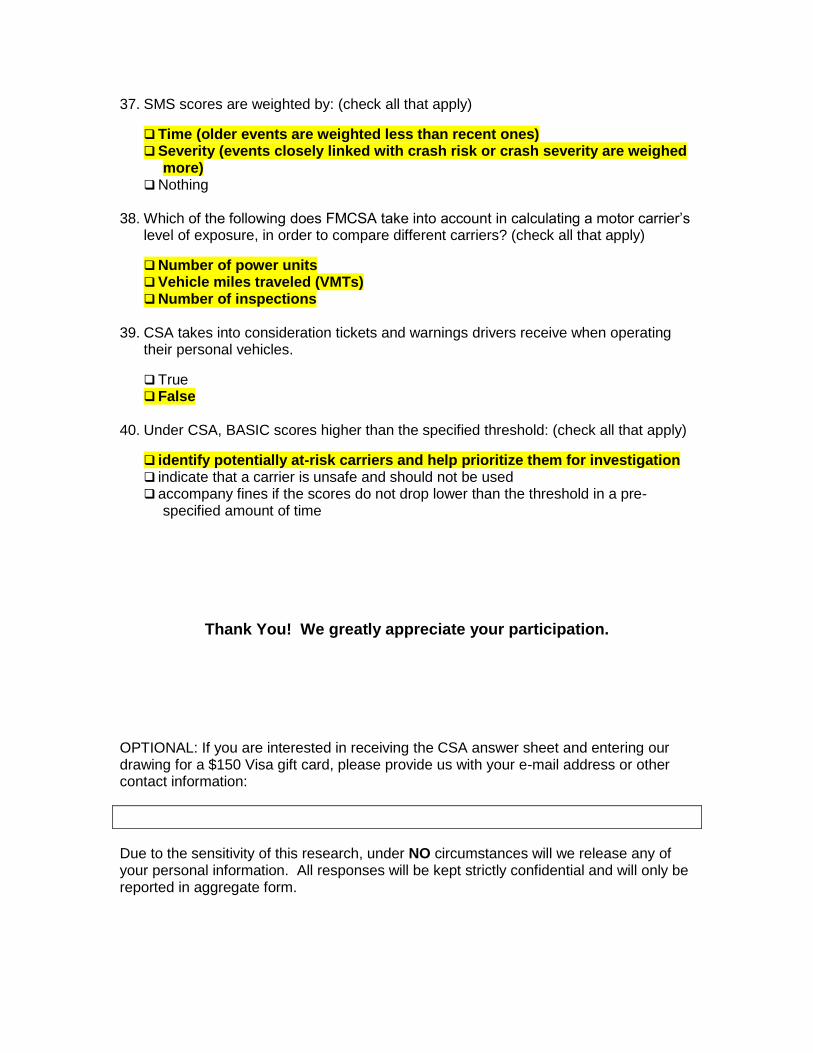
37. SMS scores are weighted by: (check all that apply)
Time (older events are weighted less than recent ones) Severity (events closely linked with crash risk or crash severity are weighed
more) Nothing
38. Which of the following does FMCSA take into account in calculating a motor carrier’s
level of exposure, in order to compare different carriers? (check all that apply)
Number of power units Vehicle miles traveled (VMTs) Number of inspections
39. CSA takes into consideration tickets and warnings drivers receive when operating
their personal vehicles.
True False
40. Under CSA, BASIC scores higher than the specified threshold: (check all that apply)
identify potentially at-risk carriers and help prioritize them for investigation indicate that a carrier is unsafe and should not be used accompany fines if the scores do not drop lower than the threshold in a pre-
specified amount of time
Thank You! We greatly appreciate your participation.
OPTIONAL: If you are interested in receiving the CSA answer sheet and entering our drawing for a $150 Visa gift card, please provide us with your e-mail address or other contact information:
Due to the sensitivity of this research, under NO circumstances will we release any of your personal information. All responses will be kept strictly confidential and will only be reported in aggregate form.