complete thesis - ruchi sagarshodhganga.inflibnet.ac.in/bitstream/10603/45020/13/13...136 mahila...
TRANSCRIPT
134
CHAPTER 5
THE PATTERN OF UTILISATION OF LOANS
5.1 INTRODUCTION
Microfinance has made great
to financial services and developing ways to overcome these barriers. It is assumed
the household and the access to income for both production and consumption.
particularly with that of children. In this context the present chapter examines the
borrowing behaviour of the respondents. The saving as well as borrowing activity has
multiple aspects. It initiates the process of bringing up the households above their
subsistence level living. The process is rather gradual but it certainly indicates that
this activity has tremendous potential.
This chapter brings forth the utilisation of SHG loans by the respondents, analyses the
relation between various socio-economic indicators like income of the respondents
and their families, education levels, working status, age etc. with the loan utilisation
patterns of the respondents. The utilisation pattern has revealed very interesting
aspects about the role played by the SHGs in the livelihoods of their members. The
major part of the total loans advanced by the groups was for fulfilling their
consumption requirements. However, some of the women have shown enterprising
spirit. These women have not only used the loans for their consumption requirements
135
but they also moved on to gain more stability into their lives. They have taken loans
for various kinds of income generating activities which they have been pursuing to
support their families.
5.2 BORROWING STATUS OF WOMEN
The present section examines the total number of respondents who borrowed from the
groups and the amount of loans availed by them. It also analyses the frequency of
borrowings by the respondents.
5.2.1 NUMBER OF BORROWERS
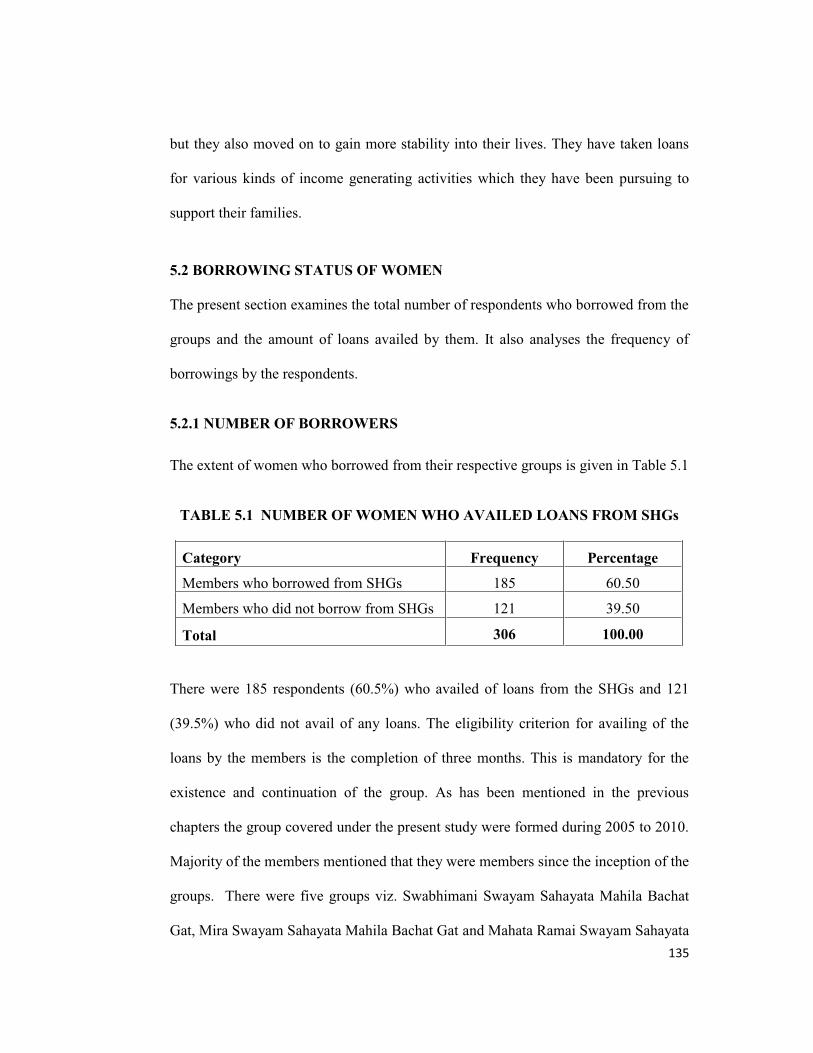
The extent of women who borrowed from their respective groups is given in Table 5.1
TABLE 5.1 NUMBER OF WOMEN WHO AVAILED LOANS FROM SHGs
Category Frequency Percentage
Members who borrowed from SHGs 185 60.50
Members who did not borrow from SHGs 121 39.50
Total 306 100.00
There were 185 respondents (60.5%) who availed of loans from the SHGs and 121
(39.5%) who did not avail of any loans. The eligibility criterion for availing of the
loans by the members is the completion of three months. This is mandatory for the
existence and continuation of the group. As has been mentioned in the previous
chapters the group covered under the present study were formed during 2005 to 2010.
Majority of the members mentioned that they were members since the inception of the
groups. There were five groups viz. Swabhimani Swayam Sahayata Mahila Bachat
Gat, Mira Swayam Sahayata Mahila Bachat Gat and Mahata Ramai Swayam Sahayata
136
Mahila Bachat Gat (Malad) Mahila Vikas Swayam Sahayata Mahila Bachat Gat,
Savitribai Swayam Sahayata Mahila Bachat Gat which had not completed the required
time limit for the availing of loans. Members from these groups had not begun their
borrowing activity. For these women the regular saving activity was extremely
important.
There were 34 women whose family income was below ` 3000. For these women the
support of the groups was crucial. They had found a way of saving regularly. The
gradual strengthening of their savings was extremely important for these women
though they were not in a position to avail of loans.
5.2.2 AMOUNT OF LOANS AVAILED BY MEMBERS
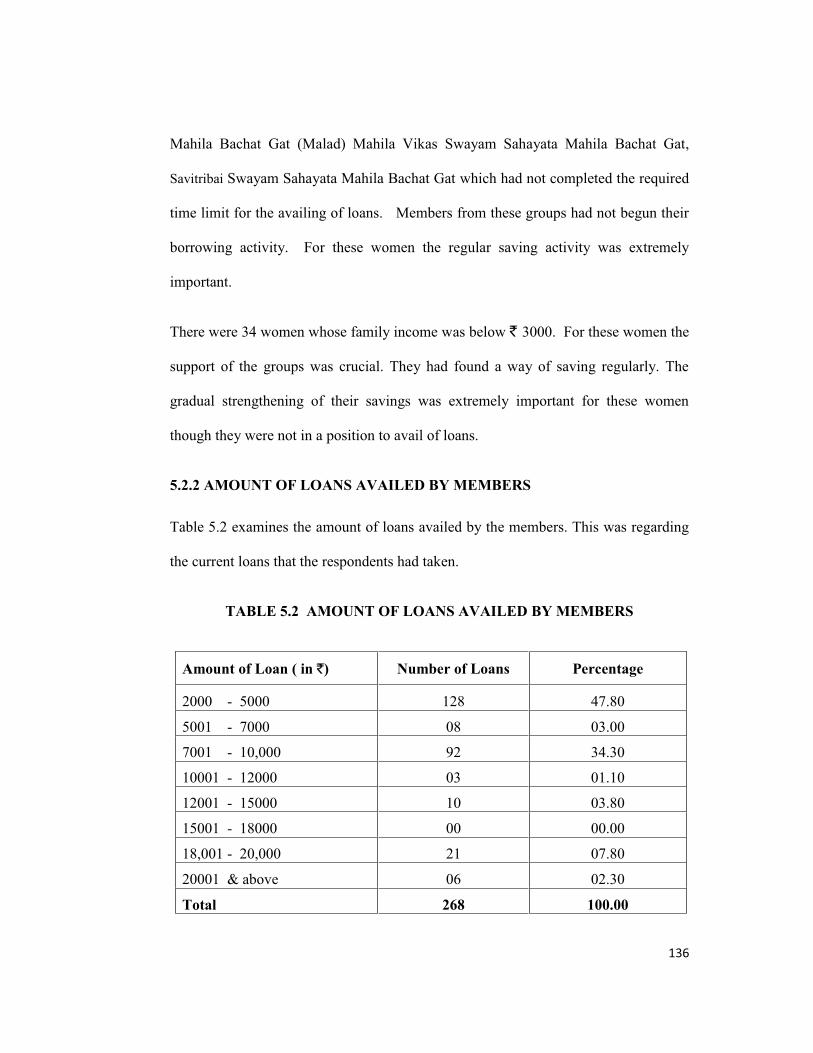
Table 5.2 examines the amount of loans availed by the members. This was regarding
the current loans that the respondents had taken.
TABLE 5.2 AMOUNT OF LOANS AVAILED BY MEMBERS
Amount of Loan ( in `) Number of Loans Percentage
2000 - 5000 128 47.80
5001 - 7000 08 03.00
7001 - 10,000 92 34.30
10001 - 12000 03 01.10
12001 - 15000 10 03.80
15001 - 18000 00 00.00
18,001 - 20,000 21 07.80
20001 & above 06 02.30
Total 268 100.00
137
The above table reports the amount of loans availed by the members. It was also
reported earlier that there were 34 women who reported that their family income was
only up to ` 3000 per month. It is in this context the group membership for such
women becomes only an instrument of saving rather than borrowing. Accordingly it
was observed that there were 128 loans (47.80%) to the extent of up to Rs. ` 5000.
This was followed by 100 loans reported to the tune of ` 5001 to ` 10,000. The
number of loans above ` 10,000 were 34 (12.7%). Out of this 13 (4.9%) loans were
for ` 10001 to ` 15000 and there were 21 loans (7.8%) for ` 20,000. It is significant
that there were six loans that were for more than ` 20,000. Majority of the loans i.e.
(85%) were for the amount up to ` 10,000.
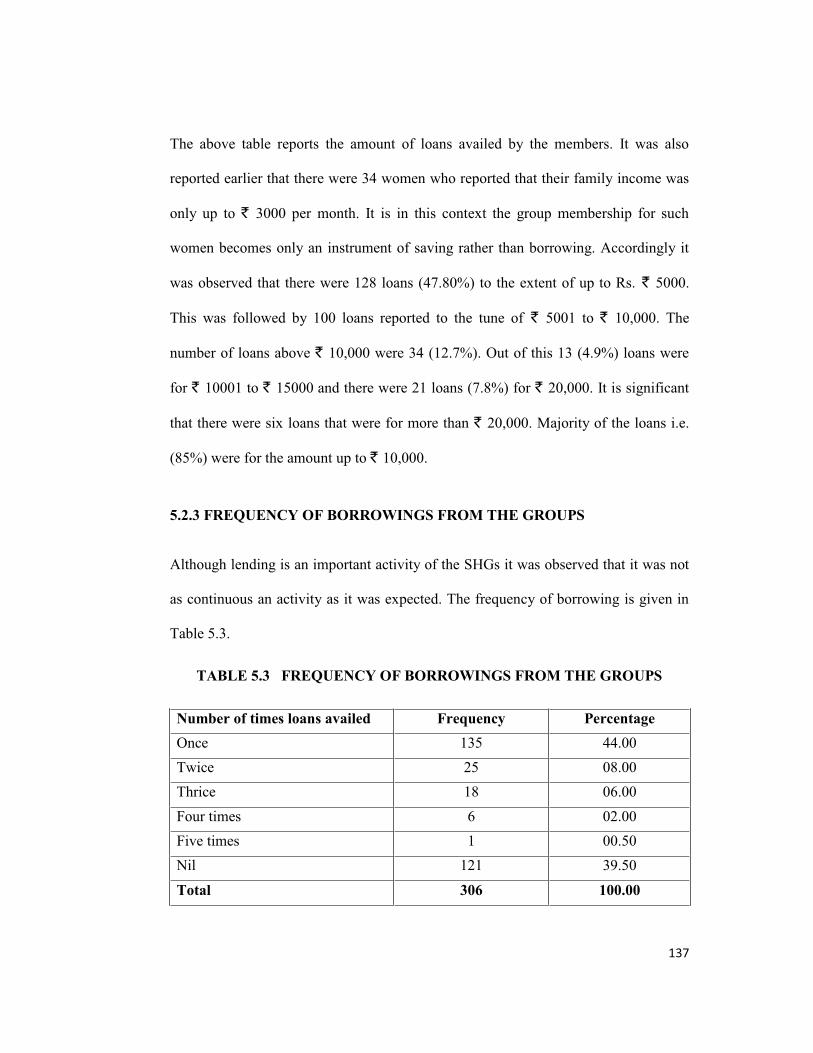
5.2.3 FREQUENCY OF BORROWINGS FROM THE GROUPS
Although lending is an important activity of the SHGs it was observed that it was not
as continuous an activity as it was expected. The frequency of borrowing is given in
Table 5.3.
TABLE 5.3 FREQUENCY OF BORROWINGS FROM THE GROUPS
Number of times loans availed Frequency Percentage
Once 135 44.00
Twice 25 08.00
Thrice 18 06.00
Four times 6 02.00
Five times 1 00.50
Nil 121 39.50
Total 306 100.00
138
There were 185 respondents who borrowed from the groups. The largest number of
borrowers i.e. 135 respondents had borrowed only once from their respective groups.
There were 25 respondents who had borrowed twice and 18 respondents who had
borrowed three times. The number of respondents who borrowed more than three
times was only seven. While six respondents had borrowed four times only one
respondent had borrowed five times. There were 121 respondents who did not borrow
even once. These were the women who had focused on the strengthening of their
savings. The reason largely for not availing of loans was because of the low capacity
to repay the loans. Also some of the members belonged to the newly formed groups
so they could not borrow. Frequency of borrowing was mainly related to the maturity
of the groups. Members belonging to older groups borrowed more frequently.
5.3 UTILISATION OF THE LOANS
The various aspects of utilisation of loans such as the purpose of borrowing,
relationship between the purpose of loan and the frequency of the borrowing, working
status of respondents, age of the respondents, their educational levels etc. have been
discussed in the present section.
5.3.1 PURPOSE WISE DISTRIBUTION OF LOANS
Table 5.4 gives information on the purpose of borrowing and the number of
respondents availing loans for the specified purpose. Since loans could be for more
than one purpose, the purpose with largest amount has been taken as the main reason
of borrowing. It was observed that the loans for the general household expenses were
availed by those members who had borrowed more than once from the groups.
139
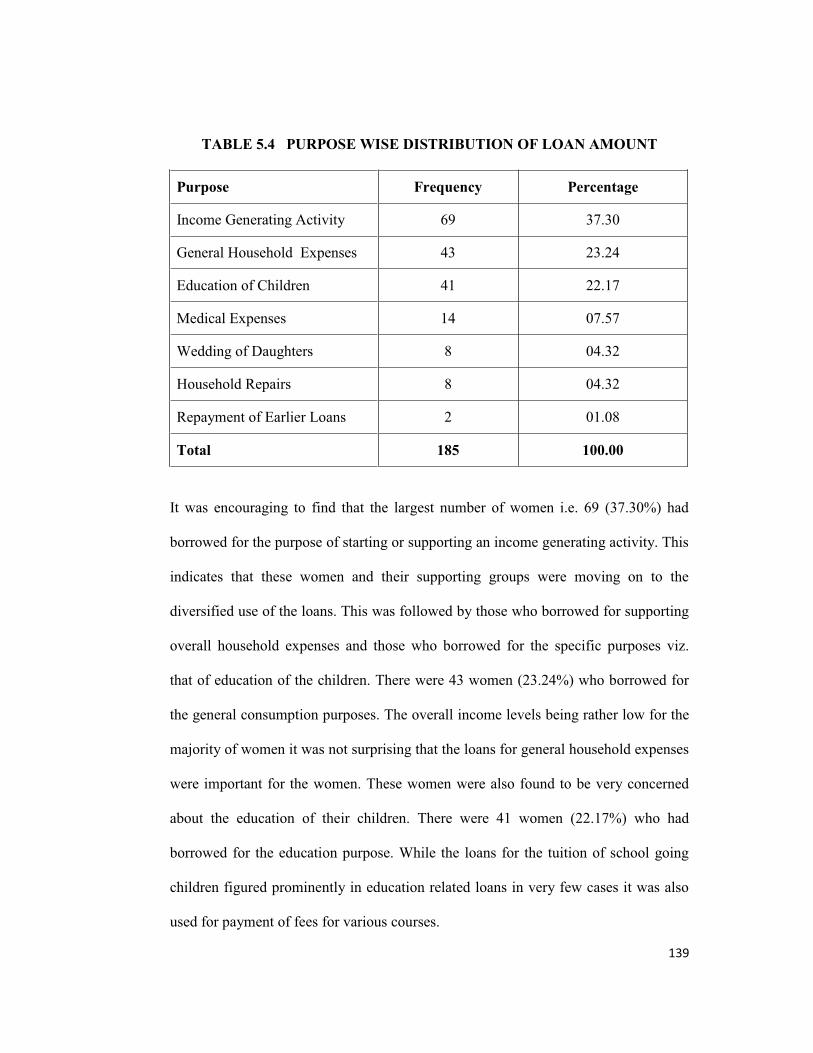
TABLE 5.4 PURPOSE WISE DISTRIBUTION OF LOAN AMOUNT
Purpose Frequency Percentage
Income Generating Activity 69 37.30
General Household Expenses 43 23.24
Education of Children 41 22.17
Medical Expenses 14 07.57
Wedding of Daughters 8 04.32
Household Repairs 8 04.32
Repayment of Earlier Loans 2 01.08
Total 185 100.00
It was encouraging to find that the largest number of women i.e. 69 (37.30%) had
borrowed for the purpose of starting or supporting an income generating activity. This
indicates that these women and their supporting groups were moving on to the
diversified use of the loans. This was followed by those who borrowed for supporting
overall household expenses and those who borrowed for the specific purposes viz.
that of education of the children. There were 43 women (23.24%) who borrowed for
the general consumption purposes. The overall income levels being rather low for the
majority of women it was not surprising that the loans for general household expenses
were important for the women. These women were also found to be very concerned
about the education of their children. There were 41 women (22.17%) who had
borrowed for the education purpose. While the loans for the tuition of school going
children figured prominently in education related loans in very few cases it was also
used for payment of fees for various courses.
140
The remaining 32 women (17.29%) borrowed for various other purposes. These were
the contingencies which the households have to face frequently. There were 14
women (7.57%) who had borrowed on account of medical contingency. There were
eight women who had borrowed for wedding expenses and the other eight women
borrowed for undertaking household repairs. There were only two women who
borrowed to repay the earlier loans.
Almost all the loans other than those taken for the income generating activities were
for the important phases in the life cycle. Some of the requirements were unexpected
such as the medical expenses whereas some of them were expected ones like
education and marriage expenses. These loans were extremely important to the
women as in the absence of them they would have had to go to the money lenders and
consequently would have become indebted for an unspecified period of life. These
loans were a kind of much needed safety nets for the women.
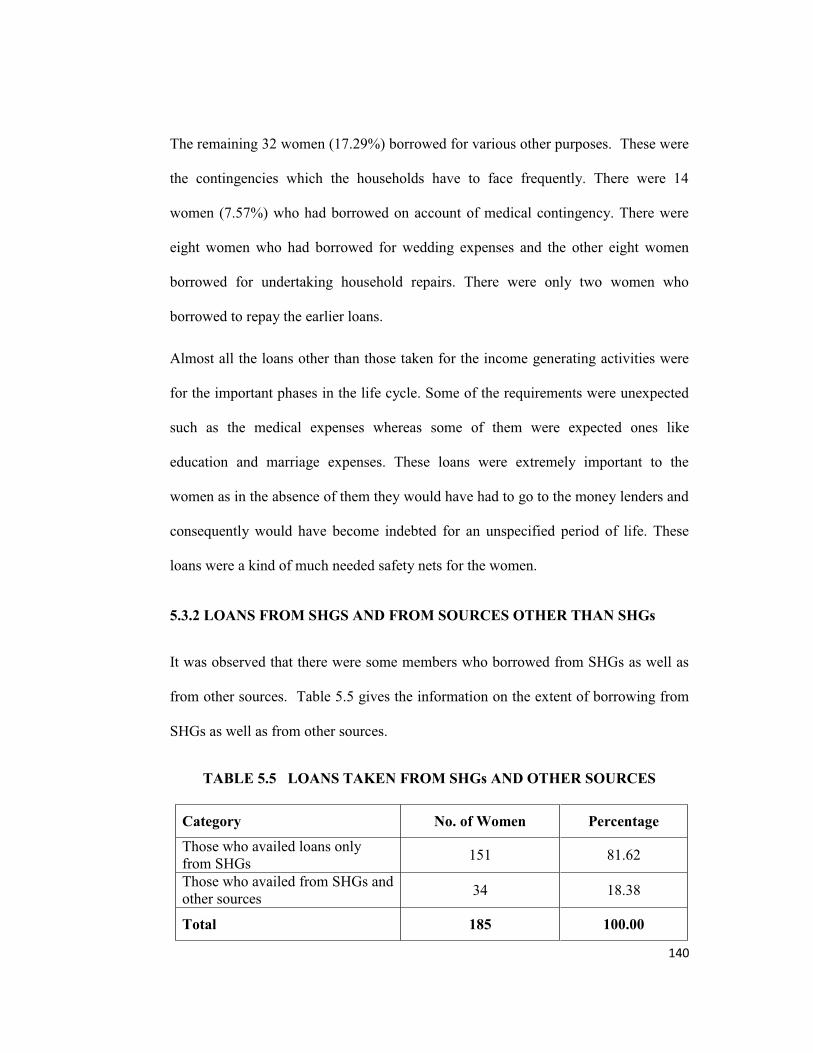
5.3.2 LOANS FROM SHGS AND FROM SOURCES OTHER THAN SHGs
It was observed that there were some members who borrowed from SHGs as well as
from other sources. Table 5.5 gives the information on the extent of borrowing from
SHGs as well as from other sources.
TABLE 5.5 LOANS TAKEN FROM SHGs AND OTHER SOURCES
Category No. of Women Percentage
Those who availed loans only
from SHGs 151 81.62
Those who availed from SHGs and
other sources 34 18.38
Total 185 100.00
141
What needs to be noted here is that 34 (18.38%) women who had to borrow from
other sources had also borrowed from their respective SHGs. Thus they were also
part of the number of women who borrowed from SHGs. The SHGs had their own
policy in disbursing the loans. If the SHGs could not sanction loans for these
members, they had to borrow from other sources. For 151 women (81.62%) SHGs
were the only source.
5.3.3 COMPARATIVE ANALYSIS BETWEEN THE UTILISATION OF
LOANS TAKEN FROM SHGs AND LOANS TAKEN FOM OTHER
SOURCES
The present section undertakes the comparative analysis of the utilisation of loans
taken from SHGs and from other sources.
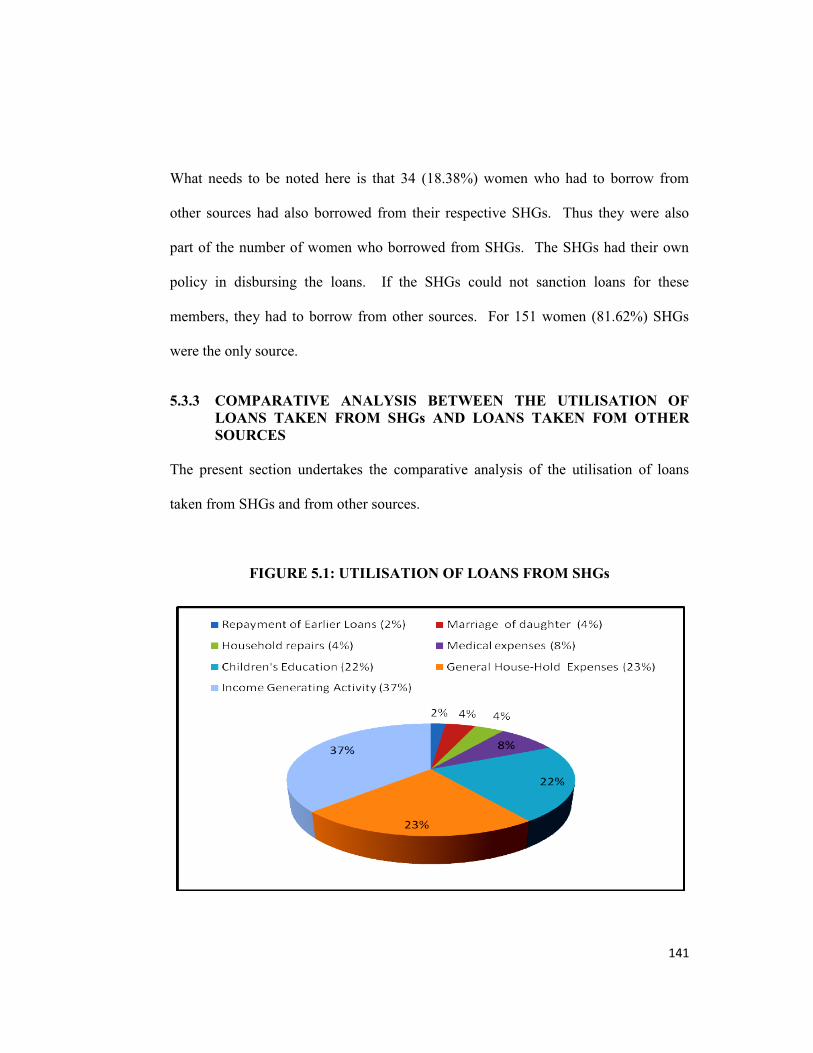
FIGURE 5.1: UTILISATION OF LOANS FROM SHGs
142
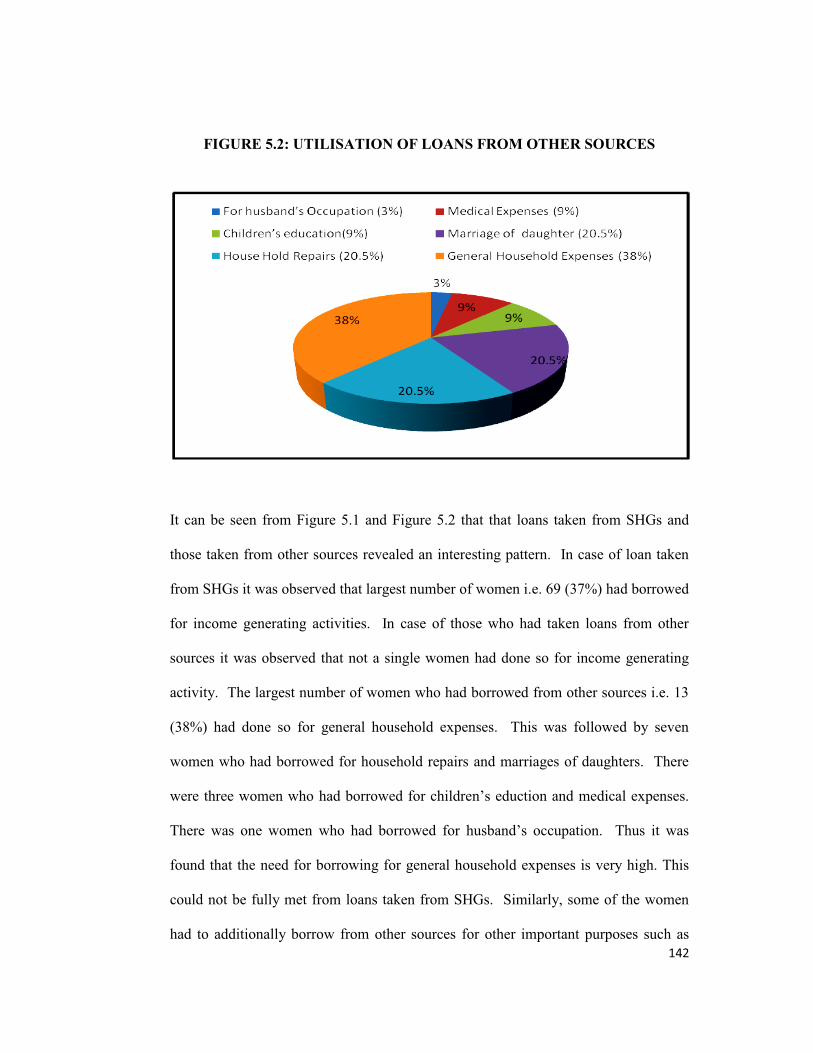
FIGURE 5.2: UTILISATION OF LOANS FROM OTHER SOURCES
It can be seen from Figure 5.1 and Figure 5.2 that that loans taken from SHGs and
those taken from other sources revealed an interesting pattern. In case of loan taken
from SHGs it was observed that largest number of women i.e. 69 (37%) had borrowed
for income generating activities. In case of those who had taken loans from other
sources it was observed that not a single women had done so for income generating
activity. The largest number of women who had borrowed from other sources i.e. 13
(38%) had done so for general household expenses. This was followed by seven
women who had borrowed for household repairs and marriages of daughters. There
There was one women who had bor
found that the need for borrowing for general household expenses is very high. This
could not be fully met from loans taken from SHGs. Similarly, some of the women
had to additionally borrow from other sources for other important purposes such as
143
education. SHGs still have to go a long way to completely eliminate the needs of
their member to borrow from other sources.
5.4 RELATION BETWEEN SOCIO-ECONOMOIC INDICATORS AND
THE REASONS OF BORROWING FROM THE SHGs
The present section tries to explore the relation between socio-economic status of
women and the reasons of their borrowings from the SHGs. The selected socio-
economic indicators are age of borrowers, education levels, their monthly income, the
income of their families, working status and past employment.
5.4.1 RELATION BETWEEN WORKING STATUS OF THE WOMEN AND
BORROWINGS FROM THE SHG
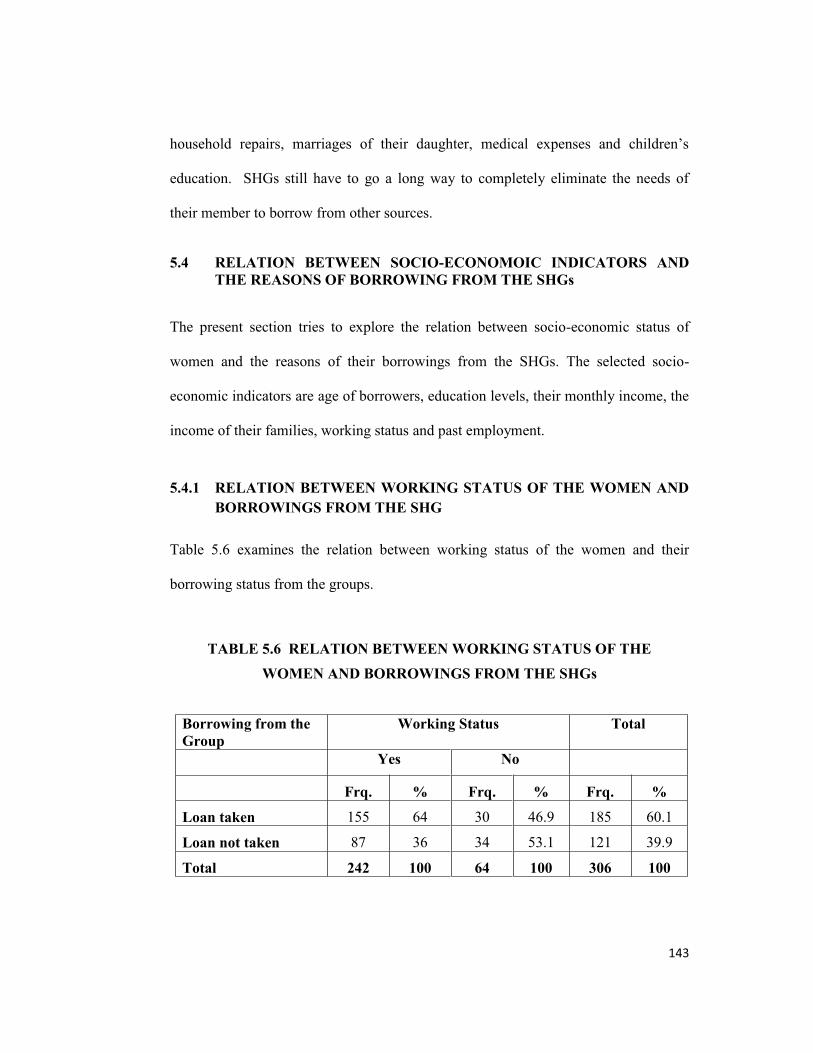
Table 5.6 examines the relation between working status of the women and their
borrowing status from the groups.
TABLE 5.6 RELATION BETWEEN WORKING STATUS OF THE
WOMEN AND BORROWINGS FROM THE SHGs
Borrowing from the
Group
Working Status Total
Yes No
Frq. % Frq. % Frq. %
Loan taken 155 64 30 46.9 185 60.1
Loan not taken 87 36 34 53.1 121 39.9
Total 242 100 64 100 306 100
144
From Table 5.6 it can be seen that 242 women were working. As had been reported
earlier these women were largely domestic workers, anganwadi helpers and petty
vendors. There were 155 working women who had availed of loans. But there was
also a significant number of working women i.e. 87 who did not borrow from the
groups. There were 64 women who reported that they were not engaged in any work.
Out of this 30 women had availed of loans and 34 women did not take any loans. It
indicates that the working status did not have any significant relationship with the
borrowing status of the respondents. Those women who were not working had to
depend on the earning members of their household to contribute to the savings.
5.4.2 RELATION BETWEEN REASON OF LOAN AND AGE
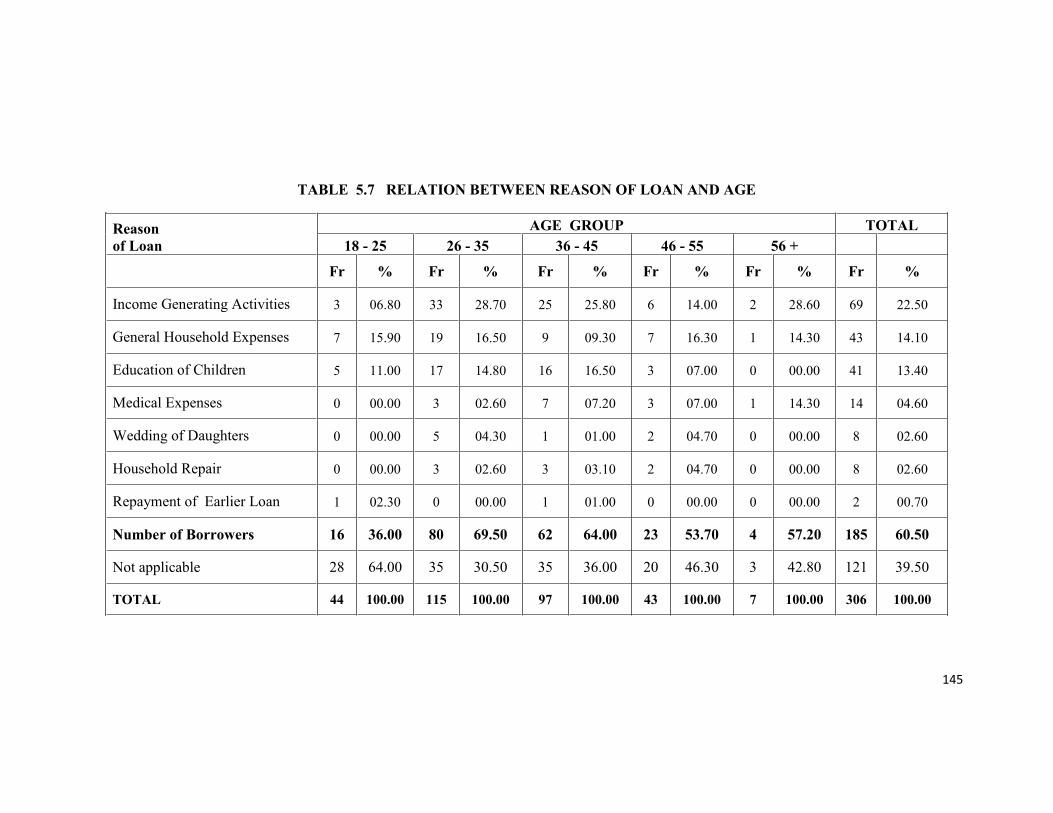
Table 5.7 presents the relationship between the reason of SHG loans and the age of
respondents.
This table brings out an interesting relationship between the age of the respondents
and the purpose of borrowing. It was observed that the largest number of borrowers
i.e. 80 (43.24%) were in the age group of 26 35 years. This was followed by 62
women (33.51%) who were in the age group of 36 to 45 years. Thus there were 142
borrowers (76.75%) who were in the age group of 26 45 years. Among the
remaining borrowers 23 (12.43%) were in the higher age group of 46 55 years and
16 borrowers (8.65%) in the youngest age group of 18 25 years. There were only
four borrowers in the oldest age group of 56 years and above.
145
TABLE 5.7 RELATION BETWEEN REASON OF LOAN AND AGE
Reason
of Loan
AGE GROUP TOTAL
18 - 25 26 - 35 36 - 45 46 - 55 56 +
Fr % Fr % Fr % Fr % Fr % Fr %
Income Generating Activities 3 06.80 33 28.70 25 25.80 6 14.00 2 28.60 69 22.50
General Household Expenses 7 15.90 19 16.50 9 09.30 7 16.30 1 14.30 43 14.10
Education of Children 5 11.00 17 14.80 16 16.50 3 07.00 0 00.00 41 13.40
Medical Expenses 0 00.00 3 02.60 7 07.20 3 07.00 1 14.30 14 04.60
Wedding of Daughters 0 00.00 5 04.30 1 01.00 2 04.70 0 00.00 8 02.60
Household Repair 0 00.00 3 02.60 3 03.10 2 04.70 0 00.00 8 02.60
Repayment of Earlier Loan 1 02.30 0 00.00 1 01.00 0 00.00 0 00.00 2 00.70
Number of Borrowers 16 36.00 80 69.50 62 64.00 23 53.70 4 57.20 185 60.50
Not applicable 28 64.00 35 30.50 35 36.00 20 46.30 3 42.80 121 39.50
TOTAL 44 100.00 115 100.00 97 100.00 43 100.00 7 100.00 306 100.00
146
There were 44 women in the youngest age group of 18-25 years. There were 16
women who had availed loans from this age group. They had mainly borrowed for
consumption needs followed by education, income generating activities and the
repayment of earlier loans.
Out of 115 women in the age group of 26-35 years, 80 women had availed of loans
and large number of them i.e. 33 women had borrowed for income generating activity.
There were 19 and 17 women who had borrowed for consumption and educational
needs respectively. The remaining 11 women borrowed for marriage, medical
expenses and repairing of the house.
Out of 97 women in the age group of 36-45 years there were 62 women who had
availed of loans. In this age group also as in the case of the age group 26-35 years
largest number of borrowers had taken loans for income generating activity. This was
followed by 16 women who had borrowed for education purpose. Remaining
21women had borrowed for consumption (9), medical expenses (7), repairing of the
house (3), marriage (1), repayment of previous loan (1).
Out of 43 women in the age group of 46-55 years, largest number borrowed for
consumption purposes. This was closely followed by six women who borrowed for
income generating activities. The remaining 10 women were all spread out in
borrowing for education (3), medical expenses (3), marriage (2), and house repair (2).
There were only seven women in the age group of 56 years and above. Out of these
four women had taken loans. There were two women from this category who
147
borrowed for income generating activities and one each had taken loans for
consumption and medical expenses respectively.
It was observed that borrowing for income generating activity figured prominently for
each of the age groups. This was followed by consumption needs and educational
expenses.
5.4.3 RELATION BETWEEN BORROWING STATUS AND EDUCATION
Table 5.8 describes the relation between borrowing status of the respondents and their
education levels.
There were 140 women who had not been to the schools at all. Out of 140 women
with nil education, 81 women (57.85%) had availed of loans whereas 59 women
(42.15%) did not borrow. There were 8 women who studied up to 4th
standard. Out of
them 4 women had borrowed from the groups.
There were 30 women who could reach up to 8th
standard but could not clear the
examination. From among them 19 women (63.33%) had borrowed from the groups.
Those who could reach up to SSC but failed to clear were 77 women. From this
category 50 women (64.93%) had availed of loans from the groups.
There were 33 women who had passed SSC and 22 women had borrowed from this
category. The number of women who studied beyond SSC is very low. There were
nine women who completed their HSC and nine women who completed graduation.
In each of these categories i.e. those who studied beyond SSC the extent of borrowers
was 50% to 66%.
148
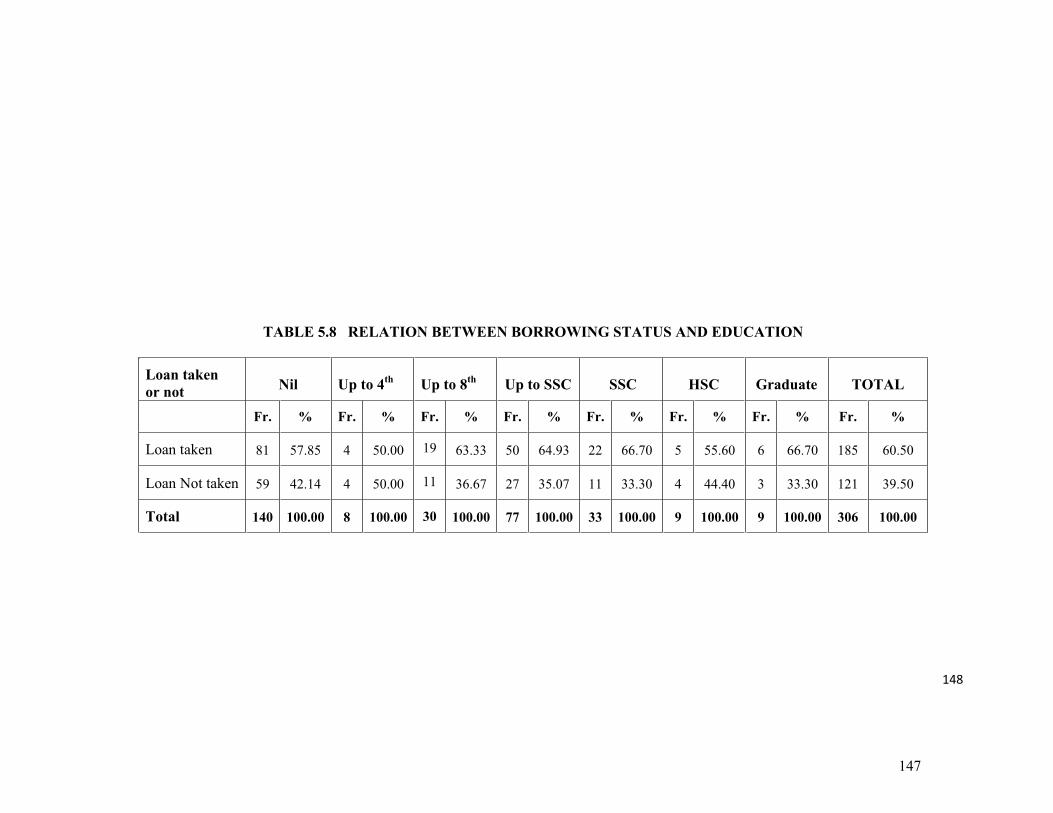
TABLE 5.8 RELATION BETWEEN BORROWING STATUS AND EDUCATION
Loan taken
or not Nil
Up to 4th
Up to 8th
Up to SSC SSC HSC Graduate TOTAL
Fr. % Fr. % Fr. % Fr. % Fr. % Fr. % Fr. % Fr. %
Loan taken 81 57.85 4 50.00 19 63.33 50 64.93 22 66.70 5 55.60 6 66.70 185 60.50
Loan Not taken 59 42.14 4 50.00 11 36.67 27 35.07 11 33.30 4 44.40 3 33.30 121 39.50
Total 140 100.00 8 100.00 30 100.00 77 100.00 33 100.00 9 100.00 9 100.00 306 100.00
147
149
At each level of education from up to 4th
Standard till the graduate level it was found
that the number of women who had taken loans was more than those who had not
availed of loans. This was so even for illiterate women. Overall it was observed that
the extent of borrowers across the different categories of educational levels ranged
from 50% to 66%.
5.4.4 RELATION BETWEEN REASON OF LOAN AND EDUCATION
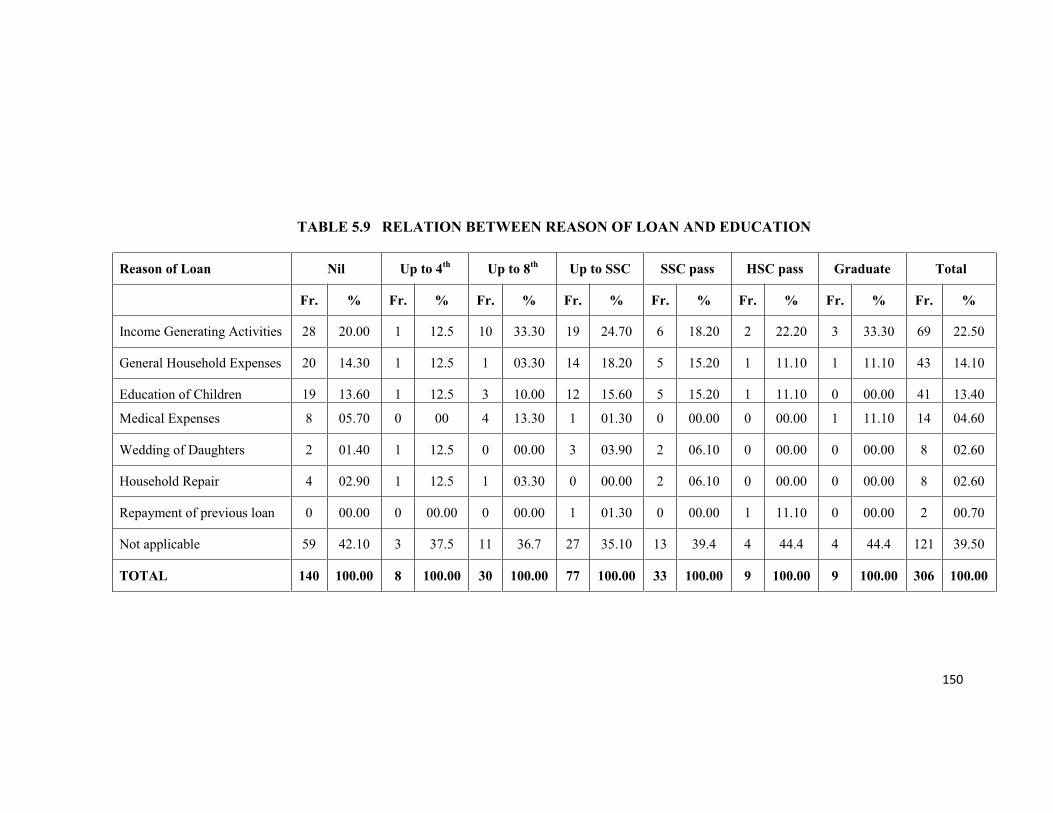
Table 5.9 examines the relation between purpose of borrowing and the education
levels of the respondents.
This table explains that out of 140 women who were illiterate 81 women had
borrowed from their groups. The largest number of women i.e. 28 had taken the loans
for income generating activities. This was closely followed by the number of
borrowers for consumption purposes (20) as well as for education (19). The remaining
14 women borrowed for medical purposes (8), house repairing (4) and marriage
expenses (2).
In case of women who studied up to 4th
standard one each borrowed for marriage
expenses, education, house repair, consumption and income generating activity.
In case of respondents who studied up to 8th
standard it was found that the majority
i.e. 10 women borrowed for income generating activities whereas remaining women
borrowed for medical expenses (4), education (3), house repair (1) and
consumption (1).
150
TABLE 5.9 RELATION BETWEEN REASON OF LOAN AND EDUCATION
Reason of Loan Nil Up to 4th
Up to 8th
Up to SSC SSC pass HSC pass Graduate Total
Fr. % Fr. % Fr. % Fr. % Fr. % Fr. % Fr. % Fr. %
Income Generating Activities 28 20.00 1 12.5 10 33.30 19 24.70 6 18.20 2 22.20 3 33.30 69 22.50
General Household Expenses 20 14.30 1 12.5 1 03.30 14 18.20 5 15.20 1 11.10 1 11.10 43 14.10
Education of Children 19 13.60 1 12.5 3 10.00 12 15.60 5 15.20 1 11.10 0 00.00 41 13.40
Medical Expenses 8 05.70 0 00 4 13.30 1 01.30 0 00.00 0 00.00 1 11.10 14 04.60
Wedding of Daughters 2 01.40 1 12.5 0 00.00 3 03.90 2 06.10 0 00.00 0 00.00 8 02.60
Household Repair 4 02.90 1 12.5 1 03.30 0 00.00 2 06.10 0 00.00 0 00.00 8 02.60
Repayment of previous loan 0 00.00 0 00.00 0 00.00 1 01.30 0 00.00 1 11.10 0 00.00 2 00.70
Not applicable 59 42.10 3 37.5 11 36.7 27 35.10 13 39.4 4 44.4 4 44.4 121 39.50
TOTAL 140 100.00 8 100.00 30 100.00 77 100.00 33 100.00 9 100.00 9 100.00 306 100.00
151
Similar pattern was observed for those who studied up to SSC. Out of 50 women from
this category who had borrowed from the groups 19 women had borrowed for income
generating activities. This was closely followed by 14 women who borrowed for
consumption needs and 12 women who borrowed for educational needs. Remaining
women borrowed for marriage (3), medical expenses (1) and the repayment of earlier
debts (1).
There were 33 women who had passed SSC examination. Out of them largest number
of women i.e. six had borrowed for income generating activities. This was closely
followed by five women each who borrowed for education and consumption
purposes. From this category two women each borrowed for medical expenses and
house repair.
There were only 18 women who had studied beyond SSC. The borrowing pattern of
these women was found to be mixed and spread over the requirements primarily on
income generating activities, consumption and education and followed by medical
expenses, marriage, house repair and repayment of earlier loans. Thus it was observed
that the pattern of borrowing as per the educational status followed the overall pattern
of purpose of loans.
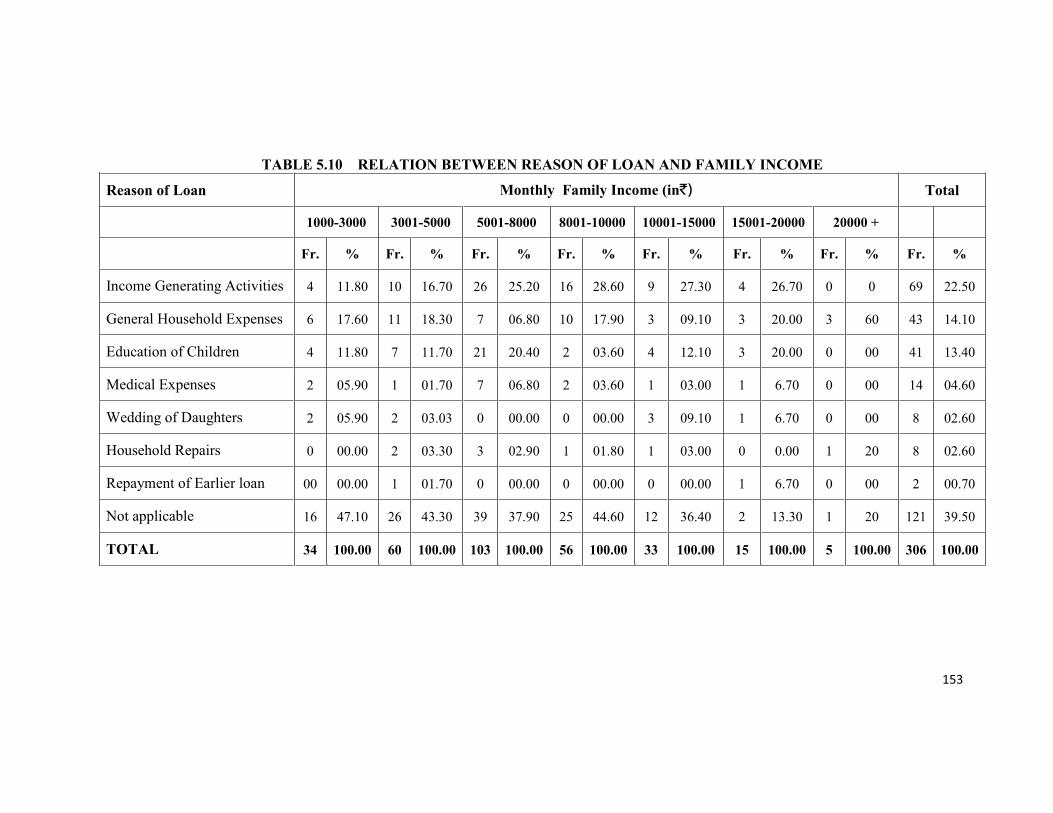
5.4.5 RELATION BETWEEN REASON OF LOAN AND FAMILY INCOME
Table 5.10 explains the relation between the purpose of borrowings and monthly
family income of the respondents
152
This table exhibits the relation between monthly family income of the respondents
and the reason of their SHG loan. There were 34 women with family income of up to
` 3000. From this category largest number of women borrowed for consumption
needs. This was followed by four women each who borrowed for educational needs
and for starting income generating activities. There were 2 women from this category
who borrowed for medical expenses.
There were 60 women who had family income in the range of ` 3001 to ` 5000.
From among them the largest number of women i.e. 11 borrowed for consumption
needs, closely followed by 10 women who borrowed for income generating activities.
There were seven women form this category who borrowed for educational needs ,
two women each borrowed for marriage expenses and house repair and one each who
borrowed for medical expenses and repayment of earlier loans. There were 26 women
from this category who had not availed of borrowing from the groups.
There were 103 women who had family income in the range of ` 5001 to ` 8000.
From among them largest number of women i.e. 26 borrowed for starting income
generating activities. This was followed by 21 women who borrowed for educational
needs. There were 7 women each from this category who borrowed for medical
expenses and consumption needs, followed by 3 women who borrowed for house
repairs. Thus in all there were 197 respondents with family income up to `8000 per
month. This is 64% of the total respondents. Out of them more than 40 respondents
borrowed for starting income generating activity. This constitutes more than 50% of
total respondents who borrowed to start income generating activity.
153
TABLE 5.10 RELATION BETWEEN REASON OF LOAN AND FAMILY INCOME
Reason of Loan Monthly Family Income (in`) Total
1000-3000 3001-5000 5001-8000 8001-10000 10001-15000 15001-20000 20000 +
Fr. % Fr. % Fr. % Fr. % Fr. % Fr. % Fr. % Fr. %
Income Generating Activities 4 11.80 10 16.70 26 25.20 16 28.60 9 27.30 4 26.70 0 0 69 22.50
General Household Expenses 6 17.60 11 18.30 7 06.80 10 17.90 3 09.10 3 20.00 3 60 43 14.10
Education of Children 4 11.80 7 11.70 21 20.40 2 03.60 4 12.10 3 20.00 0 00 41 13.40
Medical Expenses 2 05.90 1 01.70 7 06.80 2 03.60 1 03.00 1 6.70 0 00 14 04.60
Wedding of Daughters 2 05.90 2 03.03 0 00.00 0 00.00 3 09.10 1 6.70 0 00 8 02.60
Household Repairs 0 00.00 2 03.30 3 02.90 1 01.80 1 03.00 0 0.00 1 20 8 02.60
Repayment of Earlier loan 00 00.00 1 01.70 0 00.00 0 00.00 0 00.00 1 6.70 0 00 2 00.70
Not applicable 16 47.10 26 43.30 39 37.90 25 44.60 12 36.40 2 13.30 1 20 121 39.50
TOTAL 34 100.00 60 100.00 103 100.00 56 100.00 33 100.00 15 100.00 5 100.00 306 100.00
154
The number of women who had family income in the range of ` 8001 to ` 10000 was
56. From among them also largest number of women i.e. 16 borrowed for income
generating activities. This was followed by 10 women who borrowed for consumption
needs. There were two women each who borrowed for educational expenses and
medical expenses and only one woman from this category borrowed for house repair.
There were 48 women who had family income of ` 10001 to ` 20,000 per month.
From among them 13 respondents borrowed to start some income generating activity.
There were only five women with monthly income of more than ` 20,000. Those
having comparatively higher monthly family income mainly borrowed for the
education of their children, house repair and for general household expenses.
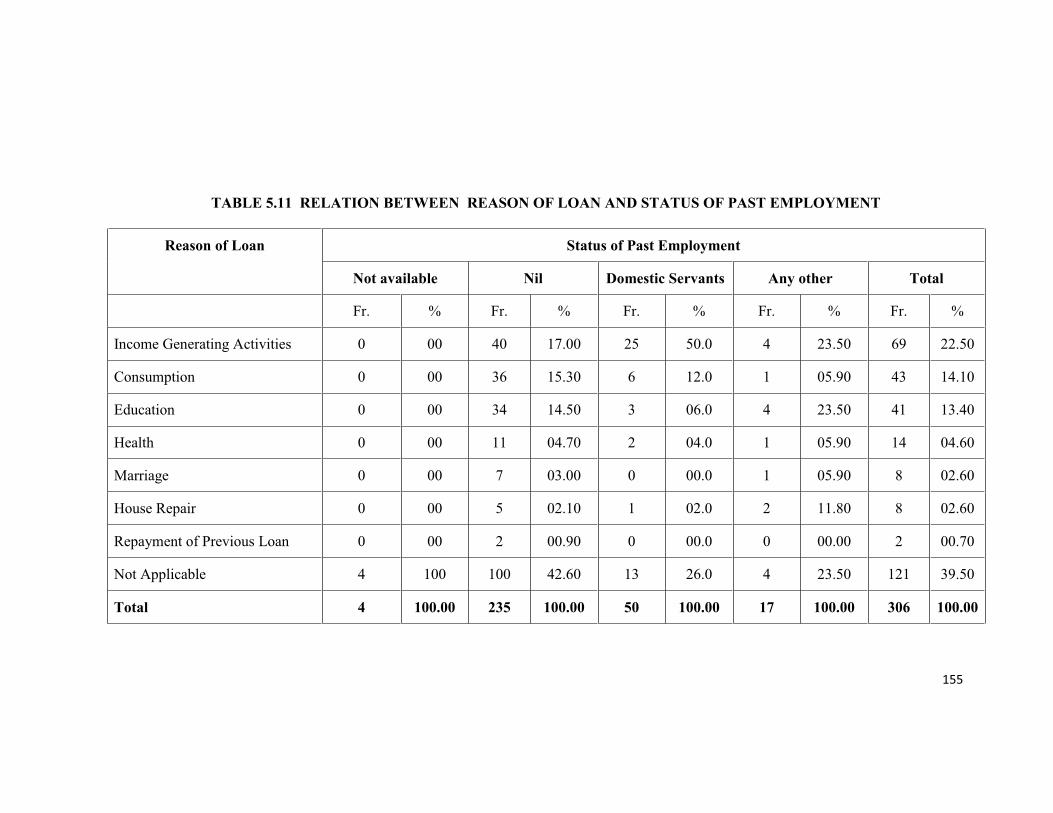
5.4.6 RELATION BETWEEN REASON OF LOAN AND PAST
EMPLOYMENT
Past employment status describes the work the respondents were doing prior to start
their own income generating activity. Table 5.11 describes the relation between the
category indicates those women who did not borrow from the groups. category
indicates those women who were not working earlier. It is noteworthy that a large
majority i.e. 50% of the women who were earlier working as domestic servants,
borrowed from the groups to start some income generating activity in the form of
small business. It helps us to understand the impact of microfinance on economic
empowerment of respondents. Around 24% of those women who were earlier
working as causal workers etc. borrowed from the group to start their own business.
155
TABLE 5.11 RELATION BETWEEN REASON OF LOAN AND STATUS OF PAST EMPLOYMENT
Reason of Loan Status of Past Employment
Not available Nil Domestic Servants Any other Total
Fr. % Fr. % Fr. % Fr. % Fr. %
Income Generating Activities 0 00 40 17.00 25 50.0 4 23.50 69 22.50
Consumption 0 00 36 15.30 6 12.0 1 05.90 43 14.10
Education 0 00 34 14.50 3 06.0 4 23.50 41 13.40
Health 0 00 11 04.70 2 04.0 1 05.90 14 04.60
Marriage 0 00 7 03.00 0 00.0 1 05.90 8 02.60
House Repair 0 00 5 02.10 1 02.0 2 11.80 8 02.60
Repayment of Previous Loan 0 00 2 00.90 0 00.0 0 00.00 2 00.70
Not Applicable 4 100 100 42.60 13 26.0 4 23.50 121 39.50
Total 4 100.00 235 100.00 50 100.00 17 100.00 306 100.00
156
Almost 40 women who were not working earlier borrowed to start their small
business. Four women did not disclose their earlier work status. Among those who
were not working earlier 3% borrowed for marriage in the family, 14.5% for the
education of their children, 5% for health purposes, 2% for the repair of their houses
and 1% for the repayment of earlier loans.
5.5 ROLE OF SHGs IN SUPPORTING ECONOMIC CONDITIONS
The SHGs have played a very important role in supporting the economic conditions of
the members. The thrust of SHGs is on two major activities viz. savings and loans.
Both were very important for the respondents.
5.5.1 ROLE OF SAVINGS
As mentioned earlier the SHGs to which the respondents belonged were formed
during 2005 to 2010. There were five groups that were engaged only in saving
activities. Each respondent of those groups shared that the regular saving was an
extremely important part of their routine. Those who were earning found that the
regular saving activity gave them some kind of security and stability. For those who
were not engaged in any activity also shared that the regular savings enabled them to
have a glimpse of hope to improve their condition. There was a steady increase in the
savings balance of all the groups. All the respondents reported that they were very
keen to remain members of their SHGs and continue to save regularly. They were all
aware of the need to build up savings without any interruption. This they all
considered as a starting point towards ensuring a better future for themselves.
157
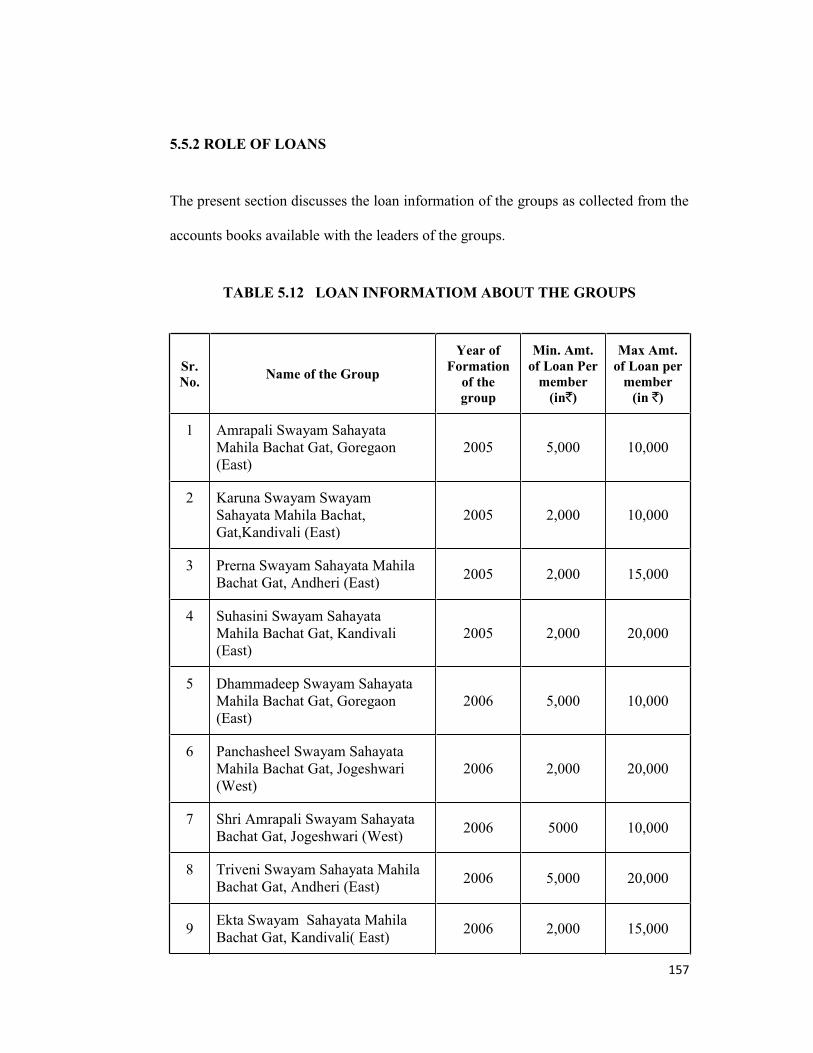
5.5.2 ROLE OF LOANS
The present section discusses the loan information of the groups as collected from the
accounts books available with the leaders of the groups.
TABLE 5.12 LOAN INFORMATIOM ABOUT THE GROUPS
Sr.
No. Name of the Group
Year of
Formation
of the
group
Min. Amt.
of Loan Per
member
(in`)
Max Amt.
of Loan per
member
(in `)
1 Amrapali Swayam Sahayata
Mahila Bachat Gat, Goregaon
(East)
2005 5,000 10,000
2 Karuna Swayam Swayam
Sahayata Mahila Bachat,
Gat,Kandivali (East)
2005 2,000 10,000
3 Prerna Swayam Sahayata Mahila
Bachat Gat, Andheri (East) 2005 2,000 15,000
4 Suhasini Swayam Sahayata
Mahila Bachat Gat, Kandivali
(East)
2005 2,000 20,000
5 Dhammadeep Swayam Sahayata
Mahila Bachat Gat, Goregaon
(East)
2006 5,000 10,000
6 Panchasheel Swayam Sahayata
Mahila Bachat Gat, Jogeshwari
(West)
2006 2,000 20,000
7 Shri Amrapali Swayam Sahayata
Bachat Gat, Jogeshwari (West) 2006 5000 10,000
8 Triveni Swayam Sahayata Mahila
Bachat Gat, Andheri (East) 2006 5,000 20,000
9 Ekta Swayam Sahayata Mahila
Bachat Gat, Kandivali( East) 2006 2,000 15,000
158
10 Bhimai Swayam Sahayata Mahila
Bachat Gat,Andheri (East) 2007 2000 5000
11 Ekta Swayam Sahayata Mahila
Bachat Gat, Andheri Kurla Road,
Andheri (East)
2007 2000 20,000
12 Mahata Ramai Swayam Sahayata
Mahila Bachat Gat, Marol,
Andheri (East)
2007 2,000 15,000
13 Sant Rohidas Swayam Sahayata
Mahila Bachat Gat, Andheri
(West)
2007 2,000 25,000
14 Sujata Swayam Sahayata Mahila
Bachat Gat, Santosh Nagar
Goregaon (East)
2007 2,000 20,000
15 Karuna Swayam Sahayata Mahila
Bachat Gat,Vikroli 2008 5,000 10,000
16 Nari shakti Swayam Sahayata
Mahila Bachat Gat, Chembur 2008 5,000 10,000
17 Riddhi Swayam Sahayata Mahila
Bachat Gat, Jogeshwari (West) 2008 2,000 10,000
18 Sparkle Swayam Sahayata Mahila
Bachat Gat, Chembur 2008 5,000 15,000
19 Vrindavan Swayam Sahayata
Mahila Bachat Gat, Chembur 2008 5,000 10,000
20 Mahata Ramai Swayam Sahayata
Mahila Bachat Gat, Malwani,
Malad (West)
2009 NIL NIL
21 Kalpavruksh Swayam Sahayata
Mahila Bachat Gat, Chembur 2009 2,000 10,000
22 Kranti Swayam Sahayata Mahila
Bachat Gat, Goregaon
(East)
2009 2,000 5,000
23 Mahila Vikas Swayam Sahayata
Bachat Gat Goregaon (East) 2009 NIL NIL
159
24 Mira Swayam Sahayata Mahila
Bachat Gat, Goregaon (West) 2009 NIL NIL
25 Sambodhini Swayam Sahayata
Mahila Bachat Gat, Chembur 2009 5,000 10,000
26 Savitribai Swayam Sahayata
Mahila Bachal Gat, Goregaon
(East)
2009 NIL NIL
27 Vandana Swayam Sahayata
Mahila Bachat Gat, Jogeshwari
(West)
2009 5,000 10,000
28 Varsha Swayam Sahayata Mahila
Bachat Gat, Chembur 2009 2,000 15,000
29 Ahilya Swayam Sahayata Mahila
Bachat Gat, Jogeshwari (West) 2010 2,000 10,000
30 Bismillah Swayam Sahayata
Mahila Bachat Gat Film city
Goregaon (East)
2010 5,000 5,000
31 Khwaza Garib Nawaz Swayam
Sahayata Mahila Bachat Gat,
Goregaon (East)
2010 5,000 5,000
32 Swabhimani Mahila Swayam
Sahayata Bachat Gat, Goregaon
(East)
2010 NIL NIL
33 Yellamma Swayam Sahayata
Mahila Bachat Gat, Goregaon
(East)
2010 3,000 5,000
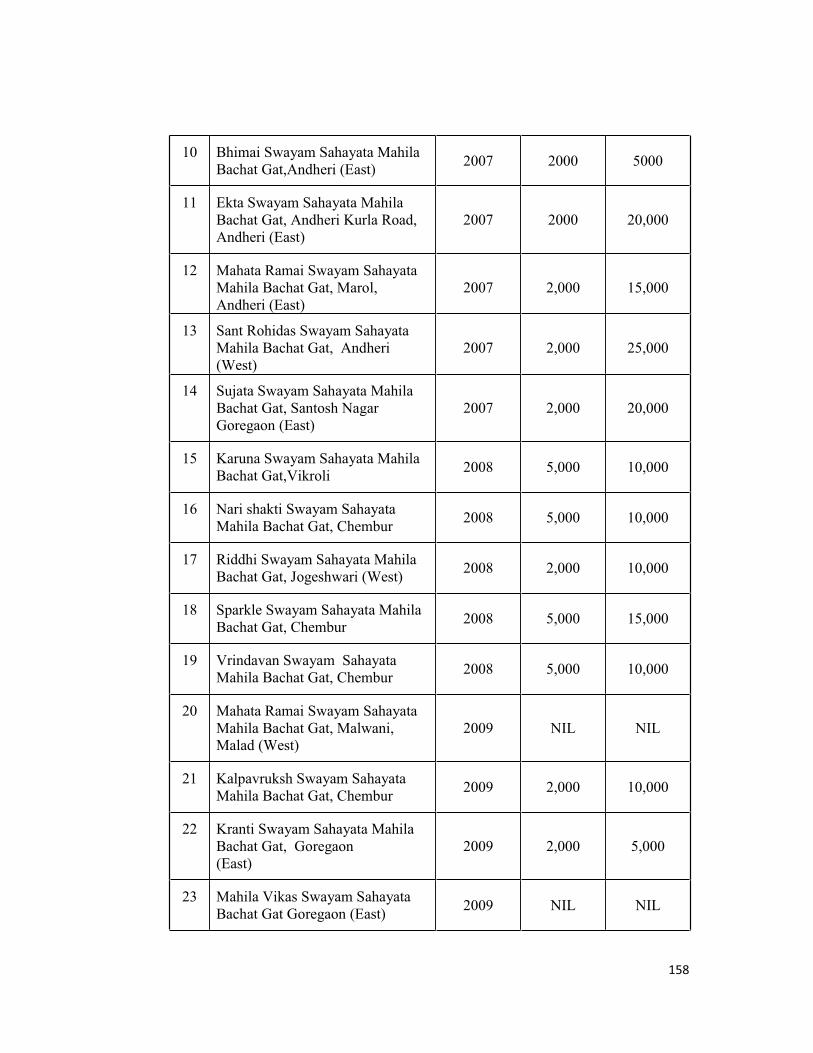
The above table presents very interesting information about the extent of loans
sanctioned by the groups to their members. The minimum amount disbursed by the
groups per member as well as the maximum amount lent has been mentioned in the
table. There were four groups which were formed in the year 2005 and therefore they
160
were the oldest groups covered in the study. The minimum amount ranged between
`2000 to `5000 whereas the maximum amount was between `10,000 to `20,000.
Five groups were formed in the year 2006. In case of these groups also it was found
that the minimum amount of loan disbursed was between `2000 to `5000 whereas the
maximum amount was between `10,000 to `20,000.
There were five groups that were established in 2007. The minimum amount for each
of the group was uniform i.e. `2000. The maximum amount ranged between `10,000
to `25,000. It was on account of catering to the diverse needs of the members by these
groups. These were primarily for income generating activities as well as for
consumption needs.
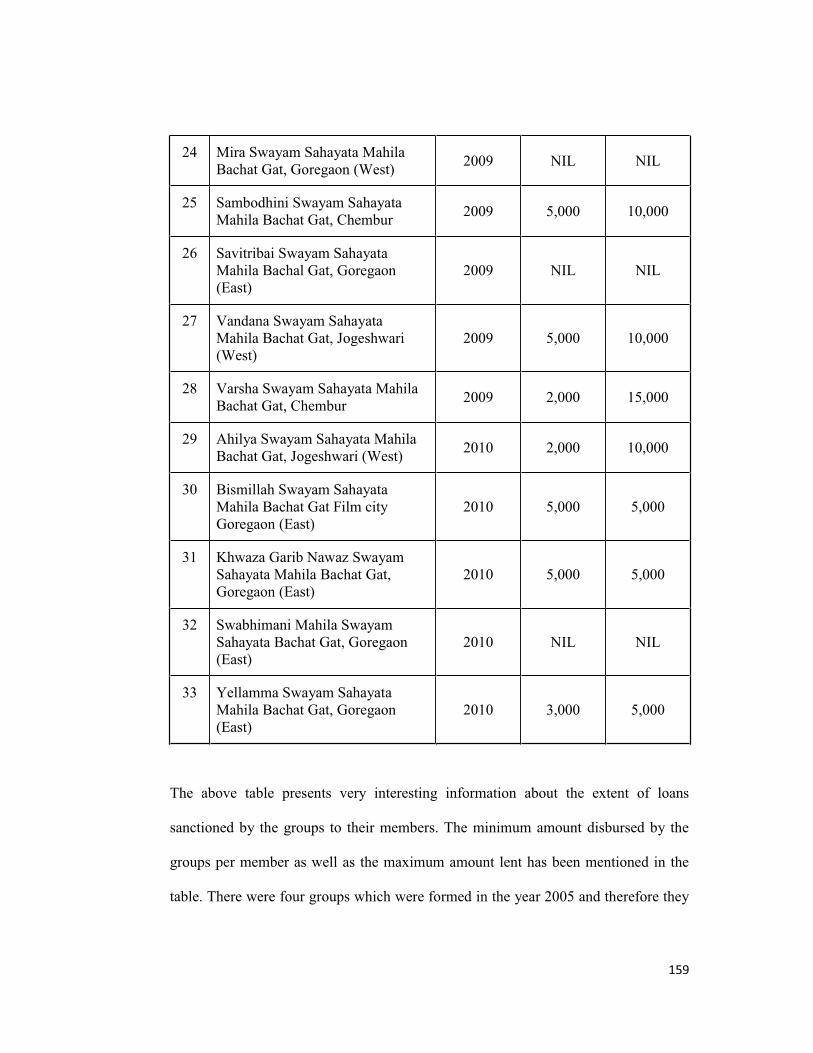
Five groups were formed in 2008. Though the minimum amount of loan was reported
between `2000 to `5000 it was observed that for four groups it was `5000 and only
for one group it was `2000. The maximum amount was `10,000 for four groups and
`15,000 for one group.
There were nine groups that were formed in 2009. At the time of collecting data it
was found that four groups had not disbursed any loans. However all these groups had
recorded steady savings by the members. There were five groups that were formed in
2010. Out of these groups only one group had not started lending operations. The
minimum amount lent per member by these groups was between `2000 to `5000 and
the maximum amount was between `5000 to `10,000.
161
All the members who had borrowed for above ` 10,000 had done so for income
generating activities. There were five groups each who had given loans to the extent
of ` 15,000 and ` 20,000. There was only one group that had given up to ` 25,000.
It was observed that women had formed a very close bond with their groups. The
groups had helped the members to reduce their dependence on the external sources of
loan considerably. The older groups went on expanding their savings base. With
larger savings the frequency of loans also increased. Thus timely loans were made
available to the members.
Over the period of time the groups were stabilised and they could also borrow from
the banks in which they had accounts. The sources of external loans were NGOs. The
NGO with respect to external funding of the groups was Rotary Club, Mumbai.
There were four groups which had received loans from the banks. These were
Yellamma Swayam Sahayata Mahila Bachat Gat, Sant Rohidas Swayam Sahayata
Mahila Bachat Gat, Varsha Swayam Sahayata Mahila Bachat Gat and Vasti Vikas
Samiti. Other than these there were three groups which had already applied for bank
loans. These were Khwaza Garib Nawaz Swayam Sahayata Mahila Bachat Gat,
Mahata Ramai Swayam Sahayata Mahila Bachat Gat and Bismillah Swayam Sahayata
Mahila Bachat Gat.
There were four groups which received external loans for initiating income generating
activities from Rotary Club, Mumbai. These groups were Prerna Swayam Sahayata
Mahila Bachat Gat, Triveni Swayam Sahayata Mahila Bachat Gat, Sant Rohidas
Swayam Sahayata Mahila Bachat Gat and Vasti Vikas Samiti consisting of one
162
member each from Vrindavan Swayam Sahayata Mahila Bachat Gat Nari Shakti
Swayam Sahayata Mahila Bachat Gat and Sambodhini Swayam Sahayata Mahila
Bachat Gat and two members from Sparkle Swayam Sahayata Mahila Bachat Gat.
The loans which were received from Rotary Club did not require the payment of
installments for the first three months. Thereafter the borrowers were required to pay
some amount from the principal in the form of installments.
Thus it was observed that both the savings as well as lending activities of the groups
played an extremely important role in supporting economic activities of the
respondents. The members were in a position to save on a regular basis. Timely loans
for various consumption needs were extremely important for them. This also reduced
their dependence on the money lenders. The interest on SHG loans being
comparatively less than the money lenders the loans were further instrumental in
saving in terms of interest. A move towards further enhancement of economic
conditions has already begun by way availing loans for income generating activities.
The largest numbers of loans were taken for income generating activities. Thus both
saving and lending by SHGs have enabled the members to gain some security.
5.6 SUMMARY
The present chapter focused on the borrowing behavior of the respondents. It has
highlighted the role of SHGs with respect to savings and credit operations. Majority
of the members availed loans from the group while some were content with savings
and some others could not borrow as the groups were in the initial stages of
formation. Even those women who had still not borrowed from the groups appreciated
163
the fact that they could save some amount of money after becoming members of the
SHGs. It helped in raising their self esteem.
Interest rates on SHG loans as reported by the members were less than interest rates
charged by the money lenders. However, compared to the interest rates charged by
sources other than money lenders, SHG loans were not cheap. Majority of the
members borrowed loans in the amounts of ` 5000 and ` 10, 000. In the instance of
loans arranged from NGOs they could also borrow up to ` 20,000 or more. However,
in some cases the groups also allowed some members to borrow more than ` 20,000
depending upon the need and circumstances of the members.
The study also revealed that majority of the members had borrowed only once from
the group. It is noteworthy that almost 40% of the borrowers utilised the loans to start
income generating activities. Remaining borrowers used the loans for risk situations
like illnesses, marriages, repayment of earlier loans house repairs and for the payment
of school or college fees or tuition fees of their children.
Thus, it can be concluded that SHG loans helped the women from vulnerable sections
of the society, enabling them to deal with risk situations of various types and also
helping some of them to become economically empowered.