comparison of the ramp versus standard exercise protocols · comparison of the ramp versus standard...
TRANSCRIPT
1334 JACC Vol. 17, No.6 May 1991: 1334-42
Comparison of the Ramp Versus Standard Exercise Protocols
JONATHAN MYERS, PHD, NANCY BUCHANAN, BS, DOUG WALSH, BS,
MARK KRAEMER, MD, PAUL McAULEY PHD, MARIANTHA HAMILTON-WESSLER, MA,
VICTOR F. FROELICHER, MD, FACC
Long Beach, California
To compare the hemodynamic and gas exchange responses of ramp treadmill and cycle ergometer tests with standard exercise protocols used clinically, 10 patients with chronic heart failure, 10 with coronary artery disease who were asymptomatic during exercise, 11 with coronary artery disease who were limited by angina during exercise and 10 age-matched normal subjects performed maximal exercise using six different exercise protocols. Gas exchange data were collected continuously during each of the following protocols, performed on separate days in randomized order: Bruce, Balke and an individualized ramp treadmill; 25 W/stage, 50 W/stage and an individualized ramp cycle ergometer test.
Maximal oxygen uptake was 16% greater on the treadmill protocols combined (21.4 ± 8 mIlkg per min) versus the cycle ergometer protocols combined (18.1 ± 7 ml/kg per min) (p < 0.01), although no differences were observed in maximal heart rate (131 ± 24 versus 126 ± 24 beats/min for the treadmill and cycle ergometer protocols, respectively). No major differences were observed in maximal heart rate or maximal oxygen uptake among the various treadmill protocols or among the various cycle
Graded exercise testing is routinely performed to assess exercise capacity in patients with cardiovascular disease. When treadmill and cycle ergometer testing were first introduced into clinical practice, practioners adopted protocols used by major researchers, that is, Balke (1), Astrand (2), Bruce (3) and Ellestad (4) and their coworkers. Comparisons among treadmill protocols have suggested that similar hemodynamic results can be obtained (5,6) and comparisons between cycle ergometry and treadmill testing have demonstrated that maximal oxygen uptake is 10% to 20% higher when testing with a treadmill. These findings imply that the cycle ergometer has inherent limitations for assessing functional capacity. The clinical advantages and disadvantages of
From the Cardiology Section. Long Beach Veterans Affairs Medical Center, Long Beach. California. This study was supported in part by the Burdick Corporation. Milton. Wisconsin.
Manuscript received August 22. 1990; revised manuscript received November 5. 1990. accepted November 21. 1990.
Address for reprints: Victor F. Froelicher. MD. Cardiology OliO. Long Beach Veterans Affairs Medical Center. 5901 East Seventh Street. Long Beach. California 90822.
©1991 by the American College of Cardiology
ergometer protocols. The ratio of oxygen uptake to work rate, expressed as a slope, was highest for the ramp tests (slope ± SEE ml/kg per min = 0.80 ± 2.5 and 0.78 ± 1.7 for ramp treadmill and ramp cycle ergometer, respectively). The slopes were poorest for the tests with the largest increments in work (0.62 ± 4.0 and 0.59 ± 2.8 for the Bruce treadmill and 50 W/stage cycle ergometer, respectively).
Normal subjects demonstrated a greater slope (0.71 ± 4.2) than did patients with chronic heart failure (0.53 ± 2.8), coronary artery disease (0.51 ± 2.6) and angina (0.53 ± 3.1) (p < 0.001). The difference between measured and predicted maximal oxygen uptake was greatest for the tests with the largest increments between stages (> 1 metabolic equivalent (MET) for the Bruce treadmill and 50 W/stage cycle ergometer) and least for the tests with the smallest increments between stages (ramp tests and 25 W/stage cycle ergometer). These findings suggest that the exercise protocol, even when the same mode is used, can result in marked variations in maximal oxygen uptake and the dynamics of gas exchange during exercise testing.
(J Am Coll CardioI1991;17:1334-42)
various exercise testing modes and protocols have been described by several investigators (2,5-10).
In addition to the exercise mode and protocol, the work rate pattern during exercise testing has also been considered. Buchfuhrer et al. (10) reported that maximal oxygen uptake among normal subjects varies with the increment in work; the highest values were observed when intermediate work increments were employed. These investigators suggested that an optimal exercise test would be individualized to yield an exercise time of approximately 10 min. Work rate increments that are too large result in a reduced exercise capacity in patients with exertional angina and are not reliable for studying the effects of therapy (11). Lipkin et al. (12), on the other hand, observed that, among patients with chronic heart failure, small work increments yielding a long test duration (31 ± 15 min) resulted in a reduced maximal oxygen uptake. minute ventilation and arterial lactate compared with values in tests using more standard increments. The Bruce protocol, used by more than half of clinicians in North America (13), contains large and unequal work increments, which have been shown to result in a nonlinear relation between oxygen uptake and work rate (14,15). Thus, it is
0735-1097/91/$3.50

JACC Vol. 17. No.6 May 1991: 1334-42
Table 1. Clinical Characteristics of Each Subgroup
MYERS ET AL. 1335 RAMP VERSUS STANDARD EXERCISE TESTING
Medications
No. of Age (yr)/ Ejection Calcium Channel Beta-Adrenergic Antiarrhythmic Patients Gender Fraction (%) MI PTCA CABS Blockers Blockers Nitrates Digoxin Agents
CAD 10 59 ± 5M 5 (50) 4 (40) 3 (30) 7 (70) 5 (50) 7 (70) 0 2 (20) CHF 10 57 ± 8M 27 ± 11 5 (50) 0 I (10) 3 (30) 2 (20) 3 (30) 4 (40) 7 (70) Angina II 63 ± 5M 50 ± 12 6 (54) 2 (18) 2 (18) 9 (82) 6 (54) 8 (73) 0 0 Normal 10 62 ± 7M 0 0 0 0 9 (0) 0 0 0
*Indicates that this measurement was not made. Age and ejection fraction are mean values ± SD. Parentheses denote percentage. CABS = history of coronary artery bypass surgery; CAD = coronary artery disease; CHF = chronic heart failure; M = male; MI = history of myocardial infarction; PTCA = history of percutaneous transluminal coronary angioplasty.
inappropriate for some patients; in addition, it reduces the accuracy with which ventilatory oxygen uptake is predicted from time or work load. Reduced oxygen kinetics have been observed in patients with heart disease compared with normal subjects using the Bruce protocol (14) and others (16).
Ramp protocols offer a means of overcoming the limitations of standard incremental protocols. The ramp exercise test avoids sudden alterations in neuromuscular motor unit recruitment or metabolic changes associated with incremental protocols by employing a constant and continuous increase in external work. Whipp et al. (17) observed high reproducibility in oxygen uptake on different days and a first-order linear relation between oxygen uptake and work rate even at high levels of exercise using a ramp cycle ergometer protocol. Recently our laboratory developed a computer program to individualize ramp rates based on exercise capacity for treadmill and cycle ergometer tests (18,19) to achieve an "optimal" (10,20) test duration of9 to 10 min. Maximal oxygen uptake was highly reproducible on individualized tests lasting a mean of 9.1 ± 1 min among subjects whose exercise capacity varied greatly (21).
The differences in measurements of maximal oxygen uptake and gas exchange dynamics during exercise, attributed previously to disease, mode of exercise and work increment, stimulated our interest in performing a systematic comparison of the ramp treadmill and cycle ergometer tests with standard clinical exercise protocols.
Methods Study subjects (Table 1). Forty-one men (mean age 61 ±
7 years) participated in the study. They were recruited to fit into four groups: 10 patients with angiographically documented coronary artery disease who were not limited by angina during exercise, 11 patients with coronary artery disease who were limited by angina during baseline treadmill testing, 10 patients with chronic heart failure documented by clinical history and a left ventricular ejection fraction at rest <40% and 10 age-matched normal subjects. Clinical characteristics of the subjects are presented in Table 1. All rights and privileges were honored in accordance with an estab-
lished human subject protocol and informed consent was obtained.
Exercise testing. Each subject performed six exercise tests in randomized order on different days. Subjects continued their usual medications but were requested to abstain from food, coffee and cigarettes for at least 3 h before testing. The following treadmill protocols were employed: 1) standard Bruce; 2) modified Balke (2.0 mph/O% grade for the first 2 min stage, increasing to 3.0 mph/O% grade for the second stage, followed by 2.5% increments in grade each stage thereafter); and 3) an individualized ramp treadmill test, with the ramp rate set to elicit a test duration of approximately 10 min. The cycle ergometer protocols used were: l) 25 W per 2 min stage, 2) 50 W per 2 min stage, and 3) an individualized ramp cycle ergometer test with the ramp rate set to elicit a test duration of approximately 10 min. The ramp rates for the treadmill and cycle ergometer were determined by considering each subject's maximal oxygen uptake during a baseline test. The patient's subjective level of exertion was qualified using the Borg 6-20 scale (22). In the absence of chest pain, all tests were continued to volitional fatigue/dyspnea. In patients limited by angina, exercise was discontinued with the attainment of moderately severe angina (rating of 3 on a 1 to 4 scale) (23).
Respiratory gas exchange variables were determined continuously throughout the exercise test using the Medical Graphics Corporation 2001 system. Validation procedures on this system were performed in accordance with those outlined by Jones and Campbell (24). Gas exchange variables analyzed were; oxygen uptake (mllkg per min, STPD); carbon dioxide production (liters/min, STPD); minute ventilation (liters/min, BTPS); oxygen pulse (oxygen uptake mllmin divided by heart rate); and respiratory exchange ratio (carbon dioxide production divided by oxygen uptake). The ventilatory threshold was determined by three independent observers who had no knowledge of other data, as outlined by Sullivan et al. (25).
Statistics. All data were entered into a Lotus 1-2-3 spreadsheet that calculated means and standard deviations. The Statistical Graphics program was used to determine regression lines between oxygen uptake and work rate for each subgroup and each protocol. The external work rates
1336 MYERS ET AL. RAMP VERSUS STANDARD EXERCISE TESTING
JACe Vol. 17, No.6 May 1991: 1334-42
Table 2. Hemodynamic and Gas Exchange Data (mean ± I SD) at the Ventilatory Threshold for the Six Exercise Protocols
Treadmill Bicycle
Bruce Balke Ramp 25 W 50 W Ramp
Heart rate (beats/min) 104 ± 18 100 ± 16 99 ± 15 94 ± 17 93 ± 16 98 ± 20 Oxygen uptake (ml/kg per min) 14.7 ± 4* 14.0 ± 4* 12.8 ± 3' 10.4 ± 3.4 10.5 ± 3 10.6 ± 3 % of maximal oxygen uptake 68% 71% 64% 60% 60% 61% Minute ventilation (liters/min. BTPS) 37.2 ± 9t 36.6 ± lit 31.7 ± 7' 30.3 ± 9 28.7 ± 7 30.8 ± 7 Carbon dioxide production 1.080 ± 0.36* 1.019 ± 0.39* 0.8900 ± 0.24* 1.040 ± 0.12 1.028 ± 0.13 0.857 ± 0.22
(liters/min. STPD) Respiratory exchange ratio 0.85 ± 0.09* 0.86 ± 0.1 * 0.83 ± 0.08* 0.93 ± 0.12 0.93 ± 0.08 0.93 ± 0.08 Perceived exertion 10.0 ± 3 11.2±2 10.4 ± 2 11.4 ± 3 10.4 ± 2 10.4 ± 3
*Significantly different from bicycle tests (p < 0.05). tSignificantly different from other tests of the same mode (p < 0.05). 25 W = 25 W/2 min stage cycle ergometer test; 50 W = 50 W/2 min stage cycle ergometer test.
were calculated using equations commonly applied for predicting oxygen uptake from treadmill and cycle ergometer work (26). Student's t tests for paired observations were used to evaluate differences between measured and predicted maximal oxygen uptake. MANOVA with Tukey post-hoc range testing was performed to evaluate hemodynamic and gas exchange responses between subgroups and protocols.
Results Hemodynamic and gas exchange variables. Hemodynamic
and gas exchange variables observed from each of the six exercise protocols for the ventilatory threshold and maximal exercise are presented in Tables 2 and 3, respectively. Maximal oxygen uptake for each of the treadmill and cycle ergometer protocols for each subgroup is presented using box plot illustrations in Figures I and 2, respectively. The slopes of measured oxygen uptake regressed with work rate for each protocol among all subjects are presented in Table 4. These relations are presented for each subgroup in Table 5. The slopes for the ramp and Bruce treadmill tests for patients with chronic heart failure are contrasted in Figure 3. Figure 4 contrasts measured and predicted maximal oxygen uptake for each protocol.
Reasons for stopping exercise. Normal SUbjects, patients with coronary artery disease and those with chronic heart failure were limited by fatigue, leg fatigue or shortness of breath on 94% of exercise tests performed. The remaining end points included chest discomfort (3%), light-headedness (2%) and hip pain (one test). Maximal perceived exertion among these subjects was 19.2 ± I and the maximal respiratory exchange ratios for each protocol ranged from 1.13 ± O. IO to 1.29 ± 0.15 (Table 3). These values suggest that maximal effort was generally achieved for all groups in each protocol.
Patients who were limited by angina at baseline testing, although limited by angina on 93% of treadmill tests, were limited by leg fatigue before the angina end point on 26% of cycle ergometer tests. The type of treadmill (Balke, Bruce or ramp) or cycle ergometer test (25 W/stage, 50 W/stage or ramp) did not appear to affect the exercise end points in these patients.
Treadmill versus cycle ergometer protocol. A main effect was observed due to mode of exercise (treadmill versus cycle ergometer) for maximal oxygen uptake (21.4 ± 8 vs. 18.1 ± 7 mIlkg per min for the treadmill and cycle ergometer, respectively; p < 0.01). Maximal heart rate, however, did not differ between the treadmill (131 ± 24 beats/min) and cycle ergometer (126 ± 24 beats/min) protocols collectively.
Table 3. Hemodynamic and Gas Exchange Data (mean ± I SD) at Maximal Exercise for the Six Exercise Protocols
Treadmill Bicycle
Bruce Balke Ramp 25W SOW Ramp
Heart rate (beats/min) 134 ± 25 131 ± 25 130 ± 24 124 ± 26 127± 33 128 ± 25 Systolic blood pressure (mm Hg) 171 ± 28 172 ± 25 179 ± 24 181 ± 25 185 ± 22 185 ± 24 Diastolic blood pressure (mm Hg) 86 ± 14 85 ± lJ 85 ± 15 87 ± 23 88 ± II 89 ± 13 Test duration (min) 6.6 ± 1.5 10.4 ± 3.4 9.1 ± 1.4 10.3 ± 2.2 7.1 ± 1.1 9.4 ± 0.8 Oxygen uptake (ml/kg per min) 22.3 ± st 21.1 ± 8 21.0 ± 8 17.7 ± 7* 18.1 ± 7 18.5 ± 7 Minute ventilation (liters/min. BTPS) 83.2 ± 30 72.8 ± 24 n.1 ± 27 68.6 ± 27 69.9 ± 23 71.9 ± 27 Carbon dioxide production (liters/min. 2.363 ± 1.0 2.018 ± 0.84 2.044 ± 0.94 1.910 ± 0.84 1.951 ± 0.75 1.930 ± 0.89
STPD) Respiratory exchange ratio 1.26 ± 0.15* 1.13±0.lt 1.14 ± 0.12t 1.21 ± 1.2t 1.29 ± 0.14t 1.23 ± 0.12 Perceived exertion 19.0 ± I 19.4 ± I 19.5 ± I 19.3 ± I 19.0 ± I 19.2 ± 2
*Significantly different from bicycle tests (p < 0.05); tSignificantly different from other tests of the same mode (p < 0.05). 25 w = 25 W/2 min stage cycle ergometer test; 50 W = 50 W/2 min stage cycle ergometer test.
lACC Vol. 17. No.6 MYERS ET AL. 1337 May 1991: 1334-42 RAMP VERSUS STANDARD EXERCISE TESTING
BALKE BRUCE RAMP ..... c 60 e •• .... 01 •• • 0 .x 0 0 ....
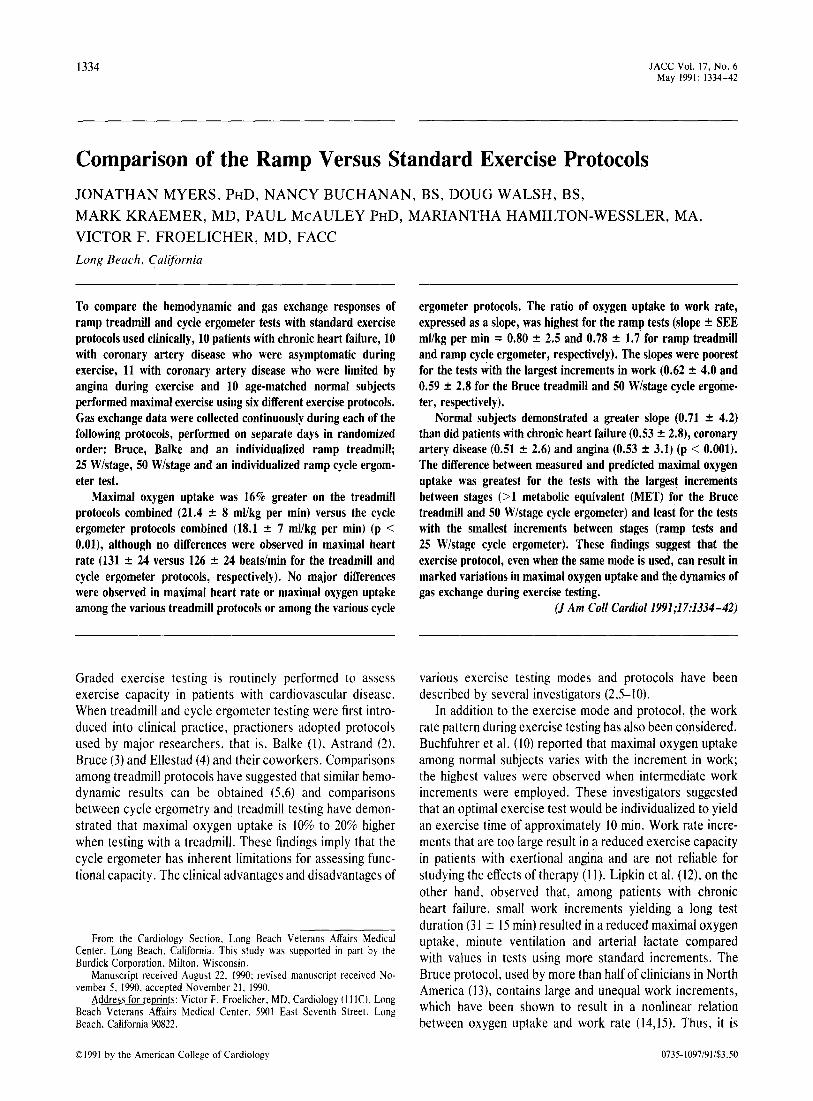
Figure 1. Box plots of maximal oxygen uptake on e 45 each treadmill protocol for each subgroup. Each large box represents 50% of the data; the horizon- IU
x tal line within the box = median; the top and <C
~ 0
~ ~ 0
~ bottom of the box represent upper and lower 11.
quartiles, respectively; the vertical lines represent :::) 30
~ Z 0 range; the small boxes represent outlying data IU
8 6 ~ points for each subgroup. *p < 0.01 versus the ~ 8 ~ ~
>
9 ~ other groups for a given protocol; **p < 0.01 )(
versus angina (AN G) and coronary artery disease 0 15
(CAD) groups. CHF = chronic heart failure; ..... <C
NORM = normal. ~ )(
<C 0 ~ I I
ANG CHF ANG CHF ANG CHF
Likewise, no differences were observed in systolic or diastolic blood pressure between exercise modes.
Treadmill tests. With all subgroups combined, no differences were observed for maximal heart rate on the Bruce (134 ± 25 beats/min), Balke (131 ± 25) and ramp (130 ± 25) tests (Table 3). The Bruce protocol yielded a slightly but significantly higher maximal oxygen uptake (22.3 ± 8 ml/kg per min) than the Balke (21.1 ± 8) and ramp (21.0 ± 8) tests (p < 0.05), which did not differ from each other. Treadmill time was significantly reduced (p < 0.05) on the Bruce protocol (6.6 ± 1.5 min) versus the Balke (10.4 ± 3.4 min) and ramp (9.1 ± 1.4 min) tests, which did not differ. Normal subjects demonstrated a significantly greater maximal oxygen uptake on the treadmill versus the other subgroups (29.9 ± 10 mllkg per min, p < 0.05) and the patient groups did not differ (17.2 ± 3, 17.9 ± 4 and 20.8 ± 6 mllkg per min for patients with coronary artery disease, angina or chronic heart failure, respectively). Maximal heart rate differed
.... c e ... co ... .... e IU X <C
60
4
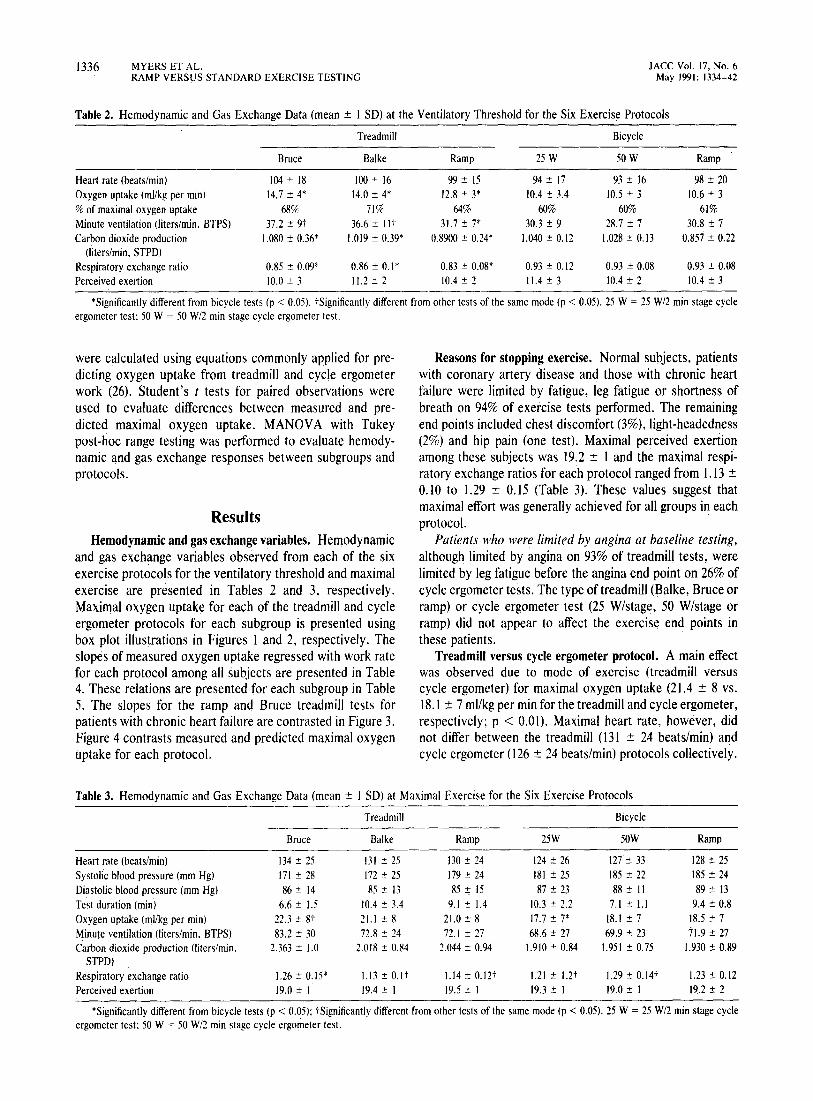
Figure 2. Box plots of maximal oxygen uptake ~ on each bicycle protocol for each subgroup. ~ Abbreviations and format as in Figure 1. *p < Z 30 0.01 versus the other groups for a given proto- ~ col; **p < 0.05 versus angina and coronary > artery disease groups; 25 W = 25 W/2 min stage ~ test; 50 W = 50 W/2 min stage test. 15 .....
<C :e )(
<C ~ 0
o
CAD NORM CAD NORM CAD NORM
significantly between normal subjects (150 ± 23 beats/min) and patients with chronic heart failure (138 ± 25), coronary artery disease (125 ± 17) or angina (114 ± 17, P < 0.05).
Cycle ergometer protocols. With all subgroups combined, no differences were observed in maximal heart rate (beats/ min) between the 25 W/stage (124 ± 26), 50 W/stage (127 ± 23) and ramp (128 ± 25) protocols. Maximal oxygen uptake (mllkg per min) was significantly greater on the ramp (18.5 ± 7) and 50 W/stage (18.1 ± 7) tests versus the 25 W/stage (17.7 ± 7) test (p < 0.05). Maximal exercise time (min) was reduced (p < 0.05) on the 50 W /stage test (7.1 ± 1.1) versus the 25 W/stage (10.3 ± 2.2) and ramp (9.4 ± 0.8) tests. Among subgroups the observations were similar to those observed on the treadmill. Normal subjects demonstrated significantly higher values for maximal heart rate (144 ± 21 beats/min, p < 0.05) and maximal oxygen uptake (25.7 ± 9 mllkg per min, p < 0.05) in comparison with all other groups. Among the patient groups, no differences were
25 watt
o
••
o
50 watt
•
RAMP
• o
A~G CHF I ANG CHF ANG CHF CAD NORM CAD NORM CAD' NORM
1338 MYERS ET AL. RAMP VERSUS STANDARD EXERCISE TESTING
Table 4. Slopes in Oxygen Uptake Versus Work Rate for 40 Subjects Performing the Six Exercise Protocols
Treadmills Bicycles
Bruce Balke Ramp 25 W 50 W Ramp
Slope 0.62 0.79 0.80 0.69 0.59 0.78 SEE 4.0 3.4 2.5 2.3 2.8 1.7
Each slope ",0.78 was significantly different from each slope ,;;0.69 (p < 0.05 except Balke vs. 25 W, p = 0.07). If the change in ventilatory oxygen uptake was equal to the change in work rate, the slope would be equal to 1.0. SEE = standard error of the estimate (ml oxygen/kg per min): 25 W = 25 W/stage; 50 W = 50 W/stage.
observed in maximal oxygen uptake (16.7 ± 4, 15.4 ± 3 and 14.4 ± 3 mVkg per min for patients with chronic heart failure. angina and coronary artery disease, respectively). Maximal heart rate (beats/min), however, was lower in patients with angina (109 ± 17) than in the other groups (p < 0.05), whereas values in patients with coronary artery disease (121 ± 20) and chronic heart failure (130 ± 25) did not differ.
Ventilatory threshold. Comparison of the exercise mode (treadmill versus cycle ergometer) demonstrated several differences in gas exchange data at the ventilatory threshold (Table 2). Greater values for oxygen uptake, minute ventilation, carbon dioxide production and respiratory exchange ratio were observed on each treadmill protocol versus each cycle ergometer protocol (p < 0.05). The overall difference in oxygen uptake at the ventilatory threshold between treadmill tests collectively (13.9 ± 4 ml/kg per min) and cycle ergometer tests collectively (10.5 ± 3 mVkg per min) was approximately 25% (p < 0.01). However, when the ventilatory threshold was expressed as a relative percentage of maximal oxygen uptake, the difference between the treadmill (64%) and cycle ergometer (57%) tests was not significant. The only differences observed among treadmill protocols were higher minute ventilation values for the Bruce (37.2 ± 9 liters/ min) and Balke (36.6 ± It) versus the ramp (31.7 ± 7) (p < 0.05). The only differences observed among the cycle ergometer protocols were higher minute ventilation values for the ramp (30.8 ± 7 liters/min) and 25 W/stage (30.3 ± 9) tests versus the 50 W /stage (28.7 ± 7) test (p < 0.05). No differences among protocols in heart rate or perceived exertion were observed at the ventilatory threshold.
Oxygen kinetics. The ratios of oxygen uptake to work rate, expressed as a slope, for all subjects on each protocol
Table 5. Slopes in Oxygen Uptake Versus Work Rate for Each Patient Subgroup Performing Each of the Six Exercise Protocols
Slope SEE, ml 0ikg per min
CAD
0.51 2.6
Angina
0.53 3.1
CHF
0.53 2.8
Normal
0.71* 4.2
*p < 0.001 versus other groups. CAD = coronary artery disease; CHF =
chronic heart failure. If the change in ventilatory oxygen uptake was equal to the change in work rate, the slope would be equal to 1.0.
lACC Vol. 17. No.6 May 1991: 1334-42
are presented in Table 4. (If measured oxygen uptake were equal to the work performed on the cycle ergometer or treadmill, the slope would equal 1.0.) The slope in oxygen uptake for the treadmill protocols collectively (slope ± SEE, mllkg per min = 0.66 ± 3.6) versus the cycle ergometer protocols collectively (0.56 ± 3.0) was significantly different (p < 0.001). Among treadmill protocols, the ramp (0.80 ±2.5) and Balke (0.79 ± 3.4) protocols had a greater slope between oxygen uptake and work rate than did the Bruce (0.62 ± 4.0) protocol (p < 0.05). The slope for the Bruce test improved to 0.67 if the predicted oxygen uptake was derived from seconds achieved on the protocol (27), rather than the value predicted from the treadmill stage (26). Among cycle ergometer protocols. the slopes for the ramp (0.78 ± 1.7) and 25 W/stage tests (0.69 ± 2.3) differed from one another (p < 0.05) and both were greater than that of the 50 W/stage (0.59 ± 2.8) protocol (p < 0.05).
The slopes of the relation between oxygen uptake and work rate for each subgroup are presented in Table 5. Normal subjects had a greater slope (0.71 ± 4.2) than did patients with coronary artery disease (0.51 ± 2.6), angina (0.53 ± 3.1) or chronic heart failure (0.53 ± 2.8) (p < 0.001). The differences in slope among the patient groups were not significant.
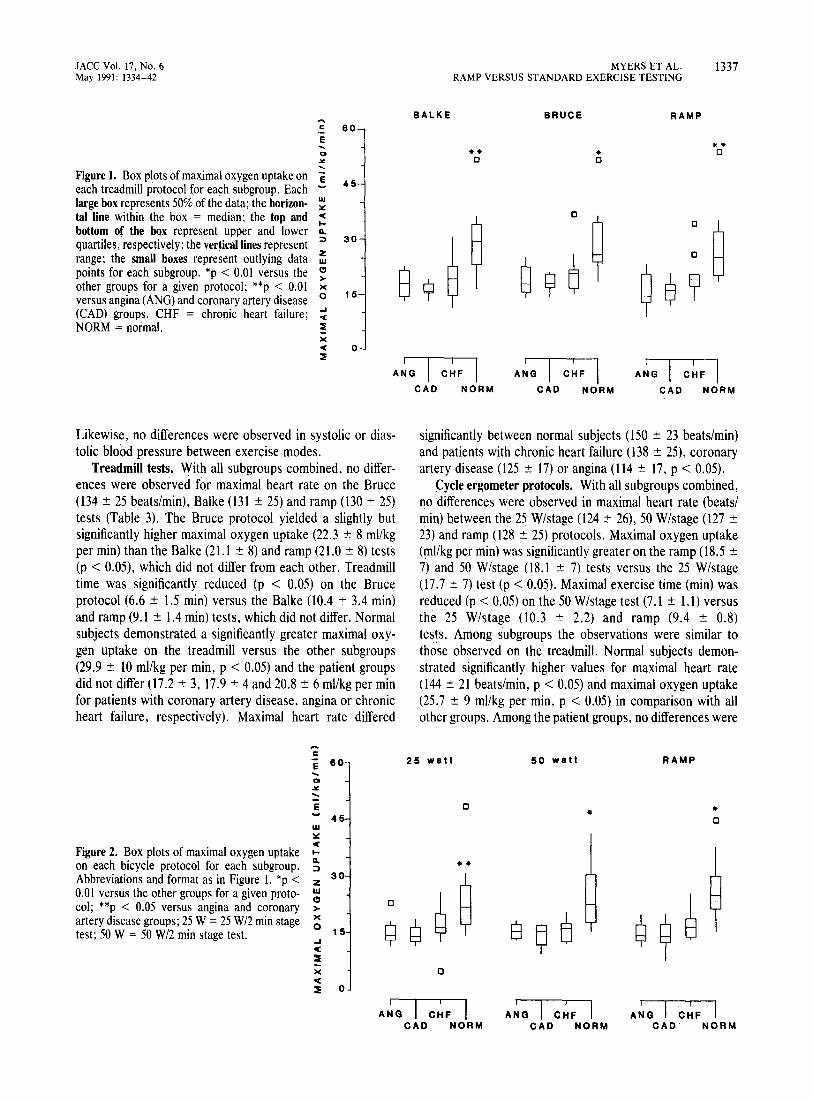
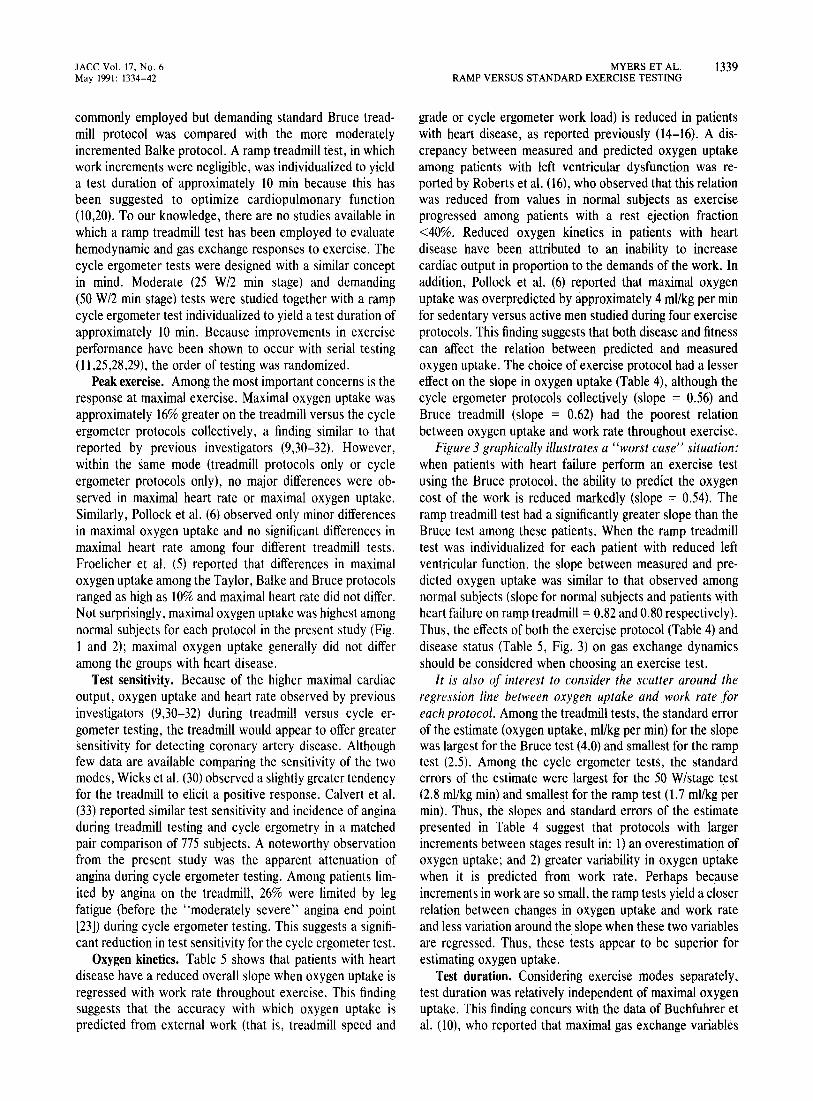
The regression lines between the change in measured and predicted oxygen uptake for the ramp and Bruce treadmill protocols among patients with chronic heart failure are contrasted in Figure 3. The regression equation was Y = 0.80x + 2.0 for the ramp test and Y = 0.54x + 3.8 for the Bruce test. The slopes of these regression lines differed significantly (p < 0.01).
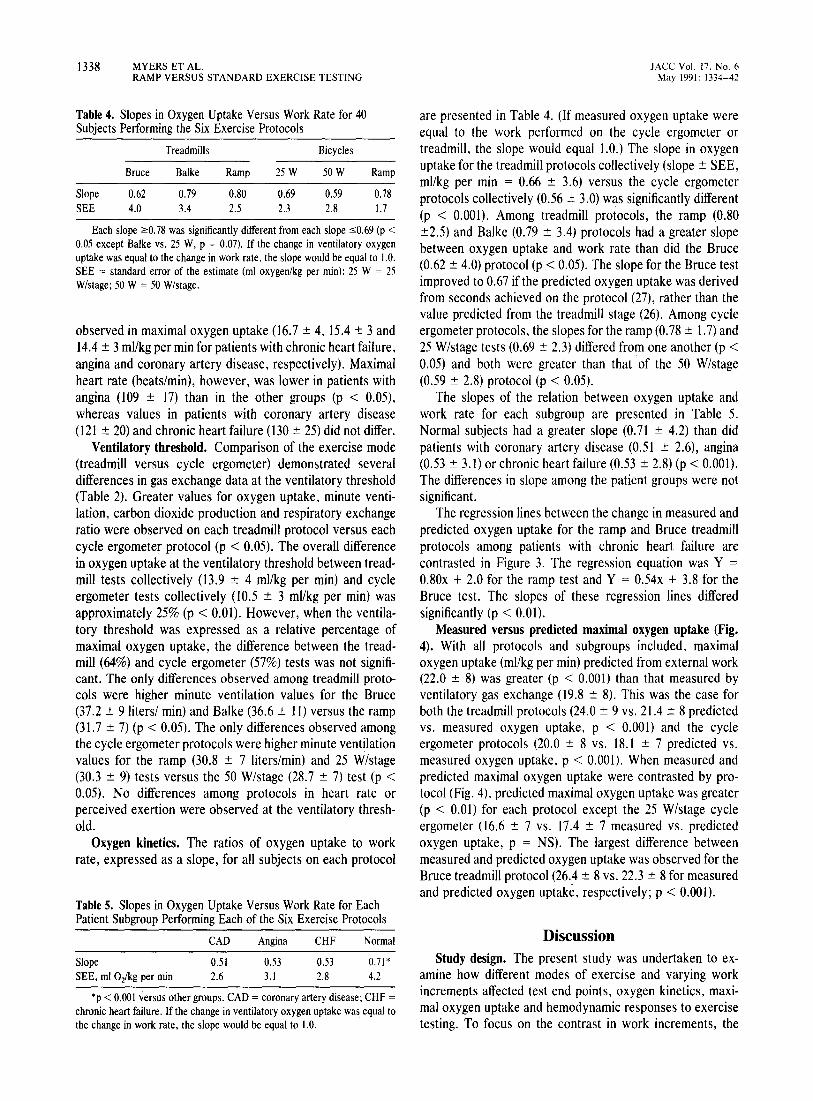
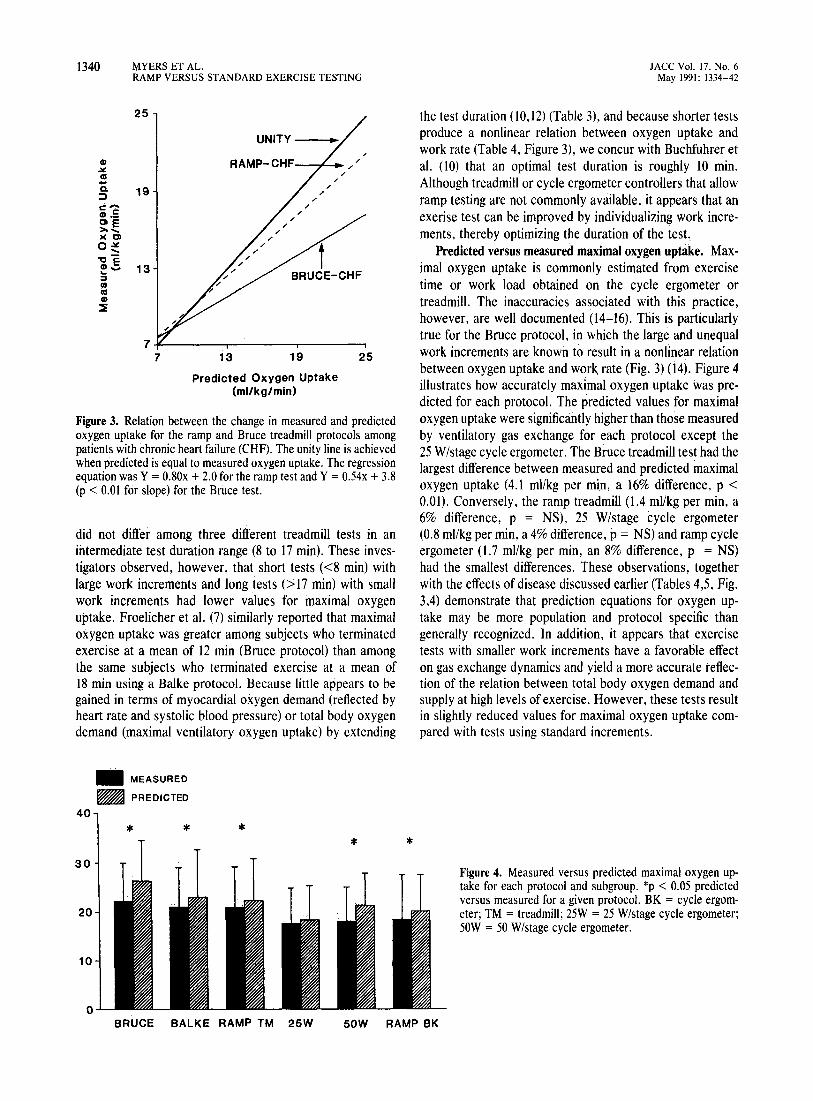
Measured versus predicted maximal oxygen uptake (Fig. 4). With all protocols and subgroups included. maximal oxygen uptake (mllkg per min) predicted from external work (22.0 ± 8) was greater (p < 0.001) than that measured by ventilatory gas exchange (19.8 ± 8). This was the case for both the treadmill protocols (24.0 ± 9 vs. 21.4 ± 8 predicted vs. measured oxygen uptake, p < 0.001) and the cycle ergometer protocols (20.0 ± 8 vs. 18.1 ± 7 predicted vs. measured oxygen uptake, p < 0.001). When measured and predicted maximal oxygen uptake were contrasted by protocol (Fig. 4), predicted maximal oxygen uptake was greater (p < 0.01) for each protocol except the 25 W/stage cycle ergometer (16.6 ± 7 vs. 17.4 ± 7 measured vs. predicted oxygen uptake, p = NS). The largest difference between measured and predicted oxygen uptake was observed for the Bruce treadmill protocol (26.4 ± 8 vs. 22.3 ± 8 for measured and predicted oxygen uptake, respectively; p < 0.001).
Discussion Study design. The present study was undertaken to ex
amine how different modes of exercise and varying work increments affected test end points, oxygen kinetics, maximal oxygen uptake and hemodynamic responses to exercise testing. To focus on the contrast in work increments, the
lACC Vol. \7, No.6 May 1991: 1334-42
commonly employed but demanding standard Bruce treadmill protocol was compared with the more moderately incremented Balke protocol. A ramp treadmill test, in which work increments were negligible, was individualized to yield a test duration of approximately 10 min because this has been suggested to optimize cardiopulmonary function 00,20), To our knowledge, there are no studies available in which a ramp treadmill test has been employed to evaluate hemodynamic and gas exchange responses to exercise. The cycle ergometer tests were designed with a similar concept in mind. Moderate (25 W/2 min stage) and demanding (50 W/2 min stage) tests were studied together with a ramp cycle ergometer test individualized to yield a test duration of approximately 10 min. Because improvements in exercise performance have been shown to occur with serial testing 01,25,28,29), the order of testing was randomized.
Peak exercise. Among the most important concerns is the response at maximal exercise. Maximal oxygen uptake was approximately 16% greater on the treadmill versus the cycle ergometer protocols collectively, a finding similar to that reported by previous investigators (9,30-32). However, within the same mode (treadmill protocols only or cycle ergometer protocols only), no major differences were observed in maximal heart rate or maximal oxygen uptake. Similarly, Pollock et al. (6) observed only minor differences in maximal oxygen uptake and no significant differences in maximal heart rate among four different treadmill tests. Froelicher et al. (5) reported that differences in maximal oxygen uptake among the Taylor, Balke and Bruce protocols ranged as high as 10% and maximal heart rate did not differ. Not surprisingly, maximal oxygen uptake was highest among normal subjects for each protocol in the present study (Fig. 1 and 2); maximal oxygen uptake generally did not differ among the groups with heart disease.
Test sensitivity. Because of the higher maximal cardiac output, oxygen uptake and heart rate observed by previous investigators (9,30-32) during treadmill versus cycle ergometer testing, the treadmill would appear to offer greater sensitivity for detecting coronary artery disease. Although few data are available comparing the sensitivity of the two modes, Wicks et al. (30) observed a slightly greater tendency for the treadmill to elicit a positive response. Calvert et al. (33) reported similar test sensitivity and incidence of angina during treadmill testing and cycle ergometry in a matched pair comparison of 775 SUbjects. A noteworthy observation from the present study was the apparent attenuation of angina during cycle ergometer testing. Among patients limited by angina on the treadmill, 26% were limited by leg fatigue (before the "moderately severe" angina end point [23]) during cycle ergometer testing. This suggests a significant reduction in test sensitivity for the cycle ergometer test.
Oxygen kinetics. Table 5 shows that patients with heart disease have a reduced overall slope when oxygen uptake is regressed with work rate throughout exercise. This finding suggests that the accuracy with which oxygen uptake is predicted from external work (that is, treadmill speed and
MYERS ET AL. 1339 RAMP VERSUS STANDARD EXERCISE TESTING
grade or cycle ergometer work load) is reduced in patients with heart disease, as reported previously (14-16). A discrepancy between measured and predicted oxygen uptake among patients with left ventricular dysfunction was reported by Roberts et al. (16), who observed that this relation was reduced from values in normal subjects as exercise progressed among patients with a rest ejection fraction <40%. Reduced oxygen kinetics in patients with heart disease have been attributed to an inability to increase cardiac output in proportion to the demands of the work. In addition, Pollock et al. (6) reported that maximal oxygen uptake was overpredicted by approximately 4 mllkg per min for sedentary versus active men studied during four exercise protocols. This finding suggests that both disease and fitness can affect the relation between predicted and measured oxygen uptake. The choice of exercise protocol had a lesser effect on the slope in oxygen uptake (Table 4), although the cycle ergometer protocols collectively (slope = 0.56) and Bruce treadmill (slope = 0.62) had the poorest relation between oxygen uptake and work rate throughout exercise.
Figure 3 graphically illustrates a "worst case" situation: when patients with heart failure perform an exercise test using the Bruce protocol, the ability to predict the oxygen cost of the work is reduced markedly (slope = 0.54). The ramp treadmill test had a significantly greater slope than the Bruce test among these patients. When the ramp treadmill test was individualized for each patient with reduced left ventricular function. the slope between measured and predicted oxygen uptake was similar to that observed among normal subjects (slope for normal subjects and patients with heart failure on ramp treadmill = 0.82 and 0.80 respectively). Thus. the effects of both the exercise protocol (Table 4) and disease status (Table 5. Fig. 3) on gas exchange dynamics should be considered when choosing an exercise test.
It is also of interest to consider the scatter around the regression line between oxygen uptake and work rate for each protocol. Among the treadmill tests, the standard error of the estimate (oxygen uptake, mllkg per min) for the slope was largest for the Bruce test (4.0) and smallest for the ramp test (2.5). Among the cycle ergometer tests, the standard errors of the estimate were largest for the 50 W /stage test (2.8 mllkg min) and smallest for the ramp test (1. 7 ml/kg per min). Thus, the slopes and standard errors of the estimate presented in Table 4 suggest that protocols with larger increments between stages result iri: 1) an overestimation of oxygen uptake; and 2) greater variability in oxygen uptake when it is predicted from work rate. Perhaps because increments in work are so small, the ramp tests yield a closer relation between changes in oxygen uptake and work rate and less variation around the slope when these two variables are regressed. Thus, these tests appear to be superior for estimating oxygen uptake.
Test duration. Considering exercise modes separately, test duration was relatively independent of maximal oxygen uptake. This finding concurs with the data of Buchfuhrer et al. (10), who reported that maximal gas exchange variables
1340 MYERS ET AL. RAMP VERSUS STANDARD EXERCISE TESTING
25
UNITY--_/
RAMP-CHF--r-__
7~------r--------.-------' 7 13 19
Predicted Oxygen Uptake (ml/kg/min)
25
Figure 3. Relation between the change in measured and predicted oxygen uptake for the ramp and Bruce treadmill protocols among patients with chronic heart failure (CHF). The unity line is achieved when predicted is equal to measured oxygen uptake. The regression equation was Y = 0.80x + 2.0 for the ramp test and Y = 0.54x + 3.8 (p < 0.01 for slope) for the Bruce test.
did not differ among three different treadmill tests in an intermediate test duration range (8 to 17 min). These investigators observed, however, that short tests «8 min) with large work increments and long tests (> 17 min) with small work increments had lower values for maximal oxygen uptake. Froelicher et al. (7) similarly reported that maximal oxygen uptake was greater among subjects who terminated exercise at a mean of 12 min (Bruce protocol) than among the same subjects who terminated exercise at a mean of 18 min using a Balke protocol. Because little appears to be gained in terms of myocardial oxygen demand (reflected by heart rate and systolic blood pressure) or total body oxygen demand (maximal ventilatory oxygen uptake) by extending
_ MEASURED
_ PREDICTED
40
* * 30
20
10
0
* * *
JACC Vol. 17, No.6 May 1991: 1334-42
the test duration (10,12) (Table 3), and because shorter tests produce a nonlinear relation between oxygen uptake and work rate (Table 4, Figure 3), we concur with Buchfuhrer et al. (10) that an optimal test duration is roughly 10 min. Although treadmill or cycle ergometer controllers that allow ramp testing are not commonly available, it appears that an exerise test can be improved by individualizing work increments, thereby optimizing the duration of the test
Predicted versus measured maximal oxygen uptake. Maximal oxygen uptake is commonly estimated from exercise time or work load obtained on the cycle ergometer or treadmill. The inaccuracies associated with this practice, however, are well documented (14-16). This is particularly true for the Bruce protocol, in which the large and unequal work increments are known to result in a nonlinear relation between oxygen uptake and wor~ rate (Fig. 3) (14). Figure 4 illustrates how accurately maximal oxygen uptake was predicted for each protocol. The predicted values for maximal oxygen uptake were significantly higher than those measured by ventilatory gas exchange for each protocol except the 25 W/stage cycle ergometer. The Bruce treadmill test had the largest difference between measured and predicted maximal oxygen uptake (4.1 mllkg per min, a 16% difference, p < 0.01). Conversely, the ramp treadmill (1.4 mllkg per min, a 6% difference, p = NS), 25 W/stage cycle ergometer (0.8 mllkg per min, a 4% difference, p = NS) and ramp cycle ergometer (1.7 ml/kg per min, an 8% difference, p = NS) had the smallest differences. These observations, together with the effects of disease discussed earlier (Tables 4,5, Fig. 3,4) demonstrate that prediction equations for oxygen uptake may be more population and protocol specific than generally recognized. In addition, it appears that exercise tests with smaller work increments have a favorable effect on gas exchange dynamics and yield a more accurate reflection of the relation between total body oxygen demand and supply at high levels of exercise. However, these tests result in slightly reduced values for maximal oxygen uptake compared with tests using standard increments.
Figure 4. Measured versus predicted maximal oxygen up-take for each protocol and subgroup. *p < 0.05 predicted versus measured for a given protocol. BK = cycle ergom-eter; TM = treadmill; 25W = 25 W/stage cycle ergometer; 50W = 50 W/stage cycle ergometer.
BRUCE BALKE RAMP TM 25W 50W RAMP BK

JACC Vol. 17, No, 6 May 1991: 1334-42
Ventilatory threshold. Although oxygen uptake at the ventilatory threshold was greater (approximately 25%) on each of the treadmill protocols versus each cycle ergometer protocol, there were no differences among the treadmill protocols or the cycle ergometer protocols. A small (7%) difference between modes was observed when oxygen uptake at the ventilatory threshold was expressed as a relative percentage of maximal oxygen uptake (64% for treadmill, 57% for cycle ergometer). Buchfuhrer et al. (10) reported a 13.5% greater oxygen uptake at the ventilatory threshold among 12 healthy subjects on a treadmill versus a cycle ergometer. However, no differences were observed by these investigators when oxygen uptake was expressed as a percentage of maximal oxygen uptake. In contrast, Davis et al. (34) reported that oxygen uptake at the ventilatory threshold did not differ between treadmill and cycle ergometer tests.
The large absolute difference in oxygen uptake at the ventilatory threshold among exercise modes in the present study suggests that caution should be employed when using the ventilatory threshold to assess medical management or prescribe exercise. Oxygen uptake at the ventilatory threshold changes significantly with differences in exercise protocols, methods of determination and the use of different reviewers (10,35-37). The uncertain relations among lactate production, anaerobiosis and the ventilatory threshold suggested by recent investigators (38,39) and the present observation that oxygen uptake at the ventilatory threshold can be altered by exercise mode underscore the limitations in applying the ventilatory threshold clinically. They further suggest that the use of the ventilatory threshold to evaluate a given clinical intervention should be considered valid only when the same protocol is used.
Conclusions. Although exercise protocols have been compared previously, there has been a lack of appreciation of the effects the protocol can have when testing patients with heart disease. The present study illustrates that the exercise protocol can have a marked influence on hemodynamic and gas exchange data obtained from an exercise test. Although some of the present observations confirm previous data, to our knowledge this is the first systematic evaluation of a wide range of work increments comparing the responses of normal subjects and patients with different cardiovascular diseases. Ramp tests have not been included in previous investigations because of the difficulty in programming them. Given the shortcomings associated with standard incremental protocols apparent from the present data and outlined by previous investigators, the ramp test appears to be a superior alternative.
The following conclusions appear warranted on the basis of the present investigation:
1. In agreement with previous investigations, treadmill protocols generally yield a maximal oxygen uptake that is 10% to 20% greater than that of cycle ergometer protocols.
2. Among various treadmill protocols or among various cycle ergometer protocols themselves, no major differences
MYERS ET AL. 1341 RAMP VERSUS STANDARD EXERCISE TESTING
were observed in maximal heart rate, blood pressure or maximal oxygen uptake.
3. The errors associated with predicting oxygen uptake from work load can be minimized by use of the ramp protocol; a ramp treadmill protocol individualized for each subject has the most linear relation between oxygen uptake and work rate. Protocols with large increments between stages (Bruce treadmill and 50 W/stage cycle ergometer) have the poorest relation between oxygen uptake and work rate. The reduced slope between oxygen uptake and work rate due to disease can be minimized by choosing an appropriate protocol; individualized ramp tests on both a cycle ergometer and treadmill greatly improved this relation.
4. Protocols that result in a short exercise duration cause a greater discrepancy between oxygen uptake and work rate, but little appears to be gained by extending the duration of the test. An optimal duration of 10 min is suggested.
5. Maximal oxygen uptake is more accurately predicted using protocols with shorter and smaller work increments. A test with small increments between stages or ramp tests more accurately reflects the oxygen cost of the work performed and is preferable when gas exchange equipment is unavailable.
References I. Balke B. Ware R. An experimental study of physical fitness of air force
personnel. US Armed Forces Med 1 1959:10:675-88. 2. Astrand PO. Rodahl K. Textbook of Work Physiology. New York:
McGraw-Hill. 1986:331-65. 3. Bruce RA. Exercise testing of patients with coronary heart disease. Ann
Clin Res 1971;3:323-30. 4. Ellestad MH. Allen W. Wan MCK, Kemp G. Maximal treadmill stress
tesVng for cardiovascular evaluation. Circulation 1969:39:517-22. 5. Froelicher YF, Brammell H, Davis G, Noguera I, Steward A, Lancaster
Me. A compflrison of the reproducibility and physiologic response to three maximal treadmill exercise protocols. Chest 1974:65:512-17.
6. Pollock ML. Bohannon RL. Cooper KH, et al. A comparative analysis of four protocols for maximal treadmill stress testing. Am Heart 1 1976;92: 39-46.
7. Froelicher YF. Thomas AI, Noguera I, Davis G, Steward AI, Triebwasser JH. Prediction of maximal oxygen consumption: comparison of the Bruce and Balke treadmill protocols. Chest 1975:68:331-6.
8. Wolthuis RA. Froelicher YF. Fischer 1, et al. New practical treadmill protocol for clinical use. Am 1 Cardiol 1977:39:697-700.
9. Miyamura M. Honda Y. Oxygen intake and cardiac output during maximal treadmill and bicycle exercise. 1 Appl PhysioI1972:32: 185-8.
10. Buchfuhrer MI. Hansen IE, Robinson TE. Sue DY. Wasserman K. Whipp Bl. Optimizing the exercise protocol for cardiopulmonary assessment. 1. Appl PhysioI1983;55:1558-64.
II. Redwood DR, Rosing DR. Goldstein RE, Beiser GO, Epstein SE. Importance of the design of an exercise protocol in the evaluation of patients with angina pectoris. Circulation 1971 :43:618-28.
12. Lipkin DP. Canepa-Anson R. Stephens MR, Poole-Wilson PA. Factors determining symptoms in heart failure: comparison of fast and slow exercise tests. Br Heart 1 1986:55:439-45.
13. Stuart Rl. Ellestad MH. National survey of exercise stress testing facilities. Chest 1980:77:94-7.
14. Sullivan M. McKirnan MD. Errors in predicting functional capacity for postmyocardial infarction patients u~ing a modified Bruce protocol. Am Heart 1 1984:107:486-91.
IS. Foster e. Hare 1. Taylor MM. Goldstein T, Anholm 10. Pollock ML. Prediction of oxygen uptake during exercise testing in cardiac patients and healthy volunteers. 1. Cardiac Rehab 1984:4:537-42.
1342 MYERS ET AL. RAMP VERSUS STANDARD EXERCISE TESTING
16: Roberts 1M, Sullivan M, Froelicher VF. Genter F, Myers 1. Predicting oxygen uptake from treadmill testing in normal subjects and coronary artery disease patients. Am Heart 11984;108:1454-60.
17. Whipp Bl, Davis lA. Torres F, Wasserman K. A test to determine parameters of aerobic function during exercise. 1 Appl Physiol 1981;50: 217-21.
18. Myers 1, Walsh D, Buchanan N. et al. Effect of protocol and disease on the kinetics of oxygen uptake during exercise testing (abstr). 1 Am Coli CardioI1990;15:237A.
19. Buchanan N. Myers 1, Walsh D, Kraemer M, Froelicher VF. Comparison of the gas exchange response to exercise using ramp versus standard exercise protocols (abstr). 1 Cardiopulmonary Rehab 1989:9:402.
20. Webster MWI, Sharpe DN. Exercise testing in angina pectoris: the importance of protocol design in clinical trials. Am Heart J 1989;117; 505-8.
21. Myers 1. Walsh D. Buchanan N. Froelicher VF. Can maximal cardiopulmonary capacity be recognized by a plateau in oxygen uptake? Chest 1989;96: 1312-6.
22. Borg GA V. Psychophysical bases of perceived exertion. Med Sci Sports Exerc 1982;14:377-81.
23. Myers J, Froelicher VF. Optimizing the exercise test for pharmacologic investigations. Circulation 1990;82: 1839-46.
24. 10nes NL. Campbell ElM. Clinical Exercise Testing. Philadelphia: WB Saunders, 1982: 152-6.
25. Sullivan M, Genter F. Savvides M, Roberts M, Myers 1, Froelicher VF. The reproducibility of hemodynamic, electrocardiographic, and gas exchange data during treadmill exercise in patients with stable angina pectoris. Chest 1984;86:375-81.
26. American College of Sports Medicine. Guidelines for Graded Exercise Testing and Prescription. Philadelphia: Lea & Febiger. 1986:159-71.
27. Bruce RA. Exercise testing of patients with coronary heart disease: principles and normal standards for evaluation. Ann Clin Res 1971 ;3:323-32.
JACC Vol. 17, No.6 May 1991: 1334-42
28. Starling MR. Moody M, Crawford MH, Levi B, O'Rourke RA. Repeat treadmill exercise testing: variability of results in patients with angina pectoris. Am Heart J 1984;107:298-303.
29. Kraemer M. Sullivan M. Atwood JE. Forbes S. Myers J, Froelicher VF. Reproducibility of treadmill exercise data in patients with atrial fibrillation. Cardiology 1989;76:234-42.
30. Wicks JR. Sutton JR, Oldridge NB, Jones NL. Comparison of the electrocardiographic changes induced by maximum exercise testing with treadmill and cycle ergometer. Circulation 1978:57: 1066-70.
31. Hermansen L, Saltin B. Oxygen uptake during maximal treadmill and bicycle exercise: J Appl PhysioI1969;26:3l-7.
32. Smodlaka VN. Treadmill versus bicycle ergometer. In Mellerowity HM, Smodlaka VN. eds. Ergometry: Basics of Exercise Testing. Baltimore: Urban and Schwarzenberg, 1981:385-92.
33. Calvert AF, Pater G, Pye D. Mann J, Chalmers D. Ayres B. A matched pairs comparison of cycle ergometry and treadmill exercise testing in the evaluation of coronary heart disease. Aust NZ J Med 1987:17:472-8.
34. DavisJA. Vodak P. Wilmore JH, Vodak 1. Kurty P. Anaerobic threshold and maximal aerobic power for three modes of exercise. J Appl Physiol 1976;41 :544-50.
35. Dickstein K, Barvik S. Aarsland T. Snapinn S. Karlsson J. A comparison of methodologies in detection of the anaerobic threshold. Circulation 1990;81 :1138-46.
36. Yeh MP. Gardner RM, Adams TD, Yanowitz FG, Crapo RO. "Anaerobic threshold": problems of determination and validation. J Appl Physiol 1983;55: 1178-86.
37. Gladden LB, Yates JW, Stremel RW, Stamford BA. Gas exchange and lactate anaerobic thresholds: inter- and intraevaluator agreement. 1 Appl Physiol 1985;58:2082-9.
38. Connett RJ. Ganeski TEJ, Honig GR. Lactate accumulation in fully aerobic, working dog gracillis muscle. Am J PhysioI1984;246:HI20-8.
39. Brooks GA. Anaerobic threshold: review of the concept and directions for future research. Med Sci Sports Exerc 1985;17:22-31.