comparison of solar and heat pump water heaters in … of solar and heat pump water heaters in new...
TRANSCRIPT
Comparison of solar and heat pump water heaters in New Zealand
Report prepared for the Parliamentary Commissioner for the Environment, 30 June 2011
by
Gerry Carrington1
Key points
1) The performance of representative solar water heaters and heat pump
water heaters is analysed using accepted procedures set out in the
Standard AS/NZS4234. The systems are representative of good current
technology practices in New Zealand.
2) The electricity savings are evaluated against the consumption of a
reference electric water heater, as specified in AS/NZS4234.
3) For both solar and heat pump water heaters the electricity savings are not
significantly affected by realistic changes in the daily hot water
consumption pattern.
4) The factors that determine and limit the seasonal and annual
performance of solar and heat pump water heaters are different.
5) For heat pumps the electricity savings (in kWh) peak in winter, whereas
they peak in summer for the solar systems.
6) The annual electricity savings (in kWh) for both solar and heat pump
water heaters increase with increasing hot water demand.
7) Expressed as a percentage of the demand for a reference electric water
heater, the annual savings of the solar water heater decrease as the
demand increases, whereas the annual savings for the heat pump system
increase slightly in the range 60 – 63% as the demand increases.
8) The electricity savings for the solar systems increase as the collector area
increases, with a maximum of around 95%, and savings of approximately
70% for a well matched system. There is increased risk of over-heating in
1 [email protected] Gerry is an Emeritus Professor of Physics at the University of Otago, a Fellow of the Royal Society of New
Zealand, a Fellow of the Institution of Professional Engineers of New Zealand and a Fellow of the Institute of Refrigeration, Heating
and Air Conditioning Engineers New Zealand. He is grateful to Mr Adrian Kerr for his kind advice and assistance in preparing this
report.
2
the summer if a solar system is sized to produce annual savings much
greater than 70%.
9) Typical annual savings for a well designed heat pump water heater are in
the range 60 – 70%.
10) Expressed as a percentage of the consumption of the reference electric
water heater, the solar savings in the South are typically 14% less than
those in the North.
11) For the heat pump system the savings in the South are typically 3% less
than those in the North.
12) The solar savings in Nelson are greater than those in Auckland in April,
May and June, but not significantly different at other times.
13) For an average consumer in Nelson the annual electricity saving is
approximately 120 kWh greater than that for the same consumer in
Auckland with the same solar system.
14) If 80% of hot water demand currently supplied by conventional electric
heating were to switch to either solar or heat pump water heating, the
year-average national electricity savings would be 8.3 GWh/day for the
solar option and 7.6 GWh/day for the heat pump.
15) Under this scenario, the average saving in the electricity demand
averaged for the month of July would be 7.0 GWh/day for the solar option
and 9.2 GWh/day for the heat pump choice. The additional saving
achieved by the heat pump is equivalent to 2% of the annual average
national electricity demand. In terms of energy savings during a dry-year,
the heat pump option is preferred.
16) On a day-to-day basis, the variations in national electricity savings in July
are larger for solar than those for heat pumps by a factor of six. In the
simulation on the worst day the national solar savings are 28%. The
corresponding heat pump savings are 59%.
17) The reduction in the peak daily demand in July is 8.8 GWh/day for the
heat pump option and 4.3 GWh/day for the solar. This difference is
equivalent to 4.3% of the national average daily electricity demand. In
terms of peak electricity requirements during winter, the heat pump
option is preferred.
18) It is well accepted in the industry that the quality of both solar and heat
pump water heaters has advanced significantly in recent years, evidently
due to the selective support provided for good technology under the EECA
ENERGYWISE™ grant schemes. There is, at present, room for further
technology advancement.

3
19) Unlike solar water heaters, heat pump systems produce significant levels
of noise outdoors. This is a potential difficulty for the technology in urban
settings, but at present the problem appears to be managed reasonably.
4
Contents
Page
1. Electric water heating in New Zealand. 4
2. How do solar and heat pump water heaters differ? 5
3. Is the daily hot water use pattern important? 6
4. How does the electricity demand change with the season? 9
5. How does the annual electricity use depend on the hot water demand? 11
6. How do the annual electricity savings depend on the demand? 12
7. How are solar savings affected by the collector area? 13
8. How do the savings in the South compare with the North? 13
9. Is Nelson a special case for solar water heating? 15
10. How do solar and heat pump systems respond to seasonal climate changes? 17
11. How might solar and heat pump systems affect the electricity system? 18
12. What can go wrong with solar and heat pump water heaters? 21
13. Is noise a problem? 25
14. Appendix – Methods. 26
5
1. Electric water heating in New Zealand
On average 34% of NZ household electricity consumption is used for water heating2, costing each
household some $650 a year. Nationally the electricity used for residential water heating is 15.6 PJ
per annum, the largest single item in the EECA data base of household electricity use3. In addition
the electricity used nationally for non-residential water heating is 4.3 PJ per annum. The total, 19.9
PJ, represents 14.4% of all electricity used in NZ, costing approximately $1.1B per annum4.
The possibility of using solar heating to reduce the electricity demand for water heating is well
accepted, but the product is not yet a mass-market item. To encourage wider adoption the cost of
suitable systems is subsidised under the EECA ENERGYWISE™ scheme5. Users installing an approved
solar water heater are eligible for a grant of $1000 for a larger system, or $500 for a smaller one. To
access such a grant the solar water heater must satisfy a number of criteria6, one being that the
system must deliver annual electricity savings of at least 70% for a defined level of hot water use in
the Auckland climate zone, compared with a reference electric water heater. This saving is
determined using procedures set out in the Standard AS/NZS42347. Approved products are listed on
the ENERGYWISE™ website8.
Among the other options for reducing the electricity used for water heating, heat pump water
heaters are also recognised9. The annual electricity savings for heat pump systems currently eligible
for ENERGYWISE™ grants10 are in the range 52 – 69% in the Auckland climate zone. Like solar
systems, these savings are relative to a reference electric water heater calculated using the
procedures in AS/NZS4234.
The ENERGYWISE™ website indicates that heat pump water heaters eligible for funding provide a
lower level of annual savings than the corresponding solar systems and the maximum
ENERGYWISE™ grant for heat pump water heaters is less than that for solar systems. It would
therefore be reasonable for a potential purchaser to infer that the heat pump option has lower
merit than a solar system in terms of its support for sustainable energy, reduced electricity costs and
better security of electricity supply.
Such a conclusion may be incorrect because solar and heat pump water heaters achieve electricity
savings in different ways and consequently have different operating characteristics and limitations.
2 Isaacs, N, Camerilleri, M, Burrough, L, Pollard, A, Savel-Smith, K, Fraser, R, Rosseauw, P, Jowett, J. Energy use in New Zealand
households, final report of the household energy end-use project [HEEP]. BRANZ SR 221 (2010). BRANZ Ltd, Judgeford, NZ.
http://www.branz.co.nz/HEEP Accessed 26/6/2011. 3 EECA end-use data base. http://enduse.eeca.govt.nz/ Accessed 20/6/2011.
4 The total NZ annual electricity consumption for low temperature (less than 100°C) water heating is 19.9 PJ or 5.53 x 10
9 kWh. At 20¢
per kWh the annual cost to NZ consumers is $1.11B. 5 http://www.energywise.govt.nz/how-to-be-energy-efficient/your-house/hot-water/choosing-the-right-water-heating-system
Accessed 20/6/2011. 6 New Zealand ENERGY STAR® Criteria for Solar Water Heating Systems. NZ Energy Efficiency and Conservation Authority.
http://www.eeca.govt.nz/sites/all/files/NZ%20ENERGY%20STAR%20solar%20water%20heating%20spec%20v1.0.pdf Accessed
24/6/2011. 7 AS/NZS4234:2008 Heated water systems - calculation of energy consumption. Joint Australian and New Zealand Standard.
8 http://www.energywise.govt.nz/solar-systems/search-results Accessed 21/6/2011.
9 Whitley, B. Heat Pump Water Heaters. Consumer New Zealand (May 2009) http://www.consumer.org.nz/reports/heat-pump-water-
heaters Accessed 21/6/2011. 10
http://www.energywise.govt.nz/sites/all/files/eligible-systems-scheme-partners-03062011.pdf Accessed 20/6/2011.
6
The heating capacity of solar systems varies on a seasonal basis much more than heat pump water
heaters. This raises a number of issues concerning the potential effects of solar and heat pump
water heaters on the electricity supply system in the event that they become widely used.
These matters have been discussed by Aye et al11, who compare three water heating technologies
(two heat pump and one solar) for Australian cities on the basis of electricity consumption, initial
and operating costs, and greenhouse gas emissions. Based on average costs they conclude that the
heat pump options are cheaper in Hobart and Melbourne and the solar system is best in Darwin. In
the other cities considered, the differences between the three systems were small, with no system
clearly preferred. Lloyd and Kerr12 examine solar and heat pump water heaters in New Zealand,
focussing on the influence of seasonal variations in performance. They conclude that “… heat pump
technology is likely to result in a better match between security of supply, GHG emissions and
reduced peak transmission loading compared to the solar option”.
Since these studies were conducted, defined procedures for calculating the performance of solar
and heat pump water heaters have been recognised in the joint Australian and New Zealand
Standard, AS/NZS423413. These methods therefore provide credible means for assessing the
performance of individual solar and heat pump water heating products. The purpose of this report is
to apply these methods systematically to re-examine the issues raised by Aye et al. and Lloyd & Kerr.
In order to provide quantitative information to illustrate the performance of solar and heat pump
water heaters, representative systems have been modelled using the methods set out in AS/NZS
4234. The calculations, described in the Appendix at the end of this report, are essentially the same
as those used to assess the products listed on the ENERGYWISE™ website.
2. How do solar and heat pump water heaters differ?
A solar water heater uses available solar energy to heat water. Because it can utilise only the solar
energy captured by the collector, a key constraint for a solar system is the collector area. Other
relevant performance factors are the seasonal availability of sunshine, seasonal variations in the use
of hot water, the efficiency of the collector, the performance of the hot water storage tank and the
effectiveness of the controls. Since the energy that a solar water heater provides is limited by what
is available, a small user with a sufficiently large solar collector may be able to save a high
percentage of the electricity they would otherwise use to provide hot water, summer and winter. On
the other hand a different household with the same solar system but with larger hot water
consumption would have a lower percentage saving, although they may save more electricity than
the small user.
A heat pump water heater – in the form considered here – extracts energy from the outside air,
which is a store for solar energy. As a result, the performance of the heat pump system is primarily
affected by the outside air temperature, falling as the temperature falls. But for a particular location,
11
Aye, L, Charters, WWS and Chaichana, C. Solar heat pump systems for domestic hot water. Solar Energy, 73(3):169–175 (2002). 12
Lloyd, CR and Kerr, ASD. Performance of commercially available solar and heat pump water heaters. Energy Policy, 36:3807–3813
(2008). 13
AS/NZS4234:2008 Heated water systems - calculation of energy consumption. Joint Australian and New Zealand Standard.
7
the variation in the performance of a heat pump water heater tends to be less affected than a solar
system by day to day variations in the weather and by seasonal changes. In addition, the savings,
expressed as a percentage, are not that much affected by the hot water demand, unlike the solar
system.
There are therefore two defining differences between solar and heat pump water heaters: the
effects of seasonal variations in the climate and the effects of changing the hot water demand.
Consequently a single performance measure, such as the percentage annual savings for a particular
consumer in a defined climate zone, cannot represent the relative contributions of the systems to
sustainable energy, supply security and lower costs.
The following sections of this report discuss these differences for the representative solar and heat
pump systems considered here and examine how the electricity supply may be affected by these
systems in the future.
3. Is the daily hot water use pattern important?
Solar water heaters are able to heat water only when solar energy is available. So for households
where a lot of people take morning showers there is a risk they will run short of hot water before
there is any solar input, in which case the shortfall would be made up by the booster electric heater,
rather than the sun. One might expect similar effects for a heat pump water heater, because the
performance will be influenced by daily variations in the outdoor air temperature.
This suggests there may be significant differences in the savings realised by solar and heat pump
water heaters depending on whether the occupants have higher hot water demands in the morning,
during the day, or in the evening. To examine this issue the effect of changing the hot water
consumption profile on the electricity savings is illustrated here for the representative solar and heat
pump water heaters. The savings are calculated on a monthly basis to show the seasonal variations
and the example presented here is for the North zone (as described in the Appendix).
The purchased energy for the solar system includes the electricity used by the water circulating
pump and the auxiliary electric booster heater. For the heat pump the purchased energy includes
the electricity used by the heat pump compressor, the heat pump fan and the water circulating
pump. The savings are determined by subtracting the monthly purchased energy for the
representative solar and heat pump water heaters from that used by the reference electric water
heater in the North zone (Appendix, Figure A2). The data is presented for five levels of hot water
consumption, denoted user 0 – user 4, as summarised in the Appendix, Table A1. For this part of the
analysis just one size of solar collector, an evacuated-tube system with 30 tubes with an area of 2.4
m2, is considered. The three consumption profiles, denoted in the figures by std, am, pm, are
illustrated in the Appendix, Figure A1.
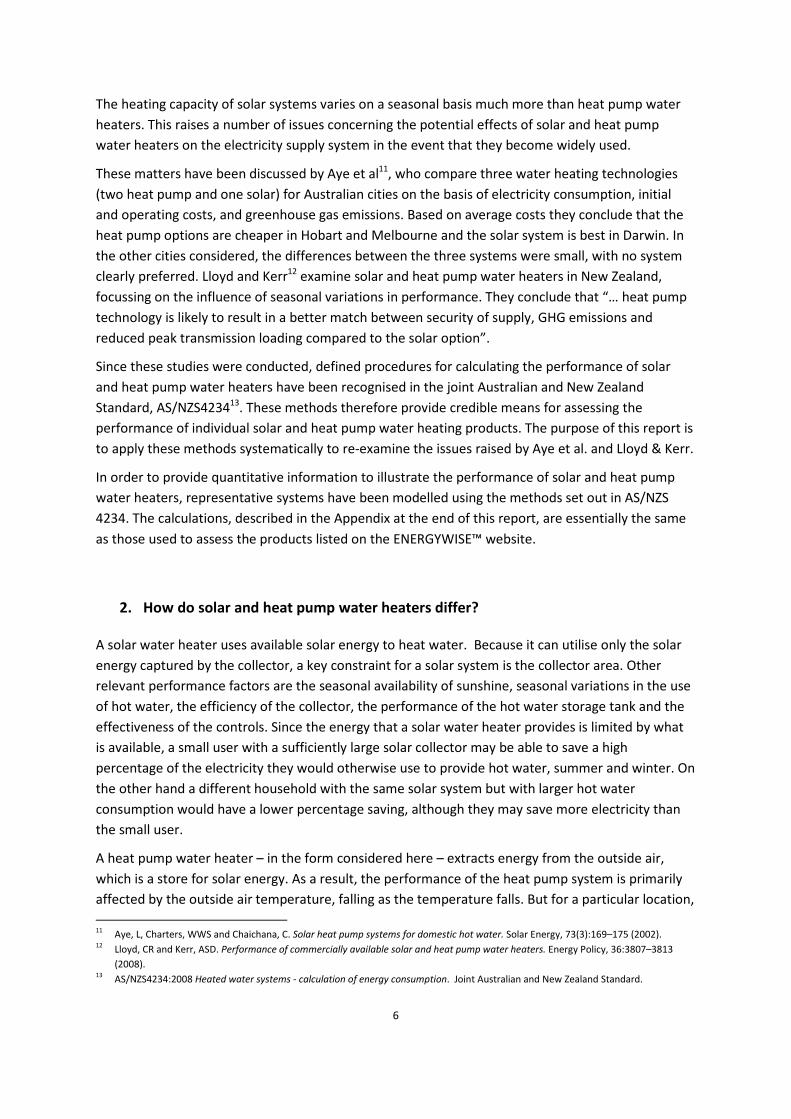
Figure 1 shows the effect of changing the daily water use profile on the saving in purchased
electricity for a medium level user (user 2) for the representative solar system. This indicates that
the consumption profile has a relatively small influence on the monthly savings for this user, the
standard profile yielding slightly higher savings than the morning or evening profiles.
8
120
140
160
180
200
220
240
260
Mo
nth
ly e
lect
rici
ty s
ave
d k
Wh
am
pm
std
Fig. 1. Effect of different daily water use profiles on the saving in monthly purchased electricity for a
medium level user in the North zone using a 2.4 m2 solar collector (30 evacuated-tubes).
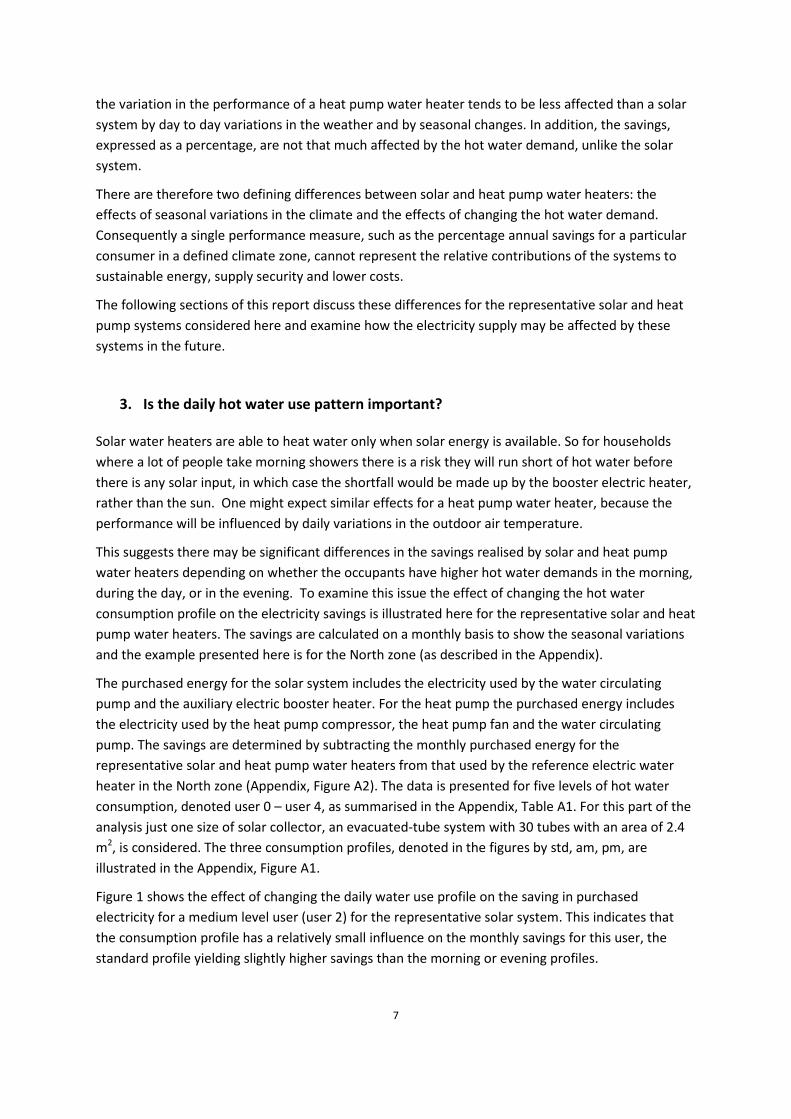
Figure 2 shows how the consumption profile affects the annual electricity savings for the same solar
system for a range of users, 0 – 4. For users 2 – 4 the electricity savings for the standard
consumption profile is approximately 5% larger than the am and pm profiles, but there is no
significant difference between the savings achieved by the am and pm profiles. Evidently there is
some effect due to changes in the hot water consumption profile, but it is small enough not to be a
major consideration.
1200
1400
1600
1800
2000
2200
2400
2600
0 1 2 3 4
An
nu
al
sav
ing
kW
h
User ID number
am
pm
std
Fig. 2. Effect of different daily water use profiles on the annual kWh saving in purchased electricity
using a solar water heater compared with the reference electric water heater. This figure applies to
the North zone using a 2.4 m2 solar collector (30 evacuated-tubes) and shows five levels of
consumption (user 0 – 4).
9
120
140
160
180
200
220
240
260
Mo
nth
ly e
lect
rici
ty s
ave
d k
Wh
am
pm
std
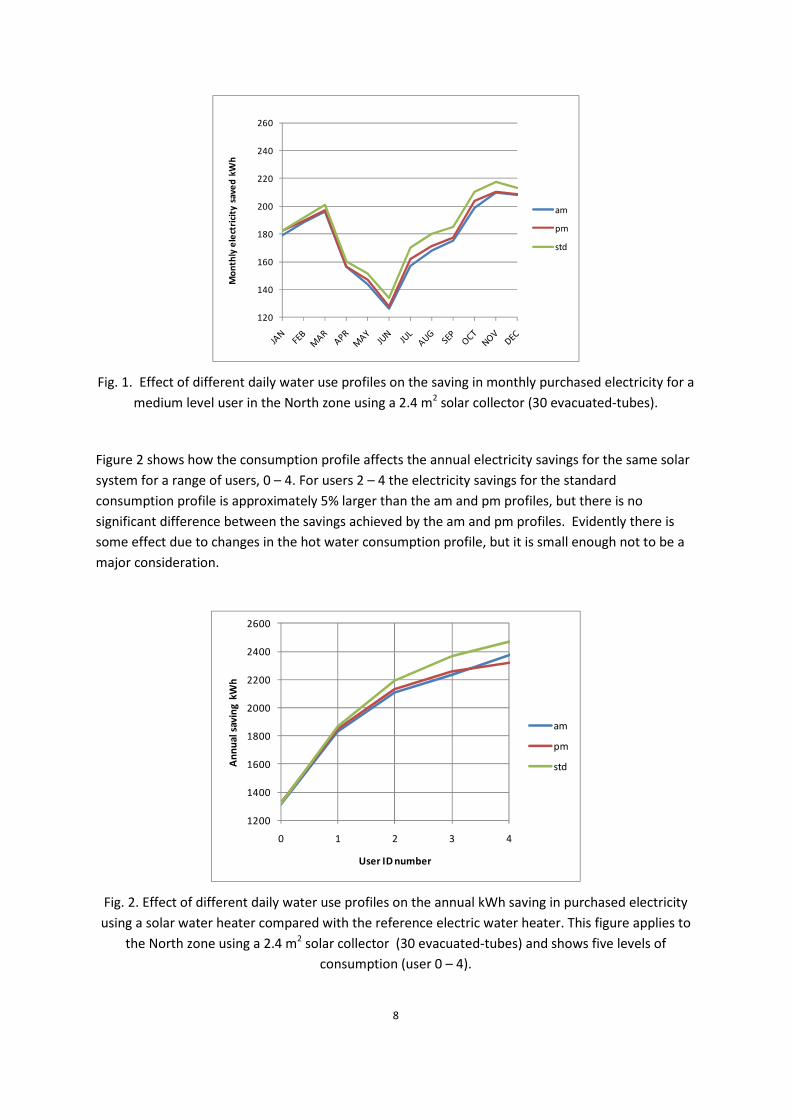
Fig. 3. Effect of different daily water use profiles on the saving in monthly purchased electricity for a
medium level user in the North zone using the heat pump water heater.
In comparison with the representative solar water heater, the savings achieved by the
representative heat pump system are almost entirely unaffected by variations in the daily
consumption profile. Figure 3, which illustrates the savings per month in the North zone for user 2,
shows that the hot water consumption profile has essentially no effect on the monthly savings.
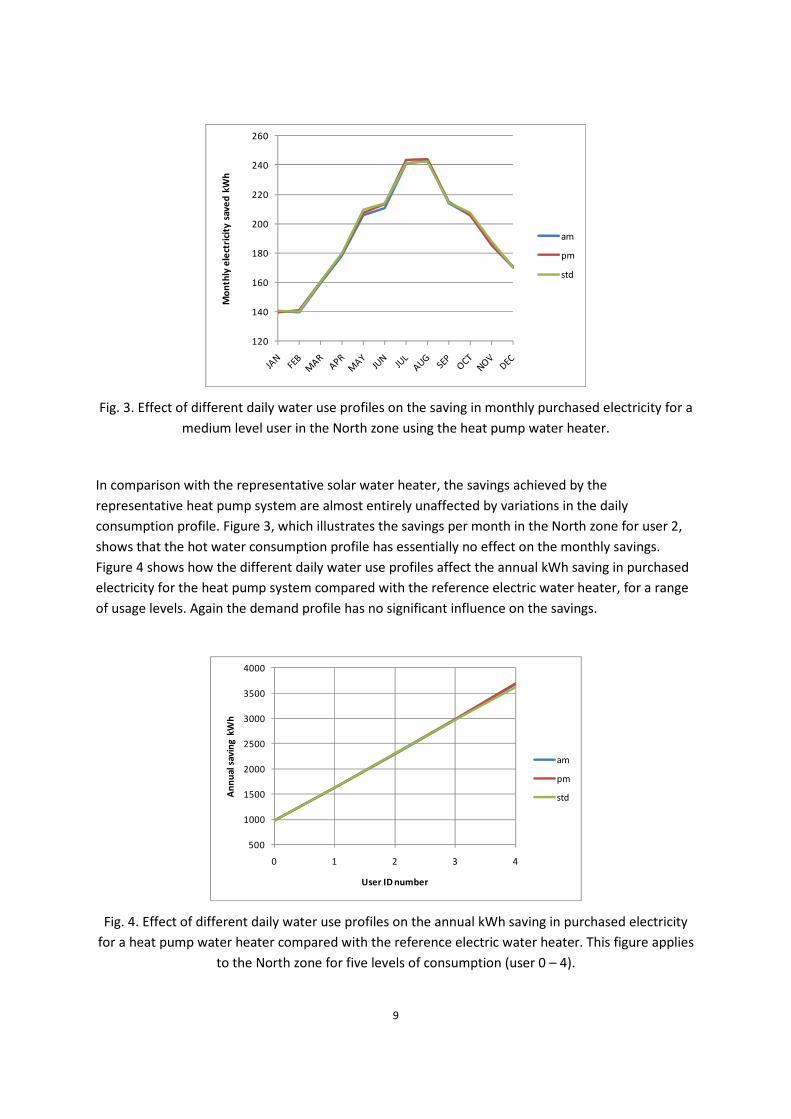
Figure 4 shows how the different daily water use profiles affect the annual kWh saving in purchased
electricity for the heat pump system compared with the reference electric water heater, for a range
of usage levels. Again the demand profile has no significant influence on the savings.
500
1000
1500
2000
2500
3000
3500
4000
0 1 2 3 4
An
nu
al
sav
ing
kW
h
User ID number
am
pm
std
Fig. 4. Effect of different daily water use profiles on the annual kWh saving in purchased electricity
for a heat pump water heater compared with the reference electric water heater. This figure applies
to the North zone for five levels of consumption (user 0 – 4).
10
This null result appears to be in contrast with data published by Bourke and Bansal14 who examined
the influence of the consumption profile on the performance of three heat pump water heaters,
using TRNSYS15 modelling (as here). These authors found that the demand profile had a significant
influence on the annual electricity consumption by the system, up to 12% of the annual electricity
use. They also found that the use of an alternative profile (not the standard profile defined in
AS/NZS4234), with larger peaks, produced improved efficiency for the three heat pump systems.
However, these changes were different for the three systems examined. The changes are also
relatively small when expressed as the change in the percentage annual savings relative to the
reference electric water heater, being between 1.5% and 4.8%. In the context of this report, these
changes are relatively small and are not out-of-line with the results shown in Figures 3 and 4.
The effect of the consumption profile on the savings for the solar and heat pump water heaters in
the South zone are not shown here, but the results are consistent with those for the North zone.
Hence the influence of the daily hot water consumption profile on the savings estimate for the
representative solar and heat pump water heaters is small, or not significant, in both the North and
South zones for the range of consumption levels examined. For this reason, only the standard daily
consumption profile is used in the following analyses.
4. How does the electricity demand change with the season?
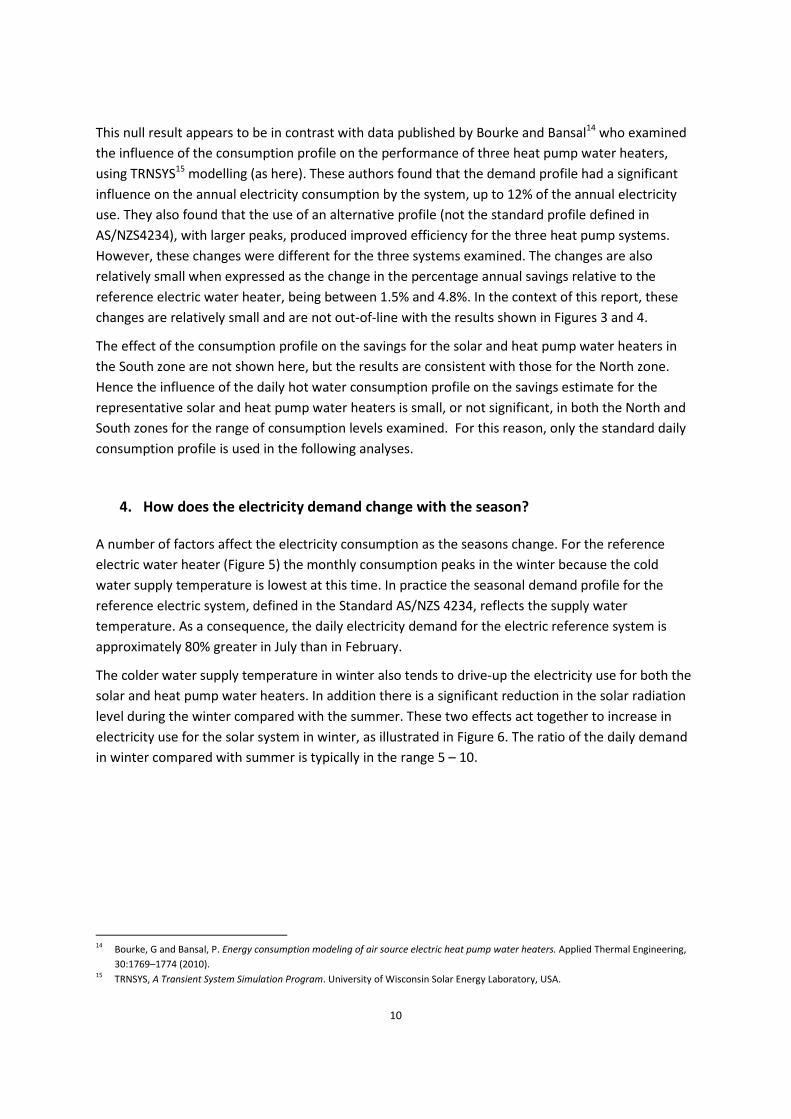
A number of factors affect the electricity consumption as the seasons change. For the reference
electric water heater (Figure 5) the monthly consumption peaks in the winter because the cold
water supply temperature is lowest at this time. In practice the seasonal demand profile for the
reference electric system, defined in the Standard AS/NZS 4234, reflects the supply water
temperature. As a consequence, the daily electricity demand for the electric reference system is
approximately 80% greater in July than in February.
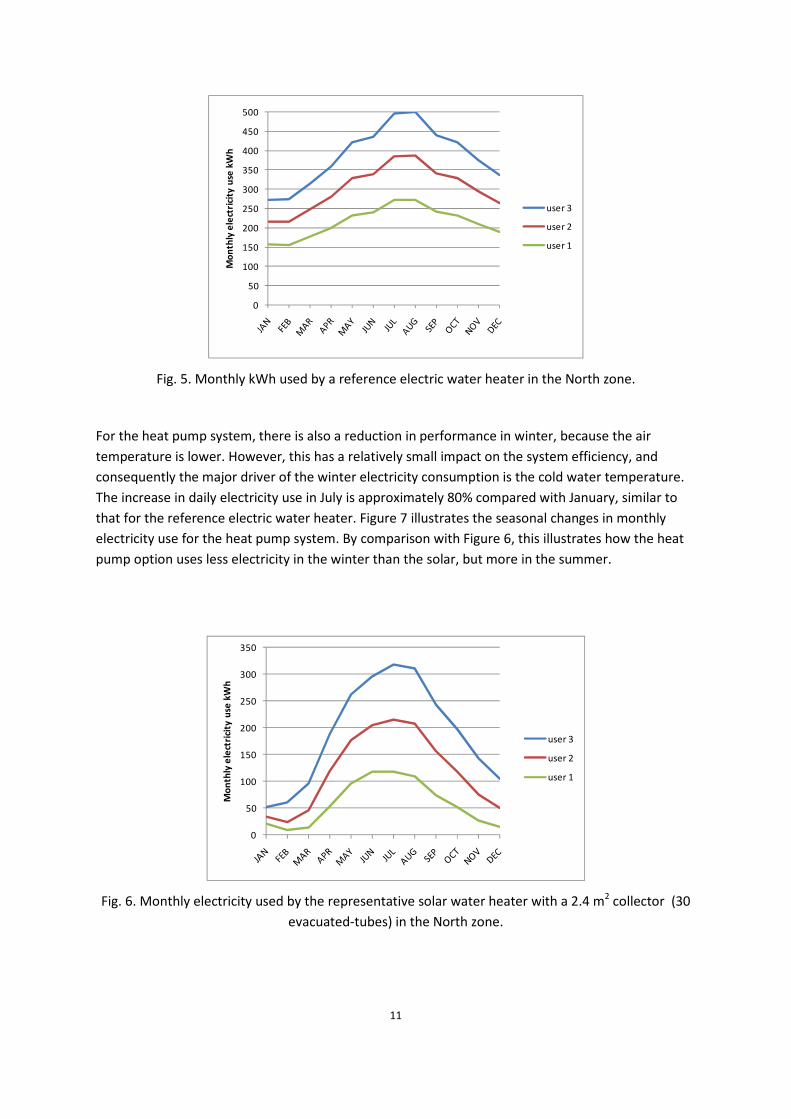
The colder water supply temperature in winter also tends to drive-up the electricity use for both the
solar and heat pump water heaters. In addition there is a significant reduction in the solar radiation
level during the winter compared with the summer. These two effects act together to increase in
electricity use for the solar system in winter, as illustrated in Figure 6. The ratio of the daily demand
in winter compared with summer is typically in the range 5 – 10.
14
Bourke, G and Bansal, P. Energy consumption modeling of air source electric heat pump water heaters. Applied Thermal Engineering,
30:1769–1774 (2010). 15
TRNSYS, A Transient System Simulation Program. University of Wisconsin Solar Energy Laboratory, USA.
11
0
50
100
150
200
250
300
350
400
450
500
Mo
nth
ly e
lect
rici
ty u
se k
Wh
user 3
user 2
user 1
Fig. 5. Monthly kWh used by a reference electric water heater in the North zone.
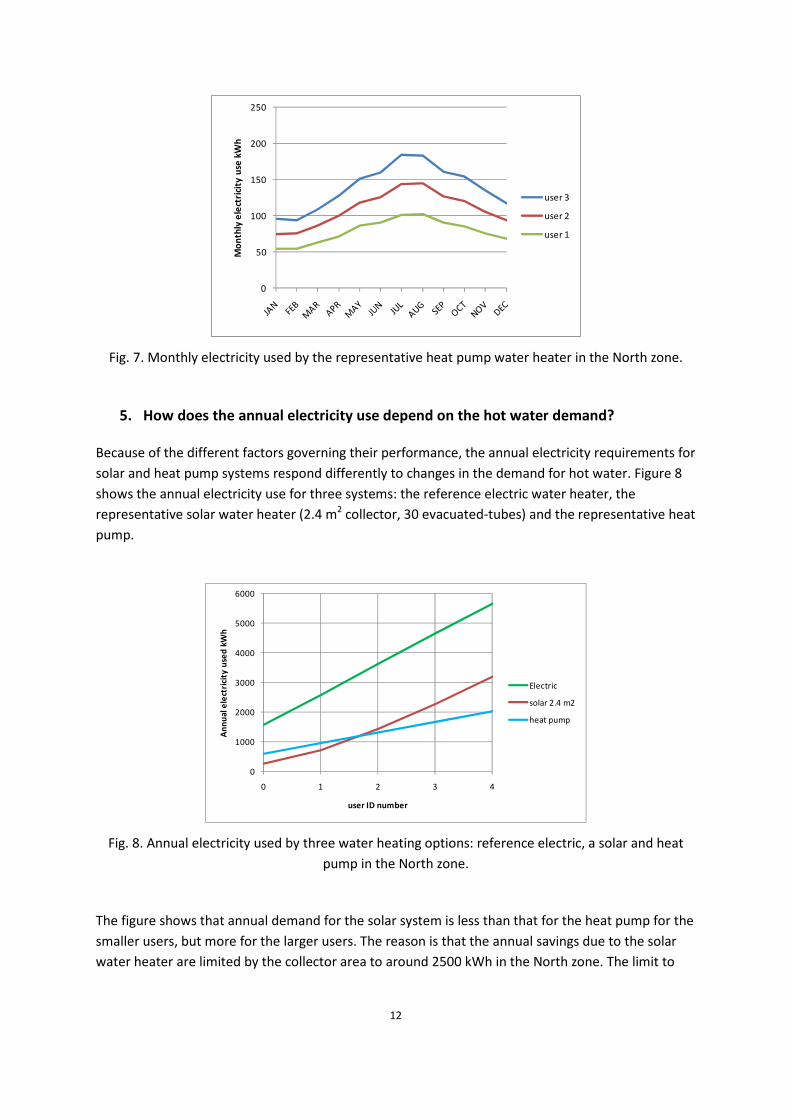
For the heat pump system, there is also a reduction in performance in winter, because the air
temperature is lower. However, this has a relatively small impact on the system efficiency, and
consequently the major driver of the winter electricity consumption is the cold water temperature.
The increase in daily electricity use in July is approximately 80% compared with January, similar to
that for the reference electric water heater. Figure 7 illustrates the seasonal changes in monthly
electricity use for the heat pump system. By comparison with Figure 6, this illustrates how the heat
pump option uses less electricity in the winter than the solar, but more in the summer.
0
50
100
150
200
250
300
350
Mo
nth
ly e
lect
rici
ty u
se k
Wh
user 3
user 2
user 1
Fig. 6. Monthly electricity used by the representative solar water heater with a 2.4 m2 collector (30
evacuated-tubes) in the North zone.
12
0
50
100
150
200
250
Mo
nth
ly e
lect
rici
ty u
se k
Wh
user 3
user 2
user 1
Fig. 7. Monthly electricity used by the representative heat pump water heater in the North zone.
5. How does the annual electricity use depend on the hot water demand?
Because of the different factors governing their performance, the annual electricity requirements for
solar and heat pump systems respond differently to changes in the demand for hot water. Figure 8
shows the annual electricity use for three systems: the reference electric water heater, the
representative solar water heater (2.4 m2 collector, 30 evacuated-tubes) and the representative heat
pump.
0
1000
2000
3000
4000
5000
6000
0 1 2 3 4
An
nu
al e
lect
rici
ty u
sed
kW
h
user ID number
Electric
solar 2.4 m2
heat pump
Fig. 8. Annual electricity used by three water heating options: reference electric, a solar and heat
pump in the North zone.
The figure shows that annual demand for the solar system is less than that for the heat pump for the
smaller users, but more for the larger users. The reason is that the annual savings due to the solar
water heater are limited by the collector area to around 2500 kWh in the North zone. The limit to
13
the savings achieved by the heat pump is much larger, more than 10000 kWh. As a consequence, the
electricity consumption of the solar system is more sensitive to increasing levels of demand than the
heat pump. This has implications for households where the demand for hot water changes over
time.
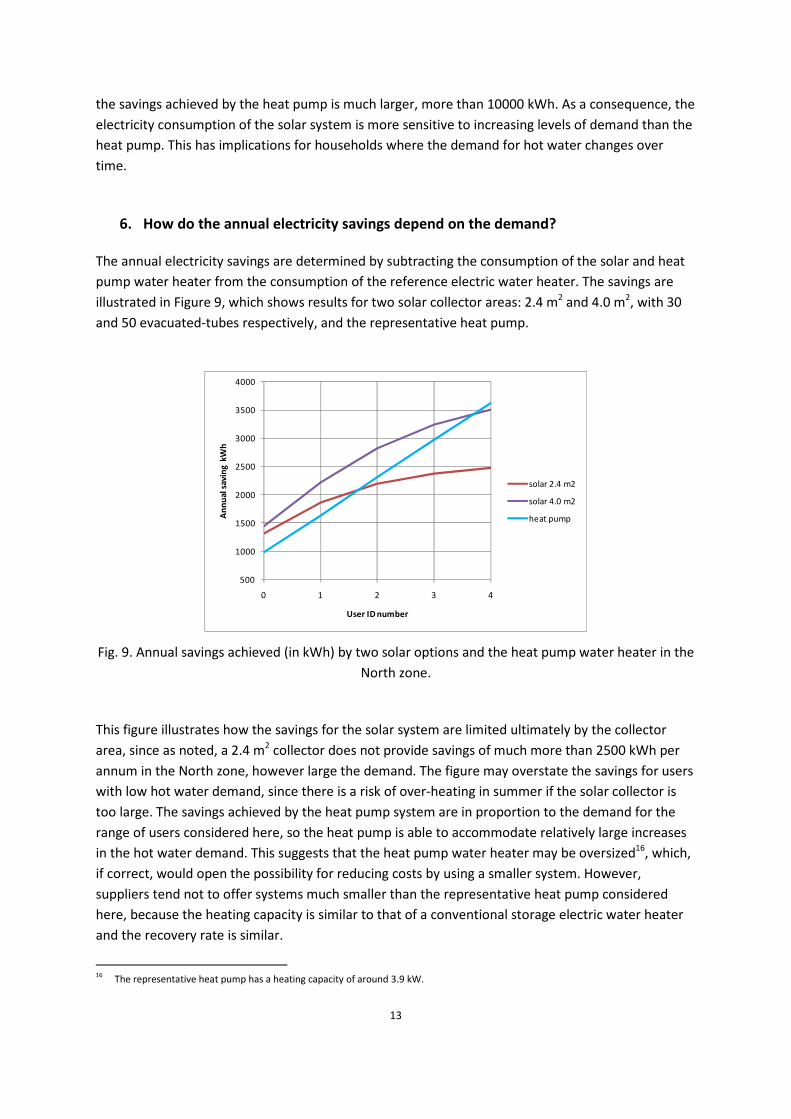
6. How do the annual electricity savings depend on the demand?
The annual electricity savings are determined by subtracting the consumption of the solar and heat
pump water heater from the consumption of the reference electric water heater. The savings are
illustrated in Figure 9, which shows results for two solar collector areas: 2.4 m2 and 4.0 m2, with 30
and 50 evacuated-tubes respectively, and the representative heat pump.
500
1000
1500
2000
2500
3000
3500
4000
0 1 2 3 4
An
nu
al
sav
ing
kW
h
User ID number
solar 2.4 m2
solar 4.0 m2
heat pump
Fig. 9. Annual savings achieved (in kWh) by two solar options and the heat pump water heater in the
North zone.
This figure illustrates how the savings for the solar system are limited ultimately by the collector
area, since as noted, a 2.4 m2 collector does not provide savings of much more than 2500 kWh per
annum in the North zone, however large the demand. The figure may overstate the savings for users
with low hot water demand, since there is a risk of over-heating in summer if the solar collector is
too large. The savings achieved by the heat pump system are in proportion to the demand for the
range of users considered here, so the heat pump is able to accommodate relatively large increases
in the hot water demand. This suggests that the heat pump water heater may be oversized16, which,
if correct, would open the possibility for reducing costs by using a smaller system. However,
suppliers tend not to offer systems much smaller than the representative heat pump considered
here, because the heating capacity is similar to that of a conventional storage electric water heater
and the recovery rate is similar.
16
The representative heat pump has a heating capacity of around 3.9 kW.
14
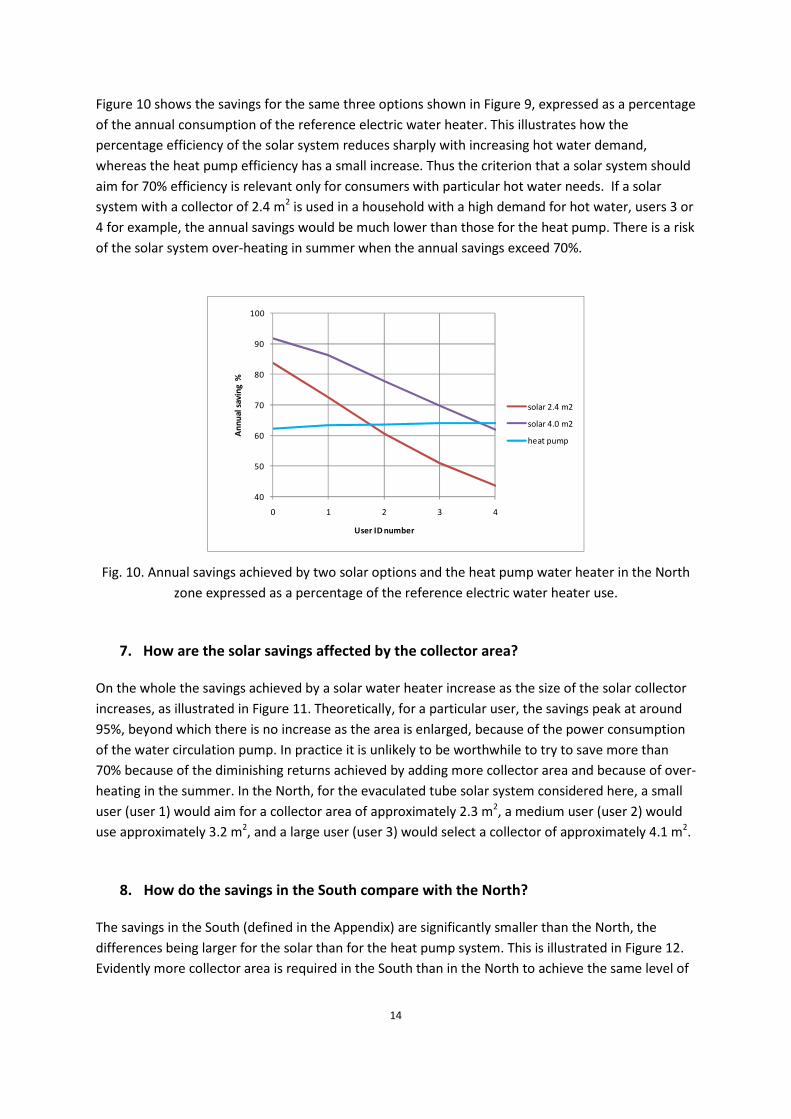
Figure 10 shows the savings for the same three options shown in Figure 9, expressed as a percentage
of the annual consumption of the reference electric water heater. This illustrates how the
percentage efficiency of the solar system reduces sharply with increasing hot water demand,
whereas the heat pump efficiency has a small increase. Thus the criterion that a solar system should
aim for 70% efficiency is relevant only for consumers with particular hot water needs. If a solar
system with a collector of 2.4 m2 is used in a household with a high demand for hot water, users 3 or
4 for example, the annual savings would be much lower than those for the heat pump. There is a risk
of the solar system over-heating in summer when the annual savings exceed 70%.
40
50
60
70
80
90
100
0 1 2 3 4
An
nu
al
sav
ing
%
User ID number
solar 2.4 m2
solar 4.0 m2
heat pump
Fig. 10. Annual savings achieved by two solar options and the heat pump water heater in the North
zone expressed as a percentage of the reference electric water heater use.
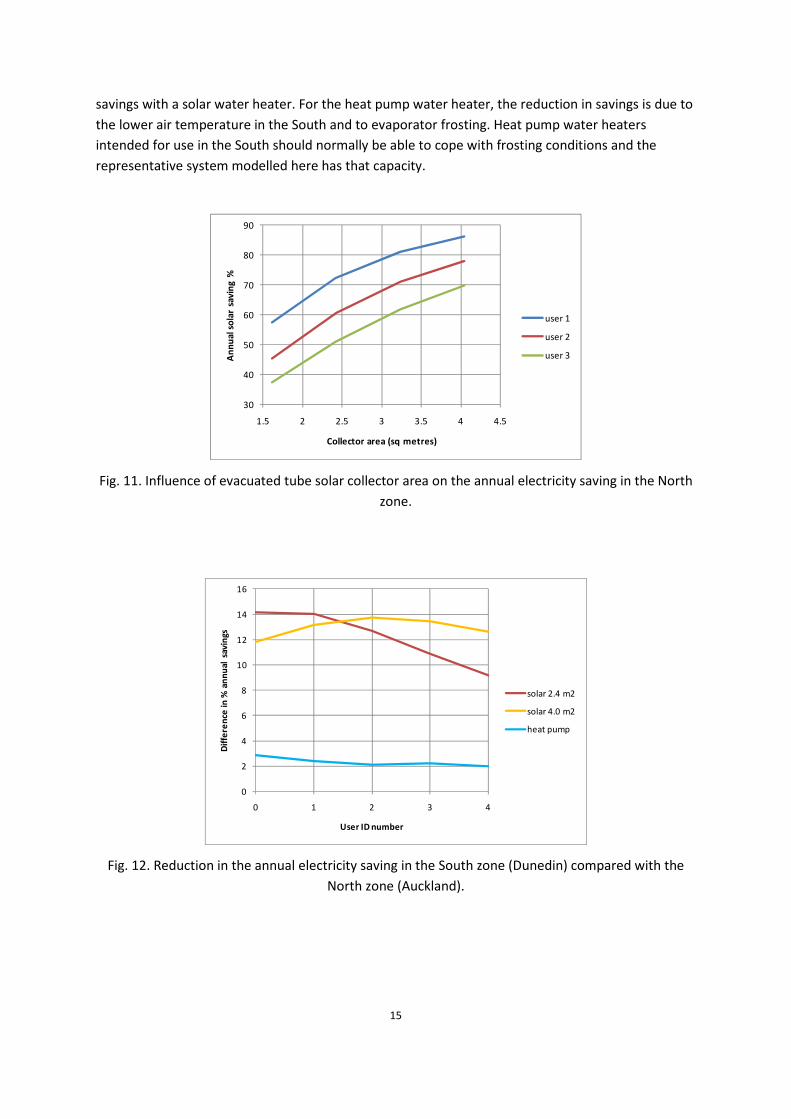
7. How are the solar savings affected by the collector area?
On the whole the savings achieved by a solar water heater increase as the size of the solar collector
increases, as illustrated in Figure 11. Theoretically, for a particular user, the savings peak at around
95%, beyond which there is no increase as the area is enlarged, because of the power consumption
of the water circulation pump. In practice it is unlikely to be worthwhile to try to save more than
70% because of the diminishing returns achieved by adding more collector area and because of over-
heating in the summer. In the North, for the evaculated tube solar system considered here, a small
user (user 1) would aim for a collector area of approximately 2.3 m2, a medium user (user 2) would
use approximately 3.2 m2, and a large user (user 3) would select a collector of approximately 4.1 m2.
8. How do the savings in the South compare with the North?
The savings in the South (defined in the Appendix) are significantly smaller than the North, the
differences being larger for the solar than for the heat pump system. This is illustrated in Figure 12.
Evidently more collector area is required in the South than in the North to achieve the same level of
15
savings with a solar water heater. For the heat pump water heater, the reduction in savings is due to
the lower air temperature in the South and to evaporator frosting. Heat pump water heaters
intended for use in the South should normally be able to cope with frosting conditions and the
representative system modelled here has that capacity.
30
40
50
60
70
80
90
1.5 2 2.5 3 3.5 4 4.5
An
nu
al
sola
r sa
vin
g %
Collector area (sq metres)
user 1
user 2
user 3
Fig. 11. Influence of evacuated tube solar collector area on the annual electricity saving in the North
zone.
0
2
4
6
8
10
12
14
16
0 1 2 3 4
Dif
fere
nce
in
% a
nn
ual
sav
ings
User ID number
solar 2.4 m2
solar 4.0 m2
heat pump
Fig. 12. Reduction in the annual electricity saving in the South zone (Dunedin) compared with the
North zone (Auckland).
16
9. Is Nelson a special case for solar water heating?
Based on long term records17 Nelson has 2405 sunshine hours per annum on average, the highest for
New Zealand cities. By comparison Auckland, Wellington and Christchurch have significantly less
sunshine at 2060, 2065 and 2100 hours respectively. There is therefore some justification for
Nelson’s aspiration “to be the solar capital of New Zealand”18. As part of this initiative the council
has set up a Solar Saver Scheme to encourage homeowners to install solar water heaters. Under this
scheme the Council pays the cost of the installed solar system and the owner pays for the system,
with interest, over a period of ten years, as a special rate on the property19. This section addresses
the question: do solar water heaters perform in Nelson much better than elsewhere?
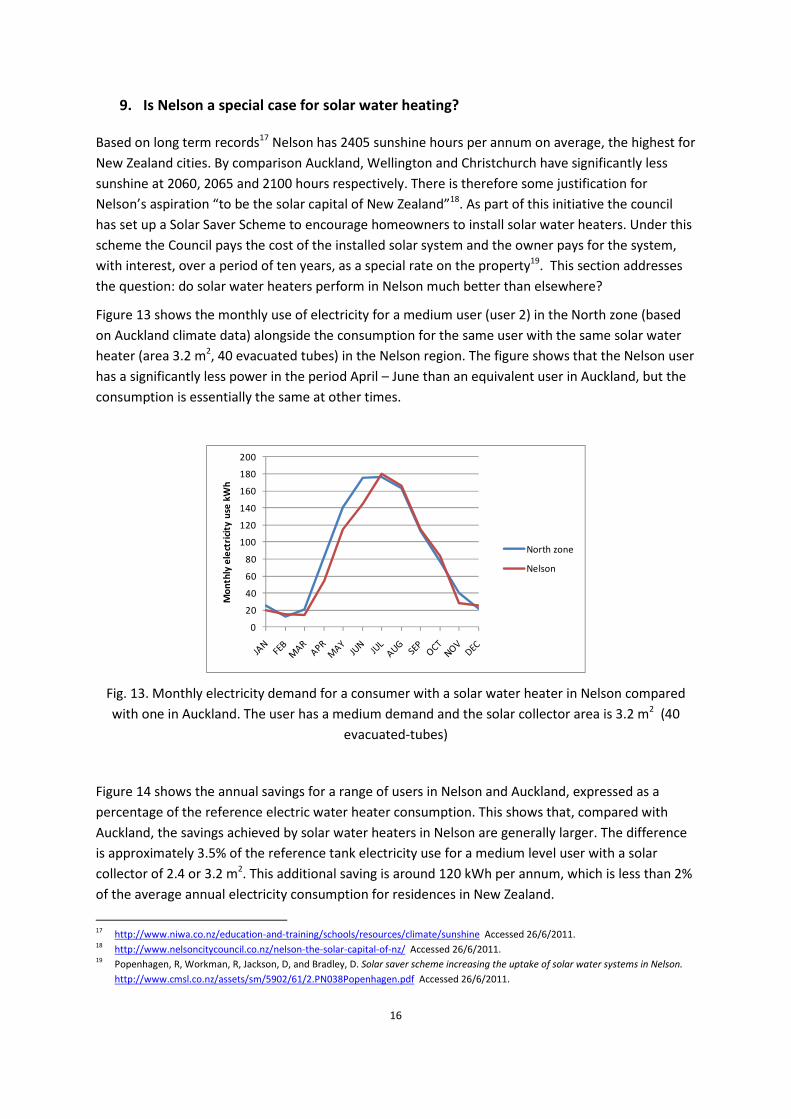
Figure 13 shows the monthly use of electricity for a medium user (user 2) in the North zone (based
on Auckland climate data) alongside the consumption for the same user with the same solar water
heater (area 3.2 m2, 40 evacuated tubes) in the Nelson region. The figure shows that the Nelson user
has a significantly less power in the period April – June than an equivalent user in Auckland, but the
consumption is essentially the same at other times.
0
20
40
60
80
100
120
140
160
180
200
Mo
nth
ly e
lect
rici
ty u
se k
Wh
North zone
Nelson
Fig. 13. Monthly electricity demand for a consumer with a solar water heater in Nelson compared
with one in Auckland. The user has a medium demand and the solar collector area is 3.2 m2 (40
evacuated-tubes)
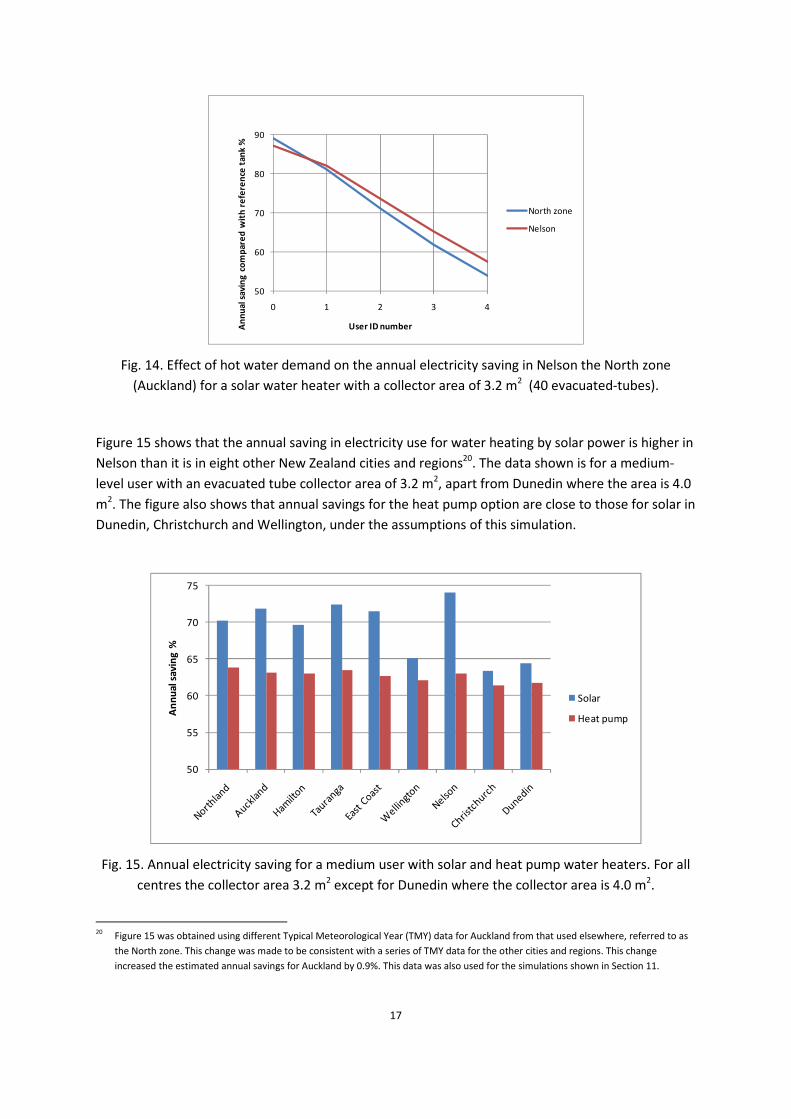
Figure 14 shows the annual savings for a range of users in Nelson and Auckland, expressed as a
percentage of the reference electric water heater consumption. This shows that, compared with
Auckland, the savings achieved by solar water heaters in Nelson are generally larger. The difference
is approximately 3.5% of the reference tank electricity use for a medium level user with a solar
collector of 2.4 or 3.2 m2. This additional saving is around 120 kWh per annum, which is less than 2%
of the average annual electricity consumption for residences in New Zealand.
17
http://www.niwa.co.nz/education-and-training/schools/resources/climate/sunshine Accessed 26/6/2011. 18
http://www.nelsoncitycouncil.co.nz/nelson-the-solar-capital-of-nz/ Accessed 26/6/2011. 19
Popenhagen, R, Workman, R, Jackson, D, and Bradley, D. Solar saver scheme increasing the uptake of solar water systems in Nelson.
http://www.cmsl.co.nz/assets/sm/5902/61/2.PN038Popenhagen.pdf Accessed 26/6/2011.
17
50
60
70
80
90
0 1 2 3 4
An
nu
al
savi
ng
com
pa
red
wit
h r
efe
ren
ce t
an
k %
User ID number
North zone
Nelson
Fig. 14. Effect of hot water demand on the annual electricity saving in Nelson the North zone
(Auckland) for a solar water heater with a collector area of 3.2 m2 (40 evacuated-tubes).
Figure 15 shows that the annual saving in electricity use for water heating by solar power is higher in
Nelson than it is in eight other New Zealand cities and regions20. The data shown is for a medium-
level user with an evacuated tube collector area of 3.2 m2, apart from Dunedin where the area is 4.0
m2. The figure also shows that annual savings for the heat pump option are close to those for solar in
Dunedin, Christchurch and Wellington, under the assumptions of this simulation.
50
55
60
65
70
75
An
nu
al
sav
ing
%
Solar
Heat pump
Fig. 15. Annual electricity saving for a medium user with solar and heat pump water heaters. For all
centres the collector area 3.2 m2 except for Dunedin where the collector area is 4.0 m2.
20
Figure 15 was obtained using different Typical Meteorological Year (TMY) data for Auckland from that used elsewhere, referred to as
the North zone. This change was made to be consistent with a series of TMY data for the other cities and regions. This change
increased the estimated annual savings for Auckland by 0.9%. This data was also used for the simulations shown in Section 11.
18
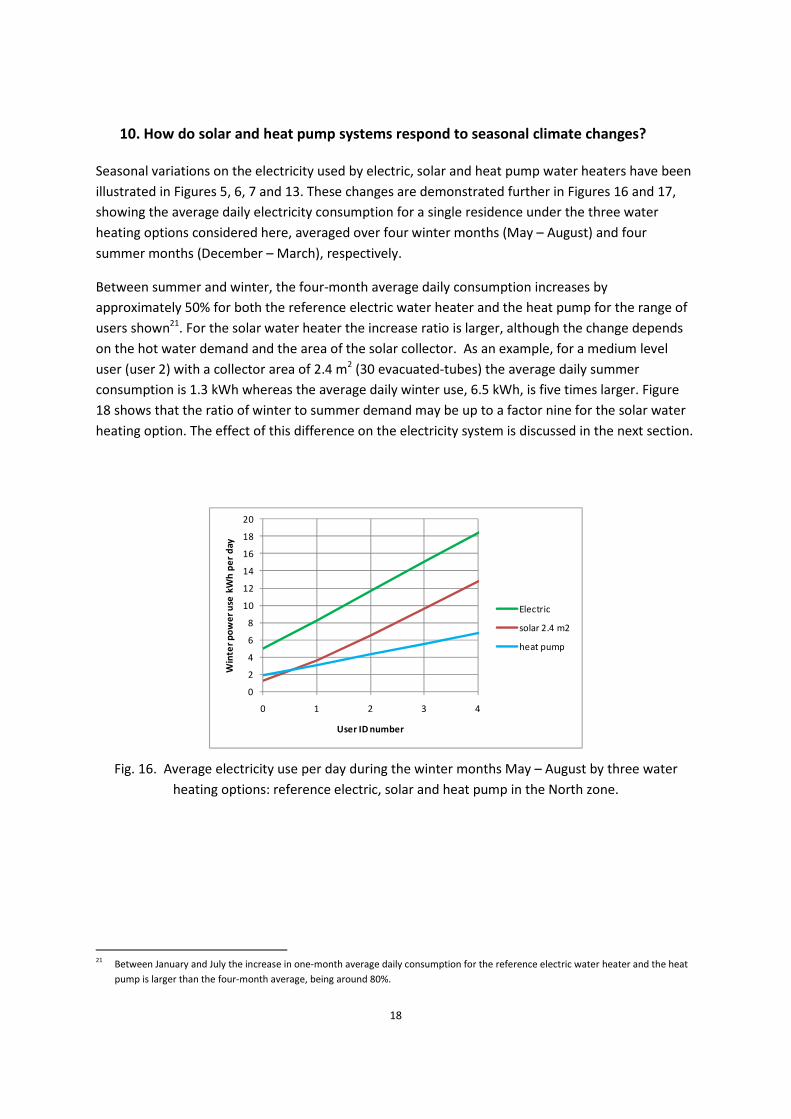
10. How do solar and heat pump systems respond to seasonal climate changes?
Seasonal variations on the electricity used by electric, solar and heat pump water heaters have been
illustrated in Figures 5, 6, 7 and 13. These changes are demonstrated further in Figures 16 and 17,
showing the average daily electricity consumption for a single residence under the three water
heating options considered here, averaged over four winter months (May – August) and four
summer months (December – March), respectively.
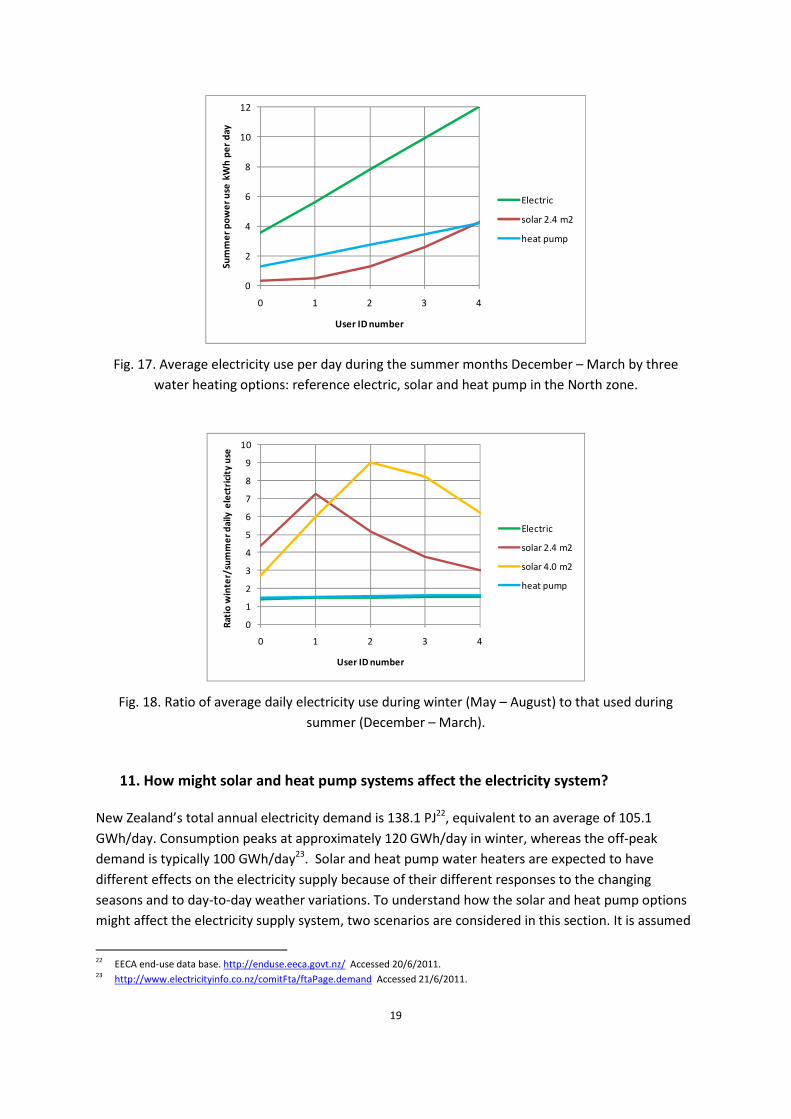
Between summer and winter, the four-month average daily consumption increases by
approximately 50% for both the reference electric water heater and the heat pump for the range of
users shown21. For the solar water heater the increase ratio is larger, although the change depends
on the hot water demand and the area of the solar collector. As an example, for a medium level
user (user 2) with a collector area of 2.4 m2 (30 evacuated-tubes) the average daily summer
consumption is 1.3 kWh whereas the average daily winter use, 6.5 kWh, is five times larger. Figure
18 shows that the ratio of winter to summer demand may be up to a factor nine for the solar water
heating option. The effect of this difference on the electricity system is discussed in the next section.
0
2
4
6
8
10
12
14
16
18
20
0 1 2 3 4
Win
ter
po
we
r u
se k
Wh
pe
r d
ay
User ID number
Electric
solar 2.4 m2
heat pump
Fig. 16. Average electricity use per day during the winter months May – August by three water
heating options: reference electric, solar and heat pump in the North zone.
21
Between January and July the increase in one-month average daily consumption for the reference electric water heater and the heat
pump is larger than the four-month average, being around 80%.
19
0
2
4
6
8
10
12
0 1 2 3 4
Su
mm
er
po
we
r u
se k
Wh
pe
r d
ay
User ID number
Electric
solar 2.4 m2
heat pump
Fig. 17. Average electricity use per day during the summer months December – March by three
water heating options: reference electric, solar and heat pump in the North zone.
0
1
2
3
4
5
6
7
8
9
10
0 1 2 3 4
Ra
tio
win
ter/
sum
me
r d
ail
y e
lect
rici
ty u
se
User ID number
Electric
solar 2.4 m2
solar 4.0 m2
heat pump
Fig. 18. Ratio of average daily electricity use during winter (May – August) to that used during
summer (December – March).
11. How might solar and heat pump systems affect the electricity system?
New Zealand’s total annual electricity demand is 138.1 PJ22, equivalent to an average of 105.1
GWh/day. Consumption peaks at approximately 120 GWh/day in winter, whereas the off-peak
demand is typically 100 GWh/day23. Solar and heat pump water heaters are expected to have
different effects on the electricity supply because of their different responses to the changing
seasons and to day-to-day weather variations. To understand how the solar and heat pump options
might affect the electricity supply system, two scenarios are considered in this section. It is assumed
22
EECA end-use data base. http://enduse.eeca.govt.nz/ Accessed 20/6/2011. 23
http://www.electricityinfo.co.nz/comitFta/ftaPage.demand Accessed 21/6/2011.
20
that, at some future time, 80% of all electrically heated hot water demand will have switched over
from conventional electrical heating to either (i) solar or (ii) heat pump water heating.
The total annual electricity demand for water heating is 19.9 PJ, including both household and other
hot water users. The switch in water heating technology would affect 80% of this quantity, 15.9 PJ
per annum, being 11.5% of the all national electricity demand, or 12.1 GWh/day expressed as an
annual average. The consequences of this change to solar or heat pump water heating on such a
large scale are modelled by supposing that 1.22 M New Zealand households, all with medium hot
water demand24, switch to either solar or heat pump water heating. The households are distributed
in proportion to their populations among nine cities and regions, including Northland, Auckland,
Hamilton, Tauranga, East Coast, Wellington, Nelson, Christchurch and Dunedin25. In order for most
medium level users in the North (including Nelson and Christchurch) to achieve a saving of
approximately 70% with the solar option the area of household collectors is 3.2 m2 (40 evacuated-
tubes), except for Dunedin where the area is 4.0 m2 (50 evacuated-tubes).
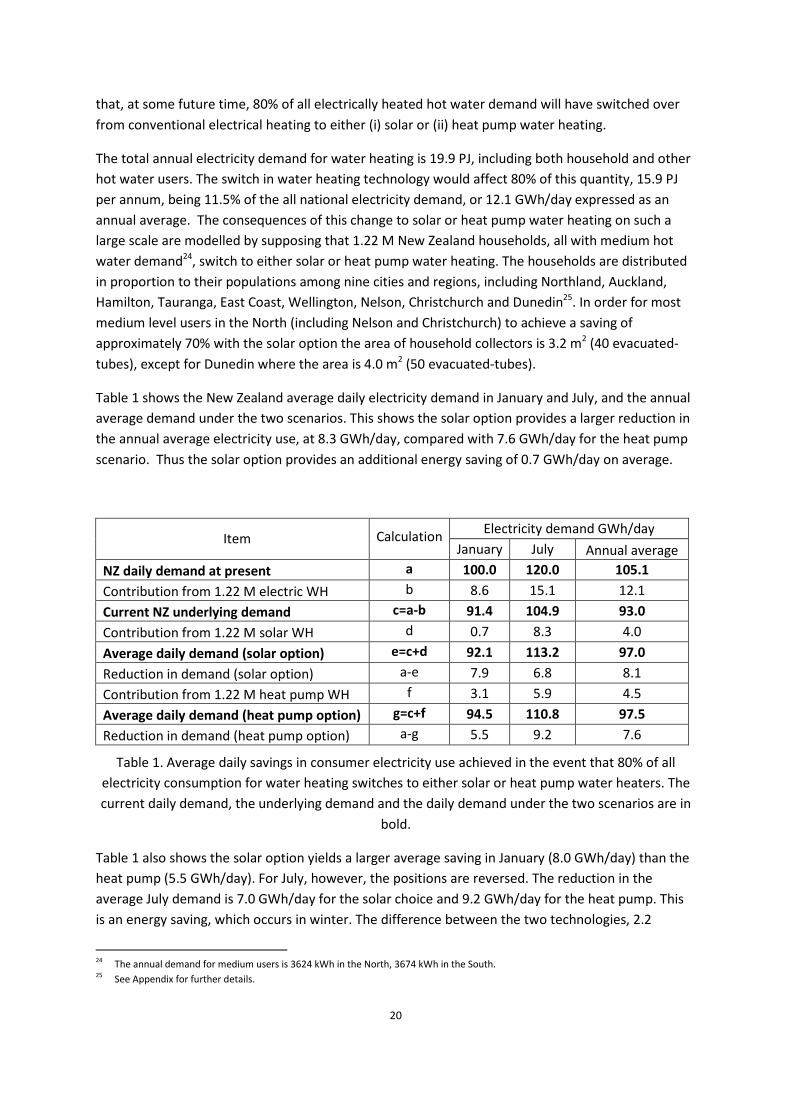
Table 1 shows the New Zealand average daily electricity demand in January and July, and the annual
average demand under the two scenarios. This shows the solar option provides a larger reduction in
the annual average electricity use, at 8.3 GWh/day, compared with 7.6 GWh/day for the heat pump
scenario. Thus the solar option provides an additional energy saving of 0.7 GWh/day on average.
Electricity demand GWh/day Item Calculation
January July Annual average
NZ daily demand at present a 100.0 120.0 105.1
Contribution from 1.22 M electric WH b 8.6 15.1 12.1
Current NZ underlying demand c=a-b 91.4 104.9 93.0
Contribution from 1.22 M solar WH d 0.7 8.3 4.0
Average daily demand (solar option) e=c+d 92.1 113.2 97.0
Reduction in demand (solar option) a-e 7.9 6.8 8.1
Contribution from 1.22 M heat pump WH f 3.1 5.9 4.5
Average daily demand (heat pump option) g=c+f 94.5 110.8 97.5
Reduction in demand (heat pump option) a-g 5.5 9.2 7.6
Table 1. Average daily savings in consumer electricity use achieved in the event that 80% of all
electricity consumption for water heating switches to either solar or heat pump water heaters. The
current daily demand, the underlying demand and the daily demand under the two scenarios are in
bold.
Table 1 also shows the solar option yields a larger average saving in January (8.0 GWh/day) than the
heat pump (5.5 GWh/day). For July, however, the positions are reversed. The reduction in the
average July demand is 7.0 GWh/day for the solar choice and 9.2 GWh/day for the heat pump. This
is an energy saving, which occurs in winter. The difference between the two technologies, 2.2
24
The annual demand for medium users is 3624 kWh in the North, 3674 kWh in the South. 25
See Appendix for further details.
21
GWH/day, is 2% of the annual average daily electricity demand. This difference may be important in
a dry-year when electricity shortages tend to occur in winter.
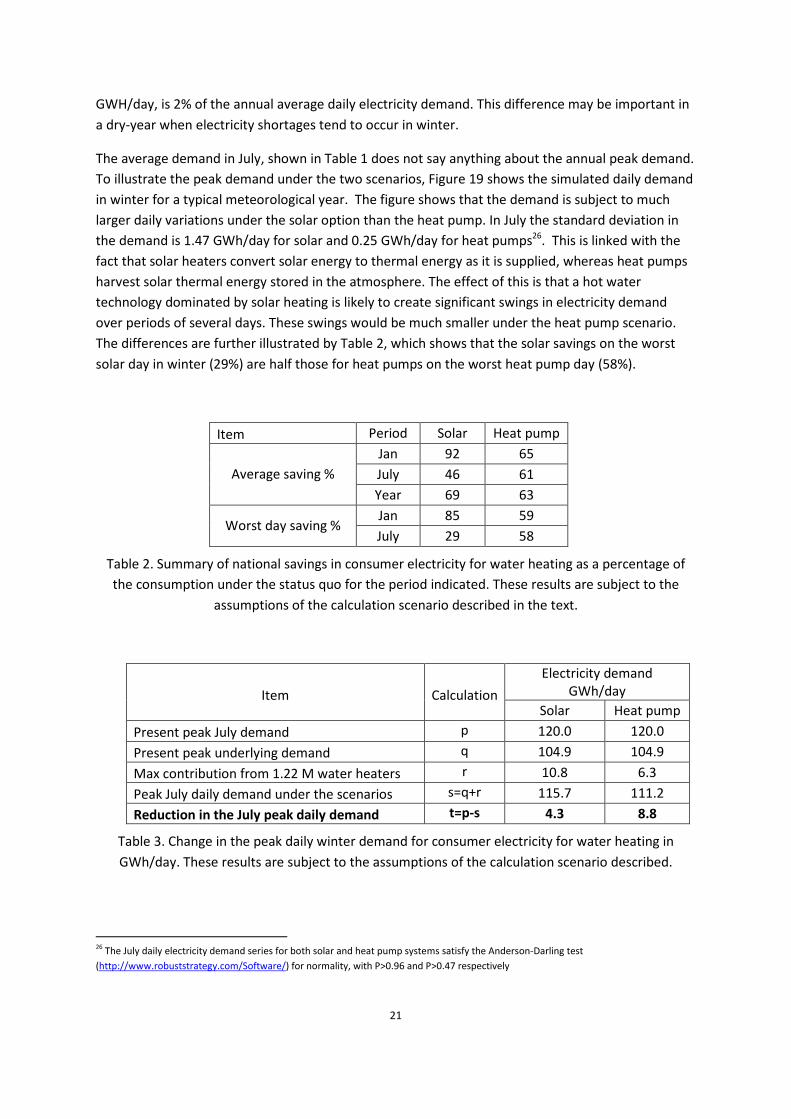
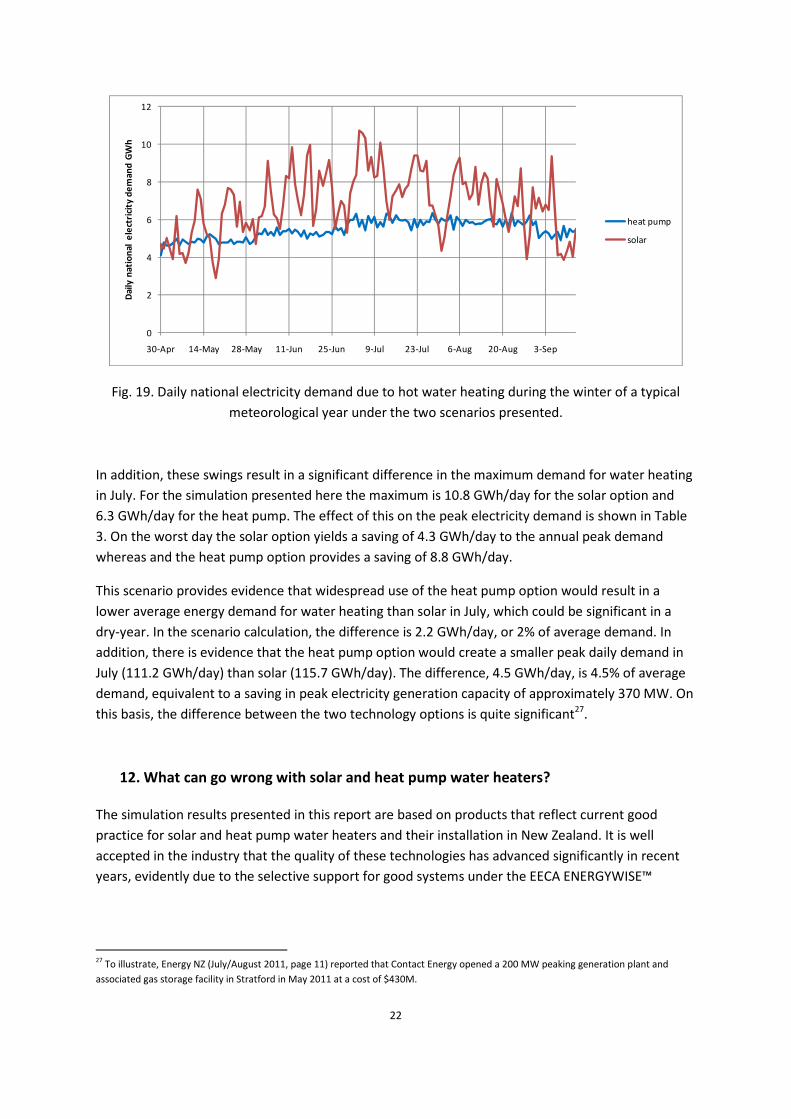
The average demand in July, shown in Table 1 does not say anything about the annual peak demand.
To illustrate the peak demand under the two scenarios, Figure 19 shows the simulated daily demand
in winter for a typical meteorological year. The figure shows that the demand is subject to much
larger daily variations under the solar option than the heat pump. In July the standard deviation in
the demand is 1.47 GWh/day for solar and 0.25 GWh/day for heat pumps26. This is linked with the
fact that solar heaters convert solar energy to thermal energy as it is supplied, whereas heat pumps
harvest solar thermal energy stored in the atmosphere. The effect of this is that a hot water
technology dominated by solar heating is likely to create significant swings in electricity demand
over periods of several days. These swings would be much smaller under the heat pump scenario.
The differences are further illustrated by Table 2, which shows that the solar savings on the worst
solar day in winter (29%) are half those for heat pumps on the worst heat pump day (58%).
Item Period Solar Heat pump
Jan 92 65
July 46 61 Average saving %
Year 69 63
Jan 85 59 Worst day saving %
July 29 58
Table 2. Summary of national savings in consumer electricity for water heating as a percentage of
the consumption under the status quo for the period indicated. These results are subject to the
assumptions of the calculation scenario described in the text.
Electricity demand
GWh/day Item Calculation Solar Heat pump
Present peak July demand p 120.0 120.0
Present peak underlying demand q 104.9 104.9
Max contribution from 1.22 M water heaters r 10.8 6.3
Peak July daily demand under the scenarios s=q+r 115.7 111.2
Reduction in the July peak daily demand t=p-s 4.3 8.8
Table 3. Change in the peak daily winter demand for consumer electricity for water heating in
GWh/day. These results are subject to the assumptions of the calculation scenario described.
26
The July daily electricity demand series for both solar and heat pump systems satisfy the Anderson-Darling test
(http://www.robuststrategy.com/Software/) for normality, with P>0.96 and P>0.47 respectively
22
0
2
4
6
8
10
12
30-Apr 14-May 28-May 11-Jun 25-Jun 9-Jul 23-Jul 6-Aug 20-Aug 3-Sep
Da
ily
na
tio
na
l e
lect
rici
ty d
em
an
d G
Wh
heat pump
solar
Fig. 19. Daily national electricity demand due to hot water heating during the winter of a typical
meteorological year under the two scenarios presented.
In addition, these swings result in a significant difference in the maximum demand for water heating
in July. For the simulation presented here the maximum is 10.8 GWh/day for the solar option and
6.3 GWh/day for the heat pump. The effect of this on the peak electricity demand is shown in Table
3. On the worst day the solar option yields a saving of 4.3 GWh/day to the annual peak demand
whereas and the heat pump option provides a saving of 8.8 GWh/day.
This scenario provides evidence that widespread use of the heat pump option would result in a
lower average energy demand for water heating than solar in July, which could be significant in a
dry-year. In the scenario calculation, the difference is 2.2 GWh/day, or 2% of average demand. In
addition, there is evidence that the heat pump option would create a smaller peak daily demand in
July (111.2 GWh/day) than solar (115.7 GWh/day). The difference, 4.5 GWh/day, is 4.5% of average
demand, equivalent to a saving in peak electricity generation capacity of approximately 370 MW. On
this basis, the difference between the two technology options is quite significant27.
12. What can go wrong with solar and heat pump water heaters?
The simulation results presented in this report are based on products that reflect current good
practice for solar and heat pump water heaters and their installation in New Zealand. It is well
accepted in the industry that the quality of these technologies has advanced significantly in recent
years, evidently due to the selective support for good systems under the EECA ENERGYWISE™
27
To illustrate, Energy NZ (July/August 2011, page 11) reported that Contact Energy opened a 200 MW peaking generation plant and
associated gas storage facility in Stratford in May 2011 at a cost of $430M.
23
schemes28. There are a number of reports on the problems faced by these technologies prior to the
recent improvements, and these are reviewed in this section.
Solar
In 2006 EECA commissioned BRANZ to make an assessment of the energy performance, installation
quality and durability of solar water heaters in New Zealand. The resulting study29,30 included
measurements on 35 solar water heaters over a period of one year, plus measurements on four heat
pump water heaters over a summer season. On average 38% of the household hot water use was
supplied by solar energy. Translating this into the energy savings compared with the reference
electric water heater defined in AS/NZS4234, the savings in purchased electricity were in the range
25 – 30%. More than half the solar water heaters tested provided less than 10% of the hot water
used during the winter. These savings are low compared with current good-practice and the authors
identified a number of problems:
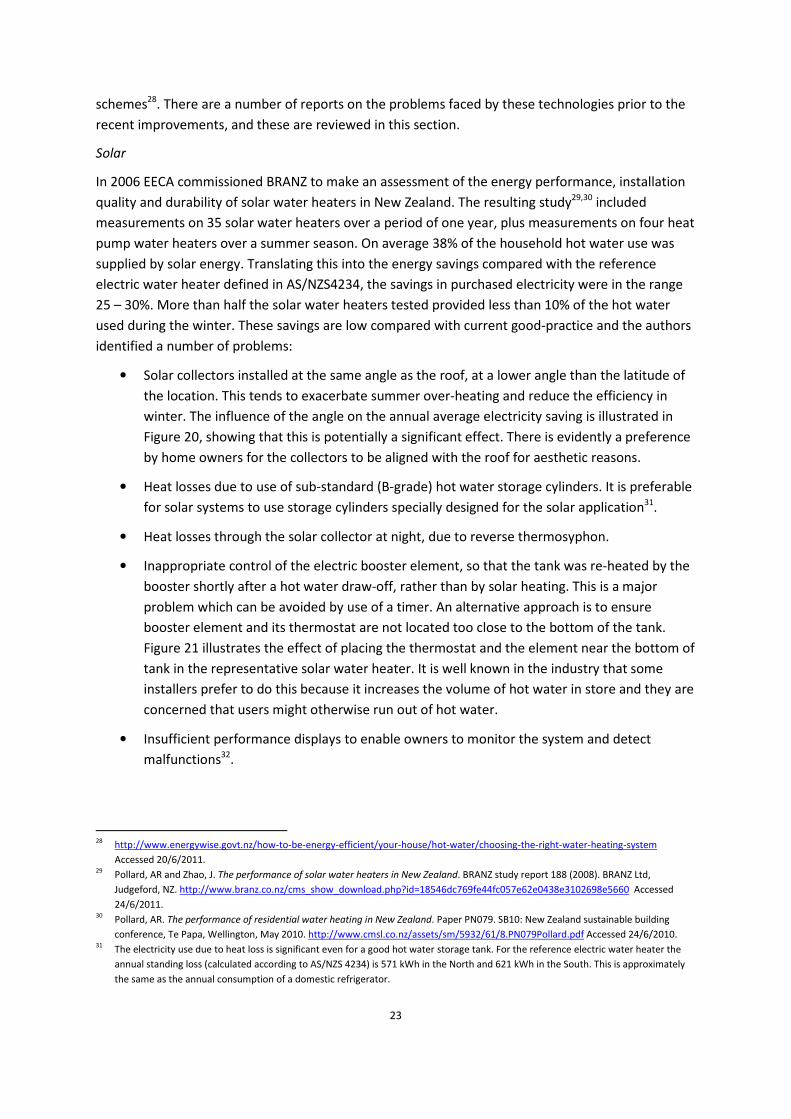
• Solar collectors installed at the same angle as the roof, at a lower angle than the latitude of
the location. This tends to exacerbate summer over-heating and reduce the efficiency in
winter. The influence of the angle on the annual average electricity saving is illustrated in
Figure 20, showing that this is potentially a significant effect. There is evidently a preference
by home owners for the collectors to be aligned with the roof for aesthetic reasons.
• Heat losses due to use of sub-standard (B-grade) hot water storage cylinders. It is preferable
for solar systems to use storage cylinders specially designed for the solar application31.
• Heat losses through the solar collector at night, due to reverse thermosyphon.
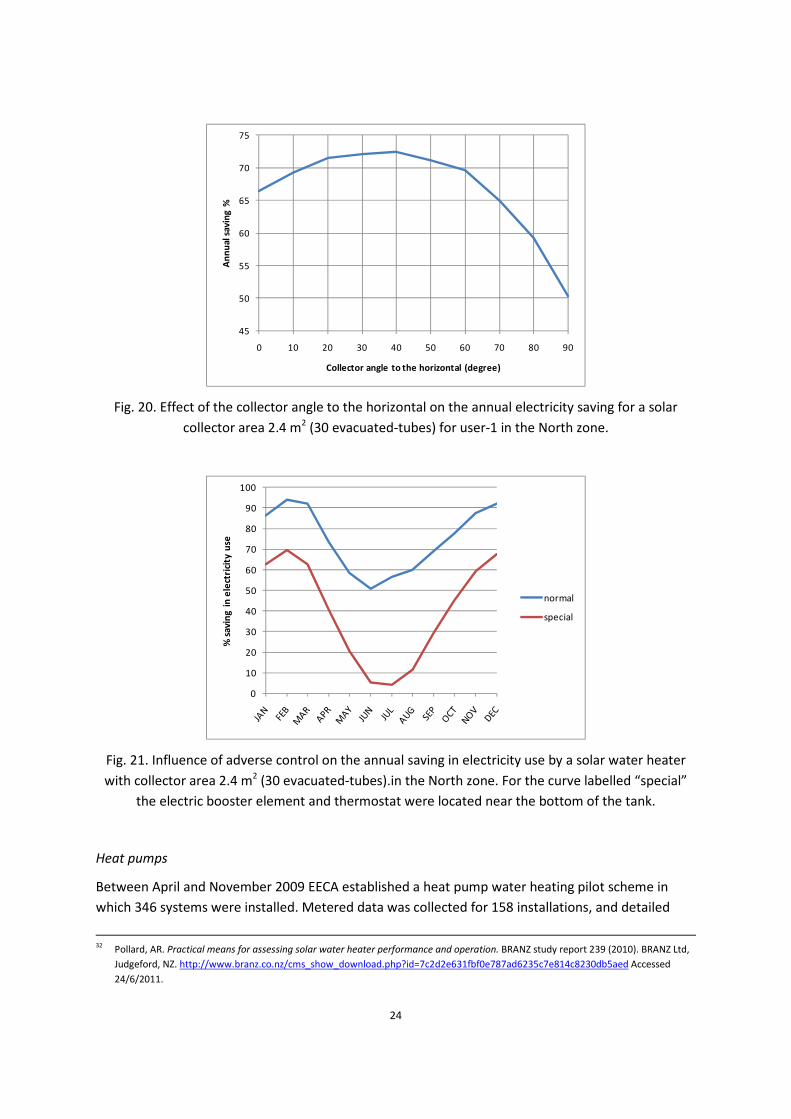
• Inappropriate control of the electric booster element, so that the tank was re-heated by the
booster shortly after a hot water draw-off, rather than by solar heating. This is a major
problem which can be avoided by use of a timer. An alternative approach is to ensure
booster element and its thermostat are not located too close to the bottom of the tank.
Figure 21 illustrates the effect of placing the thermostat and the element near the bottom of
tank in the representative solar water heater. It is well known in the industry that some
installers prefer to do this because it increases the volume of hot water in store and they are
concerned that users might otherwise run out of hot water.
• Insufficient performance displays to enable owners to monitor the system and detect
malfunctions32.
28
http://www.energywise.govt.nz/how-to-be-energy-efficient/your-house/hot-water/choosing-the-right-water-heating-system
Accessed 20/6/2011. 29
Pollard, AR and Zhao, J. The performance of solar water heaters in New Zealand. BRANZ study report 188 (2008). BRANZ Ltd,
Judgeford, NZ. http://www.branz.co.nz/cms_show_download.php?id=18546dc769fe44fc057e62e0438e3102698e5660 Accessed
24/6/2011. 30
Pollard, AR. The performance of residential water heating in New Zealand. Paper PN079. SB10: New Zealand sustainable building
conference, Te Papa, Wellington, May 2010. http://www.cmsl.co.nz/assets/sm/5932/61/8.PN079Pollard.pdf Accessed 24/6/2010. 31
The electricity use due to heat loss is significant even for a good hot water storage tank. For the reference electric water heater the
annual standing loss (calculated according to AS/NZS 4234) is 571 kWh in the North and 621 kWh in the South. This is approximately
the same as the annual consumption of a domestic refrigerator.
24
45
50
55
60
65
70
75
0 10 20 30 40 50 60 70 80 90
An
nu
al s
av
ing
%
Collector angle to the horizontal (degree)
Fig. 20. Effect of the collector angle to the horizontal on the annual electricity saving for a solar
collector area 2.4 m2 (30 evacuated-tubes) for user-1 in the North zone.
0
10
20
30
40
50
60
70
80
90
100
% s
avi
ng
in e
lect
rici
ty u
se
normal
special
Fig. 21. Influence of adverse control on the annual saving in electricity use by a solar water heater
with collector area 2.4 m2 (30 evacuated-tubes).in the North zone. For the curve labelled “special”
the electric booster element and thermostat were located near the bottom of the tank.
Heat pumps
Between April and November 2009 EECA established a heat pump water heating pilot scheme in
which 346 systems were installed. Metered data was collected for 158 installations, and detailed
32
Pollard, AR. Practical means for assessing solar water heater performance and operation. BRANZ study report 239 (2010). BRANZ Ltd,
Judgeford, NZ. http://www.branz.co.nz/cms_show_download.php?id=7c2d2e631fbf0e787ad6235c7e814c8230db5aed Accessed
24/6/2011.
25
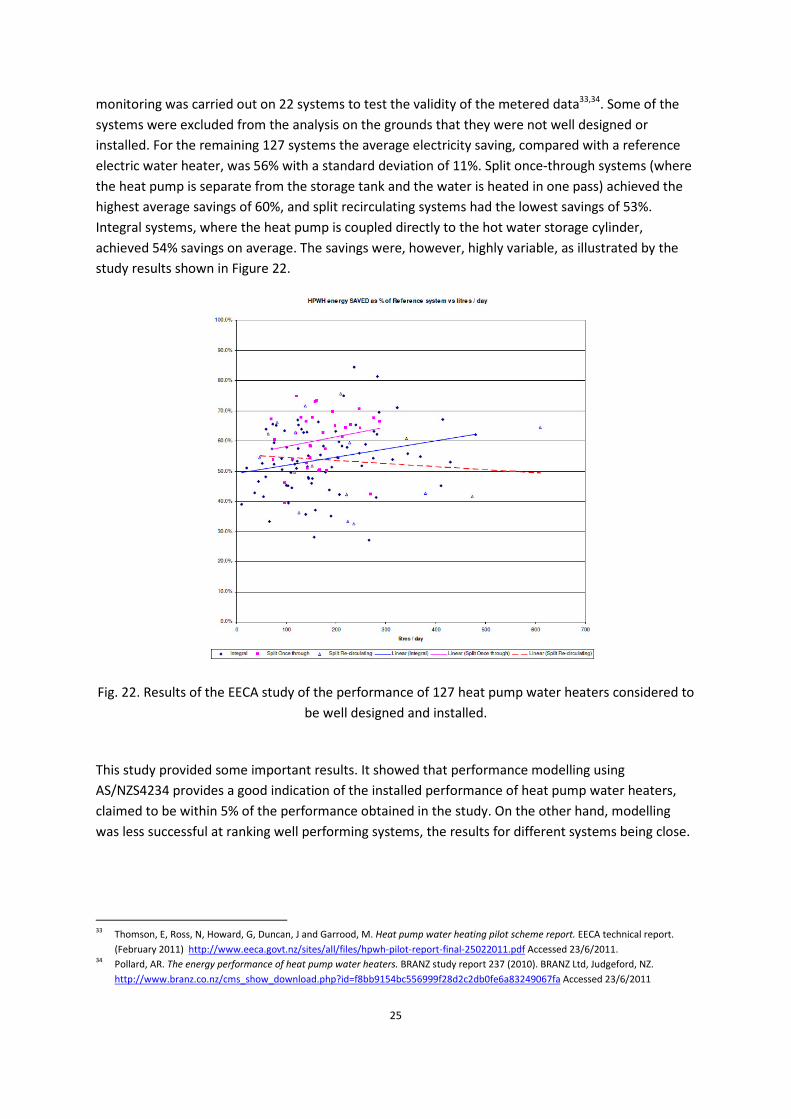
monitoring was carried out on 22 systems to test the validity of the metered data33,34. Some of the
systems were excluded from the analysis on the grounds that they were not well designed or
installed. For the remaining 127 systems the average electricity saving, compared with a reference
electric water heater, was 56% with a standard deviation of 11%. Split once-through systems (where
the heat pump is separate from the storage tank and the water is heated in one pass) achieved the
highest average savings of 60%, and split recirculating systems had the lowest savings of 53%.
Integral systems, where the heat pump is coupled directly to the hot water storage cylinder,
achieved 54% savings on average. The savings were, however, highly variable, as illustrated by the
study results shown in Figure 22.
Fig. 22. Results of the EECA study of the performance of 127 heat pump water heaters considered to
be well designed and installed.
This study provided some important results. It showed that performance modelling using
AS/NZS4234 provides a good indication of the installed performance of heat pump water heaters,
claimed to be within 5% of the performance obtained in the study. On the other hand, modelling
was less successful at ranking well performing systems, the results for different systems being close.
33 Thomson, E, Ross, N, Howard, G, Duncan, J and Garrood, M. Heat pump water heating pilot scheme report. EECA technical report.
(February 2011) http://www.eeca.govt.nz/sites/all/files/hpwh-pilot-report-final-25022011.pdf Accessed 23/6/2011. 34 Pollard, AR. The energy performance of heat pump water heaters. BRANZ study report 237 (2010). BRANZ Ltd, Judgeford, NZ.
http://www.branz.co.nz/cms_show_download.php?id=f8bb9154bc556999f28d2c2db0fe6a83249067fa Accessed 23/6/2011
26
The Consumers’ Institute has also conducted a heat pump water heating test the report for which is
publically available35. Like the EECA pilot scheme results, the performance was mixed. Also like the
EECA study, the Consumer found that the split systems performed better than the integral.
For solar water heaters there is a reasonably broad level of awareness and acceptance of the
principles of good system design and installation within the industry. This is not presently the case
for heat pump water heaters and the authors of the EECA and BRANZ reports do not attempt to
discuss the technology or to recommend a direction for technology improvements. Thus the
technological leadership lies primarily with the firms supplying the technology. At present it appears
that some of these firms are struggling with issues such as minimising the impact of frosting,
capturing the benefits of a stratified tank and temperature control. For heat pump water heaters
there should be significant advances over the next decade given appropriate encouragement.
13. Is noise a problem?
Like space-heating heat pumps, heat pump water heaters generate noise primarily due to the
refrigerant compressor and the evaporator fan. Heat pump noise is already a concern for space
heating systems, and there is potential for this to happen also for heat pump water heaters. The
noise levels reported in the Consumer study were in the range 58 – 62 dBA, measured at a distance
of 1 – 1.5 m. For the products listed on the EECA ENERGYWISE™ website36, the noise is in the range
47 – 62 dBA, which is less than that of some space heating systems, where sound levels of 65 dBA
are not uncommon.
It is difficult to determine whether these noise levels are acceptable in New Zealand cities because
many local authorities do not specify permitted noise limits quantitatively. One council which does
specify noise limits is the Dunedin City Council. The district plan has maps showing limits at different
times and the council offers guidance for owners of heat pumps on how to manage noise37. The
most restrictive condition is in the outer suburbs where the maximum allowed noise level at night-
time and during week-ends is 35 dBA, measured at the property boundary. On this basis, assuming
noise levels drop by 6 dBA when the distance doubles, a unit rated at 47 dBA is likely to satisfy the
Dunedin regulations provided it is located not less than 6 m from the property boundary.
35
Whitley, B. Heat Pump Water Heaters. Consumer New Zealand (May 2009) http://www.consumer.org.nz/reports/heat-pump-water-
heaters Accessed 21/6/2011. 36
http://www.energywise.govt.nz/sites/all/files/eligible-systems-scheme-partners-03062011.pdf Accessed 20/6/2011. 37
Neighbourly installation of Heat Pumps. Dundein City Council – EH / 0014
http://www.dunedin.govt.nz/__data/assets/pdf_file/0010/133876/0014NeighbourlyHeatpump.pdf Accessed 26/6/2011
27
14. Appendix – Methods
To determine the performance of different water heating technologies, computational models have
been used to estimate the monthly electricity use for five levels of hot water use for four sizes of
solar system and one size of heat pump. For each combination of user and system two climate zones
have been considered, based on climate data for a Typical Meteorological Year (TNY) in Auckland
and Dunedin. In the report I denote these as the North zone and South zone respectively. Some
calculations have been done using Nelson-Marlborough climate data.
As far as possible, the models satisfy the requirements of the Australian and New Zealand Standard
for calculating the energy consumption of heated water systems, Standard AS/NZS423438 and its
Amendment 139. In applying the Standard, TRNSYS simulation40 was used, together with system
performance parameters provided confidentially by an industry colleague. These measurements are
described in the Standards AS/NZS253541 (for solar collectors) and AS/NZS512542 (for air-source heat
pump water heaters).
The modelling software uses local hourly records for representative temperature, humidity, wind
speed and solar radiation for a typical meteorological year as input to the simulation. The Standard
specifies two climate zones for the analysis of solar water heaters in New Zealand, zone 5 and zone
6. Zone 5, which encompasses the North Island and much of the South Island, is based on a typical
meteorological year for Auckland. Zone 6, which covers the southern part of the South Island, is
based on a typical meteorological year for Dunedin. For air source heat pump water heaters the
climate zones, HP1-NZ and HP2-NZ, are based on typical meteorological years for Auckland and
Dunedin respectively. Zone HP1 corresponds to zones 5 and 7 of NZS421843 (essentially the North
Island, excluding the Central Plateau) and HP2 corresponds to NZS4218 zone 6 (the Central Plateau
of the North Island plus the South Island). In this report I have used North zone to denote solar zone
5 and heat pump zone HP1-NZ and South zone to denote solar zone 6 and heat pump zone HP2-NZ.
For the analyses presented in sections 9 and 11 typical meteorological year data for nine centres,
provided by EECA, was used. In these simulations the file labelled AK.TMY was used for Auckland
rather than the solar file Auckland.TMY used elsewhere, in order that the Auckland calculations
should be in the same basis as the other cities and regions. However, this substitution had only a
minor effect on the simulation results. In section 11 the national daily electricity demand is
calculated under a particular scenario. The first day in these simulations had a high electricity
consumption on start-up, which was anomalous. The data for Jan 1 was set equal to that for Jan 2.
In order to determine the annual power use, the consumption for each city or region was weighted
in proportion to the population, shown in Table A1. Where cities or towns were left out, the
population was included with that of the nearest one on the list. One difficulty encountered in the
38 AS/NZS4234:2008 Heated water systems - calculation of energy consumption. Joint Australian and New Zealand Standard. 39
Amendment 1, AS/NZS 4234:2008 Heated water systems—Calculation of energy consumption. Joint Australian and New Zealand
Standard. Amendment unpublished as at June 2011. 40
TRNSYS, A Transient System Simulation Program. University of Wisconsin Solar Energy Laboratory, USA. 41
AS/NZS2535.1:2007 Test methods for solar collectors. Part 1: Thermal performance of glazed liquid heating collectors including
pressure drop (ISO 9806-1:1994, MOD) Joint Australian and New Zealand Standard. 42
AS/NZS5125.1:2010 Heat pump water heaters – performance assessment. Part 1: Air source heat pump water heaters. Joint Australian
and New Zealand Standard. 43
AS/NZS4218:2009 Thermal insulation—Housing and small buildings. Joint Australian and New Zealand Standard.
28
heat pump water heater simulation was that the heat pump operated only a few times each day,
sometimes twice, sometimes three times. In addition, the switching in different towns and regions
tended to be synchronised. The effect of this was that the daily variations in the national electricity
demand were magnified. To avoid this effect, the size of the hot water cylinders in Auckland,
Wellington and Christchurch were set at different values, 150 L for Auckland, 160 L for Wellington
and 170L for Christchurch. This had no significant influence on the average system efficiency in these
cities, but it reduced the influence of synchronous thermostat switching. This problem did not occur
in the solar system model.
Region Population (M)
Northland 0.06
Auckland 1.4
Hamilton 0.2
Tauranga 0.12
East Coast 0.16
Wellington 0.56
Nelson 0.05
Christchurch 0.45
Dunedin 0.17
Table A1 Populations used to estimate the national demand.
The Standard AS/NZS4234 defines three levels for the daily hot water demand in terms of the
thermal energy supplied as hot water on the day when the demand is a maximum. These levels are
described as: small (3 occupants or less, maximum demand 25.6 MJ/day), medium (4 – 5 occupants,
maximum demand 39 MJ/day) and large (6 occupants or more, maximum demand 52 MJ/day). In
order to extend the range of consumers I have added two new levels in this report: one smaller
(extra small, maximum demand 12.8 MJ/day) and one larger (extra large, maximum demand 65
MJ/day). In this context I note that in a study of heat pump water heaters in seven New Zealand
households by Anderson et al.44 the average delivered energy for the top three consumers was more
than 75 MJ/day, suggesting that such high levels of demand are not uncommon.
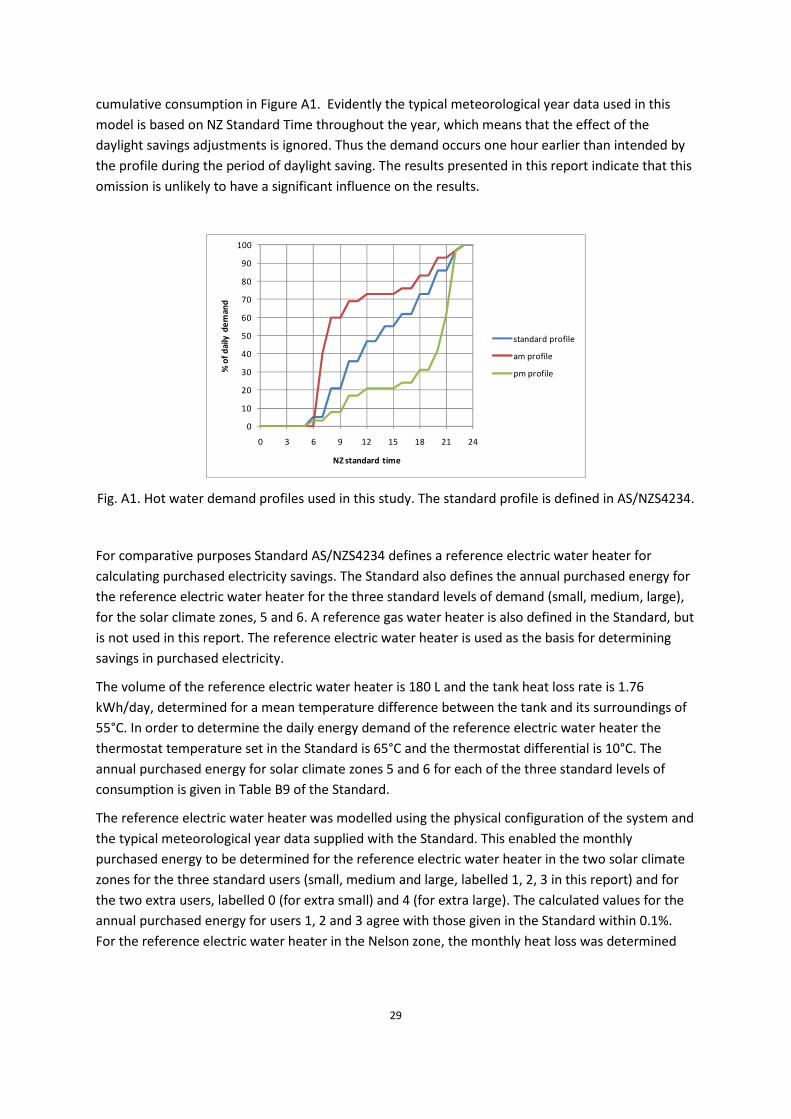
In order to provide a realistic pattern of hot water demand at hourly intervals throughout the year,
Standard AS/NZS4234 specifies a daily load profile (the standard profile), a seasonal load profile and,
for each zone, a seasonal cold water temperature profile. In the daily profile the demand peaks at 8
am and 8 pm, with 36% of the demand before (or at) 10 am and 26% after (or at) 8 pm. In order to
assess the effect of the water usage pattern on the electricity demand two new profiles were
established in which the demand is biased towards the morning (am profile) and evening (pm
profile). In the morning profile 69% of demand occurred before (or at) 10 am and in the evening
profile 69% of the demand occurred after (or at) 8 pm. The three profiles are illustrated by the
44
Anderson, JA, Bradford, RA and Carrington, CG. Assessment of a heat pump water heater. International Journal of Energy Research,
9:77–89 (1985).
29
cumulative consumption in Figure A1. Evidently the typical meteorological year data used in this
model is based on NZ Standard Time throughout the year, which means that the effect of the
daylight savings adjustments is ignored. Thus the demand occurs one hour earlier than intended by
the profile during the period of daylight saving. The results presented in this report indicate that this
omission is unlikely to have a significant influence on the results.
0
10
20
30
40
50
60
70
80
90
100
0 3 6 9 12 15 18 21 24
% o
f d
aily
de
ma
nd
NZ standard time
standard profile
am profile
pm profile
Fig. A1. Hot water demand profiles used in this study. The standard profile is defined in AS/NZS4234.
For comparative purposes Standard AS/NZS4234 defines a reference electric water heater for
calculating purchased electricity savings. The Standard also defines the annual purchased energy for
the reference electric water heater for the three standard levels of demand (small, medium, large),
for the solar climate zones, 5 and 6. A reference gas water heater is also defined in the Standard, but
is not used in this report. The reference electric water heater is used as the basis for determining
savings in purchased electricity.
The volume of the reference electric water heater is 180 L and the tank heat loss rate is 1.76
kWh/day, determined for a mean temperature difference between the tank and its surroundings of
55°C. In order to determine the daily energy demand of the reference electric water heater the
thermostat temperature set in the Standard is 65°C and the thermostat differential is 10°C. The
annual purchased energy for solar climate zones 5 and 6 for each of the three standard levels of
consumption is given in Table B9 of the Standard.
The reference electric water heater was modelled using the physical configuration of the system and
the typical meteorological year data supplied with the Standard. This enabled the monthly
purchased energy to be determined for the reference electric water heater in the two solar climate
zones for the three standard users (small, medium and large, labelled 1, 2, 3 in this report) and for
the two extra users, labelled 0 (for extra small) and 4 (for extra large). The calculated values for the
annual purchased energy for users 1, 2 and 3 agree with those given in the Standard within 0.1%.
For the reference electric water heater in the Nelson zone, the monthly heat loss was determined
30
from the known values for Zones 5 and 6. This was done by scaling the loss by the difference in
temperature between the hot water and the ambient temperature.
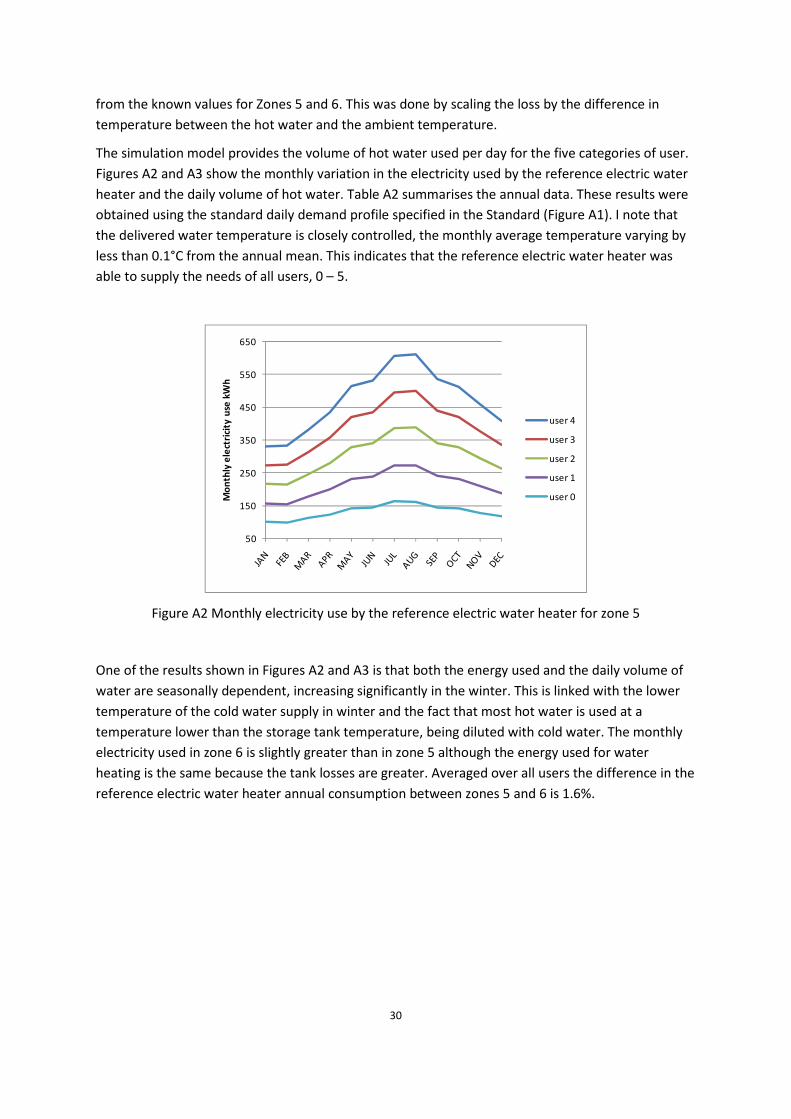
The simulation model provides the volume of hot water used per day for the five categories of user.
Figures A2 and A3 show the monthly variation in the electricity used by the reference electric water
heater and the daily volume of hot water. Table A2 summarises the annual data. These results were
obtained using the standard daily demand profile specified in the Standard (Figure A1). I note that
the delivered water temperature is closely controlled, the monthly average temperature varying by
less than 0.1°C from the annual mean. This indicates that the reference electric water heater was
able to supply the needs of all users, 0 – 5.
50
150
250
350
450
550
650
Mo
nth
ly e
lect
rici
ty u
se k
Wh
user 4
user 3
user 2
user 1
user 0
Figure A2 Monthly electricity use by the reference electric water heater for zone 5
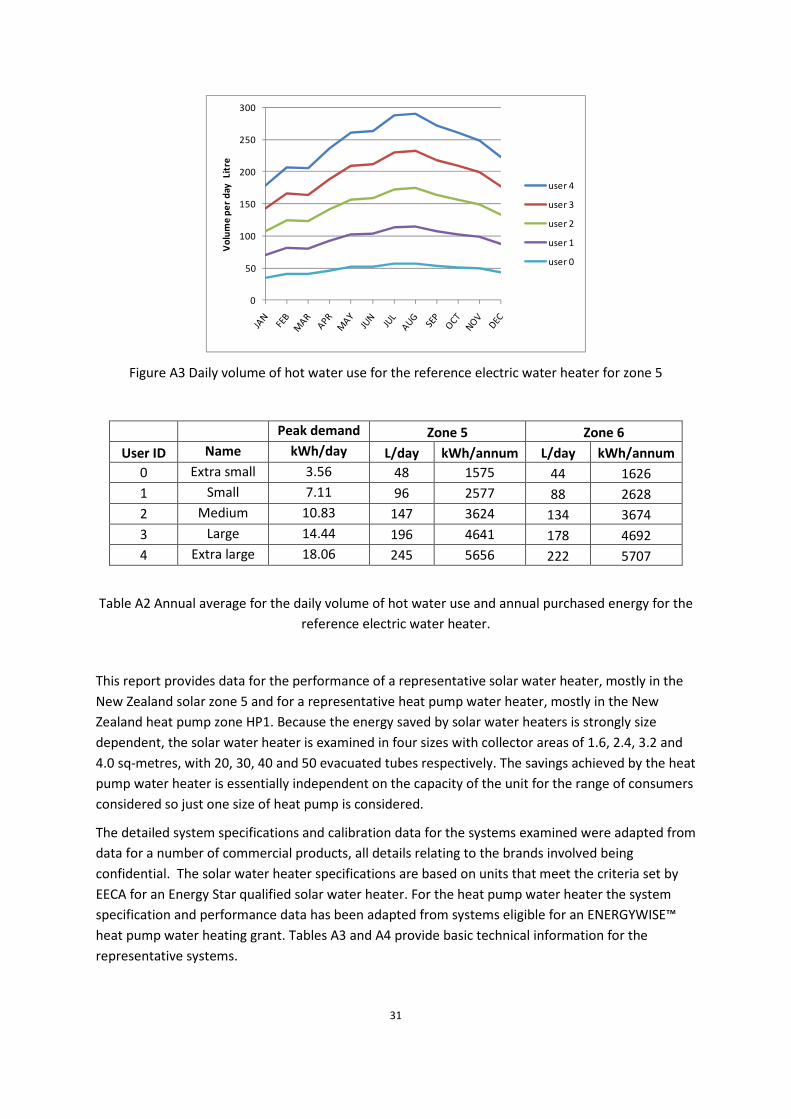
One of the results shown in Figures A2 and A3 is that both the energy used and the daily volume of
water are seasonally dependent, increasing significantly in the winter. This is linked with the lower
temperature of the cold water supply in winter and the fact that most hot water is used at a
temperature lower than the storage tank temperature, being diluted with cold water. The monthly
electricity used in zone 6 is slightly greater than in zone 5 although the energy used for water
heating is the same because the tank losses are greater. Averaged over all users the difference in the
reference electric water heater annual consumption between zones 5 and 6 is 1.6%.
31
0
50
100
150
200
250
300
Vo
lum
e p
er
day
Li
tre
user 4
user 3
user 2
user 1
user 0
Figure A3 Daily volume of hot water use for the reference electric water heater for zone 5
Peak demand Zone 5 Zone 6
User ID Name kWh/day L/day kWh/annum L/day kWh/annum
0 Extra small 3.56 48 1575 44 1626
1 Small 7.11 96 2577 88 2628
2 Medium 10.83 147 3624 134 3674
3 Large 14.44 196 4641 178 4692
4 Extra large 18.06 245 5656 222 5707
Table A2 Annual average for the daily volume of hot water use and annual purchased energy for the
reference electric water heater.
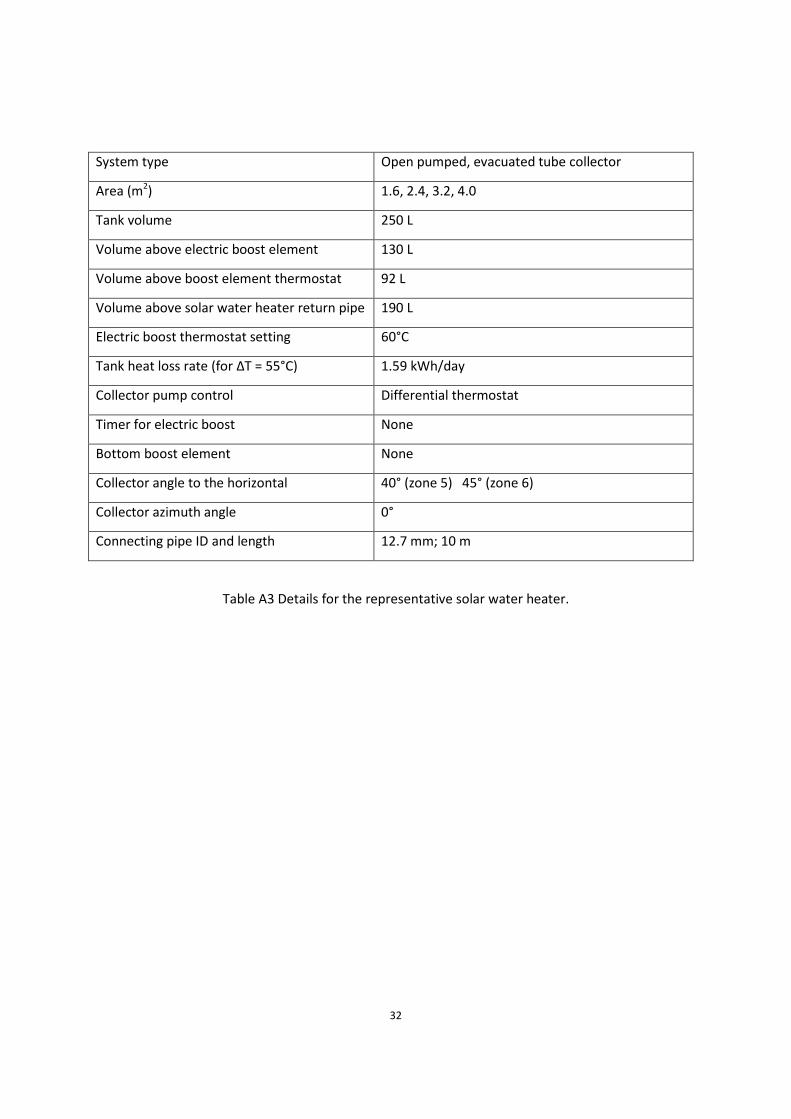
This report provides data for the performance of a representative solar water heater, mostly in the
New Zealand solar zone 5 and for a representative heat pump water heater, mostly in the New
Zealand heat pump zone HP1. Because the energy saved by solar water heaters is strongly size
dependent, the solar water heater is examined in four sizes with collector areas of 1.6, 2.4, 3.2 and
4.0 sq-metres, with 20, 30, 40 and 50 evacuated tubes respectively. The savings achieved by the heat
pump water heater is essentially independent on the capacity of the unit for the range of consumers
considered so just one size of heat pump is considered.
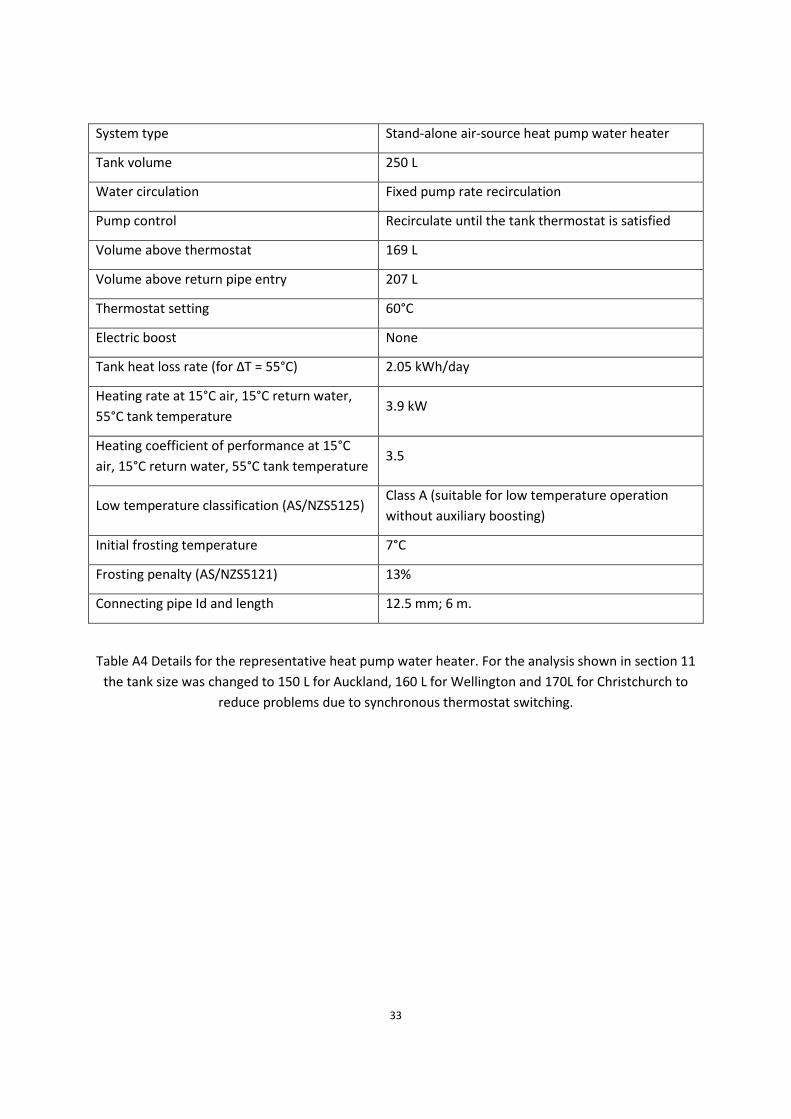
The detailed system specifications and calibration data for the systems examined were adapted from
data for a number of commercial products, all details relating to the brands involved being
confidential. The solar water heater specifications are based on units that meet the criteria set by
EECA for an Energy Star qualified solar water heater. For the heat pump water heater the system
specification and performance data has been adapted from systems eligible for an ENERGYWISE™
heat pump water heating grant. Tables A3 and A4 provide basic technical information for the
representative systems.
32
System type Open pumped, evacuated tube collector
Area (m2) 1.6, 2.4, 3.2, 4.0
Tank volume 250 L
Volume above electric boost element 130 L
Volume above boost element thermostat 92 L
Volume above solar water heater return pipe 190 L
Electric boost thermostat setting 60°C
Tank heat loss rate (for ΔT = 55°C) 1.59 kWh/day
Collector pump control Differential thermostat
Timer for electric boost None
Bottom boost element None
Collector angle to the horizontal 40° (zone 5) 45° (zone 6)
Collector azimuth angle 0°
Connecting pipe ID and length 12.7 mm; 10 m
Table A3 Details for the representative solar water heater.
33
System type Stand-alone air-source heat pump water heater
Tank volume 250 L
Water circulation Fixed pump rate recirculation
Pump control Recirculate until the tank thermostat is satisfied
Volume above thermostat 169 L
Volume above return pipe entry 207 L
Thermostat setting 60°C
Electric boost None
Tank heat loss rate (for ΔT = 55°C) 2.05 kWh/day
Heating rate at 15°C air, 15°C return water,
55°C tank temperature 3.9 kW
Heating coefficient of performance at 15°C
air, 15°C return water, 55°C tank temperature 3.5
Low temperature classification (AS/NZS5125) Class A (suitable for low temperature operation
without auxiliary boosting)
Initial frosting temperature 7°C
Frosting penalty (AS/NZS5121) 13%
Connecting pipe Id and length 12.5 mm; 6 m.
Table A4 Details for the representative heat pump water heater. For the analysis shown in section 11
the tank size was changed to 150 L for Auckland, 160 L for Wellington and 170L for Christchurch to
reduce problems due to synchronous thermostat switching.