comparison of sensitivity and series high dynamic … of sensitivity and linearity of the agilent...
TRANSCRIPT
Comparison of Sensitivity and Linearity of the Agilent 1200 Infi nity Series High Dynamic Range Diode Array Detector Solution and the Conventional Agilent 1290 Infi nity DADTechnical Overview
AbstractThe Agilent 1200 Infi nity Series High Dynamic Range Diode Array Detector (HDR DAD) solution expands the linear dynamic range by a factor of 30. By combining the signals from two diode array detectors with different path length Agilent Max-Light fl ow cells, the 1200 Infi nity Series HDR DAD solution facilitates detection and quantifi cation of main and trace components in a single run without exceeding the linear range of the detector.
This Technical Overview evaluated linearity and limit of detection (LOD) for the 1290 Infi nity HDR DAD solution and the 1290 Infi nity DAD with the 10-mm path length fl ow cell. In addition, quantitative results of the 1290 Infi nity HDR DAD and a 1200 Series DAD were compared for confi rmation of results.
AuthorA.G.HuesgenAgilent Technologies Inc.Waldbronn, Germany
1.551.651.751.851.952.05
0.01 0.02 0.1 0.5 1 2.5 ng (×102)5 10 20 40 80Resp
onse
fact
or (A
mt/
area
)
Linearity of an Agilent 1290 Infinity HDR DAD from 1.28 to 7,932 mAU Rsp. fac
± %5 Linear range
×10–1
2
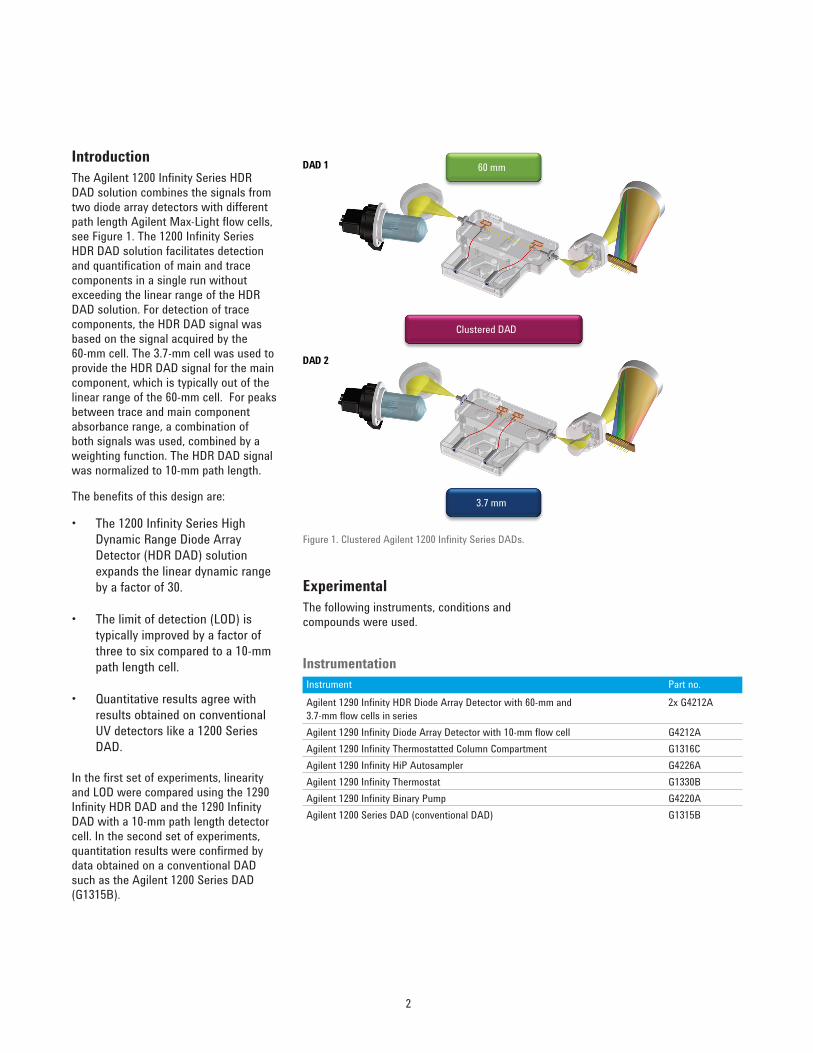
IntroductionThe Agilent 1200 Infi nity Series HDR DAD solution combines the signals from two diode array detectors with different path length Agilent Max-Light fl ow cells, see Figure 1. The 1200 Infi nity Series HDR DAD solution facilitates detection and quantifi cation of main and trace components in a single run without exceeding the linear range of the HDR DAD solution. For detection of trace components, the HDR DAD signal was based on the signal acquired by the 60-mm cell. The 3.7-mm cell was used to provide the HDR DAD signal for the main component, which is typically out of the linear range of the 60-mm cell. For peaks between trace and main component absorbance range, a combination of both signals was used, combined by a weighting function. The HDR DAD signal was normalized to 10-mm path length.
The benefi ts of this design are:
• The 1200 Infi nity Series High Dynamic Range Diode Array Detector (HDR DAD) solution expands the linear dynamic range by a factor of 30.
• The limit of detection (LOD) is typically improved by a factor of three to six compared to a 10-mm path length cell.
• Quantitative results agree with results obtained on conventional UV detectors like a 1200 Series DAD.
In the fi rst set of experiments, linearity and LOD were compared using the 1290 Infi nity HDR DAD and the 1290 Infi nity DAD with a 10-mm path length detector cell. In the second set of experiments, quantitation results were confi rmed by data obtained on a conventional DAD such as the Agilent 1200 Series DAD (G1315B).
ExperimentalThe following instruments, conditions and compounds were used.
Figure 1. Clustered Agilent 1200 Infi nity Series DADs.
60 mm
3.7 mm
Clustered DAD
DAD 1
DAD 2
InstrumentationInstrument Part no.Agilent 1290 Infi nity HDR Diode Array Detector with 60-mm and 3.7-mm fl ow cells in series
2x G4212A
Agilent 1290 Infi nity Diode Array Detector with 10-mm fl ow cell G4212AAgilent 1290 Infi nity Thermostatted Column Compartment G1316CAgilent 1290 Infi nity HiP Autosampler G4226AAgilent 1290 Infi nity Thermostat G1330BAgilent 1290 Infi nity Binary Pump G4220AAgilent 1200 Series DAD (conventional DAD) G1315B

3
Compounds analyzed • Caffeine was used for experiments
evaluating linearity of detectors.
• Anthracene was used for experiments evaluating the limit of detection of detectors.
• Comparison of quantitative results was done using a pharmaceutical preparation with:
Paracetamol
Chlorphenamine Vitamin C
CaffeineHO
NH
O
CH3
Cl CH3
CH3
O
O
CH3
CH3
H3C
HO
HO
HO OH
HO
Chromatographic conditions for evaluating linearityParameter ValueSample Caffeine dissolved in water, 0.5 µg/mL to 500 µg/mLColumn Agilent ZORBAX RRHT Eclipse Plus C18, 4.6 × 150 mm, 1.8 µm, (p/n 993967-902)Mobile phases A) water
B) acetonitrileGradient at 0 minutes 5 % B,
at 5 minutes 20 % BFlow 1 mL/minStop time 8.5 minutesPost time 5 minutesInjection volume 2 µL from 0.5 µg/mL to 500 µg/mL; 4, 8, and 16 µL for 2,000, 4,000, and 8,000 ng
injection from 500 µg/mL solutionUV 273/10 nm,
Ref: 380/80 nm, 20 HzColumn temperature 30 °C
Chromatographic conditions for evaluating LODParameter ValueSample Anthracene dissolved in acetonitrile, 10 pg/µLColumn Agilent ZORBAX RRHT Eclipse Plus C18, 2.1 × 50 mm, 1.8 µm, (p/n 959741-902)Mobile phases A) water
B) acetonitrileIsocratic 65 % BFlow 0.5 mL/minStop time 5 minutesInjection volume 1 µL UV 251/4 nm,
Ref: 450/80 nm, 2.5 HzColumn temperature 36 °C
Parameter ValueColumn Agilent ZORBAX RRHT Eclipse Plus C18, 4.6 × 100 mm, 5 µm, (p/n 959996-902)Mobile phases A) water + 0.1 % TFA,
B) acetonitrile + 0.09 % TFAGradient at 0 minutes 5 % B,
at 0.5 minutes 5 % B, at 6.1 minutes 40 % B, at 6.5 minutes 95 % B, at 8 minutes 5 % B
Post time 2 minutesFlow 1 mL/minStop time 10 minutesInjection volume 0.5, 1, 2 µL, for a 3-level calibration and 1.5 µL to compare quantitation,
see Table 1 UV 254/10 nm,
Ref: 380/80 nm, 10 HzColumn temperature 40 °C
Chromatographic conditions for comparing quantitation
4
Sample preparation1. Two capsules of the pharmaceutical
preparation were opened and dissolved in 20 mL distilled water.
2. Extraction with ultrasonic bath for 5 minutes
3. Filtering with Agilent Captiva Premium Syringe Filter, regenerated cellulose, p/n 5190-5111
4. Clear liquid was fi lled and stored in 1.5-mL LC vials containing:
• 250 ng/μL chlorphenamine• 20,000 ng/μL paracetamol• 2,500 ng/μL caffeine• 15,000 ng/μL vitamin C
5. Dilution 1:20 with water containing:
• 12.5 ng/μL chlorphenamine• 1,000 ng/μL paracetamol• 125 ng/μL caffeine• 750 ng/μL vitamin C
6. This solution was injected using different injection volumes, see Table 1.
Software OpenLAB CDS ChemStation C.01.05
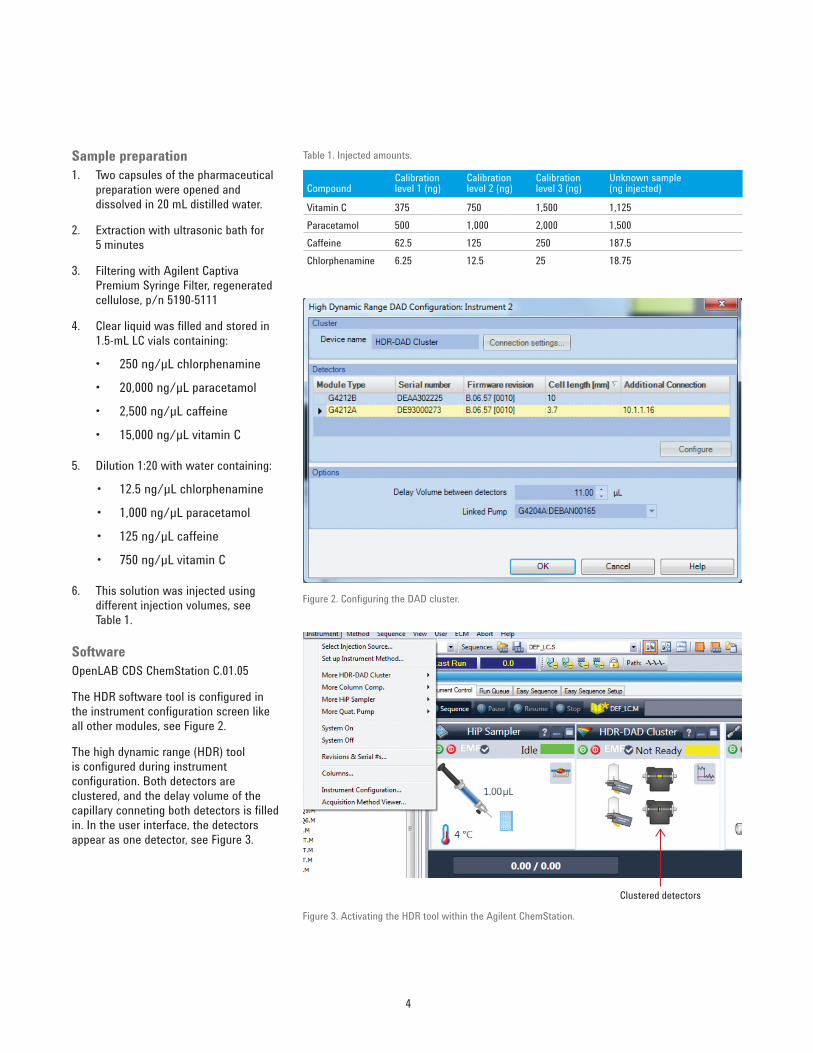
The HDR software tool is confi gured in the instrument confi guration screen like all other modules, see Figure 2.
The high dynamic range (HDR) tool is confi gured during instrument confi guration. Both detectors are clustered, and the delay volume of the capillary conneting both detectors is fi lled in. In the user interface, the detectors appear as one detector, see Figure 3.
Figure 2. Confi guring the DAD cluster.
Figure 3. Activating the HDR tool within the Agilent ChemStation.
Clustered detectors
Table 1. Injected amounts.
CompoundCalibration level 1 (ng)
Calibrationlevel 2 (ng)
Calibrationlevel 3 (ng)
Unknown sample(ng injected)
Vitamin C 375 750 1,500 1,125
Paracetamol 500 1,000 2,000 1,500
Caffeine 62.5 125 250 187.5
Chlorphenamine 6.25 12.5 25 18.75
5
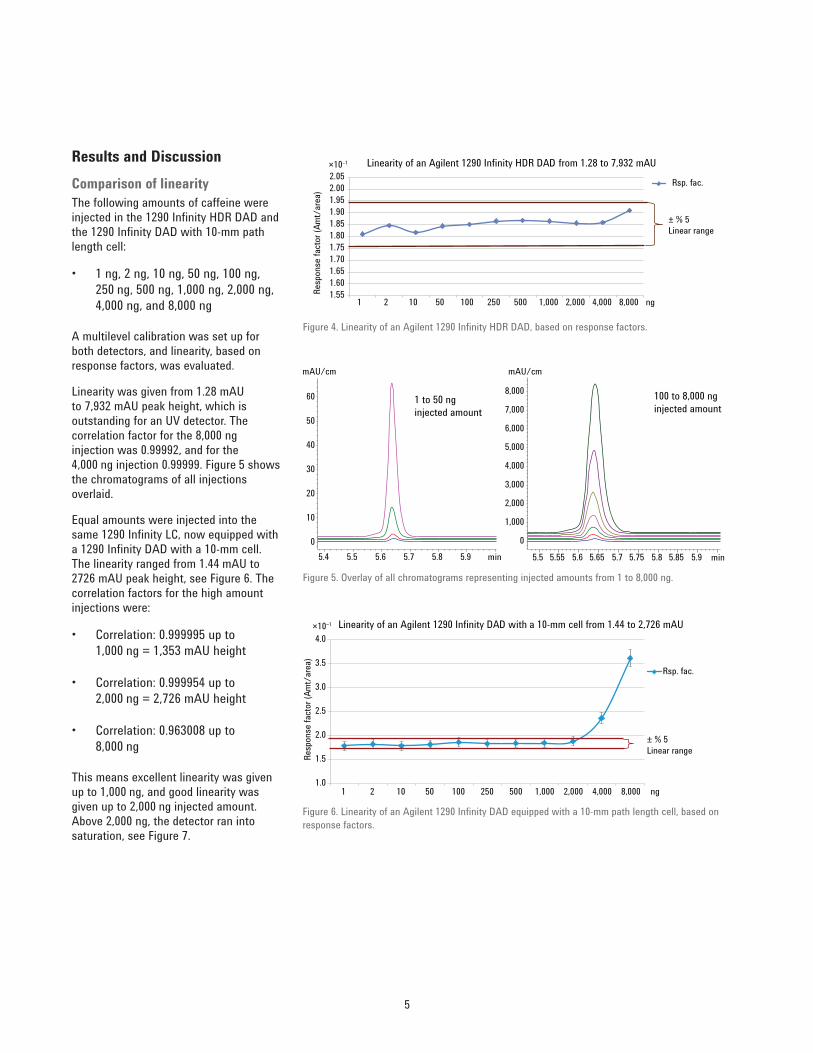
Results and DiscussionComparison of linearityThe following amounts of caffeine were injected in the 1290 Infi nity HDR DAD and the 1290 Infi nity DAD with 10-mm path length cell:
• 1 ng, 2 ng, 10 ng, 50 ng, 100 ng, 250 ng, 500 ng, 1,000 ng, 2,000 ng, 4,000 ng, and 8,000 ng
A multilevel calibration was set up for both detectors, and linearity, based on response factors, was evaluated.
Linearity was given from 1.28 mAU to 7,932 mAU peak height, which is outstanding for an UV detector. The correlation factor for the 8,000 ng injection was 0.99992, and for the 4,000 ng injection 0.99999. Figure 5 shows the chromatograms of all injections overlaid.
Equal amounts were injected into the same 1290 Infi nity LC, now equipped with a 1290 Infi nity DAD with a 10-mm cell. The linearity ranged from 1.44 mAU to 2726 mAU peak height, see Figure 6. The correlation factors for the high amount injections were:
• Correlation: 0.999995 up to 1,000 ng = 1,353 mAU height
• Correlation: 0.999954 up to 2,000 ng = 2,726 mAU height
• Correlation: 0.963008 up to 8,000 ng
This means excellent linearity was given up to 1,000 ng, and good linearity was given up to 2,000 ng injected amount. Above 2,000 ng, the detector ran into saturation, see Figure 7.
1.551.601.651.701.751.801.851.901.952.002.05
1 2 10 50 100 250 ng500 1,000 2,000 4,000 8,000Re
spon
se fa
ctor
(Am
t/ar
ea)
Linearity of an Agilent 1290 Infinity HDR DAD from 1.28 to 7,932 mAU
Rsp. fac.
± % 5 Linear range
×10–1
Figure 4. Linearity of an Agilent 1290 Infi nity HDR DAD, based on response factors.
Figure 5. Overlay of all chromatograms representing injected amounts from 1 to 8,000 ng.
min5.5 5.55 5.6 5.65 5.7 5.75 5.8 5.85 5.9
0
1,000
2,000
3,000
4,000
5,000
6,000
7,000
8,0001 to 50 nginjected amount
100 to 8,000 nginjected amount
min5.4 5.5 5.6 5.7 5.8 5.9
mAU/cm mAU/cm
0
10
20
30
40
50
60
1.0
1.5
2.0
2.5
3.0
3.5
4.0
Resp
onse
fact
or (A
mt/
area
)
Linearity of an Agilent 1290 Infinity DAD with a 10-mm cell from 1.44 to 2,726 mAU
Rsp. fac.
± % 5 Linear range
1 2 10 50 100 250 ng500 1,000 2,000 4,000 8,000
×10–1
Figure 6. Linearity of an Agilent 1290 Infi nity DAD equipped with a 10-mm path length cell, based on response factors.
6
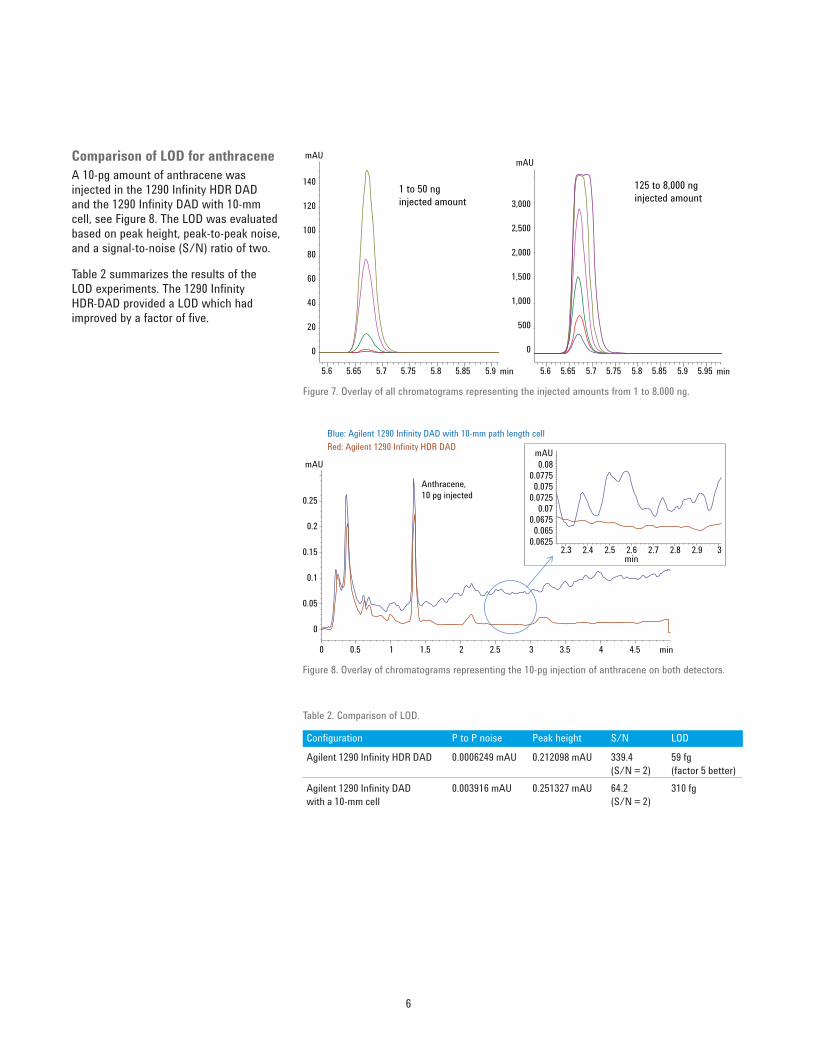
Comparison of LOD for anthraceneA 10-pg amount of anthracene was injected in the 1290 Infi nity HDR DAD and the 1290 Infi nity DAD with 10-mm cell, see Figure 8. The LOD was evaluated based on peak height, peak-to-peak noise, and a signal-to-noise (S/N) ratio of two.
Table 2 summarizes the results of the LOD experiments. The 1290 Infi nity HDR-DAD provided a LOD which had improved by a factor of fi ve.
Confi guration P to P noise Peak height S/N LOD
Agilent 1290 Infi nity HDR DAD 0.0006249 mAU 0.212098 mAU 339.4 (S/N = 2)
59 fg (factor 5 better)
Agilent 1290 Infi nity DAD with a 10-mm cell
0.003916 mAU 0.251327 mAU 64.2 (S/N = 2)
310 fg
Table 2. Comparison of LOD.
Blue: Agilent 1290 Infinity DAD with 10-mm path length cell Red: Agilent 1290 Infinity HDR DAD
min0 0.5 1 1.5 2 2.5 3 3.5 4 4.5
mAU
0
0.05
0.1
0.15
0.2
0.25Anthracene, 10 pg injected
min2.3 2.4 2.5 2.6 2.7 2.8 2.9 3
mAU
0.06250.065
0.06750.07
0.07250.075
0.07750.08
Figure 8. Overlay of chromatograms representing the 10-pg injection of anthracene on both detectors.
min5.6 5.65 5.7 5.75 5.8 5.85 5.9
mAU
0
20
40
60
80
100
120
140
min5.6 5.65 5.7 5.75 5.8 5.85 5.9 5.95
mAU
0
500
1,000
1,500
2,000
2,500
3,0001 to 50 nginjected amount
125 to 8,000 nginjected amount
Figure 7. Overlay of all chromatograms representing the injected amounts from 1 to 8,000 ng.
7
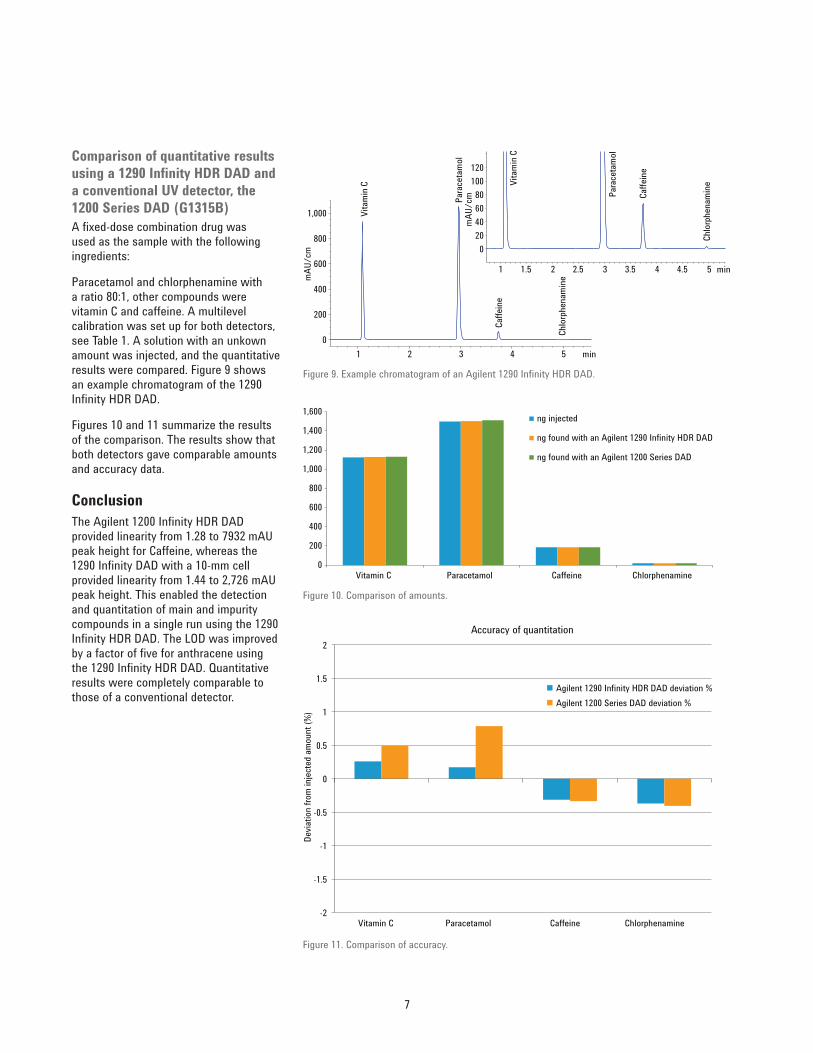
Comparison of quantitative results using a 1290 Infi nity HDR DAD and a conventional UV detector, the 1200 Series DAD (G1315B)A fi xed-dose combination drug was used as the sample with the following ingredients:
Paracetamol and chlorphenamine with a ratio 80:1, other compounds were vitamin C and caffeine. A multilevel calibration was set up for both detectors, see Table 1. A solution with an unkown amount was injected, and the quantitative results were compared. Figure 9 shows an example chromatogram of the 1290 Infi nity HDR DAD.
Figures 10 and 11 summarize the results of the comparison. The results show that both detectors gave comparable amounts and accuracy data.
ConclusionThe Agilent 1200 Infi nity HDR DAD provided linearity from 1.28 to 7932 mAU peak height for Caffeine, whereas the 1290 Infi nity DAD with a 10-mm cell provided linearity from 1.44 to 2,726 mAU peak height. This enabled the detection and quantitation of main and impurity compounds in a single run using the 1290 Infi nity HDR DAD. The LOD was improved by a factor of fi ve for anthracene using the 1290 Infi nity HDR DAD. Quantitative results were completely comparable to those of a conventional detector.
min1 2 3 4 5
mAU
/cm
mAU
/cm
0
200
400
600
800
1,000 Vita
min
C
Para
ceta
mol
Caffe
ine
Chlor
phen
amin
e
min1 1.5 2 2.5 3 3.5 4 4.5 5
020406080
100120
Vita
min
C
Para
ceta
mol
Caffe
ine
Chlor
phen
amin
e
Figure 9. Example chromatogram of an Agilent 1290 Infi nity HDR DAD.
Figure 10. Comparison of amounts.
0
200
400
600
800
1,000
1,200
1,400
1,600
Vitamin C Paracetamol Caffeine Chlorphenamine
ng injected
ng found with an Agilent 1290 Infinity HDR DAD
ng found with an Agilent 1200 Series DAD
Figure 11. Comparison of accuracy.
-2
-1.5
-1
-0.5
0
0.5
1
1.5
2
Vitamin C Paracetamol Caffeine Chlorphenamine
Devia
tion
from
injec
ted
amou
nt (%
)
Accuracy of quantitation
Agilent 1290 Infinity HDR DAD deviation %Agilent 1200 Series DAD deviation %

www.agilent.com/chem/hdr
© Agilent Technologies, Inc., 2013-2014Published in the USA, March 1, 20145991-3877EN