comparison of marshall and superpave level i mix design...
TRANSCRIPT

TRANSPORTATION RESEARCH RECORD 1492 161
Comparison of Marshall and Superpave Level I Mix Design for Asphalt Mixes
lHAB H. HAFEZ AND MATTHEW W. WITCZAK
Mix designs were conducted on 20 different mixtures categorized as: (a) conventional, (b) wet process asphalt rubber (manufacturer preblended), (c) dry process rubber asphalt, (d) polymer modified mixes, and (e) wet-process asphalt rubber (plant-blended). These designs were
· developed using both the Marshall procedure and the Superpave gyratory Level I procedure. A comparison between the design asphalt contents results obtained by the two procedures is presented. The Superpave designs were conducted at a traffic level compared to traffic for the 75-blow Marshall procedure and for three climatic regions representative of cool to warm conditions. Major problems were encountered with the Superpave gyratory approach for five mixtures within the dry-process rubber asphalt groups. These problems appear to be related to the high resiliency of the rubber aggregate during the gyratory compaction process coupled with time-dependent swell of these mixtures directly after compaction. It is concluded that the Superpave Level I mix design approach is not applicable to those mixtures. For the other four groups of mixtures studied, differences between the binder contents from the Marshall and Superpave were found to be a function of the group type. Differences in design content obtained from the Superpave gyratory were found to be about 1.0 percent more asphalt as the climatic regions went from warm to cool conditions. This finding was true for all types of mixtures studied. In general, the conventional mixtures and manufacturer-preblended rubber asphalts gave similar design values between the Marshall and "warm" Superpave climatic region and the contrast is true for the plantblended rubber asphalt. In contrast, 0.5 percent to 0.8 percent less asphalt was found for the Superpave design, in warm conditions, compared to the Marshall design for the polymer modified asphalts investigated.
The main objective of the laboratory mix design process for asphalt mixtures is to determine the combination of binder and aggregate that, when properly constructed, will yield an asphalt mixture that will withstand loading and environmental distress throughout the intended design and performance period.
The two most common mix design procedures used in the United States are the Marshall and Hveem procedures, with the former being the most widely used. In 1993, the Strategic Highway Research Program (SHRP) introduced the Superpave laboratory mix design procedure, which is based on a gyratory compaction device (1). Conceptually, the Superpave laboratory testing procedure is intended to be applicable for all types of asphalt mixtures: virgin and recycled hot mixtures, with or without modified binders even though SHRP research almost universally focused on conventional asphalt mixtures and binders.
The Superpave mix design procedure recommends three distinct hierarchical levels of design, termed Level I, II, and III, which are dependent on the anticipated traffic volume. Also, under each design level, the influence of the project site climatic conditions (related to design air temperature) are also combined in the mix
I. H. Hafez, University of Maryland, College Park, Md. 20742. M. W. Witczak, University of Maryland, College Park, Md. 20742.
design process. Table 1 presents Superpave guidelines for the number of design gyrations to be used under design Level I for different design air temperatures and traffic [equivalent single axle loads (ESALs)]. These design gyrations, coupled with the specific mixture gyratory densification curves developed for each mix under different asphalt contents, can be used to determine the design asphalt content. The final design asphalt (binder) content will depend on traffic level and environmental conditions. · In contrast to the proposed Superpave gyratory mix design
approach, the Marshall mix design uses an impact hammer to achieve the design level of compaction (air voids) as a basis for establishing the design asphalt content. The compaction energy is controlled by the number of blows the specimen will be subjected to in the compaction process. The majority of agencies using the Marshall specify 35-, 50-, or 75-blow compaction consistent with the anticipated traffic level(::; 104
, 104 - 106
, > 106, respectively). For this widely used mix design process, it can be recognized that the final design asphalt (binder) content will only depend on traffic level.
STUDY OBJECTIVES
The major objectives of this study were twofold. The first objective was to obtain quantitative information on the difference in design asphalt contents determined by the Marshall design and SHRPSuperpave gyratory Level I procedure for a variety of mixtures. The second objective was to develop a preliminary assessment of the applicability of the Superpave Level I design to several types of nonconventional (rubber and polymer modified) mixtures.
It should be clearly recognized that the pursuit of these objectives should not be misconstrued to show that the final design asphalt contents from one approach are much better than another as this can only be accomplished by a rigorous lab study encompassing more fundamental test procedures (e.g., moduli, permanent deformation, fatigue) on a given mix, at a unique combination of air-asphalt binder percentage. This study provides, for the first time, some knowledge of the anticipated differences in design asphalt content between the two major compaction processes evaluated. Because of the limited number of the mixtures evaluated, it is hoped, however, that other agencies will conduct similar studies to broaden the data base, results, and implications of this study.
MIXTURES INVESTIGATED
A total of 20 different mixtures were evaluated in the comparative mix design study. These mixtures have been classified into the five major groups identified in Table 2. The major groups investigated were: (a) Group I-conventional mixtures, (b) Group 2-wet

162 TRANSPORTATION RESEARCH RECORD 1492
TABLE 1 Superpave Design Number of Gyrations (J)
Traffic Average De!!ign Air Temperature (o C)
(ESAL~) ~ 34 JS - 36 37 - 38 39- 40 41 - 42 43 - 44
< 31105 50 59 68 74 78 82
< ht06 55 65 76 83 88 93
<3d06 61 73 86 95 100 105
< tx107 67 81 96 106 113 119
< 3x10 7 74 92 109 121 128 135
< tx108 84 105 126 139 146 153
~ 1x10⁸ 93 118 143 l5S 165 172
process asphalt rubber (manufacturer preblended), (c) Group 3-dry process rubber asphalt, ( d) Group 4-polymer modified, and (e) Group 5-wet process asphalt rubber (plant blended).
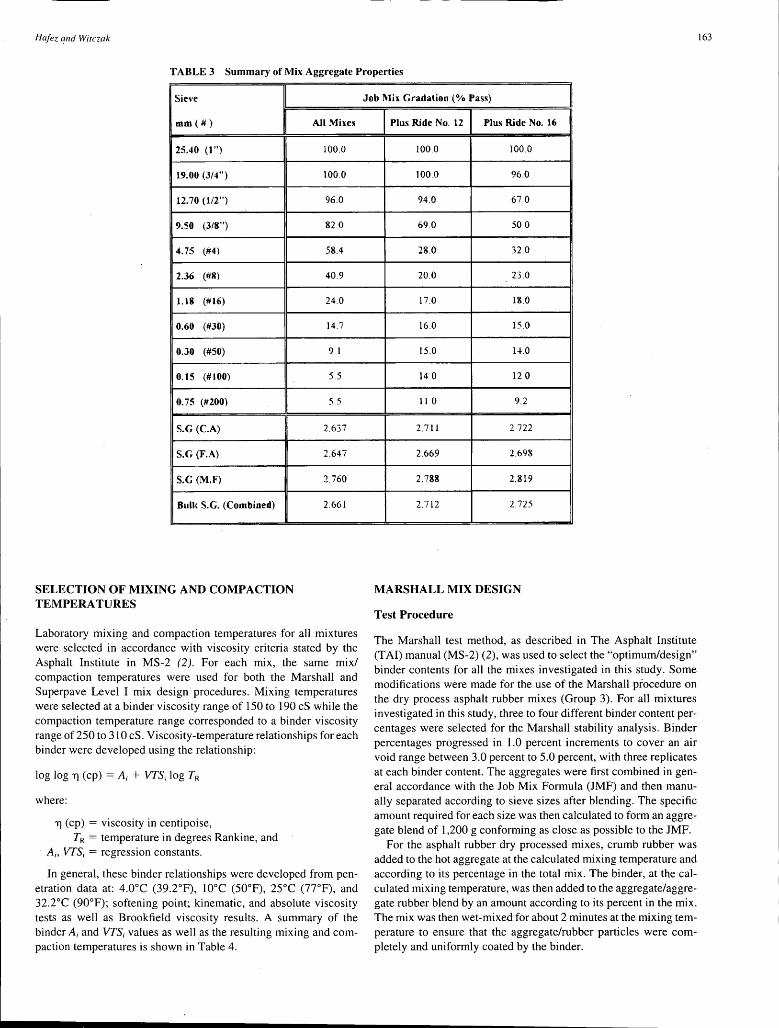
istration (MSHA) dense aggregate grading with maximum nominal size of 12.5 mm (1/2 in.) were used for all mixes except the Plus Ride mixtures where an open grading was used with a maximum nominal size of 12.5 mm (112 in.) and 19.0 mm (314 in.) for Plus Ride No. 12 and No. 16, respectively. Table 3 summarizes the job mix gradation for all of the mixes studied.
For all mixtures investigated, the aggregate type, source, stockpile gradations, and maximum nominal size were identical except for the two Plus Ride mixtures. A Maryland State Highway Admin-
TABLE 2 Summary of Asphalt Mixtures Group Evaluated
Group
2
4
5
Description
Conventional
Wet Process Asphalt Rubber
(Manufacturer Preblended)
Dry Process Rubber Asphalt
Polymer Modified
Wet Process Asphalt Rubber
(Plant Blended)
Mix Identification
Chevron AC-20
Neste AC-20
Conoco AC120/150
Neste SAR 10/5
Neste SAR 10/10
Ecotlex (Bitumru)
Generic: Chevron AC-20 (I% R)
Generic· Chevron AC-20 (2% R)
Generic: Chewon AC-20 (3° o R)
Plus Ride No 12 (3% R)
Plus Ride No.16 (3% R)
Neste EV ALAST
ELVALOY (Con 120/l50 + l.5% Mod)
ELVALOY (Con 1201150 t- 2 0°10Mod)
Citgo AC-10 (0%EO • 10%CR)
Citgo AC-10 (1% EO +- 15% CR)
Citgo AC-10 (7% EO + 20% CR)
Citgo AC-20 (0% EO + 10% CR)
Citgo AC-20 (3% EO + 15% CR)
Citgo AC-20 (7% EO + 20% CR)
UM Project
MSHA Rubber Prnject
Neste Oil Study
DuPont Study
Neste Oil Study
MSHA Rubber Project
MSHA Rubber Project
MSHA Rubber Project
MSHA Rubber Project
MSHA Rubber Project
MSHA Rubber Project
MSHA Rubber Project
Neste Oil Study
DuPont Study
DuPont Study
MSHA Rubber Project
MSHA Rubber Project
MSHA Rubber Project
MSHA Rubber Project
MSHA Rubber Project
MSHA Rubber Project
Hafez and Witczak
TABLE 3 Summary of Mix Aggregate Properties
Sieve
mm ( #)
25.40 (1 ")
19.00 (J/4")
12.70 (112'')
9.50 (318")
4.75 (#4)
2.36 (#K)
1.18 (#16)
0.60 (#JO)
0.30 (#50)
0. 15 (#100)
0.75 (#200)
S.G (C.A)
S.G (F.A)
S.G (M.F)
Built S.G. (Combined)
SELECTION OF MIXING AND COMPACTION TEMPERA TURES
All Mi1es
100.0
100.0
96.0
82.0
58.4
40.9
24.0
14.7
9.1
5.5
5.5
2.637
2.647
2.760
2.661
Laboratory mixing and compaction temperatures for all mixtures were selected in accordance with viscosity criteria stated by the Asphalt Institute in MS-2 (2). For each mix, the same mix/ compaction temperatures were used for both the Marshall and Superpave Level I mix design procedures. Mixing temperatures were selected at a binder viscosity range of 150 to 190 cS while the compaction temperature range corresponded to a binder viscosity range of 250 to 310 cS. Viscosity-temperature relationships for each binder were developed using the relationship:
log log Tl (cp) =A;+ VTSi log TR
where:
Tl (cp) = viscosity in centipoise, TR = temperature in degrees Rankine, and
· A;, VTS; = regression constants.
In general, these binder relationships were developed from penetration data at: 4.0°C (39.2°F), l0°C (50°F), 25°C (77°F), and 32.2°C (90°F); softening point; kinematic, and absolute viscosity tests as well as Brookfield viscosity results. A summary of the binder A; and VTS; values as well as the resulting mixing and compaction temperatures is shown in Table 4.
Job Mix Gradation(% Pass)
Plus Ride No. 12 Plus Ride No. 16
100.0 100.0
100.0 96.0
94.0 67 0
69.0 50 0
28.0 32.0
20.0 23.0
17.0 18.0
16.0 15.0
15.0 l~.O
14 0 12 0
11 0 9.2
2.711 2 722
2.669 2.698
2.788 2.819
2.712 2.725
MARSHALL MIX DESIGN
Test Procedure
The Marshall test method, as described in The Asphalt Institute (TAI) manual (MS-2) (2), was used to select the "optimum/design" binder contents for all the mixes investigated in this study. Some modifications were made for the use of the Marshall procedure on the dry process asphalt rubber mixes (Group 3). For all mixtures investigated in this study, three to four different binder content percentages were selected for the Marshall stability analysis. Binder percentages progressed in 1.0 percent increments to cover an air void range between 3.0 percent to 5.0 percent, with three replicates at each binder content. The aggregates were first combined in general accordance with the Job Mix Formula (JMF) and then manually separated according to sieve sizes after blending. The specific amount required for each size was then calculated to form an aggregate blend of 1,200 g conforming as close as possible to the JMF.
For the asphalt rubber dry processed mixes, crumb rubber was added to the hot aggregate at the calculated mixing temperature and according to its percentage in the total mix. The binder, at the calculated mixing temperature, was then added to the aggregate/aggregate rubber blend by an amount according to its percent in the mix. The mix was then wet-mixed for about 2 minutes at the mixing temperature to ensure that the aggregate/rubber particles were completely and uniformly coated by the binder.
163

164
TABLE 4 Summary of Binder Ah VTS; Parameters
Mix Type Binder
Conventional Che\'TOll AC-20
Neste AC-20
Conoco 120/ 150
Wet Process Asphalt Rubber Neste SAR 1015
(Manufacturer Preblended) Neste SAR 1Oil0
Ecoflex (Bitumar)
Dry Process Rubber Asphalt Generic: Chevron AC-20 (1%, 2%, 3°0 R)
Plus Ride No. 12 & No. 16
Polymer Modified Neste EV ALAST
EL V ALOY (Conoco 1201150 -t l .5% Modifier)
ELY ALOY (Conoco 120/150 .. 2.0% Modifier)
Wet Process Asphalt Rubber Citgo AC-10 (0% EO ~ 10% CR)
(Plant Blended) Citgo AC-IO (3% EO -r 15% CR)
Citgo AC-10 (7% EO +- 20% CR)
Citgo AC-20 (0% EO • 10% CR)
Citgo AC-20 (3% EO • 15% CR)
Citgo AC-20 (7% EO • 20% CR)
Upon mixing, the loose mixture was then placed in an oven, at 160°C (320°F), for 1 hour. This aging process simulated the shortterm aging during mixing and laydown conditions. After that, samples were compacted, at the calculated compaction temperature, using an automatic Marshall hammer with 75 blows per side. To prevent expansion of the dry-process, rubber-compacted mixes in the molds during the cooling period, two plugs were placed under and above the specimen in the molds, and then a 10-lb (minimum) weight was placed on the specimen. After the specirriens cooled to room temperature, they were removed from the molds and their height and weight in air and in water were recorded. The specimens were then immersed in a water bath maintained at 140°F (60°C). After 30 to 40 min, they were removed from the water bath and tested immediately using the Marshall apparatus. Stability and the flow values were recorded. Bulk density, specific gravity, voids· (air), voids in mineral aggregate, voids filled with asphalt, and the stability/flow values were calculated for each specimen and the average for the replicates at the same binder content were also calculated.
Selection of Design Binder Contents
Design binder contents were selected, for each mixture, at air void levels of 3.0 percent, 4.0 percent, and 5.0 percent. These results, for the 75-blow Marshall study, are shown in Table 5. From this table, it can be observed that only insignificant changes are shown for the
TRANSPORTATION RESEARCH RECORD 1492
A VTS Mixing Temp Compaction Temp
(OF) (OJ<')
10 72596 -3 59598 310 290
10.93286 -3.67221 305 2S5
11.22030 -3.78738 285 265
9.21569 -3.05231 340 :no
9.49318 -3.14280 350 330
I0.06920 -3.35609 325 305
10.72596 -3.59598 310 290
10.72596 -3.59598 310 290
8.70081 -2.84582 400 375
I0.31936 -3.45168 310 290
9.41115 -3.11800 345 325
8.42568 -2.75490 390 370
7.29285 -2.34103 460 435
7.33291 -2.35572 455 430
8.42707 -2.75691 385 365
7.94432 -2.58102 410 390
6.80774 -2.16188 510 475
Group I (conventional) mixtures. For the Group 2 (asphalt rubber manufacturer preblends), asphalt contents for the two 10 percent rubber blends (SAR 10/10 and Ecoflex) are essentially the same and are about 0.5 percent more than the 5 percent rubber preblended (SAR 10/5).
The dry process rubber asphalt generic mixtures shown in Group 3 indicate that the demand for the total asphalt content, at any air void level, is increased by approximately 1.3 to 1. 7 percent for each 1 percent increment of rubber (see also Chevron AC-20); Group 1 (conventional) for 0 percent rubber. For the Group 4 polymermodified mixtures, the asphalt contents are ·about 0.3 percent more for the EVALAST modifier and are about 0.7 percent more for the DuPont EL V ALOY mixtures.
For the Group 5 (asphalt rubber plant-blended), it was observed that for the mixtures using the AC-10 binder there is no significant difference in the design binder content as the percent of the rubber increases from 10 percent to 20 percent at any air void level. In contrast, mixes prepared with the AC-20 resulted in design binder contents being increased by about 0.1 percent for each 1 percent increase of rubber.
SHRP-GYRATORY COMPACTION
Test Procedure
The Superpave Level mix design method requires specimen compaction with a gyratory compactor capable of providing a con-

Hafez and Witczak 165
TABLE 5 Summary of Design Asphalt Content (Marshall)
Group Description Mix Identification A.C. at Temp.Nair
Va-3% Va= 4°/o Va=5%
1 Conventional Chevron AC - 20 5. l 4.8 44
Neste AC - 20 5.1 4.7 4.3
Conoco AC 1201150 5.1 4.8 44
2 Wet Proce~s Neste SAR 101 5 5.3 4.7 4.3
(Manufacturer Preblended) Neste SAR l 0/ 10 5.8 5 3 4.7
Ecotlex (Bittunar) 5.7 5.3 4.8
3 Dry· Process Rubber Asphalt Generic· Chevron AC-20 ( l % R) 6.2 5.7 5.5
Generic. Chevron AC-20 (2% R) 8.0 7.3 6.8
Genenc: Chevron AC-20 (3% R) 9.0 8.2 7.7
Pluse Ride No. 12 (3% R) 10.0 8.9 7.5
Pluse Ride No. 16 (3° o R) 74 64 -
4 Pol~·mer Modified Neste EVALAST 5.5 5.1 4.6
EL V ALOY (Conoco 120/150 + 1.5% Mod) 5.8 5.J 4.8
ELVALOY (Conoco 120/150 ~ 2.0% Mod) S.9 5.5 5.1
5 Wet Process Citgo AC-10 (0% EO + 10% CR) 6.6 5.9 54
(Plant Blended) Citgo AC-10 (3°o EO -~ 15% CR) 6.6 6.1 5.6
Citgo AC-10 (7% EO ..- 20% CR) 7.0 5 9 5.4
Citgo AC-20 (0% EO + l 0% CR) 6.0 5.7 5.3
Citgo AC-20 (3% EO • 15% CR) 6.3 5.9 5.7
Citgo AC-20 (7° o EO ... 20% CR) 7.0 6.7 6.4
solidation pressure of 0.60 MPa with an angle of gyration of 1.25 degrees and speed of gyration of 30.0 rpm. Cylindrical molds are also required to accommodate specimen sizes of 100 mm to 150 mm in diameter and with height ranges of 60 to 100 mm and 90 to 150 mm, respectively. The gyratory compactor can continuously monitor the increase in specimen density (expressed as a percent of its theoretical maximum specific gravity) with increasing compactive effort. For all mixes investigated in this study, specimens were compacted in the 100-mni diameter mold using a Rainhart gyratory compactor up to 200 gyrations: Two replicates were prepared at each of the three binder contents used in the Marshall mix design. Also, mixing and compaction temperatures were maintained the same as those used in the Marshall tests. Specimen height versus number of gyrations were saved in computer files to generate the corrected density curves.
Uncorrected Density Curves
The density can be computed at any point in the compaction process from the weight of the specimen and its height. This is termed the uncorrected density ( C11x)·
CllX = x G,,,111
where
w = the weight of the specimen, gm; H = the height of the specimen at any number of
gyrations, cm; d = the diameter of the specimen, cm; and
Gmm = the theoretical maximum specific gravity of the tested specimen.
To generate final densification curves, the uncorrected values of tlie theoretical maximum specific gravity must be corrected using the final height recorded at the end of compaction (He0 J and the measured bulk specific gravity of the specimen after the end of compaction (G111b).
Corrected Density Curves
After the compaction of the specimens, the final heights were recorded and the bulk specific gravities were measured in accordance with AASHTO T-166. The corrected density ( C. ... ) at any number of gyrations is calculated as follows:
Figure I represents the typical densification curves obtained for a conventional mix (AC-20 Chevron) under 4.0 percent, 5.0 per-

166
ci cti
100.0-
90.0 [. - >r<~ I f
85.0 ·- I ,' -~-------<
80.0 I [___ I
I
75.0 h-----+----
70.0
0 20 40 60
TRANSPORTATION RESEARCH RECORD 1492
80 100 120 140 160 180 200
No. of Gyrations
FIGURE 1 Percent of theoretical maximum specific gravity versus number of gyrations under different asphalt content with Pr = 0.0 percent (AC-20 Chevron).
cent, and 6.0 percent binder content. Each curve in this figure represents the average corrected density values for two replicates at the same binder content.
Selection of Design Binder Contents
The first step to determine the design binder content was to select a traffic level expected on the pavement as well as the average design air temperature for the pavement site. Once these two factors are selected, the design number of gyrations (Nctesign) can be determined from Table 1. The design binder content will be the one that produces a densification curve passing through 96.0 percent of theoretical maximum specific gravity (i.e., Va = 4.0 percent at the design number of gyrations).
In this study, a traffic level less than 1 X 10⁷ ESALs was selected in order to be consistent with the 75-blow Marshall traffic level (> 1 X 10⁶ EAL). Ranges of the design air temperature were selected to represent different climatic conditions. These design air temperatures were :s34°C, 37°C to 39°C, and 43°C to 44°C. The corresponding Ndesign values from Table 1 were 67, 96, and 119 number of gyrations. In addition, in lieu of simply determining the design binder content at one level of V" = 4.0 percent binder contents were also evaluated at the 3.0, 4.0, and 5.0 percent air void levels conducted for the Marshall analysis. The summary of these results is shown in Table 6.
Table 6 summarizes design asphalt contents for mixtures in Groups 1, 2, 4, and 5. These values are not shown for Group 3 (dry process rubber asphalt) mixtures. Significant problems were found with these mixtures, with the Superpave gyratory device. These
problems preclude their applicability with Superpave gyratory device and design specifications to select design asphalt contents under the Level I approach. A more detailed discussion of these findings is presented in ensuing sections of this paper.
COMPARISON BETWEEN MARSHALL AND SUPERPA VE RESULTS
Approach
Tables 5 and 6 provide summaries of the design binder content for the Marshall and Superpave gyratory procedures. These results are shown for V0 = 3.0, 4.0, and 5.0 percent. Marshall results are based on 75-blow, while the gyratory designs have been selected to represent a comparable traffic level to the 75-blow compaction and at three levels of temperature to simulate cool ( :s;34 °C), moderate (37°C to 38°C), and warm (43°C to 44°C) climatic regions.
The comparison of the design asphalt contents is presented in two approaches. The first approach uses the difference in asphalt contents between the Superpave Level I and Marshall. This parameter is referred to as the d(AC) value or:
d(AC) = AC Percent (Superpave) - AC Percent (Marshall)
The second approach was to determine the equivalent number of gyrations, for the 75-blow Marshall results, that when used in the Superpave procedure will yield the same design binder content as determined by the Marshall approach. This parameter is referred to as the Neq value. Using the information shown in Tables 5 and 6,

Hafez and Witczak 167
TABLE 6 Summary of Design Asphalt Content (Superpave Level I)
Group Description Mix Identification Va(%) A.C. at Temp.Nair
34°C 37 -38 °c 43-44 oc
1 Conventional Chevron AC - 20 3.0 - 5.6 5.3 4.0 5.8 5.2 4.9 5.0 5.3 4.8 4.5
Neste AC-20 3.0 - 5.4 5.1 4.0 5.6 5.0 4.7 5.0 5.1 4.6 4.3
Conoco AC 120/150 3.0 5.9 5.5 5.3 4.0 5.6 5.2 4.9 5.0 5.3 4.6 -
2 Wet Process Neste SAR 10/5 3.0 - 5.7 5.4 (Manufacturer Preblended) 4.0 6.0 5.2 4.9
5.0 5.4 4.7 4.5
Neste SAR 10/10 3.0 - - 5.8 4.0 - 5.6 5.3 5.0 5.7 5.1 4.7
Ecoflex (Bitumar) 3.0 - 5.7 5.4 4.0 5.8 5.3 5.0 5.0 5.4 4.8 4.5
4 Polymer Modified Neste EV ALAST 3.0 - 5.5 5.1 4.0 5.9 4.9 4.6 5.0 5.1 4.4 4.1
ELV ALOY (Conoco 120/150 + 1.5% Mod) 3.0 5.7 5.2 5.0 4.0 5.3 4.8 4.5 5.0 5.0 4.4 4.1
ELVALOY (Conoco 120/150 + 2.0%Mod) 3.0 - 5.7 5.1 4.0 - 4.9 4.7 5.0 5.2 4.6 4.4
5 Wet Process Citgo AC-10 (0% EO + 10% CR) 3.0 6.8 6.0 5.7 (Plant Blended) 4.0 6.2 5.6 5.3
5.0 5.7 5.2 -Citgo AC-10 (3% EO + 15% CR) 3.0 - 6.5 6.1
4.0 6.6 5.9 5.6 5.0 6.1 5.4 5.1
Citgo AC-10 (7% EO + 20% CR) 3.0 - 7.0 6.4 4.0 7.1 6.2 5.7 5.0 6.3 5.4 -
Citgo AC-20 (0% EO + 10% CR) 3.0 - 6.6 6.2 4.0 6.8 6.0 5.0 5.0 6.2 - -
Citgo AC-20 (3% EO + 15% CR) 3.0 - 5.8 5.2 4.0 6.0 5.1 -5.0 5.3 - -
Citgo AC-20 (7% EO + 20% CR) 3.0 7.2 6.5 5.9
Table 7 is a summary of the d(AC) and Neq values for the mixtures evaluated in Group 1, 2, 4, and 5. Figure 2 presents the d(AC) results, and Figure 3 shows the Neq values obtained in the comparison study.
Results
As noted in Table 7 and Figures 2 and 3, mix subgroups have been developed for the Group 2, Group 4, and Group 5 categories to facilitate the ensuing discussions. Based on an examination of the information shown, the following conclusions can be drawn.
4.0 6.6 5.6 -5.0 6.0 - -
For each specific mixture evaluated, there is little (if any) variation of the d(AC) values, within a given mix, at the three levels of Va examined. This implies that the d(AC) is independent of the target air void level used to establish the design binder content (within the normal Va design range of 3 to 5 percent).
As would be expected, the Superpave design asphalt content is increased as the design climatic condition becomes cooler (i.e., less asphalt is required for warmer conditions). This finding was observed for all mixtures evaluated. Quite interestingly, the increase in design asphalt content by the Superpave, between the warm (43/44°C) and cool (:534°C) condition, is equivalent to nearly 1.0 percent more asphalt irrespective of the mix type and group (i.e., this finding is true for conventional, wet blend rubber

TABLE 7 Summary of Design Binder Comparison Analysis
Group Description Mix Identification
---
1 Conventional Chevron AC - 20
Neste AC- 20
Conoco AC 120/150
Group Avera2e
2 Wet Process Neste SAR 10/5 (Manufacturer Preblended)
Neste SAR 10/10
Subgroup Average
2 Wet Process Ecoflex (Bitumar) (Manufacturer Preblended)
Suberoup Avera2e
4 Polymer Modified Neste EV ALAST
Sub2roup Avera2e EL V ALOY (Conoco 120/150 + 1.5% Mod)
ELVALOY (Conoco 120/150 + 2.0% Mod)
Sugroup Average
5 Wet Process Citgo AC-10 (0% EO + 10% CR) (Plant Blended)
Citgo AC-10 (3% EO + 15% CR)
Citgo AC-10 (7% EO + 20% CR)
Citgo AC-20 (0% EO + 10% CR)
Citgo AC-20 (3% EO + 15% CR)
Citgo AC-20 (7% EO + 20% CR)
Group Avera2e
•a. d(AC) Value= AC% (SUPERPA VE) - AC% (Marshall) b. SUPERP A VE Climatic Regions
Cool : Temp s; 34 °c ; Ndes = 67 Mod : Temp = 37 - 38 °c ; Ndes = 96 Warm : Temp= 43 - 44 °c ; Ndes = 119
Design
Va(%)
Cool
3.0 -4.0 1.0 5.0 0.9 3.0 -4.0 0.9 5.0 0.8 3.0 0.8 4.0 0.8 5.0 0.9
0.9 3.0 -4.0 1.3 5.0 1.1 3.0 -4.0 -5.0 1.0
1.1
3.0 -4.0 0.5 5.0 0.6
0.6
3.0 -4.0 0.8 5.0 0.5
0.7
3.0 -0.l 4.0 0.0 5.0 0.2 3.0 -4.0 -5.0 0.1
0.1
3.0 0.2 4.0 0.3 5.0 0.3 3.0 -4.0 0.5 5.0 0.5 3.0 -4.0 1.2 5.0 0.9 3.0 -4.0 1.1 5.0 0.9 3.0 -4.0 0.1 5.0 -0.4
3.0 0.2 4.0 -0.1 5.0 -0.4
0.4
Marshall · d(AC) Value
. Neq
Mod Warm
0.5 0.2 138 0.4 0.1 140 0.4 0.1 148 0.3 0.0 120 0.3 0.0 128 0.3 0.0 124 0.4 0.2 145 0.4 0.1 122 0.2 - 104
0.4 0.1 130 0.4 0.1 127 0.5 0.2 142 0.4 0.2 152
- 0.0 124 0.3 0.0 120 0.4 0.0 128
0.4 0.1 132
0.0 -0.3 133 0.0 -0.3 122 0.0 - 130
o.o -0.3 131
0.0 -0.4 104 -0.2 -0.5 89 -0.2 -0.5 84
-0.1 -0.5 92
-0.6 -0.8 68 -0.5 -0.8 72 -0.4 -0.7 77 -0.2 -0.8 91 -0.6 -0.8 80 -0.5 -0.7 67
-0.5 -0.8 76
-0.6 -0.9 76 -0.3 -0.6 87 -0.2 - 87 -0.1 -0.5 96 -0.2 -0.5 88 -0.2 -0.5 93 0.0 -0.6 96 0.3 -0.2 107 0.0 - 98
0.6 0.2 124 0.3 -0.7 103
- - 86 0.5 -1.1 116 -0.8 - 68
- - 70
-0.5 -1.1 76 -1.1 - 66
- - 60
-0.2 -0.6 89

Hafez and Witczak 169
I Group 1 : Conven~ional Mixes !
=a .&:
~ i
f! Cll : 0.80% :E Q. IC
_J_ ::c 0.0 II)
II -0.2 Cool Mod Warm Climatic
I
iii ~ ;a :E Q. a: :I: II)
II
u <( ;:;
1.2
1.0
0.8 0.6 0.4 0.2 0.0
-0.2 -0.4 -0.6 -0.8 -1.0
1.2-,-
1.0 + ~:: t~· 0.4
u -0.4 c( ;:; -0.6 -
-0.8
-1:0
Cool Mod Warm
Group 4: DuPont ELVALOY Mixes
D. IC :I: II)
II -0.2 Cool ~:~1-·= u -0.4 <( -0.6 T
;:; -0.8 l -1.0 L
1.00%
Climatic Range
1--------
Climatic Range 0.90%
Range
____ _J
1·1.2,
' 1.0 + ] 0.8 + ~ 0.6
:E 0.4 Q. IC ::c II)
II
0.2 0.0
-0.2
u -0.4 <( -0.6 T ;:;
-0.8 +
Cool Mod
Group 2: Ecoflex Mixes
-1.0 ' ·------------------------~
r·-··------- ·- --------------··-·-··- Group 4: Neste EVALAST Mixes
I 1.2..,.---~~~~~--'=========================::::'...~~~ 1.0
iii 0.8 .&: £! 0.6 Ill
:E Q.
1.20% IC ::c 0.0 II)
u -0.2 Cool Mod
u -0.4 c( -0.6 ;:;
-0.8 -1.0
Group 5: Wet Process Asphalt Rubber (Plant Blended)
1.2 ,....::================== ==========::::===========:::'.___, 1.0 T 0.8
Q. a: ::c II)
u
0.6
u -0.4 c( -0.6. iS I
f 1.00%•
Cool tmatic Range
-0.8L__ -1.0 ---------_____________ __,
FIGURE 2 Design AC percent differences (Superpave - Marshall) for mix groups evaluated.
(manufacturer-preblended and plant-blended) ·and polymermodified asphalt mixtures).
Within a given Superpave climatic region, there are no consistent trends in the d(AC) values between the various groups (subgroups) identified. In general, the d(AC)-climatic trends for the two Neste SAR (wet process-manufacturer preblends) are very similar to those found for all three of the conventional (Group 1) mixes studied. For the warm Superpave region, Level I design asphalt contents are almost equivalent to those found by the Marshall procedure. In contrast, for the cold Superpave region, the Superpave designs require about 1.0 percent more binder content than Marshall designs.
The Ecoftex (Bitumar) wet asphalt rubber binder appeared to be intermediate in d(AC) values to the conventional (Group 1) and
polymer modified (Group 4) mixtures. Both polymer modified subgroups (DuPont Elvaloy and Neste Evalast) resulted in Superpave asphalt contents that were significantly less ( -0.5 to -0.8 percent), for the warm Superpave condition, compared to Marshall derived asphalt contents.
Within a given Superpave climatic region, the wet process plantblended mix (Group 5) d(AC) values are dependent on the rubber percent and the binder type. For mixes prepared with AC-10 binders, the d(AC) value increases as the rubber percent increases and the converse is true for the mixes prepared using AC-20 binder.
The average Neq values for the conventional (Group 1 ), wet-blend SAR and wet-blend Ecoftex (Group 2) were found to be 130, 132, and 128, respectively. This implies that the probable response of the

er G> z
160
150
140
130
120
110
I !
100 ·~ T = 37/3~ Deg C l. .+----1--
901 I I
I : so -l- I
70 .\ T ~ < 34 IDeg C - - - - - • - - - - r - -
60 L. ·- -__ L_L __ _ (ij c 0
·~ > c 0
0
a: < (/)
I
I
I !
76
> 0 ...J
<
~
I
I
J I
I
104
i 0
11 #. oo UJ ~
- 11 0 ~ ~Cl..
u <
i M II cf?. @~
• II 0 ~ ~Cl..
u <
FIGURE 3 Equivalent number of gyrations for mixes investigated .
.... .s::. O> ·a;
:::c c: Q)
E ·c:; Q) c.
en End of Compaction
tc
Time (Gyrations)
i " 11 #. oo UJ N
• II 0 ~ ~Cl..
u <
FIGURE 4 Variation of sample height during and after Superpave gyratory compaction.
124
i 0 II#
Q O UJ ~
- 11 0 ~ ~Cl..
u <
85
i M
11 #-@~
- 11 0 ~ ~Cl..
u <
Bulk Density and Height Measurements
tm
i " II cf?. oo UJ N
• II 0 ~ N Cl..
u <

Hafez and Witczak
wet blends investigated is not dissimilar to conventional mixtures. The overall average of these groups (Ncq = 130) is not greatly different from the Superpave design gyration value, for warm climatic conditions, of Neq = 119. In contrast, the polymer-modified materials (Elvaloy and Evalast) resulted in Neq values of76 and 92, respectively, indicating that equivalent Superpave and Marshall design binder contents occur for colder Superpave climatic regions. This finding was also observed for the Group 5 (wet process plantblended) as the overall average of Neq was 89 and the subgroup averages ranged between 67 and 104, depending on the rubber percent and the binder type.
GYRATORY BEHAVIOR OF DRY PROCESS RUBBER ASPHALT MIXTURES
General Problem Discussion
As noted in Table 2, the study of the Group 3 (dry process rubber asphalt mixtures) involved the Marshall and Superpave Level I analysis of five separate mixtures (three generic mixes developed at the UMD and two Plus-Ride mixes). Several major obstacles developed with the implementation of the Superpave Level I approach for the Group 3 mixtures that have led the authors to conclude that the Superpave approach is not appropriate to select design binder contents for the Group 3 mixtures.
These problems and limitations regarding the Superpave approach are a direct result of two unique properties of the dry rubber asphalt mixtures. The first property of these mixtures is related to the highly resilient nature of the rubber particles used as aggregate within the mix. During the gyratory compaction process, the
100.0 r------- , I // ,
I ,'
95 .0 _.,_l_ --.~1-' --1---1 , I:
1: t.'
171
change in sample height (i.e., volumetric change) is primarily an elastic compression because of the high resilience of the rubber particles themselves. After the gyratory process is complete, a significant instantaneous rebound may occur in the specimen. This process is best viewed as having the gyratory device simply compact a series of elastic springs.
The second characteristic of these mixtures is related to the swelling of the sample after the compaction process stops. This positive (increase) volume change is a time dependent phenomena whose magnitude is related to the complex interaction of rubber type/gradation, percentage of rubber as well as asphalt cement, and the temperature during the compaction process.
These two volumetric change properties of the Group 3 mixtures are directly responsible for the inaccurate interpretation of lab results for use with the Superpave Level I mix design procedure currently used (especially the Ngyr criteria of Table 1 ). The schematic influence of this volume change is shown in Figure 4. Directly after compaction, if the mix has no volume change potential, the height of the specimen (and subsequently the measurement of the sample bulk density) is identical to end of compaction conditions. If the specimen exhibits volume change, the final height at the end of compaction and the measured bulk-specific gravity after the sample cools cannot be used to correct the density curves (i.e., obtain Cc ... ) because the specimen volumes differ between the G111b measurement and the end of compaction process. Thus, even though "corrections" can be computed, they will always be in error and consequently provide erroneous plots of gyrations versus air voids (or percent of maximum theoretical gravity). In contrast, accurate estimates of the densification curve can be obtained for mixtures with little to no volume change after the compaction process.
T -----+-------~
90.0 ,. ·---1 85
·0 l--~---~-l- I :-~ - - l -~-------! 80.0 ~t-
1
f---- -1----l ___ l I
:::: 1-~o----+----· -~-+--j 0 20 40 60 80 100 120 140 160 180
No. of Gyrations
FIGURE 5 Percent of theoretical maximum specific gravity versus number of gyrations under different asphalt content (Plus Ride No. 12).
200

172 TRANSPORTATION RESEARCH RECORD 1492
TABLE 8 Equivalent Marshall Gyrations for Group 3-Dry Process Rubber Asphalt Mixes
Group Description Mix Identification Va(%) AC% Marshall Marshall Neq
3 Dry Process Rubber Asphalt Generic: Chevron AC-20 ( 1 % R) 3.0 6.2 72
4.0 5.7 71
5.0 5.5 59
Group Average 67
Generic: Chevron AC-20 ( 2% R) 3.0 8.0 23
4.0 7.3 22
5.0 6.8 21
Group Average 22
Generic: Chevron AC-20 ( 3% R) 3.0 9.0 16
4.0 8.2 10
5.0 7.7 13
Group Average 13
Plus Ride No. 12 ( 3% R) 3.0 10.0 6
4.0 8.9 8
5.0 7.5 11
Group Average 8
Plus Ride No. 16 ( 3% R) 3.0 7.4 14
Typical Results
Figure 5 illustrates results of the "corrected" densification curves for the PLUS RIDE No. I 2 mixture at three binder contents. All five of the Group 3 mixtures evaluated.resulted in very similar types of relationships. The difference in gyratory response for this mix is quite obvious in comparison to the Group 1 (conventional) mix response shown in Figure l. As a general rule, the "computed" (erroneous) maximum theoretical density was achieved within 20 to 50 gyrations for all 15 mix-binder content combinations evaluated in Group 3. As noted, the major reason associated with the rapid "densification" of dry rubber asphalt mixtures is caused by the large resilient (elastic) deformations within the rubber particles themselves and not by permanent densification of the specimen from the compaction process.
The inapplicability of the Superpave densification curves developed for all five mixtures in Group 3 can also be viewed relative to the N~q parameter introduced in the previous section of this paper. Table 8 summarizes for the Group 3 mixtures, the Marshall design asphalt content and the equivalent Superpave gyratory repetitions necessary to achieve equivalent binder contents. Of special importance is that each of the five mixtures was successfully placed in MSHA field demonstration projects during the fall of l 993 at design Marshall asphalt contents shown in the table at air voids between 3 and 4 percent. The Superpave Neq values (average) (67, 22, 13, 8, and 15) are nowhere near the Table 1 (Superpave) recommendations of Ndes = 67, 96, and 119 to represent the various gyratory climatic regions used in this study. In fact, the difference is so large that it was impossible to obtain design binder contents for all five mixtures from the Superpave criterion shown in Table 1.
4.0 6.4 16
5.0 - -Group Average 15
To evaluate the influence of the time-dependent volume change increase immediately after the gyratory compaction process, the gyratory machine itself determined the time-dependent height change observed during the volume change process. This process involved the preparation of an additional replicate, at each binder content, and compacting the specimens in the gyratory device to 200 gyrations. At the end of compaction, the ram pressure was released to a zero level and the height of the specimen recorded at various time increments (generally I 0 measurements during the first 30 min, starting at 30 sec, I to 2 hr, 3 to 4 hr, and 16 to 20 hr).
The measurement of volume change was computed by two approaches using the process to obtain the Gmb values. In the "confined" approach, the specimens were left in the gyratory mold for 16 to 20 hr after the end of the compaction process. Bulk density measurements were obtained on the specimen after completion of the volume change measurements. For the "unconfined" approach, samples were extruded from the molds after about 1.5 hr from the end of the compaction and allowed to expand volumetrically for 16 hr before the bulk gravity was measured.
Figure 6 illustrates a typical volume change (as denoted by the air voids) pattern measured during the study. The combined influence of the nearly instantaneous and time-dependent swell pattern on this mix is clearly shown. A volume change equivalent to an air void change, dV0 • of nearly 6.0 percent was observed.
Figure 7 graphically summarizes the average dV0 values (computed by both the "confined" and "unconfined" approaches) for all mixtures and binder contents evaluated and not limited to the Group 3 mixtures. While dV0 values were recorded for Groups I, 2, and 4, their magnitude is not considered to be significant relative to the dVa values obtained on the Group 3 (dry-process rubber asphalt) mix-

~ 2... IQ
> "C ~ 0
! 0
(.)
30.0 -- . ~~~1 :1---r-----+----
---- i 25.0
~---~r 20.0 -!------ ---1- _j _____ I __ _
15_0 I ___
. 10.0
5.0
0.0 +~1-
o I
_L
I
2000 End of Compaction
i I
I ~
4000 6000 8000
l +- --------'. II I I I I _ _j
~- I : I -- I . I --1 --l -___ L___ ,
_,
l 10000 12000 14000 16000 18000 20000
Time (sec)
FIGURE 6 Corrected air voids versus time (rubber modified asphalt mixtures with Pb= 7.0 percent and Pr= 2.0 percent.
6
I 5.
4
«l 3 >
'C
2
0.4
iU .... 5 0. '+;'. ::J c 0 ~ .... > (!I c:
0 ~
0.3 0.6
~2':-o~ :2. Q)
- '"C N <I>; a. ~ ::0 :I 0 11> 0 0 .... ....... a..
(!I c...
0.5
~ ~ :-0-~~ 'Ct" :0
~~ e (!I
ID Confined O Unconfined
5.7
I
>i .... .s::. e ~~ (") <( ~ Q, Ill .Q :::i ti) :s 0 Ql a: .... (,l
(!I e . a..
FIGURE 7 Average volume change (dV0 ) values after gyratory compaction by major mix groups.
1.6
a; c !:>- cc -:> - i::i - Q. G> It) iii "C
ti) c n. Ql GI E g a o~

174 TRANSPORTATION RESEARCH RECORD 1492
~--, - -
>----
-·~-
I/ v , 1 ,___ ,__
.iv ,.
,___ -- I I (
I~
7
6
5 I
- >--- . - - - -- ·--• "--
i IV
> "ti
l_ u 4
3
r-2
0
10.0
I I I
I
' I , J
\1 1- I
I
I I I I
I 15.0
~
J I
1•
)9
I v I/
I I I ,_ : I I I
'J I - -- - - ~- ~,_
I - - --
20.0 25.0
I ... I I.()'-
-
I ~
' . I J .. ,,
I I
I I
• ,. I . I
·-~ -·1-··1"-1-- >---r - ..
·~ .. I I
. I
.. i-. .. -1-II' I
I -.
i.. j " . 7
I/ ~
I
- ,_ ,__ ,_, C3
30.0 35.0 40.0 45.0 50.0
Pr lpercent of binder weight)
1~G: 1%R --El-G: 2%R • • .. G: 3%R --El• PR #12 -4• PR #161 FIGURE 8 Increase in air voids after gyratory compaction versus rubber percent (by binder weight) for Group 3 mixtures-confined condition.
tures. The Group 5 (wet-process plant-blended) mixtures exhibited intermediate volume change between these two categories of groups discussed. While their volume change magnitudes are nowhere near those recorded for Group 3, they are 2 to 3 times the magnitude of Group 1, 2, and 4; therefore, these mixtures should also be considered suspect relative to the Superpave interpretation.
Figure 8 shows the relationship between dV" and rubber percentage (by binder weight) for all five mixtures within Group 3. Within any given mix, the dVa is shown to greatly increase as the rubber percentage is increased (i.e., binder content is decreased). Or, at a given rubber percent (by total mix weight) the dV" (volume change) is decreased with increasing asphalt content.
SUMMARY AND CONCLUSIONS
This study focused on the comparison of Asphalt Mix designs between the 75-blow Marshall and Superpave gyratory Level I approach. A total of 20 different mixtures were evaluated and categorized into five major mix groups. Based on the results of this study the following conclusions have been developed.
1. Of the five mix groups evaluated, it is the conclusion of the authors that the Superpave gyratory Level I design cannot be used to evaluate dry-process rubber asphalt mixtures. The reasons for this are due to the high resilience of the rubber particles during the compaction process and the time dependent swelling, after compaction, of these mixtures. This suggests, that problems with the Superpave
approach implementation may occur on any mixture possessing these abnormal characteristics.
2. The design process for all other mixtures investigated, except for the wet-process plant-blended mixes where slightly higher swelling was observed, posed no similar type of problem and demonstrated the potential advantages and benefits of the Superpave gyratory approach.
3. Relative to the comparison of design asphalt content differences between both mix design procedures, it was found that:
a. Within any specific mix type, the difference in asphalt contents between approaches is independent of the target air void level selected (V0 = 3.0 to 5.0 percent) to develop the design value.
b. As the Superpave climatic regions changes from warm to cool, an increase of approximately 1.0 percent more asphalt will be required from the Level I approach. This finding was found to be true for all mix types/groups studied.
c. Within a given Superpave climatic region, no consistent trends in design asphalt contents, between the type of mix design procedure used, were found between mixtures. In general, design asphalt contents for the conventional and wet process (manufacturer-preblended) asphalt rubber mixes were equivalent between the Marshall and the warm Superpave climatic region while the converse was true for the wet process (plant blended) asphalt rubber mixes. For identical traffic and climatic conditions, the Superpave Level I designs for polymer modified mixtures were about 0.5 percent to 0.8 percent less than the Marshall analysis.
Hafez and Witczak
ACKNOWLEDGMENTS
This research has been conducted under a research grant from the Maryland State Highway Administration to the University of Maryland under MSHA Study No. A W0-94-368-046, Development of Demonstration Projects With Scrap Tire Rubber in Highway Pavements Within the State of Maryland. The authors are indebted to MSHA for their technical and financial assistance. The contents of this paper reflect the views and opinions of only the authors and do not reflect the official views or policies of MSHA.
175
REFERENCES
I. Strategic Highway Research Program (SHRP) The Superpave Mix Design Manual for New Construction and Overlays. National Research Council, March I 993. ·
2. Asphalt Institute Manual Series No. 2 (MS-2). Mix Design Methods for Asphalt Concrete and Other Hot-Mix Types. 6th ed. Lexington, Ky., 1993.
Publication of this paper sponsored by Committee on Characteristics of Bituminous Paving Mixtures to Meet Structural Requirements.