comparison of langer biomechanic’s dynaflange™ to ... study.pdf · comparison of langer...
TRANSCRIPT
Comparison of Langer Biomechanic’s DynaFlange™ to Traditional, “Legacy”, Rear Foot Posted Orthotics
DynaFlange™ Testing Session 2012
Sally M Crawford MS, Biomed Eng, Neuromuscular Eng. [email protected], 480-392-4137
Background
Motion control, energy return, balance, stability and comfort are some of the key words used in preparing for orthotic
intervention. The traditional, extrinsic rear foot post is typically used to stabilize, and sometimes restrict movement
of the foot, so as to provide relief of clinical symptomsi. The so called “Legacy” post can also impede the natural
reaction to the environment, and not encourage as much natural, or barefoot, and un-braced motion. Rear foot posts
consist of material added to the underside of the orthotic shell’s heel with a goal of increasing stabilization and motion
management at heel contact. Thus far, no studies have compared their quantitative function or comfort to that of
more dynamic orthotic devices, such as Langer Biomechanics, DynaFlange™, invented by Dr. Jay Segel.
Dynamic orthotics are designed to control motion, not only at heel contact, but throughout the gait cycle. Dynamic
orthotics work to facilitate motion, store and distribute energy,or loading symmetries. Additionally, they are
responsive and adaptive throughout the entire gait cycle, so as not to focus in one singular area. Doing so may
otherwise force associated areas to be compromised due to over-compensations. Adding the mechanics of flexible,
dynamic bounce, while maintaining control where it otherwise might not be allowed, and mitigating the localized
rigidities of posts can translate to a revolutionary idea. Does the aspect of control hold up though? Will the
responsiveness of a dynamic orthotic follow through where it is needed?
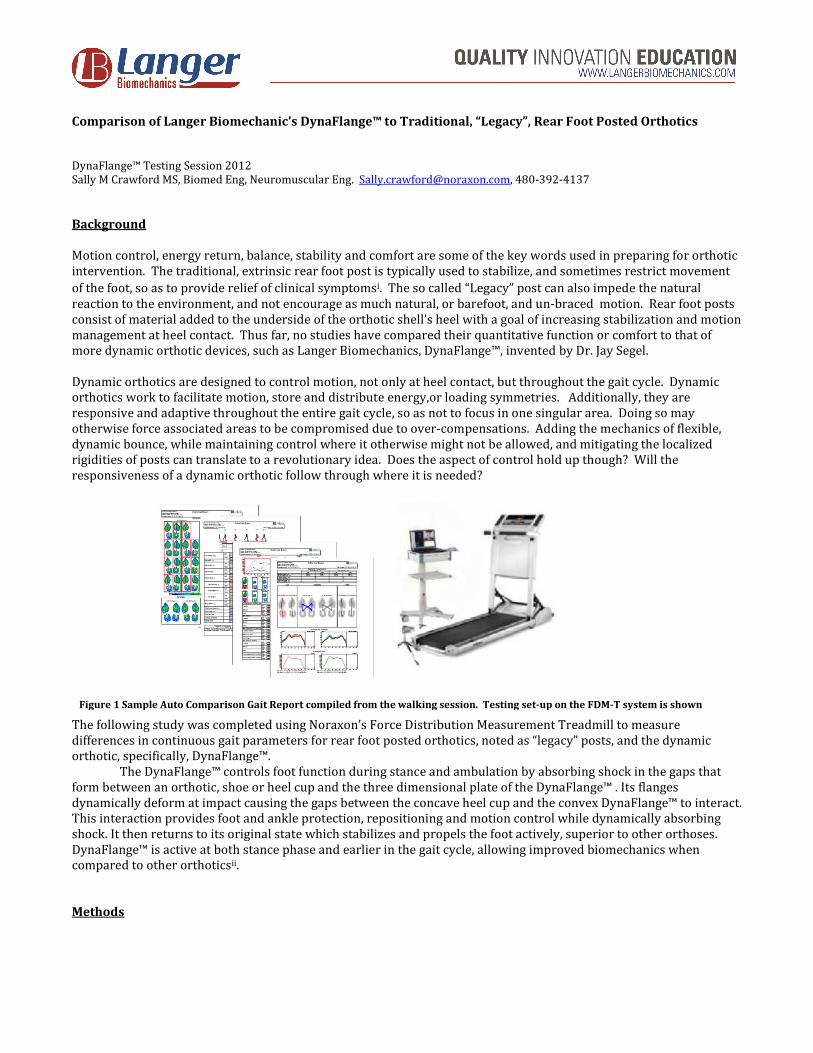
The following study was completed using Noraxon’s Force Distribution Measurement Treadmill to measure
differences in continuous gait parameters for rear foot posted orthotics, noted as “legacy” posts, and the dynamic
orthotic, specifically, DynaFlange™.
The DynaFlange™ controls foot function during stance and ambulation by absorbing shock in the gaps that
form between an orthotic, shoe or heel cup and the three dimensional plate of the DynaFlange™ . Its flanges
dynamically deform at impact causing the gaps between the concave heel cup and the convex DynaFlange™ to interact.
This interaction provides foot and ankle protection, repositioning and motion control while dynamically absorbing
shock. It then returns to its original state which stabilizes and propels the foot actively, superior to other orthoses.
DynaFlange™ is active at both stance phase and earlier in the gait cycle, allowing improved biomechanics when
compared to other orthoticsii.
Methods
Figure 1 Sample Auto Comparison Gait Report compiled from the walking session. Testing set-up on the FDM-T system is shown
adjacent.
In this study, 23 subjects were tested within 48 hours. All were without acute, inhibiting symptoms or pathologies.
Subjects were all previously scanned to assure a correct device size.“Legacy” osted orthotics (abbreviated L)and
DynaFlange™ orthotics (abbreviated D), made either of a composite or plastic shell(C or PE), were custom
manufactured specifically for testing.
Testing was completed on Noraxon’s FDM-T system for stance and gait analysis. The Force Distribution Measurement
Treadmill (FDM-T) makes it possible to control the speed, walking surface, and environment while measuring all
temporal and spacial gait parameters along with complete kinetics, pressure and ground reaction forces averaged and
segmented. The FDM-T system has over 5,300 pressure sensors in a 150 x 50 cm area, built into the deck of the
treadmill under the belt, thus subjects are not limited in their foot placement, deformities, orientations, or gait styles.
The unit is a proprietary technology developed by Zebris to automatically stabilize the belt for accurate data
acquisition from initial contact, during walking or running gait, through gait roll-off over any number of strides. The
system is exclusively distributed and supported by Noraxon USA.
Upon arrival, instructions were provided and a questionnaire on any pre-existing variables or symptoms (along with
mention of ease of comfort on a treadmill, age, and weight), was completed. All subjects also signed a data release
form. Prior to any measurement being taken, the auto calibration button was activated, and subjects were asked to
walk for a few minutes to obtain comfort on the FDM-T. After a comfort level was achieved and natural gait was
maintained, recording #1 was completed at 1.5 kph with patient facing forwards, arms relaxed, eyes forward. Data for
the recording in regular sneakers was saved as Subject “X” R. The second recording was then made for the same
length of time at a subject-chosen speed. Data recorded for the second recording in regular shoes was saved as
Subject “X” R 2, denoting the second speed.
Following this first test, while resting off the treadmill, subjects were asked to remove standard, everyday inserts, and
replace them with their custom “Legacy” post or DynaFlange™. They were asked to again reach comfort treadmill
level prior to recording and maintain consistent gait for 30 seconds at 1.5kph, and then at their chosen speed. These
recordings were saved as Subject X (LC/LPE) and then Subject X (LC/LPE 2) if “Legacy” was used, or Subject X
(DC/DPE), or Subject X (DC/DPE) if DynaFlange™ was used. The procedure was then completed again for the
remaining device, including rest then the initial walk on the treadmill as warm-up.
Once the 6 recordings of walking were made, there was a summary test completed of lateral stepping - left and right - ,
initiating from a stance with feet shoulder width apart. These were recorded as Subject X step (DC/DPE), or Subject X
step (LC/LPE).
Summary of Tests:
I. Dynamic Gait: Regular Shoe (R) without custom orthotic;1.5 kph and speed of choice based on comfort
II. Dynamic Gait: “Legacy” Post (L) Orthotic;1.5 kph and speed of choice based on comfort (made either
of C or PE)
III. Lateral Side-Step: “Legacy” Post (L) Orthotic (made either of C or PE)
IV. Dynamic Gait: DynaFlange™ (D) Orthotic; 1.5 kph and speed of choice based on comfort (made either
of C or PE)
V. Lateral Side-Step: DynaFlange™ (D) Orthotic (made either of C or PE)
Auto Gait Report Print Outs comparing “Legacy” (L) to DynaFlange™ (D) were saved, and raw data for parameters and
center of pressure analysis were exported from the reports.
Results and Discussion
As tests were completed, the overall responses to the DynaFlange™ experience matched the numbers to a marked
degree. Measurements with the DynaFlange™ showed longer roll-throughs, lengthened steps, dispersed impacts with
increased loading responses, and more balancedand controlled movement. All were objectified reactions which
subjects did not have with the “Legacy” post. Based on automatic software reports of direct comparisons on 30
seconds of strides, averaged for each of the 23 subjects, the following numerical results were found for the differences
between DynaFlange™, over the “Legacy” post.
CENTER OF PRESSURE ANALYSIS
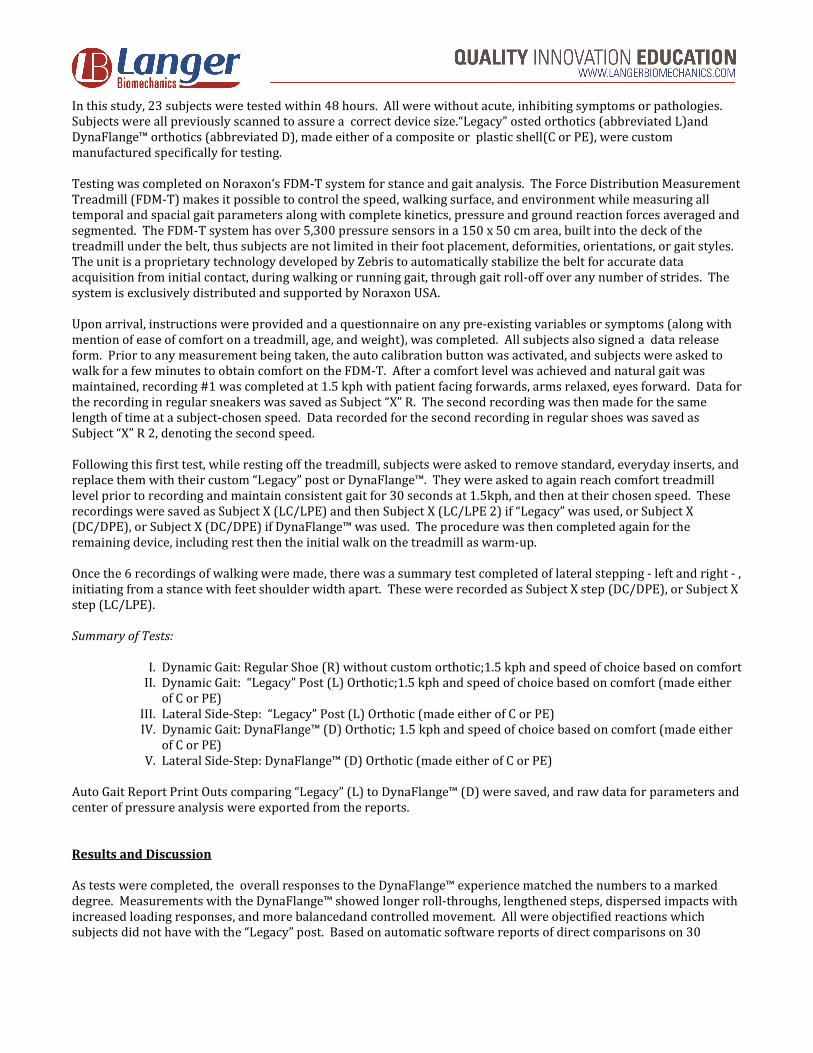
The first, most notable parameter, documented in each report was the gait line for the left and right side (COP
trace during stance phase). With DynaFlange™, the average gait line for the left and right side increased in length by
over 4.3mm when compared to the “Legacy” posts. The largest set of gait line lengths increased 30-40mm more from
gait with the “Legacy” post. The average variability in this length was reduced to less than 2.17 mm. This translates to
a significantly longer sagittal movement of ground contact, and as shown by the loading rates, a smoother, more
efficient overall transition. There were more consistent patterns between strides, as indicated by the reduced
variations in the individual gait line lengths. Less variation of the gait lines follow the law that gait is a repeated
motion. Ideal gait would be without step deviations. DynaFlange™ was found to bring these patterns to a more ideal
level.
Aside from the gait line increasing for over 82% of the test subjects, average single support line on the left and right
increased by over 2.74mm. They also had reduced variability between strides for the same percentage. A faster, more
consistent, single support is indicative of the smoother propulsion into swing phase and single support for the
opposite side. This is also supported by the increased length of the loading response, detailed below.
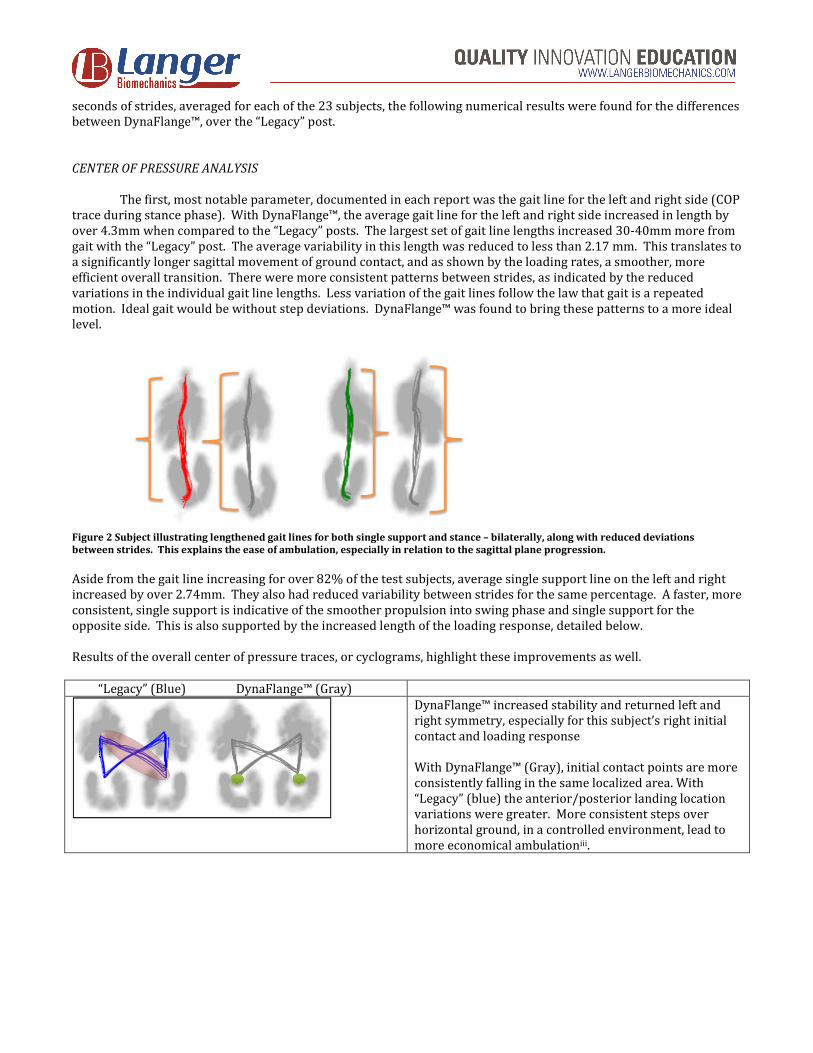
Results of the overall center of pressure traces, or cyclograms, highlight these improvements as well.
“Legacy” (Blue) DynaFlange™ (Gray)
DynaFlange™ increased stability and returned left and
right symmetry, especially for this subject’s right initial
contact and loading response
With DynaFlange™ (Gray), initial contact points are more
consistently falling in the same localized area. With
“Legacy” (blue) the anterior/posterior landing location
variations were greater. More consistent steps over
horizontal ground, in a controlled environment, lead to
more economical ambulationiii.
Figure 2 Subject illustrating lengthened gait lines for both single support and stance – bilaterally, along with reduced deviations
between strides. This explains the ease of ambulation, especially in relation to the sagittal plane progression.
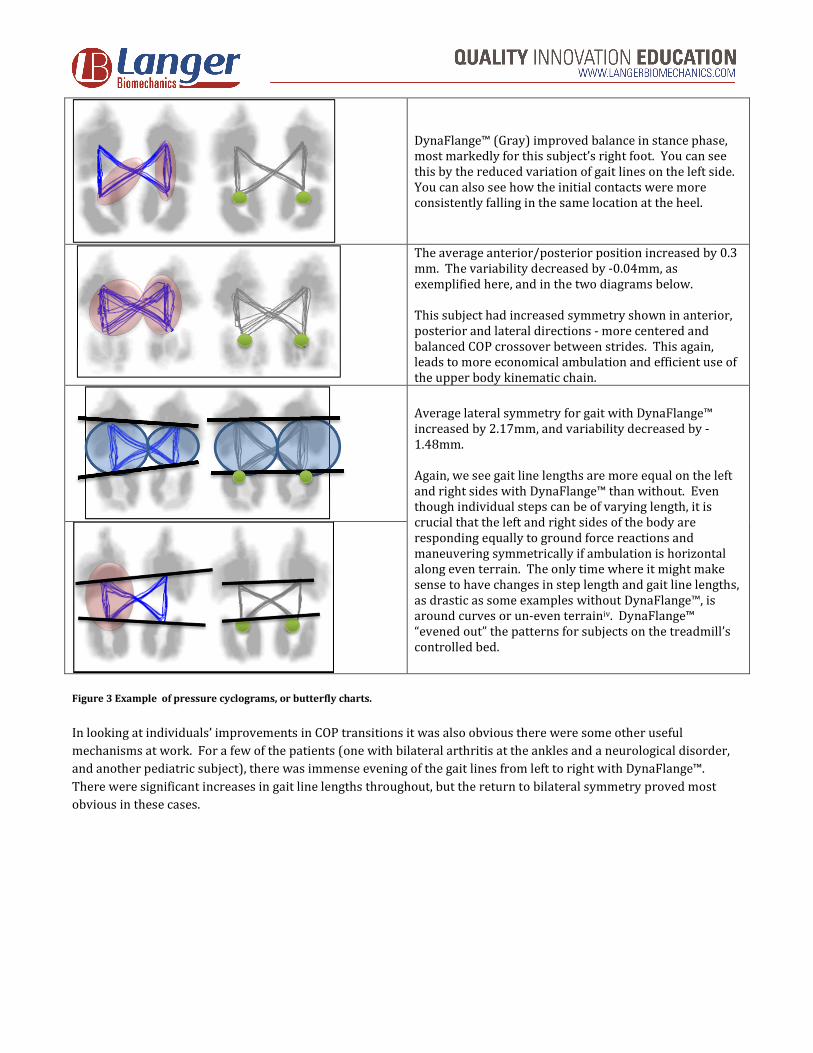
DynaFlange™ (Gray) improved balance in stance phase,
most markedly for this subject’s right foot. You can see
this by the reduced variation of gait lines on the left side.
You can also see how the initial contacts were more
consistently falling in the same location at the heel.
The average anterior/posterior position increased by 0.3
mm. The variability decreased by -0.04mm, as
exemplified here, and in the two diagrams below.
This subject had increased symmetry shown in anterior,
posterior and lateral directions - more centered and
balanced COP crossover between strides. This again,
leads to more economical ambulation and efficient use of
the upper body kinematic chain.
Average lateral symmetry for gait with DynaFlange™
increased by 2.17mm, and variability decreased by -
1.48mm.
Again, we see gait line lengths are more equal on the left
and right sides with DynaFlange™ than without. Even
though individual steps can be of varying length, it is
crucial that the left and right sides of the body are
responding equally to ground force reactions and
maneuvering symmetrically if ambulation is horizontal
along even terrain. The only time where it might make
sense to have changes in step length and gait line lengths,
as drastic as some examples without DynaFlange™, is
around curves or un-even terrainiv. DynaFlange™
“evened out” the patterns for subjects on the treadmill’s
controlled bed.
Figure 3 Example of pressure cyclograms, or butterfly charts.
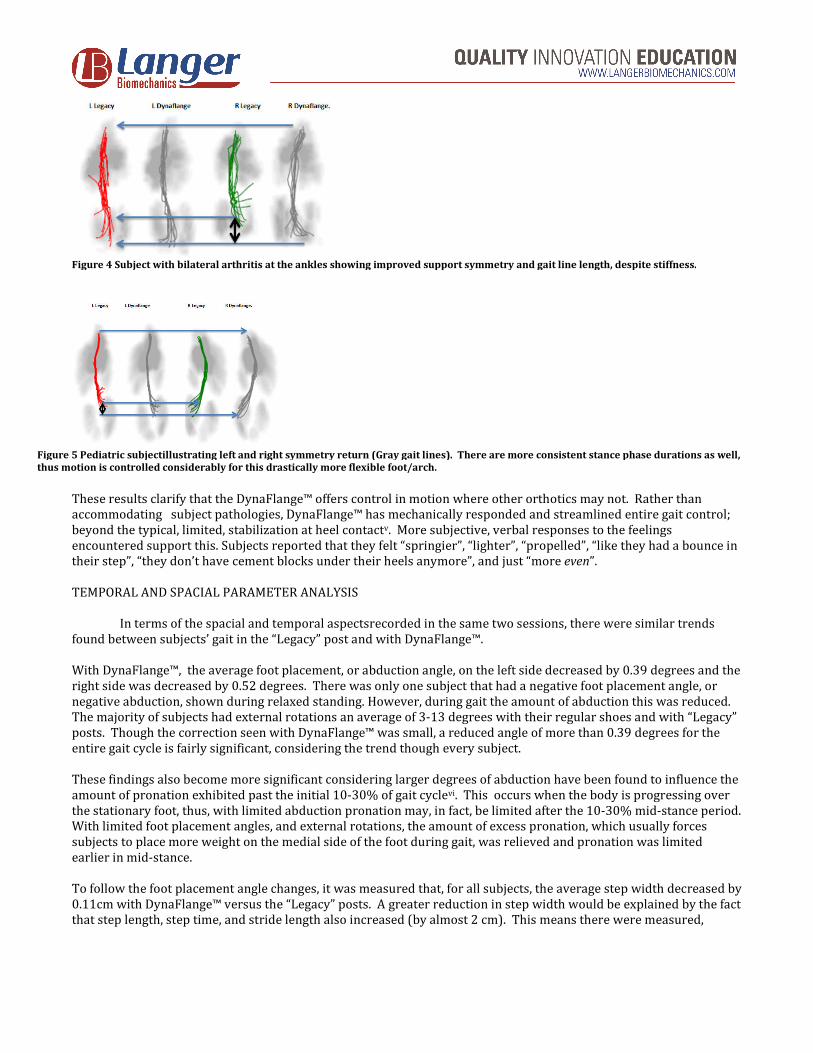
In looking at individuals’ improvements in COP transitions it was also obvious there were some other useful
mechanisms at work. For a few of the patients (one with bilateral arthritis at the ankles and a neurological disorder,
and another pediatric subject), there was immense evening of the gait lines from left to right with DynaFlange™.
There were significant increases in gait line lengths throughout, but the return to bilateral symmetry proved most
obvious in these cases.
These results clarify that the DynaFlange™ offers control in motion where other orthotics may not. Rather than
accommodating subject pathologies, DynaFlange™ has mechanically responded and streamlined entire gait control;
beyond the typical, limited, stabilization at heel contactv. More subjective, verbal responses to the feelings
encountered support this. Subjects reported that they felt “springier”, “lighter”, “propelled”, “like they had a bounce in
their step”, “they don’t have cement blocks under their heels anymore”, and just “more even”.
TEMPORAL AND SPACIAL PARAMETER ANALYSIS
In terms of the spacial and temporal aspectsrecorded in the same two sessions, there were similar trends
found between subjects’ gait in the “Legacy” post and with DynaFlange™.
With DynaFlange™, the average foot placement, or abduction angle, on the left side decreased by 0.39 degrees and the
right side was decreased by 0.52 degrees. There was only one subject that had a negative foot placement angle, or
negative abduction, shown during relaxed standing. However, during gait the amount of abduction this was reduced.
The majority of subjects had external rotations an average of 3-13 degrees with their regular shoes and with “Legacy”
posts. Though the correction seen with DynaFlange™ was small, a reduced angle of more than 0.39 degrees for the
entire gait cycle is fairly significant, considering the trend though every subject.
These findings also become more significant considering larger degrees of abduction have been found to influence the
amount of pronation exhibited past the initial 10-30% of gait cyclevi. This occurs when the body is progressing over
the stationary foot, thus, with limited abduction pronation may, in fact, be limited after the 10-30% mid-stance period.
With limited foot placement angles, and external rotations, the amount of excess pronation, which usually forces
subjects to place more weight on the medial side of the foot during gait, was relieved and pronation was limited
earlier in mid-stance.
To follow the foot placement angle changes, it was measured that, for all subjects, the average step width decreased by
0.11cm with DynaFlange™ versus the “Legacy” posts. A greater reduction in step width would be explained by the fact
that step length, step time, and stride length also increased (by almost 2 cm). This means there were measured,
Figure 4 Subject with bilateral arthritis at the ankles showing improved support symmetry and gait line length, despite stiffness.
Figure 5 Pediatric subjectillustrating left and right symmetry return (Gray gait lines). There are more consistent stance phase durations as well,
thus motion is controlled considerably for this drastically more flexible foot/arch.
faster, transitions between contacts. Faster transitions are made more efficient if the stride width is also made more
economical (limbs are not swinging out)vii.
Summary of Findings
• Average Step length on the left increased by 0.50cm
• Average Step length on the right increased by 1.33cm
• Average Step time on the left increased by 0.01
• Average Step time on the right increased by 0.01
Subjects additionally reported less strain in the mid-foot with DynaFlange™ rather than with the “Legacy” post. This
is speculated to be due to the DynaFlange™ deforming and providing energy to get the foot into re-supination and
back off the ground, rather than ceasing the support after landing, and in some cases “blocking” the rest of the
movement pathwayviii. This can be seen as the amount of time the heel is on the ground is longer, but the transition
through to forefoot loading is faster as more of the contact energy is transferred. There was a measured faster and
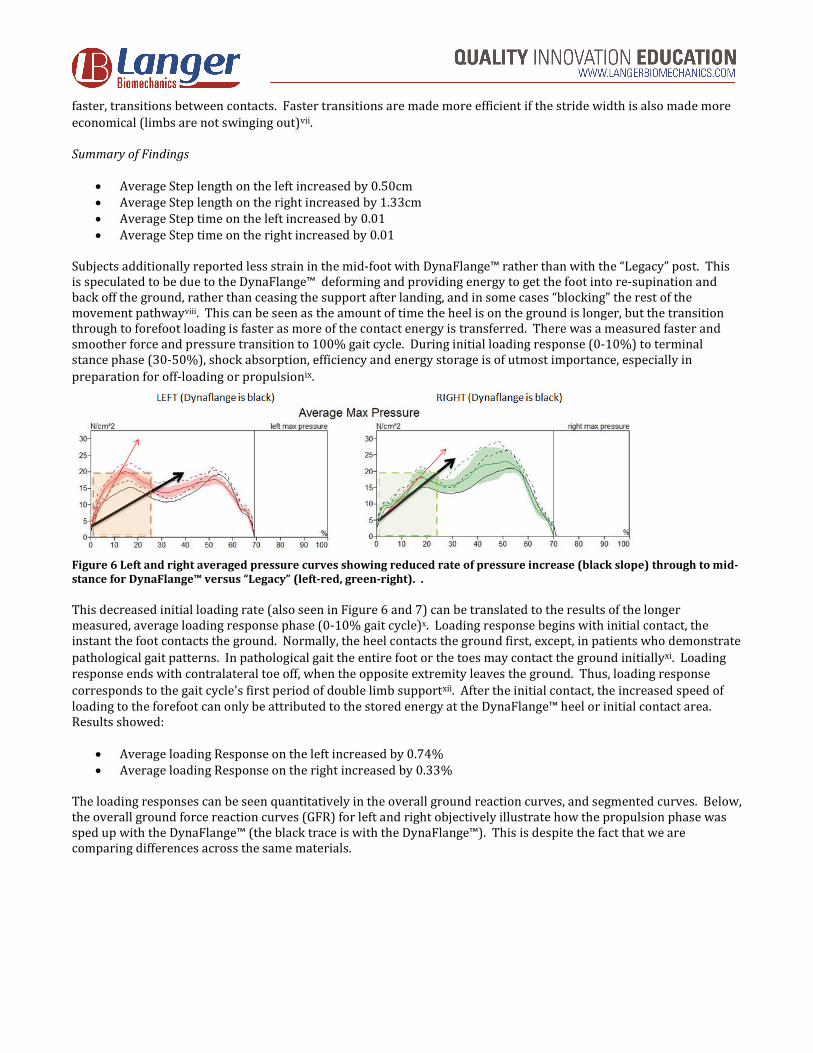
smoother force and pressure transition to 100% gait cycle. During initial loading response (0-10%) to terminal
stance phase (30-50%), shock absorption, efficiency and energy storage is of utmost importance, especially in
preparation for off-loading or propulsionix.
Figure 6 Left and right averaged pressure curves showing reduced rate of pressure increase (black slope) through to mid-
stance for DynaFlange™ versus “Legacy” (left-red, green-right). .
This decreased initial loading rate (also seen in Figure 6 and 7) can be translated to the results of the longer
measured, average loading response phase (0-10% gait cycle)x. Loading response begins with initial contact, the
instant the foot contacts the ground. Normally, the heel contacts the ground first, except, in patients who demonstrate
pathological gait patterns. In pathological gait the entire foot or the toes may contact the ground initiallyxi. Loading
response ends with contralateral toe off, when the opposite extremity leaves the ground. Thus, loading response
corresponds to the gait cycle's first period of double limb supportxii. After the initial contact, the increased speed of
loading to the forefoot can only be attributed to the stored energy at the DynaFlange™ heel or initial contact area.
Results showed:
• Average loading Response on the left increased by 0.74%
• Average loading Response on the right increased by 0.33%
The loading responses can be seen quantitatively in the overall ground reaction curves, and segmented curves. Below,
the overall ground force reaction curves (GFR) for left and right objectively illustrate how the propulsion phase was
sped up with the DynaFlange™ (the black trace is with the DynaFlange™). This is despite the fact that we are
comparing differences across the same materials.
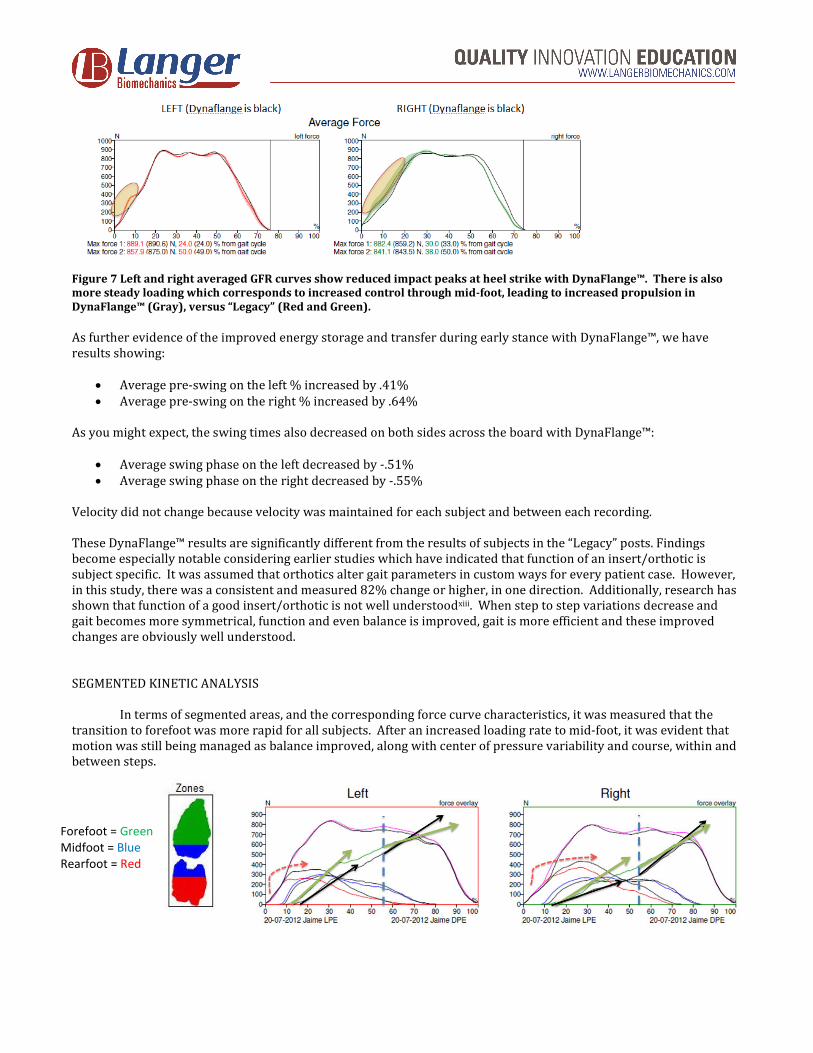
Figure 7 Left and right averaged GFR curves show reduced impact peaks at heel strike with DynaFlange™. There is also
more steady loading which corresponds to increased control through mid-foot, leading to increased propulsion in
DynaFlange™ (Gray), versus “Legacy” (Red and Green).
As further evidence of the improved energy storage and transfer during early stance with DynaFlange™, we have
results showing:
• Average pre-swing on the left % increased by .41%
• Average pre-swing on the right % increased by .64%
As you might expect, the swing times also decreased on both sides across the board with DynaFlange™:
• Average swing phase on the left decreased by -.51%
• Average swing phase on the right decreased by -.55%
Velocity did not change because velocity was maintained for each subject and between each recording.
These DynaFlange™ results are significantly different from the results of subjects in the “Legacy” posts. Findings
become especially notable considering earlier studies which have indicated that function of an insert/orthotic is
subject specific. It was assumed that orthotics alter gait parameters in custom ways for every patient case. However,
in this study, there was a consistent and measured 82% change or higher, in one direction. Additionally, research has
shown that function of a good insert/orthotic is not well understoodxiii. When step to step variations decrease and
gait becomes more symmetrical, function and even balance is improved, gait is more efficient and these improved
changes are obviously well understood.
SEGMENTED KINETIC ANALYSIS
In terms of segmented areas, and the corresponding force curve characteristics, it was measured that the
transition to forefoot was more rapid for all subjects. After an increased loading rate to mid-foot, it was evident that
motion was still being managed as balance improved, along with center of pressure variability and course, within and
between steps.
Forefoot = Green
Midfoot = Blue
Rearfoot = Red
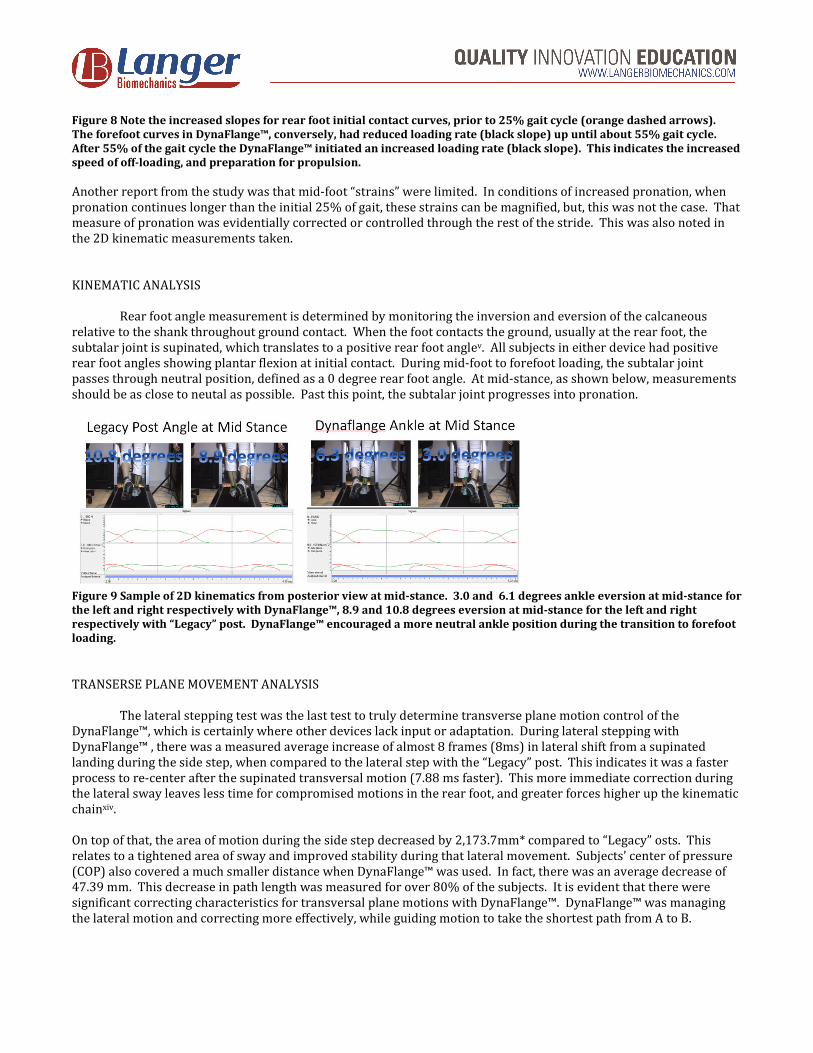
Figure 8 Note the increased slopes for rear foot initial contact curves, prior to 25% gait cycle (orange dashed arrows).
The forefoot curves in DynaFlange™, conversely, had reduced loading rate (black slope) up until about 55% gait cycle.
After 55% of the gait cycle the DynaFlange™ initiated an increased loading rate (black slope). This indicates the increased
speed of off-loading, and preparation for propulsion.
Another report from the study was that mid-foot “strains” were limited. In conditions of increased pronation, when
pronation continues longer than the initial 25% of gait, these strains can be magnified, but, this was not the case. That
measure of pronation was evidentially corrected or controlled through the rest of the stride. This was also noted in
the 2D kinematic measurements taken.
KINEMATIC ANALYSIS
Rear foot angle measurement is determined by monitoring the inversion and eversion of the calcaneous
relative to the shank throughout ground contact. When the foot contacts the ground, usually at the rear foot, the
subtalar joint is supinated, which translates to a positive rear foot anglev. All subjects in either device had positive
rear foot angles showing plantar flexion at initial contact. During mid-foot to forefoot loading, the subtalar joint
passes through neutral position, defined as a 0 degree rear foot angle. At mid-stance, as shown below, measurements
should be as close to neutal as possible. Past this point, the subtalar joint progresses into pronation.
Figure 9 Sample of 2D kinematics from posterior view at mid-stance. 3.0 and 6.1 degrees ankle eversion at mid-stance for
the left and right respectively with DynaFlange™, 8.9 and 10.8 degrees eversion at mid-stance for the left and right
respectively with “Legacy” post. DynaFlange™ encouraged a more neutral ankle position during the transition to forefoot
loading.
TRANSERSE PLANE MOVEMENT ANALYSIS
The lateral stepping test was the last test to truly determine transverse plane motion control of the
DynaFlange™, which is certainly where other devices lack input or adaptation. During lateral stepping with
DynaFlange™ , there was a measured average increase of almost 8 frames (8ms) in lateral shift from a supinated
landing during the side step, when compared to the lateral step with the “Legacy” post. This indicates it was a faster
process to re-center after the supinated transversal motion (7.88 ms faster). This more immediate correction during
the lateral sway leaves less time for compromised motions in the rear foot, and greater forces higher up the kinematic
chainxiv.
On top of that, the area of motion during the side step decreased by 2,173.7mm* compared to “Legacy” osts. This
relates to a tightened area of sway and improved stability during that lateral movement. Subjects’ center of pressure
(COP) also covered a much smaller distance when DynaFlange™ was used. In fact, there was an average decrease of
47.39 mm. This decrease in path length was measured for over 80% of the subjects. It is evident that there were
significant correcting characteristics for transversal plane motions with DynaFlange™. DynaFlange™ was managing
the lateral motion and correcting more effectively, while guiding motion to take the shortest path from A to B.
The last stunning result from the lateral stepping test showed that the average velocity, mm/sec, of the COP
movement increased by 5.73 m/s over the “Legacy” posts’ average velocity during lateral stepping. This suggests that
with DynaFlange™, the velocity of correction during the lateral step was increased. The rapidly correcting nature of
DynaFlange™ made the re-centering smoother and more immediate. Legacy posts did not provide the flexibility and
dynamic response to center, rather the numbers showed movement was slowed and possibly compromised,
especially at the ankle and even farther up the kinematic chain.
Conclusion:
Results were run through statistical analysis tests. The T-Test that was used was particular to paired samples or
correlated data (i.e. both sets of measures from the same individuals). Tests showed statistical significance far greater
than the minimum standard for the stride lengths and loading responses. Though some of the findings measured
closer to the minimum standard, it can be confirmed that based on the measurements, observations, and backed by
the anecdotal information, results fit with the claims stated:
With DynaFlange™:
I. Stability and lateral movement in all planes are controlled so there is less variability of center of
pressure when compared to movement in “Legacy” posts.
II. Energy is stored and returned more efficiently so strides are longer, more neutral in position,
and loading responses are faster, when compared to “Legacy” posts.
III. Preparation for re-supination is faster, and preparation for propulsion to the next contact is
faster, but at the same time more controlled.
IV. DynaFlange™ adds an aspect of consistency, or control, to all portions and planes of the gait cycle
as detailed above.
The timing results for increased force and pressure, only loading after the initial 25% of the gait cycle, also correspond
to where the center of pressure is shifting. Center of pressure shift to or from a pronated position is a big topic of
debate. We know that some pronation is necessary for gait to occur, especially as it is one of the main shock
absorption mechanisms of the footxv. Dorsiflexion, eversion, and abduction make up the pronation sequence, starting
at the time heel hits the ground until about mid-stance. If pronation continues later in the gait cycle then additional
forces will be placed on the mid-foot, affecting the higher kinematic chain as the rest of the body deforms to
compensate for the movement past the body’s midline. This timing and shift up until when pronation ceases is very
important in our measurements.
Results for the DynaFlange™ tests indicate that only normal pronation was encouraged. This “normal” initial
pronation after contact absorbs shockand allows the foot to be a mobile adaptor, which allows accommodation to
uneven surfaces. This accommodation also stabilizes the subsequent spacial and temporal changes. Additionally, the
main concerns with pronation are where it is occurring, and if it is equal bilaterally. Bilateral symmetry was markedly
improved for the DynaFlange™ over the “Legacy” posts.
Research and popular opinion have shown that orthotic devices are not for everyonex. Some have thought that rigid
or semi rigid foot orthotics should only be recommended in cases where foot deformities are un-capable of being
targeted at the source (mechanism of the deformity). In these cases, accommodation is desired. It seems that in all
other cases where accommodation is not ideal, and instead a responsive nature, encouraging correction at the level of
repair would suit best. We saw that in our subjects, including those with more pliable arches and flexibility, that the
DynaFlange™ improved controlled symmetry, but also improved loading responses and brought spacial placements
more towards neutral. Left and right deviations were nullified and the dynamic symmetry improved measurably.
This was true across the board for all other varieties of foot types, not only flexible flatfeet, but all tested. Results
were also maintained across left to right sides, and timing for each segment was improved in a measureable pattern
(increased or lengthened loading response, increased pre-swing, and decreased swing). This suggests that the
DynaFlange™ is stabilizing and controlling motion through the entire gait cycle, unlike other orthotics, and also
introducing use of the natural energies produced during early stance.
For further information on the data and reports compiled from the study, please contact Sally M Crawford 480-392-
4137, [email protected].
i Sobel, Ellen, et. als. Orthoses in the Treatment of Rearfoot Problems. Journal of Americal Podiatric Medical
Association. May 1999; Volume 89: Number 5. ii USPTO Jerome Dennis Segel. Application number: 12/321,355, Publication number: US 2010/0175279 A1 Filing
date: Jan 12, 2009 iii Winter, David. Biomechanics and Motor Control of Human Movement. 1930. 4th ed. p. cm iv Whittle, Michael. Gait analysis: an introduction (fourth edition). Oxford: Butterworth-Heinemann. 2007. v Smith LS, Clarke TE, Hamill CL, et al. The effects of soft and semi-rigid orthoses upon rearfoot movementin running.
JAPMA. 76: 227, 1986 vi Kernozek TW, Ricard MD. Foot placement angle and arch type: effect on rearfoot motion. Arch Phys
Med Rehabil 1990; 71: 988-91. vii Pei-Feng Chen and TsaiYen Li, “Planning Efficient Walking Gaits in Real-Time for Human Characters”,
Proceeding of Computer Graphics Workshop (CG2003),SIGGRAPH95,2003 pp.105-108. viii Dr. Stephen Gangemi, Sock Doc(2011). ix Observational Gait Analysis Handbook. (1989). Downey, CA: Professional Staff Association of Rancho Los Amigos
Medical Center. x Dr. Chris Powers, Movement Performance Institute, 2012. xi Perry, J. (1990). Pathological gait. Instructional Course Lectures, 39, 325-331. xii Gage, J.R. (1990). An overview of normal walking. Instructional Course Lectures, 39,, 291-303. xiii Nigg, Benno. The Role of Impact Forces and Foot Pronation: A new Paradigm. Clinical Journal of Sport Medicine:
January 2001 - Volume 11 - Issue 1 - pp 2-9 xiv Ochesendork DT, Mattacola CG, Arnold BL. Effect of orthotics on postural sway after fatigue of the plantar flexors
and dorsiflexors. Journal of Athletic Training 2000; 35(1): 26-30. xv Clippinger, Karen. Dance Anatomy and Kinesiology, 2007. Chapter 8 Human Kinetics.