comparison of laboratory analytical methods for uranium … · comparison of laboratory analytical...
TRANSCRIPT

WM2016 Conference, March 6 – 10, 2016, Phoenix, Arizona, USA.
1
Comparison of Laboratory Analytical Methods for Uranium Analysis Superior Steel FUSRAP Site – 16606
Natalie Watson and Scott McCabe – U.S. Army Corps of Engineers, Buffalo District
Jeffrey Lively and Nelson Walter – Amec Foster Wheeler E&I, Inc., 511 Congress Street, Suite 200, Portland, ME 04101
ABSTRACT
The Superior Steel Site processed uranium metal in support of the Atomic Energy Commission’s fuel-element development program in the 1950’s, and was
subsequently classified as a Formerly Utilized Sites Remedial Action Program (FUSRAP) Site. Previous investigations at the site identified uranium contamination
both inside and outside the buildings associated with historic uranium metalworking activities. The U.S. Army Corps of Engineers (USACE) is currently engaged in the Remedial Investigation (RI) phase in accordance with the Comprehensive
Environmental Response, Compensation, and Liability Act (CERCLA) of 1980, as amended. As part of the RI, gamma spectroscopy analysis of environmental samples
was performed on-site using a laboratory-grade, high-purity germanium (HPGe) spectrometer. The gamma spectroscopy analysis included isotopes of uranium and
their progeny. As a quality assurance measure, a subset of samples already analyzed on-site were sent to a certified, commercial, off-site laboratory for analysis using a suite of analytical methods including gamma spectroscopy, alpha spectroscopy, and
mass spectroscopy.
As an element of the quality assurance program implemented for the RI, an assessment of the correlations between the various analytical methods employed by both the on-site and off-site laboratory was performed. This assessment revealed
inconsistencies between on-site and off-site gamma spectroscopy analytical results, which raised concerns about the appropriateness and suitability of the analytical data.
To resolve the data quality concerns and better understand the source(s) of analytical results variability, the Superior Steel RI team (USACE together with its contractor, Amec Foster Wheeler) developed a quality control test whose design objective was
to control or practically eliminate sampling and sample preparation variability in order to focus more clearly on analytical variability. This paper discusses the results of this
supplemental quality control test, showing the differences in the various analytical methods (both on-site and off-site). It demonstrates in a practical and real world setting how sample preparation and analytical variability, if not controlled and
understood can impact data quality and data defensibility.

WM2016 Conference, March 6 – 10, 2016, Phoenix, Arizona, USA.
2
INTRODUCTION
The majority of samples collected from the Superior Steel Site during the execution of the RI were shown to have very low concentrations of uranium (the FUSRAP
contaminant of concern), thus challenging the detection limits of the on-site analytical methods used. While this is not an uncommon scenario for sites that have been impacted with radiological contaminants, it does present a statistical challenge for a
quality assurance program. Only a small number of samples analyzed on-site were shown to have measureable uranium concentrations that were statistically significant
and above the detection limits of the on-site laboratory gamma spectrometer. Of these, a relatively small subset (up to 5%) were subjected to analysis at the off-site laboratory by multiple analytical methods. For off-site laboratory analysis, different
aliquots from a common sample were used for each analytical method which, is largely unavoidable as some analytical methods “consume” the aliquot of sample in
the process. Initial reviews of the correlations between datasets generated by different methods
showed inconsistent relationships among analytical methods whether between various off-site laboratory methods or between on-site laboratory and off-site
laboratory methods. The initial impulse was to question the verity and quality of the data produced by the on-site laboratory’s gamma spectroscopy analyses. However,
off-site laboratory inter-method variances observed suggested something more than the analytical quality of the on-site laboratory’s gamma spectroscopy analysis method must have been responsible for the inconsistent relationships observed.
A number of tests were performed in the on-site laboratory to assess the
measurement quality of the gamma spectrometer, including a complete recalibration of the system, splitting samples, and multiple assays of the same sample aliquots under a variety of conditions, among others. The results of these tests established
and confirmed that the on-site laboratory’s gamma spectrometer was consistently yielding expected results. In the light of these results, the Superior Steel RI team
developed a quality control test whose design objective was to control or practically eliminate sampling and sample preparation variability in order to focus more clearly on analytical variability and whose end objective was to resolve the data quality
concerns and better understand the source(s) of analytical variability observed.
The information below describes the supplemental quality control test that was designed by the RI Team to uncover the source(s) of analytical variance and assess the data quality of the on-site gamma spectroscopy laboratory in relationship to the
variety of analytical methods employed at the off-site commercial laboratory. The test and its evaluation were also used to assess the effects of the differences on the
confidence in and defensibility of the data that will be used in the RI Report.

WM2016 Conference, March 6 – 10, 2016, Phoenix, Arizona, USA.
3
SUPPLEMENTAL ANALYTICAL QUALITY CONTROL TEST PROCEDURE
As described above, the supplemental analytical quality control test was designed to overcome two potential sources of error and uncertainty that could have been
impacting measures of comparability between analytical methods.
a. Many of the samples for which there were multiple results from different
analytical methods that could be compared with one another originated from samples with very little radioactivity, often below the analytical method
detection limit. The scenario invariably leads to poor comparability when performing pairwise statistical analysis such as correlation testing.
b. The aliquots apportioned for use in the various analytical methods were taken from a field-blended sample. The field blending procedure used was to mix
soil/solids samples in a stainless steel bowl and place in sample jars in accordance with the Quality Assurance Project Plan (QAPP) (
c. Figure 1: Standard Field Sample Process
d. ). However, the typical field blending procedure cannot be expected to thoroughly homogenize every soil or solid media sample collected due to limits
of sample preparation methods available on-site. If considerable heterogeneity is present in the field sample, it is likely that this heterogeneity
will manifest itself in the analytical results as well.

WM2016 Conference, March 6 – 10, 2016, Phoenix, Arizona, USA.
4
Isolate Field Sample
On-Site Gamma Spec
Off-Site Gamma Spec
Off-Site Alpha Spec
Off-Site Mass Spec
Dry Dry Sample Prep
Sample Prep
Analyze Analyze Analyze Analyze
Blend Field Sample`
Split Sample into Aliquots
Prep Sample for Analysis
Analyze Samples
Figure 1: Standard Field Sample Process Sample Selection
The test was designed as a one-time supplement to the already approved data quality
assessment program. A suite of 18 samples (
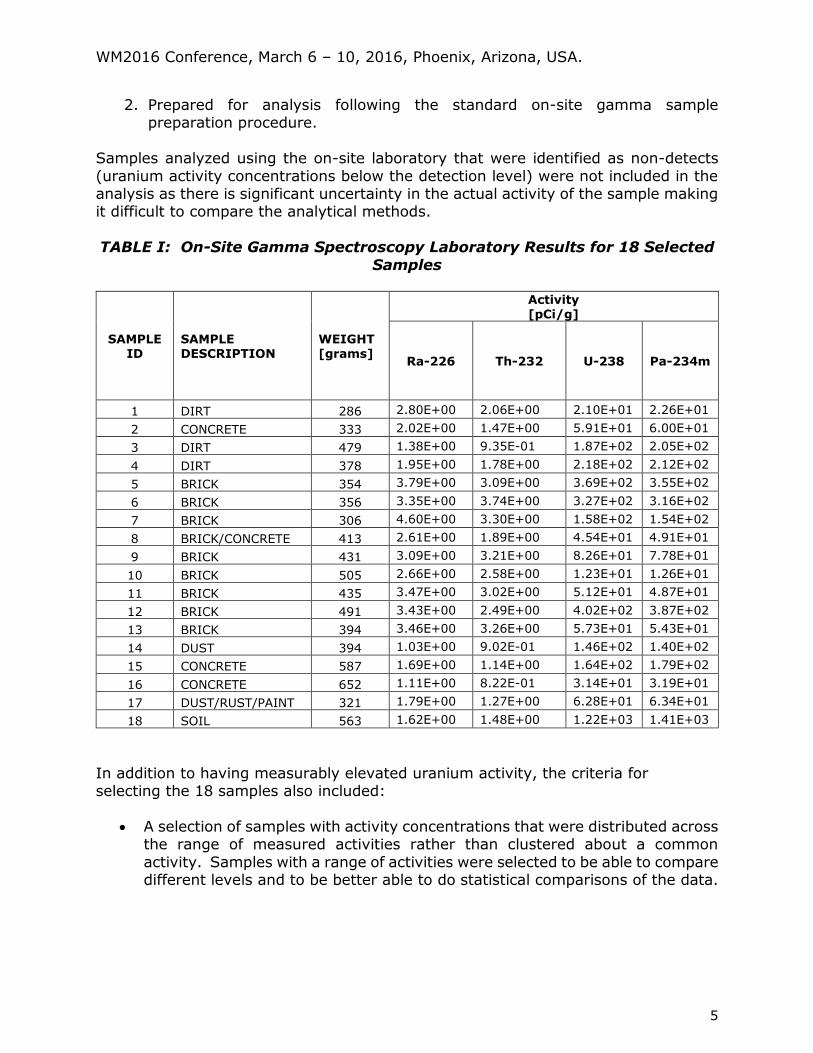
TABLE I: On-Site Gamma Spectroscopy Laboratory Results for 18 Selected Samples
) were selected from among candidate samples. A candidate sample is defined as a media sample having measurable uranium activity that was:
1. Statistically distinguishable from background as indicated by gamma
spectroscopy using the on-site laboratory, and
WM2016 Conference, March 6 – 10, 2016, Phoenix, Arizona, USA.
5
2. Prepared for analysis following the standard on-site gamma sample preparation procedure.
Samples analyzed using the on-site laboratory that were identified as non-detects
(uranium activity concentrations below the detection level) were not included in the analysis as there is significant uncertainty in the actual activity of the sample making it difficult to compare the analytical methods.
TABLE I: On-Site Gamma Spectroscopy Laboratory Results for 18 Selected
Samples
SAMPLE ID
SAMPLE DESCRIPTION
WEIGHT [grams]
Activity [pCi/g]
Ra-226 Th-232 U-238 Pa-234m
1 DIRT 286 2.80E+00 2.06E+00 2.10E+01 2.26E+01
2 CONCRETE 333 2.02E+00 1.47E+00 5.91E+01 6.00E+01
3 DIRT 479 1.38E+00 9.35E-01 1.87E+02 2.05E+02
4 DIRT 378 1.95E+00 1.78E+00 2.18E+02 2.12E+02
5 BRICK 354 3.79E+00 3.09E+00 3.69E+02 3.55E+02
6 BRICK 356 3.35E+00 3.74E+00 3.27E+02 3.16E+02
7 BRICK 306 4.60E+00 3.30E+00 1.58E+02 1.54E+02
8 BRICK/CONCRETE 413 2.61E+00 1.89E+00 4.54E+01 4.91E+01
9 BRICK 431 3.09E+00 3.21E+00 8.26E+01 7.78E+01
10 BRICK 505 2.66E+00 2.58E+00 1.23E+01 1.26E+01
11 BRICK 435 3.47E+00 3.02E+00 5.12E+01 4.87E+01
12 BRICK 491 3.43E+00 2.49E+00 4.02E+02 3.87E+02
13 BRICK 394 3.46E+00 3.26E+00 5.73E+01 5.43E+01
14 DUST 394 1.03E+00 9.02E-01 1.46E+02 1.40E+02
15 CONCRETE 587 1.69E+00 1.14E+00 1.64E+02 1.79E+02
16 CONCRETE 652 1.11E+00 8.22E-01 3.14E+01 3.19E+01
17 DUST/RUST/PAINT 321 1.79E+00 1.27E+00 6.28E+01 6.34E+01
18 SOIL 563 1.62E+00 1.48E+00 1.22E+03 1.41E+03
In addition to having measurably elevated uranium activity, the criteria for selecting the 18 samples also included:
A selection of samples with activity concentrations that were distributed across the range of measured activities rather than clustered about a common
activity. Samples with a range of activities were selected to be able to compare different levels and to be better able to do statistical comparisons of the data.

WM2016 Conference, March 6 – 10, 2016, Phoenix, Arizona, USA.
6
Preliminary indication of a good degree of existing homogeneity for uranium activity. Samples with comparable Th-234 and Pa-234m activities were
selected, as they are indicative of more homogenous samples, which reduced the chance for variability in the analytical test results due to a lack of
homogeneity (sampling variance). In a gamma spectroscopy analysis of uranium-238 (U-238), the ratio of thorium-234 (Th-234) vs. protactinium-234m (Pa-234m) in the same sample volume is a reasonable predictor of
U-238 homogeneity. This is due to the marked difference in the primary photon energies of these two radioactive progeny of U-238. Based upon the
age of the U-238, it is known that the Th-234 and Pa-234m are in secular equilibrium. A properly calibrated gamma spectrometer measuring a completely homogenous sample will report equivalent concentrations.
Conversely, U-238 heterogeneity within the sample can readily lead to a shift in the ratio of reported Th-234 and Pa-234m activities.
Sample Processing
To further reduce the potential for analytical variability due to sample heterogeneity, and measurement geometry, a supplemental sample processing
workflow was created for the 18 selected samples. The sample processing workflow for this supplemental quality assurance test is graphically represented in
Error! Reference source not found.. In summary, the sample processing workflow proceeded as follows:
1. The 18 selected samples were analyzed using the on-site laboratory’s gamma spectroscopy system using the QAPP analytical method and preparation
procedures (in the standard “pint jar” geometry). The results were tabulated for subsequent evaluation and comparison. This processes reflects the baseline analytical approach and method to which each sample collected during
the RI program was subjected.
2. The 18 selected samples were then shipped to the off-site commercially contracted laboratory for preparation and analysis by gamma spectroscopy. The off-site sample preparation process included drying, thorough grinding,
and blending. The prepared sample was then packaged into the off-site laboratory’s standard “tuna can” geometry for solid media samples subject to
gamma spectroscopy analysis (~215 cm3).
3. The off-site laboratory analyzed the sample by high purity gamma
spectroscopy. The results were tabulated for subsequent evaluation and comparison. This process reflected the preparation procedure and analytical
method used by the off-site laboratory to assay each sample it was provided during the RI program. The important difference is that the off-site laboratory would now be able to analyze the same aliquot of solid media that the on-site
laboratory had measured.

WM2016 Conference, March 6 – 10, 2016, Phoenix, Arizona, USA.
7
Figure 2: Supplemental Sample Process Workflow
4. The off-site laboratory then returned the gamma spec sample to the on-site laboratory in the same tuna can in which it had been prepared and without any
further disturbance or manipulation of the sample.
`
PINT GeometryAnalyze On-SiteGamma
Spec
Ship to Off-Site Lab
Off-Site Alpha Spec
Off-Site Mass Spec
Analyze: Off-Site Gamma
SpecAnalyze: Off-site
Alpha Spec
Analyze: Off-Site
Mass Spec
Sample Prep
Sample Prep
Ship to On-Site Lab
TUNA CAN Geometry
Analyze On-SiteGamma
Spec
Analyze On-SiteGamma
Spec
Ship back to Off-Site Lab
Drying
Grinding
Blending
TUNA CANGeometry
Blending

WM2016 Conference, March 6 – 10, 2016, Phoenix, Arizona, USA.
8
5. Upon receipt of the sample and without opening or further preparing the sample, the on-site laboratory then reanalyzed the off-site laboratory prepared
sample aliquot in the “tuna can” geometry by gamma spectroscopy using the on-site laboratory’s HPGe system. As a further assessment of the potential for
in sample heterogeneity to impact analytical variability, the on-site laboratory analyzed the off-site laboratory prepared sample aliquot in two configurations-right side up (TUNA “A”) and upside down (TUNA “B”). The
results were tabulated for subsequent evaluation and comparison. This step was conceived to provide data that could be most directly compared in order
to evaluate intra-sample homogeneity/heterogeneity.
6. The on-site laboratory then returned the gamma spec sample to the off-site
laboratory in the same “tuna can” in which it was originally prepared.
7. Upon receipt, the off-site laboratory opened the tuna can and subsampled the gamma spectroscopy aliquot to produce two sub-aliquots for further analysis using alpha spectroscopy, and inductively coupled plasma mass spectroscopy
(ICP/MS). This process reflects the baseline analytical approach used by the off-site laboratory to assay samples designated for alpha-spectroscopy and
ICP/MS. The off-site laboratory was now subsampling and measuring solids partitioned from the same sample aliquot that had been thoroughly dried,
ground, and blended, and which had previously been subjected to gamma spectroscopy analysis by both the on-site and off-site laboratories.
8. The off-site lab processed and prepared the samples for analysis by alpha spectroscopy and ICP/MS using their standard analytical methods and
preparation procedures. The analytical results were tabulated for subsequent evaluation and comparison. This process reflects the baseline analytical method used by the off-site laboratory to assay samples it was provided for
alpha-spectroscopy and ICP/MS analysis during the RI.
Resulting Data Sets The supplemental analytical quality control test generated a considerable amount of
data that could now be used to directly compare and assess the analytical quality of the measurement processes independent of the other factors that were evidently
contributing to the overall analytical variance. A total of six data subsets were generated:
1. On-site, G-Spec, PINT
2. Off-site, G-Spec, TUNA
3. On-site, G-Spec, TUNA “A”
4. On-site, G-Spec, TUNA “B”
5. Off-site, A-Spec
6. Off site, ICP/MS

WM2016 Conference, March 6 – 10, 2016, Phoenix, Arizona, USA.
9
Intermediate Assessment of Homogeneity
The on-site, G-Spec, TUNA “A” and TUNA “B” data subsets are not unique, independent data sets. They were analyzed to provide an intermediate assessment
of the degree of intra-sample homogeneity/heterogeneity. Therefore, the first evaluation performed on the data subsets generated by the supplemental analytical quality control test was a correlation assessment of the two data subsets collected
from the same samples measured in opposite orientations (identified as TUNA “A” and TUNA “B”), as shown on Error! Reference source not found..
Figure 3: Assessment of Correlation between Samples Measured in Two Orientations
The assessment of correlation between the TUNA “A” and TUNA “B” data subsets shows a strong correlation (R2 = 0.9894) and a slope near unity (y=1.0988x). The
presence of a discernable slope coupled with a very strong coefficient of determination indicates a slight but tolerable bias in the measured values taken from the same sample, measured with the same detection system, but in opposite
orientations. This result suggests that there is a small degree heterogeneity present in the sample despite the efforts to eliminate its influence on analytical variability.
In view of the fact that the TUNA “A” and TUNA “B” data subsets are not unique,
independent data sets, the RI Team determined that it was appropriate to create a single independent data subset for subsequent evaluations of the analytical data sets. The single independent data set was created by calculating the arithmetic mean

WM2016 Conference, March 6 – 10, 2016, Phoenix, Arizona, USA.
10
(TUNA “Mean”) of the TUNA “A” and TUNA “B” data subsets (Error! Reference source not found.).
TABLE II On-Site Laboratory, G-Spec Analysis [pCi/g U-238]
Sample ID TUNA "A" TUNA "B" TUNA
"Mean"
1 20 19 20
2 29 22 25
3 103 90 96
4 177 163 170
5 274 209 242
6 197 98 147
7 100 61 81
8 45 20 32
9 69 40 54
10 13 5 9
11 63 39 51
12 284 220 252
13 37 13 25
14 172 145 159
15 140 136 138
16 33 15 24
17 38 41 40
18 1310 1217 1263

WM2016 Conference, March 6 – 10, 2016, Phoenix, Arizona, USA.
11
Compiled Data Set
Next, each of the data subsets generated by the supplemental analytical quality control test were compiled and assembled to facilitate inter-comparative analyses
and evaluations (TABLE ).
TABLE III: Compiled Data Subsets from the Supplemental Analytical
Quality Control Test
Data Subsets O
n-s
ite L
ab
G-S
pec
PIN
T
On
-sit
e L
ab
G-S
pec
TU
NA
"M
ean
"
Off
-sit
e L
ab
G-S
pec
TU
NA
Off
-sit
e L
ab
A-S
pec
Off
-sit
e L
ab
IC
P/
MS
Sample ID Number U-238 [pCi/g]
1 21 20 14 18 16
2 59 25 20 42 44
3 187 96 61 120 127
4 218 170 115 130 141
5 369 242 164 435 369
6 327 147 115 352 369
7 158 81 66 136 137
8 45 32 33 43 67
9 83 54 50 119 121
10 12 9 10 17 14
11 51 51 40 87 111
12 402 252 145 443 503
13 57 25 23 136 121
14 146 159 117 156 111
15 164 138 101 163 164
16 31 24 22 31 28
17 63 40 26 32 37
18 1218 1263 794 1420 1240

WM2016 Conference, March 6 – 10, 2016, Phoenix, Arizona, USA.
12
RESULTS: CORRELATION ANALYSIS BETWEEN DATA SUBSETS
Comparison of Pint & Tuna Can Geometries
The first comparison performed was between the two measures of U-238 made with the on-site laboratory (i.e., On-site Lab, G-Spec, PINT and On-site Lab, G-Spec, TUNA “Mean”) using the same HPGe gamma spectrometer (Error! Reference source not
found.). There was a reasonably good correlation between these two data subsets (R2 = 0.9417) and a slope near unity (y = 0.9219x) indicating reasonably good
comparability between the two measures of U-238 radioactivity.
Figure 4: Comparison of On-site, PINT vs. TUNA “Mean”
Comparison of On-site vs. Off-site Gamma Spectroscopy Results
There are two data subsets collected by gamma spectroscopy analysis of the samples at the on-site laboratory (On-site Lab, G-Spec, PINT and On-site Lab, G-Spec, TUNA “Mean”). As a result, two separate comparisons can be made when evaluating the
results of the on-site and off-site results as measured with the gamma spectroscopy method.
y = 0.9219xR² = 0.9417
0
200
400
600
800
1000
1200
1400
0 200 400 600 800 1000 1200 1400
On
-Sit
e L
ab, G
-Sp
ec, T
UN
A "
Mea
n"
U-2
38
(p
Ci/
g)
U-238 (pCi/g)On-Site Lab , G-Spec, PINT
On-Site Lab PINT vs. On-Site Lab TUNA "Mean"

WM2016 Conference, March 6 – 10, 2016, Phoenix, Arizona, USA.
13
On-site, G-Spec, PINT vs. Off-site, G-Spec TUNA
The data subset corresponding to the initial measure of U-238 by gamma spectroscopy in the pint jar geometry (at the on-site laboratory) was compared with
the off-site laboratories measure of U-238 by gamma spectroscopy (Error! Reference source not found.).
Figure 5: Comparison of On-site Lab, G-Spec, PINT vs. Off-site Lab, G-Spec TUNA
There was a reasonably good correlation between these two data subsets (R2 =
0.9482). However, the correlation analysis revealed a slope with a relatively large departure from unity (y = 0.5885x) indicating a systemic bias between the two measures of U-238 radioactivity with the off-site commercial laboratory typically
reporting values approximately 40% lower than those reported by the on-site laboratory’s standard gamma spectroscopy analytical method and preparation
procedure. On-site, G-Spec, TUNA vs. Off-site, G-Spec, TUNA
The data subset corresponding to the measure of U-238 by gamma spectroscopy in
the tuna can geometry at the on-site laboratory (On-site Lab, G-Spec, TUNA “Mean”) was compared with the off-site laboratories measure of U-238 by gamma spectroscopy in the tuna can geometry (Off-site Lab, G-Spec) (Error! Reference
source not found.). Recall that these two analyses measured the same aliquot of solid media in the same geometry, and in the same container.
y = 0.5885xR² = 0.9482
0
100
200
300
400
500
600
700
800
900
0 200 400 600 800 1000 1200 1400
Off
-Sit
e La
b, G
-Sp
ecU
-23
8 (
pC
i/g)
U-238 (pCi/g)On-Site Lab , G-Spec, PINT
On-Site G-Spec (PINT) vs. Off-Site G-Spec

WM2016 Conference, March 6 – 10, 2016, Phoenix, Arizona, USA.
14
As expected, the correlation between these two data subsets (R2 = 0.996) is excellent
suggesting that random statistical variance (associated with low activity samples) and sampling variance (due to sample heterogeneity) have been sufficiently
controlled for this test. However, the correlation analysis again revealed a slope with a relatively large departure from unity (y = 0.6353x) indicating a systemic bias between the two measures of U-238 radioactivity with the off-site commercial
laboratory typically reporting values approximately 35% lower than those reported by the on-site laboratory’s standard gamma spectroscopy analytical method and
preparation procedure.
Figure 6: Comparison of On-site Lab, G-Spec, TUNA vs. Off-site Lab,
G-Spec TUNA
The question then is: “Which of the two gamma spectroscopy analyses — on-site or off-site — is producing the most reliable and representative estimates of U-238 activity in solid media samples?”
Comparison of Off-site Laboratory Analytical Methods’ Results
To explore the answer to that question, a series of comparisons were next made
between the each of the analyses performed by the off-site laboratory by gamma spectroscopy, alpha spectroscopy, and ICP/MS methods using their respective data subsets.
y = 0.6353xR² = 0.996
0
100
200
300
400
500
600
700
800
900
0 200 400 600 800 1000 1200 1400
Off
-Sit
e La
b, G
-Sp
ecU
-23
8 (
pC
i/g)
U-238 (pCi/g)On-Site Lab , G-Spec, TUNA "Mean"
On-Site G-Spec (TUNA) vs. Off-Site G-Spec

WM2016 Conference, March 6 – 10, 2016, Phoenix, Arizona, USA.
15
Off-site, ICP/MS vs. Off-site, A-Spec
The data subset corresponding to the measure of U-238 by ICP/MS (Off-site Lab, ICP/MS) was compared with the measure of U-238 by alpha spectroscopy (Off-site
Lab, A-Spec) (Error! Reference source not found.). Recall that these two analyses measured distinct sub-aliquots, both taken from the “tuna can” used to perform the onsite and off-site gamma spectroscopy analyses.
The correlation between these two data subsets (R2 = 0.9869) is also excellent, again
suggesting that random statistical variance and sampling variance have been sufficiently controlled for this test. The slope of the best-fit line (y = 1.0961x) is near unity indicating no appreciable systemic differences between these two measures of
U-238 radioactivity. In other words, one could reasonably expect very comparable results from these two methods.
Figure 7: Comparison of Off-site Lab, ICP/MS vs. Off-site Lab, A-Spec
Off-site, ICP/MS vs. Off-site, G-Spec, TUNA
The data subset corresponding to the measure of U-238 by ICP/MS (Off-site Lab,
ICP/MS) was next compared with the off-site laboratory’s measure of U-238 by gamma spectroscopy (Off-site Lab, G-Spec) (Error! Reference source not found.).
y = 1.0961xR² = 0.9869
0
200
400
600
800
1000
1200
1400
1600
0 200 400 600 800 1000 1200 1400
Off
-Sit
e L
ab,
A-S
pec
(pC
i/g)
U-238 (pCi/g)Off-site Lab, ICP/MS
Off-Site Lab ICP/MS vs. Off-Site Lab A-Spec

WM2016 Conference, March 6 – 10, 2016, Phoenix, Arizona, USA.
16
There was a reasonably good correlation between these two data subsets (R2 = 0.9144). However, the correlation analysis revealed a slope with a relatively large
departure from unity (y = 0.5626x) indicating a systemic bias between the two measures of U-238 radioactivity with the off-site commercial laboratory typically
reporting values generated by their gamma spectroscopy method approximately 40% lower than those reported by the ICP/MS method.
Figure 7: Comparison of Off-site Lab, ICP/MS vs. Off-site Lab,
G-Spec TUNA
Off-site, A-Spec vs. Off-site, G-Spec, TUNA The data subset corresponding to the measure of U-238 by alpha spectroscopy (Off-
site Lab, A-Spec) was next compared with the off-site laboratory’s measure of U-238 by gamma spectroscopy (Off-site Lab, G-Spec) (Error! Reference source not
found.). As expected, the pattern of correlation for these two data subsets mirrors that
observed when comparing the off-site laboratory’s ICP/MS and gamma spectroscopy data subsets. There was good correlation (R2 = 0.953). However, the slope of the
best-fit line again reveals a relatively large departure from unity (y = 0.5186x) indicating a systemic bias between the two measures of U-238 radioactivity with the off-site commercial laboratory typically reporting values generated by their gamma
y = 0.5626xR² = 0.9144
0
200
400
600
800
1000
1200
0 200 400 600 800 1000 1200 1400
Off
-Sit
e L
ab,
G-S
pec
(pC
i/g)
U-238 (pCi/g)Off-site Lab, ICP/MS
Off-Site Lab ICP/MS vs. Off-Site Lab G-Spec

WM2016 Conference, March 6 – 10, 2016, Phoenix, Arizona, USA.
17
spectroscopy method nearly 50% lower than those reported by the alpha spectroscopy method.
Figure 8: Comparison of Off-site Lab, A-Spec vs. Off-site Lab, G-Spec TUNA
In consideration of the foregoing analyses, it is clear that the data generated by off-site laboratory using their gamma spectroscopy method was consistently indicating lower concentrations of uranium activity than other analytical methods employed in
the RI program.
The next question would then be: “How well does the data generated by gamma spectroscopy analyses at the on-site laboratory compare with measures of U-238 activity in solid media samples by means of alpha spectroscopy and ICP/MS?”
Comparison of On-site, G-Spec with Off-site, A-Spec, and ICP/MS Methods
Because there are two gamma spectroscopy data subsets generated by the on-site laboratory, a series of four comparisons were made.
On-site, G-Spec, TUNA vs. Off-site, ICP/MS
The data subset corresponding to the measure of U-238 by ICP/MS (Off-site Lab, ICP/MS) was next compared with the on-site laboratory’s measure of U-238 by
y = 0.5186xR² = 0.953
0
200
400
600
800
1000
1200
0 200 400 600 800 1000 1200 1400 1600
Off
-Sit
e L
ab,
G-S
pec
(pC
i/g)
U-238 (pCi/g)Off-site Lab, A-Spec
Off-Site Lab A-Spec vs. Off-Site Lab G-Spec

WM2016 Conference, March 6 – 10, 2016, Phoenix, Arizona, USA.
18
gamma spectroscopy with the sample in the tuna can geometry (On-site Lab, G-Spec, TUNA “Mean (Error! Reference source not found.).
Figure 9: Comparison of On-site Lab, G-Spec, TUNA vs. Off-site Lab,
ICP/MS The correlation between these two data subsets (R2 = 0.8965) is reasonably good.
The slope of the best-fit line (y = 1.0575x) is near unity indicating no appreciable systemic differences between these two measures of U-238 radioactivity. In other
words, one could reasonably expect very comparable results from these two methods, provided that variables other than those associated directly with analytical method are controlled. This finding is important in that it provides evidence that two
different analytical methodologies from two different laboratories are yielding comparable results.
On-site, G-Spec, TUNA vs. Off-site, A-Spec
The data subset corresponding to the measure of U-238 by alpha spectroscopy (Off-site Lab, A-Spec) was next compared with the on-site laboratory’s measure of
U-238 by gamma spectroscopy with the sample in the tuna can geometry (On-site Lab, G-Spec, TUNA “Mean”) (Error! Reference source not found.).
y = 1.0575xR² = 0.8965
0
200
400
600
800
1000
1200
1400
1600
0 200 400 600 800 1000 1200 1400
Off
-Sit
e L
ab, I
CP
/MS
U-2
38
(p
Ci/
g)
U-238 (pCi/g)On-Site Lab , G-Spec, TUNA "Mean"
On-Site Lab TUNA "Mean" vs. Off-Site Lab, ICP/MS

WM2016 Conference, March 6 – 10, 2016, Phoenix, Arizona, USA.
19
Figure 10: Comparison of On-site Lab, G-Spec, TUNA vs. Off-site Lab, A-Spec
The correlation between these two data subsets is very good (R2 = 0.9436) is very good. However, the slope of the best-fit line (y = 1.1822x) suggests an
approximately 15% systemic difference between these two measures of U-238 radioactivity, with U-238 by alpha spectroscopy likely being reported approximately 15% higher than by gamma spectroscopy. It is noteworthy to consider that a
significant portion of the ~15% systemic bias in the alpha spectroscopy results shown here is also present in the comparison of the ICP/MS and alpha spectroscopy results
as described in Section 3.3.1 (Error! Reference source not found.). On-site, G-Spec, PINT vs. Off-site, ICP/MS
The data subset corresponding to the measure of U-238 by ICP/MS (Off-site Lab,
ICP/MS)was next compared with the on-site laboratory’s measure of U-238 by gamma spectroscopy with the sample in the pint jar geometry (On-site Lab, G-Spec, PINT) (Error! Reference source not found.). Recall that this is the standard
analytical methodology and preparation procedure used by the on-site laboratory and is the analytical method by which the U-238 activity concentration in all volumetric
solid media samples collected in the RI program was measured.
y = 1.1822xR² = 0.9436
0
200
400
600
800
1000
1200
1400
1600
0 200 400 600 800 1000 1200 1400
Off
-Sit
e L
ab, A
-Sp
ecU
-23
8 (
pC
i/g)
U-238 (pCi/g)On-Site Lab , G-Spec, TUNA "Mean"
On-Site Lab TUNA "Mean" vs. Off-Site Lab, A- Spec

WM2016 Conference, March 6 – 10, 2016, Phoenix, Arizona, USA.
20
Figure 11: Comparison of On-site Lab, G-Spec, PINT vs. Off-site Lab, ICP/MS
The correlation between these two data subsets (R2 = 0.9773) is excellent. The slope of the best-fit line (y = 1.0245x) is essentially 1:1 indicating exceptional agreement
between these two measures of U-238 radioactivity with no appreciable systemic differences. In other words, one could reasonably expect very comparable results from these two methods.
On-site, G-Spec, PINT vs. Off-site, A-Spec
The data subset corresponding to the measure of U-238 by alpha spectroscopy (Off-site Lab, A-Spec) was next compared with the on-site laboratory’s measure of U-238
by gamma spectroscopy with the sample in the pint jar geometry (On-site Lab, G-Spec, PINT) (Error! Reference source not found.).
y = 1.0249xR² = 0.9773
0
200
400
600
800
1000
1200
1400
0 200 400 600 800 1000 1200 1400
Off
-Sit
e L
ab, I
CP
/MS
U-2
38
(p
Ci/
g)
U-238 (pCi/g)On-Site Lab , G-Spec, PINT
On-Site Lab, G-Spec, PINT vs. Off-Site Lab, ICP/MS

WM2016 Conference, March 6 – 10, 2016, Phoenix, Arizona, USA.
21
Figure 12: Comparison of On-site Lab, G-Spec, PINT vs. Off-site Lab, A-Spec
The correlation between these two data subsets is also very good (R2 = 0.9806). Again, as with each comparison that included alpha spectroscopy data subsets, the
slope of the best-fit line (y = 1.1294x) suggests an approximately 10% systemic difference between these two measures of U-238 radioactivity, with U-238 by alpha spectroscopy likely being reported approximately 10% higher than by gamma
spectroscopy.
y = 1.1294xR² = 0.9806
0
200
400
600
800
1000
1200
1400
1600
0 200 400 600 800 1000 1200 1400
Off
-Sit
e L
ab, A
-Sp
ecU
-23
8 (
pC
i/g)
U-238 (pCi/g)On-Site Lab , G-Spec, PINT
On-Site Lab, G-Spec, PINT vs. Off-Site Lab, Alpha-Spec

WM2016 Conference, March 6 – 10, 2016, Phoenix, Arizona, USA.
22
CONCLUSION
The supplemental quality control test was effective in assessing variables that could influence total measurement uncertainty, thereby allowing a meaningful and
revealing assessment of the verity of the various measures of radioactivity that were employed in the RI. This was crucial in that the conclusions of the RI rely strongly upon the analytical data and preliminary reports of analytical results from some
samples suggested discrepancy in uranium radioactivity concentrations between analytical methods. It became imperative to understand the source of such
discrepancies and to confirm the quality of the analytical methods used to assess uranium radioactivity concentrations in samples collected in support of the RI. Of particular concern was the verity and quality of the gamma spectroscopy method
used at the on-site laboratory, as it was the principal analytical method used to measure uranium radioactivity for solid media volumetric samples collected.
After many steps in the investigative process, it had become clear that intra-sample heterogeneity was impacting analytical results. Yet, there remained a need to verify
the intrinsic quality and accuracy of the on-site laboratory’s gamma spectroscopy results.
Conclusion Statements
1. The results from the initial on-site laboratory’s gamma spectroscopy analysis
(G-Spec, “PINT”) show very good correlation with the on-site laboratory’s
gamma spectroscopy analysis of the samples that were dried, ground, blended, and canned (G-Spec, “TUNA”) in the off-site laboratory prior to analysis. This
indicates that the standard method of preparation of the samples for gamma spectroscopy in the on-site laboratory (without grinding of the samples) does not have a significant negative impact on the accuracy of the analytical results.
2. The results from the initial on-site laboratory’s gamma spectroscopy analysis
(G-Spec, “PINT”) show very good correlation with the off-site laboratory’s alpha spectroscopy and ICP/MS analysis of the samples that were dried, ground, and blended in the off-site laboratory prior to analysis. This indicates
that the standard gamma spectroscopy analytical method used in the on-site laboratory are of very good quality and that the results can be confidently
relied upon for developing decisions and conclusions within the context of the RI.
3. The on-site laboratory’s gamma spectroscopy results compare considerably better with the off-site laboratory’s alpha spectroscopy and ICP/MS analyses
than does the off-site laboratory’s gamma spectroscopy analysis. The off-site laboratory’s gamma spectroscopy analysis is shown to have a relatively consistent, low (non-conservative) systemic bias in its measure of uranium
radioactivity for solid media volumetric samples.

WM2016 Conference, March 6 – 10, 2016, Phoenix, Arizona, USA.
23
4. The gamma spectroscopy method and preparation procedures used in the on-site laboratory produce reliable and representative measures of the U-238
activity in solid media samples collected at the Superior Steel Site and are suitable for use in the decision-making aspects of the RI.
5. Intra-sample analytical variability (between On-site lab G-Spec, Off-site lab A-Spec, and Off-site lab ICP/MS) observed in a small number of samples collected during the RI are attributable to sample heterogeneity and not a lack
quality in the analytical method and process.
6. There is a temptation to presume that the quality of an analytical method performed in a commercial, credentialed laboratory will be superior to that achieved in an on-site laboratory. However, one should not rush to judgement
or make assumptions about the verity or quality of one analytical method over another based on pedigree alone. Rather, a careful consideration of the
collective evidence should be considered.
All samples used in this supplemental correlation were “the same” as in that the same
sample material used for on-site analysis was sent to the off-site laboratory, processed, analyzed, returned, analyzed on-site, and then returned for additional off-
site analysis. The heterogeneity was minimized because the same sample material was used for all analysis instead of subdividing a sample that was hand mixed in the
field, or separately analyzing samples that were collected adjacent to one another without mixing.