comparison of empirical and kinetic modeling of the photocatalytic oxidation of cyanide
TRANSCRIPT
INTERNATIONAL JOURNAL OF CHEMICAL
REACTOR ENGINEERING
Volume 5 2007 Article A89
Comparison of Empirical and KineticModeling of the Photocatalytic Oxidation of
Cyanide
Javier Marugan∗ Rafael van Grieken†
Alberto E. Cassano‡ Orlando M. Alfano∗∗
´
´
∗ESCET, Universidad Rey Juan Carlos, [email protected]†ESCET, Universidad Rey Juan Carlos, [email protected]‡Instituto de Desarrollo Tecnologico para la Industria Quımica (INTEC), Universidad Nacional
del Litoral-CONICET, [email protected]∗∗Instituto de Desarrollo Tecnologico para la Industria Quımica (INTEC), Universidad Nacional
del Litoral-CONICET, [email protected] 1542-6580
Brought to you by | University of PennsylvaniaAuthenticated | 165.123.234.223Download Date | 5/12/14 6:04 PM
Comparison of Empirical and Kinetic Modeling ofthe Photocatalytic Oxidation of Cyanide
Javier Marugan, Rafael van Grieken, Alberto E. Cassano, and Orlando M. Alfano
Abstract
An intrinsic kinetic model based on the reaction mechanism of the photo-catalytic oxidation of cyanide with TiO2 has been developed and applied to theresults of experiments carried out using different catalyst concentrations, initialconcentrations of cyanide and incident radiation fluxes. The results of the ki-netic modeling have been compared with the use of an empirical model equationgenerated following the response surface methodology; a statistical procedure tocorrelate the influence of several factors on a response variable.
The kinetic model reproduces the experimental data with a relative error below13%, slightly lower than that obtained with the empirical model equation. Incontrast with the latter, the kinetic model is based on the intrinsic photocatalyticreaction mechanism and takes into account the radiation profiles inside the pho-toreactor. Consequently, after validating the model in a broad range of experimen-tal conditions, it could be applied to any other reactor configuration, allowing thesimulation and optimization of the radiation and reaction rate fields with scaling-up and photoreactor design purposes.
KEYWORDS: kinetic model, cyanide, photocatalytic oxidation, titanium diox-ide, response surface, factorial design
Brought to you by | University of PennsylvaniaAuthenticated | 165.123.234.223Download Date | 5/12/14 6:04 PM
1. INTRODUCTION
Heterogeneous photocatalytic processes have emerged during the last two decades as very attractive, environmentally friendly technologies for water and air treatment, especially considering the possibility of using solar light to drive the removal of pollutants. However, most of the research efforts have been devoted to the investigation of the fundamental mechanisms and/or phenomenological aspects of the photocatalytic processes, whereas fewer contributions have been developed from the photoreactor engineering viewpoint.
In contrast with thermal reactions in which isothermal conditions can be easily achieved to determine the kinetic parameters, the kinetic modeling of the photocatalytic processes with scaling-up purposes requires the evaluation of the radiation profiles inside the photoreactor, for which several approaches have been reported in the literature (Alfano et al., 1997; Ray, 1999; Zhang et al., 2003; Zalazar et al., 2005a; Bayarri et al, 2005; Li Puma and Brucato, 2007).
Cyanide species are common pollutants of effluents derived from precious metal mining, electro-plating and coal gasification processes. Traditional cyanide oxidation processes, such as alkaline chlorination, ozone or peroxide treatments, do not achieve the complete removal of metal-cyanide complexes (Young and Jordan, 1995). In contrast, the photocatalytic oxidation has shown a high efficiency in the removal not only of free cyanides (Frank and Bard, 1977; Augugliaro et al., 1997), but also of iron (Rader et al., 1993; van Grieken et al., 2005a), copper (Peral et al., 1992) and gold cyanocomplexes (van Grieken et al., 2005b).
The aim of this work is to achieve an intrinsic kinetic model of the photocatalytic oxidation of cyanide with TiO2. The obtained kinetic model should be independent of irradiation form, as well as of the reactor size and its geometrical configuration, providing the necessary information for scaling-up and designing the commercial scale photoreactors.
2. EXPERIMENTAL
2.1. Photoreactor Setup
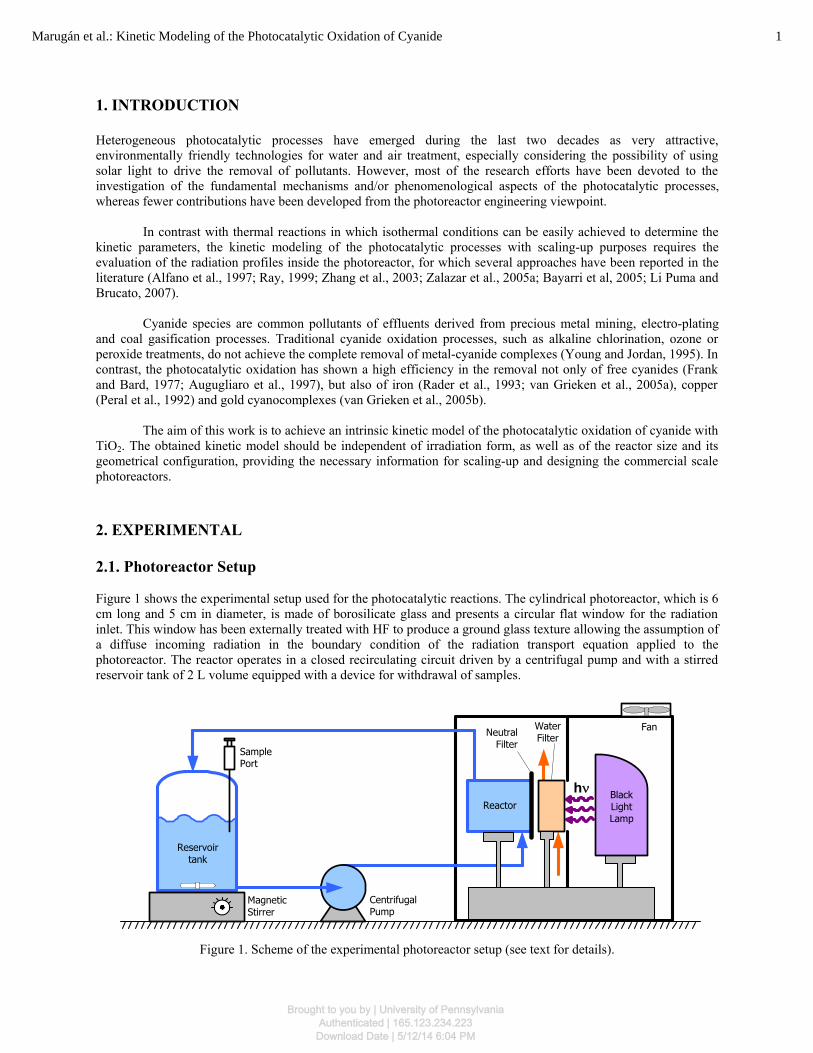
Figure 1 shows the experimental setup used for the photocatalytic reactions. The cylindrical photoreactor, which is 6 cm long and 5 cm in diameter, is made of borosilicate glass and presents a circular flat window for the radiation inlet. This window has been externally treated with HF to produce a ground glass texture allowing the assumption of a diffuse incoming radiation in the boundary condition of the radiation transport equation applied to the photoreactor. The reactor operates in a closed recirculating circuit driven by a centrifugal pump and with a stirred reservoir tank of 2 L volume equipped with a device for withdrawal of samples.
hν
Reservoirtank
MagneticStirrer
CentrifugalPump
ReactorBlackLightLamp
FanWaterNeutral FilterFilter
SamplePort
Figure 1. Scheme of the experimental photoreactor setup (see text for details).
1Marugán et al.: Kinetic Modeling of the Photocatalytic Oxidation of Cyanide
Brought to you by | University of PennsylvaniaAuthenticated | 165.123.234.223Download Date | 5/12/14 6:04 PM
The liquid flow was set above 100 cm3·s-1 to ensure a differential conversion per pass and good mixing conditions in the reactor (uniform concentration of the cyanide and catalyst). The inlet of the suspension in the photoreactor produces a turbulence that avoids mass transport limitations and sedimentation of the catalyst.
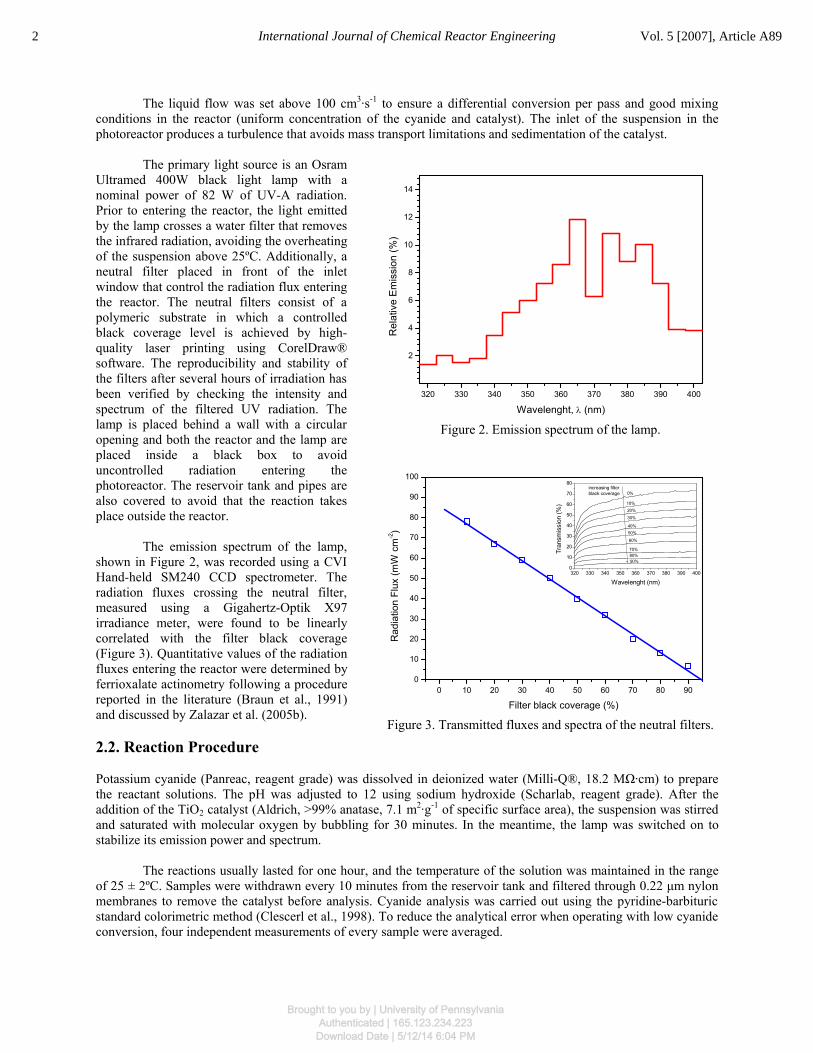
The primary light source is an Osram Ultramed 400W black light lamp with a nominal power of 82 W of UV-A radiation. Prior to entering the reactor, the light emitted by the lamp crosses a water filter that removes the infrared radiation, avoiding the overheating of the suspension above 25ºC. Additionally, a neutral filter placed in front of the inlet window that control the radiation flux entering the reactor. The neutral filters consist of a polymeric substrate in which a controlled black coverage level is achieved by high-quality laser printing using CorelDraw® software. The reproducibility and stability of the filters after several hours of irradiation has been verified by checking the intensity and spectrum of the filtered UV radiation. The lamp is placed behind a wall with a circular opening and both the reactor and the lamp are placed inside a black box to avoid uncontrolled radiation entering the photoreactor. The reservoir tank and pipes are also covered to avoid that the reaction takes place outside the reactor.
The emission spectrum of the lamp, shown in Figure 2, was recorded using a CVI Hand-held SM240 CCD spectrometer. The radiation fluxes crossing the neutral filter, measured using a Gigahertz-Optik X97 irradiance meter, were found to be linearly correlated with the filter black coverage (Figure 3). Quantitative values of the radiation fluxes entering the reactor were determined by ferrioxalate actinometry following a procedure reported in the literature (Braun et al., 1991) and discussed by Zalazar et al. (2005b).
320 330 340 350 360 370 380 390 400
2
4
6
8
10
12
14
Rel
ativ
e E
mis
sion
(%)
Wavelenght, λ (nm)
Figure 2. Emission spectrum of the lamp.
0 10 20 30 40 50 60 70 80 900
10
20
30
40
50
60
70
80
90
100
320 330 340 350 360 370 380 390 4000
10
20
30
40
50
60
70
80
Rad
iatio
n Fl
ux (m
W c
m-2)
Filter black coverage (%)
90%80%70%
60%
50%40%
30%
20%10%
0%increasing filter black coverage
Tra
nsm
issi
on (%
)
Wavelenght (nm)
Figure 3. Transmitted fluxes and spectra of the neutral filters.
2.2. Reaction Procedure
Potassium cyanide (Panreac, reagent grade) was dissolved in deionized water (Milli-Q®, 18.2 MΩ·cm) to prepare the reactant solutions. The pH was adjusted to 12 using sodium hydroxide (Scharlab, reagent grade). After the addition of the TiO2 catalyst (Aldrich, >99% anatase, 7.1 m2·g-1 of specific surface area), the suspension was stirred and saturated with molecular oxygen by bubbling for 30 minutes. In the meantime, the lamp was switched on to stabilize its emission power and spectrum.
The reactions usually lasted for one hour, and the temperature of the solution was maintained in the range of 25 ± 2ºC. Samples were withdrawn every 10 minutes from the reservoir tank and filtered through 0.22 μm nylon membranes to remove the catalyst before analysis. Cyanide analysis was carried out using the pyridine-barbituric standard colorimetric method (Clescerl et al., 1998). To reduce the analytical error when operating with low cyanide conversion, four independent measurements of every sample were averaged.
2 International Journal of Chemical Reactor Engineering Vol. 5 [2007], Article A89
Brought to you by | University of PennsylvaniaAuthenticated | 165.123.234.223Download Date | 5/12/14 6:04 PM
3. REACTION RATE
3.1. Mass Balance
Assuming that (i) the system is perfectly mixed, (ii) there are no mass transport limitations, (iii) the conversion per pass in the reactor is differential, and (iv) there are no parallel dark reactions, the cyanide mass balance could be expressed as follows (Cabrera et al., 1997):
( )RVCN
T
R
Tk
CNL r
VV
ttC
ε −
−
=d
d (1)
where Lε is the liquid hold-up ( 1≈Lε ); −CN
C is the molar concentration of cyanide; t denotes reaction time; Tk,
R and T subindexes refer to the tank, reactor and total, respectively; and RVCN
r − is the cyanide oxidation rate
averaged over the reactor volume.
3.2. Kinetic Model
The kinetic model proposed for the photocatalytic degradation of cyanide in aqueous solution is based on the reaction sequence reported by Chiang et al. (2003). Table 1 summarizes the main reaction steps which contribute to the overall degradation of cyanide on the surface of TiO2 photocatalyst under near ultraviolet polychromatic radiation. The derivation of the cyanide photooxidation rate expression is based on the following assumptions:
i. Photocatalytic reactions occur at the catalyst surface among adsorbed species. ii. The kinetic steady state approximation is applied for unstable reaction intermediates such as radicals
and semiconductor holes (Turchi and Ollis, 1990). iii. Concentration of electrons (e-) and holes (h+) can be assumed equal (Turchi and Ollis, 1990). iv. The rate of electron-hole generation is proportional to the local volumetric rate of photon absorption
(ea) (Alfano et al., 1997). v. Cyanide is oxidized by the surface trapped holes (≡TiO ) (Chiang et al., 2003). vi. The concentrations of water and hydroxyl ions on the catalytic surface are almost constant. vii. Equilibrium conditions are achieved between the bulk and the adsorbed concentrations of cyanide. viii. Negligible concentration of intermediate products is postulated (initial reaction rate hypothesis). ix. A non-competitive adsorption of oxygen on the catalyst surface sites is considered (Turchi and Ollis,
1990). x. Oxygen concentration is constant and in excess with respect to the stoichiometric demand.
On the basis of these assumptions, the following reaction rate expression can be derived:
⎟⎟⎠
⎞⎜⎜⎝
⎛++−
+−=
−
−
−
catg
a
CN
CNcatgCN CS
eC
CCSr 2
3
1 111
αα
α (2)
where rCN- is the cyanide photooxidation rate, Sg the catalyst specific surface area, Ccat the catalyst mass concentration, CCN- the cyanide molar concentration, ea the local volumetric rate of photon absorption (LVRPA), and αi (i = 1 to 3) are kinetic parameters.
3Marugán et al.: Kinetic Modeling of the Photocatalytic Oxidation of Cyanide
Brought to you by | University of PennsylvaniaAuthenticated | 165.123.234.223Download Date | 5/12/14 6:04 PM
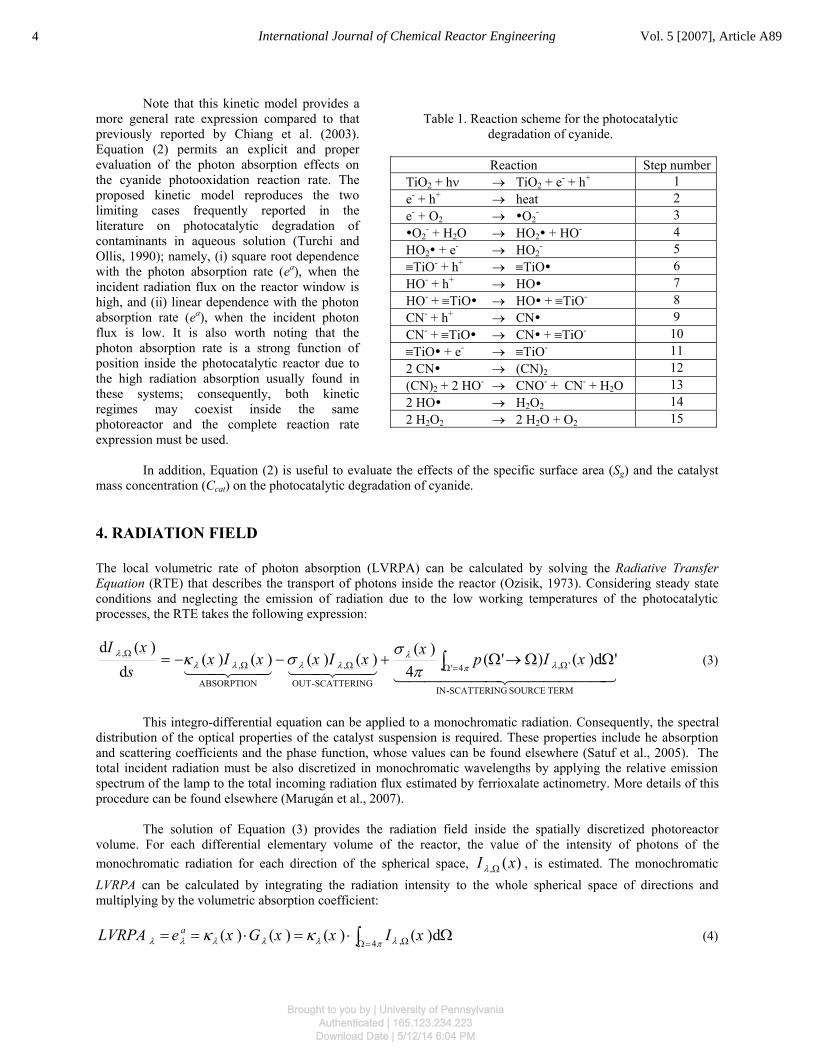
Note that this kinetic model provides a more general rate expression compared to that previously reported by Chiang et al. (2003). Equation (2) permits an explicit and proper evaluation of the photon absorption effects on the cyanide photooxidation reaction rate. The proposed kinetic model reproduces the two limiting cases frequently reported in the literature on photocatalytic degradation of contaminants in aqueous solution (Turchi and Ollis, 1990); namely, (i) square root dependence with the photon absorption rate (ea), when the incident radiation flux on the reactor window is high, and (ii) linear dependence with the photon absorption rate (ea), when the incident photon flux is low. It is also worth noting that the photon absorption rate is a strong function of position inside the photocatalytic reactor due to the high radiation absorption usually found in these systems; consequently, both kinetic regimes may coexist inside the same photoreactor and the complete reaction rate expression must be used.
Table 1. Reaction scheme for the photocatalytic degradation of cyanide.
Reaction Step numberTiO2 + hν → TiO2 + e- + h+ 1 e- + h+ → heat 2 e- + O2 → O2
- 3 O2
- + H2O → HO2 + HO- 4 HO2 + e- → HO2
- 5 ≡TiO- + h+ → ≡TiO 6 HO- + h+ → HO 7 HO- + ≡TiO → HO + ≡TiO- 8 CN- + h+ → CN 9 CN- + ≡TiO → CN + ≡TiO- 10 ≡TiO + e- → ≡TiO- 11 2 CN → (CN)2
12 (CN)2 + 2 HO- → CNO- + CN- + H2O 13 2 HO → H2O2 14 2 H2O2 → 2 H2O + O2
15
In addition, Equation (2) is useful to evaluate the effects of the specific surface area (Sg) and the catalyst mass concentration (Ccat) on the photocatalytic degradation of cyanide.
4. RADIATION FIELD
The local volumetric rate of photon absorption (LVRPA) can be calculated by solving the Radiative Transfer Equation (RTE) that describes the transport of photons inside the reactor (Ozisik, 1973). Considering steady state conditions and neglecting the emission of radiation due to the low working temperatures of the photocatalytic processes, the RTE takes the following expression:
444444 3444444 2144 344 214434421TERMSOURCESCATTERING-IN
',4'
SCATTERING-OUT
,
ABSORPTION
,, 'd)()'(
4)(
)()()()(d
)(dΩΩ→Ω+−−= Ω=ΩΩΩ
Ω∫ xIp
xxIxxIx
sxI
λπλ
λλλλλ
πσ
σκ (3)
This integro-differential equation can be applied to a monochromatic radiation. Consequently, the spectral distribution of the optical properties of the catalyst suspension is required. These properties include he absorption and scattering coefficients and the phase function, whose values can be found elsewhere (Satuf et al., 2005). The total incident radiation must be also discretized in monochromatic wavelengths by applying the relative emission spectrum of the lamp to the total incoming radiation flux estimated by ferrioxalate actinometry. More details of this procedure can be found elsewhere (Marugán et al., 2007).
The solution of Equation (3) provides the radiation field inside the spatially discretized photoreactor volume. For each differential elementary volume of the reactor, the value of the intensity of photons of the monochromatic radiation for each direction of the spherical space, )(, xI Ωλ , is estimated. The monochromatic LVRPA can be calculated by integrating the radiation intensity to the whole spherical space of directions and multiplying by the volumetric absorption coefficient:
∫ =Ω Ω Ω⋅=⋅==π λλλλλλ κκ
4 , d)()()()( xIxxGxeLVRPA a (4)
4 International Journal of Chemical Reactor Engineering Vol. 5 [2007], Article A89
Brought to you by | University of PennsylvaniaAuthenticated | 165.123.234.223Download Date | 5/12/14 6:04 PM
The polychromatic local volumetric rate of photon absorption, which is the magnitude that appears in the expression of the kinetic model, Equation (2), represents the activation step of the photocatalytic reaction mechanism, and it can be calculated by integration of the LVRPA into the whole wavelength range from 320 to 400 nm, delimited by the overlapping between the lamp emission and the catalysts absorption spectra:
∫ ∫∫∫ =Ω Ω Ω⋅=⋅=== 2
1
2
1
2
1d d )()(d )()(d
4 ,λ
λ π λλλ
λ λλλ
λ λ λκλκλ xIxxGxeeLVRPA aa (5)
The numerical resolution of the RTE has been done by means of the Discrete Ordinate Method (DOM). The DOM transforms the integro-differential expression of the RTE into a system of finite differences algebraic equations that can be solved by numerical computation (Duderstadt and Martin, 1979). Instead of applying the 1-dimensional 1-directional model of the reactor initially described by Alfano et al. (1997), a cylindrical two-dimensional two-directional model of the photoreactor was developed, avoiding the assumption of null outgoing photon flux through the lateral wall of the reactor. A detailed explanation of the quadrature scheme used for the discretization of the spherical space of directions and the spatial mesh defined for the 2-D discretization of the cylindrical reactor can be found in a previous work (Marugán et al., 2007). For multidimensional geometries, Duderstadt and Martin (1979) recommended to derive the finite difference relations directly from the radiation balance for each mesh cell, rather than introducing the finite difference approximation directly into the RTE. From the proposed discretization procedure, it is derived a system of algebraic equations comprising the application of the photons balance for a given wavelength λ to each cell of the spatial and directional meshes, together with the following boundary conditions: i) null reflection on the cylindrical wall; ii) known inlet radiation at the reactor window; iii) null reflection on the rear wall; and (iv) the symmetry condition in the axis of the cylinder. The numerical algorithm for the resolution of this system of equations iterates until convergence of the radiation field, achieved when the intensities initially employed for the calculus of the in-scattering terms coincide with the calculated values.
5. RESULTS AND MODELING
The photocatalytic reactions for cyanide oxidation were planned according to a two-level factorial design of the following variables:
1. Catalyst concentration, Ccat × 103 (g·cm-3): 0.1 and 0.3. 2. Cyanide concentration, CCN- × 107 (mol·cm-3): 5.77 and 17.3, corresponding to 15 and 45 mg·L-1,
respectively. 3. Incident photon flux, q0 × 108 (Einstein·cm-2·s-1): 5.86 and 20.0, corresponding to the neutral filters with
70% and 30% black coverage, respectively.
In addition to the eight experiments of the factorial design, four different replicates of the central point were performed to evaluate the experimental error and the possible existence of a non-linear behavior in the response variable: the initial reaction rate of cyanide photooxidation. In all the experiments, the profile of cyanide concentration versus time can be successfully fitted to a straight line as the conversion is small enough to consider: i) the change in cyanide concentration is low and does not affect the reaction rate, ii) the amount of oxidation products is negligible, and iii) the stoichiometric consumption of oxygen is low and the dissolved oxygen concentration could be considered constant. In these conditions, the hypothesis of initial conditions could be applied to calculate the experimental values of the initial reaction rate of cyanide photooxidation by applying the mass balance of the reactor:
( )Tk
CN
R
TVCN t
tCVV
rtR d
d
0 lim
Exp0 −
−
→= (6)
where the limit of the cyanide variation with the reaction time is calculated from the slope of a fitted straight line. The values of the reaction rate provided by Equation (6), summarized in Table 2, are macroscopic values averaged in the total reactor volume.
5Marugán et al.: Kinetic Modeling of the Photocatalytic Oxidation of Cyanide
Brought to you by | University of PennsylvaniaAuthenticated | 165.123.234.223Download Date | 5/12/14 6:04 PM
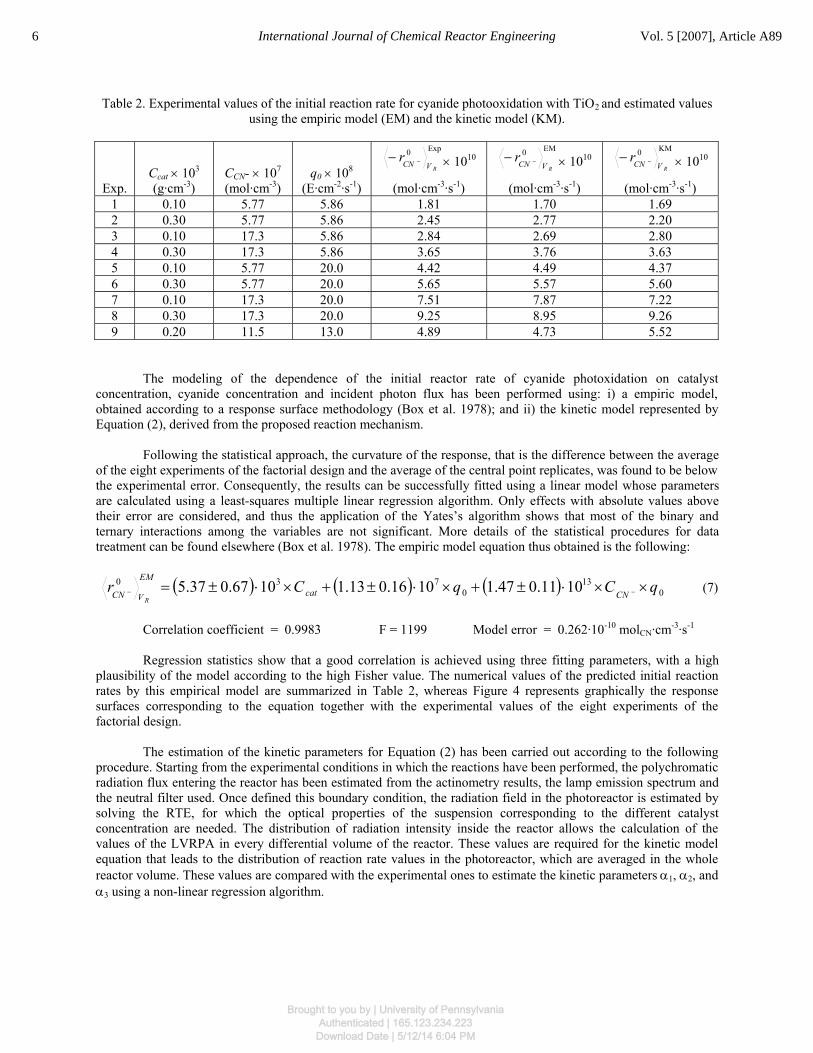
Table 2. Experimental values of the initial reaction rate for cyanide photooxidation with TiO2 and estimated values using the empiric model (EM) and the kinetic model (KM).
Exp. Ccat × 103
(g·cm-3)
CCN- × 107
(mol·cm-3) q0 × 108
(E·cm-2·s-1)
Exp0
RVCNr −− × 1010
(mol·cm-3·s-1)
EM0
RVCNr −− × 1010
(mol·cm-3·s-1)
KM0
RVCNr −− × 1010
(mol·cm-3·s-1)
1 0.10 5.77 5.86 1.81 1.70 1.69 2 0.30 5.77 5.86 2.45 2.77 2.20 3 0.10 17.3 5.86 2.84 2.69 2.80 4 0.30 17.3 5.86 3.65 3.76 3.63 5 0.10 5.77 20.0 4.42 4.49 4.37 6 0.30 5.77 20.0 5.65 5.57 5.60 7 0.10 17.3 20.0 7.51 7.87 7.22 8 0.30 17.3 20.0 9.25 8.95 9.26 9 0.20 11.5 13.0 4.89 4.73 5.52
The modeling of the dependence of the initial reactor rate of cyanide photoxidation on catalyst concentration, cyanide concentration and incident photon flux has been performed using: i) a empiric model, obtained according to a response surface methodology (Box et al. 1978); and ii) the kinetic model represented by Equation (2), derived from the proposed reaction mechanism.
Following the statistical approach, the curvature of the response, that is the difference between the average of the eight experiments of the factorial design and the average of the central point replicates, was found to be below the experimental error. Consequently, the results can be successfully fitted using a linear model whose parameters are calculated using a least-squares multiple linear regression algorithm. Only effects with absolute values above their error are considered, and thus the application of the Yates’s algorithm shows that most of the binary and ternary interactions among the variables are not significant. More details of the statistical procedures for data treatment can be found elsewhere (Box et al. 1978). The empiric model equation thus obtained is the following:
( ) ( ) ( ) 013
0730 1011.047.11016.013.11067.037.5 qCqCr
CNcat
EM
VCNR
××⋅±+×⋅±+×⋅±= −− (7)
Correlation coefficient = 0.9983 F = 1199 Model error = 0.262·10-10 molCN·cm-3·s-1
Regression statistics show that a good correlation is achieved using three fitting parameters, with a high plausibility of the model according to the high Fisher value. The numerical values of the predicted initial reaction rates by this empirical model are summarized in Table 2, whereas Figure 4 represents graphically the response surfaces corresponding to the equation together with the experimental values of the eight experiments of the factorial design.
The estimation of the kinetic parameters for Equation (2) has been carried out according to the following procedure. Starting from the experimental conditions in which the reactions have been performed, the polychromatic radiation flux entering the reactor has been estimated from the actinometry results, the lamp emission spectrum and the neutral filter used. Once defined this boundary condition, the radiation field in the photoreactor is estimated by solving the RTE, for which the optical properties of the suspension corresponding to the different catalyst concentration are needed. The distribution of radiation intensity inside the reactor allows the calculation of the values of the LVRPA in every differential volume of the reactor. These values are required for the kinetic model equation that leads to the distribution of reaction rate values in the photoreactor, which are averaged in the whole reactor volume. These values are compared with the experimental ones to estimate the kinetic parameters α1, α2, and α3 using a non-linear regression algorithm.
6 International Journal of Chemical Reactor Engineering Vol. 5 [2007], Article A89
Brought to you by | University of PennsylvaniaAuthenticated | 165.123.234.223Download Date | 5/12/14 6:04 PM
The kinetic model equation thus obtained is:
( )( )
( )⎟⎟⎟
⎠
⎞
⎜⎜⎜
⎝
⎛ ×⋅±++−
×⋅±+
×⋅±=
−
−
−
−
R
R
Vcatg
a
CN
CNcatg
KM
VCN CSe
CC
CSr10
6
50 1033.112.211
1021.019.111096.002.2
(8)
Correlation coefficient = 0. 9982 F = 1128 Model error = 0.309·10-10 molCN·cm-3·s-1
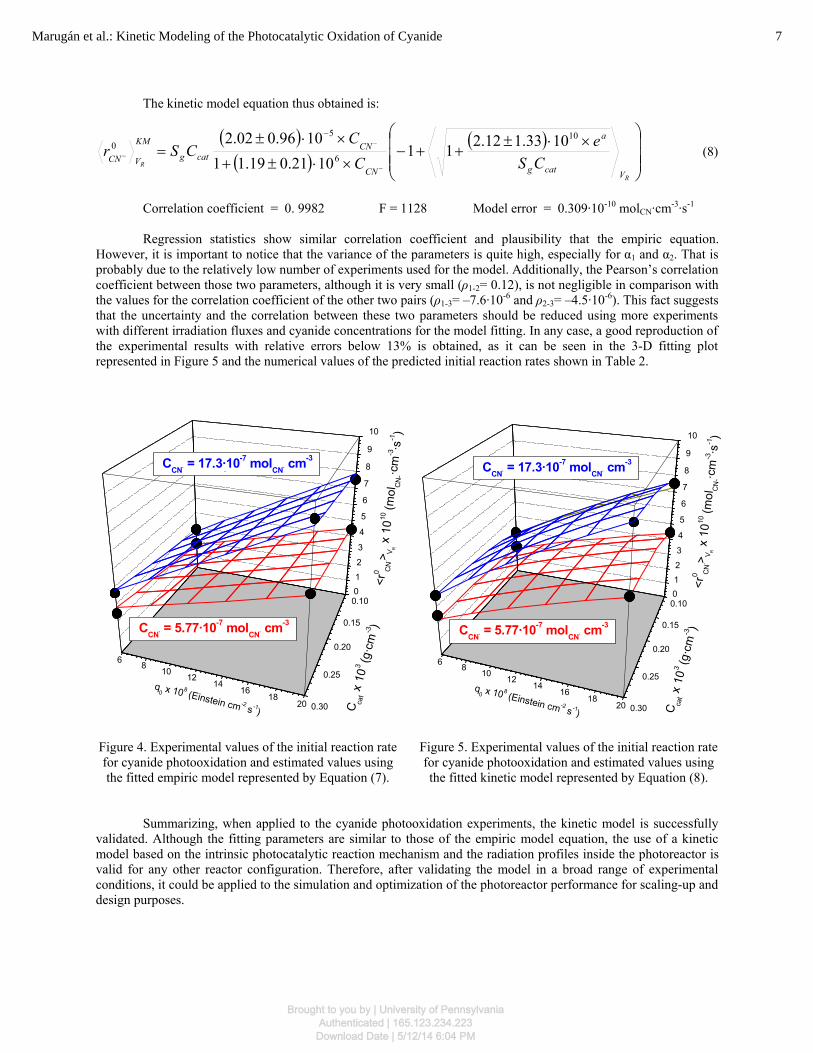
Regression statistics show similar correlation coefficient and plausibility that the empiric equation. However, it is important to notice that the variance of the parameters is quite high, especially for α1 and α2. That is probably due to the relatively low number of experiments used for the model. Additionally, the Pearson’s correlation coefficient between those two parameters, although it is very small (ρ1-2= 0.12), is not negligible in comparison with the values for the correlation coefficient of the other two pairs (ρ1-3= –7.6·10-6 and ρ2-3= –4.5·10-6). This fact suggests that the uncertainty and the correlation between these two parameters should be reduced using more experiments with different irradiation fluxes and cyanide concentrations for the model fitting. In any case, a good reproduction of the experimental results with relative errors below 13% is obtained, as it can be seen in the 3-D fitting plot represented in Figure 5 and the numerical values of the predicted initial reaction rates shown in Table 2.
0.10
0.15
0.20
0.25
0.30
6 810
1214
1618
20
01
2
3
4
5
6
7
8
9
10
CCN- = 5.77·10-7 molCN- cm-3
CCN- = 17.3·10-7 molCN- cm-3
<r0 C
N-> V
R
x 10
10 (m
olC
N-·c
m-3·s
-1)
C ca
tx
103 (g
·cm
-3 )
q0 x 10 8 (Einstein cm -2 s -1)
0.10
0.15
0.20
0.25
0.30
6 810
1214
1618
20
01
2
3
4
5
6
7
8
9
10
CCN- = 5.77·10-7 molCN- cm-3
CCN- = 17.3·10-7 molCN- cm-3
<r0 C
N-> V
Rx
1010
(mol
CN
-·cm
-3·s
-1)
C ca
tx
103 (g
·cm
-3 )q
0 x 10 8 (Einstein cm -2 s -1)
Figure 4. Experimental values of the initial reaction rate for cyanide photooxidation and estimated values using the fitted empiric model represented by Equation (7).
Figure 5. Experimental values of the initial reaction rate for cyanide photooxidation and estimated values using the fitted kinetic model represented by Equation (8).
Summarizing, when applied to the cyanide photooxidation experiments, the kinetic model is successfully validated. Although the fitting parameters are similar to those of the empiric model equation, the use of a kinetic model based on the intrinsic photocatalytic reaction mechanism and the radiation profiles inside the photoreactor is valid for any other reactor configuration. Therefore, after validating the model in a broad range of experimental conditions, it could be applied to the simulation and optimization of the photoreactor performance for scaling-up and design purposes.
7Marugán et al.: Kinetic Modeling of the Photocatalytic Oxidation of Cyanide
Brought to you by | University of PennsylvaniaAuthenticated | 165.123.234.223Download Date | 5/12/14 6:04 PM

ACKNOWLEDGEMENTS
The Authors gratefully acknowledge the financial support of the Ministerio de Educación y Ciencia of Spain through the program Consolider-Ingenio 2010 (project CSD2006-00044 TRAGUA), Comunidad de Madrid through the program REMTAVARES S-0505/AMB/0395 and from the Universidad Nacional del Litoral, Agencia Nacional de Promoción Científica y Tecnológica, and Consejo Nacional de Investigaciones Científicas y Técnicas of Argentina.
NOTATION
Ccat catalyst mass concentration, g·m-3 CCN- cyanide molar concentration, mol·cm-3 ea local volumetric rate of photon absorption, Einstein·cm-3·s-1
G incident radiation, Einstein·cm-2·s-1 I radiation intensity, Einstein·cm-2·s-1·sr-1 p phase function, dimensionless q0 inlet radiation flux, Einstein·cm-2·s-1 rCN- cyanide photooxidation reaction rate, mol·cm-3·s-1 s linear coordinate along the direction of radiation propagation Ω, cm Sg specific surface area of the catalyst, cm2·g-1
t time, s V volume, cm3
x vector representing position in a 3D space, cm
Greek letters α1 kinetic parameter, cm·s-1 α2 kinetic parameter, cm2·s·Einstein-1
α3 kinetic parameter, cm3·mol-1 εL liquid hold-up, dimensionlessκ napierian volumetric absorption coefficient, cm-1
λ wavelength, nm σ napierian volumetric scattering coefficient, cm-1 Ω solid angle of radiation propagation about the direction Ω, sr Ω unit vector in the direction of radiation propagation
Subscripts λ indicates a dependence on wavelength Ω indicates a directional dependence 0 indicates inlet condition R relative to the reactor T relative to the total recirculating system Tk relative to the reservoir tank
Superscripts 0 indicates initial condition EM relative to the empiric model KM relative to the kinetic model
Special symbols _ indicates a vectorial quantity ⟨ ⟩ indicates average value
8 International Journal of Chemical Reactor Engineering Vol. 5 [2007], Article A89
Brought to you by | University of PennsylvaniaAuthenticated | 165.123.234.223Download Date | 5/12/14 6:04 PM
REFERENCES
Alfano, O.M., Cabrera, M.I., Cassano, A.E., “Photocatalytic reactions involving hydroxyl radical attack. I. Reaction kinetics formulation with explicit photon absorption effects”, J. Catal., Vol. 172, 370-379 (1997).
Augugliaro, V., Loddo, V., Marcì, G., Palmisano, L., López-Muñoz, M.J. “Photocatalytic oxidation of cyanides in aqueous titanium dioxide suspensions”, J. Catal., Vol. 166, 272-283 (1997).
Bayarri, B., Giménez, J., Curcó, D., Esplugas, S., “Photocatalytic degradation of 2,4-dichlorophenol by TiO2/UV: Kinetics, actinometries and models”, Catal. Today, Vol. 101, 227-236 (2005).
Box, G. E. P., Hunter, W. G., Hunter, J. S., “Statistics for experimenters: An introduction to design, data analysis, and model building”, Wiley, New York (1978).
Braun, A.M., Maurette, M.T., Oliveros, E. “Photochemical technology”, Wiley, Chichester (1991).
Cabrera, M.I., Negro, A.C., Alfano, O.M., Cassano, A.E., “Photocatalytic reactions involving hydroxyl radical attack. II. Kinetics of the decomposition of trichloroethylene using titanium dioxide”, J. Catal., Vol. 172, 380-390 (1997).
Chiang, K., Amal, R., Tran, T., “Photocatalytic oxidation of cyanide: kinetic and mechanistic studies”, J. Molec. Catal. A. Chem., Vol. 193, 285-297 (2003).
Clescerl, L.S., Greenberg, A.E., Eaton, A.D. (Eds.), “Standard methods for the examination of water and wastewater”, United Book Press Inc., Baltimore (1998).
Duderstadt, J.J., Martin, W.R. “Transport theory”, Wiley, New York (1979).
Frank, S.N., Bard, A.J., “Heterogeneous photocatalytic oxidation of cyanide ion in aqueous solutions at TiO2 powder”, J. Am. Chem. Soc., Vol. 99, 303-304 (1977).
Li Puma, G., Brucato, A., “Dimensionless analysis of slurry photocatalytic reactors using two-flux and six-flux radiation absorption-scattering models”, Catal. Today, in press, doi:10.1046/j.cattod.2007.01.027, (2007).
Marugán, J., van Grieken, R., Cassano, A.E., Alfano, O.M., “Quantum efficiency of cyanide photooxidation with TiO2/SiO2 catalysts: Multivariate analysis by experimental design”, Catal. Today, (Accepted for publication, 2007).
Ozisik, M.N., “Radiative transfer and interactions with conduction and convection”, Wiley, New York (1973).
Peral, J., Domènech, X., “Photocatalytic cyanide oxidation from aqueous copper cyanide solutions over titania and zinc oxide”, J. Chem. Technol. Biotechnol., Vol. 53, 93-96 (1992).
Rader, W.S., Solujic, L., Milosavljevic, E.B., Hendrix, J.L., “Sunlight-induced photochemistry of aqueous solutions of hexacyanoferrate (II) and (III) ions”, Environ. Sci. Technol., Vol. 27, 1875-1879 (1993).
Ray, A.K., “Design, modeling and experimentation of a new large-scale photocatalytic reactor for water treatment”, Chem. Eng. Sci., Vol. 54, 3113-3125 (1999)
Satuf, M.L., Brandi, R.J., Cassano, A.E., Alfano, O.M., “Experimental method to evaluate the optical properties of aqueous titanium dioxide suspensions”, Ind. Eng. Chem. Res., Vol. 44, 6643-6649 (2005). Turchi C.S., Ollis, D.F., “Photocatalytic degradation of organic water contaminants: Mechanisms involving hydrogen radical attack”, J. Catal., Vol. 122, 178-192 (1990).
van Grieken, R., Aguado, J., López-Muñoz, M.J., Marugán, J., “Photocatalytic degradation of iron–cyanocomplexes by TiO2 based catalysts”, Appl. Catal B. Environ., Vol. 55, 201-211 (2005a).
9Marugán et al.: Kinetic Modeling of the Photocatalytic Oxidation of Cyanide
Brought to you by | University of PennsylvaniaAuthenticated | 165.123.234.223Download Date | 5/12/14 6:04 PM
van Grieken, R., Aguado, J., López-Muñoz, M.J., Marugán, J., “Photocatalytic gold recovery from spent cyanide plating bath solutions”, Gold Bull., Vol. 38/4, 180-187 (2005b).
Young, C.A., Jordan, T.S., “Cyanide remediation: Current and past technologies”, in “Proceedings of the 10th annual conference on hazardous waste research”, Kansas State University, Manhattan, Kansas, 104-129 (1995).
Zalazar, C.S., Romero, R.L., Martín, C.A., Cassano, A.E., “Photocatalytic intrinsic reaction kinetics I: Mineralization of dichloroacetic acid”, Chem. Eng. Sci., Vol. 60, 5240-5254 (2005a).
Zalazar, C.S., Labas, M.D., Martín, C.A., Brandi, R.J., Alfano, O.M., Cassano, A.E., “The extended use of actinometry in the interpretation of photochemical reaction engineering data”, Chem. Eng. J., Vol. 109, 67-81 (2005b).
Zhang, Z.J., Anderson, W.A., Moo-Young, M., “An engineering model for the scale-up and design of photocatalytic reactors”, Int. J. Chem. Reactor Eng., Vol. 1, A57 (2003).
10 International Journal of Chemical Reactor Engineering Vol. 5 [2007], Article A89
Brought to you by | University of PennsylvaniaAuthenticated | 165.123.234.223Download Date | 5/12/14 6:04 PM