comparison of efficiency functions for ge gamma-ray detectors in a wide energy range
TRANSCRIPT
Nuclear Instruments and Methods in Physics Research A 418 (1998) 374—386
Comparison of efficiency functions for Ge gamma-ray detectors ina wide energy range
Z. Kis!,",*, B. Fazekas", J. O® stor", Zs. Revay", T. Belgya", G.L. Molnar", L. Koltay#
! Department of Physics, University of Veszpre&m, POB 158, H-8201 Veszpre&m, Hungary" RCC Institute of Isotope and Surface Chemistry, POB 77, H-1525 Budapest, Hungary
# Department of Mathematics, University of Veszpre&m, H-8201 Veszpre&m, Hungary
Received 12 April 1998
Abstract
The applicability of linear parameter functions for fitting the full-energy peak efficiency of Ge gamma-ray detectors hasbeen examined in a wide energy range of 50—8500 keV, typical for prompt gamma activation analysis, by using efficiencydata measured with the Budapest capture gamma-ray spectrometer. In a least-squares fitting procedure involvingcorrelation and singular value decomposition the performance of six different analytical functions has been compared. Itturns out that a high-order polynomial function on a log—log scale gives the best performance if a proper fittingprocedure is used, as in the program Hypermet-PC. ( 1998 Elsevier Science B.V. All rights reserved.
Keywords: Ge detectors; Efficiency calibration; Linear functions; Correlated data; Hypermet-PC
1. Introduction
In gamma-ray spectrometry by Ge detectors it isa common practice to approximate the detectorefficiency for full-energy peaks by an analyticalfunction fitted to the experimental efficiency datapoints [1—3]. From the experimental efficiencyvalues, e
i, the least-squares fitting procedure yields
the optimum parameters, pj, for the fitting function,
F(E; p1, p
2,2), and the covariance matrix of the p
j,
hence the calculated efficiency, e#(E), and its
*Correspondence address: Department of Nuclear Medi-cine, County Hospital Veszprem, Veszprem H-8201, Hungary.Tel.: #36 88 422 103; fax: #36 88 422 103; e-mail: [email protected].
standard deviation, p(e#), at an arbitrary energy E.
The fitting functions commonly used are eitherlinear or nonlinear in their parameters [1,2].
In prompt gamma activation analysis (PGAA)measurements the full-energy range of the efficiencyfunction extends up to about 11 MeV (typicallyfrom 50 keV to 8.5 MeV) which can only becovered with data sets from different radioactivesources and from (n, c) reactions combined [1—3].In that case data points from the individual sourceshave to be normalized or, when an absolute effi-ciency is required, the activities of uncalibratedsources have to be determined by using the activ-ities of calibrated sources. Another problem is thecorrelation between the input data if more than oneline of the same calibrated source is used [1,4,5].
0168-9002/98/$19.00 ( 1998 Elsevier Science B.V. All rights reserved.PII: S 0 1 6 8 - 9 0 0 2 ( 9 8 ) 0 0 7 7 8 - 5
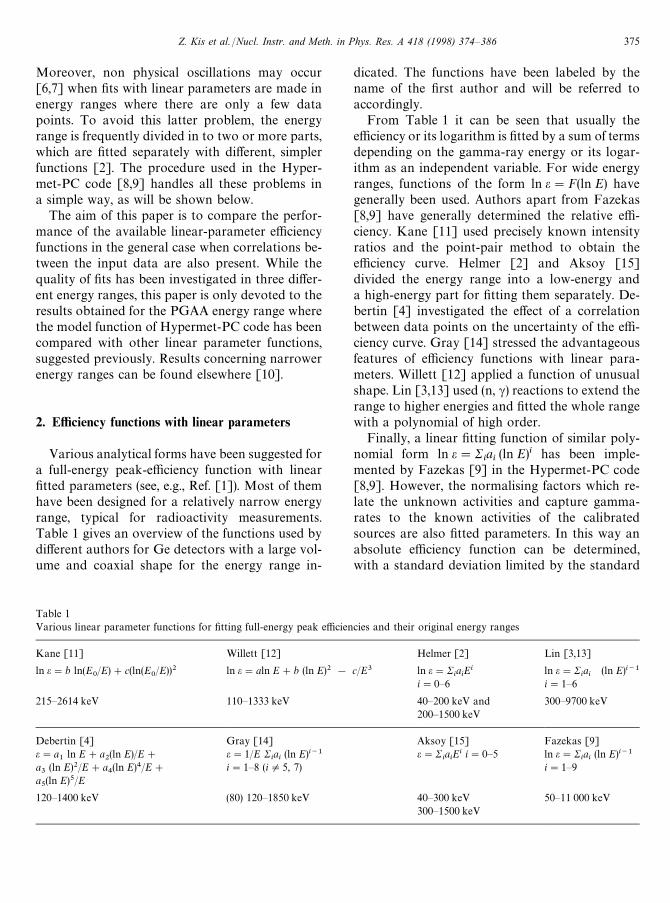
Table 1Various linear parameter functions for fitting full-energy peak efficiencies and their original energy ranges
Kane [11] Willett [12] Helmer [2] Lin [3,13]
ln e"b ln(E0/E)#c(ln(E
0/E))2 ln e"aln E#b (ln E)2 ! c/E3 ln e"R
iaiEi
i"0—6ln e"R
iai
(ln E)i~1
i"1—6
215—2614 keV 110—1333 keV 40—200 keV and200—1500 keV
300—9700 keV
Debertin [4]e"a
1ln E#a
2(ln E)/E#
a3
(ln E)2/E#a4(ln E)4/E#
a5(ln E)5/E
Gray [14]e"1/E R
iai(ln E)i~1
i"1—8 (iO5, 7)
Aksoy [15]e"R
iaiEi i"0—5
Fazekas [9]ln e"R
iai(ln E)i~1
i"1—9
120—1400 keV (80) 120—1850 keV 40—300 keV300—1500 keV
50—11 000 keV
Moreover, non physical oscillations may occur[6,7] when fits with linear parameters are made inenergy ranges where there are only a few datapoints. To avoid this latter problem, the energyrange is frequently divided in to two or more parts,which are fitted separately with different, simplerfunctions [2]. The procedure used in the Hyper-met-PC code [8,9] handles all these problems ina simple way, as will be shown below.
The aim of this paper is to compare the perfor-mance of the available linear-parameter efficiencyfunctions in the general case when correlations be-tween the input data are also present. While thequality of fits has been investigated in three differ-ent energy ranges, this paper is only devoted to theresults obtained for the PGAA energy range wherethe model function of Hypermet-PC code has beencompared with other linear parameter functions,suggested previously. Results concerning narrowerenergy ranges can be found elsewhere [10].
2. Efficiency functions with linear parameters
Various analytical forms have been suggested fora full-energy peak-efficiency function with linearfitted parameters (see, e.g., Ref. [1]). Most of themhave been designed for a relatively narrow energyrange, typical for radioactivity measurements.Table 1 gives an overview of the functions used bydifferent authors for Ge detectors with a large vol-ume and coaxial shape for the energy range in-
dicated. The functions have been labeled by thename of the first author and will be referred toaccordingly.
From Table 1 it can be seen that usually theefficiency or its logarithm is fitted by a sum of termsdepending on the gamma-ray energy or its logar-ithm as an independent variable. For wide energyranges, functions of the form ln e"F(ln E) havegenerally been used. Authors apart from Fazekas[8,9] have generally determined the relative effi-ciency. Kane [11] used precisely known intensityratios and the point-pair method to obtain theefficiency curve. Helmer [2] and Aksoy [15]divided the energy range into a low-energy anda high-energy part for fitting them separately. De-bertin [4] investigated the effect of a correlationbetween data points on the uncertainty of the effi-ciency curve. Gray [14] stressed the advantageousfeatures of efficiency functions with linear para-meters. Willett [12] applied a function of unusualshape. Lin [3,13] used (n, c) reactions to extend therange to higher energies and fitted the whole rangewith a polynomial of high order.
Finally, a linear fitting function of similar poly-nomial form ln e"R
iai(ln E)i has been imple-
mented by Fazekas [9] in the Hypermet-PC code[8,9]. However, the normalising factors which re-late the unknown activities and capture gamma-rates to the known activities of the calibratedsources are also fitted parameters. In this way anabsolute efficiency function can be determined,with a standard deviation limited by the standard
Z. Kis et al. /Nucl. Instr. and Meth. in Phys. Res. A 418 (1998) 374—386 375
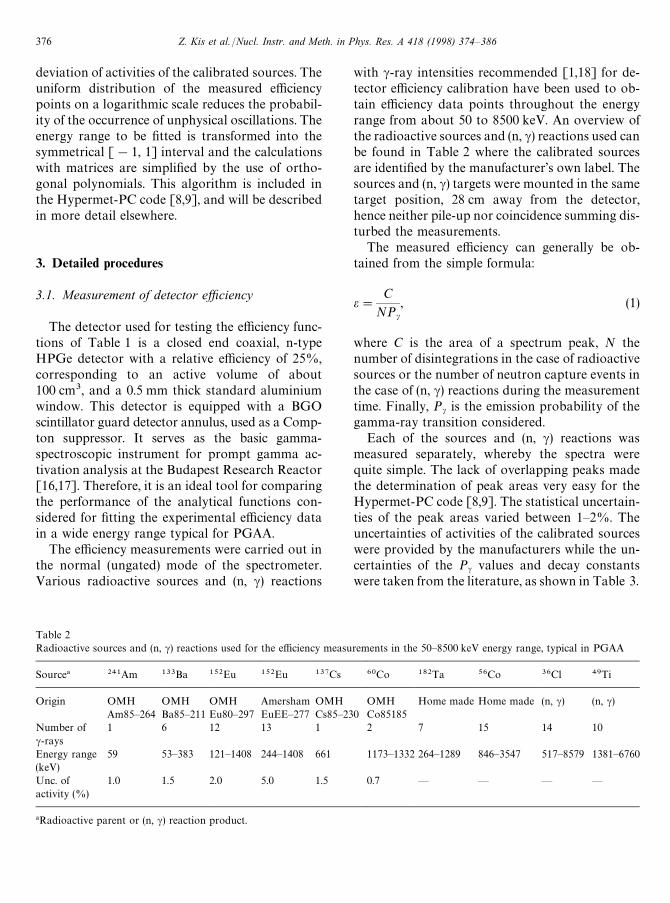
Table 2Radioactive sources and (n, c) reactions used for the efficiency measurements in the 50—8500 keV energy range, typical in PGAA
Source! 241Am 133Ba 152Eu 152Eu 137Cs 60Co 182Ta 56Co 36Cl 49Ti
Origin OMHAm85—264
OMHBa85—211
OMHEu80—297
AmershamEuEE—277
OMHCs85—230
OMHCo85185
Home made Home made (n, c) (n, c)
Number ofc-rays
1 6 12 13 1 2 7 15 14 10
Energy range(keV)
59 53—383 121—1408 244—1408 661 1173—1332 264—1289 846—3547 517—8579 1381—6760
Unc. ofactivity (%)
1.0 1.5 2.0 5.0 1.5 0.7 — — — —
!Radioactive parent or (n, c) reaction product.
deviation of activities of the calibrated sources. Theuniform distribution of the measured efficiencypoints on a logarithmic scale reduces the probabil-ity of the occurrence of unphysical oscillations. Theenergy range to be fitted is transformed into thesymmetrical [!1, 1] interval and the calculationswith matrices are simplified by the use of ortho-gonal polynomials. This algorithm is included inthe Hypermet-PC code [8,9], and will be describedin more detail elsewhere.
3. Detailed procedures
3.1. Measurement of detector efficiency
The detector used for testing the efficiency func-tions of Table 1 is a closed end coaxial, n-typeHPGe detector with a relative efficiency of 25%,corresponding to an active volume of about100 cm3, and a 0.5 mm thick standard aluminiumwindow. This detector is equipped with a BGOscintillator guard detector annulus, used as a Comp-ton suppressor. It serves as the basic gamma-spectroscopic instrument for prompt gamma ac-tivation analysis at the Budapest Research Reactor[16,17]. Therefore, it is an ideal tool for comparingthe performance of the analytical functions con-sidered for fitting the experimental efficiency datain a wide energy range typical for PGAA.
The efficiency measurements were carried out inthe normal (ungated) mode of the spectrometer.Various radioactive sources and (n, c) reactions
with c-ray intensities recommended [1,18] for de-tector efficiency calibration have been used to ob-tain efficiency data points throughout the energyrange from about 50 to 8500 keV. An overview ofthe radioactive sources and (n, c) reactions used canbe found in Table 2 where the calibrated sourcesare identified by the manufacturer’s own label. Thesources and (n, c) targets were mounted in the sametarget position, 28 cm away from the detector,hence neither pile-up nor coincidence summing dis-turbed the measurements.
The measured efficiency can generally be ob-tained from the simple formula:
e"C
NPc, (1)
where C is the area of a spectrum peak, N thenumber of disintegrations in the case of radioactivesources or the number of neutron capture events inthe case of (n, c) reactions during the measurementtime. Finally, Pc is the emission probability of thegamma-ray transition considered.
Each of the sources and (n, c) reactions wasmeasured separately, whereby the spectra werequite simple. The lack of overlapping peaks madethe determination of peak areas very easy for theHypermet-PC code [8,9]. The statistical uncertain-ties of the peak areas varied between 1—2%. Theuncertainties of activities of the calibrated sourceswere provided by the manufacturers while the un-certainties of the P
cvalues and decay constants
were taken from the literature, as shown in Table 3.
376 Z. Kis et al. /Nucl. Instr. and Meth. in Phys. Res. A 418 (1998) 374—386
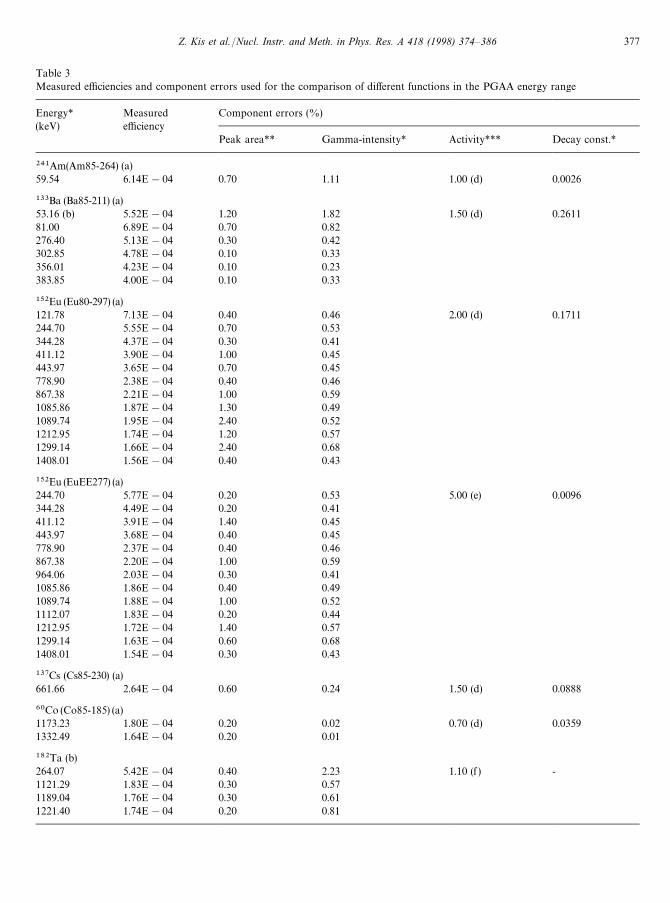
Table 3Measured efficiencies and component errors used for the comparison of different functions in the PGAA energy range
Energy* Measured Component errors (%)(keV) efficiency
Peak area** Gamma-intensity* Activity*** Decay const.*
241Am(Am85-264) (a)59.54 6.14E!04 0.70 1.11 1.00 (d) 0.0026
133Ba (Ba85-211) (a)53.16 (b) 5.52E!04 1.20 1.82 1.50 (d) 0.261181.00 6.89E!04 0.70 0.82276.40 5.13E!04 0.30 0.42302.85 4.78E!04 0.10 0.33356.01 4.23E!04 0.10 0.23383.85 4.00E!04 0.10 0.33
152Eu (Eu80-297) (a)121.78 7.13E!04 0.40 0.46 2.00 (d) 0.1711244.70 5.55E!04 0.70 0.53344.28 4.37E!04 0.30 0.41411.12 3.90E!04 1.00 0.45443.97 3.65E!04 0.70 0.45778.90 2.38E!04 0.40 0.46867.38 2.21E!04 1.00 0.591085.86 1.87E!04 1.30 0.491089.74 1.95E!04 2.40 0.521212.95 1.74E!04 1.20 0.571299.14 1.66E!04 2.40 0.681408.01 1.56E!04 0.40 0.43
152Eu (EuEE277) (a)244.70 5.77E!04 0.20 0.53 5.00 (e) 0.0096344.28 4.49E!04 0.20 0.41411.12 3.91E!04 1.40 0.45443.97 3.68E!04 0.40 0.45778.90 2.37E!04 0.40 0.46867.38 2.20E!04 1.00 0.59964.06 2.03E!04 0.30 0.411085.86 1.86E!04 0.40 0.491089.74 1.88E!04 1.00 0.521112.07 1.83E!04 0.20 0.441212.95 1.72E!04 1.40 0.571299.14 1.63E!04 0.60 0.681408.01 1.54E!04 0.30 0.43
137Cs (Cs85-230) (a)661.66 2.64E!04 0.60 0.24 1.50 (d) 0.0888
60Co (Co85-185) (a)1173.23 1.80E!04 0.20 0.02 0.70 (d) 0.03591332.49 1.64E!04 0.20 0.01
182Ta (b)264.07 5.42E!04 0.40 2.23 1.10 (f ) -1121.29 1.83E!04 0.30 0.571189.04 1.76E!04 0.30 0.611221.40 1.74E!04 0.20 0.81
Z. Kis et al. /Nucl. Instr. and Meth. in Phys. Res. A 418 (1998) 374—386 377
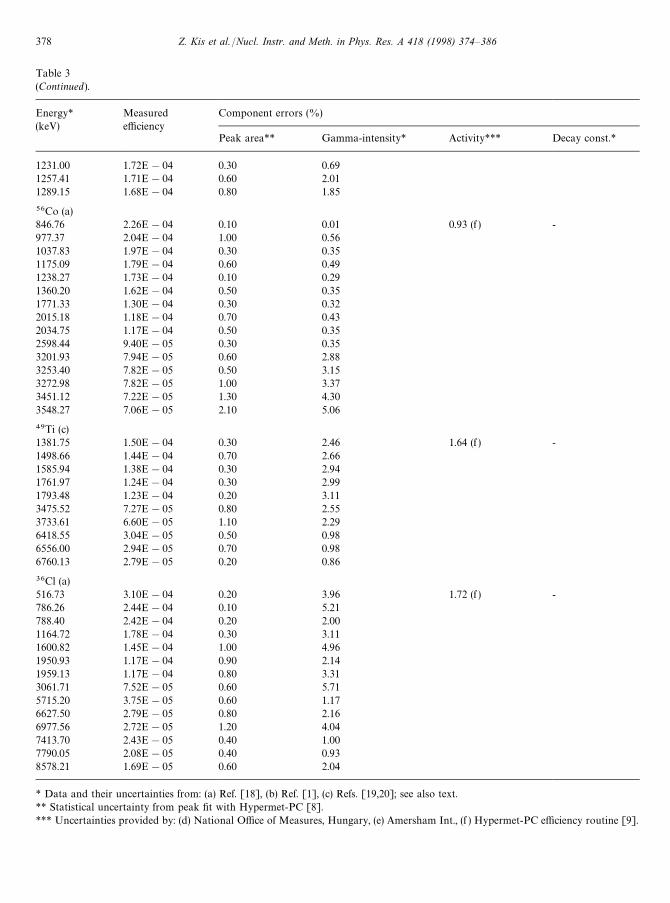
Table 3(Continued).
Energy* Measured Component errors (%)(keV) efficiency
Peak area** Gamma-intensity* Activity*** Decay const.*
1231.00 1.72E!04 0.30 0.691257.41 1.71E!04 0.60 2.011289.15 1.68E!04 0.80 1.85
56Co (a)846.76 2.26E!04 0.10 0.01 0.93 (f ) -977.37 2.04E!04 1.00 0.561037.83 1.97E!04 0.30 0.351175.09 1.79E!04 0.60 0.491238.27 1.73E!04 0.10 0.291360.20 1.62E!04 0.50 0.351771.33 1.30E!04 0.30 0.322015.18 1.18E!04 0.70 0.432034.75 1.17E!04 0.50 0.352598.44 9.40E!05 0.30 0.353201.93 7.94E!05 0.60 2.883253.40 7.82E!05 0.50 3.153272.98 7.82E!05 1.00 3.373451.12 7.22E!05 1.30 4.303548.27 7.06E!05 2.10 5.06
49Ti (c)1381.75 1.50E!04 0.30 2.46 1.64 (f ) -1498.66 1.44E!04 0.70 2.661585.94 1.38E!04 0.30 2.941761.97 1.24E!04 0.30 2.991793.48 1.23E!04 0.20 3.113475.52 7.27E!05 0.80 2.553733.61 6.60E!05 1.10 2.296418.55 3.04E!05 0.50 0.986556.00 2.94E!05 0.70 0.986760.13 2.79E!05 0.20 0.86
36Cl (a)516.73 3.10E!04 0.20 3.96 1.72 (f ) -786.26 2.44E!04 0.10 5.21788.40 2.42E!04 0.20 2.001164.72 1.78E!04 0.30 3.111600.82 1.45E!04 1.00 4.961950.93 1.17E!04 0.90 2.141959.13 1.17E!04 0.80 3.313061.71 7.52E!05 0.60 5.715715.20 3.75E!05 0.60 1.176627.50 2.79E!05 0.80 2.166977.56 2.72E!05 1.20 4.047413.70 2.43E!05 0.40 1.007790.05 2.08E!05 0.40 0.938578.21 1.69E!05 0.60 2.04
* Data and their uncertainties from: (a) Ref. [18], (b) Ref. [1], (c) Refs. [19,20]; see also text.** Statistical uncertainty from peak fit with Hypermet-PC [8].*** Uncertainties provided by: (d) National Office of Measures, Hungary, (e) Amersham Int., (f ) Hypermet-PC efficiency routine [9].
378 Z. Kis et al. /Nucl. Instr. and Meth. in Phys. Res. A 418 (1998) 374—386
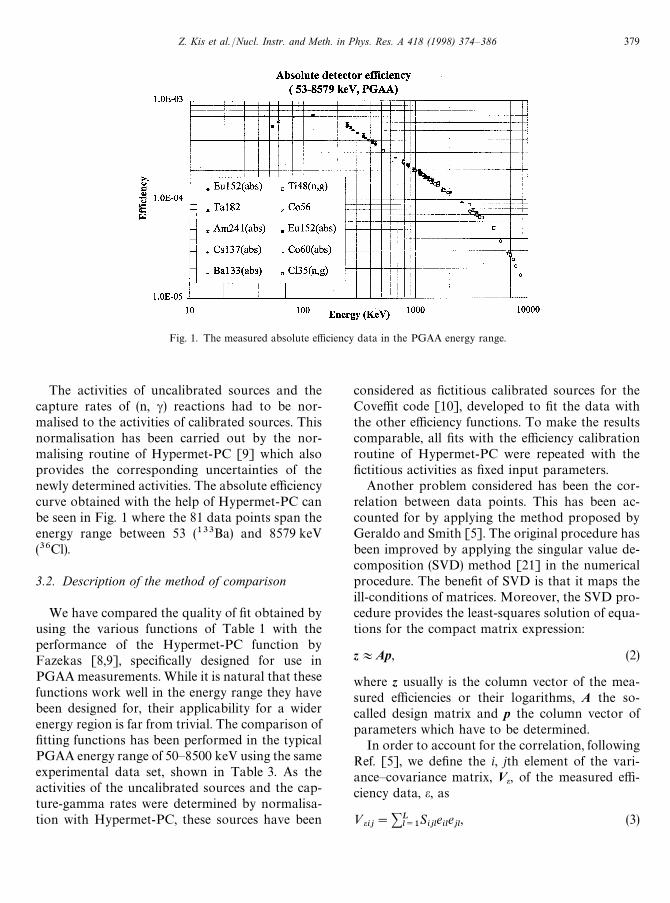
Fig. 1. The measured absolute efficiency data in the PGAA energy range.
The activities of uncalibrated sources and thecapture rates of (n, c) reactions had to be nor-malised to the activities of calibrated sources. Thisnormalisation has been carried out by the nor-malising routine of Hypermet-PC [9] which alsoprovides the corresponding uncertainties of thenewly determined activities. The absolute efficiencycurve obtained with the help of Hypermet-PC canbe seen in Fig. 1 where the 81 data points span theenergy range between 53 (133Ba) and 8579 keV(36Cl).
3.2. Description of the method of comparison
We have compared the quality of fit obtained byusing the various functions of Table 1 with theperformance of the Hypermet-PC function byFazekas [8,9], specifically designed for use inPGAA measurements. While it is natural that thesefunctions work well in the energy range they havebeen designed for, their applicability for a widerenergy region is far from trivial. The comparison offitting functions has been performed in the typicalPGAA energy range of 50—8500 keV using the sameexperimental data set, shown in Table 3. As theactivities of the uncalibrated sources and the cap-ture-gamma rates were determined by normalisa-tion with Hypermet-PC, these sources have been
considered as fictitious calibrated sources for theCoveffit code [10], developed to fit the data withthe other efficiency functions. To make the resultscomparable, all fits with the efficiency calibrationroutine of Hypermet-PC were repeated with thefictitious activities as fixed input parameters.
Another problem considered has been the cor-relation between data points. This has been ac-counted for by applying the method proposed byGeraldo and Smith [5]. The original procedure hasbeen improved by applying the singular value de-composition (SVD) method [21] in the numericalprocedure. The benefit of SVD is that it maps theill-conditions of matrices. Moreover, the SVD pro-cedure provides the least-squares solution of equa-tions for the compact matrix expression:
z+Ap, (2)
where z usually is the column vector of the mea-sured efficiencies or their logarithms, A the so-called design matrix and p the column vector ofparameters which have to be determined.
In order to account for the correlation, followingRef. [5], we define the i, jth element of the vari-ance—covariance matrix, Ve, of the measured effi-ciency data, e, as
»eij"+Ll/1
Sijl
eilejl, (3)
Z. Kis et al. /Nucl. Instr. and Meth. in Phys. Res. A 418 (1998) 374—386 379
where Sijl
is the i, jth element of the microcorrela-tion matrix for the lth independent error source(l"1,2, ¸); S
ijlis equal to either 1 (correlated) or
0 (uncorrelated). The eil
and ejl
terms represent thevalues of component errors from the lth errorsource at the ith and jth data points, respectively.
The fitting analysis involves natural logarithmsof efficiencies therefore the measured efficiencies, e
i,
have to be converted to their equivalent naturallogarithms: z
i"ln e
i. This implies a simultaneous
conversion of the variance—covariance matrixVe—Vz according to
»zij"
»eijeiej
. (4)
In the case of efficiency measurements the followingfour independent error sources can be distin-guished:
N0
initial activity or capture rate,j decay constant,Pc gamma-ray intensity,C peak area per unit live time.
Hence, the variance—covariance matrix Vz of thez efficiency vector (and/or Ve) consists of the sum offour matrices, each of which belongs to one of theindependent error sources. The individual gamma-ray intensities and the corresponding peak areashave been considered uncorrelated for each radi-ation source. Therefore, their microcorrelation ma-trices S
ijlare diagonal unit matrices. As to the
activities and decay constants, their microcorrela-tion submatrices along the diagonal are identical,with all elements equal to 1, according to the fullcorrelation. The size of each submatrix is deter-mined by the number of gamma-ray transitions ofthe source used for the fitting. The energy andefficiency data and the component errors from theindependent error sources can be found in Table 3.Here, only the uncertainties of decay constants ofcalibrated sources are included. The decay con-stants of the fictitious calibrated sources are con-sidered to be exact, e.g. having zero uncertainty,because these uncertainties have very small magni-tudes ((10~5%).
The elements of z have to be made uncorrelatedfor SVD. To achieve this we have transformed
z and A to
z*"Vz~1@2z, A*"Vz~1@2A, (5)
so as the standard deviation of z* becomes 1. Herethe superscript denotes the power of the matrix.The least-squares condition states that the bestestimate for the parameter vector p is the one whichminimises the chi-square given by the quadraticform
s2"(z*!A*p)`(z*!A*p), (6)
where ` denotes matrix transposition. Note thatEq. (6) differs from the corresponding expression inRef. [5] due to the transformation, Eq. (5).
The quality of fit can be measured by the value ofchi-square as follows. The optimal number of fit-ting parameters is determined by means oftabulated values of the chi-square distribution. Ifthe difference between the chi-square values of thefits with n parameters and n#1 parameters ex-ceeds the value of the chi-square distribution withone degree of freedom with a probability of 5%then this new parameter has to be considered sig-nificant at this confidence level. Hence, the differ-ence between the value of the obtained reducedchi-square (i.e. s2 divided by the number of degreesof freedom, f ) and the theoretical value of unityindicates the quality of fit.
The uncertainty of the efficiency value at anarbitrary energy can be derived in a statisticallyrigorous way by applying the law of error propaga-tion
V1"(A`V~1
zA)~1, (7)
Vz#"A`
#V1
A#, (8)
where Vp and Vz#
are the variance-covariance ma-trices of the fitted parameters and calculated ef-ficiencies, respectively, while A
#is the design matrix
at an arbitrary energy. Whenever the reduced chi-square exceeds the theoretical value, 1, the vari-ance—covariance matrix of fitted parameters, V
1,
has to be multiplied by this reduced chi-squarevalue. The diagonal elements of V
z#are then the
variances of the calculated efficiencies, p2(e#).
The fitting procedure has been repeated by usingboth the MeV and keV energy scales because the
380 Z. Kis et al. /Nucl. Instr. and Meth. in Phys. Res. A 418 (1998) 374—386
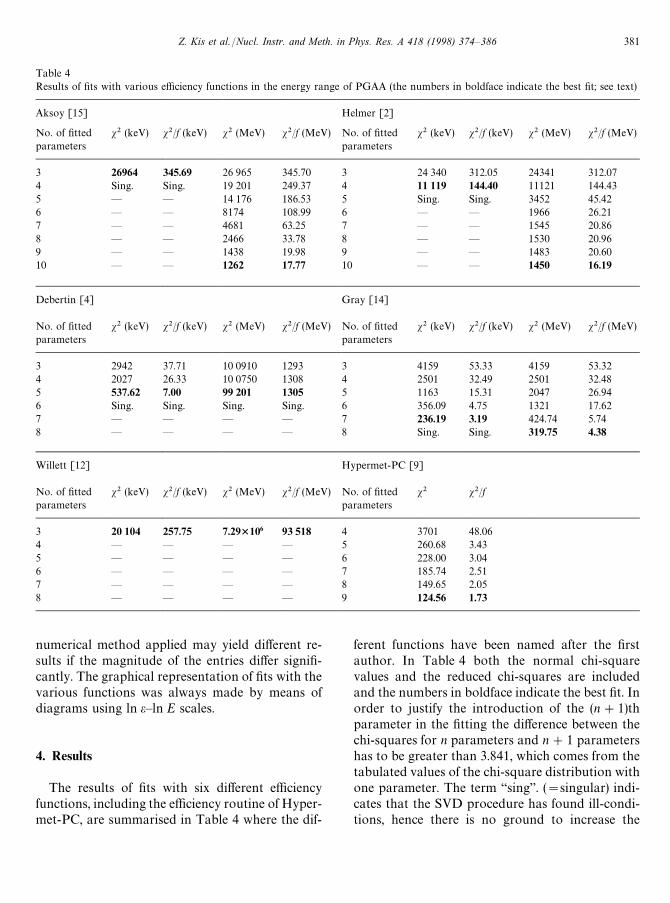
Table 4Results of fits with various efficiency functions in the energy range of PGAA (the numbers in boldface indicate the best fit; see text)
Aksoy [15] Helmer [2]
No. of fittedparameters
s2 (keV) s2/f (keV) s2 (MeV) s2/f (MeV) No. of fittedparameters
s2 (keV) s2/f (keV) s2 (MeV) s2/f (MeV)
3 26964 345.69 26 965 345.70 3 24 340 312.05 24341 312.074 Sing. Sing. 19 201 249.37 4 11 119 144.40 11121 144.435 — — 14 176 186.53 5 Sing. Sing. 3452 45.426 — — 8174 108.99 6 — — 1966 26.217 — — 4681 63.25 7 — — 1545 20.868 — — 2466 33.78 8 — — 1530 20.969 — — 1438 19.98 9 — — 1483 20.6010 — — 1262 17.77 10 — — 1450 16.19
Debertin [4] Gray [14]
No. of fittedparameters
s2 (keV) s2/f (keV) s2 (MeV) s2/f (MeV) No. of fittedparameters
s2 (keV) s2/f (keV) s2 (MeV) s2/f (MeV)
3 2942 37.71 10 0910 1293 3 4159 53.33 4159 53.324 2027 26.33 10 0750 1308 4 2501 32.49 2501 32.485 537.62 7.00 99 201 1305 5 1163 15.31 2047 26.946 Sing. Sing. Sing. Sing. 6 356.09 4.75 1321 17.627 — — — — 7 236.19 3.19 424.74 5.748 — — — — 8 Sing. Sing. 319.75 4.38
Willett [12] Hypermet-PC [9]
No. of fittedparameters
s2 (keV) s2/f (keV) s2 (MeV) s2/f (MeV) No. of fittedparameters
s2 s2/f
3 20 104 257.75 7.293106 93 518 4 3701 48.064 — — — — 5 260.68 3.435 — — — — 6 228.00 3.046 — — — — 7 185.74 2.517 — — — — 8 149.65 2.058 — — — — 9 124.56 1.73
numerical method applied may yield different re-sults if the magnitude of the entries differ signifi-cantly. The graphical representation of fits with thevarious functions was always made by means ofdiagrams using ln e—ln E scales.
4. Results
The results of fits with six different efficiencyfunctions, including the efficiency routine of Hyper-met-PC, are summarised in Table 4 where the dif-
ferent functions have been named after the firstauthor. In Table 4 both the normal chi-squarevalues and the reduced chi-squares are includedand the numbers in boldface indicate the best fit. Inorder to justify the introduction of the (n#1)thparameter in the fitting the difference between thechi-squares for n parameters and n#1 parametershas to be greater than 3.841, which comes from thetabulated values of the chi-square distribution withone parameter. The term “sing”. ("singular) indi-cates that the SVD procedure has found ill-condi-tions, hence there is no ground to increase the
Z. Kis et al. /Nucl. Instr. and Meth. in Phys. Res. A 418 (1998) 374—386 381
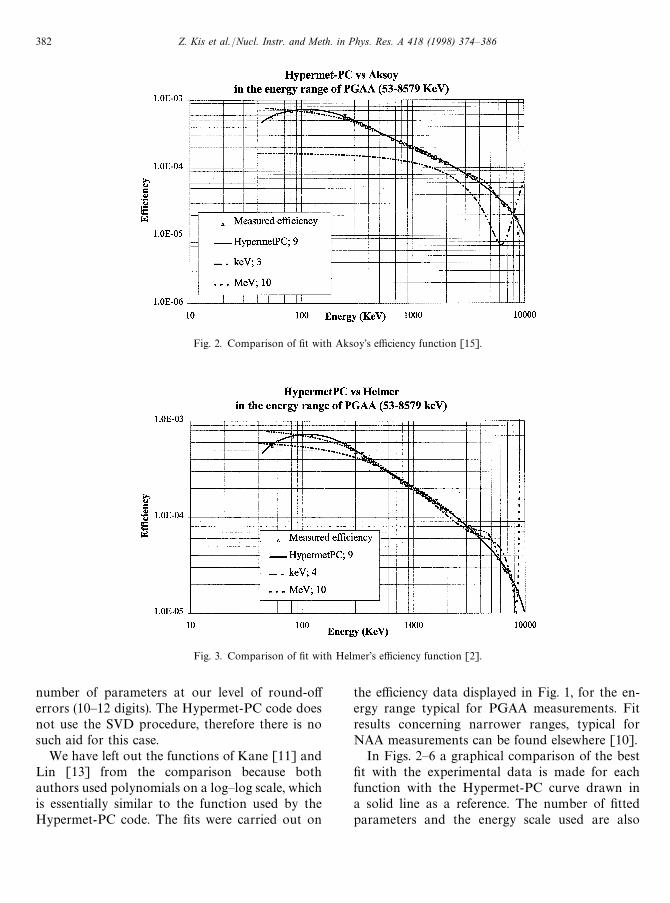
Fig. 2. Comparison of fit with Aksoy’s efficiency function [15].
Fig. 3. Comparison of fit with Helmer’s efficiency function [2].
number of parameters at our level of round-offerrors (10—12 digits). The Hypermet-PC code doesnot use the SVD procedure, therefore there is nosuch aid for this case.
We have left out the functions of Kane [11] andLin [13] from the comparison because bothauthors used polynomials on a log—log scale, whichis essentially similar to the function used by theHypermet-PC code. The fits were carried out on
the efficiency data displayed in Fig. 1, for the en-ergy range typical for PGAA measurements. Fitresults concerning narrower ranges, typical forNAA measurements can be found elsewhere [10].
In Figs. 2—6 a graphical comparison of the bestfit with the experimental data is made for eachfunction with the Hypermet-PC curve drawn ina solid line as a reference. The number of fittedparameters and the energy scale used are also
382 Z. Kis et al. /Nucl. Instr. and Meth. in Phys. Res. A 418 (1998) 374—386
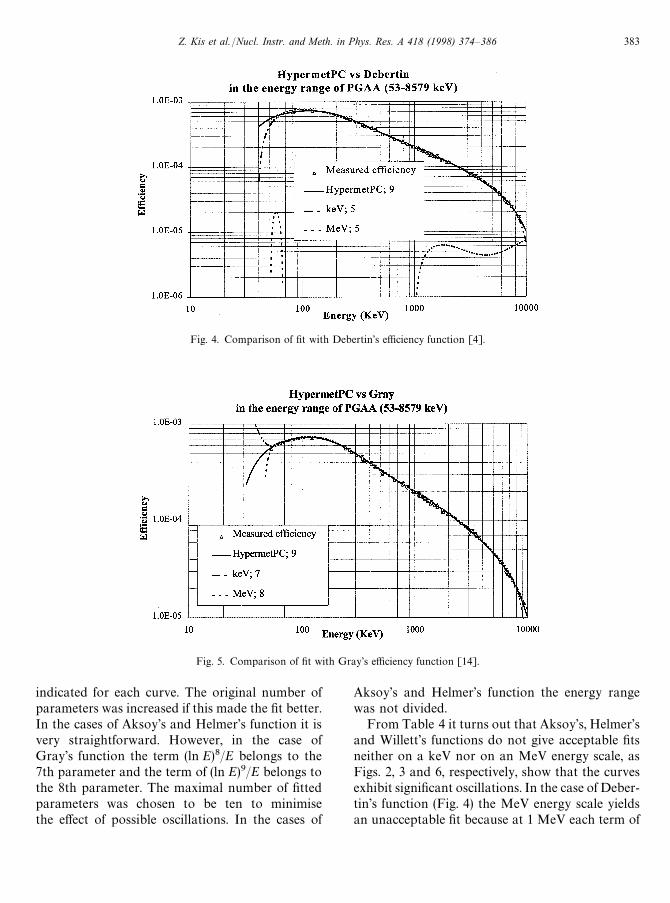
Fig. 4. Comparison of fit with Debertin’s efficiency function [4].
Fig. 5. Comparison of fit with Gray’s efficiency function [14].
indicated for each curve. The original number ofparameters was increased if this made the fit better.In the cases of Aksoy’s and Helmer’s function it isvery straightforward. However, in the case ofGray’s function the term (ln E)8/E belongs to the7th parameter and the term of (ln E)9/E belongs tothe 8th parameter. The maximal number of fittedparameters was chosen to be ten to minimisethe effect of possible oscillations. In the cases of
Aksoy’s and Helmer’s function the energy rangewas not divided.
From Table 4 it turns out that Aksoy’s, Helmer’sand Willett’s functions do not give acceptable fitsneither on a keV nor on an MeV energy scale, asFigs. 2, 3 and 6, respectively, show that the curvesexhibit significant oscillations. In the case of Deber-tin’s function (Fig. 4) the MeV energy scale yieldsan unacceptable fit because at 1 MeV each term of
Z. Kis et al. /Nucl. Instr. and Meth. in Phys. Res. A 418 (1998) 374—386 383
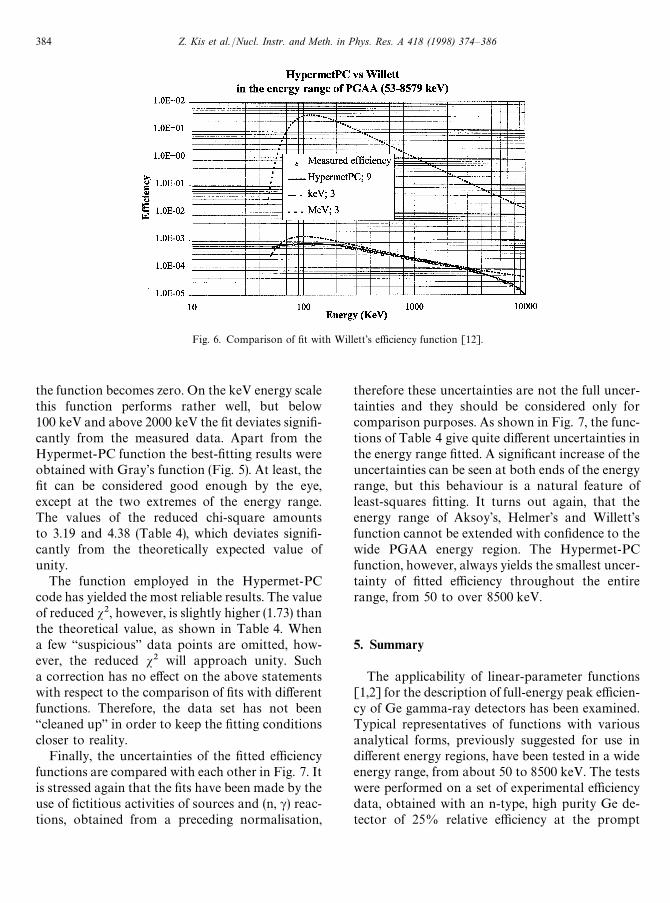
Fig. 6. Comparison of fit with Willett’s efficiency function [12].
the function becomes zero. On the keV energy scalethis function performs rather well, but below100 keV and above 2000 keV the fit deviates signifi-cantly from the measured data. Apart from theHypermet-PC function the best-fitting results wereobtained with Gray’s function (Fig. 5). At least, thefit can be considered good enough by the eye,except at the two extremes of the energy range.The values of the reduced chi-square amountsto 3.19 and 4.38 (Table 4), which deviates signifi-cantly from the theoretically expected value ofunity.
The function employed in the Hypermet-PCcode has yielded the most reliable results. The valueof reduced s2, however, is slightly higher (1.73) thanthe theoretical value, as shown in Table 4. Whena few “suspicious” data points are omitted, how-ever, the reduced s2 will approach unity. Sucha correction has no effect on the above statementswith respect to the comparison of fits with differentfunctions. Therefore, the data set has not been“cleaned up” in order to keep the fitting conditionscloser to reality.
Finally, the uncertainties of the fitted efficiencyfunctions are compared with each other in Fig. 7. Itis stressed again that the fits have been made by theuse of fictitious activities of sources and (n, c) reac-tions, obtained from a preceding normalisation,
therefore these uncertainties are not the full uncer-tainties and they should be considered only forcomparison purposes. As shown in Fig. 7, the func-tions of Table 4 give quite different uncertainties inthe energy range fitted. A significant increase of theuncertainties can be seen at both ends of the energyrange, but this behaviour is a natural feature ofleast-squares fitting. It turns out again, that theenergy range of Aksoy’s, Helmer’s and Willett’sfunction cannot be extended with confidence to thewide PGAA energy region. The Hypermet-PCfunction, however, always yields the smallest uncer-tainty of fitted efficiency throughout the entirerange, from 50 to over 8500 keV.
5. Summary
The applicability of linear-parameter functions[1,2] for the description of full-energy peak efficien-cy of Ge gamma-ray detectors has been examined.Typical representatives of functions with variousanalytical forms, previously suggested for use indifferent energy regions, have been tested in a wideenergy range, from about 50 to 8500 keV. The testswere performed on a set of experimental efficiencydata, obtained with an n-type, high purity Ge de-tector of 25% relative efficiency at the prompt
384 Z. Kis et al. /Nucl. Instr. and Meth. in Phys. Res. A 418 (1998) 374—386
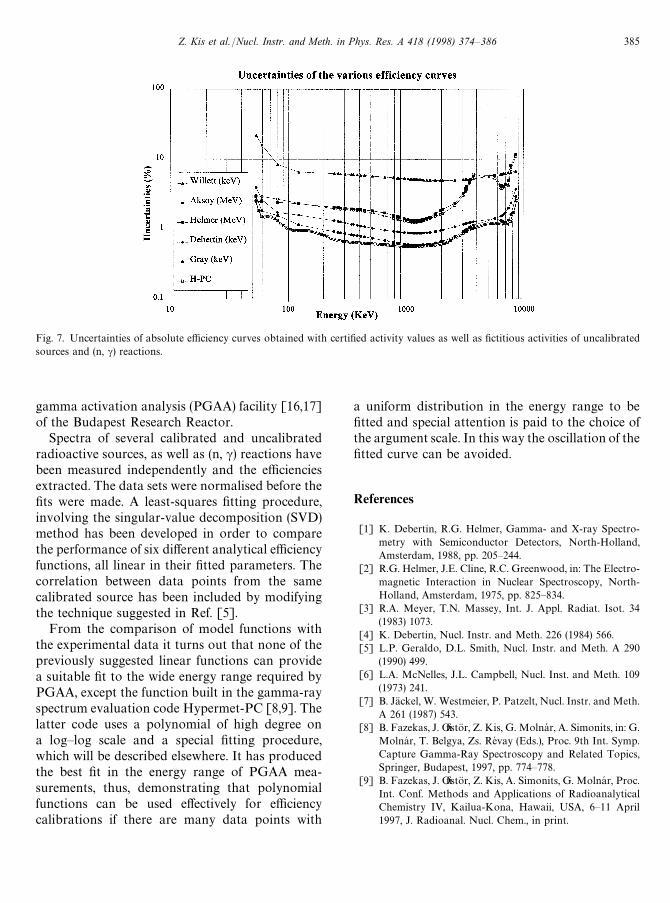
Fig. 7. Uncertainties of absolute efficiency curves obtained with certified activity values as well as fictitious activities of uncalibratedsources and (n, c) reactions.
gamma activation analysis (PGAA) facility [16,17]of the Budapest Research Reactor.
Spectra of several calibrated and uncalibratedradioactive sources, as well as (n, c) reactions havebeen measured independently and the efficienciesextracted. The data sets were normalised before thefits were made. A least-squares fitting procedure,involving the singular-value decomposition (SVD)method has been developed in order to comparethe performance of six different analytical efficiencyfunctions, all linear in their fitted parameters. Thecorrelation between data points from the samecalibrated source has been included by modifyingthe technique suggested in Ref. [5].
From the comparison of model functions withthe experimental data it turns out that none of thepreviously suggested linear functions can providea suitable fit to the wide energy range required byPGAA, except the function built in the gamma-rayspectrum evaluation code Hypermet-PC [8,9]. Thelatter code uses a polynomial of high degree ona log—log scale and a special fitting procedure,which will be described elsewhere. It has producedthe best fit in the energy range of PGAA mea-surements, thus, demonstrating that polynomialfunctions can be used effectively for efficiencycalibrations if there are many data points with
a uniform distribution in the energy range to befitted and special attention is paid to the choice ofthe argument scale. In this way the oscillation of thefitted curve can be avoided.
References
[1] K. Debertin, R.G. Helmer, Gamma- and X-ray Spectro-metry with Semiconductor Detectors, North-Holland,Amsterdam, 1988, pp. 205—244.
[2] R.G. Helmer, J.E. Cline, R.C. Greenwood, in: The Electro-magnetic Interaction in Nuclear Spectroscopy, North-Holland, Amsterdam, 1975, pp. 825—834.
[3] R.A. Meyer, T.N. Massey, Int. J. Appl. Radiat. Isot. 34(1983) 1073.
[4] K. Debertin, Nucl. Instr. and Meth. 226 (1984) 566.[5] L.P. Geraldo, D.L. Smith, Nucl. Instr. and Meth. A 290
(1990) 499.[6] L.A. McNelles, J.L. Campbell, Nucl. Inst. and Meth. 109
(1973) 241.[7] B. Jackel, W. Westmeier, P. Patzelt, Nucl. Instr. and Meth.
A 261 (1987) 543.[8] B. Fazekas, J. O® stor, Z. Kis, G. Molnar, A. Simonits, in: G.
Molnar, T. Belgya, Zs. Revay (Eds.), Proc. 9th Int. Symp.Capture Gamma-Ray Spectroscopy and Related Topics,Springer, Budapest, 1997, pp. 774—778.
[9] B. Fazekas, J. O® stor, Z. Kis, A. Simonits, G. Molnar, Proc.Int. Conf. Methods and Applications of RadioanalyticalChemistry IV, Kailua-Kona, Hawaii, USA, 6—11 April1997, J. Radioanal. Nucl. Chem., in print.
Z. Kis et al. /Nucl. Instr. and Meth. in Phys. Res. A 418 (1998) 374—386 385
[10] Z. Kis, Ph.D. Thesis, Department of Physics, University ofVeszprem, 1997, in Hungarian.
[11] W.R. Kane, M.A. Mariscotti, Nucl. Instr. and Meth. 56(1967) 189.
[12] J.B. Willett, Nucl. Instr. and Meth. 84 (1970) 157.[13] J. Lin, E. Henry, R.A. Meyer, Lawrence Livermore Na-
tional Laboratory Report UCLR-84536, 1980.[14] P.W. Gray, A. Ahmad, Nucl. Instr. and Meth. A 237 (1985)
577.[15] A. Aksoy, J. Radioanal. Nucl. Chem. 169 (1993) 463.[16] G. Molnar, T. Belgya, L. Dabolczi, B. Fazekas, Zs. Revay,
A. Veres, I. Bikit, Z. Kis, J. O® stor, J. Radioanal. Nucl.Chem. 215 (1997) 111.
[17] T. Belgya, Zs. Revay, B. Fazekas, I. Hejja, L. Dabolczi, G.L. Molnar, Z. Kis, J. O® stor, Gy. Kaszas, in: G. Molnar, T.Belgya, Zs. Revay (Eds.), Proc. 9th Int. Symp. on CaptureGamma-Ray Spectroscopy and Related Topics, Springer,Budapest, 1997, pp. 826—837.
[18] X-ray and gamma-ray standards for detector calibration,IAEA-TECDOC-619, International Atomic EnergyAgency, Vienna, 1991.
[19] J.F.A.G. Ruyl, P.M. Endt, Nucl. Phys. A 407 (1983) 60.[20] T.W. Burrows, Nucl. Data Sheets 76 (1995) 191.[21] G.E. Forsythe, M.A. Malcolm, C.B. Moler, Computer
Methods for Mathematical Computations, Prentice-Hall,Englewood Cliffs, NJ, 1977.
386 Z. Kis et al. /Nucl. Instr. and Meth. in Phys. Res. A 418 (1998) 374—386