comparing requirements prioritization methods in industry: a study
TRANSCRIPT

Comparing Requirements Prioritization Methods in Industry:
A study of the Effectiveness of the Ranking Method, the Binary
Search Tree Method and the Wiegers Matrix
Thesis v1.0
Todor Kyosev (3621618)
2 | P a g e
Thesis information
Author Todor Kyosev
Student N. 3621618
Contact information
e-mail: [email protected]
Master Program Business Informatics
Title Comparing Requirements Prioritization Methods in Industry: A
study of the Effectiveness of the Ranking Method, the Binary
Search Tree Method and the Wiegers Matrix
Start date 23.09.2012
End date 15.08.2014
Internship Company Negometrix BV
First supervisor dr. Slinger Jansen
Second supervisor Prof. dr. Sjaak Brinkkemper
Company supervisor MSc. Jan Siderius
3 | P a g e
Table of Contents
Thesis information ...................................................................................................................... 2
Table of Contents ....................................................................................................................... 3
List of Figures .............................................................................................................................. 6
List of Tables ............................................................................................................................... 7
Abstract ...................................................................................................................................... 8
Preface ........................................................................................................................................ 9
1. Introduction ...................................................................................................................... 10
2. Problem Statement .......................................................................................................... 11
3. Research Triggers and Problem Definitions ..................................................................... 12
3.1. Scientific Triggers ....................................................................................................... 12
3.2. Business Triggers ....................................................................................................... 12
4. Research question ............................................................................................................ 14
5. Research Approach .......................................................................................................... 16
5.1. Research Design ......................................................................................................... 16
5.2. Experiment Process ................................................................................................... 17
5.3. Scope and limitations ................................................................................................ 19
5.4. Research Approach Comparison ............................................................................... 20
5.5. Experiment Planning .................................................................................................. 23
5.5.1. Context Selection ............................................................................................... 24
5.5.2. Hypothesis formulation ...................................................................................... 25
5.5.3. Variables Selection ............................................................................................. 25
4 | P a g e
5.5.4. Selection of test subjects ................................................................................... 27
5.5.5. Design Type ........................................................................................................ 27
5.5.6. Instrumentation ................................................................................................. 29
5.5.7. Validity Evaluation .............................................................................................. 31
5.6. Operation ................................................................................................................... 33
5.6.1. Preparation ......................................................................................................... 33
5.6.2. Execution ............................................................................................................ 35
5.6.3. Data Validation ................................................................................................... 41
6. Analysis and Interpretation .............................................................................................. 43
6.1. Descriptive Statistics .................................................................................................. 43
6.2. Data Set Reduction .................................................................................................... 44
6.3. Hypothesis testing ..................................................................................................... 45
7. Prioritization Methods ..................................................................................................... 46
7.1. Prioritization Methods Description ........................................................................... 46
7.1.1. Process deliverable diagrams ............................................................................. 46
7.1.2. Methods Description .......................................................................................... 50
7.2. Prioritization methods classification ......................................................................... 56
7.3. Selection of experiment methods ............................................................................. 59
8. Results Analysis ................................................................................................................ 61
8.1. Prioritization Effort .................................................................................................... 61
8.2. Ease of Use ................................................................................................................. 74
8.3. Reliability of the results ............................................................................................. 77
5 | P a g e
8.4. Fault tolerance ........................................................................................................... 79
8.5. Additional findings ..................................................................................................... 80
8.5.1. The ranking prioritization method gives urgency to the currently prioritized
requirements .................................................................................................................... 80
8.5.2. Tools does matter............................................................................................... 81
8.5.3. If there is a bottleneck in development prioritization might not be that
important.......................................................................................................................... 81
9. Discussion and future research ........................................................................................ 83
10. References ..................................................................................................................... 90
6 | P a g e
List of Figures
Figure 1 Overview of the experiment Process ......................................................................... 17
Figure 2 Planning Phase Overview ........................................................................................... 24
Figure 3 Steps in Experiment Operation .................................................................................. 33
Figure 4 Analisis and Interpretation ........................................................................................ 43
Figure 5 Activities example ...................................................................................................... 47
Figure 6 Transitions Example .................................................................................................. 48
Figure 7 Conditional Transitions and Roles Example .............................................................. 49
Figure 8 Concepts Example ...................................................................................................... 50
Figure 9 Generalization Example .............................................................................................. 50
Figure 10 Binary search tree Pdd ............................................................................................. 52
Figure 11 Ranking Time consumption Scatter Plot ................................................................. 62
Figure 12 Ranking Histogram .................................................................................................. 64
Figure 13 Wiegers matrix time consumption scatter plot ...................................................... 65
Figure 14 Wiegers Matrix Histogram ...................................................................................... 66
Figure 15 Wiegers Matrix Histogram (Reduced Dataset) ....................................................... 67
Figure 16 Binary Search Tree TIME consumption scatter plot ................................................ 68
Figure 17 Binary Search Tree Histogram ................................................................................. 69
Figure 18 Binary Search Tree descriptive statistics (reduced dataset) ................................... 71
7 | P a g e
List of Tables
Table 1. Goal definition framework ......................................................................................... 19
Table 2 Current Research Drawbacks ...................................................................................... 21
Table 3 Research Comparison .................................................................................................. 22
Table 4 Example of assigning treatments to the Subjects ....................................................... 28
Table 5 Order of A prioritization Method ................................................................................ 28
Table 6 Minutes Entry Template .............................................................................................. 31
Table 7 Binary Search tree activities table ............................................................................... 53
Table 8 Classification of requirements prioritization methods based on (Herrmann & Daneva,
2008) ......................................................................................................................................... 58
Table 9 Prioritization Methods’ descriptive statistics .............................................................. 63
Table 10 Wiegers Matrix descriptive statistics (Reduced Dataset) .......................................... 67
8 | P a g e
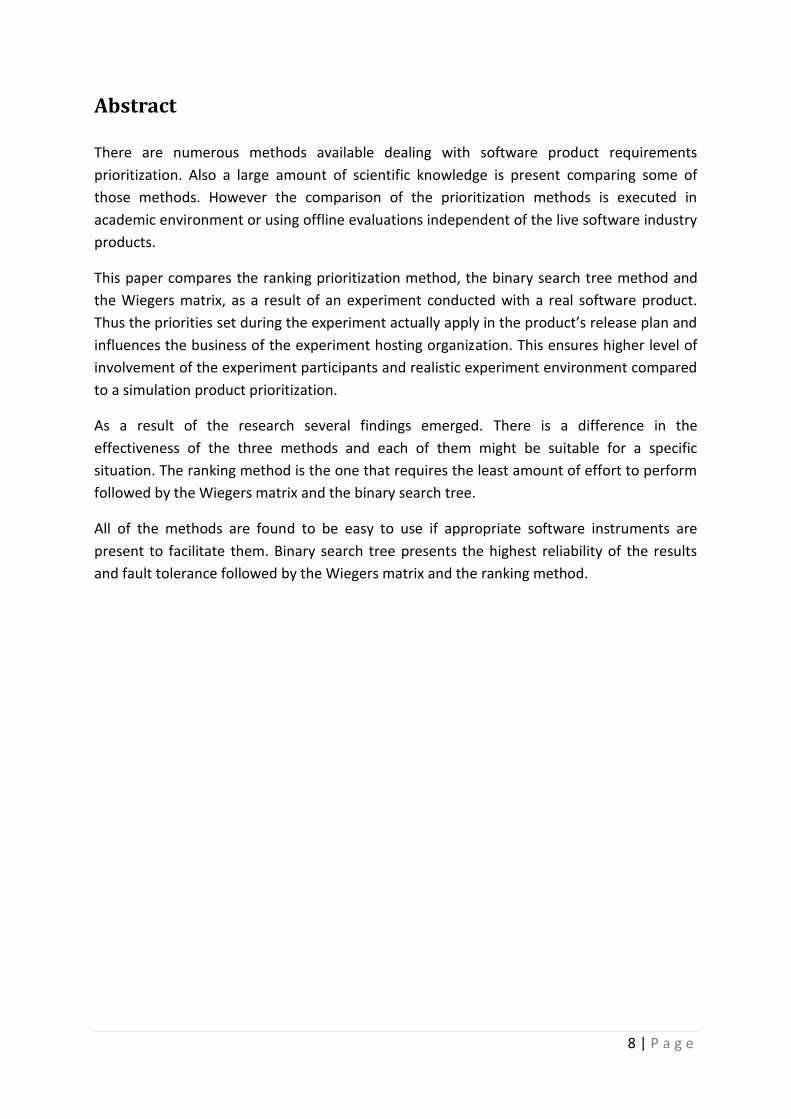
Abstract
There are numerous methods available dealing with software product requirements
prioritization. Also a large amount of scientific knowledge is present comparing some of
those methods. However the comparison of the prioritization methods is executed in
academic environment or using offline evaluations independent of the live software industry
products.
This paper compares the ranking prioritization method, the binary search tree method and
the Wiegers matrix, as a result of an experiment conducted with a real software product.
Thus the priorities set during the experiment actually apply in the product’s release plan and
influences the business of the experiment hosting organization. This ensures higher level of
involvement of the experiment participants and realistic experiment environment compared
to a simulation product prioritization.
As a result of the research several findings emerged. There is a difference in the
effectiveness of the three methods and each of them might be suitable for a specific
situation. The ranking method is the one that requires the least amount of effort to perform
followed by the Wiegers matrix and the binary search tree.
All of the methods are found to be easy to use if appropriate software instruments are
present to facilitate them. Binary search tree presents the highest reliability of the results
and fault tolerance followed by the Wiegers matrix and the ranking method.
9 | P a g e
Preface
I wrote this thesis as part of my Masters program of Business Informatics at Utrecht University, the Netherlands. I choose the subject because of my interest in software product management and requirements management in particular.
This thesis is written as a part of my Master program of Business Informatics at Utrecht University. The research was carried out at Negometrix, a Dutch company, which is specialized in development of software products for professional purchasing.
I would like to express my gratitude to all these who helped me go throughout the whole process of creating this thesis. I am truly thankful to my first supervisor dr. Slinger Jansen who guided me during the entire research project, supported me with his expert knowledge and showed great patience and understanding. His feedback and advises were extremely influential and played significant role in my thesis. Furthermore, I would like to thank prof. dr. S. Brinkkemper for reviewing my work and providing me with his insight.
I am very grateful to the whole team of Negometrix for making me feel welcome and giving me the opportunity to conduct my research. Special thanks to Jan Siderius, Matthieu Hoogerwerf, Atanas Koev and Mariela Hristova for sharing their knowledge and experience with me. I also want to thank them for the time and effort put during the operation phase of the experiment.
Last but not least, I would like to thank my family and friends for the support and understanding I got while working on this thesis.
Todor Kyosev August 2014
Utrecht, the Netherlands
10 | P a g e
1. Introduction
Software product management is a dynamic field, involving a multidisciplinary set of
activities. They vary from low level operational tasks such as translating market
requirements into product ones to taking strategic decisions. Each task is also related to
communication with a large variety of stakeholders, which demands specific approach and
processing different input. The information stakeholders provide vary in its format and
significance. It is a project managers’ responsibility to deal with this information in order to
complete their duties successfully.
The set of implemented requirements is what defines a software product. Thus the choice of
requirements to be implemented impacts the overall success of the product (Ebert, 2007).
According to Bekkers, Weerd, Spruit, & Brinkkemper (2010) “release planning covers the
software product management capabilities needed to successfully create and launch a
release”. An organization can benefit from a well-established release planning, because it
can be used as both a guideline for the development and as an assisting tool to measure the
productivity of the organization.
Often a large number of requirements are gathered for a product, which means that usually
it is not possible to implement all of them at once. To cope with that problem a product
manager has to prioritize the requirements in a way that the most significant ones are
implemented earlier than the other (Siddiqi & Shekaran, 1996).
With increase in number of requirements it becomes more difficult to set appropriate
priority for each of them. When the number of requirements is low it is easy to compare
each individual one against the others and to determine the advantages and drawbacks of its
implementation. When the requirements become more this process may become extremely
labor intensive or even impossible.
Additional problem is that when dealing with a large number of requirements, decision
makers are not able to comprehend all requirements at once. Thus priority might be set
against a limited set of comprehended requirements.
The prioritization is additionally complicated by the requirements’ different aspects which
makes them not easily comparable. A project manager needs to take numerous decisions
regarding available resources, conflicting stakeholders’ opinions, market opportunities, risk,
costs and etc. Comparison on individual aspects of a requirement makes the process easy.
For example it is easier to compare two requirements based on the perceived benefit their
implementation would bring, however the more beneficial one may require significant
11 | P a g e
additional effort for its implementation, or it may not be in liaison with the long term
strategy of the product.
To deal with the complexity of the requirements prioritization a large number of
prioritization methods are proposed and used in practice (Berander & Andrews, 4
Requirements Prioritization, 2005). The prioritization method used during the prioritization
process unquestionably has impact on the process performance. Because of that the choice
of a prioritization method has to be done in an informed manner.
2. Problem Statement
Few empirical validations of the different prioritization techniques are present
nowadays (Berander & Andrews, 4 Requirements Prioritization, 2005). There are studies
doing that for example Karlsson et al. (1998), Karlsson, Berander, Regnell, & Wohlin (2004)
however they perform offline evaluation independent from a software industry projects. In
addition the number of requirements in the simulation projects studied in the cited sources
is low, which does not provide any evidence for the performance of the studied techniques
in larger scale environment. As a result the following problem rises.
There are insufficient industrial evaluations of requirement prioritization methods
available. This leads to difficulties in organizing the prioritization process at the
software companies in an effective way, forcing the companies to either rely on
experience or perform internal investigation of the problem. That makes the
prioritization process less reliable and more time consuming thus influencing the overall
software product’s quality.
12 | P a g e
3. Research Triggers and Problem Definitions
Despite the solid body of scientific literature and the numerous prioritization techniques
available nowadays, there are studies that show that requirements prioritization is still an
area of improvement (Lehtola, Kauppinen, & Kujala, 2004), (Cheng & Atlee, 2007), (Damian,
1999).
Requirements prioritization is still ambiguous and executed in informal manner (Lehtola,
Kauppinen, & Kujala, 2004). It requires complex decisions making based on large variety of
factors that have effect on the priority of the requirements. In addition it is hard to
aggregate the view of the different stakeholders involved in the prioritization process.
3.1. Scientific Triggers
There is a significant set of performed research on requirements engineering and
requirements prioritization. However a surprisingly large amount of research problems arise
when that knowledge is incorporated into practice (Cheng & Atlee, 2007).
Berander, Khan, & Lehtola (2006) observe that there is little knowledge present in
requirements prioritization area on choosing specific approach over other in a specific
context. Because of that research comparing different prioritization methods in an industry
setting can contribute to the body of science.
3.2. Business Triggers
When a company is developing custom software for a specific client or a small number of
customers the requirements prioritization process is relatively simple. Basically the decision
what is to be developed and its priority depends on the client that ordered the software. The
development organization is involved with consultancy and evaluation related tasks.
However, in a product oriented software development environment the prioritization
process may become extremely complicated. The development organization is responsible
for the product and its financial success. Often the resources for the product
implementation are limited and it may be impossible to implement all of the product
requirements. Additionally it might be a complicated task to decide which of two
requirements has higher importance, because implementation of each requirement may
result to a large variety of product characteristics. Such characteristics may be different by
nature and hardly comparable. For example it may be hard to evaluate whether it is better
13 | P a g e
to implement requirement that would bring immediate profit, or another one which may
eliminate present risk factor in a product without additional analysis and considerations.
Prioritization methods are designed to deal with the complexity and to facilitate the
prioritization process. Each method provides specific value to the product managers and
usually is related to certain disadvantages. Since there is no silver bullet in prioritization,
software product development organizations have to decide a way they will deal with the
prioritization internally. There is insufficient number of empirical validations present
nowadays Berander et al. (2005). Because of that additional investigation of the problem
would be beneficial for the industry.
14 | P a g e
4. Research question
There are multiple triggers that drive the need for the present research, which are already
elaborated on in the previous chapter. To guide the present research the following research
question is defined:
What is the impact of the ranking method, the binary search tree method
and Wiegers matrix on the effectiveness of the prioritization process?
In order to answer the main research question an elaboration on the following research sub
questions is required.
SQ 1: What determines the effectiveness of a prioritization method?
In order to determine which prioritization method is most suitable in a certain scenario, first
it should be defined what affects the effectiveness of the prioritization. The answer of that
question gives a researcher the variables he/she should measure to be able to compare
different methods. The definition of effectiveness enables the practitioners to understand
the result and to be able to pick a method suitable for their needs based on the
effectiveness most appropriate in the context for their organization. For example a method
could be performed extremely fast, but it could neglect the depth of analysis regarding some
of the requirements characteristics. Such method could be beneficial for agile organizations
which rely on short time to market and quick customers’ feedback. However in organizations
with longer release cycles possible mistake made early in the product lifecycle could be
harder to overcome in the long run. So in those cases methods with deeper analysis and
more reliable results may be preferable over less time consuming ones. The answer of this
sub question emerges in the research approach chapter and it is closely related to the way
the present research is conducted.
SQ 2: What are the situational factors that determine the effectiveness of a
prioritization technique?
Once what determines effectiveness of a prioritization method is defined, the question how
this effectiveness is perceived in different scenarios emerges. It is possible that a certain
method may suit the needs of an organization or one of its products, but it can be
inappropriate for different organization or product. The answer of this research sub question
should elaborate on how the characteristics of a method that determine its effectiveness
liaise with the situational factors in a software product organization.
SQ 3: How can prioritization methods be compared in an industrial setting?
A distinctive feature of this research is that it compares prioritization methods in an
industrial setting. This means that the requirements being prioritized during the research
experiment are actual requirements of a real product. The priority set during the experiment

15 | P a g e
affects the actual priority of the requirements implemented in the product. This leads to
number of problems that needs to be solved.
The experiment should involve the whole team responsible for requirements prioritization in
an organization in order fully resemble an industrial setting. All of the prioritization methods
studied in the present research should be executed on identical sets of requirements during
each experiment prioritization session. Those two limitations lead to large amount of effort
required for conduction of the experiment.
To solve such problems an appropriate answer to the third research sub question should be
found during the design of the research and the experiment design phases.
16 | P a g e
5. Research Approach
This chapter describes the research design and the way the research is conducted. A focus is
set on the theory of experimentation and how this theory is applied into the present
research.
5.1. Research Design
In order to answer the research question and its sub questions the research is executed in
three main phases.
The first one studies the prioritization techniques available and tries to identify which are
the most suitable ones for the context of the research. This phase is executed entirely by
literature research. In order to identify the candidate techniques scientific sources are
consulted. The sources are identified by scientific search engines such as Google Scholar and
CiteSeerX. Additional papers present in the references of the studies identified by search
engines are also studied.
Racheva, Daneva, & Buglione, (2008) conclude that requirements prioritization techniques
can be divided into two categories small scale techniques and medium or large scale
techniques. To be able to meet the requirements of the context (1000 to 10000 candidate
requirements and middle size company) the candidate techniques are limited to medium to
large scale techniques only. The rest of the requirements are further studied which limits the
focus of the present research to ranking, binary search tree and Wiegers’ matrix.
The second phase’s emphasis is on the situational factors that determine the suitability of a
requirements prioritization technique. This phase is executed by both literature study and
formal interviews. The aim of the literature research is to define the characteristics that
affect the effectiveness of a technique. The interviews are conducted with experts in the
field and focus to determine what their effect on the effectiveness of the process is.
In order to evaluate and compare the three techniques a formal experiment is performed.
The techniques are explained to each of the participants in the prioritization meetings. The
set of data examined are actual requirements in a live project. There are three experiment
sessions performed with duration about three hours. During those sessions analysis of the
requirements is performed and each of the evaluated techniques is used in order to
prioritize the requirements. The order of the used techniques is different in each of the
sessions, thus each of them is executed once as first one once as second and once last.
17 | P a g e
The experiment is examined during its conduction and minutes are written. After the
experiment separate interview is conducted with each of the stakeholders taking part in the
prioritization meeting.
5.2. Experiment Process
To perform an experiment a set of steps need to be executed in a certain order. Thus, a
process defining how the experiment is performed is needed.
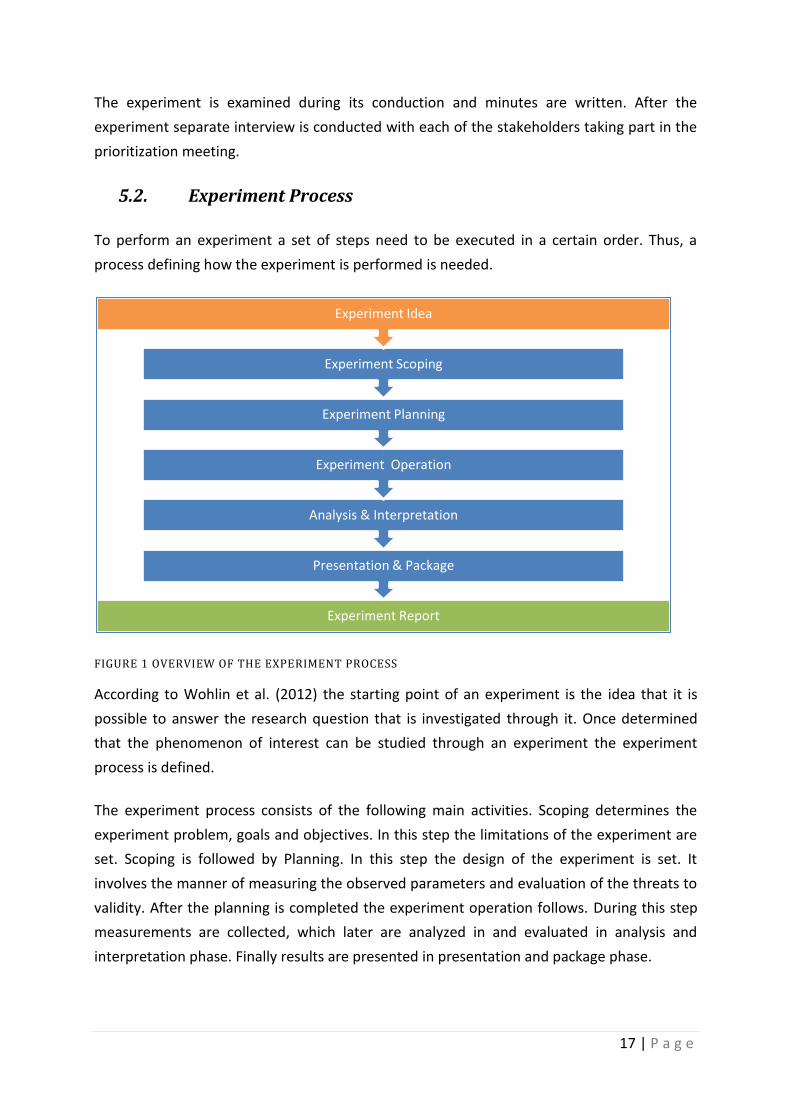
FIGURE 1 OVERVIEW OF THE EXPERIMENT PROCESS
According to Wohlin et al. (2012) the starting point of an experiment is the idea that it is
possible to answer the research question that is investigated through it. Once determined
that the phenomenon of interest can be studied through an experiment the experiment
process is defined.
The experiment process consists of the following main activities. Scoping determines the
experiment problem, goals and objectives. In this step the limitations of the experiment are
set. Scoping is followed by Planning. In this step the design of the experiment is set. It
involves the manner of measuring the observed parameters and evaluation of the threats to
validity. After the planning is completed the experiment operation follows. During this step
measurements are collected, which later are analyzed in and evaluated in analysis and
interpretation phase. Finally results are presented in presentation and package phase.
Experiment Report
Presentation & Package
Analysis & Interpretation
Experiment Operation
Experiment Planning
Experiment Scoping
Experiment Idea
18 | P a g e
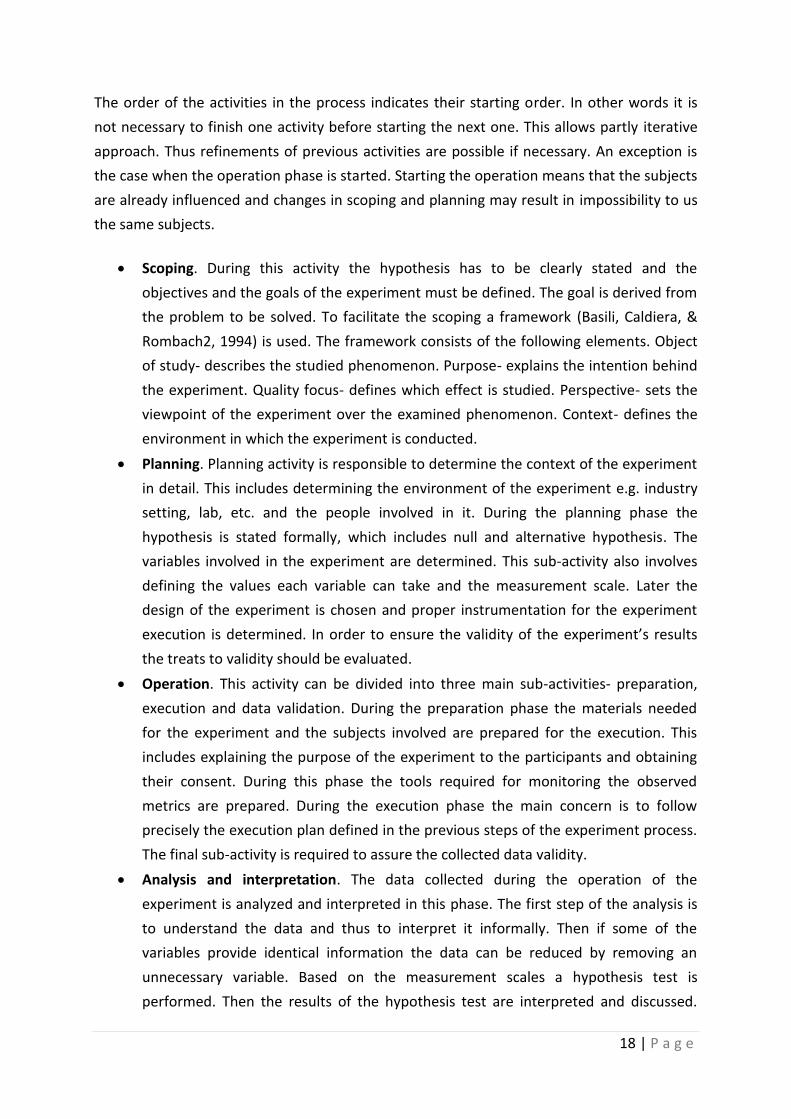
The order of the activities in the process indicates their starting order. In other words it is
not necessary to finish one activity before starting the next one. This allows partly iterative
approach. Thus refinements of previous activities are possible if necessary. An exception is
the case when the operation phase is started. Starting the operation means that the subjects
are already influenced and changes in scoping and planning may result in impossibility to us
the same subjects.
Scoping. During this activity the hypothesis has to be clearly stated and the
objectives and the goals of the experiment must be defined. The goal is derived from
the problem to be solved. To facilitate the scoping a framework (Basili, Caldiera, &
Rombach2, 1994) is used. The framework consists of the following elements. Object
of study- describes the studied phenomenon. Purpose- explains the intention behind
the experiment. Quality focus- defines which effect is studied. Perspective- sets the
viewpoint of the experiment over the examined phenomenon. Context- defines the
environment in which the experiment is conducted.
Planning. Planning activity is responsible to determine the context of the experiment
in detail. This includes determining the environment of the experiment e.g. industry
setting, lab, etc. and the people involved in it. During the planning phase the
hypothesis is stated formally, which includes null and alternative hypothesis. The
variables involved in the experiment are determined. This sub-activity also involves
defining the values each variable can take and the measurement scale. Later the
design of the experiment is chosen and proper instrumentation for the experiment
execution is determined. In order to ensure the validity of the experiment’s results
the treats to validity should be evaluated.
Operation. This activity can be divided into three main sub-activities- preparation,
execution and data validation. During the preparation phase the materials needed
for the experiment and the subjects involved are prepared for the execution. This
includes explaining the purpose of the experiment to the participants and obtaining
their consent. During this phase the tools required for monitoring the observed
metrics are prepared. During the execution phase the main concern is to follow
precisely the execution plan defined in the previous steps of the experiment process.
The final sub-activity is required to assure the collected data validity.
Analysis and interpretation. The data collected during the operation of the
experiment is analyzed and interpreted in this phase. The first step of the analysis is
to understand the data and thus to interpret it informally. Then if some of the
variables provide identical information the data can be reduced by removing an
unnecessary variable. Based on the measurement scales a hypothesis test is
performed. Then the results of the hypothesis test are interpreted and discussed.
19 | P a g e
That leads to the research conclusion and the motivation for further research in the
field.
Presentation and package. This activity is involved in communicating the findings.
This includes documentation of the results, done by research paper, publication or a
report. It is responsible for preserving and sharing the lessons learned from the
experiment, providing discussion and ideas for further investigation. Furthermore
replication of the experiment should be facilitated.
Once the steps of the experiment process are identified, the appropriate effort is required
for their completion. The following chapters elaborate on how the experiment process is
designed and executed in the present research.
5.3. Scope and limitations
Conduction of research is an activity, which involves a large amount of effort (Wohlin C. ,
Runeson, Höst, Ohlsson, Regnell, & Wesslén, 2012). To assure experiment’s feasibility it is
important to specify its foundations properly. This is done in the scoping phase of the
research described in the following chapter.
The purpose of the scope of the research is to define its goals in align with an experiment
framework. The definition of the scope of the present research follows the Goal Question
Metric Approach (GQM) (Basili, Caldiera, & Rombach2, 1994). The goal definition framework
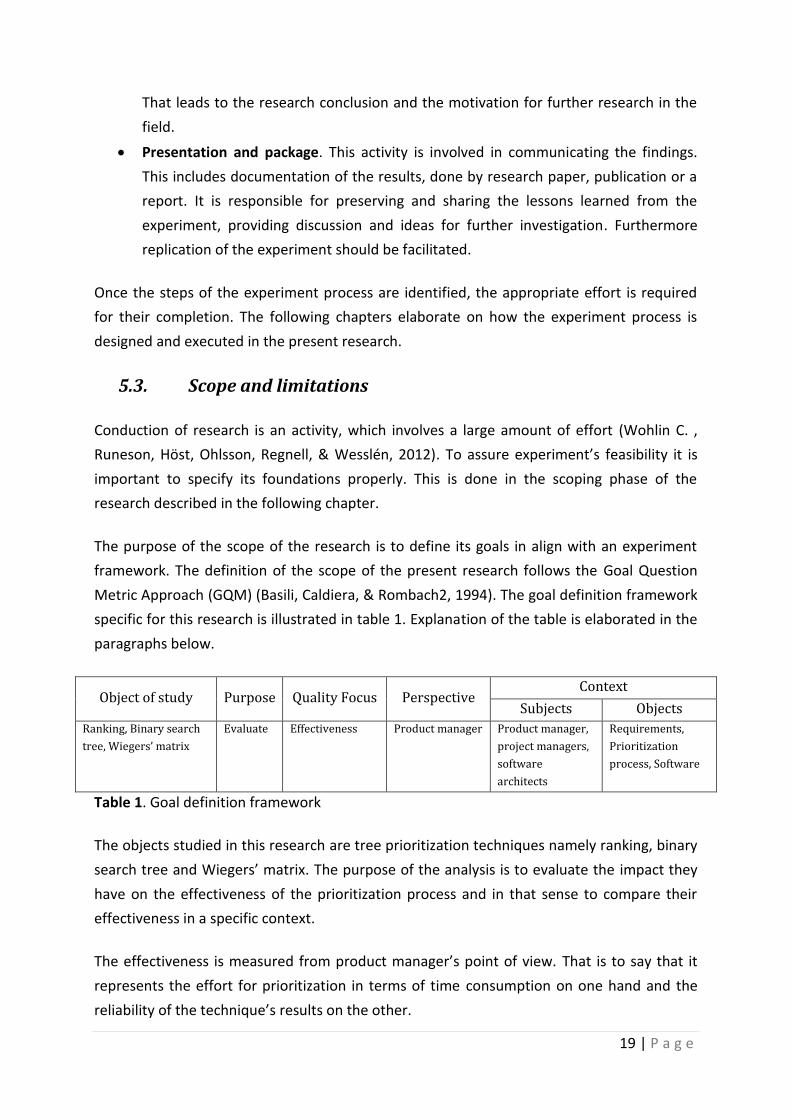
specific for this research is illustrated in table 1. Explanation of the table is elaborated in the
paragraphs below.
Object of study Purpose Quality Focus Perspective Context
Subjects Objects
Ranking, Binary search
tree, Wiegers’ matrix
Evaluate Effectiveness Product manager Product manager,
project managers,
software
architects
Requirements,
Prioritization
process, Software
Table 1. Goal definition framework
The objects studied in this research are tree prioritization techniques namely ranking, binary
search tree and Wiegers’ matrix. The purpose of the analysis is to evaluate the impact they
have on the effectiveness of the prioritization process and in that sense to compare their
effectiveness in a specific context.
The effectiveness is measured from product manager’s point of view. That is to say that it
represents the effort for prioritization in terms of time consumption on one hand and the
reliability of the technique’s results on the other.
20 | P a g e
The context the present research scopes consists of objects and subject. A subject of the
research is the product manager, project manager and software system architect involved in
the prioritization process. The objects that are taken into consideration are the
requirements, the prioritization process and the software product the examined
organizations are developing.
This research is limited to product managers responsible for medium sized teams within the
range of 20 up to 100 employees. The target product managers have multidisciplinary
responsibilities, which mean that they are also carry out additional tasks not directly related
to the product manager’s responsibilities. As an example of such scenario is a product
manager actively involved with sales, or technical tasks inherent to the development team
such as system architecture or development project management.
This research covers product software solely and focuses on business to business solutions.
The research targets software products with relatively high number of candidate
requirements, for the purpose of this research a range describing this criterion is between
1000 and 10 000 candidate requirements.
This research is limited to organizations using agile methodology.
5.4. Research Approach Comparison
This section compares the current research with some of the present body of knowledge
involved with prioritization techniques comparison. First a summarized description of the
work taken into account is examined and then a comparison table is compiled in order to
differentiate the approaches used in each of the studies.
Patrik Berander and Anneliese Andrews (2005) provide an overview of the techniques
available for prioritization of software products requirements. They provide description on
what requirements prioritization is and what its aspects are. Later they provide a short
discussion on a list of five prioritization methods the Analytical Hierarchy Process,
Cumulative Voting, Numerical Assignment, Ranking and Top-Ten Requirements. The authors
provide a short description on how to make the decision which prioritization method should
be chosen and what the trade-offs between the five options are. The research is based on a
literature review and no experimentation or evaluation is performed.
An Evaluation of Methods for Prioritizing Software (Karlsson, Wohlin, & Regnell, 1998)
evaluates six different methods for software requirements prioritization. The authors use
telephone system quality requirements to base their experiment on. Each of the authors
21 | P a g e
used all of the six methods separately. As a result of the study the six methods are
characterized a set of objective and subjective characteristics. The authors recognize a few
threats to validity in their study. Few people are involved in the experiment; only quality
requirements were considered and the evaluation is done off-line.
Requirements Prioritization: An Experiment on Exhaustive Pair-Wise Comparisons versus
Planning Game Partitioning (2004) describes two experiments which aim to compare pair-
wise comparisons to planning game. The requirements prioritization methods are compared
by their time consumption, ease of use and accuracy. A point of interest in this research is
the comparison between the manual pair-wise comparison and tool supported pair-wise
comparison. The authors indicate as research validity treats the use of students instead of
professionals in the experiment. Additionally the experimentation is done on off-line
product and on small number of requirements.
Towards a Research Framework on Requirements Prioritization (2006) presents a research
framework for studies focused on requirements prioritization. The framework aims to
provide a means for making more consistent knowledge base. Its basis is derived from a
systematic literature review on requirements prioritization techniques and it further
supported by literature studies of similar frameworks in related industries. Although this
research does not directly provide insight on the qualities of the different software
requirements prioritization methods it suggests a standardized way for methods evaluation
which might be adopted by both scholars and practitioners.
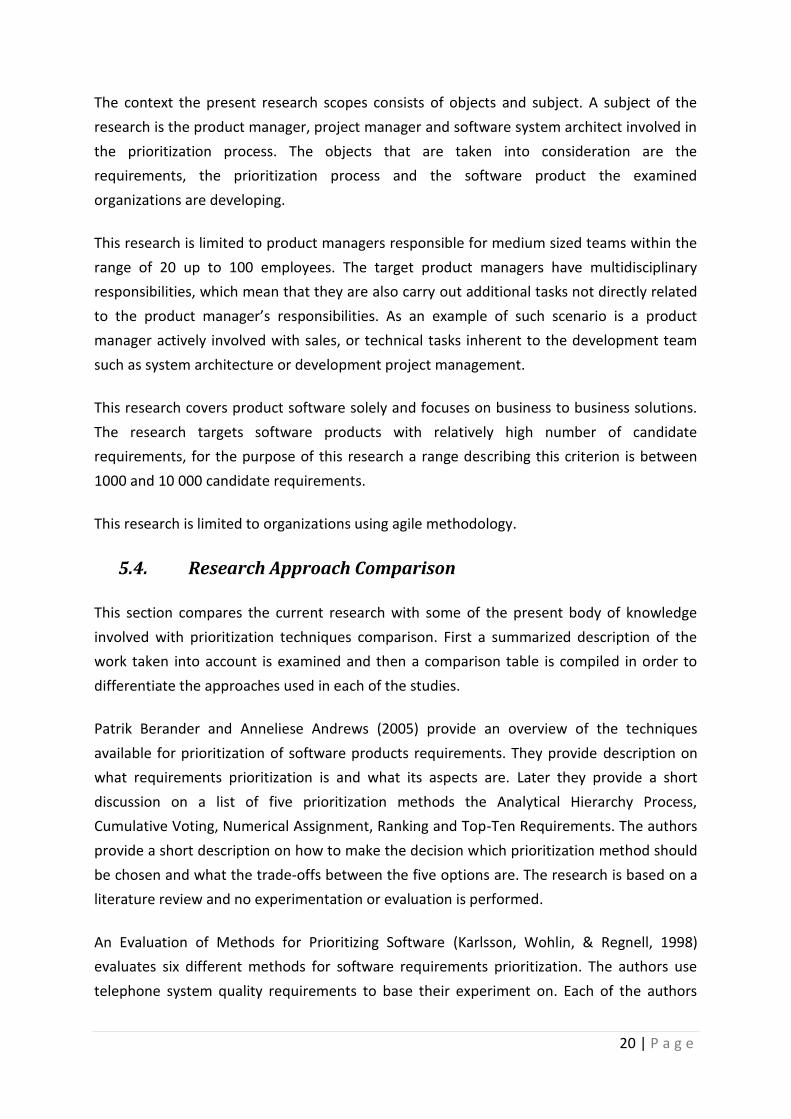
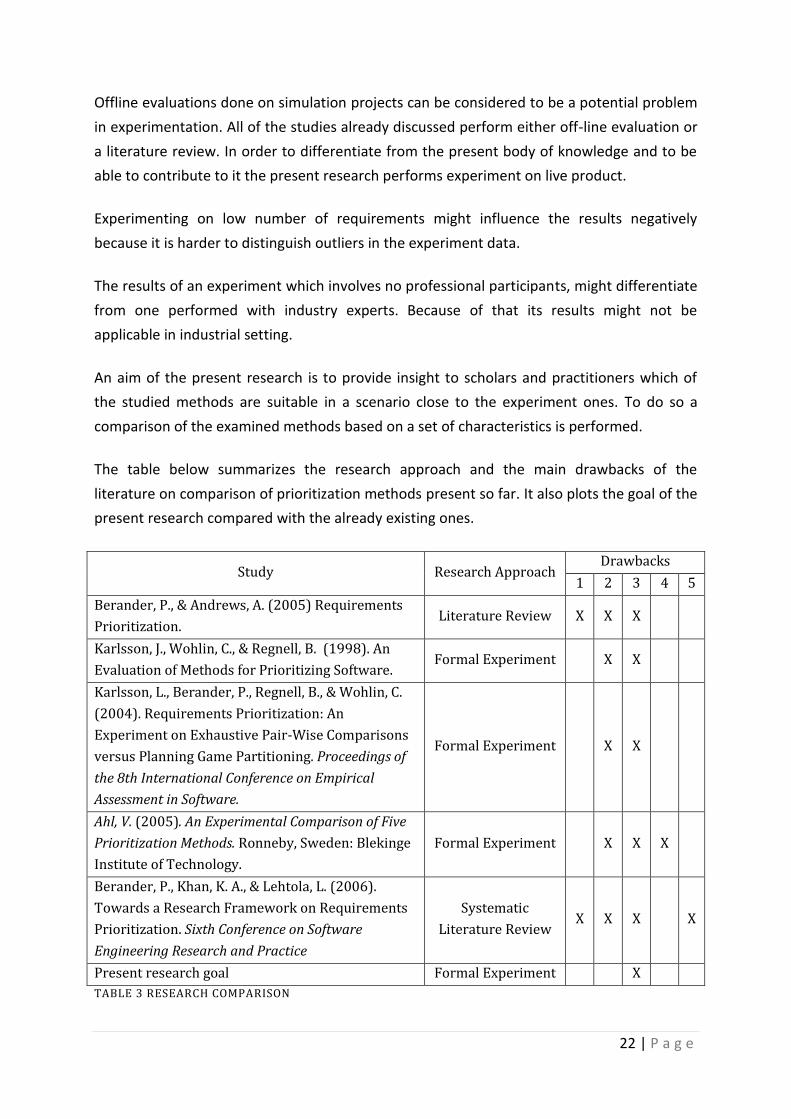
The main drawbacks identified in the available research in the field nowadays can be divided
in five main categories displayed in the table below.
Present research drawbacks
1. No empirical validations
2. Offline evaluations
3. Low number of requirements involved
4. No professionals involved
5. Little knowledge is present on choosing specific approach
TABLE 2 CURRENT RESEARCH DRAWBACKS
The no empirical validations drawback is valid for researches which approach is based mainly
on a literature review and no formal experiments or case studies are performed. The
problem of this type is that the situational factors influencing the decision which
prioritization method is suitable for certain scenario are usually insufficient.
22 | P a g e
Offline evaluations done on simulation projects can be considered to be a potential problem
in experimentation. All of the studies already discussed perform either off-line evaluation or
a literature review. In order to differentiate from the present body of knowledge and to be
able to contribute to it the present research performs experiment on live product.
Experimenting on low number of requirements might influence the results negatively
because it is harder to distinguish outliers in the experiment data.
The results of an experiment which involves no professional participants, might differentiate
from one performed with industry experts. Because of that its results might not be
applicable in industrial setting.
An aim of the present research is to provide insight to scholars and practitioners which of
the studied methods are suitable in a scenario close to the experiment ones. To do so a
comparison of the examined methods based on a set of characteristics is performed.
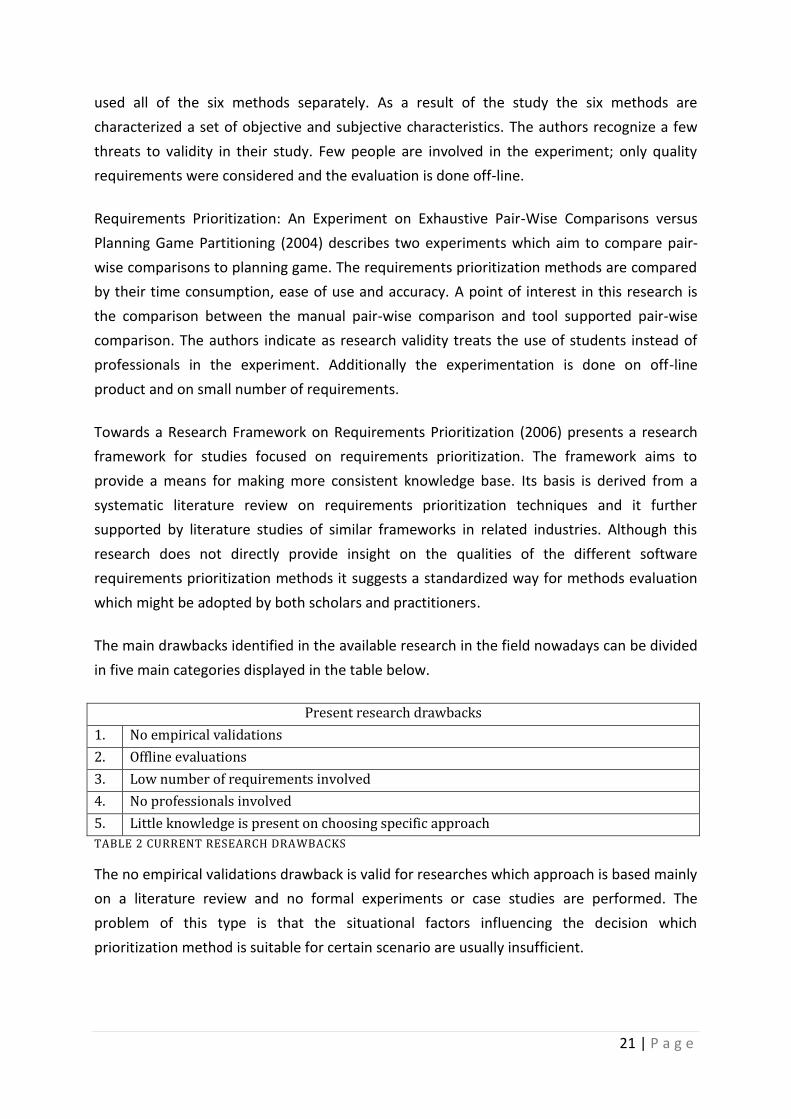
The table below summarizes the research approach and the main drawbacks of the
literature on comparison of prioritization methods present so far. It also plots the goal of the
present research compared with the already existing ones.
Study Research Approach Drawbacks
1 2 3 4 5
Berander, P., & Andrews, A. (2005) Requirements
Prioritization. Literature Review X X X
Karlsson, J., Wohlin, C., & Regnell, B. (1998). An
Evaluation of Methods for Prioritizing Software. Formal Experiment X X
Karlsson, L., Berander, P., Regnell, B., & Wohlin, C.
(2004). Requirements Prioritization: An
Experiment on Exhaustive Pair-Wise Comparisons
versus Planning Game Partitioning. Proceedings of
the 8th International Conference on Empirical
Assessment in Software.
Formal Experiment X X
Ahl, V. (2005). An Experimental Comparison of Five
Prioritization Methods. Ronneby, Sweden: Blekinge
Institute of Technology.
Formal Experiment X X X
Berander, P., Khan, K. A., & Lehtola, L. (2006).
Towards a Research Framework on Requirements
Prioritization. Sixth Conference on Software
Engineering Research and Practice
Systematic
Literature Review X X X X
Present research goal Formal Experiment X
TABLE 3 RESEARCH COMPARISON
23 | P a g e
The goal set to this research is to overcome the majority of the limitations present in the
literature so far. It aims to empirically validate the conclusions coming from the experiment.
The experiment is conducted on a real industry project prioritizing actual requirements, in
order to overcome the potential threats to validity from an off-line evaluation. The
experiment participants are professionals involved in requirements prioritization in the
experiment hosting organization. The result of the research aims to provide sufficient
information on the efficiency of each of the examined methods in the already specified
context. The low number of requirements that are prioritized during the experiment can be
considered to be a possible threat to validity of the present research. This drawback was not
overcome, because a longer experiment session will be obtrusive to the experiment hosting
organization.
5.5. Experiment Planning
Once the scoping of the research is set the planning takes place. In this phase the plan of the
operationalization of the research is created. This phase consists of seven sub phases. First
the context of the experiment is set. Then the null and alternative hypotheses are defined.
The variables that will be measured are defined. This sub step also determines the variables
type and range of possible values. Later the experiment subjects are specified and the design
type is elaborated. The proper instrumentation for the conduction of the experiment is
considered. Finally the possible pitfalls for the experiment validity are evaluated and
possible solutions for overcoming eventual problems are suggested. The following chapter
elaborates on the problems discussed above. Thus it provides detailed plan for execution of
the present research.
24 | P a g e
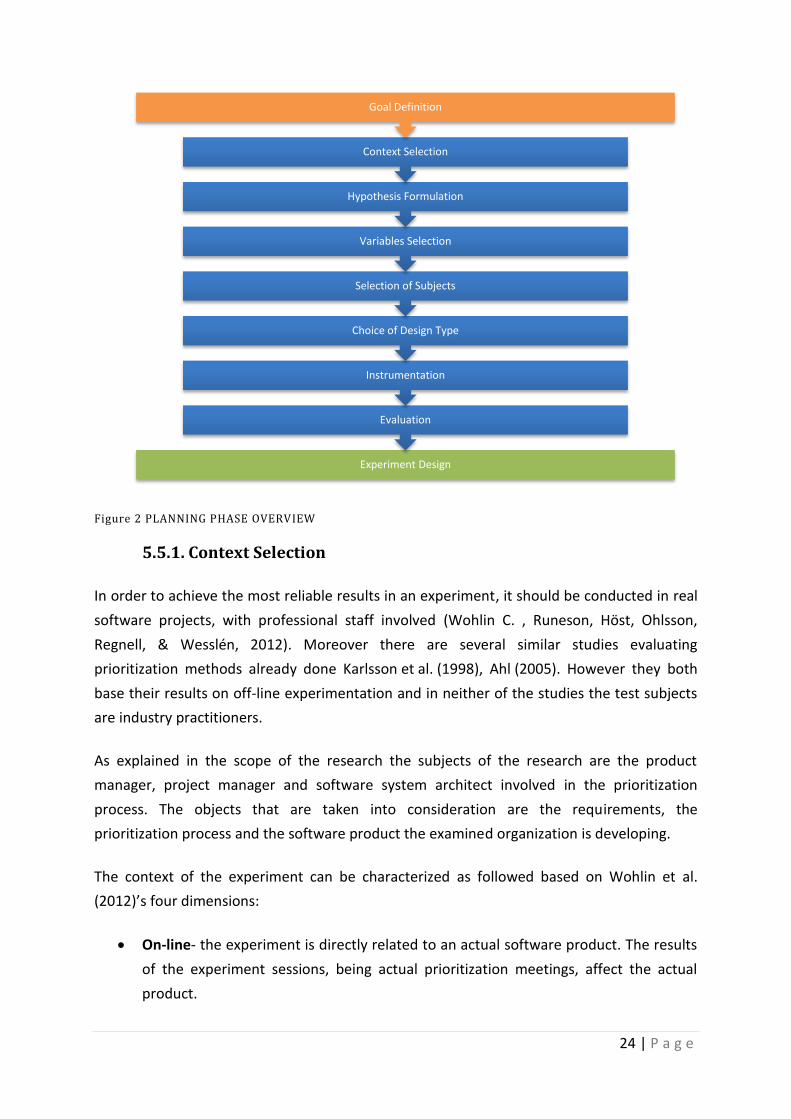
Figure 2 PLANNING PHASE OVERVIEW
5.5.1. Context Selection
In order to achieve the most reliable results in an experiment, it should be conducted in real
software projects, with professional staff involved (Wohlin C. , Runeson, Höst, Ohlsson,
Regnell, & Wesslén, 2012). Moreover there are several similar studies evaluating
prioritization methods already done Karlsson et al. (1998), Ahl (2005). However they both
base their results on off-line experimentation and in neither of the studies the test subjects
are industry practitioners.
As explained in the scope of the research the subjects of the research are the product
manager, project manager and software system architect involved in the prioritization
process. The objects that are taken into consideration are the requirements, the
prioritization process and the software product the examined organization is developing.
The context of the experiment can be characterized as followed based on Wohlin et al.
(2012)’s four dimensions:
On-line- the experiment is directly related to an actual software product. The results
of the experiment sessions, being actual prioritization meetings, affect the actual
product.
Experiment Design
Evaluation
Instrumentation
Choice of Design Type
Selection of Subjects
Variables Selection
Hypothesis Formulation
Context Selection
Goal Definition
25 | P a g e
Professional- The participants in the experiment are professionals working in a
software product company, responsible for requirement prioritization.
Real problems- The requirements that are prioritized are real and the decisions taken
during the prioritization process are applied in an actual product.
Specific- the results of the experiment can be applied in similar context, as the one
explained in the scope and limitation chapter and the context chapters of the present
research. Although some of the results could be valid in general further validation is
needed in different context.
Once the scope of the research is set, that enables to elaborate further on defining the
experiment plan.
5.5.2. Hypothesis formulation
A Hypothesis is a statement that proposes a possible explanation to a phenomenon. This
statement has to be testable in order to be used for the purpose of the research. In this
research a hypothesis is formulated. If this hypothesis is rejected a conclusion can be made.
Two hypotheses are formulated- null hypothesis (H0) and alternative hypothesis (H1). The
null hypothesis is the one that we want to reject with a high confidence.
Null Hypothesis: There is no perceived difference in the effectiveness of the
ranking method, the binary search tree method and the Wiegers Matrix for
prioritizing requirements in medium sized software companies involved in
business oriented software products with between 1000 and 10 000
candidate requirements.
Alternative Hypothesis: At least one of the three methods’ perceived effectiveness is
different than the others in the defined context.
5.5.3. Variables Selection
Before the design of the research is finished the dependant and independent variables of the
research should be determined.
The independent variables are those variables that can be manipulated during the
experiment. The independent variables should have effect on the dependant variables and
must be controllable. The choice of the variables also includes measurement scale and the
possible range of values they can be assigned to.
26 | P a g e
The effect of the experiment is measured in the dependant variables. If a dependant variable
cannot be measured directly it should be measured using indirect measure. This indirect
measure should be carefully validated because it can affect the overall results of the
research.
This research uses the following independent variables:
Prioritization Methods. This variable represents the methods used in the
prioritization process. The variable consists of three discrete values, being the three
prioritization methods: the ranking method, the binary search tree and the Wiegers
matrix.
Requirements to be prioritized. Each prioritization session’s length is about two
hours. During this session a set of requirements is proposed, discussed, analyzed and
finally prioritized. The number of the prioritized requirements in each prioritization
sessions may vary, due to the amount of time each requirement’s discussion
requires. This variable represents the set of prioritized requirements using the three
evaluated methods.
Order of the used methods. To be able to compare three different methods their
effectiveness should be measured on a same set of requirements. Because of that
the subjects in the experiment are using all of the three methods in each experiment
session. The order of the methods usage is manipulated in order to reduce possible
bias due to prior prioritization with different methods.
This research has the following dependant variables:
Required number of decisions per method. This measure indicates how many
decisions are required to prioritize one requirement using one of the three
methods. It contains a numerical value bigger than zero.
Time consumption per decision. This metric record the time that each decision
takes during the prioritization process.
Total time consumption. This variable measures the total time consumption each
method requires to prioritize a requirement.
Perceived ease of use. This measure describes how easy it is to use the prioritization
method.
Reliability of the results. This measure describes the perceived reliability of the
results for each method.
Fault tolerance. This metric measures how intensively the method prevents
judgmental errors.

27 | P a g e
There are two types of evaluation criteria involved in the experiment- objective and
subjective. The objective criteria are required number of decisions per technique, total time
consumption and time consumption per decision. The aim of those criteria is to observe the
workload related directly to utilizing a specific technique. The data regarding those factors is
obtained from the experiment minutes.
The subjective criteria examined are the perceived ease of use, reliability of the results and
fault tolerance of each of the techniques. The results about those characteristics are
obtained during the interviews following each prioritization session.
5.5.4. Selection of test subjects
The selection of experiment subjects reflects on the generalization of the results from the
experiment. In order to generalize the results for the desired population the selection must
be representative for that population.
Objective of the experiment is to evaluate the effectiveness of the ranking method, the
binary search tree method and the Wiegers matrix in an industrial setting. Thus the
participants in the experiment are the ones responsible for requirements prioritization.
The priority of the requirements set during the experiment is the one actually used in the
product development. Thus the subjects of the experiment are the stakeholders responsible
for conducting the prioritization in the experiment hosting company. The team consists of
the company CEO, product manager, system architect and a project manager.
5.5.5. Design Type
According to Wohlin et al. (2012) there are three general design principles- randomization,
blocking and balancing and the majority of experiment designs use either one or
combination of them. Randomization ensures that the observation is from independent
random variables. It can be applied on selection of the subjects, objects and the order tests
are conducted. Randomization aims to average the effect of a factor. In cases when a known
effect of a factor needs to be prevented blocking can be used. It systematically eliminates
the undesired effect in the comparison between the treatments. Balancing is in place when
the treatments have objects and subjects with equal effect on a factor. An example for
balancing is experiment involving participant groups with unified level of knowledge etc.
Wohlin et al. (2012)discusses different design types. The present experiment is a “One factor
with more than two treatments”, where the factor is the prioritization method and the
treatments are the ranking method, the binary search tree method and the Wiegers matrix.
28 | P a g e
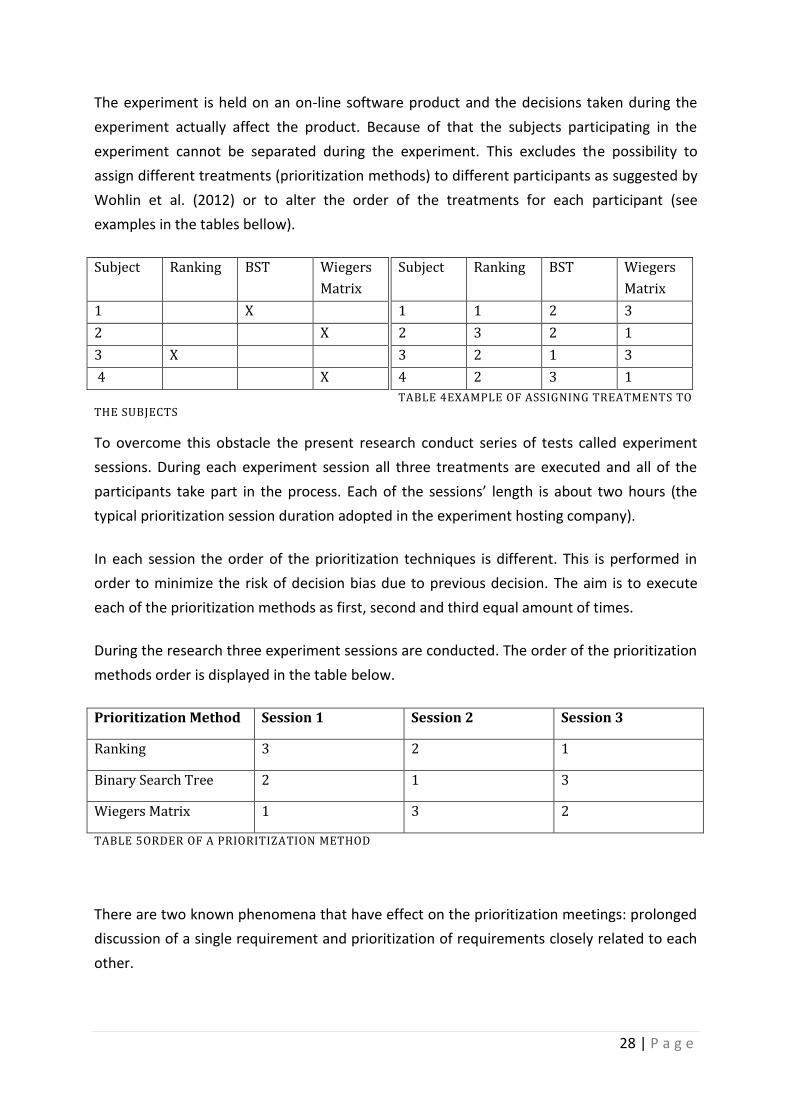
The experiment is held on an on-line software product and the decisions taken during the
experiment actually affect the product. Because of that the subjects participating in the
experiment cannot be separated during the experiment. This excludes the possibility to
assign different treatments (prioritization methods) to different participants as suggested by
Wohlin et al. (2012) or to alter the order of the treatments for each participant (see
examples in the tables bellow).
Subject Ranking BST Wiegers
Matrix
1 1 2 3
2 3 2 1
3 2 1 3
4 2 3 1
TABLE 4EXAMPLE OF ASSIGNING TREATMENTS TO THE SUBJECTS
To overcome this obstacle the present research conduct series of tests called experiment
sessions. During each experiment session all three treatments are executed and all of the
participants take part in the process. Each of the sessions’ length is about two hours (the
typical prioritization session duration adopted in the experiment hosting company).
In each session the order of the prioritization techniques is different. This is performed in
order to minimize the risk of decision bias due to previous decision. The aim is to execute
each of the prioritization methods as first, second and third equal amount of times.
During the research three experiment sessions are conducted. The order of the prioritization
methods order is displayed in the table below.
Prioritization Method Session 1 Session 2 Session 3
Ranking 3 2 1
Binary Search Tree 2 1 3
Wiegers Matrix 1 3 2
TABLE 5ORDER OF A PRIORITIZATION METHOD
There are two known phenomena that have effect on the prioritization meetings: prolonged
discussion of a single requirement and prioritization of requirements closely related to each
other.
Subject Ranking BST Wiegers
Matrix
1 X
2 X
3 X
4 X
29 | P a g e
During one prioritization session about ten requirements are discussed analyzed and
prioritized. However there are cases when the number of processed requirements cannot be
met. For example one or several requirements’ discussion might be prolonged too much in
order to get a common agreement on the issues related to the requirement. Although these
exceptions happen during the prioritization meetings the prioritization method used is not
causing them. Because of that the effect of those delays on the experiment’s results needs
to be prevented.
On contrary when a meeting is dedicated to requirements that are closely related to each
other more requirements can be processed. An example for that are requirements from one
theme or huge task decomposed to multiple requirements which should be implemented
together.
To prevent the effect of the exceptions discussed in the previous two paragraphs the
blocking principle is used. If one of those phenomena occurs during a prioritization meeting
the experiment session is considered to be invalid and is repeated.
After each session a separate interviews are made with the participants. The aim of the
interviews is to obtain information about the objective independent variables namely:
perceived ease of use, reliability of the results and fault tolerance. The interviews are semi-
structured.
5.5.6. Instrumentation
To execute the experiment proper tools should be prepared for the execution of each
method. There are three types of instruments for experiment- objects, guidelines and
measurement instruments (Wohlin C. , Runeson, Höst, Ohlsson, Regnell, & Wesslén, 2012).
During the experiment planning the instruments are determined and they are developed
before the execution of the specific experiment.
Guidelines are used to guide the participants in the experiment. In this experiment the
methods evaluated are explained to the participants prior to the requirements prioritization
meetings. The ranking method is already familiar to the participants due to the fact that it is
the method already utilized for requirements prioritization in the company. Because of that
no specific guidelines are needed prior to starting the experiment regarding this method.
The Wiegers matrix requires preliminary discussion in order to establish common agreement
over the scale of each of its characteristics- benefit, penalty, cost and risk. This is needed to
ensure that e.g. risk level of five means same amount of risk for each participant in the
prioritization group. To do so several already analyzed and prioritized requirements are

30 | P a g e
discussed again. The requirements are chosen based on their characteristics. For example
requirements with relatively low medium and high benefit are selected. Then all the
participants discuss them and rate the benefit by the scale from one to nine (the way they
are supposed to do using the Wiegers matrix). Once a common agreement on the value is
met it can be used as a control value in case future discussions rise.
The binary search tree is pretty straightforward method to execute once the participants are
familiar with it. The main emphasis of explaining it to the stakeholder responsible for the
prioritization is how the requirements are stored in a tree structure and how the tree is
traversed in order to obtain an ordered list after the prioritization is done.
In order to facilitate the experiment proper tools should be developed. It is important that
those tools do not affect the results of the experiment. For example if one of the methods is
performed using tool that is not good enough it may result the time this method requires or
the ease of use of the method.
The ranking method is already adopted in the organization hosting the experiment. Because
of that no additional tools development is necessary and the company product management
software is used.
The Wiegers matrix presents a simple spreadsheet model for evaluation of requirements. In
order to facilitate that method a spreadsheet in Microsoft Excel is used.
The binary search tree requires software tool to automate the tree structure management
process. For the purpose of the experiment a simple binary search tree based requirements
management system is developed using Microsoft .Net Framework. For the purpose of the
experiment and to keep the project simple the data prototype processes is stored in CSV
files. That allows easy import into Excel or other software for analytical purposes of the
experiment results.
Additionally due to the remoteness of the development team, the management team and
occasionally the researcher conducting the experiment conference meeting medium is
required. The meetings with exception of the cases when the three parties are physically
together are conducted through Skype.
Recording software is used to capture the interviews with the subjects of the experiment
following each prioritization meeting.
Minutes are recorded during the experiment. Those minutes include the starting and ending
time of using each method for a specific requirement. Time consumption per decision for
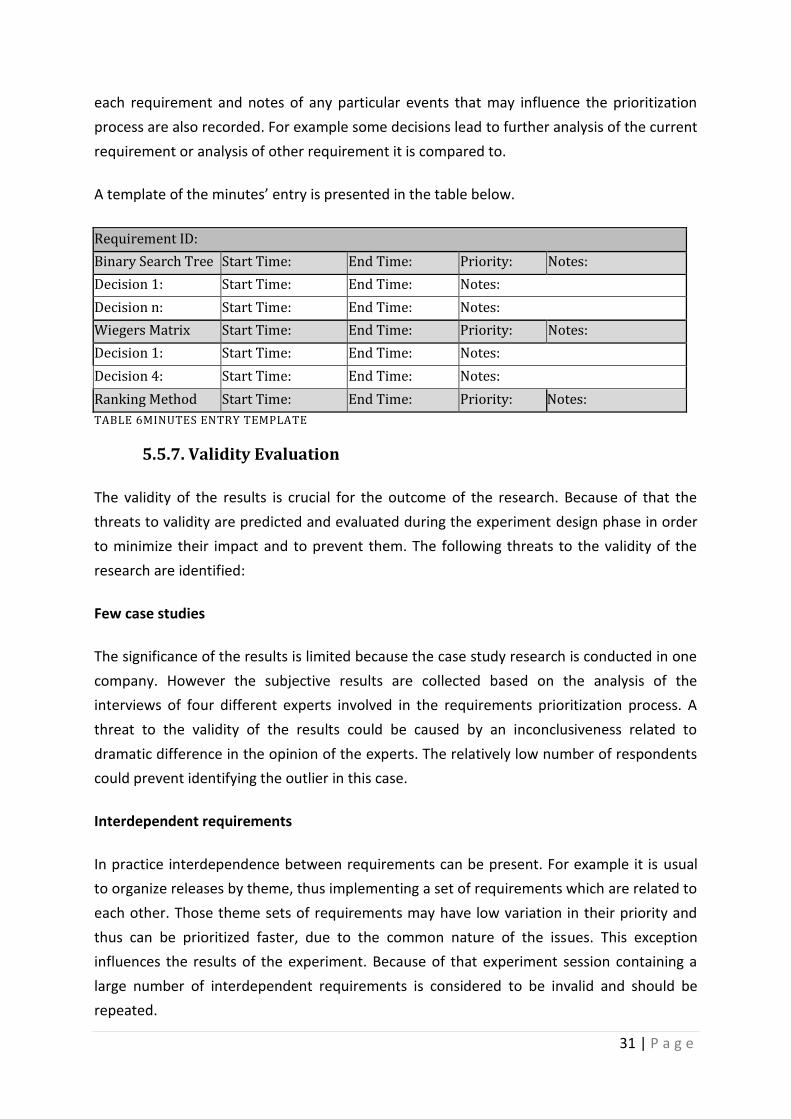
31 | P a g e
each requirement and notes of any particular events that may influence the prioritization
process are also recorded. For example some decisions lead to further analysis of the current
requirement or analysis of other requirement it is compared to.
A template of the minutes’ entry is presented in the table below.
Requirement ID:
Binary Search Tree Start Time: End Time: Priority: Notes:
Decision 1: Start Time: End Time: Notes:
Decision n: Start Time: End Time: Notes:
Wiegers Matrix Start Time: End Time: Priority: Notes:
Decision 1: Start Time: End Time: Notes:
Decision 4: Start Time: End Time: Notes:
Ranking Method Start Time: End Time: Priority: Notes:
TABLE 6MINUTES ENTRY TEMPLATE
5.5.7. Validity Evaluation
The validity of the results is crucial for the outcome of the research. Because of that the
threats to validity are predicted and evaluated during the experiment design phase in order
to minimize their impact and to prevent them. The following threats to the validity of the
research are identified:
Few case studies
The significance of the results is limited because the case study research is conducted in one
company. However the subjective results are collected based on the analysis of the
interviews of four different experts involved in the requirements prioritization process. A
threat to the validity of the results could be caused by an inconclusiveness related to
dramatic difference in the opinion of the experts. The relatively low number of respondents
could prevent identifying the outlier in this case.
Interdependent requirements
In practice interdependence between requirements can be present. For example it is usual
to organize releases by theme, thus implementing a set of requirements which are related to
each other. Those theme sets of requirements may have low variation in their priority and
thus can be prioritized faster, due to the common nature of the issues. This exception
influences the results of the experiment. Because of that experiment session containing a
large number of interdependent requirements is considered to be invalid and should be
repeated.

32 | P a g e
Bias due to prior prioritization of a requirement with different technique
During the experiment sessions identical set of requirements is prioritized with three
different techniques. Because of that the results obtained by the different techniques may
be biased by the results of the prior one. In order to prevent that each of the sessions have
different order of the executed prioritization techniques. The order is present in the table
below.
Order Session 1 Session 2 Session 3
1 Wiegers Matrix Binary Search Tree Ranking
2 Binary Search Tree Ranking Wiegers Matrix
3 Ranking Wiegers Matrix Binary Search Tree
33 | P a g e
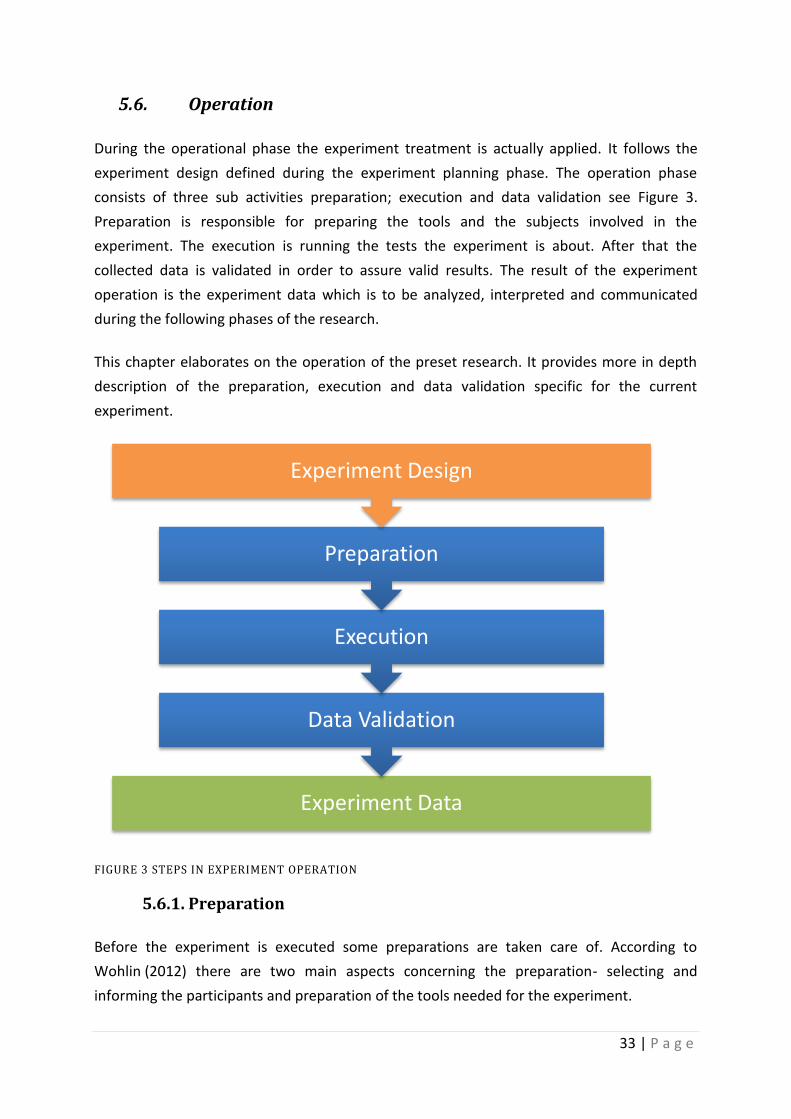
5.6. Operation
During the operational phase the experiment treatment is actually applied. It follows the
experiment design defined during the experiment planning phase. The operation phase
consists of three sub activities preparation; execution and data validation see Figure 3.
Preparation is responsible for preparing the tools and the subjects involved in the
experiment. The execution is running the tests the experiment is about. After that the
collected data is validated in order to assure valid results. The result of the experiment
operation is the experiment data which is to be analyzed, interpreted and communicated
during the following phases of the research.
This chapter elaborates on the operation of the preset research. It provides more in depth
description of the preparation, execution and data validation specific for the current
experiment.
FIGURE 3 STEPS IN EXPERIMENT OPERATION
5.6.1. Preparation
Before the experiment is executed some preparations are taken care of. According to
Wohlin (2012) there are two main aspects concerning the preparation- selecting and
informing the participants and preparation of the tools needed for the experiment.
Experiment Data
Data Validation
Execution
Preparation
Experiment Design
34 | P a g e
Before conducting the experiment people which correspond to the desired experiment
subjects (see Selection of test subjects) have to be found. Also those people should be
motivated to participate throughout the whole experiment. The present study aims to
evaluate the ranking method, binary search tree and the Wiegers matrix in an industrial
setting. That limits availability of the eligible people to participate in the experiment,
because they should work together on a same product. In order find appropriate
participants a company interested in studying and improving its requirements prioritization
process should be found.
The company hosting the experiment fits the scope of the research it is a medium sized one
with a software product targeting business clients. There is a large number of candidate
requirements that are processed and the company already uses agile methodology. Since
subjects are located the following aspects need to be considered.
Obtain consent. The experiment participants consent has to be taken to prevent the
risk that they will not perform according to the objectives of the experiment and not
put sufficient effort during the experiment execution. That may result in invalid data
and may corrupt the overall results of the research.
To gain participants’ trust they should be aware how the results of the experiment
will be used and presented. In any case the participants may feel affected by the
experiment they are free to leave it.
Sensitive results. Some of the data obtained during the experiment may be sensitive
for the participants and the company hosting the experiment. To prevent
information leakage some of the data related to the experiment needs to remain
confidential.
During the experiment sessions real requirements are analyzed discussed and
prioritized. Those discussions involve strategic information, internal data etc. The
experiment hosting company may be vulnerable if its competitors are aware of this
information. Because of that the experiment results and the research presentation
should not expose it.
Inducements. Adding a material incentive can be a good motivator for the test
subjects. The incentive should not be too big, because that may result in participation
merely to receive the reward rather than seriously participate in the experiment
(Wohlin C. , Runeson, Höst, Ohlsson, Regnell, & Wesslén, 2012). In the present
experiment no monetary inducements are given. On the other hand the results of the
experiment can be directly applied in the experiment hosting company, thus
improving the requirements prioritization process, which results in making
participants work easier.
35 | P a g e
Disclosure. In the current context disclosure means to reveal all of the details of the
experiment openly with the experiment participants. In the present research full
disclosure is present according to the test participants. They are fully aware of the
way the experiment is conducted, their responsibilities during the experiment and
the expected final results.
Beside preparation of the participants the instrumentation for the experiment is also taken
care of. The main issues that should be covered are already identified in the experiment
instrumentation chapter and during this phase they are actually applied.
5.6.2. Execution
The experiment is conducted during three prioritization meetings of the experiment hosting
company. Each of the prioritization sessions takes between two hours and two hours and a
half. During the first of the experiment sessions all of the participants and the researcher
conducting the experiment were physically together. This leads to some benefits, because
the researcher conducting the experiment is present. If a test subject has any questions they
can be answered immediately to its best. During the following two experiment’s sessions
conference call software is used to facilitate the meetings. During those meetings the test
subjects are already familiar with the experiment and there is smaller possibility that a
situation that requires the experiment leader intervention could occur.
The experiment leader is able to monitor the whole prioritization process during both
physical and virtual meetings. This allows to monitor both the formal variables defined and
measured for the experiment and to observe the behavior of the participants in the
prioritization process. This additional information may be beneficial for the analysis of the
experiment result and may be used in order to create hypotheses about the reasons of the
result. If such hypotheses occur they might be additionally studied or proposed for further
research.
The experiment leader is using the custom developed software tools to facilitate the binary
search tree method and a spreadsheet automating the Wiegers matrix method. The
company hosting the experiment already has implemented system facilitating the ranking
method integrated in their product management platform. The experiment leader also has a
read only access to that system in order to collect the data gathered during the prioritization
meetings for further analysis.
The data is collected twofold during the experiment (digitally and on paper). The priorities of
the examined requirements are recorded in files with different formats depending on the
36 | P a g e
system managing the prioritization process. The results from the Wiegers matrix is kept in
the excel spreadsheets, that facilitate the method.
The binary tree representing the priorities of the requirements prioritized with BST is
traversed and presented in and linear data structure (list). The list is needed in order to
present the priorities in a structure that is easier comprehended. After the list is made the
priorities of the requirements according to the binary search tree tool are exported to csv
file.
The ranking method is facilitated by the product management system used in the company.
The system provides export functionality of the results. The exported files are used as an
input for the analysis of the results.
The time each requirement prioritization takes is recorded by the experiment leader during
the experiment prioritization sessions. In case an exceptional event occurs during the
prioritization it is also recorded in the minutes. This information is kept in order clarify the
reasons for the present data and to support the upcoming analysis.
After the prioritization session is over the experiment leader presents a brief summary of the
results each of the methods lead to the participants. The purpose of this presentation is to
make the stakeholders involved in the prioritization process acquainted with the outcome
from each of the prioritization methods so they can evaluate the perceived reliability of the
results.
A short discussion follows, which aims to clarify any questions that the experiment
participants might have. This discussion is followed by scheduling separate interviews with
each of the participants in the experiment session. The interviews are scheduled no later
than two days after the experiment while the appointments of each of the participants are
taken into account. The reason for making the interviews as soon as possible after the
experiment is to ensure that the participants have fresh memories about the previous
prioritization session.
5.6.2.1. Interviews
Interviews are conducted separately with each of the participant in the experiments
sessions. The aim of the interviews is to gather enough evidence for analysis of the
subjective experiments variables- perceived ease of use, reliability of the results and fault
tolerance.
37 | P a g e
To be able to design the interviews in a way which enables proper data collection initial
research dedicated to conducting interviews is required. The following paragraphs describe
how this research is performed and provide information on how the interviews are
conducted in the context of the present research.
According to Kvale (1996) qualitative researches interview aims to describe the meanings of
central themes in the life world of the subjects. The main task in interviewing is to
understand the meaning of what the interviewees say.
Additionally a qualitative research interview focuses on both a factual and a meaning level,
though it is usually more difficult to interview on a meaning level. (Kvale, 1996)
Interviews are particularly useful for getting the story behind a participant’s experiences.
The interviewer can pursue in-depth information around the topic. Interviews may be useful
as follow-up to certain respondents to questionnaires, e.g., to further investigate their
responses (McNamara, 1999)
Interviews are more personal than questionnaires, because the interviewer is working
directly with the respondent. Also the interviewer has the opportunity to ask follow up
questions in case he/she needs to get additional information or does not completely
understand interviewee’s response.
From respondents point of view interviews are easier then filling in questionnaire especially
in the cases when they should provide opinion or impressions. The reason for that is because
respondents are not required to understand the questionnaires format or to put effort in
writing extensive replies.
On the other hand interviews are time consuming and require more resources than
collecting data through questionnaires. The interviewer needs to pay personal attention to
each of the participants. Additionally Interviews require schedule adjustments for both the
interviewer and interviewee.
The interviewer should be considered as a measurement instrument in the experiment. As
such an attention should be played whether the measurements (information) collected by
the interviewer is of good quality. To prevent thread to the validity of the data collected
during the interviews the interviewer needs to be trained and prepared to respond in any
contingency.
38 | P a g e
5.6.2.2. Interview Approach
There are four types of interviews described by McNamara (1999). Each of them provides
different advantages and disadvantages. A brief description of the types is presented below.
Then an argumentation on the chosen type of interview in the present research is provided.
Informal, conversational interview - this approach requires no predetermined
questions. The goal is that the interview remains as open and adaptable as possible
to be able to respond to interviewee’s personality. The interviewer task is to go with
the flow of the conversation and to slightly steer the direction of the conversation
with follow-up questions. This approach is suitable for situations when interviewer
seeks to explore an area of knowledge, but requires a specific skill set from the
interviewer in order to steer the conversation in a direction that contributes to the
research.
General interview guide approach – this type of interviews aims to ensure that each
interviewee provides information on same general areas. Thus the interview
becomes more focused than the conversational approach, but still provides a wide
degree of freedom and adaptability for getting information from the experiment
participants. To perform such interview the interviewer should prepare the several
questions per area of interest which are identical for all of the participants. During
the conversation the interviewer is free to ask follow up questions in order to guide
the discussion or in case he/she wants to obtain more details about a topic of
discussion.
Standardized, open-ended interview – This approach uses a set of identical open-
ended questions for each of the participants. The respondents are free to choose
how to answer a question and they are not limited to a set of possible answers such
as choosing a value from predefined range or selecting yes or no. This approach
facilitates faster interviews. It also ensures that all of the interviewees will answer
the same set of questions. Compared to providing them with a questionnaire the
interview approach ensures that the interviewer can explain a question if the
participant cannot understand it correctly, also the collected data will be in the
correct format.
This type of interviews is faster than the informal conversational approach and the
general interview guide approach. However it does not allow the interviewer to dig
deeper and to obtain external evidences that may provide additional insight on the
topic of interest.
Closed, fixed-response interview – This type of interview is the fastest among the
four already discussed. A fixed-response interview asks the interviewees to answer
39 | P a g e
the same set of questions with the limitation of the answers among a set of
alternatives. This type of interview requires least amount of skills from the
interviewer, but provides no additional insight on the topic of interest outside the
one provided by the data collected from the questionnaire.
As already discussed the purpose of the interviews in the current research is to provide
information about the subjective measures related to the prioritization methods being
studied. Since it is difficult to define discrete measures about ease of use, reliability of
the results and fault tolerance of a prioritization method the fixed-response interview is
considered to be inconvenient approach.
The examined variables might have different meaning for each individual additionally
each of the participants might express his/hers opinion in a different way. For example
one can be quite extensive in his/her description while another person can be laconic
and might omit important details which he/she considers goes without saying. Thus the
interviewer has to figure out a way to lead the conversation in a way that will expose the
meaning each of the participants has. The open-ended interview approach is not suitable
for dealing with that situation, because it is more restrictive to the interviewees’
responses and restricts to a relatively high extent the interviewer freedom to steer the
interview into different direction.
Since fixed-response interview approach and the open-ended interviews are considered
to be inappropriate for the purpose of this research the choice leaves between the
informal interview approach and the general interview guide approach.
The main similarity of the two left approaches is that they allow the interviewer to steer
the conversation in a way that provides the most information necessary for the research.
The main difference is that the general interview guide approach ensures that same
predetermined questions are asked to the interviewee in order to collect information on
similar areas of interest.
The two interviews approaches advantages and disadvantages of are already discussed
above. The choice which of those approaches is more suitable to for the research leaves
to the preference of the researcher and the researchers skills to lead interviews.
Since the experiment lead does not have throughout experience in leading informal
conversational interview the preferred approach for this research is set to the general
interview guide approach. The reason is to ensure that each of the experiments
40 | P a g e
participants will be asked about his/hers opinion about the ease of use, reliability of the
results and fault tolerance of the examined software prioritization methods.
5.6.2.3. Interview Preparation
Since the quality of the results depend on interviewers his/hers training becomes influential
for the validity of the experiment. Because of that interview planning should be elaborated
and rehearsal of the interview should be performed prior to the formal experiment
interviews sessions.
There are a number of criteria that needs to be covered by the interviewer in order to be
able to perform the interviews successfully. The following list explains the qualities required.
Knowledgeable – interviewer needs to have sufficient knowledge about the topic of
discussion in order to be able to obtain the required information.
Structuring – interviewer has to be able to structure the interview procedure and
follow it during the interview.
Clear – interviewer should be able to formulate understandable, simple and easy
questions.
Gentle – to be able to deal with unconventional situations or sensitive opinions the
interviewer has to be patient and sensitive.
Steering – Once the structure of the interview is set, the interviewer needs to have
the ability to steer the conversation in the desired direction.
Critical – critical thinking is required ability in order to verify the reliability and
validity of interviewees’ response.
Remembering – although recording the interviews is necessary to ensure that there
would be no missed information the ability to remember might additionally help to
during the analysis phase following the interview. For example there might be
significant moments during the interview which might make impression at the
moment, but they can be missed later while listening to the record or reading
interviews’ transcription.
Interpreting – interviewer needs to be able to provide interpretation of interview
participants’ response.
In order to prepare the interviewer for the upcoming interview several topics should be
covered. Initially the entire study needs to be explained. Interviewers need to know more
than just the questions to be asked and the structure of the interview in order to obtain the
necessary research information. The interviewer should be aware of the background of the
41 | P a g e
research and its importance. In the best situation he/she should also have background in the
researched field.
If the interviewer is responsible for the sampling process or to find interviewees that
represent the interview target group the sampling logic and process should be explained.
Inexperienced interviewer may not understand the importance of sampling. Thus his/hers
motivation to stick to the interview plan might be lower. In the present research the
interviewer is the researcher conducting the experiment. Thus he is well aware of the
interview process and the sampling so, no additional explanations were required.
The interviewer should be aware of the ways he or she can bias the interview. Additionally
the possible ways the interview can be biased due to inattention should be also explained.
The
Once the interview is conducted and the experiment data is collected the data validation
phase follows.
5.6.3. Data Validation
After the data is data collection phase the experiment leader need to check whether the
data is collected correctly. There are numerous possible scenarios that may corrupt the data.
In case the experiment participants have to record data by themselves they might not
understood correctly the forms for collection of the data or the input format. To prevent
such problem it is necessary for the experiment leader to verify the data provided by the
participants in the experiment sessions.
Another possible implication might be if a participant is not entirely involved in the
experiment and is not providing serious feedback. In this case the collected data has to be
excluded from the experiment dataset before the analysis.
During this phase it is important to ensure that the experiment is conducted according to its
design. The experiment leader needs to check whether the prioritization methods are
executed correctly. To be able to verify that and whether each of the steps are executed in
the right order the experiment leader needs to monitor each of the steps during the
experiment and to correct the experiment participants if error occurs. If the experiment
leader misses to execute this responsibility properly the collected data should be treated as
incorrect and the experiment session should be repeated.
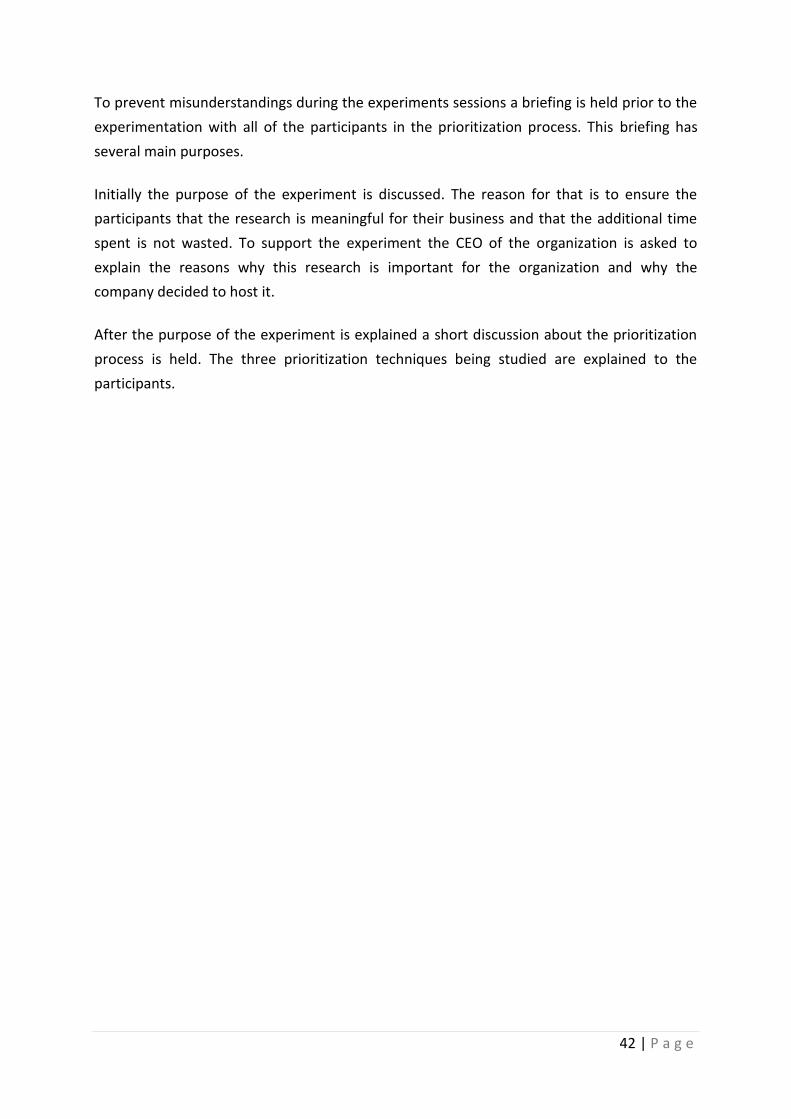
42 | P a g e
To prevent misunderstandings during the experiments sessions a briefing is held prior to the
experimentation with all of the participants in the prioritization process. This briefing has
several main purposes.
Initially the purpose of the experiment is discussed. The reason for that is to ensure the
participants that the research is meaningful for their business and that the additional time
spent is not wasted. To support the experiment the CEO of the organization is asked to
explain the reasons why this research is important for the organization and why the
company decided to host it.
After the purpose of the experiment is explained a short discussion about the prioritization
process is held. The three prioritization techniques being studied are explained to the
participants.
43 | P a g e
6. Analysis and Interpretation
Once the operation phase is completed the needed experiment data for analysis and
interpretation is collected. This data is used as input for the analysis and interpretation in
order to be able to draw conclusions based on the experiment. The experiment collects both
quantitative and qualitative data used to study different variables. The quantitative
interpretation may be carried out in tree steps illustrated in the figure bellow.
FIGURE 4 ANALISIS AND INTERPRETATION
The first sub step characterizes data using descriptive statistics which presents the data set.
The second sub step is responsible for indication and excluding abnormal data. In that
manner the data set remains containing only valid data entries. Then the hypothesis is
tested by statistical analysis of the data.
6.1. Descriptive Statistics
Descriptive statistics deals with the presentation of the data set. It is used to describe and
graphically present the interesting measures of the experiment data. Those measures
indicate where on a specific scale the data is positioned and how concentrated or spread out
Conclusions
Hypothesis Testing
Data Set Reduction
Descriptive Statistics
Experiment Data
44 | P a g e
it is. The goal is to get initial understanding about how the data set is distributed. This
information supports the hypothesis testing and may be used to identify outliers in the data
set.
6.2. Data Set Reduction
To test a hypothesis a number of statistical methods can be used. Regardless of the specific
statistical method used the results depend much on the quality of the input data. If the
methods are applied on data that does not represent what it is expected to represent the
conclusions drawn from the method’s results may be incorrect. Basically the reasons for
errors in the data set can be either systematic errors or presence of outliers.
An effective way to identify outliers is to present the data in a scatter plot. This way a
possible outlier can be visually identified. Even if a specific value looks like an outlier further
investigation is required before taking the decision to remove it from the data set.
This method can be based on that the data comes from a normal distribution and
determining the probability of finding value with the maximum and minimum value from the
distribution. For example the difference between possible outlier and the mean of all values
or the difference between the outlier and its closest value may be calculated. Then the
probability of occurrence of such large difference can be determined. In other words
through making that an evaluation is made if it is possible that the outlier found can be a
value from a normal distribution.
Data reduction is also present during the data validation in the operations phase. However
data validation is concerning outliers based on the execution of the experiment e.g.
abnormal data due to input from people who does not participate seriously in the
experiment. In this phase the reason for the outliers may be beyond improper experiment
execution, but just an exception rarely observed in practice but occurred during the data
collection.
If an outlier is identified the reasons for its appearance should be analyzed in order to take
decision how to deal with it. If it is caused by a strange or rare event that is unlikely to
happen again it is possible to exclude the data point. However even if the event is rare but
there is a possibility to happen again the outlier should not be excluded because it brings
valuable information.

45 | P a g e
6.3. Hypothesis testing
After the dataset is reduced the data is analyzed in order to test the defined hypothesis. To
do so it is assumed that the null hypothesis is true on a random representative sample. Then
an analysis is made in order to find evidences that reject that hypothesis.
In the case of this research the following hypothesis is formulated.
Null Hypothesis: There is no perceived difference in the effectiveness of the
ranking method, the binary search tree method and the Wiegers Matrix for
prioritizing requirements in medium sized software companies involved in
business oriented software products with between 1000 and 10 000
candidate requirements.
Alternative Hypothesis: At least one of the three methods’ perceived effectiveness is
different than the others in the defined context.
The aim of the analysis is to prove that there is difference in the perceived effectiveness of
the three studied methods. In order to be able to compare the effectiveness of the methods
six measurable variables are defined: required number of decisions per method; time
consumption per decision; total time consumption; perceived ease of use; reliability of the
results; fault tolerance.
46 | P a g e
7. Prioritization Methods
There is a large number of prioritization methods nowadays. For the purpose of this research
different sources are examined in order to identify candidate methods for evaluation. A brief
description of each of them is present in the present section. Next a classification of the
methods is performed based on the classification framework of Herrmann & Daneva (2008).
Based on that classification and the exploratory interviews conducted prior of the
experiment the three methods studied in the present research are chosen.
7.1. Prioritization Methods Description
The following pages provide a short description about the long list of methods intended for
evaluation. However three methods are picked to be further studied during the experiment
phase of the research- the ranking method, the binary search tree and the Wiegers matrix.
To provide further insight about them their description is further elaborated in the current
chapter including a detailed model description implemented with the process deliverable
diagrams (PDD).
7.1.1. Process deliverable diagrams
The process deliverable diagrams are a meta-modeling technique used for modeling
processes and the data that is derived from a process execution (Weerd & Brinkkemper,
2008). The diagrams consist of a combination of two integrated components. On the left
side of the diagram is the process view. It is based on the UML activity diagram (Eriksson &
Penker, 2000). On the right-hand side is situated the deliverable view, which is based on a
UML class diagram (OMG, 2011).
Meta-process modeling is performed by adapted UML activity diagrams. It presents the flow
from one activity to anther in the process. The activities can be decomposed to sub activities
and the flow between them is presented with transitions.
There are two main types of activities: standard and complex activities. The standard
activities are activities that do not contain sub activities (Weerd & Brinkkemper, 2008). They
are illustrated with a rounded rectangle (see figure below). The complex activities consist of
sub activities. They can be further divided into two different subtypes: open activity and
closed activity. The open activity consists of sub activities that are expanded either in the
current or in a supplementing diagram. Depending on the case in place two possible
notations are used: a round rectangle with a white shadow, which indicates that the sub
activities are depicted in an external diagram; a round rectangle containing a collection of
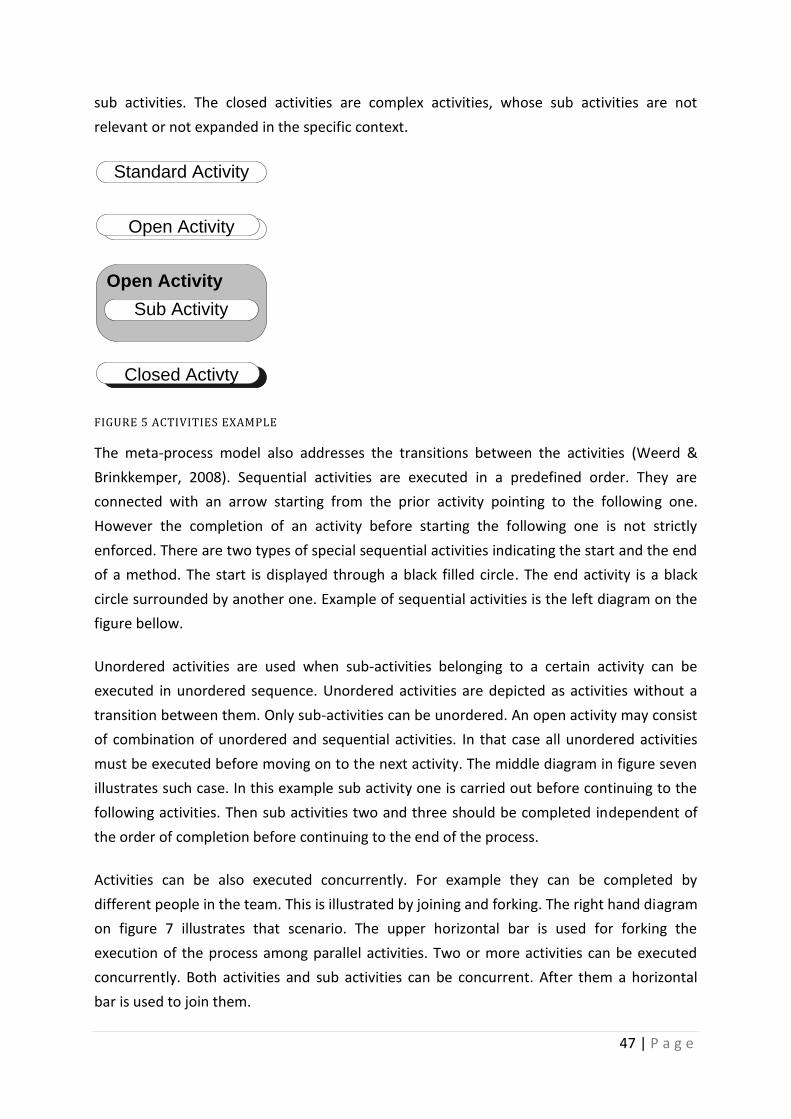
47 | P a g e
sub activities. The closed activities are complex activities, whose sub activities are not
relevant or not expanded in the specific context.
Standard Activity
Open Activity
Open Activity
Sub Activity
Closed Activty
FIGURE 5 ACTIVITIES EXAMPLE
The meta-process model also addresses the transitions between the activities (Weerd &
Brinkkemper, 2008). Sequential activities are executed in a predefined order. They are
connected with an arrow starting from the prior activity pointing to the following one.
However the completion of an activity before starting the following one is not strictly
enforced. There are two types of special sequential activities indicating the start and the end
of a method. The start is displayed through a black filled circle. The end activity is a black
circle surrounded by another one. Example of sequential activities is the left diagram on the
figure bellow.
Unordered activities are used when sub-activities belonging to a certain activity can be
executed in unordered sequence. Unordered activities are depicted as activities without a
transition between them. Only sub-activities can be unordered. An open activity may consist
of combination of unordered and sequential activities. In that case all unordered activities
must be executed before moving on to the next activity. The middle diagram in figure seven
illustrates such case. In this example sub activity one is carried out before continuing to the
following activities. Then sub activities two and three should be completed independent of
the order of completion before continuing to the end of the process.
Activities can be also executed concurrently. For example they can be completed by
different people in the team. This is illustrated by joining and forking. The right hand diagram
on figure 7 illustrates that scenario. The upper horizontal bar is used for forking the
execution of the process among parallel activities. Two or more activities can be executed
concurrently. Both activities and sub activities can be concurrent. After them a horizontal
bar is used to join them.
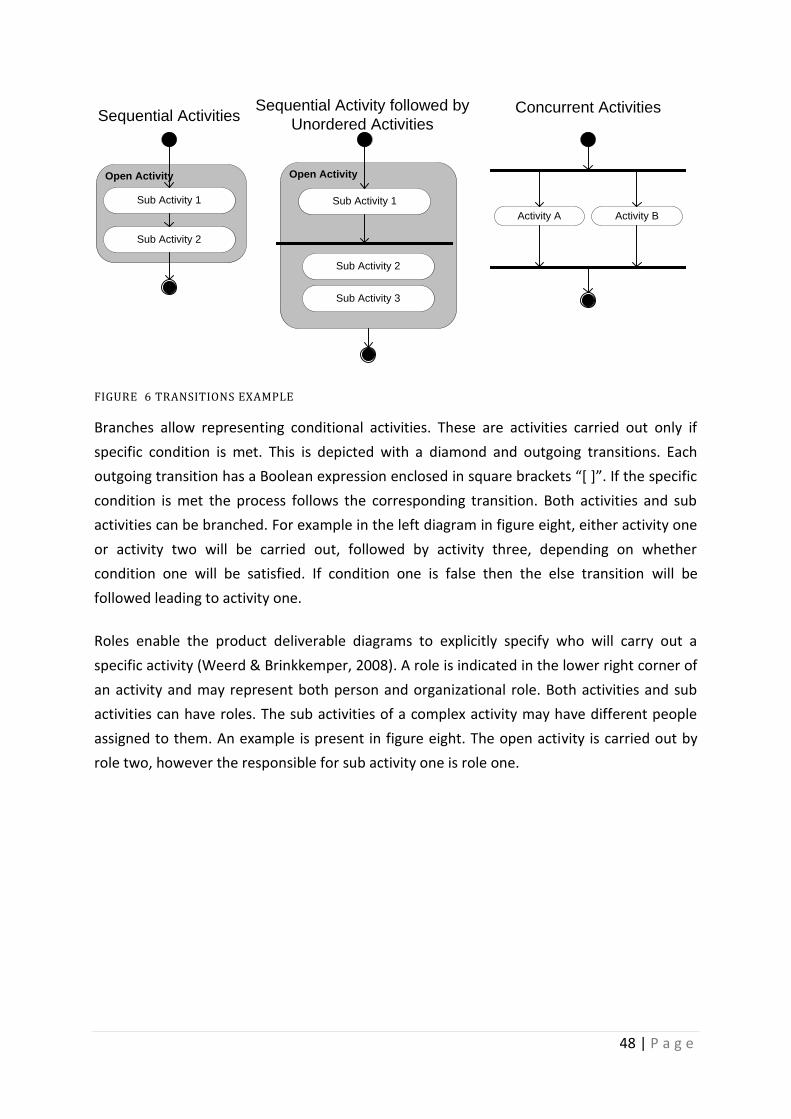
48 | P a g e
Open Activity
Sub Activity 1
Sub Activity 2
Open Activity
Sub Activity 1
Sub Activity 2
Sub Activity 3
Sequential Activity followed by
Unordered ActivitiesConcurrent Activities
Activity A Activity B
Sequential Activities
FIGURE 6 TRANSITIONS EXAMPLE
Branches allow representing conditional activities. These are activities carried out only if
specific condition is met. This is depicted with a diamond and outgoing transitions. Each
outgoing transition has a Boolean expression enclosed in square brackets “[ ]”. If the specific
condition is met the process follows the corresponding transition. Both activities and sub
activities can be branched. For example in the left diagram in figure eight, either activity one
or activity two will be carried out, followed by activity three, depending on whether
condition one will be satisfied. If condition one is false then the else transition will be
followed leading to activity one.
Roles enable the product deliverable diagrams to explicitly specify who will carry out a
specific activity (Weerd & Brinkkemper, 2008). A role is indicated in the lower right corner of
an activity and may represent both person and organizational role. Both activities and sub
activities can have roles. The sub activities of a complex activity may have different people
assigned to them. An example is present in figure eight. The open activity is carried out by
role two, however the responsible for sub activity one is role one.
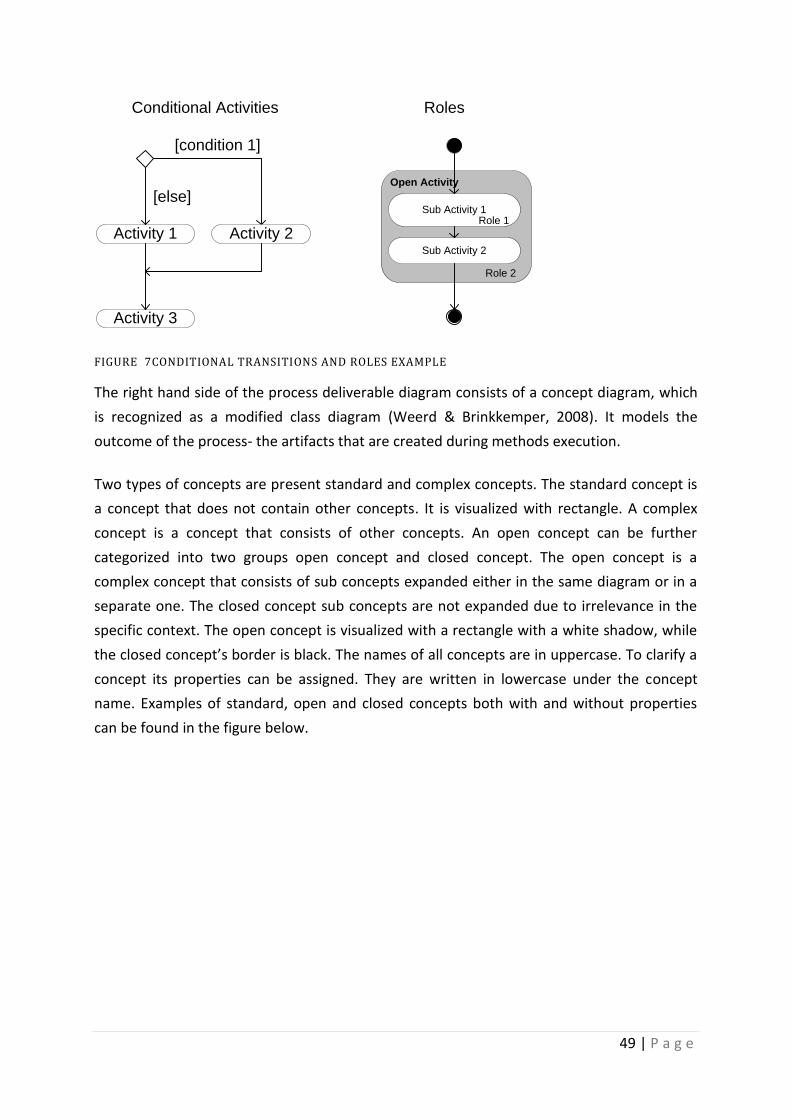
49 | P a g e
[condition 1]
Activity 2Activity 1
Activity 3
[else]
Conditional Activities Roles
Open Activity
Sub Activity 1
Sub Activity 2
Role 1
Role 2
FIGURE 7CONDITIONAL TRANSITIONS AND ROLES EXAMPLE
The right hand side of the process deliverable diagram consists of a concept diagram, which
is recognized as a modified class diagram (Weerd & Brinkkemper, 2008). It models the
outcome of the process- the artifacts that are created during methods execution.
Two types of concepts are present standard and complex concepts. The standard concept is
a concept that does not contain other concepts. It is visualized with rectangle. A complex
concept is a concept that consists of other concepts. An open concept can be further
categorized into two groups open concept and closed concept. The open concept is a
complex concept that consists of sub concepts expanded either in the same diagram or in a
separate one. The closed concept sub concepts are not expanded due to irrelevance in the
specific context. The open concept is visualized with a rectangle with a white shadow, while
the closed concept’s border is black. The names of all concepts are in uppercase. To clarify a
concept its properties can be assigned. They are written in lowercase under the concept
name. Examples of standard, open and closed concepts both with and without properties
can be found in the figure below.
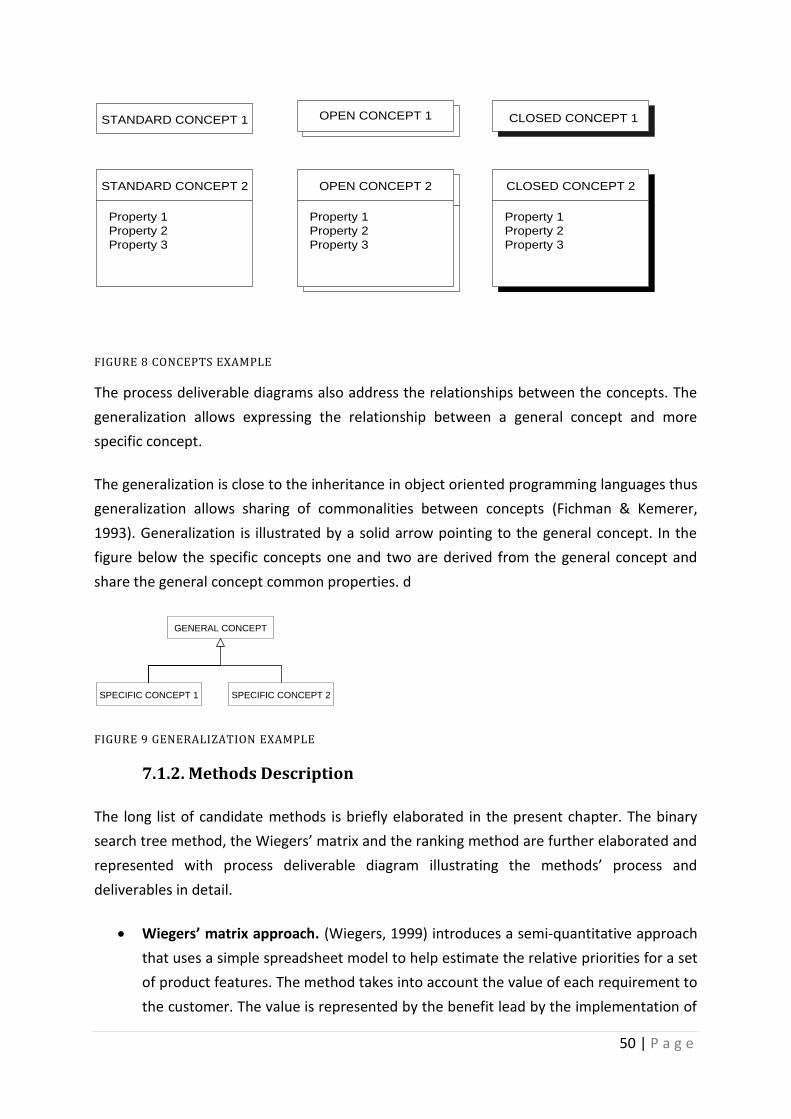
50 | P a g e
STANDARD CONCEPT 1
STANDARD CONCEPT 2
Property 1
Property 2
Property 3
OPEN CONCEPT 1
OPEN CONCEPT 2
Property 1
Property 2
Property 3
CLOSED CONCEPT 1
CLOSED CONCEPT 2
Property 1
Property 2
Property 3
FIGURE 8 CONCEPTS EXAMPLE
The process deliverable diagrams also address the relationships between the concepts. The
generalization allows expressing the relationship between a general concept and more
specific concept.
The generalization is close to the inheritance in object oriented programming languages thus
generalization allows sharing of commonalities between concepts (Fichman & Kemerer,
1993). Generalization is illustrated by a solid arrow pointing to the general concept. In the
figure below the specific concepts one and two are derived from the general concept and
share the general concept common properties. d
GENERAL CONCEPT
SPECIFIC CONCEPT 1 SPECIFIC CONCEPT 2
FIGURE 9 GENERALIZATION EXAMPLE
7.1.2. Methods Description
The long list of candidate methods is briefly elaborated in the present chapter. The binary
search tree method, the Wiegers’ matrix and the ranking method are further elaborated and
represented with process deliverable diagram illustrating the methods’ process and
deliverables in detail.
Wiegers’ matrix approach. (Wiegers, 1999) introduces a semi-quantitative approach
that uses a simple spreadsheet model to help estimate the relative priorities for a set
of product features. The method takes into account the value of each requirement to
the customer. The value is represented by the benefit lead by the implementation of
51 | P a g e
the requirement and the penalty that occurs in case the requirement is discarded or
postponed. The priority is calculated by dividing the sum of the benefit and penalty
by the costs of implementation and the technical risk involved in the requirement
implementation. Attributes are evaluated on a scale of 1 to 9. Also weight to each of
the attributes could be assigned in order to set emphasis.
Binary Search Tree (BST) (Ahl, 2005). Originally binary search trees are used in a
search for information. However BST can easily be suited in prioritizing requirements.
The method includes the following steps: Initially a set of unprioritized requirements
is present. The first (random requirement) picked requirement becomes the root
node of the BST.
Each next requirement being prioritized is compared to the root node. If the
requirement is less important than the root node, compare it to the left child node. If
the requirement is more important than the root node, compare it to the right child
node. If the node does not have any appropriate child nodes, insert the new
requirement as the new child node to the right or left, depending on if the
requirement is more or less important. This process is repeated until all of the
requirements are prioritized.
For presentation purposes the tree can be traversed in order to represent the priority
of the requirements in a linear structure (ordered list). The first item of the list being
the requirement with the highest priority and the end of the list containing the
requirement with the lowest priority.
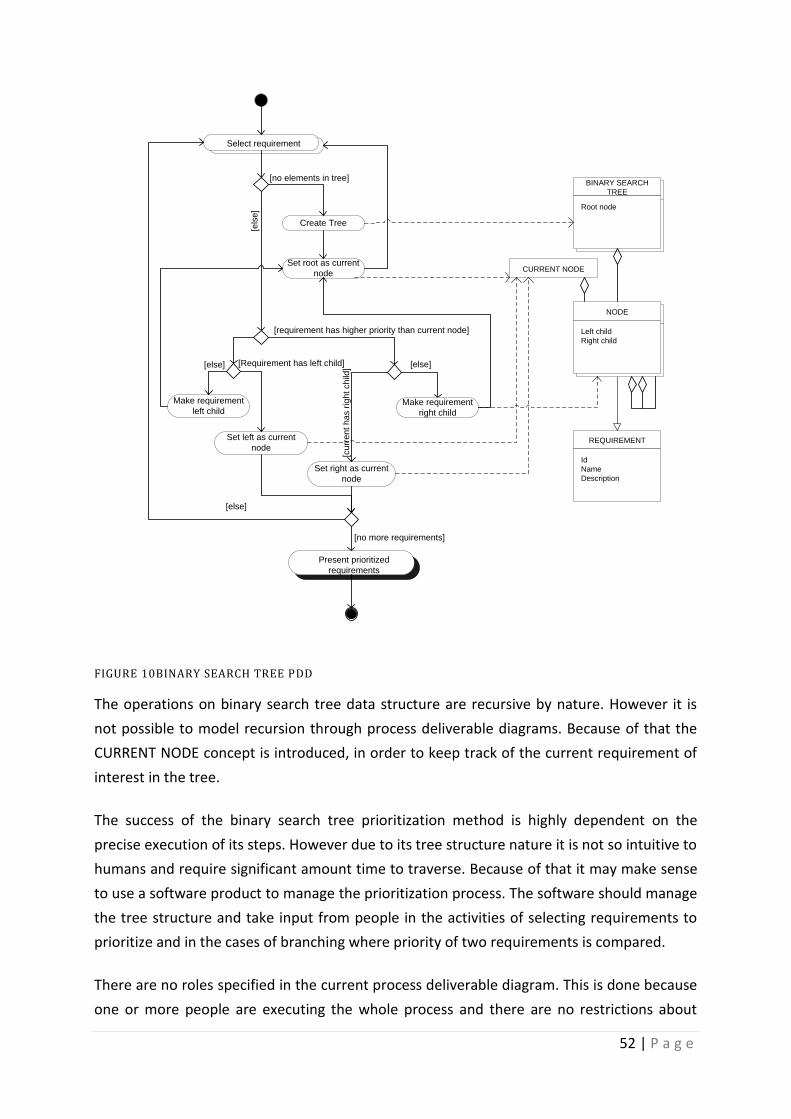
52 | P a g e
REQUIREMENT
Id
Name
Description
NODE
Left child
Right child
BINARY SEARCH
TREE
Root node
Select requirement
CURRENT NODE
Create Tree
Set root as current
node
Make requirement
right child
Set right as current
node
[cu
rre
nt h
as r
igh
t ch
ild]
[else]
[no more requirements]
Set left as current
node
Make requirement
left child
Present prioritized
requirements
[Requirement has left child][else]
[requirement has higher priority than current node]
[else]
[els
e]
[no elements in tree]
FIGURE 10BINARY SEARCH TREE PDD
The operations on binary search tree data structure are recursive by nature. However it is
not possible to model recursion through process deliverable diagrams. Because of that the
CURRENT NODE concept is introduced, in order to keep track of the current requirement of
interest in the tree.
The success of the binary search tree prioritization method is highly dependent on the
precise execution of its steps. However due to its tree structure nature it is not so intuitive to
humans and require significant amount time to traverse. Because of that it may make sense
to use a software product to manage the prioritization process. The software should manage
the tree structure and take input from people in the activities of selecting requirements to
prioritize and in the cases of branching where priority of two requirements is compared.
There are no roles specified in the current process deliverable diagram. This is done because
one or more people are executing the whole process and there are no restrictions about
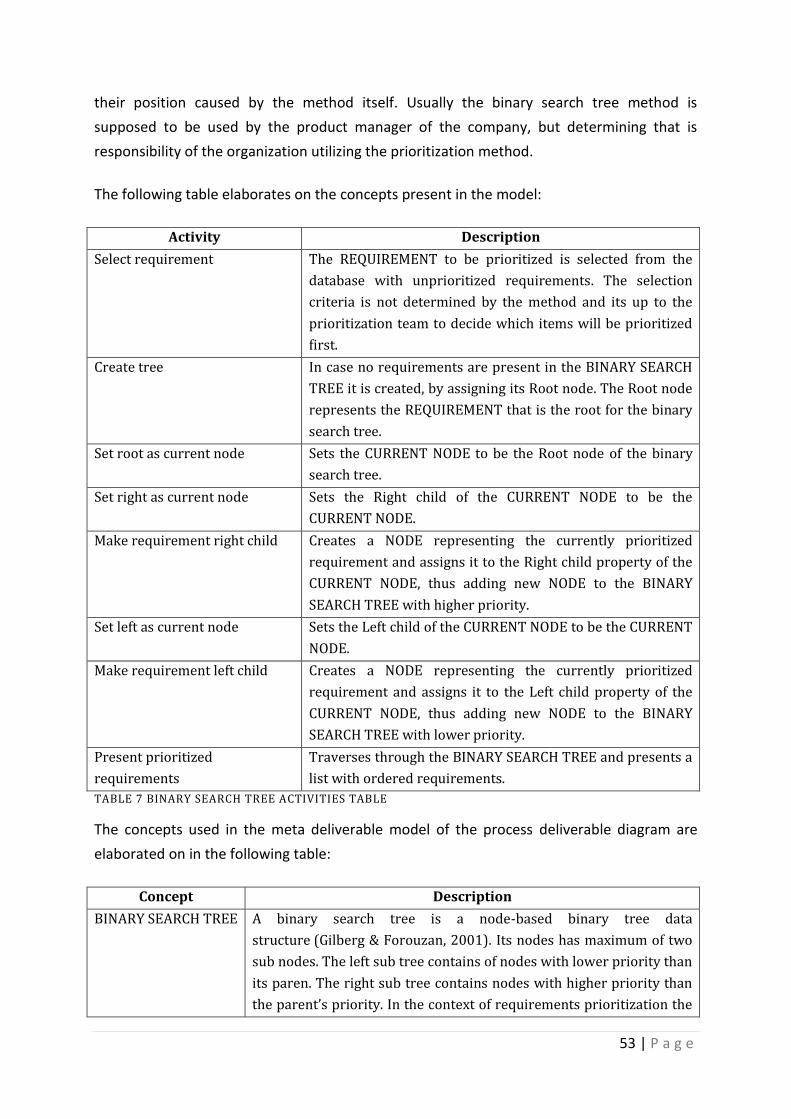
53 | P a g e
their position caused by the method itself. Usually the binary search tree method is
supposed to be used by the product manager of the company, but determining that is
responsibility of the organization utilizing the prioritization method.
The following table elaborates on the concepts present in the model:
Activity Description
Select requirement The REQUIREMENT to be prioritized is selected from the
database with unprioritized requirements. The selection
criteria is not determined by the method and its up to the
prioritization team to decide which items will be prioritized
first.
Create tree In case no requirements are present in the BINARY SEARCH
TREE it is created, by assigning its Root node. The Root node
represents the REQUIREMENT that is the root for the binary
search tree.
Set root as current node Sets the CURRENT NODE to be the Root node of the binary
search tree.
Set right as current node Sets the Right child of the CURRENT NODE to be the
CURRENT NODE.
Make requirement right child Creates a NODE representing the currently prioritized
requirement and assigns it to the Right child property of the
CURRENT NODE, thus adding new NODE to the BINARY
SEARCH TREE with higher priority.
Set left as current node Sets the Left child of the CURRENT NODE to be the CURRENT
NODE.
Make requirement left child Creates a NODE representing the currently prioritized
requirement and assigns it to the Left child property of the
CURRENT NODE, thus adding new NODE to the BINARY
SEARCH TREE with lower priority.
Present prioritized
requirements
Traverses through the BINARY SEARCH TREE and presents a
list with ordered requirements.
TABLE 7 BINARY SEARCH TREE ACTIVITIES TABLE
The concepts used in the meta deliverable model of the process deliverable diagram are
elaborated on in the following table:
Concept Description
BINARY SEARCH TREE A binary search tree is a node-based binary tree data
structure (Gilberg & Forouzan, 2001). Its nodes has maximum of two
sub nodes. The left sub tree contains of nodes with lower priority than
its paren. The right sub tree contains nodes with higher priority than
the parent’s priority. In the context of requirements prioritization the
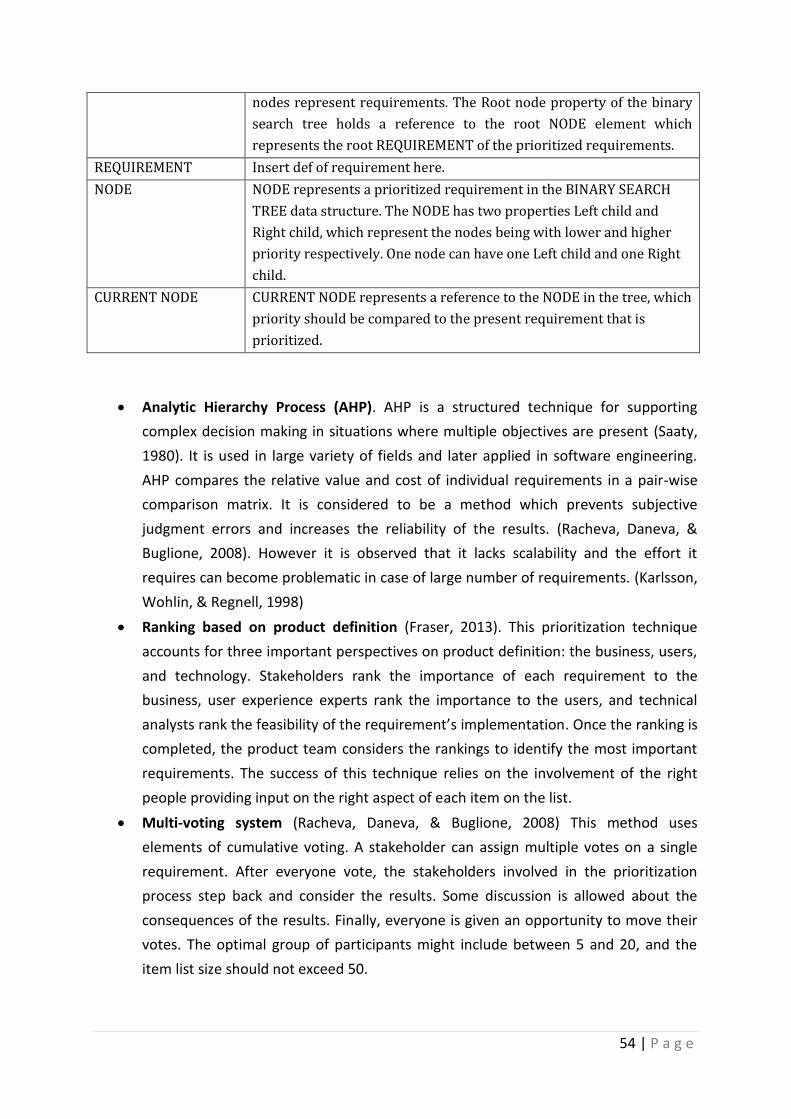
54 | P a g e
nodes represent requirements. The Root node property of the binary
search tree holds a reference to the root NODE element which
represents the root REQUIREMENT of the prioritized requirements.
REQUIREMENT Insert def of requirement here.
NODE NODE represents a prioritized requirement in the BINARY SEARCH
TREE data structure. The NODE has two properties Left child and
Right child, which represent the nodes being with lower and higher
priority respectively. One node can have one Left child and one Right
child.
CURRENT NODE CURRENT NODE represents a reference to the NODE in the tree, which
priority should be compared to the present requirement that is
prioritized.
Analytic Hierarchy Process (AHP). AHP is a structured technique for supporting
complex decision making in situations where multiple objectives are present (Saaty,
1980). It is used in large variety of fields and later applied in software engineering.
AHP compares the relative value and cost of individual requirements in a pair-wise
comparison matrix. It is considered to be a method which prevents subjective
judgment errors and increases the reliability of the results. (Racheva, Daneva, &
Buglione, 2008). However it is observed that it lacks scalability and the effort it
requires can become problematic in case of large number of requirements. (Karlsson,
Wohlin, & Regnell, 1998)
Ranking based on product definition (Fraser, 2013). This prioritization technique
accounts for three important perspectives on product definition: the business, users,
and technology. Stakeholders rank the importance of each requirement to the
business, user experience experts rank the importance to the users, and technical
analysts rank the feasibility of the requirement’s implementation. Once the ranking is
completed, the product team considers the rankings to identify the most important
requirements. The success of this technique relies on the involvement of the right
people providing input on the right aspect of each item on the list.
Multi-voting system (Racheva, Daneva, & Buglione, 2008) This method uses
elements of cumulative voting. A stakeholder can assign multiple votes on a single
requirement. After everyone vote, the stakeholders involved in the prioritization
process step back and consider the results. Some discussion is allowed about the
consequences of the results. Finally, everyone is given an opportunity to move their
votes. The optimal group of participants might include between 5 and 20, and the
item list size should not exceed 50.
55 | P a g e
Planning Game The planning game is a feature of extreme programming (Beck &
Anders, 2000) and is used with customers to prioritize features, based on stories. It
represents a variation of the Numeral Assignment Technique, where the customer
distributes the requirements into three groups, "those without which the system will
not function", "those that are less essential but provide significant business value,"
and "those that would be nice to have. The process is based on two criteria: business
value judged by the customer and technical risk judged by the developers.
Round-the-group prioritization (Racheva, Daneva, & Buglione, 2008): Items are
written on cards and placed in random order linearly either vertically or horizontally.
The members of the prioritization group take turns placing the items in the order
they think is the proper priority order. While doing so, each person moving the cards
is explaining their reasoning. The rest of the group members refrain from
commenting on the new prioritization. This continues around the group as many
times as it takes to find a stable order. The context of using this method includes
group size of 3 to 8, and item list size less than 15.
Pair-wise analysis (Gottesdiener) This method sets priorities by directly comparing
requirements one to another in pairs. This action is repeated until the top
requirement emerges at the top of the list. This method functions well for relatively
small number of requirements, because it requires n2 comparisons where n is the
number of requirements.
MoSCoW (Getting Started With Use Case Modeling, 2007) is a widely used method,
similar to the Numeral Assignment Technique. The requirements are roughly
classified in priority groups depending on importance. The priority groups are
described by the letters in the name of the method: M- must have, S- should have, C-
could have, W- won't have. The importance of this method is that when prioritising
the words mean something and can be used to discuss what is important.
Cumulative voting ($100 allocation) (Leffingwell & Widrig, 2003). Stakeholders
spread fictitious $100 among the requirements. After they allocate their money, the
total for each requirement is calculated. That total is divided by the number of
stakeholders which results in the value representing the priority of each item, with
highest totals being most important.
Weighted criteria analysis (Gottesdiener) Criteria affecting the priority are defined
and weights to those criteria are assigned. Then for each requirement numbers are
assigned to each weighted criterion to arrive at a total score for each requirement.
Dot voting (Gottesdiener). Stakeholders are assigned sticky dots. The dots are
assigned to requirements. At the end the dots per requirements is counted in order
to narrow down the list of requirements.
56 | P a g e
Quality functional deployment QFD (Crow, 2013), (Gottesdiener) is a structured
methodology for taking into account customer needs. A product planning matrix
known as the house of quality is created, which reflects both what (customer needs)
and how (designer needs).
Ping Pong Balls (Schwaber, 2004). A fixed number of ping pong ball units are given to
the prioritizing group. The ping pong balls represent units of one dimension for
prioritization such as value, risk or cost. The group discusses how to allocate ping
pong balls to each item until everyone agrees that the allocation makes sense. For
large lists, this is done in a spreadsheet with fewer people involved. This method is
appropriate for projects where 1 to12 participants take part in the prioritization
effort.
After a general knowledge of the available methods is present the list for evaluation should
be shortened in order to be able to perform the experiment. To specify the three
requirements prioritization methods that will be further investigated two steps are
undertaken. First the prioritization methods are classified based on Herrmann & Daneva’s
framework (2008) described in the following chapter. Then based on the methods
characteristics and factors derived from the scope and limitations of the research the three
methods are chosen.
7.2. Prioritization methods classification
To be able to classify the examined prioritization methods a classification criteria are
needed. The aim of the present research is not set on investigating what is the most
appropriate way to classify requirements. Because of that an already developed
classification framework is utilized. For the purpose of this research the framework of
Herrmann & Daneva (2008) is used.
They derive the classification factors for requirements prioritization methods by performing
a systematic review of scientific literature. Herrmann et al. recognize the requirements
prioritization process as a core concept in the requirements prioritization. According to them
each requirement can be characterized by the following base properties: type, estimated
benefit to stakeholders, estimated size of software that embeds the requirement, estimated
cost to build what embeds the requirement, priority and requirement dependencies.
The type means the combination of two qualities- functional or non-functional requirement
also recognized as functional, quality requirement and constraint and whether it is a primary
or secondary requirement. Primary requirements are the ones demanded by stakeholders
who benefit from them, secondary requirements are those derived from the primary ones
57 | P a g e
(Poort & With, 2004). For example the primary requirements can be decomposed, supported
or constrained by secondary requirements.
The requirement dependencies in the current context means that whether a requirement is
implemented causes effect on the benefit or the cost of another requirement. Herrmann
and Daneva’s research distinguish six ways of treating dependencies and thus classify
whether a requirements prioritization method applies to each of the six ways (Daneva &
Herrmann, 2008).
1. Fixed Importance: Each requirement’s priority is represented by a fixed value. Thus
all dependencies among requirements are disregarded. This characteristic is
commonly observed among the requirements prioritization methods.
2. Grouping requirements: Requirements are bundled into groups relatively
independent from the others. This way the dependencies among requirements are
treated and requirements with strong connection to each other are separated from
the other requirements and groups. Thus the complexity of the estimation and
therefore the prioritization is reduced, because that allows estimating the expected
benefits of the whole group prior to detailed investigation of each separate
requirement.
3. Using relative values instead of absolutes: In ideal situation the benefit and costs of
implementing a requirement represented in monetary terms could be predicted.
That will enable to easily decide which requirement adds most value to the product
and thus to determine the priority of the requirements. However estimating those
absolute values is found to be extremely time consuming task and what is worse the
results may be inaccurate (Karlsson J. , 1996). Especially in agile development the
time spent in analysis and estimation can be better invested in lean development
which results in quicker iterations and thus earlier feedback. To prevent that some
prioritization methods utilize relative values.
4. Pair-wise comparison: Some requirements prioritization methods result in
determining a value per requirement representing its priority. For example it can be
“must have” some number from a scale etc. Other prioritization methods determine
the priority of a requirement by pair-wise comparisons between the requirements to
be implemented.
5. Using discrete values instead of a continuous scale: The methods which have this
characteristic use a fixed set of categories instead of virtually infinite set of numbers
and fractions present in a certain interval or infinite scale. An example can be “low,
medium, high”, “1-2-3-…-5” etc.
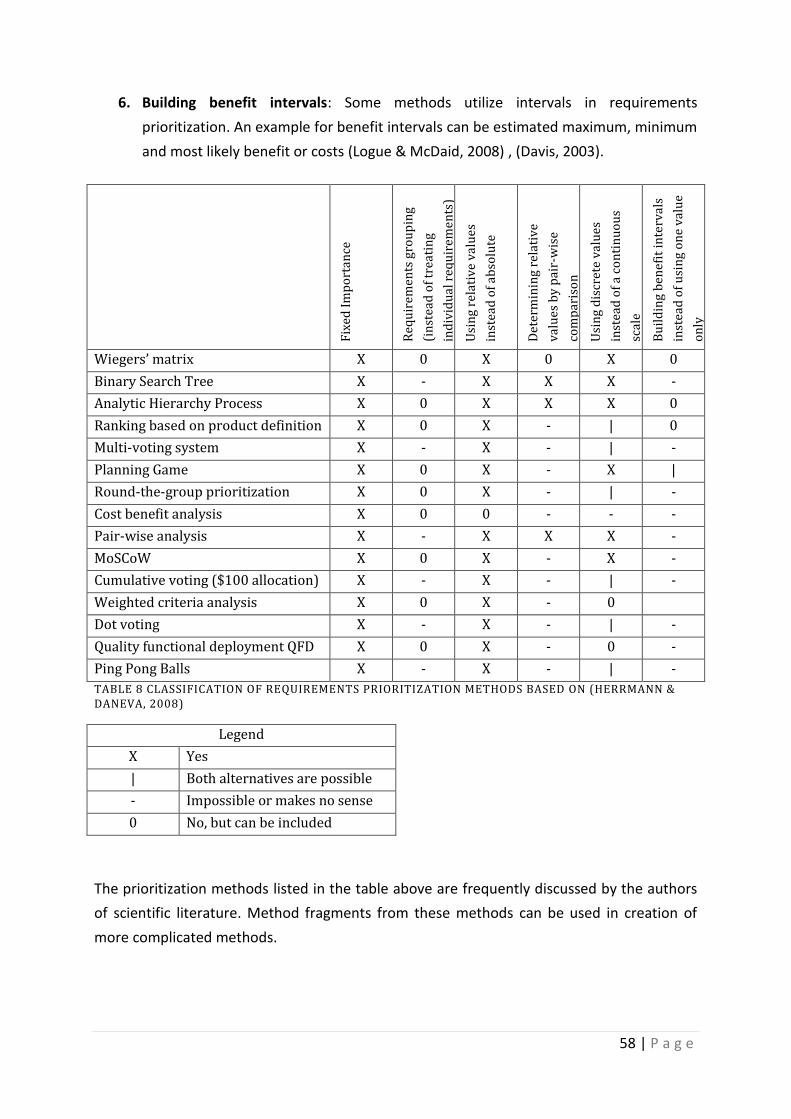
58 | P a g e
6. Building benefit intervals: Some methods utilize intervals in requirements
prioritization. An example for benefit intervals can be estimated maximum, minimum
and most likely benefit or costs (Logue & McDaid, 2008) , (Davis, 2003).
Fix
ed I
mp
ort
ance
Req
uir
emen
ts g
rou
pin
g
(in
stea
d o
f tr
eati
ng
ind
ivid
ual
req
uir
eme
nts
)
Usi
ng
rela
tiv
e v
alu
es
inst
ead
of
ab
solu
te
Det
erm
inin
g re
lati
ve
val
ues
by
pai
r-w
ise
com
par
iso
n
Usi
ng
dis
cret
e v
alu
es
inst
ead
of
a co
nti
nu
ou
s
scal
e
Bu
ild
ing
ben
efit
inte
rval
s
inst
ead
of
usi
ng
on
e v
alu
e
on
ly
Wiegers’ matrix X 0 X 0 X 0
Binary Search Tree X - X X X -
Analytic Hierarchy Process X 0 X X X 0
Ranking based on product definition X 0 X - | 0
Multi-voting system X - X - | -
Planning Game X 0 X - X |
Round-the-group prioritization X 0 X - | -
Cost benefit analysis X 0 0 - - -
Pair-wise analysis X - X X X -
MoSCoW X 0 X - X -
Cumulative voting ($100 allocation) X - X - | -
Weighted criteria analysis X 0 X - 0
Dot voting X - X - | -
Quality functional deployment QFD X 0 X - 0 -
Ping Pong Balls X - X - | -
TABLE 8 CLASSIFICATION OF REQUIREMENTS PRIORITIZATION METHODS BASED ON (HERRMANN & DANEVA, 2008)
Legend
X Yes
| Both alternatives are possible
- Impossible or makes no sense
0 No, but can be included
The prioritization methods listed in the table above are frequently discussed by the authors
of scientific literature. Method fragments from these methods can be used in creation of
more complicated methods.
59 | P a g e
7.3. Selection of experiment methods
The scope of the present research affects the prioritization methods chosen for
evaluation (Wohlin C. , Runeson, Höst, Ohlsson, Regnell, & Wesslén, 2012). The
organizations which share the attributes set in the research scope require scalable and rigid
techniques that prioritize requirements in relatively quick but still reliable manner. A
thorough cost benefit analysis of each requirement for example may result in taking the
most optimal decision, but when dealing with hundred or thousand of requirements will
leave a SME software company without resources for the actual implementation of the
requirements.
Because of that the characteristics of the prioritization methods are taken into consideration
when deciding which one of them should be implemented. For example the fixed
importance reduces the workload of prioritizing by disregarding the dependencies between
the requirements (Daneva & Herrmann, 2008).
The grouping of requirements provides the possibility of a high level prioritization of bundle
of requirements (Daneva & Herrmann, 2008). For example requirements related to a certain
new functionality can be grouped and analyzed together. That way the expected benefit and
effort for implementation of that functionality can be estimated and a decision can be made
whether this functionality is important for the product. If so it is decomposed to the actual
requirements related to it and they are further prioritized.
Numerous authors state that using relative values instead of absolute in estimating the costs
and benefits significantly increases the performance of the process without much influence
in the results of the prioritization. Because of that, methods using relative values should be
preferred in the current context.
Pair-wise comparison forces the stakeholders involved in the prioritization to consider the
rest of the requirements during prioritization process. On the other hand its scalability is
closely related to the used method. For example pair-wise analysis may require too much
effort in case when the product management team is dealing with hundreds of
requirements.
Using discrete values instead of a continuous scale limits the choice of the prioritization
team, thus simplifies the decision the team has to make (Daneva & Herrmann, 2008). For
example if MoSCoW is used a requirement can have four priorities- “must”, “should”,
“could” and “won’t”. That way when prioritizing the requirements no decisions is made
about the order of the requirements present in each of the four groups. On the other hand
60 | P a g e
using too few groups reduces the granularity of the prioritization and can result in further
need of reprioritizing the requirements in a group if their number is too high.
The chosen methods are Binary search tree, Wiegers matrix and Ranking Method. The three
of them use different approach in prioritization. Although all of them use fixed importance
and relative values instead of absolutes they have several differences.
Ranking is chosen because the company hosting the experiment is already utilizing it. As
such it can be used as a control method in the experiment. It is a widely used approach in
industry because of its simplicity and speed. It can prioritize both single requirements and
group of requirements. In the case of the experiment hosting company both of the cases are
used. Fox example a new feature that will be decomposed to numerous requirements is
prioritized first. Then if its priority is high it is decomposed and each of the requirements are
further analyzed. Ranking does not use pair wise comparison. Both discrete values and
continuous scale can be used. In the context of the experiment the priority of a requirement
can be a value between zero and one hundred including the fractions between the integer
numbers. Typically benefit intervals are not used but they can be included in the method.
Binary search tree relies on direct comparison of the importance of requirements (Ahl,
2005). Thus it provides a clear way to communicate the results of the prioritization process
with the stakeholders, which are not directly involved in the process. It reduces the number
of comparisons compared to different methods using similar approach e.g. Pair-wise analysis
and AHP and thus it is more scalable than those two methods. That is the main reason it is
chosen for the purpose of the experiment among the representatives of methods using pair-
wise comparison. It does not use grouping of requirements and no benefit intervals are
applicable.
Wiegers matrix presents a simple approach which allows to decompose the priority into four
attributes- benefit, penalty, cost and risk and to set weights to them in according to each
attribute relative importance for the project (Wiegers, 1999). This forces the prioritization
stakeholders to deepen the analysis taking into account those aspects without introduction
of large overhead in the process. It allows grouping of requirements although that is not
typical for the method. Pair wise comparisons are also quite unusual for Wiegers matrix,
although they can be used in rare cases to support a certain decision. All of the estimated
values are discrete in the interval form one to nine.
61 | P a g e
8. Results Analysis
This chapter focuses on the analysis of the experiment results and leads to the conclusions
based on the collected data. The steps that are performed in this stage of the experiment
are elaborated in the analysis and interpretation chapter of the thesis. Initially the dataset is
described with the help of descriptive statistics. This is followed by identification of possible
outliers and dataset reduction. If a possible outlier is identified a further analysis in two
directions is required. The first step is to identify whether a certain record is indeed an
outlier is performed. Later the reasons for outlier’s presence are identified and discussed.
Once the dataset is reduced the null hypothesis is put to the test.
8.1. Prioritization Effort
Total time consumption variable measures the total time each method requires to prioritize
a requirement. The time spent is recorded in the minutes during the prioritization sessions.
This measure indicates the effort required for prioritizing requirements. Each prioritization
meeting took two hours in total. During the first meeting seven requirements have been
analyzed and prioritized with the three techniques. During the second and the third
prioritization meetings six requirements were processed.
The ranking method appears to be the fastest one among the three methods studied in the
experiment. It is also the method originally used in the experiment hosting company. Thus
no additional time is spent due to inexperience of the team with this method. Also no trend
is visible among the time consumption between the three prioritization sessions, separated
by dashed blue vertical lines in the scatter plot figure.
The scatter plot of the time spent for the ranking method is displayed on the figure below.
No distinctive outliers are visible on the graphics. The minimum value is thirty seconds
indicated for both requirements two and sixteen. In both of the cases the decision what is
the appropriate priority is taken extremely fast because a common agreement was met
during the analysis of the requirement. In that case the requirement is either extremely
urgent it has to be implemented before the rest or its priority is low enough that it will be
postponed for a long period of time. In the second case the exact priority is not of that great
importance because after a certain period (about a year or longer) the priority of the already
not implemented requirements has to be revised.
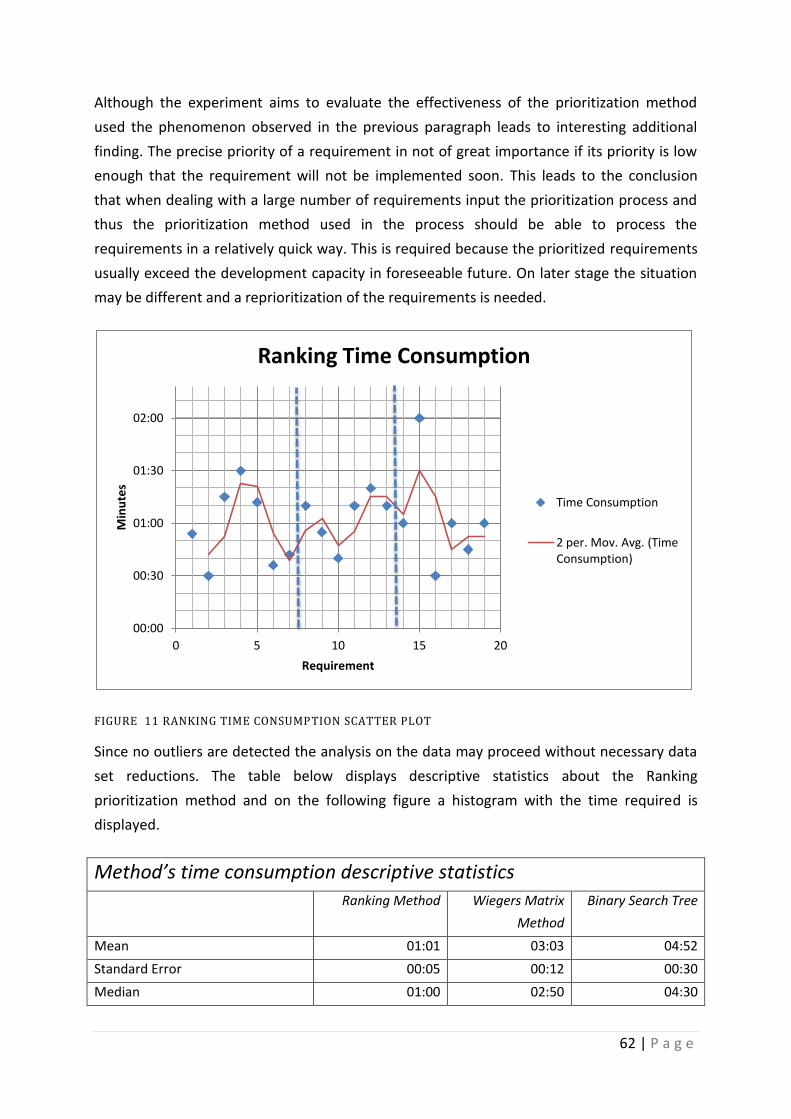
62 | P a g e
Although the experiment aims to evaluate the effectiveness of the prioritization method
used the phenomenon observed in the previous paragraph leads to interesting additional
finding. The precise priority of a requirement in not of great importance if its priority is low
enough that the requirement will not be implemented soon. This leads to the conclusion
that when dealing with a large number of requirements input the prioritization process and
thus the prioritization method used in the process should be able to process the
requirements in a relatively quick way. This is required because the prioritized requirements
usually exceed the development capacity in foreseeable future. On later stage the situation
may be different and a reprioritization of the requirements is needed.
FIGURE 11 RANKING TIME CONSUMPTION SCATTER PLOT
Since no outliers are detected the analysis on the data may proceed without necessary data
set reductions. The table below displays descriptive statistics about the Ranking
prioritization method and on the following figure a histogram with the time required is
displayed.
Method’s time consumption descriptive statistics
Ranking Method Wiegers Matrix
Method
Binary Search Tree
Mean 01:01 03:03 04:52
Standard Error 00:05 00:12 00:30
Median 01:00 02:50 04:30
00:00
00:30
01:00
01:30
02:00
0 5 10 15 20
Min
ute
s
Requirement
Ranking Time Consumption
Time Consumption
2 per. Mov. Avg. (Time Consumption)
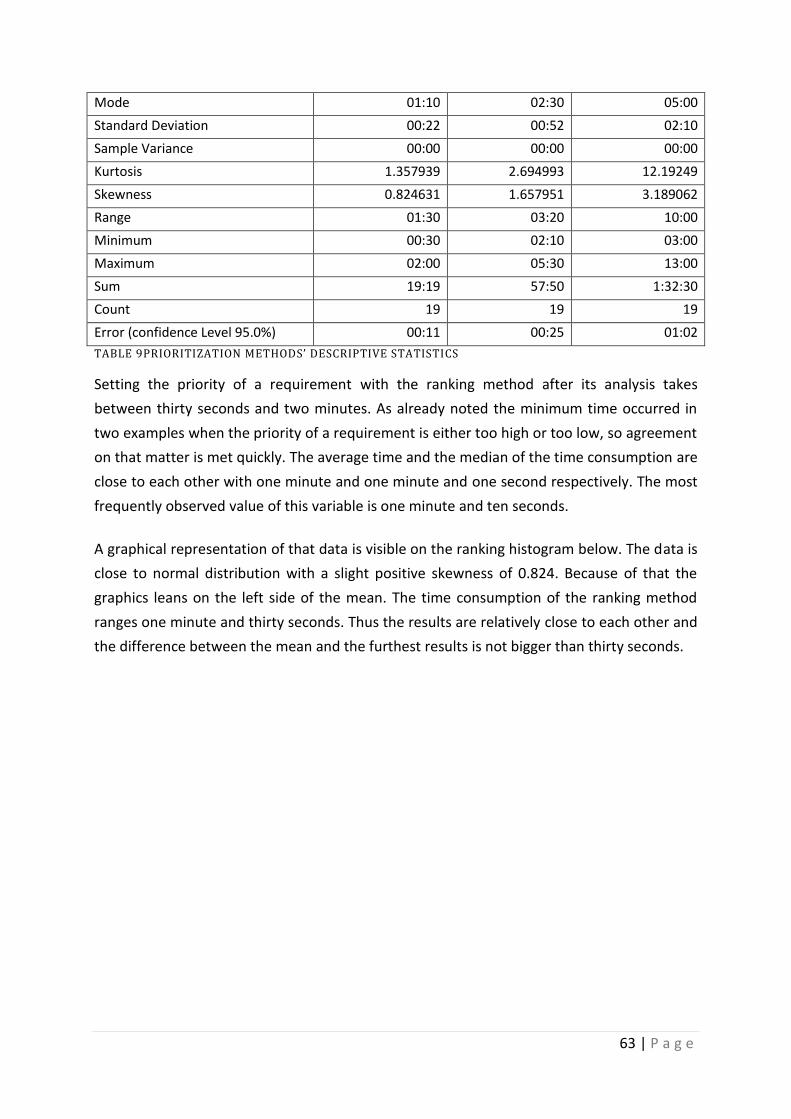
63 | P a g e
Mode 01:10 02:30 05:00
Standard Deviation 00:22 00:52 02:10
Sample Variance 00:00 00:00 00:00
Kurtosis 1.357939 2.694993 12.19249
Skewness 0.824631 1.657951 3.189062
Range 01:30 03:20 10:00
Minimum 00:30 02:10 03:00
Maximum 02:00 05:30 13:00
Sum 19:19 57:50 1:32:30
Count 19 19 19
Error (confidence Level 95.0%) 00:11 00:25 01:02
TABLE 9PRIORITIZATION METHODS’ DESCRIPTIVE STATISTICS
Setting the priority of a requirement with the ranking method after its analysis takes
between thirty seconds and two minutes. As already noted the minimum time occurred in
two examples when the priority of a requirement is either too high or too low, so agreement
on that matter is met quickly. The average time and the median of the time consumption are
close to each other with one minute and one minute and one second respectively. The most
frequently observed value of this variable is one minute and ten seconds.
A graphical representation of that data is visible on the ranking histogram below. The data is
close to normal distribution with a slight positive skewness of 0.824. Because of that the
graphics leans on the left side of the mean. The time consumption of the ranking method
ranges one minute and thirty seconds. Thus the results are relatively close to each other and
the difference between the mean and the furthest results is not bigger than thirty seconds.
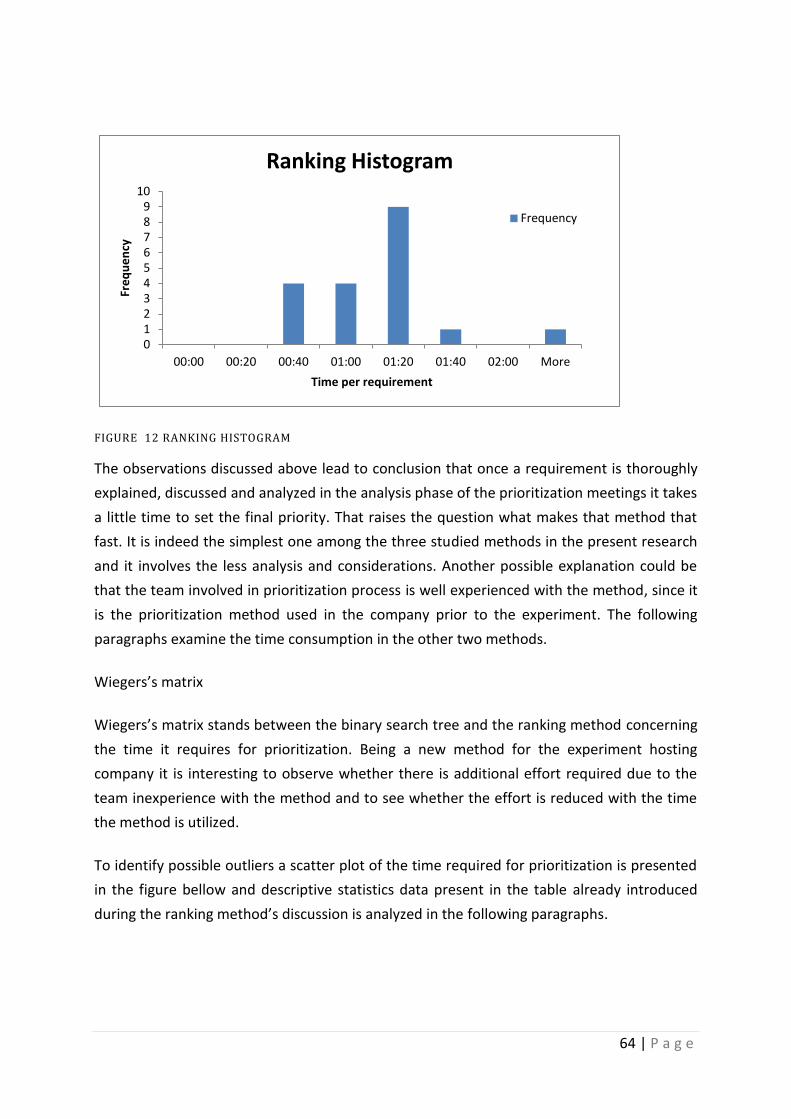
64 | P a g e
FIGURE 12 RANKING HISTOGRAM
The observations discussed above lead to conclusion that once a requirement is thoroughly
explained, discussed and analyzed in the analysis phase of the prioritization meetings it takes
a little time to set the final priority. That raises the question what makes that method that
fast. It is indeed the simplest one among the three studied methods in the present research
and it involves the less analysis and considerations. Another possible explanation could be
that the team involved in prioritization process is well experienced with the method, since it
is the prioritization method used in the company prior to the experiment. The following
paragraphs examine the time consumption in the other two methods.
Wiegers’s matrix
Wiegers’s matrix stands between the binary search tree and the ranking method concerning
the time it requires for prioritization. Being a new method for the experiment hosting
company it is interesting to observe whether there is additional effort required due to the
team inexperience with the method and to see whether the effort is reduced with the time
the method is utilized.
To identify possible outliers a scatter plot of the time required for prioritization is presented
in the figure bellow and descriptive statistics data present in the table already introduced
during the ranking method’s discussion is analyzed in the following paragraphs.
0 1 2 3 4 5 6 7 8 9
10
00:00 00:20 00:40 01:00 01:20 01:40 02:00 More
Fre
qu
en
cy
Time per requirement
Ranking Histogram
Frequency
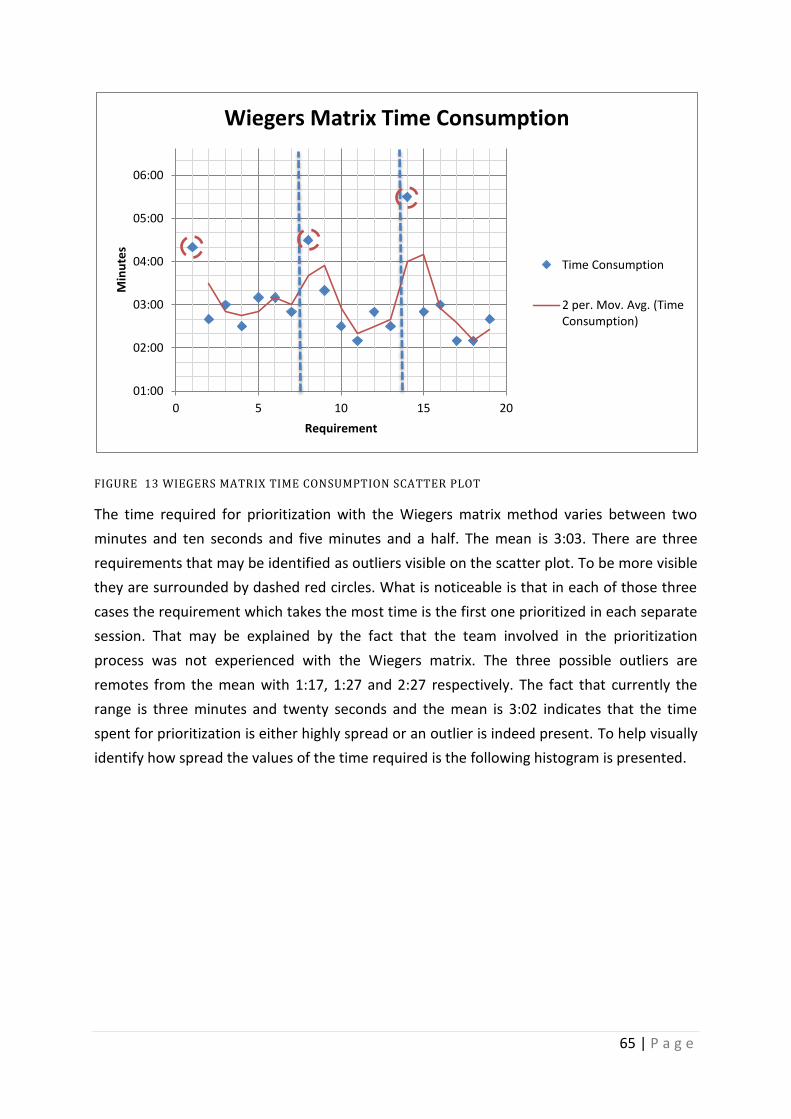
65 | P a g e
FIGURE 13 WIEGERS MATRIX TIME CONSUMPTION SCATTER PLOT
The time required for prioritization with the Wiegers matrix method varies between two
minutes and ten seconds and five minutes and a half. The mean is 3:03. There are three
requirements that may be identified as outliers visible on the scatter plot. To be more visible
they are surrounded by dashed red circles. What is noticeable is that in each of those three
cases the requirement which takes the most time is the first one prioritized in each separate
session. That may be explained by the fact that the team involved in the prioritization
process was not experienced with the Wiegers matrix. The three possible outliers are
remotes from the mean with 1:17, 1:27 and 2:27 respectively. The fact that currently the
range is three minutes and twenty seconds and the mean is 3:02 indicates that the time
spent for prioritization is either highly spread or an outlier is indeed present. To help visually
identify how spread the values of the time required is the following histogram is presented.
01:00
02:00
03:00
04:00
05:00
06:00
0 5 10 15 20
Min
ute
s
Requirement
Wiegers Matrix Time Consumption
Time Consumption
2 per. Mov. Avg. (Time Consumption)
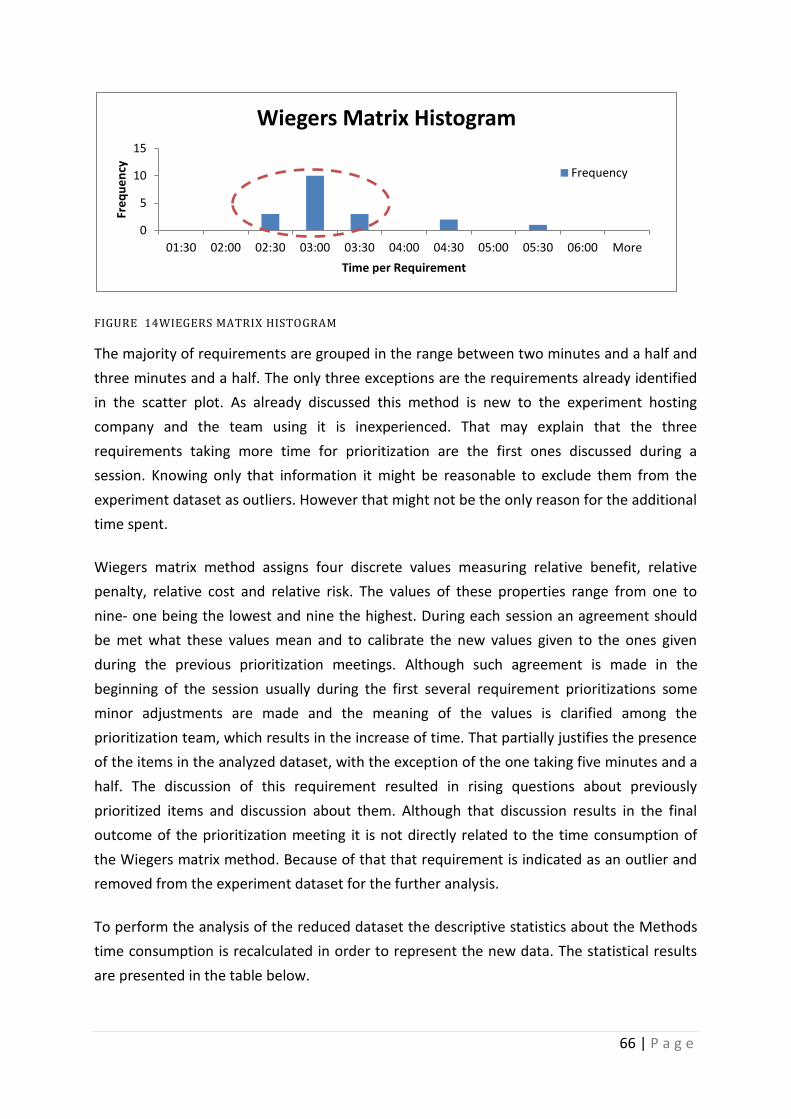
66 | P a g e
FIGURE 14WIEGERS MATRIX HISTOGRAM
The majority of requirements are grouped in the range between two minutes and a half and
three minutes and a half. The only three exceptions are the requirements already identified
in the scatter plot. As already discussed this method is new to the experiment hosting
company and the team using it is inexperienced. That may explain that the three
requirements taking more time for prioritization are the first ones discussed during a
session. Knowing only that information it might be reasonable to exclude them from the
experiment dataset as outliers. However that might not be the only reason for the additional
time spent.
Wiegers matrix method assigns four discrete values measuring relative benefit, relative
penalty, relative cost and relative risk. The values of these properties range from one to
nine- one being the lowest and nine the highest. During each session an agreement should
be met what these values mean and to calibrate the new values given to the ones given
during the previous prioritization meetings. Although such agreement is made in the
beginning of the session usually during the first several requirement prioritizations some
minor adjustments are made and the meaning of the values is clarified among the
prioritization team, which results in the increase of time. That partially justifies the presence
of the items in the analyzed dataset, with the exception of the one taking five minutes and a
half. The discussion of this requirement resulted in rising questions about previously
prioritized items and discussion about them. Although that discussion results in the final
outcome of the prioritization meeting it is not directly related to the time consumption of
the Wiegers matrix method. Because of that that requirement is indicated as an outlier and
removed from the experiment dataset for the further analysis.
To perform the analysis of the reduced dataset the descriptive statistics about the Methods
time consumption is recalculated in order to represent the new data. The statistical results
are presented in the table below.
0
5
10
15
01:30 02:00 02:30 03:00 03:30 04:00 04:30 05:00 05:30 06:00 More
Fre
qu
en
cy
Time per Requirement
Wiegers Matrix Histogram
Frequency

67 | P a g e
Wiegers matrix time consumption descriptive statistics
Statistical Variable Old value New Value Difference
Mean 03:03 02:54 00:08
Standard Error 00:12 00:09 00:03
Median 02:50 02:50 00:00
Mode 02:30 02:30 00:00
Standard Deviation 00:52 00:39 00:13
Sample Variance 00:00 00:00 00:00
Kurtosis 2.694993 1.840898 0.854095
Skewness 1.657951 1.350671 0.30728
Range 03:20 02:20 01:00
Minimum 02:10 02:10 00:00
Maximum 05:30 04:30 01:00
Sum 57:50 52:20 05:30
Count 19 18 1
Confidence Level (95.0%) 00:25 00:19 00:06
TABLE 10 WIEGERS MATRIX DESCRIPTIVE STATISTICS (REDUCED DATASET)
The table illustrates the initial results before the dataset reduction the new values and the
difference between the results since the outlier is removed. Since the requirement taking
the most time is removed from the dataset the mean expectedly drops with eight seconds
from 3:03 to 2:54. The standard error and the standard deviation are also decreased with
three and thirteen seconds respectively. Another noticeable difference is in the range which
drops roughly by 30% from three minutes twenty second to two minutes and twenty
seconds.
FIGURE 15WIEGERS MATRIX HISTOGRAM (REDUCED DATASET)
A graphical representation of that data is visible on the Wiegers matrix histogram below. The
data is close to normal distribution with a positive skewness of 1.350671. Due to that the the
graphics is leaned to the left of the mean with a mode of two minutes and a half. The time
0
5
10
15
01:30 02:00 02:30 03:00 03:30 04:00 04:30 05:00 05:30 06:00 More
Fre
qu
en
cy
Time per Requirement
Wiegers Matrix (reduced dataset)
Frequency
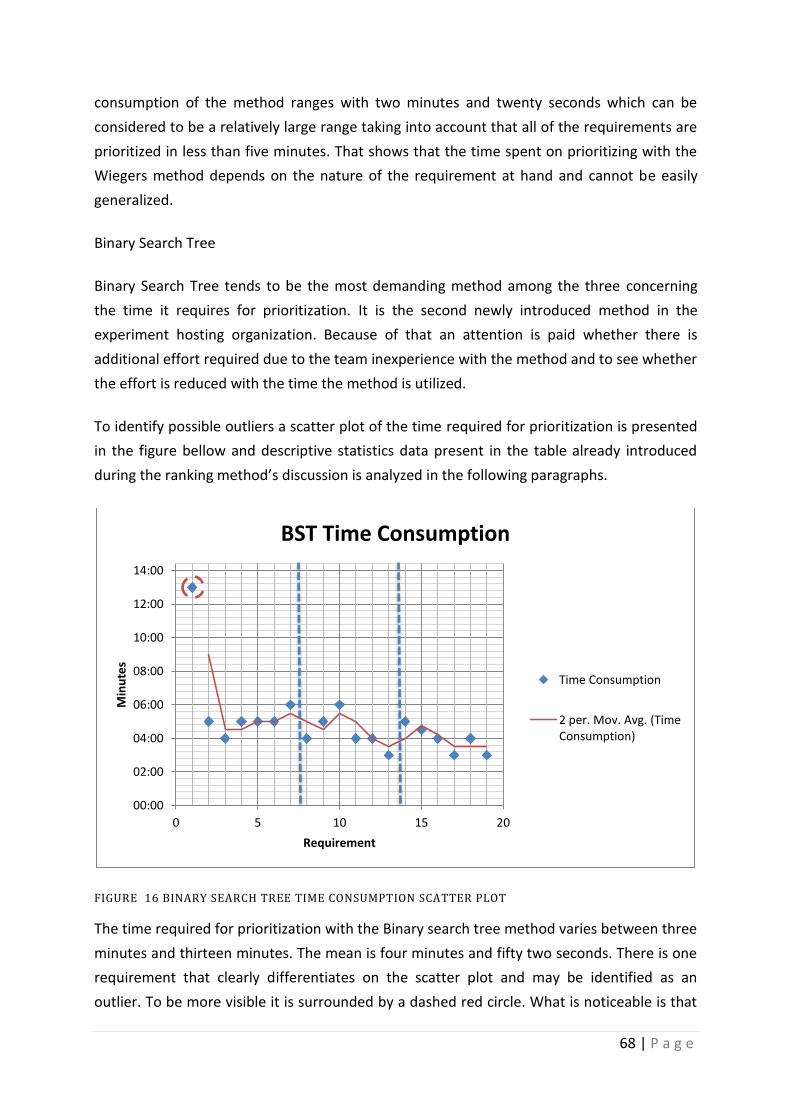
68 | P a g e
consumption of the method ranges with two minutes and twenty seconds which can be
considered to be a relatively large range taking into account that all of the requirements are
prioritized in less than five minutes. That shows that the time spent on prioritizing with the
Wiegers method depends on the nature of the requirement at hand and cannot be easily
generalized.
Binary Search Tree
Binary Search Tree tends to be the most demanding method among the three concerning
the time it requires for prioritization. It is the second newly introduced method in the
experiment hosting organization. Because of that an attention is paid whether there is
additional effort required due to the team inexperience with the method and to see whether
the effort is reduced with the time the method is utilized.
To identify possible outliers a scatter plot of the time required for prioritization is presented
in the figure bellow and descriptive statistics data present in the table already introduced
during the ranking method’s discussion is analyzed in the following paragraphs.
FIGURE 16 BINARY SEARCH TREE TIME CONSUMPTION SCATTER PLOT
The time required for prioritization with the Binary search tree method varies between three
minutes and thirteen minutes. The mean is four minutes and fifty two seconds. There is one
requirement that clearly differentiates on the scatter plot and may be identified as an
outlier. To be more visible it is surrounded by a dashed red circle. What is noticeable is that
00:00
02:00
04:00
06:00
08:00
10:00
12:00
14:00
0 5 10 15 20
Min
ute
s
Requirement
BST Time Consumption
Time Consumption
2 per. Mov. Avg. (Time Consumption)
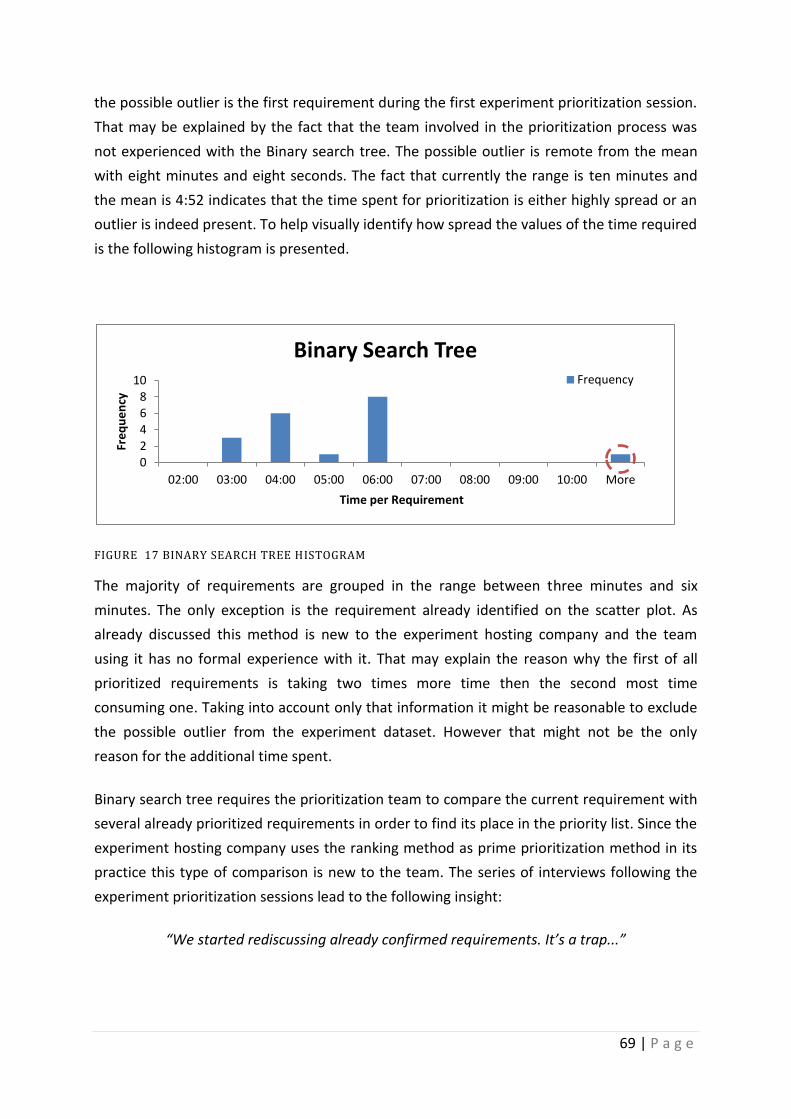
69 | P a g e
the possible outlier is the first requirement during the first experiment prioritization session.
That may be explained by the fact that the team involved in the prioritization process was
not experienced with the Binary search tree. The possible outlier is remote from the mean
with eight minutes and eight seconds. The fact that currently the range is ten minutes and
the mean is 4:52 indicates that the time spent for prioritization is either highly spread or an
outlier is indeed present. To help visually identify how spread the values of the time required
is the following histogram is presented.
FIGURE 17 BINARY SEARCH TREE HISTOGRAM
The majority of requirements are grouped in the range between three minutes and six
minutes. The only exception is the requirement already identified on the scatter plot. As
already discussed this method is new to the experiment hosting company and the team
using it has no formal experience with it. That may explain the reason why the first of all
prioritized requirements is taking two times more time then the second most time
consuming one. Taking into account only that information it might be reasonable to exclude
the possible outlier from the experiment dataset. However that might not be the only
reason for the additional time spent.
Binary search tree requires the prioritization team to compare the current requirement with
several already prioritized requirements in order to find its place in the priority list. Since the
experiment hosting company uses the ranking method as prime prioritization method in its
practice this type of comparison is new to the team. The series of interviews following the
experiment prioritization sessions lead to the following insight:
“We started rediscussing already confirmed requirements. It’s a trap...”
0 2 4 6 8
10
02:00 03:00 04:00 05:00 06:00 07:00 08:00 09:00 10:00 More
Fre
qu
en
cy
Time per Requirement
Binary Search Tree Frequency
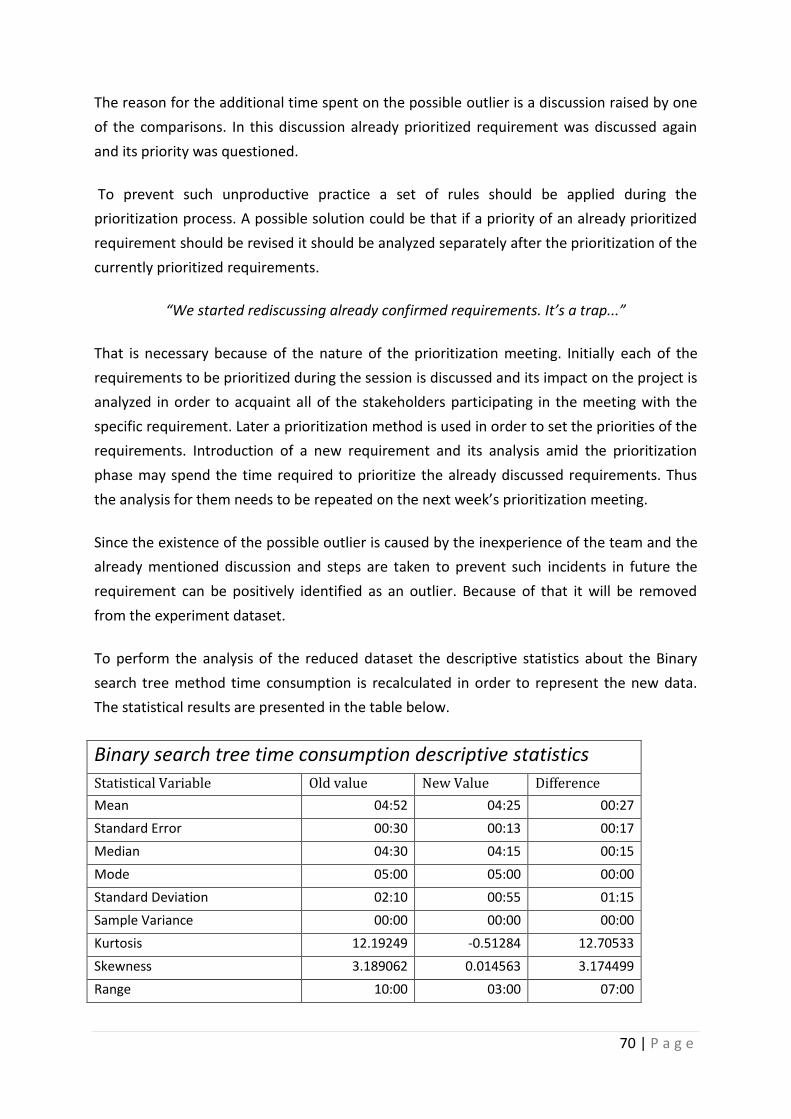
70 | P a g e
The reason for the additional time spent on the possible outlier is a discussion raised by one
of the comparisons. In this discussion already prioritized requirement was discussed again
and its priority was questioned.
To prevent such unproductive practice a set of rules should be applied during the
prioritization process. A possible solution could be that if a priority of an already prioritized
requirement should be revised it should be analyzed separately after the prioritization of the
currently prioritized requirements.
“We started rediscussing already confirmed requirements. It’s a trap...”
That is necessary because of the nature of the prioritization meeting. Initially each of the
requirements to be prioritized during the session is discussed and its impact on the project is
analyzed in order to acquaint all of the stakeholders participating in the meeting with the
specific requirement. Later a prioritization method is used in order to set the priorities of the
requirements. Introduction of a new requirement and its analysis amid the prioritization
phase may spend the time required to prioritize the already discussed requirements. Thus
the analysis for them needs to be repeated on the next week’s prioritization meeting.
Since the existence of the possible outlier is caused by the inexperience of the team and the
already mentioned discussion and steps are taken to prevent such incidents in future the
requirement can be positively identified as an outlier. Because of that it will be removed
from the experiment dataset.
To perform the analysis of the reduced dataset the descriptive statistics about the Binary
search tree method time consumption is recalculated in order to represent the new data.
The statistical results are presented in the table below.
Binary search tree time consumption descriptive statistics
Statistical Variable Old value New Value Difference
Mean 04:52 04:25 00:27
Standard Error 00:30 00:13 00:17
Median 04:30 04:15 00:15
Mode 05:00 05:00 00:00
Standard Deviation 02:10 00:55 01:15
Sample Variance 00:00 00:00 00:00
Kurtosis 12.19249 -0.51284 12.70533
Skewness 3.189062 0.014563 3.174499
Range 10:00 03:00 07:00
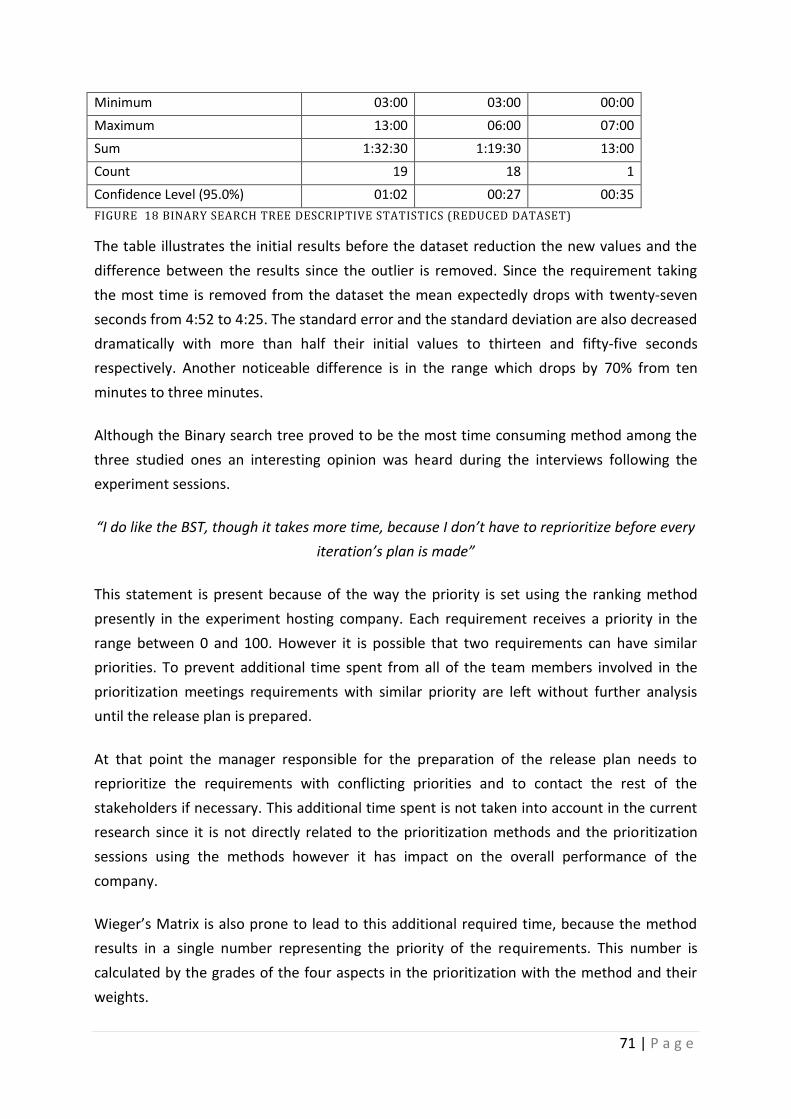
71 | P a g e
Minimum 03:00 03:00 00:00
Maximum 13:00 06:00 07:00
Sum 1:32:30 1:19:30 13:00
Count 19 18 1
Confidence Level (95.0%) 01:02 00:27 00:35
FIGURE 18 BINARY SEARCH TREE DESCRIPTIVE STATISTICS (REDUCED DATASET)
The table illustrates the initial results before the dataset reduction the new values and the
difference between the results since the outlier is removed. Since the requirement taking
the most time is removed from the dataset the mean expectedly drops with twenty-seven
seconds from 4:52 to 4:25. The standard error and the standard deviation are also decreased
dramatically with more than half their initial values to thirteen and fifty-five seconds
respectively. Another noticeable difference is in the range which drops by 70% from ten
minutes to three minutes.
Although the Binary search tree proved to be the most time consuming method among the
three studied ones an interesting opinion was heard during the interviews following the
experiment sessions.
“I do like the BST, though it takes more time, because I don’t have to reprioritize before every
iteration’s plan is made”
This statement is present because of the way the priority is set using the ranking method
presently in the experiment hosting company. Each requirement receives a priority in the
range between 0 and 100. However it is possible that two requirements can have similar
priorities. To prevent additional time spent from all of the team members involved in the
prioritization meetings requirements with similar priority are left without further analysis
until the release plan is prepared.
At that point the manager responsible for the preparation of the release plan needs to
reprioritize the requirements with conflicting priorities and to contact the rest of the
stakeholders if necessary. This additional time spent is not taken into account in the current
research since it is not directly related to the prioritization methods and the prioritization
sessions using the methods however it has impact on the overall performance of the
company.
Wieger’s Matrix is also prone to lead to this additional required time, because the method
results in a single number representing the priority of the requirements. This number is
calculated by the grades of the four aspects in the prioritization with the method and their
weights.
72 | P a g e
On the other hand the Binary search tree results in a list of ordered items which priority
cannot overlap. Because of that additional effort for reprioritizing requirements with
overlapping priority is not necessary during the preparation of the release plan and the
manager responsible for that can focus on the other tasks related to that process.
Measuring the time required the three examined methods displayed clearly that there is
clear difference between them. The ranking prioritization method performs the fastest
among the three ones with a mean of 1:01. The Wiegers Matrix prioritization method is
following with a mean of 2:54 which almost triples the time required by the ranking. The
most time consuming method proved to be the Binary search tree which time required per
requirement mean is 4:25. However it is noticed that the binary search tree has one
advantage among the other methods which is that it saves time for future reprioritization
during the release planning phase.
The other two objective variables measured by the experiment are easier to analyze since
they are derived by the methods sequence and time each of the requirements required. The
following paragraphs will elaborate on the required number of decisions per method and the
total time consumption per method.
The required number of decisions per method is directly related to the steps performed in
each of the prioritization methods studied in the present research. This variable measures
the decisions required by the method and not the questions raised during the prioritization
process.
The ranking method requires the lowest number of decisions per requirement. Since the
analysis with this method is less structured and the only output of the method is one priority
score it requires one decision to be taken per requirement which represents requirements
prioritization rank in the scale from one to one hundred.
The Wiegers Matrix also requires fixed number of decisions per requirement. It presents a
simple approach which allows to decompose the priority into four attributes- benefit,
penalty, cost and risk and to set weights to them in according to each attribute relative
importance for the project (Wiegers, 1999). This forces the prioritization stakeholders to
deepen the analysis taking into account those aspects without introduction of large
overhead in the process. Once the weights are set prioritization with the Wiegers matrix
requires four decisions per requirement in order to specify the attributes of the priority
namely the expected benefit, penalty, cost and risk.
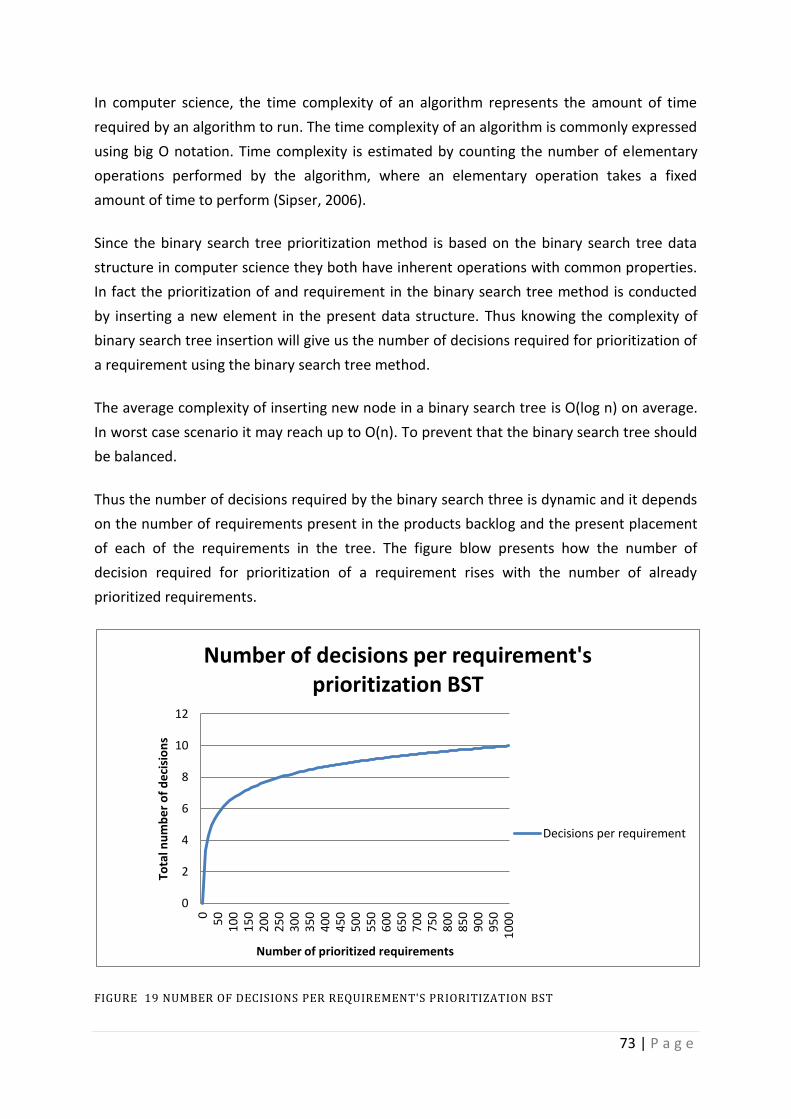
73 | P a g e
In computer science, the time complexity of an algorithm represents the amount of time
required by an algorithm to run. The time complexity of an algorithm is commonly expressed
using big O notation. Time complexity is estimated by counting the number of elementary
operations performed by the algorithm, where an elementary operation takes a fixed
amount of time to perform (Sipser, 2006).
Since the binary search tree prioritization method is based on the binary search tree data
structure in computer science they both have inherent operations with common properties.
In fact the prioritization of and requirement in the binary search tree method is conducted
by inserting a new element in the present data structure. Thus knowing the complexity of
binary search tree insertion will give us the number of decisions required for prioritization of
a requirement using the binary search tree method.
The average complexity of inserting new node in a binary search tree is O(log n) on average.
In worst case scenario it may reach up to O(n). To prevent that the binary search tree should
be balanced.
Thus the number of decisions required by the binary search three is dynamic and it depends
on the number of requirements present in the products backlog and the present placement
of each of the requirements in the tree. The figure blow presents how the number of
decision required for prioritization of a requirement rises with the number of already
prioritized requirements.
FIGURE 19 NUMBER OF DECISIONS PER REQUIREMENT'S PRIORITIZATION BST
0
2
4
6
8
10
12
0
50
1
00
1
50
2
00
2
50
3
00
3
50
4
00
4
50
5
00
5
50
6
00
6
50
7
00
7
50
8
00
8
50
9
00
9
50
1
00
0
Tota
l nu
mb
er
of
de
cisi
on
s
Number of prioritized requirements
Number of decisions per requirement's prioritization BST
Decisions per requirement
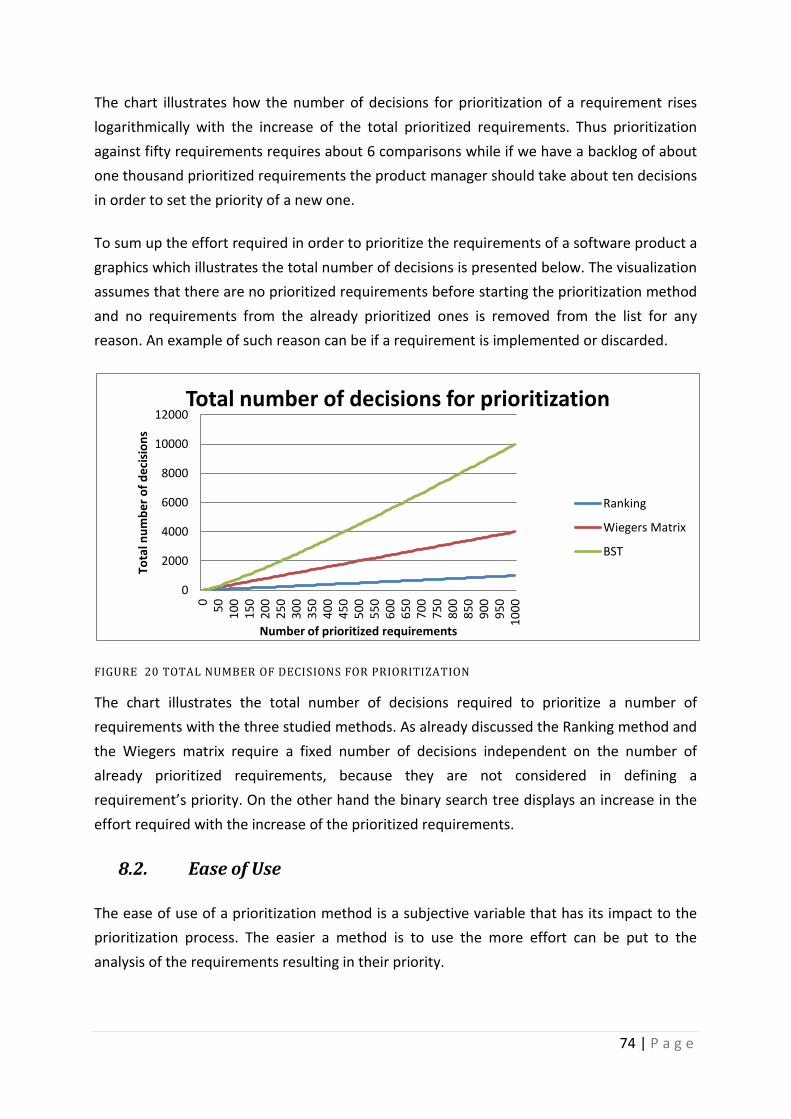
74 | P a g e
The chart illustrates how the number of decisions for prioritization of a requirement rises
logarithmically with the increase of the total prioritized requirements. Thus prioritization
against fifty requirements requires about 6 comparisons while if we have a backlog of about
one thousand prioritized requirements the product manager should take about ten decisions
in order to set the priority of a new one.
To sum up the effort required in order to prioritize the requirements of a software product a
graphics which illustrates the total number of decisions is presented below. The visualization
assumes that there are no prioritized requirements before starting the prioritization method
and no requirements from the already prioritized ones is removed from the list for any
reason. An example of such reason can be if a requirement is implemented or discarded.
FIGURE 20 TOTAL NUMBER OF DECISIONS FOR PRIORITIZATION
The chart illustrates the total number of decisions required to prioritize a number of
requirements with the three studied methods. As already discussed the Ranking method and
the Wiegers matrix require a fixed number of decisions independent on the number of
already prioritized requirements, because they are not considered in defining a
requirement’s priority. On the other hand the binary search tree displays an increase in the
effort required with the increase of the prioritized requirements.
8.2. Ease of Use
The ease of use of a prioritization method is a subjective variable that has its impact to the
prioritization process. The easier a method is to use the more effort can be put to the
analysis of the requirements resulting in their priority.
0
2000
4000
6000
8000
10000
12000
0
50
1
00
1
50
2
00
2
50
3
00
3
50
4
00
4
50
5
00
5
50
6
00
6
50
7
00
7
50
8
00
8
50
9
00
9
50
1
00
0
Tota
l nu
mb
er
of
de
cisi
on
s
Number of prioritized requirements
Total number of decisions for prioritization
Ranking
Wiegers Matrix
BST

75 | P a g e
The three of the studied methods differ in the way they prioritize requirements. The ranking
and the Wiegers matrix on one hand focus on the present requirement and analyze its
benefits and costs in absolute numbers rather than comparing with the other requirements.
The result of the two methods is a number set by the team involved in the prioritization in
the case of the Ranking method or calculated based on criteria in the case of the Wiegers
matrix.
On the other hand the binary search tree directly compares the requirement being
prioritized with already prioritized ones. Thus the analysis on the importance of a
requirement is performed while comparing it with another one.
The ranking prioritization method is the one used in the experiment hosting company before
starting the research. As a consequence of that fact the team is quite aware and experienced
with that method and the method could be found easier than the rest.
The other two methods had to be explained to the participants in the prioritization sessions
in order to be used. The Wiegers matrix differs from the Ranking method by introduction of
four different criteria which needs to be analyzed and evaluated before obtaining a
requirement’s priority- its benefit, penalty, cost and risk and their weights in order to
calculate the final priority. Since the difference between the two methods is not that
dramatic the Wiegers matrix is quickly and easily understood by the prioritization team.
Teaching the binary search tree includes the explanation of the tree structure in which the
requirements are stored after prioritization. It is the most difficult to explain method among
the three studied ones.
Once the methods are explained and put to practice the ease of use is discussed in the
interviews following each of the prioritization meetings.
As expected the ranking is considered the easiest to use method among the studied ones. As
its main advantage are considered its simplicity and straightforwardness. Once a
requirement is discussed and analyzed the team has understanding of its importance for the
product and the amount of effort its implementation would require and a priority is set.
Although the binary search tree took more effort during its explanation its execution is
considered also as easy. However it is important that a software tool that implements the
method is present, since it saves a lot of labor intensive operations in order to keep the
priority tree structure up to date after each new requirement implementation. Without the
presence of such tool the requirements prioritization of a real software product is
76 | P a g e
considered impossible. For the purpose of this research a prototype of such prioritization
software is developed and used.
“I think that having a structure makes easier to set the priorities”
Using a software tool to prioritize requirements with the binary search tree makes the
prioritization process straightforward. The software used matches the pair that needs to be
compared and asks the prioritization team which of the two requirements in hand is
considered to be more important. Once the team got familiar with the process and decision
was made that no other already prioritized requirements should be discussed while a
running prioritization, this style of work made them focus on the current decision.
“We can better explain why a requirement has a certain priority.”
Comparing requirements’ priority against each other makes the stakeholders more aware of
the reasons lead to the decision that one requirement should be implemented before
another. This also enables the prioritization team to save further effort in convincing
external stakeholders about taking a decision. During the interviews following the
experiment a suggestion was made that a feature that saves the comparisons leading to
requirement’s priority could be implemented. This feature might be helpful to illustrate the
reasoning behind a certain priority in case of future uncertainty or distrust.
Wiegers matrix is also considered easy to use. Compared to the ranking and the binary
search tree it requires a little bit more effort to use properly. The reason for that is that the
team should constantly be in sync what each value representing component of the priority
means over time. For example a five can be considered to be a high value in one session
while it could be interpreted as relatively low several weeks later. Although this is not a
technical difficulty for the team it requires some additional effort in order to establish the
same baseline during the prioritization meetings.
As a conclusion about the ease of use of the three methods the following findings emerged.
It is easier to initially explain and understand the way the Ranking and the Wiegers matrix
work compared to the binary search tree prioritization method. Once the team is aware of
the methods the three of them are considered easy to execute.
The simplicity of the ranking method makes it the easiest to use among the three methods.
However the structure of the binary search tree incorporating a proper software tools to
implement the method makes it comparably easy method to use with the ranking method.
The binary search tree is considered to be extremely hard and effort consuming to use
77 | P a g e
without a proper software to tool to support the method. Wiegers matrix is considered to be
easy enough method however it requires slightly more effort than the other two to use.
8.3. Reliability of the results
Reliability of the results in the present research describes the perceived reliability of the
results for each method studied. A reliable method results does not necessary mean valid
results. The reliability represents the consistency of method results. So in other words if one
requirement is prioritized numerous times with the same method that will lead to the same
priority.
Although method’s reliability does not imply validity, a lack of reliability limits the overall
validity of method’s results. A factor that may influence the reliability of the prioritization
method is found to be the current emotion of the members of the team setting the priority.
Another possible reason for affecting the reliability of method’s results might be analysis
that is not extensive enough and misses some of the factors that might influence
requirements priority.
During the interviews following each of the experiment prioritization sessions the following
key points concerning the reliability of the results are mentioned by the participants in the
prioritization process.
“Its completely up to the emotion of one man which priority is set to the requirement”
The quote above concerns the ranking prioritization method. It addresses the concern that
depending on just one decision which determines priority sometimes leaves the priority to
the current emotion of the managing director of the company, who also is part of the
prioritization team. This may lead to setting priority that is urged by a current emotion of
that person. For example a recent conversation with an important client or prospect
requesting a requirement may result in higher priority for the current requirement over
older ones that might be considered more important otherwise.
The other two methods stimulate the team involved with the prioritization to make more
elaborate analysis in order to set requirements priority so they are found better concerning
the reliability of the results they provide.
“Wiegers matrix is a better method than the ranking but yet a bit too abstract, because each
requirement is treated separately”
78 | P a g e
The Wiegers matrix forces the prioritization team to consider four separate aspects of each
requirement. The benefit and the penalty are related to the expected benefit if a
requirement is implemented and the eventual losses that omitting a requirement’s
implementation might lead to. The experiment sessions indicated that the business oriented
stakeholders in the prioritization process are more active in this part of the requirement
analysis. On other hand the technical oriented ones might better estimate the cost
requirements implementation might take and the possible risks of its implementation for the
system.
Introduction of more people opinion by providing input for the different parameters which
determine the final priority of the requirement weakens the possibility that a priority is set
based on recent emotions. However a new problem concerning the reliability of the results
emerges. Using the ranking method and the Wiegers matrix the priority is set in isolation
from the other requirements priority. Working on a medium to large scale product implies a
large number of requirements waiting to be implemented. Because of that it is hard or
nearly impossible to know each of the requirements in detail in every given moment.
“The BST method is more reliable because you compare in relation to the other work items
(requirements)”
By using the binary search tree it is impossible to have that isolation, because the method
forces the prioritization team to compare the present requirements priority against the
priority of already prioritized requirements. When doing so the team does not just set an
abstract value representing requirements priority but can perceive how the requirement’s
priority is positioned among the other ones.
“When you have done the BST you have made a very careful consideration of each
requirement”
After prioritization with the binary search tree is done additionally the priority of previous
requirements is revised. Thus in case of doubt in older requirement’s priority it can be
reprioritized.
Present research lead to the conclusion that the reliability of the results of the studied
methods is proportional to the amount of analysis each of them requires. The binary search
tree is perceived to provide the most reliable results. The Wiegers matrix comes second and
at the end of the list is the ranking method.

79 | P a g e
8.4. Fault tolerance
The ranking method and the Wiegers matrix method are considered to be relatively similar
concerning their fault tolerance with slight advantage of the Wiegers matrix. The reason for
that advantage is that the Wiegers matrix method forces the team to consider four different
characteristics that determine requirements priority explicitly. Usually the benefits, penalty,
costs and risk are also considered during the analysis phase of the ranking method, however
that is made in an implicit way and some of them might be omitted.
“The priority set with Ranking and Wiegers is a one time number, unless you spend time to
reprioritize, with BST you make that constantly”
As already stated in the previous sections with the ranking method and the Wiegers matrix
the priority is set in isolation from the other requirements priority. When dealing with a
large number of requirements it is possible that some of them would be implemented a
significant time after their prioritization. However due to the dynamics of a product’s market
the conditions causing one requirements priority might change over time.
In order to keep the prioritized requirement relevant to the reality a constant reprioritization
should be performed. However this process requires additional time and during the study it
is found that such time is rarely available. On the other hand the binary search tree makes
the prioritization team to constantly compare new requirements with the already prioritized
ones. This forces them to consider older requirements while setting the priority to new ones
and actively changes the priority of the older ones. This is especially true for requirements
once set with low priority.
“If we continue to use Ranking or Wiegers every requirement with current low priority will
never be done”
When old requirements are not regularly prioritized the older ones with lower priority
usually remain forgotten in the product’s backlog for long periods of time. This is caused by
two reasons: as expected only the highest prioritized requirements are the ones being
implemented and thus removed from the backlog; there are constantly new requirements
introduced for the product which push low priority requirements back.
80 | P a g e
This situation raises two concerns. The first one is that the conditions might have changed
over time and previously not so urgent requirement might become more important over
time. Secondly requirements that are no longer necessary or adequate for the product might
remain in its backlog thus unnecessary lumbering the process of requirements management.
With the use of binary search tree such requirements would regularly be observed due to
the need of comparison and appropriate measures could be taken if necessary.
The observations on the fault tolerance of the studied methods so far show that the binary
search tree exceeds the one of the ranking method and the Wiegers matrix method. This
was further confirmed by the following statement:
“After using binary search tree if I am ranking I will give the exact same priority”
To sum up the fault tolerance is considered to be a significant factor affecting prioritization
process effectiveness. There is a difference between the studied methods concerning their
perceived fault tolerance. The binary search tree excels according to this quality, because it
forces the prioritization team to take into account all of the requirements waiting to be
implemented. As additional benefit the product’s backlog is being examined while
performing the prioritization process and in case of irregularities further actions can be
initiated. The Wiegers matrix is the second best option among the methods in the present
research concerning its fault tolerance, because it forces the prioritization team to deepen
the analysis leading to the priority of a requirement compared to the Ranking method.
8.5. Additional findings
Although not directly related to the variables measured by the experiment there are number
of findings that emerged during the interviews following the prioritization sessions that are
related to the studied methods effectiveness. This section describes those findings and the
effect they have on the prioritization process.
8.5.1. The ranking prioritization method gives urgency to the
currently prioritized requirements
As already discussed in the section about the perceived reliability of the results the ranking
method results might be influenced by the current emotion of the decision maker.
Comparisons of the prioritization results with the ranking and the binary search tree method
is performed after the experiment by juxtaposing the priorities of same requirements
prioritized with the two methods. The results displayed that the prioritization team tends to
give on average 6.5 points priority more with the ranking method from scale of 0 to 100
81 | P a g e
compared with the results from the binary search tree. This difference is significant enough
because in some cases the difference is enough to move a requirement in different releases.
The most probable reason for that is that the team is not completely aware of all of the
requirements in the product backlog and tends to forget older requirements urgency, while
when comparing requirements directly with the binary search tree method they familiarize
themselves with the reasons about the older requirements priority.
A further research on that phenomenon could be helpful to understand better the
prioritization process and to prevent such skewness in the results of prioritization methods.
8.5.2. Tools do matter
As mentioned before the software tools used to facilitate the prioritization process are
found to have impact on the effectiveness of the prioritization process and the methods in
particular.
The ranking method can be facilitated by a relatively simple software, because it is required
to store a number representing the priority of a requirement. The Wiegers matrix requires
software to facilitate the computations of the priority based on the values of its four criteria
that is provided by the prioritization team. For the purpose of the experiment a spreadsheet
was sufficient to facilitate the method. In an industry setting this functionality should be
integrated in the requirements database of the product.
The binary search tree requires the most sophisticated software, because the structure it
stores the requirements is not easy to understand by people as the number of prioritized
requirements increases. Additionally in order to keep the prioritization optimal the binary
tree should be balanced regularly, which also is a laborious task.
8.5.3. If there is a bottleneck in development prioritization might not
be that important
The research found that the development structure and the development resources at hand
can influence the needs from the requirements prioritization. In cases when specific tasks
cannot be performed by a large number of software developers a bottleneck may appear. In
case there is a large number of such specific requirements or the implementation of those
requirements need much effort this bottleneck may influence the priority of the
requirements.

82 | P a g e
“If all high priority requirements needs to be done by me it is not that important to set
precise priority to the others, since they will be implemented sooner anyways”
In case that there are a number of important requirements, constrained by the deadline of
their implementation and the resources needed for their implementation it might be
possible that the rest of the development team would implement not that important
requirements before the urgent ones. The interviewees stated that in those cases the
prioritization of those not so important requirements don’t necessary need to be extremely
precise.
83 | P a g e
9. Discussion and future research
This section describes the weaknesses in the present research and analyses the threats to
the validity of its results. Later it suggests the future research that can contribute to the field
of requirements prioritization by extending the finding of this research and possible topics
for further study.
There are a number of threats to the validity of the results indicated in this research,
including:
1. Few case studies
2. Interdependent requirements
3. Bias due to prior prioritization of a requirement with different technique
It can be argued that the threats to validity are under control, based on the following
considerations:
The subjective results are collected based on the analysis of the interviews of four different
experts involved in the requirements prioritization process. A threat to the validity of the
results could be caused by an inconclusiveness related to dramatic difference in the opinion
of the experts. The relatively low number of respondents could prevent identifying the
outlier in this case. There are no major inconsistencies in the interviews participants’
responses.
In practice interdependence between requirements can be present. For example it is usual
to organize releases by theme, thus implementing a set of requirements which are related to
each other. Those theme sets of requirements may have low variation in their priority and
thus can be prioritized faster, due to the common nature of the issues. This exception
influences the results of the experiment. Because of that experiment session containing a
large number of interdependent requirements is considered to be invalid and should be
repeated. During the experiment there were no cases of interdependent requirements
present in the prioritization sessions.
During the experiment sessions identical set of requirements is prioritized with three
different techniques. Because of that the results obtained by the different techniques may
be biased by the results of the prior one. In order to prevent that each of the sessions have
different order of the executed prioritization techniques.
84 | P a g e
A single study, cannot be considered sufficient basis for changing the attitudes towards the
ranking method, the Wiegers matrix and the binary search three effectiveness. Conducting
the same analyses on data from existing experiments as well as new replications with the
purpose of evaluating differences among perspectives will bring more clarity into the
advantages and disadvantages of the three examined methods, and also give a better
control over the validity threats.
Additionally it will be interesting to compare the currently studied methods with different
ones in similar context or replication of this research in different context.
This research found several additional factors that may influence the effectiveness of
prioritization methods mentioned during the interviews. The first one is that the ranking
prioritization method gives urgency to the currently prioritized requirements. It might be
interesting to be found weather that is a tendency in general and what may be causing that.
It may be also relevant to study if there are other methods which results give priority to
currently prioritized requirements.
During this study it is found that the software instruments used to facilitate requirements
prioritization may influence strongly the ease of use and the willingness to use a certain
prioritization method. An investigation on the topic what characteristics such software tools
should have for each specific requirements prioritization method may be beneficial for the
industry and may contribute to adoption of prioritization methods seen as cumbersome.
During this research a concern was raised that in cases when bottlenecks in the
development process are present which influence a certain set of requirements precise
prioritization of the rest of the requirements may not be of high importance. This suggests
that lightweight prioritization methods should be used in those cases. It may be interesting
to study whether this phenomenon is present in other cases and what is causing it. Also if
present a research on possible solutions may be beneficial.
85 | P a g e
10. Conclusions
This thesis presents a study on the effectiveness of the ranking requirements prioritization
method, the binary search tree method and the Wiegers matrix for requirements
prioritization. This research extends the present body of knowledge in requirements
prioritization and uses as basis several previous experiments i.e. Karlsson, Wohlin & Regnell
(1998); Karlsson, Berander, Regnell, & Wohlin (2004); Ahl (2005).
The objective of the presented study is to investigate what is the impact of the ranking
method the binary search tree method and the Wiegers matrix on the effectiveness of the
prioritization process.
In order to measure the effect on prioritization effectiveness six variables are defined and
measured during a formal experiment.
Required number of decisions per method indicates how many decisions are
required to prioritize one requirement using one of the three methods. It contains a
numerical value bigger than zero.
Time consumption per decision records the time that each decision takes during
the prioritization process.
Total time consumption measures the total time consumption each method
requires to prioritize a requirement.
Perceived ease of use describes how easy it is to use the prioritization method.
Reliability of the results describes the perceived reliability of the results for each
method.
Fault tolerance measures how intensively the method prevents judgmental errors.
The effectiveness is measured from product manager’s point of view. A subject of the
research is the product manager, project manager and software system architect involved in
the prioritization process. The objects that are taken into consideration are the
requirements, the prioritization process and the software product the examined
organizations are developing.
This research is limited to product managers responsible for medium sized teams within the
range of 20 up to 100 employees, though the results might be applicable for smaller or
larger organizations additional research is required to verify the results in those contexts.
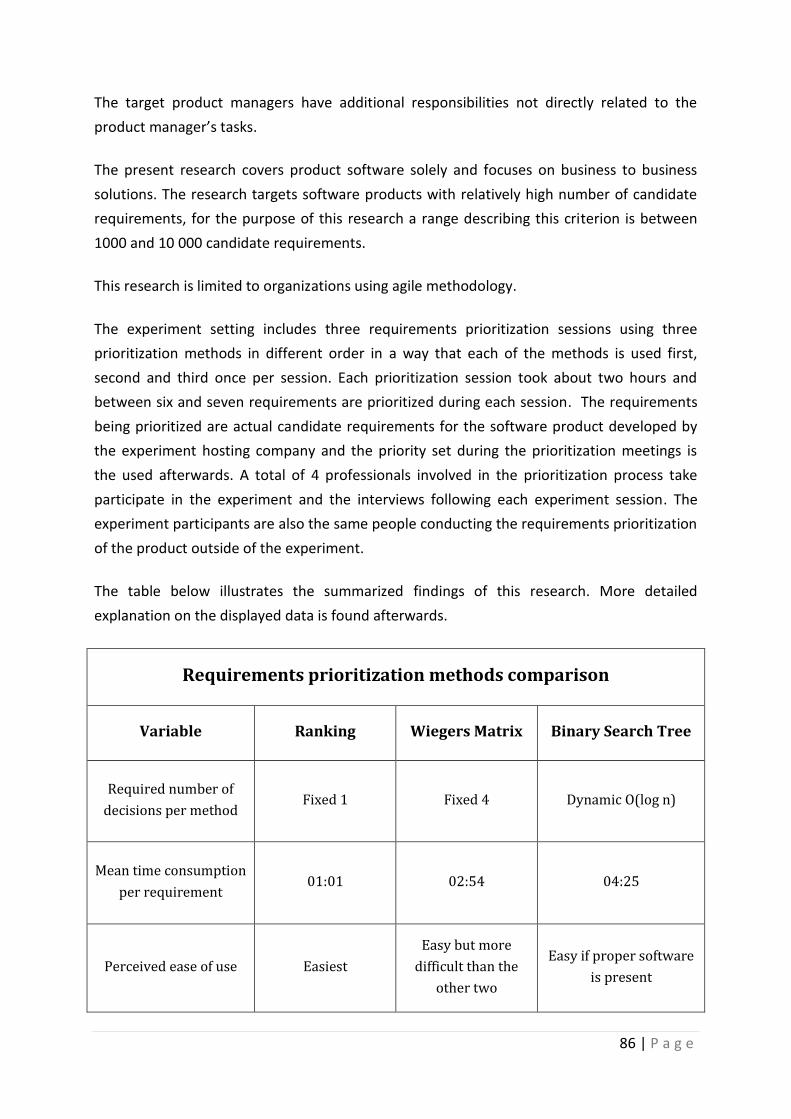
86 | P a g e
The target product managers have additional responsibilities not directly related to the
product manager’s tasks.
The present research covers product software solely and focuses on business to business
solutions. The research targets software products with relatively high number of candidate
requirements, for the purpose of this research a range describing this criterion is between
1000 and 10 000 candidate requirements.
This research is limited to organizations using agile methodology.
The experiment setting includes three requirements prioritization sessions using three
prioritization methods in different order in a way that each of the methods is used first,
second and third once per session. Each prioritization session took about two hours and
between six and seven requirements are prioritized during each session. The requirements
being prioritized are actual candidate requirements for the software product developed by
the experiment hosting company and the priority set during the prioritization meetings is
the used afterwards. A total of 4 professionals involved in the prioritization process take
participate in the experiment and the interviews following each experiment session. The
experiment participants are also the same people conducting the requirements prioritization
of the product outside of the experiment.
The table below illustrates the summarized findings of this research. More detailed
explanation on the displayed data is found afterwards.
Requirements prioritization methods comparison
Variable Ranking Wiegers Matrix Binary Search Tree
Required number of
decisions per method Fixed 1 Fixed 4 Dynamic O(log n)
Mean time consumption
per requirement 01:01 02:54 04:25
Perceived ease of use Easiest
Easy but more
difficult than the
other two
Easy if proper software
is present
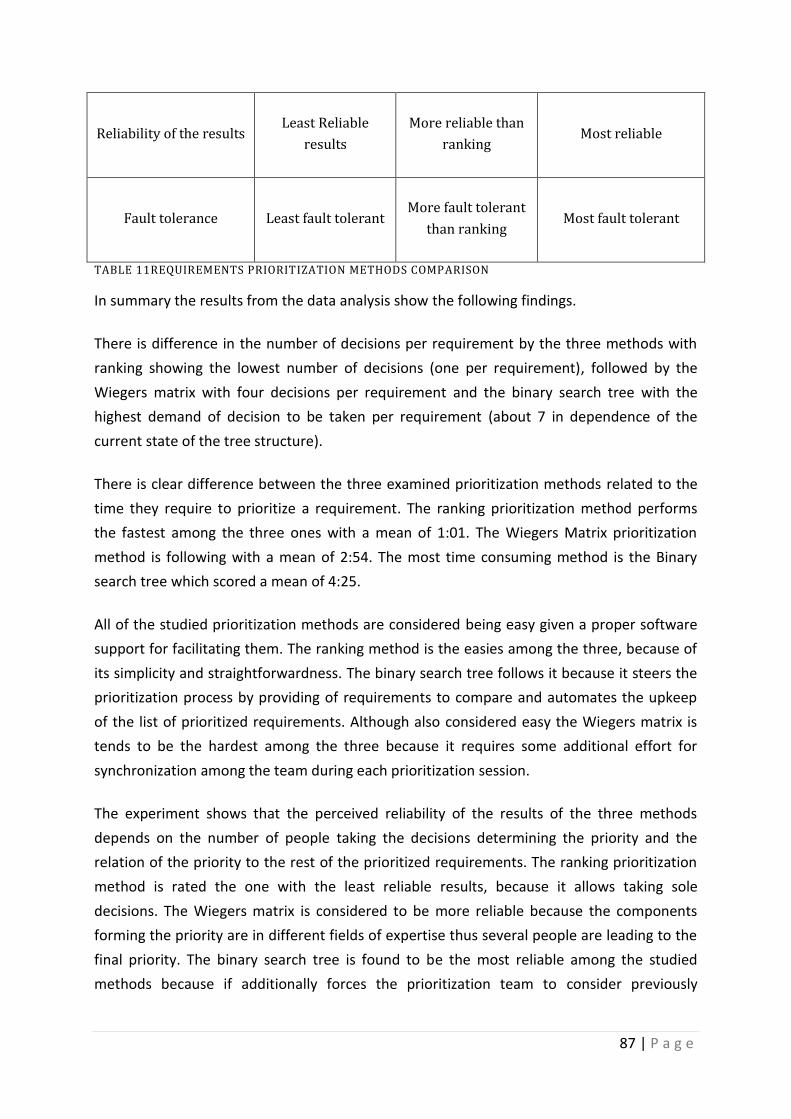
87 | P a g e
Reliability of the results Least Reliable
results
More reliable than
ranking Most reliable
Fault tolerance Least fault tolerant More fault tolerant
than ranking Most fault tolerant
TABLE 11REQUIREMENTS PRIORITIZATION METHODS COMPARISON
In summary the results from the data analysis show the following findings.
There is difference in the number of decisions per requirement by the three methods with
ranking showing the lowest number of decisions (one per requirement), followed by the
Wiegers matrix with four decisions per requirement and the binary search tree with the
highest demand of decision to be taken per requirement (about 7 in dependence of the
current state of the tree structure).
There is clear difference between the three examined prioritization methods related to the
time they require to prioritize a requirement. The ranking prioritization method performs
the fastest among the three ones with a mean of 1:01. The Wiegers Matrix prioritization
method is following with a mean of 2:54. The most time consuming method is the Binary
search tree which scored a mean of 4:25.
All of the studied prioritization methods are considered being easy given a proper software
support for facilitating them. The ranking method is the easies among the three, because of
its simplicity and straightforwardness. The binary search tree follows it because it steers the
prioritization process by providing of requirements to compare and automates the upkeep
of the list of prioritized requirements. Although also considered easy the Wiegers matrix is
tends to be the hardest among the three because it requires some additional effort for
synchronization among the team during each prioritization session.
The experiment shows that the perceived reliability of the results of the three methods
depends on the number of people taking the decisions determining the priority and the
relation of the priority to the rest of the prioritized requirements. The ranking prioritization
method is rated the one with the least reliable results, because it allows taking sole
decisions. The Wiegers matrix is considered to be more reliable because the components
forming the priority are in different fields of expertise thus several people are leading to the
final priority. The binary search tree is found to be the most reliable among the studied
methods because if additionally forces the prioritization team to consider previously
88 | P a g e
prioritized requirements and thus the making the priority more concrete and easier to
perceive by the team.
According methods fault tolerance the best among the studied ones performed the binary
search tree followed by the Wiegers matrix and the ranking method. The binary search tree
exceed the other two because it forces the prioritization team to deepen the analysis of a
requirement compared to the other two methods and to compare a requirement against
already prioritized ones. The second difference is considered to be the main advantage of
the binary search tree because it makes the team aware of all of the requirements to be
implemented instead of narrowing down its focus on the presently prioritized ones.
The results comply with the main assumptions that the binary search tree is the most
demanding prioritization method in terms of effort among the three examined ones, while
the ranking method is the most lightweight one. Additionally the binary search method
requires more decisions to be made with the increase of the number of already prioritized
requirements.
According to ease of use there is no significant difference among the three methods. All of
them are considered easy enough to use in industrial setting and it is up to the prioritization
team to decide which method will fit the best to the prioritization process.
According to reliability of the results and fault tolerance the binary search tree exceeds the
other two capabilities. The Wiegers matrix follows next and due to its simplicity the ranking
method scores last.
When a decision has to be made which prioritization method would be the most effective
the following considerations should be taken into account. Although all of the methods are
suitable for quick and agile prioritization the Ranking method followed closely by the
Wiegers matrix are the fastest ones. This means that for organizations which aim is to deliver
fast and take quick customers feedback one of those methods might be more suitable.
However if more precise prioritization results are demanded the binary search tree is more
appropriate method due to its higher reliability of results and fault tolerance.
Additionally it should be considered that setting the actual priority with a method at hand
takes a relatively small time of the whole prioritization meeting. The three experiment
prioritization sessions took about two hours each. During each of them between six or seven
requirements are prioritized. The median time required for prioritization of a requirement is
1:01, 2:54 and 4:25 minutes for ranking Wiegers matrix and the binary search tree
respectfully. Even in a session when 7 requirements are prioritized the total time for

89 | P a g e
prioritization is less than an hour for all of the three methods. Given that the requirements
priority determine what will be implemented in the product it might be beneficial to put the
additional effort if resources are available.
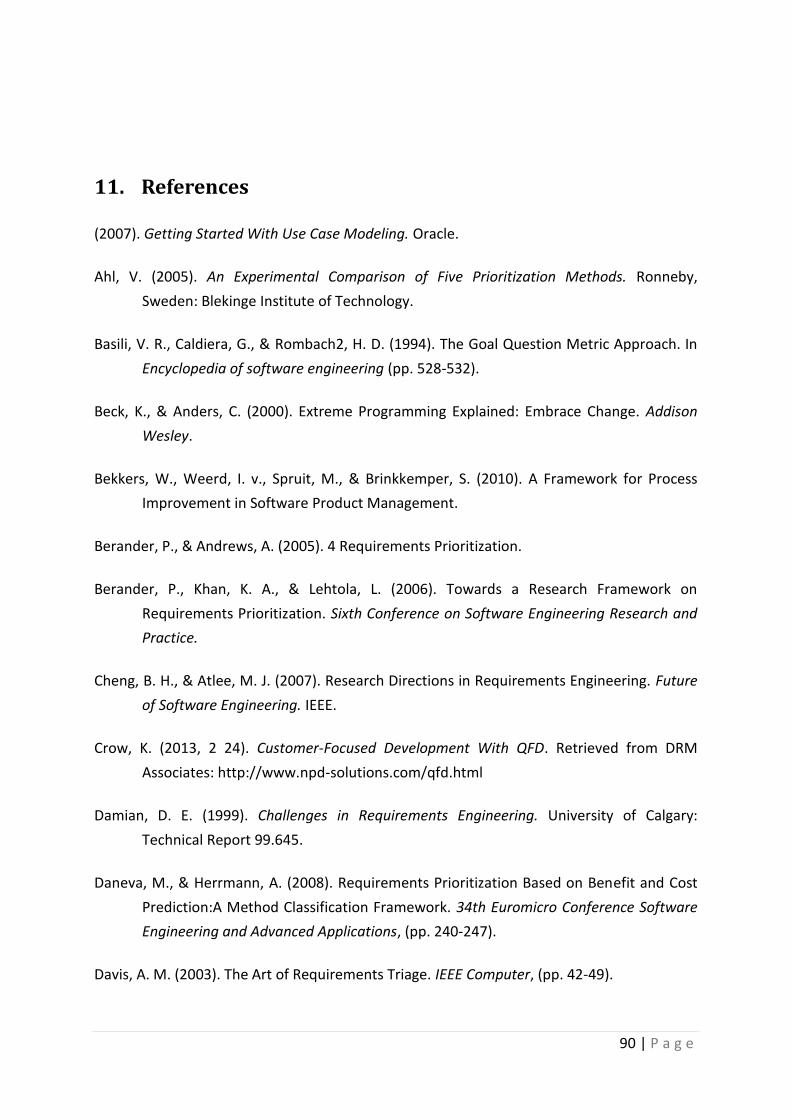
90 | P a g e
11. References
(2007). Getting Started With Use Case Modeling. Oracle.
Ahl, V. (2005). An Experimental Comparison of Five Prioritization Methods. Ronneby,
Sweden: Blekinge Institute of Technology.
Basili, V. R., Caldiera, G., & Rombach2, H. D. (1994). The Goal Question Metric Approach. In
Encyclopedia of software engineering (pp. 528-532).
Beck, K., & Anders, C. (2000). Extreme Programming Explained: Embrace Change. Addison
Wesley.
Bekkers, W., Weerd, I. v., Spruit, M., & Brinkkemper, S. (2010). A Framework for Process
Improvement in Software Product Management.
Berander, P., & Andrews, A. (2005). 4 Requirements Prioritization.
Berander, P., Khan, K. A., & Lehtola, L. (2006). Towards a Research Framework on
Requirements Prioritization. Sixth Conference on Software Engineering Research and
Practice.
Cheng, B. H., & Atlee, M. J. (2007). Research Directions in Requirements Engineering. Future
of Software Engineering. IEEE.
Crow, K. (2013, 2 24). Customer-Focused Development With QFD. Retrieved from DRM
Associates: http://www.npd-solutions.com/qfd.html
Damian, D. E. (1999). Challenges in Requirements Engineering. University of Calgary:
Technical Report 99.645.
Daneva, M., & Herrmann, A. (2008). Requirements Prioritization Based on Benefit and Cost
Prediction:A Method Classification Framework. 34th Euromicro Conference Software
Engineering and Advanced Applications, (pp. 240-247).
Davis, A. M. (2003). The Art of Requirements Triage. IEEE Computer, (pp. 42-49).
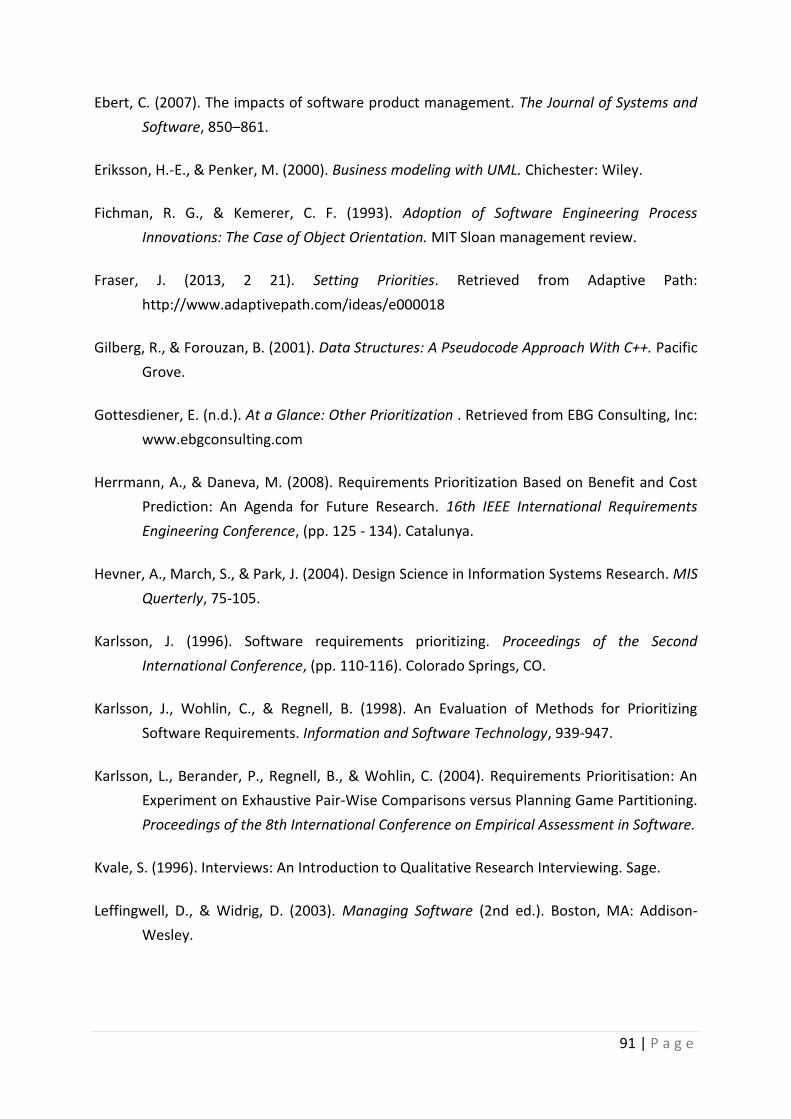
91 | P a g e
Ebert, C. (2007). The impacts of software product management. The Journal of Systems and
Software, 850–861.
Eriksson, H.-E., & Penker, M. (2000). Business modeling with UML. Chichester: Wiley.
Fichman, R. G., & Kemerer, C. F. (1993). Adoption of Software Engineering Process
Innovations: The Case of Object Orientation. MIT Sloan management review.
Fraser, J. (2013, 2 21). Setting Priorities. Retrieved from Adaptive Path:
http://www.adaptivepath.com/ideas/e000018
Gilberg, R., & Forouzan, B. (2001). Data Structures: A Pseudocode Approach With C++. Pacific
Grove.
Gottesdiener, E. (n.d.). At a Glance: Other Prioritization . Retrieved from EBG Consulting, Inc:
www.ebgconsulting.com
Herrmann, A., & Daneva, M. (2008). Requirements Prioritization Based on Benefit and Cost
Prediction: An Agenda for Future Research. 16th IEEE International Requirements
Engineering Conference, (pp. 125 - 134). Catalunya.
Hevner, A., March, S., & Park, J. (2004). Design Science in Information Systems Research. MIS
Querterly, 75-105.
Karlsson, J. (1996). Software requirements prioritizing. Proceedings of the Second
International Conference, (pp. 110-116). Colorado Springs, CO.
Karlsson, J., Wohlin, C., & Regnell, B. (1998). An Evaluation of Methods for Prioritizing
Software Requirements. Information and Software Technology, 939-947.
Karlsson, L., Berander, P., Regnell, B., & Wohlin, C. (2004). Requirements Prioritisation: An
Experiment on Exhaustive Pair-Wise Comparisons versus Planning Game Partitioning.
Proceedings of the 8th International Conference on Empirical Assessment in Software.
Kvale, S. (1996). Interviews: An Introduction to Qualitative Research Interviewing. Sage.
Leffingwell, D., & Widrig, D. (2003). Managing Software (2nd ed.). Boston, MA: Addison-
Wesley.
92 | P a g e
Lehtola, L., & Kauppinen, M. (2006). Suitability of Requirements Prioritization Methods for
Market-driven Software Product Development. Software Process: Improvement and
Practice, 7-19.
Lehtola, L., Kauppinen, M., & Kujala, S. (2004). Requirements Prioritization Challenges in
Practice. In Lecture Notes in Computer Science (pp. 497-508).
Li, C., Van Den Akker, J. M., Brinkkemper, S., & Diepen, G. (2007). Integrated Requirement
Selection and Scheduling for the Release Planning of a Software Product. Springer-
Verlag Berlin Heidelberg, 93-108.
Logue, K., & McDaid, K. (2008). Agile Release Planning: Dealing with Uncertainty in
Development Time and. 15th Annual IEEE International Conference and Workshop on
the Engineering of Computer Based Systems, 437-442.
McNamara, C. (1999). General Guidelines for Conducting Interviews. Minnesota.
OMG. (2011). OMG Unified Modeling LanguageTM (OMG UML), Superstructure. Object
Managemment Group.
Poort, E. R., & With, P. H. (2004). Resolving Requirement Conflicts through Non-Functional
Decomposition. 4th. Workshop on Software Architecture, (pp. 498-507).
Racheva, Z., Daneva, M., & Buglione, L. (2008). Supporting the Dynamic Reprioritization of
Requirements in Agile Development of Software Products., (pp. 49--58). Barcelona.
Saaty, T. L. (1980). The Analytic Hierarchy Process: Planning, Priority Setting, Resource,
Allocation. New York: McGraw-Hill.
Schwaber, K. (2004). Agile Project Management with SCRUM. Microsoft Press.
Siddiqi, J., & Shekaran, M. C. (1996). Requirements Engineering: The Emerging Wisdom. IEEE
Software, 15-19.
Simon, L. J. (2013, May 13). Outliers and Influential Data Points. Retrieved from STAT 501
Regression Methods:
http://online.stat.psu.edu/online/development/stat501/14outliers/02outlier_distinc
tion.html
Sipser, M. (2006). Introduction to the Theory of Computation, Second Edition. Boston,
Massachusetts: MIT.

93 | P a g e
Weerd, I. v., & Brinkkemper, S. (2008). Meta-modeling for situational analysis and design
methods. In R. M. Syed, & S. N. Syed, Handbook of Research on Modern Systems
Analysis and Design Technologies and Applications (pp. 38-58). Hershey, USA.
Wiegers, K. (1999). First Things First: Prioritizing Requirements. Software Development.
Wohlin, C., Runeson, P., Höst, M., Ohlsson, M. C., Regnell, B., & Wesslén, A. (2012). Scoping.
In Experimentation in Software Engineering (pp. 85-88). Springer Berlin Heidelberg.
Wohlin, C., Runeson, P., Höst, M., Ohlsson, M., Regnell, B., & Wesslén, A. (2012).
Experimentation in Software Engineering. Springer.