comparative study of symmetric and asymmetric deformation of al
TRANSCRIPT

Journal of
Mechanics ofMaterials and Structures
COMPARATIVE STUDY OF SYMMETRIC AND ASYMMETRICDEFORMATION OF AL SINGLE CRYSTAL UNDER MICROSCALE
LASER SHOCK PEENING
Siniša Vukelic, Youneng Wang, Jeffrey W. Kysar and Y. Lawrence Yao
Volume 4, Nº 1 January 2009
mathematical sciences publishers


JOURNAL OF MECHANICS OF MATERIALS AND STRUCTURESVol. 4, No. 1, 2009
COMPARATIVE STUDY OF SYMMETRIC AND ASYMMETRIC DEFORMATIONOF AL SINGLE CRYSTAL UNDER MICROSCALE LASER SHOCK PEENING
SINIŠA VUKELIC, YOUNENG WANG, JEFFREY W. KYSAR AND Y. LAWRENCE YAO
The process of laser shock peening induces compressive residual stresses in a material to improve ma-terial fatigue life. For micron sized laser beams, the size of the laser-target interaction zone is of thesame order of magnitude as the target material grains and, thus, the target material must be consideredanisotropic and inhomogeneous. Single crystals are chosen to study the effects of the anisotropic me-chanical properties. It is of further interest to investigate the response of symmetric and asymmetric slipsystems with respect to the shocked surface. In the present study, analytic, numerical, and experimentalaspects of laser shock peening on two different crystal surfaces, (110) and (114), of aluminum singlecrystals are studied. Anisotropic slip line theory is employed for the construction of slip line fieldsfor both orientations and compared with numerical results. Lattice rotations of the cross section aremeasured using Electron Backscatter Diffraction (EBSD).
1. Introduction
Laser shock peening (LSP) is a surface treatment introduced in the 1960s [Clauer and Holbrook 1981;Fabbro et al. 1990; Clauer and Lahrman 2001] as a potential replacement for shot peening, which hasthe same goal of inducing compressive residual stresses on the surface of a material to improve fatiguebehavior and wear resistance of the target material. Shocks induced by a laser induce compressiveresidual stresses of the same order of magnitude as those created by conventional shock peening, however,the residual stresses generated by LSP penetrate deeper into the material resulting in the significantimprovement of material response to the cyclic loading [Hammersley et al. 2000]. Moreover, it is mucheasier to control the position of laser beams, and the process as a whole is much more flexible.
More recently, microscale laser shock peening (µLSP) has been employed as a means to improvereliability of various micro devices, such as MEMS (microelectromechanical systems). The process isperformed by coating the specimen with an ablative layer and submerging it into water, after which ahigh intensity laser is directed at the ablative layer for 50 ns. The result is a plasma confined by thesurrounding fluid so that much of the energy is directed into the material as a shock pulse. The process isconsidered to be primarily mechanical without any thermal effects that modify the microstructure. Mostof the initial work in this field was on polycrystalline materials [Zhang and Yao 2002; Fan et al. 2005].
Keywords: laser shock peening, single crystal, micromechanics, anisotropic slip line theory.This work is supported by National Science Foundation under grant DMII–0500239. Dr. Jean Jordan Sweet of IBM WatsonResearch Center provided help with usage of X-ray microdiffraction equipment at the National Synchrotron Light Sourceat Brookhaven National Laboratory. This work has used the shared experimental facilities that are supported primarily bythe MRSEC Program of the National Science Foundation under Award Number DMR – 0213574 by the New York StateOffice of Science, Technology and Academic Research (NYSTAR). Dr. Paul van der Wilt generously assisted during EBSDmeasurements.
89

90 SINIŠA VUKELIC, YOUNENG WANG, JEFFREY W. KYSAR AND Y. LAWRENCE YAO
However, since the laser beam spot size, usually several microns, is comparable to the average grain sizeof most polycrystalline materials used in the fabrication of microdevices (aluminum, copper, etc.), at mosta few grains are affected by a single laser pulse. Thus the effects of anisotropy and heterogeneity have tobe taken into account to properly understand this process. This was the motivation for previous studies[Chen et al. 2004a] in which the response of single crystals of aluminum and copper were examinedafter laser treatment. Two different orientations of aluminum and copper single crystals were examined,a numerical model was established, and the results were compared to experimental findings.
Anisotropic properties of single crystal materials have been studied extensively. One of the earlyefforts was presented by Hill [1998], who extended the classical slip line theory [Hencky 1923] developedfor isotropic materials by substituting a circular yield surface with an elliptic one. Rice [1973] and Bookerand Davis [1972] went further in the generalization of slip line theory by expanding it to materials witharbitrary anisotropy. Asaro [1983] summarized the principles of single crystal plasticity. Anisotropic slipline theory as well as plasticity theory was applied to the problem of a flat punch impinged onto the surfaceof a plastic medium of arbitrary anisotropy [Rice 1973]. The same theory was used by Rice [1987] andDrugan [2001] for derivation of the asymptotic crack tip stress field solutions for elastic ideally-plasticsingle crystals. An analytic solution for the stress distribution and deformation state around a cylindricalvoid has been found in [Kysar 1997; 2001a; 2001b].
Single crystal plasticity and anisotropic slip line theory have also been employed to study the responseof single crystals under laser shock peening. The approach taken by Wang et al. [2008] was to approxi-mate the Gaussian pressure loading from laser shocks as a punch problem with nonuniform pressure. Analuminum single crystal of a nonsymmetric (114) orientation was used in the study because only one slipsystem was predicted to be active directly under the applied loading. The size of the deformed regionwas estimated, and an approximate analytic solution was obtained and compared with findings acquiredfrom numerical analysis.
A symmetric orientation of the crystal is of interest because multiple slip systems are activated under aGaussian pressure distribution. This complicates the analytic derivation and raises issues of the differencein material response and stress field distributions between nonsymmetric and symmetric cases. In thepresent study, the (110) orientation is chosen because two slip systems are activated under loading, sincethe symmetry of the yield surface simplifies the derivation of the deformation field. Furthermore, in realapplications, polycrystalline materials with textures involving mostly low Miller index grains are quitecommon.
Thus, the objective of this work is a comparative study of aluminum single crystal behavior undera Gaussian pressure distribution induced by µLSP for two different crystallographic surfaces, one non-symmetric with high Miller index (114) and the other symmetric with low Miller index (110). A lineof µLSP shocks exists in the (110) on the respective surfaces in order to introduce an approximatetwo-dimensional deformation state. The effects of anisotropy are emphasized, neglecting inertial termspresent due to the dynamic nature of the process, terms which are taken into account in [Vukelic et al.≥ 2009]. The deformation state is characterized experimentally, and anisotropic slip line theory is usedto investigate the stress distribution and deformation state induced by laser shock peening of a singlecrystal surface under plane strain conditions. In addition, the finite element method (FEM) is used forthe detailed analysis of single crystal plasticity as another perspective of the study. The results are clearlyapproximate because inertia is neglected, however, the results give insight into the role of anisotropy.

COMPARATIVE STUDY OF DEFORMATION OF AL SINGLE CRYSTAL 91
2. Experimental setup and characterization
Twelve dislocation-mediated plastic slip systems exist in the face-centered cubic aluminum, denoted as{111} <<110>> , where {111} corresponds to the family of slip planes and <<110>> denotes the family of slipdirections. If a line loading is applied parallel to the (110) direction, the twelve physical slip systemsreduce to three effective in-plane slip systems resulting in an approximate plane strain deformation [Rice1973; 1987; Kysar et al. 2005]. Lines of laser shocks applied parallel to the (110) direction on the (110)and (114) planes are called, respectively, the symmetric and asymmetric deformations. The symmetriccase admits slip on two effective in-plane slip systems in the region immediately below the laser shock.The asymmetric case admits slip only on one effective slip system. The two experimental setups witheffective in-plane slip systems are shown in Figure 1. A detailed discussion about the formation of theapproximate two-dimensional deformation can be found in [Rice 1987; Kysar 2001a; Kysar et al. 2005].The geometric conditions needed for plane strain conditions to be achieved are summarize in [Croneet al. 2004].
Aluminum single crystals are used in this study grown via the Bridgeman method. The sample ismounted on a three circle goniometer and its orientation is determined by Laue diffraction. The specimenis cut to size with a wire electrical discharge machine (EDM) to within ±1◦ of the desired orientation, andthe resulting heat affected zone (HAZ) is removed via mechanical polishing. Finally, electropolishing isused in order to remove any residual deformed material.
A frequency tripled Q-switched Nd:YAG laser with wavelength λ= 355 nm in TEM00 mode is usedfor the µLSP experiments, with a beam diameter of 12µm, pulse duration of 50 ns, and laser intensity ofabout 4 GW/cm2. A thin polycrystalline aluminum foil is used as an ablative coating applied tightly overan evenly spread layer (approximately 10µm thick) of high vacuum grease. The specimen is placed intoa shallow container filled with distilled water to about two millimeters above the sample’s top surface asshown in Figure 1. More details about laser shocking can be found in [Zhang and Yao 2002; Chen et al.2004b]. To obtain an approximate two-dimensional deformation state, laser shocks are applied with a25µm spacing along the (110) direction.µLSP induces deformation into the single crystal that can be characterized experimentally through
lattice rotation which is measured by comparing the as-deformed crystallographic orientation [Kysar2001a; Wang et al. 2008] relative to the known undeformed state. Lattice orientation is measured usingElectron Backscatter Diffraction (EBSD) as a function of micrometer scale spatial position. In orderto get information about the depth of the affected region and magnitude of lattice rotation under thesurface, EBSD mapping is employed on a cross section of the sample. For these measurements, anHKL Technology system attached to a JEOL JSM 5600LV scanning electron microscope (SEM) is usedwith a scan area of 200µm ×200µm and 120µm ×120µm on the shocked surface and cross section,respectively, with 3µm step size.
3. Numerical simulation conditions of single crystals
Finite element analysis is performed based on single crystal plasticity theory described by [Asaro 1983].For the purpose of this analysis, a plane strain model is established based upon results of prior experiments[Chen et al. 2004a; Wang et al. 2008; Vukelic et al. ≥ 2009] which demonstrate that the deformation is ap-proximately two-dimensional at any cross section along a shock line parallel to a <<110>> crystallographic

92 SINIŠA VUKELIC, YOUNENG WANG, JEFFREY W. KYSAR AND Y. LAWRENCE YAO
(a) (b)
Figure 1: Experimental Setup; effective in-plane strain slip systems active corresponding to a)
(110) orientation; b) (114) orientation shown
°3.35
°90
°7.144
2x
( )110
[ ]001
[ ]110
iii
i
ii
x1
Nd:YAG laser λ = 355nm Pulse width 50 ns
Spot size diameter ~ 12µm
( )110
Hot, high-pressure, strongly absorbing plasma
Transparent layer for shock wave confinement (distilled water)
Ablator (aluminum foil)
°3.35
°8.105
°5.160
[ ]221
2x [ ]114
iii
i
ii
x1
Figure 1. Experimental setup: effective in-plane strain slip systems active correspond-ing to the (110) orientation (left) and the (114) orientation (right).
direction. The simulation assumes quasistatic conditions, which, although a gross oversimplification incomparison to the highly dynamic character of µLSP, still gives insight into the role of the anisotropy,especially in comparison to the analytic solution. Boundary conditions are specified, with reference tothe configuration in Figure 1, as follows: zero traction on the side edges; zero vertical displacement onthe bottom; and a Gaussian pressure distribution on the upper surface, given by
P(x)= P0 exp(−
x2
2R2
), (1)
where R is the plasma radius, x is the distance from the center of the Gaussian pressure distributionand P0 is the peak pressure. The analysis is performed with the commercial finite element (FEM) pro-gram ABAQUS/Standard with a user-defined material subroutine (UMAT) written by Huang [1991] andmodified by Kysar [1997]. The aluminum slip systems are assumed to have a critical shear strength ofτ ≈ 1 MPa; the peak pressure is taken to be P0/τ = 7.

COMPARATIVE STUDY OF DEFORMATION OF AL SINGLE CRYSTAL 93
4. Single crystal micromechanics
According to [Asaro 1983], plastic deformation of a single crystal can be conceptually broken downinto three steps which, when combined, determine the overall deformation gradient F : first, plastic slipthrough the undeformed crystal F P ; second, rigid body rotation F R; finally, elastic stretching of thelattice Fe. Therefore, the deformation gradient tensor can be multiplicatively decomposed as
F = Fe· F R· F P . (2)
The first two terms of (2) can be combined together, and the general expression for the deformationgradient becomes F = F∗ ·F P , where F P is the deformation related to the plastic shear and F∗ representsthe stretching and rotation of the crystal lattice. The velocity gradient, L , which is the sum of the spinrate tensor, �, and deformation rate tensor, D, can also be calculated as L = F ·F−1. Furthermore, D and� can be decomposed into D = D∗+ DP and �=�∗+�P . It can then be shown that the constitutiveequation in rate form is
τ∇ = L : D−n∑α=1
[L : P (α)+β(α)]·(α)
λ , (3)
where L is the tensor of elastic moduli, τ∇ is the Jaumann rate of the Kirchhoff stress tensor, β(α) =W (α)τ − τW (α), and γ (α) is the shear strain rate on the slip system α. Another important issue is thedefinition of the Schmid stress, also known as resolved shear stress, which is responsible for producingan effective force on dislocations. From the general expression of the rate of work,
τ : D p=
n∑α=1
τ : Pα ·(α)
λ , (4)
the Schmid stress on a particular slip system α is
τ (α) = P (α) : τ, (5)
with the Schmid tensor defined as P (α) = (n(α)⊗ s(α)+ s(α)⊗ n(α))/2, where n(α) is the unit normal ofthe α-th {111} plane and s(α) is the unit vector corresponding to the α-th <<110>> slip direction.
5. Anisotropic slip line theory
Slip line theory for isotropic rigid-ideally plastic materials experiencing plane strain deformation hasbeen originally developed by Hencky [1923] and Prandtl [1923]. The stress distribution under a flatpunch with a constant pressure was first derived by Hill [1998] for anisotropic materials with an ellipticyield surface using slip line theory and was solved with the generalized theory for arbitrary anisotropicyield surface by Rice [1973] and Booker and Davis [1972]. Wang et al. [2008] employed anisotropic slipline theory to investigate stress and deformation fields for the case of a Gaussian pressure distributionon a single crystal surface for the asymmetric case. In essence, they assumed that the deformation fromµLSP can be thought of as being induced by a punch with a Gaussian pressure distribution, rather thana constant pressure across the width of the punch.
Anisotropic slip line theory is employed to investigate the deformation field of a single face-centeredcubic crystal under µLSP for the symmetric case. Slip line theory treats incipient plane flow and it

94 SINIŠA VUKELIC, YOUNENG WANG, JEFFREY W. KYSAR AND Y. LAWRENCE YAO
is assumed that plastic deformation occurs simultaneously over the domain of interest. The governingequations are a set of equilibrium equations that have the form of hyperbolic partial differential equations;the two families of characteristics, referred to as α and β lines, correspond, respectively, to slip directionsand slip plane normals in the case of anisotropic slip line theory applied to single crystals. More detailsabout anisotropic slip line theory can be found in [Rice 1973] and [Kysar et al. 2005].
6. Analytic treatment of deformation and stress field
6.1. Gaussian pressure distribution on a (110) crystallographic orientation. The stress and deforma-tion states associated with a Gaussian pressure loading are derived by assuming that the pressure isapplied by a punch with a nonuniform pressure distribution. By this formulation, flat punch kinematicsis employed, but the distribution of the stresses under the punch is deformed by a Gaussian distribution.The stress state in the triangular region immediately below the punch is at yield for both problems. Underthese conditions, one expects there to be a singular point associated with the edges of the punch aboutwhich exist constant stress angular sectors. The only ambiguity in the derivation is to determine theprecise positions of the singular points relative to the Gaussian pressure distribution. Therefore, thefollowing procedure is employed to determine a scaling relationship for the positions of the singularpoints, and a detailed numerical simulation is performed to locate the precise position. The derivationfor the (114) case can be found in [Wang et al. 2008].
We first assume that a uniaxial stress state consisting of uniform pressure, P∗, is applied to the surfaceto be shocked such that plastic deformation is incipient. Schmid’s law for a plane strain deformation statewith effective in-plane slip systems can be expressed as [Kysar et al. 2005]
σ12 = tanφ(α)(σ11− σ22
2
)±β(α)τ (α)
cos 2φ(α), (6)
where the superscript α denotes the active slip system, φ(α) represents the angle between the slip systemand the x1-axis, τ (α) is the critical resolved shear stress which can be experimentally determined, and β(α)
is a geometric ratio (β(1)=β(3)= 2/√
3, β(2)=√
3), defined by [Rice 1987]. As seen in Figure 1, for bothcases considered, there are three effective slip systems denoted by i , i i , and i i i , which can be activated,as in Table 1. In order to find a scaling relation for the approximate position of the singular point, we findthe uniaxial stress at which plastic deformation initiates by solving (6) for P∗ with σ22 =−P∗, σ12 = 0and σ11 = 0 to obtain
P∗ =±2β(α)τ (α)
sin 2φ(α)(7)
as the approximate pressure at which plastic deformation will initiate. This value of P∗ is equated toP(x) in (1), and the corresponding value of x , denoted as x p, is
x p = R
√ln
P20 sin2 φ
(2βτ)2. (8)
This result is a scaling relation for the approximate position of the singular point. We further definex ′p = cx p, where c is a dimensionless constant of order unity to be determined by detailed numericalsimulation to specify the precise location, x ′p, of the singular point.

COMPARATIVE STUDY OF DEFORMATION OF AL SINGLE CRYSTAL 95
Active slip system φ for (110) case φ for (114) case β
i 144.7◦ 35.3◦ 2/√
3i i 90.0◦ 160.5◦
√3
i i i 35.3◦ 105.8◦ 2/√
3
Table 1. Values of φ and β for active slip systems.
6.2. Analytic prediction of slip sectors for (110) and (114) orientations. For a Gaussian pressure dis-tribution applied to the (110) surface, the surface tractions are given by σ22 = −P(x) and σ12 = 0. Ifone assumes incipient plastic deformation, it is evident that the stress state will coincide with vertex Fof the yield locus in Figure 2, left (see also Table 2 on page 97), so that both slip systems i and i i i areactivated under the pressure loading. From (7), the values of P∗ for the slip systems i and i i i are
(P∗)i =∓2β(1)τ (1)
sin 2φ(1), (P∗)i i i =∓
2β(3)τ (3)
sin 2φ(3),
where the superscripts on P∗ denote the active slip system. Since φ(3) =−φ(1), as indicated in Figure2, we have |P∗(1)| = |P∗(3)| so that both slip systems i and i i i are expected to be activated under theGaussian pressure distribution on the (110) surface, as expected. The approximate punch radius can thenbe estimated for the (110) orientation from (8) based upon the values of φ1 and β1 in Table 1.
The slip line field is then constructed based upon the concepts of [Rice 1973; 1987], as shown inFigure 3. There are constant stress angular sectors centered at each of the singular points; the boundariesof these sectors are slip directions and slip normals which pass through the singular point. In addition,
Figure 2. Yield locus for the (110) orientation (left) and for the (114) orientation (right).

96 SINIŠA VUKELIC, YOUNENG WANG, JEFFREY W. KYSAR AND Y. LAWRENCE YAO
there are constant stress triangular regions at the periphery of the slip line field. Within the centertriangular region, the stress state corresponds to position F on the yield locus in Figure 2, right. FromFigure 3, top it can be seen that the symmetric yield locus gives rise to a symmetric slip line field. On theother hand, the slip line field on the (114) surface, shown in Figure 3, bottom, as constructed by Wanget al. [2008] is asymmetric, reflecting the asymmetry of the yield locus for that orientation in Figure 2,right. From both parts of Figure 3, the geometry of the slip line field also provides an estimate for the
(110)
(110)
Figure 3. Geometry of slip line field under Gaussian loading for the (114) orientation(top) and the (110) orientation (bottom).
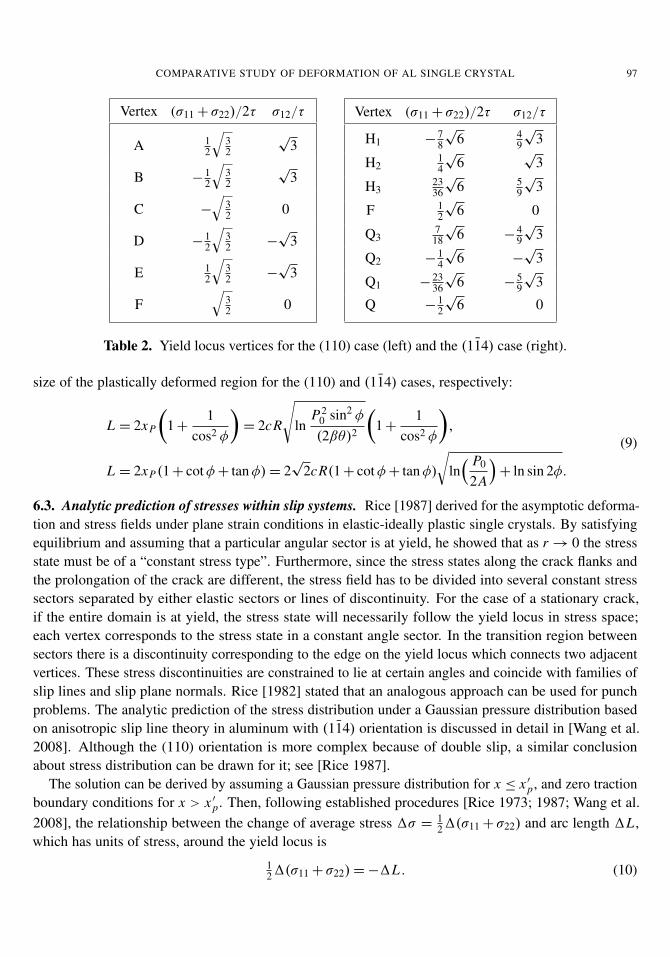
COMPARATIVE STUDY OF DEFORMATION OF AL SINGLE CRYSTAL 97
Vertex (σ11+ σ22)/2τ σ12/τ
A 12
√32
√3
B −12
√32
√3
C −
√32 0
D −12
√32 −
√3
E 12
√32 −
√3
F√
32 0
Vertex (σ11+ σ22)/2τ σ12/τ
H1 −78
√6 4
9
√3
H214
√6
√3
H32336
√6 5
9
√3
F 12
√6 0
Q3718
√6 −
49
√3
Q2 −14
√6 −
√3
Q1 −2336
√6 −
59
√3
Q −12
√6 0
Table 2. Yield locus vertices for the (110) case (left) and the (114) case (right).
size of the plastically deformed region for the (110) and (114) cases, respectively:
L = 2xP
(1+
1cos2 φ
)= 2cR
√ln
P20 sin2 φ
(2βθ)2
(1+
1cos2 φ
),
L = 2xP(1+ cotφ+ tanφ)= 2√
2cR(1+ cotφ+ tanφ)
√ln( P0
2A
)+ ln sin 2φ.
(9)
6.3. Analytic prediction of stresses within slip systems. Rice [1987] derived for the asymptotic deforma-tion and stress fields under plane strain conditions in elastic-ideally plastic single crystals. By satisfyingequilibrium and assuming that a particular angular sector is at yield, he showed that as r→ 0 the stressstate must be of a “constant stress type”. Furthermore, since the stress states along the crack flanks andthe prolongation of the crack are different, the stress field has to be divided into several constant stresssectors separated by either elastic sectors or lines of discontinuity. For the case of a stationary crack,if the entire domain is at yield, the stress state will necessarily follow the yield locus in stress space;each vertex corresponds to the stress state in a constant angle sector. In the transition region betweensectors there is a discontinuity corresponding to the edge on the yield locus which connects two adjacentvertices. These stress discontinuities are constrained to lie at certain angles and coincide with families ofslip lines and slip plane normals. Rice [1982] stated that an analogous approach can be used for punchproblems. The analytic prediction of the stress distribution under a Gaussian pressure distribution basedon anisotropic slip line theory in aluminum with (114) orientation is discussed in detail in [Wang et al.2008]. Although the (110) orientation is more complex because of double slip, a similar conclusionabout stress distribution can be drawn for it; see [Rice 1987].
The solution can be derived by assuming a Gaussian pressure distribution for x ≤ x ′p, and zero tractionboundary conditions for x > x ′p. Then, following established procedures [Rice 1973; 1987; Wang et al.2008], the relationship between the change of average stress 1σ = 1
21(σ11+ σ22) and arc length 1L ,which has units of stress, around the yield locus is
121(σ11+ σ22)=−1L . (10)

98 SINIŠA VUKELIC, YOUNENG WANG, JEFFREY W. KYSAR AND Y. LAWRENCE YAO
Sector σ11/τcr σ22/τcr σ12/τcr Active slip systems
A −32
√6 −2
√6
√3 i, i i
B −32
√6 −
√6
√3 i i, i i i
C −√
6 0 0 i, i i i
D −32
√6 −
√6 −
√3 i, i i
E −32
√6 −2
√6 −
√3 i i, i i i
Sector σ11/τcr σ22/τcr σ12/τcr Active slip systems
H −√
6 0 0 i
H1 −119
√6 −
49
√6 4
9
√3 i, i i i
H2 −43
√6 −
116
√6
√3 i i, i i i
H3 −139
√6 −
4918
√6 5
9
√3 i, i i
Q3 −169
√6 −
239
√6 −
49
√3 i, i i i
Q2 −53
√6 −
76
√6 −
√3 i i, i i i
Q1 −149
√6 −
518
√6 −
59
√3 i, i i
Q −√
6 0 0 i
Table 3. Stresses within sectors for the (110) case (top) and the (114) case (bottom).
Yield locus vertices can be found from geometry, and thus the arc length L can be calculated so thatstresses in each of the regions in Figure 3 can be derived. Table 3 shows the normalized values of stresscomponents in each sector for both the (110) and (114) case. More detailed solutions for cracks andcylindrical voids in single crystals case can be found in [Rice 1987; Kysar et al. 2005].
6.4. Analytic prediction of lattice rotation for (110) and (114) orientations. As seen in Section 4, thespin tensor � consists of �∗, which corresponds to lattice rotation, and �P , associated with plastic slip.Following [Asaro 1983], the plastic part of �P is
�P=
N∑α=1
W (α)· λα, (11)
where α represents active slip systems, γ is the rate of shear, and the tensor W is defined by
W (α)=
12(s
(α)⊗ n(α)− n(α)⊗ s(α)). (12)
Therefore, �∗ can be rewritten as
�∗ =�−12
N∑α=1
γ (s(α)⊗ n(α)− n(α)⊗ s(α)) (13)

COMPARATIVE STUDY OF DEFORMATION OF AL SINGLE CRYSTAL 99
which gives a relation between the spin tensor responsible for lattice rotation and the slip rate of eachactive slip system. If n and s are projected onto the x1, x2 plane and rescaled as unit vectors N and S,taking into account the plane strain condition, (8) can be expressed as
�∗ =�−12
N∑α=1
γ (S(α)⊗ N (α)− N (α)
⊗ S(α))β(α) (14)
From [Rice 1987] it follows that S1 = N2, S2 =−N1, so the term in parentheses reduces to a constant.The only factors left under the summation are the strain rate and the β term, which is different for eachslip system, as discussed by Rice.
Unlike the (114) case, in which only one slip system is active in the triangular regions, in the (110)orientation there are two active slip systems. From the solution for the stresses, it can be shown that theshear strain on each slip system has the same sign, so that the lattice spin induced by both slip systemsalso has the same sign, which leads to the conclusion that the deformation associated with each slipsystem adds to the total rotation. Furthermore, the (110) orientation is symmetric, and therefore eachactive slip system equally contributes to the magnitude of the lattice deformation. On the other hand,only one slip system is active for the (114) case, which suggests that the overall lattice rotation might beless than that in the symmetric case. A more detailed discussion about the numerical and experimentalresults is given below.
7. Numerical results and comparison with experiments and analytic solutions
7.1. Slip sectors and shear strain increments. According to the analytic solution, the entire deformationfield is divided into sectors. In each of those sectors one or two slips are active. As discussed by[Rice 1987], boundaries of sectors are slip directions and slip normals which represent lines of stressdiscontinuity. The numerical model agrees well with the analytic solution as shown by [Wang et al.2008] for (114) case. In the case of the (110) orientation, the analytic results derived in the previoussection and superimposed on the numerical findings are in good agreement as well, as seen in Figure 4.However, here, emphasis is placed on comparison between the deformation states of the symmetric andasymmetric orientations. Both total shear as well as shear increments for each slip system are of interest.Figure 4 depicts antisymmetry of shear strain increments associated with slips i and i i i . At the sametime, shear strain increment on slip system i i is symmetric about the center of the shock. The extent ofthe shear strain increment of all slip systems agrees well with the deformation field derived analyticly,if one chooses the consistent c to determine x ′p. Likewise, the (114) calculations agree well with theanalytic solution (see Figure 5). The distribution of the shear strain increments is larger on the right sideof the deformation field.
7.2. Lattice rotation. Plastic deformation induced by µLSP causes crystallographic lattice rotation thatwas characterized via Electron Backscatter Diffraction (EBSD). The region of interest is mapped afterlaser treatment and its crystallographic orientation compared with the known initial state which servesas a reference. More details about this method can be found in [Kysar and Briant 2002]. Results shownhere were reported elsewhere [Wang et al. 2008; Vukelic et al. ≥ 2009], and in this study they serve asa comparison with the numerical model.

100 SINIŠA VUKELIC, YOUNENG WANG, JEFFREY W. KYSAR AND Y. LAWRENCE YAO
Figure 4. Shear strain increment in each slip system at the end of the loading step for the(110) orientation. Top left, increment in slip system i ; top right, slip system i i ; bottomleft, slip system i i i ; bottom right, total shear strain increment.
Figure 5. Shear strain increment in each slip system in the end of loading step for (114)orientation. Top left, increment in slip system i ; top right, slip system i i ; bottom left,slip system i i i ; bottom right, total shear strain increment.

COMPARATIVE STUDY OF DEFORMATION OF AL SINGLE CRYSTAL 101
Figure 6. Lattice rotation contour map on the (110) cross section. Positive rotation iscounterclockwise about the z-axis.
Lattice rotation results obtained from EBSD measurements of the cross-section are shown in Figure 6.Antisymmetric rotation about the center of the shock line can be observed with blue regions correspond-ing to counterclockwise rotation and red regions depicting clockwise rotation. Green areas in the fieldrepresent unrotated parts of the crystal. From Figure 6a it can be seen that deformation of the (110) crystalis approximately symmetric and slightly narrower than in the (114) case. The magnitude of deformationis largest close to the surface of the specimen and about 15 um away from the center of the shock line.It can also be seen that directly under the center of the shock line is a region of unrotated crystal. Themagnitude of deformation is different for the symmetric and asymmetric cases; for the (110) orientation,the lattice rotates between ±2.4◦, almost double of the rotation of the (114) orientation which is about±1.2◦. These results are consistent with analytic predictions derived in the previous section that thedouble slip will cause a larger increase in the lattice rotation than the case of a single slip correspondingto the (114) orientation.
Numerical results of the in-plane lattice rotation are shown in Figure 7. One sees there good agreementbetween simulation and experimental findings. The main trend for the case of counterclockwise andclockwise rotations located directly under the center of the loading is apparent. The (110) orientationgives a symmetric response as opposed to the asymmetric case of (114). Also, the magnitude of thelattice rotation is larger for the double slip case. However, there is a discrepancy between experimentalresults and simulation, mainly seen in the magnitude of rotation. This arises from the limitations of theFEM model in which the effects of inertia and work hardening are being neglected.
7.3. Stress distribution. The FEM results of residual stress, σ11, after unloading are shown in Figure8. It can be seen that the stress field is symmetric in the (110) case and asymmetric in the (114) case.A region of compressive residual stress exists in the center region, whereas self-equilibrating regions of

102 SINIŠA VUKELIC, YOUNENG WANG, JEFFREY W. KYSAR AND Y. LAWRENCE YAO
Figure 7. Lattice deformation contour by FEM for the (110) orientation (top) and the(114) orientation (bottom).
tensile residual stress is located far from the center, with the exception of two small regions of tensileresidual stress located at the tips of the assumed ends of the punch. The trend shown in Figure 8 sug-gests that the process of µLSP is beneficial to the fatigue life and wear resistance of micro componentsexperiencing cyclic loading. Also, it should be noted that in previous studies [Wang et al. 2008], thesurface displacement after applying laser shocks onto the top surface has been measured by atomic forcemicroscopy (AFM) and optical profilometry [Vukelic et al. ≥ 2009], and the trend coincides with theresults captured by finite element simulation.
8. Conclusion
We presented a comparison between laser shock peening of two different orientations of aluminum singlecrystals, one symmetric and one asymmetric. Anisotropic slip line theory was employed for the construc-tion of slip line fields for both orientations and compared with numerical results. In addition, the stressdistribution in angular sectors has been calculated. For the double slip symmetric case, plastic deforma-tion caused by two slip systems adds to the total deformation as characterized by the lattice rotations

COMPARATIVE STUDY OF DEFORMATION OF AL SINGLE CRYSTAL 103
Figure 8. FEM simulation of residual stress distribution for the (110) orientation (top)and the (114) orientation (bottom).
which suggests that deformation in the symmetric orientation will be greater than in the asymmetric case.A numerical model is established for a more detailed investigation of the µLSP process and comparedto experiments. Experimental measurement of lattice rotation via EBSD in the double slip case showsthat lattice rotation is twice as large as in the single slip case, which is consistent with the analytic work.Future work will include the effect of heterogeneity through the study of the grain boundary response toµLSP, which will be achieved by examination of bicrystals.
References
[Asaro 1983] R. J. Asaro, “Micromechanics of crystals and polycrystals”, Adv. Appl. Mech. 23 (1983), 1–115.
[Booker and Davis 1972] J. R. Booker and E. H. Davis, “A general treatment of plastic anisotropy under conditions of planestrain”, J. Mech. Phys. Solids 20:4 (1972), 239–250.
[Chen et al. 2004a] H. Q. Chen, J. W. Kysar, and Y. L. Yao, “Characterization of plastic deformation induced by microscalelaser shock peening”, J. Appl. Mech. (ASME) 71:5 (2004), 713–723.

104 SINIŠA VUKELIC, YOUNENG WANG, JEFFREY W. KYSAR AND Y. LAWRENCE YAO
[Chen et al. 2004b] H. Q. Chen, Y. L. Yao, and J. W. Kysar, “Spatially resolved characterization of residual stress induced bymicro scale laser shock peening”, J. Manuf. Sci. Eng. (ASME) 126:2 (2004), 226–236.
[Clauer and Holbrook 1981] A. H. Clauer and J. H. Holbrook, “Effects of laser induced shock waves on metals”, Chapter 38,pp. 675–703 in Shock waves and high-strain-rate phenomena in metals: concepts and applications (Albuquerque, NM, 1980),edited by M. A. Meyers and L. E. Murr, Plenum, New York, 1981.
[Clauer and Lahrman 2001] A. H. Clauer and D. F. Lahrman, “Laser shock processing as a surface enhancement process”, KeyEng. Mat. 197 (2001), 121–142.
[Crone et al. 2004] W. C. Crone, T. W. Shield, A. Creuziger, and B. Henneman, “Orientation dependence of the plastic slipnear notches in ductile FCC single crystals”, J. Mech. Phys. Solids 52:1 (2004), 85–112.
[Drugan 2001] W. J. Drugan, “Asymptotic solutions for tensile crack tip fields without kink-type shear bands in elastic-ideallyplastic single crystals”, J. Mech. Phys. Solids 49:9 (2001), 2155–2176.
[Fabbro et al. 1990] R. Fabbro, J. Fournier, P. Ballard, and D. Devaux, “Physical study of laser-produced plasma in confinedgeometry”, J. Appl. Phys. 68:2 (1990), 775–784.
[Fan et al. 2005] Y. Fan, Y. Wang, S. Vukelic, and Y. L. Yao, “Wave-solid interactions in laser-shock-induced deformationprocesses”, J. Appl. Phys. 98:10 (2005), 104904–104904–11.
[Hammersley et al. 2000] G. Hammersley, L. A. Hackel, and F. Harris, “Surface prestressing to improve fatigue strength ofcomponents by laser shot peening”, Opt. Lasers Eng. 34:4–6 (2000), 327–337.
[Hencky 1923] H. Hencky, “Über einige statisch bestimmte Fälle des Gleichgewichts in plastischen Körpern”, Z. Angew. Math.Mech. 3:4 (1923), 241–251.
[Hill 1998] R. Hill, The mathematical theory of plasticity, Oxford Univerity Press, New York, 1998.
[Huang 1991] Y. Huang, “A user-material subroutine incorporating single crystal plasticity in the ABAQUS finite elementprogram”, Division of Applied Sciences, Harvard University, Cambridge, MA, 1991, Available at http://www.columbia.edu/~jk2079/fem/umat documentation.pdf.
[Kysar 1997] J. W. Kysar, “Addendum to ’A user-material subroutine incorporating single crystal plasticity in the ABAQUSfinite element program, Mech Report 178”’, Division of Applied Sciences, Harvard University, Cambridge, MA, 1997, Avail-able at http://www.columbia.edu/~jk2079/fem/Addendum%20to%20umat.pdf.
[Kysar 2001a] J. W. Kysar, “Continuum simulations of directional dependence of crack growth along a copper/sapphire bicrys-tal interface, I: Experiments and crystal plasticity background”, J. Mech. Phys. Solids 49:5 (2001), 1099–1128.
[Kysar 2001b] J. W. Kysar, “Continuum simulations of directional dependence of crack growth along a copper/sapphire bicrys-tal interface, II: Crack tip stress/deformation analysis”, J. Mech. Phys. Solids 49:5 (2001), 1129–1153.
[Kysar and Briant 2002] J. W. Kysar and C. L. Briant, “Crack tip deformation fields in ductile single crystals”, Acta Mater.50:9 (2002), 2367–2380.
[Kysar et al. 2005] J. W. Kysar, Y. X. Gan, and G. Mendez-Arzuza, “Cylindrical void in a rigid-ideally plastic single crystal, I:Anisotropic slip line theory solution for face-centered cubic crystals”, Int. J. Plast. 21:8 (2005), 1481–1520.
[Prandtl 1923] L. Prandtl, “Anwendungsbeispiele zu einem Henckyschen Satz über das plastische Gleichgewicht”, Z. Angew.Math. Mech. 3:6 (1923), 401–406.
[Rice 1973] J. R. Rice, “Plane strain slip line theory for anisotropic rigid/plastic materials”, J. Mech. Phys. Solids 21:2 (1973),63–74.
[Rice 1982] J. R. Rice, “Elastic-plastic crack growth”, pp. 539–562 in Mechanics of solids: The Rodney Hill 60th anniversaryvolume, edited by H. G. Hopkins and M. J. Sewell, Pergamon, Oxford, 1982.
[Rice 1987] J. R. Rice, “Tensile crack tip fields in elastic-ideally plastic crystals”, Mech. Mater. 6:4 (1987), 317–335.
[Vukelic et al. ≥ 2009] S. Vukelic, Y. Wang, J. W. Kysar, and Y. L. Yao, “Dynamic material response of aluminum singlecrystal under micro scale laser shock peening”. Submitted to J. Manuf. Sci. Eng. (ASME).
[Wang et al. 2008] Y. Wang, J. W. Kysar, and Y. L. Yao, “Analytical solution of anisotropic plastic deformation induced bymicro-scale laser shock peening”, Mech. Mater. 40:3 (2008), 100–114.
[Zhang and Yao 2002] W. Zhang and Y. L. Yao, “Microscale laser shock processing of metallic components”, J. Manuf. Sci.Eng. (ASME) 124:2 (2002), 369–378.

COMPARATIVE STUDY OF DEFORMATION OF AL SINGLE CRYSTAL 105
Received 17 Sep 2008. Revised 10 Nov 2008. Accepted 13 Nov 2008.
SINIŠA VUKELIC: [email protected] University, Mechanical Engineering Department, 500 W 120th Street, S. W. Mudd Building Room 220, MC 4703,New York, NY 10027, United States
YOUNENG WANG: [email protected] University, Mechanical Engineering Department, 500 W 120th Street, S. W. Mudd Building Room 220, MC 4703,New York, NY 10027, United States
JEFFREY W. KYSAR: [email protected] University, Mechanical Engineering Department, 500 W 120th Street, S. W. Mudd Building Room 220, MC 4703,New York, NY 10027, United States
Y. LAWRENCE YAO: [email protected] University, Mechanical Engineering Department, 500 W 120th Street, S. W. Mudd Building Room 220, MC 4703,New York, NY 10027, United States
