comparative assessment of rapd and issr...
TRANSCRIPT


OPEN ACCESS Asian Journal of Plant Pathology
ISSN 1819-1541DOI: 10.3923/ajppaj.2017.130.138
Research ArticleComparative Assessment of RAPD and ISSR Markers to StudyGenetic Polymorphism in Colletotrichum gloeosorioides Isolates ofMango1Archana Sornakili, 2Prabukarthikeyan Karthikeyan Rathinam, 1Raguchander Thiruvengadum and1Prabakar Kuppusamy
1Department of Plant Pathology, Centre for Plant Protection Studies, Tamil Nadu Agricultural University, 641003 Coimbatore, Tamil Nadu,India2Division of Crop Protection, National Rice Research Institute (NRRI), Cuttack, Odisha, India
AbstractBackground and Objective: Morphological traits of the genus Colletotrichum are extremely variable and hosts might be infected by asingle or multiple species of the pathogen, hence development of species-specific primers has provided a powerful tool for the detectionof plant pathogens. The objective of the study was to assess efficiency of Random Amplified Polymorphic DNA (RAPD) and Inter SimpleSequence Repeat (ISSR) primers against C. gloeosporioides in terms of genetic variability. Materials and Methods: Random amplifiedpolymorphic DNA and inter simple sequence repeat primers are simple PCR-based assays targeting microsatellite regions of the genome.Intra and interspecific polymorphisms among the twentysix isolates of C. gloeosporioides, causing anthracnose on mango were evaluatedby these markers. Results: In the present research, RAPD primers generated 519 amplicans with 82 alleles of which 77 were polymorphicwith 7.4 assay efficiency index; ISSR markers produced 1469 amplicans with 189 amplification products, out of which 180 werepolymorphic with 11.81 assay efficiency index. Although both the techniques were efficient and reproducible, ISSR indicated highergenetic variability in terms of percent polymorphism, polymorphism information content and effective multiplex ratio compared to RAPDanalysis. Among 16 ISSR primers (CAG)5, (TGTC)4, (AGG)5, (TCC)5, (CAG)3, (AG)8 T, (GA)8 T, (TG)8 A, (GA)8 YG, (GT)8 YC recorded highest percentpolymorphism and highest PIC value of 0.97 by (GA)8 T and EMR of 23.04 by (GACA)4 was recorded. Conclusion: It is concluded thatwell-chosen ISSR primers could result in quick estimate in terms of their efficiency in detecting polymorphisms among the isolates.
Key words: C. gloeosporioides, diversity in polymorphism,genetic markers, ISSR, RAPD primers
Received: March 14, 2017 Accepted: May 27, 2017 Published: June 15, 2017
Citation: Archana Sornakili, Prabukarthikeyan Rathinam, Raguchander Thiruvengadum and Prabakar Kuppusamy, 2017. Comparative assessment of RAPDand ISSR markers to study genetic polymorphism in Colletotrichum gloeosorioides isolates of mango. Asian J. Plant Pathol., 11: 130-138.
Corresponding Author: Archana Sornakili, Department of Plant Pathology, Centre for Plant Protection Studies, Tamil Nadu Agricultural University,641003 Coimbatore, Tamil Nadu, India
Copyright: © 2017 Archana Sornakili et al. This is an open access article distributed under the terms of the creative commons attribution License, whichpermits unrestricted use, distribution and reproduction in any medium, provided the original author and source are credited.
Competing Interest: The authors have declared that no competing interest exists.
Data Availability: All relevant data are within the paper and its supporting information files.
Asian J. Plant Pathol., 11 (3): 130-138, 2017
INTRODUCTION
Colletotrichum gloeosporioides, anthracnose diseases ofmango is more prevalent and severe in humid areas, affectingmango tress with maximum disease incidence. Genomesequencing has virtually opened a door for characterizationand evaluation of genetic diversity within and betweenspecies and populations using molecular markers. It has beenshowed that different markers might reveal various classes ofdiversity1,2. It is correlated with the genome fraction surveyedby each kind of marker, their distribution throughout thegenome and the extent of the DNA target which is analyzedby each specific assay3. Though, genetic variability among thefungal population limited by the proteins and isozymes,correlation of molecular markers to morphological, culturaland virulence characters provide us requisite landmarks forthe elucidation of genetic variation. An ideal molecular markershould be highly polymorphic in nature with consistentdistribution throughout the genome, also provide adequateresolution of genetic differences, have linkage to distinctphenotypes and without necessitate evidence about thegenome of an organism4,5.
The RAPD and ISSR markers does not require radioactivecompounds and it could be revealed a high degree ofpolymorphism. In the recent era, the efficiency of differentmolecular marker systems has been studied in assessinggenetic diversity using various statistical parameters6.
By using these markers, the correlation between differentpolymorphism assays may vary between as well as withinspecies. Therefore, careful evaluation is needed for each PCRbased marker system before being wellgrouped7. In addition,primers with more than 50% GC content are desired becauseduring polymerization process, it could be strong enough toform a duplex. Kumar et al.8 compared three marker systemviz., Random Amplified Polymorphic DNA (RAPD), UniversalRice Primers (URP) and Inter Simple Sequence Repeat (ISSR)markers to characterize twenty C. falcatum isolates andamong three markers, URP markers could successfully assessgenetic diversity in C. falcatum as it produced more numberof total bands amplified (TB) and Polymorphic Bands (PB). Inaddition, the parameters measuring the efficiency of markersviz., expected heterozygosity (Hn), Effective Multiplex Ratio(EMR), resolving power (Rp) and Marker Index (MI) were morein URP markers. Studies by Tymon and Pell9 clearly depictedthat usage of ISSR, ERIC and RAPD markers for the estimationof genetic diversity of 30 isolates of the entomopathogenicfungus Pandora neoaphidis of different geographic originsproduced larger number of polymorphic bands obtained from
ISSR. In addition, ISSR marker is a simple and rapid technique,requires no sequence information and using a single primerfor detection and random amplification of the DNA. Hence,comparing RAPD and ISSR amplification will be clearlydepicted the polymorphism among the C. gloeosporioidesisolates of mango separately by each primer, which wasfurther used for genetic variability.
Mirmajlessi et al.10 assessed the genetic diversity, bycomparing RAPD and ISSR markers in twenty three isolates ofRhizoctonia solani from root, crown and rhizosphere ofcucumber, pumpkin, watermelon and melon plants andreported that ISSR profiles showed the highest levels ofpolymorphism (0.37) in R. solani AG4, while the lowest levelsof polymorphism (0.32) was detected with RAPD profiles. Acomparative analysis of genetic variation from differentplaces of Tamil Nadu will help explain the overall structure ofthe C. gloeosporioides population and the diversity withineach location will better define against potentially damagingstrains. The present study objectives were designed to analysethe genetic diversity of C. gloeosporioides pathogen ofmango anthracnose disease using two molecular markers viz.,RAPD and ISSR.
MATERIALS AND METHODS
Isolation of C. gloeosporioides: Twenty six isolates ofC. gloeosporioides were isolated from anthracnose diseaseinfected mango samples during the period of 2011-2012 fromdifferent districts of Tamil Nadu, India and their pathogenecity,morphological variation and virulence of all isolates werepreviously studied by Archana et al.11.
Molecular identification: Genomic DNA was extracted fromthe mycelial mat of C. gloeosporioides isolates by CetylTrimethyl Ammonium Bromide (CTAB) method as describedby Knapp and Chandlee12. The ITS1-5.8S-ITS2 region ofribosomal DNA from twenty six isolates of C. gloeosporioideswas amplified with ITS1 (5' -TCCGTAGGTGAACCTGCGG-3' )and ITS4 (5’-TCCTCCGCTTATTGATATGC-3’) primers andfurther it confirmed with the specific primer (CgInt)(5’-GGCCTCCCGCCTCCGGGCGG-3’) coupled with ITS 4(5’-TCCTCCGCTTATTGATATGC-3’).
Comparison of marker systems: A set of 10 RAPD (OPB 07,OPF 11, OPF14, OPF 07, OPL 12, OPL 05, OPD 07, OPA 09, OPG16, OPC 08) and 16 ISSR ((CAG)5, (GACA)4, (GACAC)3, (TGTC)4,(AGG)5, (ACTG)4, (TCC)5, (GTG)5, (CAG)3, (CAC)5, (AG)8 T, (AG)8 C,(GA)8 T, (TG)8 A, (GA)8 YG, (GT)8 YC) primers (Chromous Biotech
131

Asian J. Plant Pathol., 11 (3): 130-138, 2017
Pvt. Ltd., Bangalore) were used to identify the molecularvariability of twenty six C. gloeosporioides isolates.
Data analysis: For data analysis, each band with a differentelectrophoretic mobility was assigned a position number anda mark of 1 or 0 based on the presence or absence of theband. Only reproducible bands were considered for analysis.Bands common to all isolates were incorporated into theanalysis. The parameters of banding pattern viz., total numberof bands, number of monomorphic, polymorphic bands perprimer and percent polymorphism were calculating bycounting the number of bands produced by each primer in allthe twenty six isolates. In addition, assay efficiency index(AEI = Polymorphic bands/Total number of primers) of RAPDand ISSR markers were documented.
Polymorphism Information Content (PIC) was calculatedusing the formula developed by Anderson et al.13. A PIC valueof each locus was calculated as:
PICj = 1- 3l = 1to L P2lj (1)
where, Plj is the relative frequency if the lth allele for the locusj and is summed across all the alleles (L) over all lines. The PICprovides an estimate of the discriminatory power of a locus bytaking into account, not only the number of alleles thatare expressed but also the relative frequencies of thosealleles. The PIC values may range from 0 (monomorphic) to 1(very highly discriminative), with many alleles in equalfrequencies.
Genotypic gene diversity was calculated as described byMariette et al.14:
Hg = 1-(pi2-qi
2) (2)
where, pi2-qi2 are the frequencies of the dominant and nullalleles, respectively. Here, allele frequencies were calculatedbased on the frequency of the null allele (i.e., the number ofindividuals without the band). Where, pi (pi = 1-qi) representsthe frequency of the dominant allele and qi represents thefrequency of the null allele:
1/2
i
No. of individuals for which the band was NOT presentq =
Total no. of individuals surveyed
Marker Index (MI) was determined as the product of PICand the number of polymorphic bands per assay unit andEffective Multiplex Ratio (EMR) is the product of the fraction ofpolymorphic loci and the number of polymorphic loci for anindividual assay:
EMR (E) = np (np/n) (3)
where, np is the number of polymorphic loci and n is the totalnumber of loci1.
Statistical analysis: The banding patterns were scored forRAPD and ISSR primers in each C. gloeosporioides isolatestarting from the small size fragment to large sized one.Presence and absence of each band in each isolate was codedas 1 and 0 respectively. The scores were used to create a datamatrix to analyse genetic relationship using the NTSYS-pcprogram version 2.02 (Exeter Software, New York, USA)described by Rohlf 15.
RESULTS AND DISCUSSION
In the present study analysis of the ITS sequence of theribosomal DNA, all the twenty six isolates amplified with theprimer pairs of ITS1 and ITS4 and CgInt and ITS4, confirmingthat they pertained to C. gloeosporioides by producing theamplicons at 560 and 450 bp, respectively.
To compare the utility of the two marker systems, twentysix isolates of C. gloeosporioides were analyzed with 10 RAPDand sixteen ISSR primers. Various parameters viz., total numberof alleles, number of polymorphic bands per assay unit, meanpercentage of polymorphism per assay, number ofmonomorphic bands per assay, Polymorphic InformationContent (PIC) value, genotypic gene diversity, Marker Index(MI), Effective Multiplex Ratio (EMR) and Assay Efficiency Index(AEI) were recorded as criteria to differentiate their efficacy.
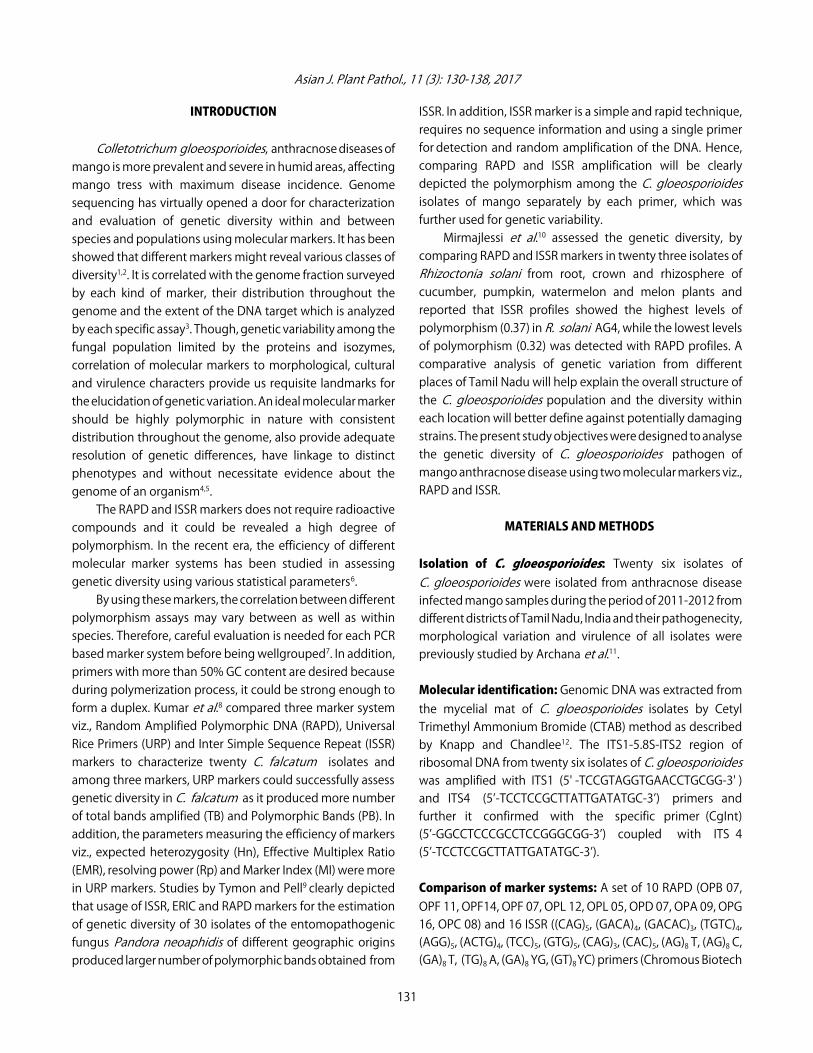
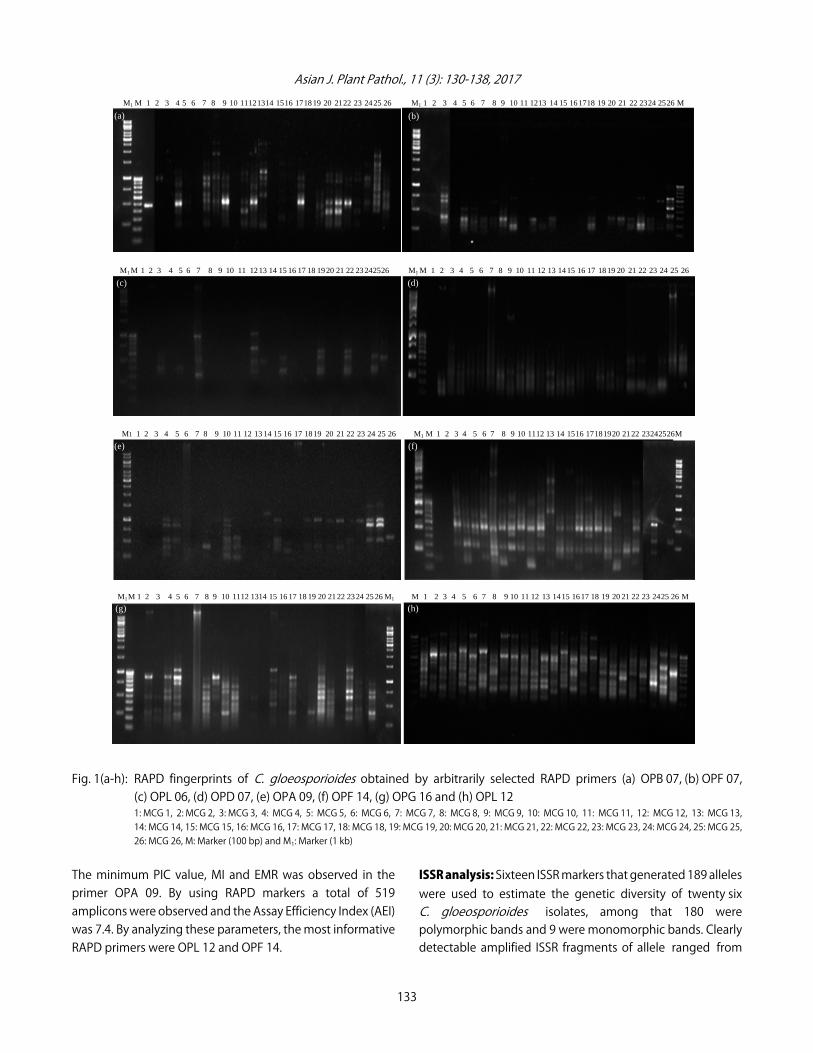
RAPD analysis: All the twenty six C. gloeosporioides isolateshad polymorphic fragments which were generated by 10oligonucleotides decamers. The selection of primers wasbased on clear, scorable and reproducible amplified bandingpatterns. The number of amplification products obtained in allisolates was specific to each primer and the size was variedfrom 100 to 2000 bp. Of the 10 primers used, six primers viz.,OPB 07, OPF 14, OPF 07, OPL 05, OPD 07 and OPG 16 werefound to show 100 per cent polymorphism which is presentedin (Table 1, Fig. 1). Of the 82 total alleles observed, 77 alleleswere polymorphic and maximum numbers of 14 alleles wereobtained with primer OPL 12, followed by primer OPF 14 with12 alleles. Minimum numbers of 5 alleles were generated withprimer OPL 05. Thus, amplifications varied across the primeremployed. Among the 10 RAPD primers, the PolymorphismInformation Content (PIC) was in the range of 0.69 to 0.90 andthe Marker Index (MI) were 3.47 to 10.82. In addition, theEffective Multiplex Ratio (EMR) was in the range of 4.17-12.00.
132
Asian J. Plant Pathol., 11 (3): 130-138, 2017
Fig. 1(a-h): RAPD fingerprints of C. gloeosporioides obtained by arbitrarily selected RAPD primers (a) OPB 07, (b) OPF 07,(c) OPL 06, (d) OPD 07, (e) OPA 09, (f) OPF 14, (g) OPG 16 and (h) OPL 121: MCG 1, 2: MCG 2, 3: MCG 3, 4: MCG 4, 5: MCG 5, 6: MCG 6, 7: MCG 7, 8: MCG 8, 9: MCG 9, 10: MCG 10, 11: MCG 11, 12: MCG 12, 13: MCG 13,14: MCG 14, 15: MCG 15, 16: MCG 16, 17: MCG 17, 18: MCG 18, 19: MCG 19, 20: MCG 20, 21: MCG 21, 22: MCG 22, 23: MCG 23, 24: MCG 24, 25: MCG 25,26: MCG 26, M: Marker (100 bp) and M1: Marker (1 kb)
The minimum PIC value, MI and EMR was observed in theprimer OPA 09. By using RAPD markers a total of 519amplicons were observed and the Assay Efficiency Index (AEI)was 7.4. By analyzing these parameters, the most informativeRAPD primers were OPL 12 and OPF 14.
ISSR analysis: Sixteen ISSR markers that generated 189 alleleswere used to estimate the genetic diversity of twenty sixC. gloeosporioides isolates, among that 180 werepolymorphic bands and 9 were monomorphic bands. Clearlydetectable amplified ISSR fragments of allele ranged from
133
M1 M 1 2 3 4 5 6 7 8 9 10 11 12 13 14 15 16 17 18 19 20 21 22 23 24 25 26 M1 1 2 3 4 5 6 7 8 9 10 11 12 13 14 15 16 17 18 19 20 21 22 23 24 25 26 M
M1 M 1 2 3 4 5 6 7 8 9 10 11 12 13 14 15 16 17 18 19 20 21 22 23 24 25 26 M1 M 1 2 3 4 5 6 7 8 9 10 11 12 13 14 15 16 17 18 19 20 21 22 23 24 25 26
(a) (b)
(c) (d)
M1 1 2 3 4 5 6 7 8 9 10 11 12 13 14 15 16 17 18 19 20 21 22 23 24 25 26 M1 M 1 2 3 4 5 6 7 8 9 10 11 12 13 14 15 16 17 18 19 20 21 22 23 24 25 26 M
(e) (f)
M1 M 1 2 3 4 5 6 7 8 9 10 11 12 1314 15 16 17 18 19 20 21 22 23 24 25 26 M1 M 1 2 3 4 5 6 7 8 9 10 11 12 13 14 15 16 17 18 19 20 21 22 23 24 25 26 M
(g) (h)

Asian J. Plant Pathol., 11 (3): 130-138, 2017
Table 1: Polymorphism detected by RAPD markersTotal Total Allele Genotypic
Primers alleles MB PB MM (%) PM (%) amplicans range PIC gene diversity MI EMR AEIOPB 07 8 0 8 0.00 100.00 56 100-1000 0.74 1.86 5.94 8.00 7.4OPF11 6 1 5 16.67 83.33 69 100-800 0.80 1.81 3.98 4.17OPF14 12 0 12 0.00 100.00 26 100-1000 0.90 1.71 10.79 12.00OPF 07 8 0 8 0.00 100.00 59 100-1400 0.87 1.88 6.96 8.00OPL 12 14 2 12 14.29 85.71 114 300-2000 0.90 1.66 10.82 10.29OPL 05 5 0 5 0.00 100.00 22 150-700 0.76 1.76 3.82 5.00OPD 07 6 0 6 0.00 100.00 87 400-1500 0.85 1.84 5.07 6.00OPA 09 6 1 5 16.67 83.33 37 100-400 0.69 1.91 3.47 4.17OPF 06 7 1 6 14.29 85.71 18 300-1500 0.80 1.88 4.81 5.14OPG 16 10 0 10 0.00 100.00 31 200-1400 0.75 1.71 7.55 10.00Total 82 5 77 61.92 938.08 519 8.06 18.02 63.21 72.76Mean 8.20 0.50 7.70 6.19 93.81 51.90 0.81 1.80 6.32 7.28MB: No. of monomorphic bands, PB: No. of polymorphic bands, MM (%): Monomorphism percentage, PM (%): Polymorphism percentage, PIC: Polymorphism informationcontent, MI: Marker index, EMR: Effective multiplex ratio, AEI: Assay efficiency index
Table 2: Polymorphism detected by ISSR markersTotal Allele Total Genotypic
Primers alleles MB PB MM (%) PM (%) range amplicans PIC gene diversity MI EMR AEI(CAG)5 16 0 16 0.00 100.00 100-1500 139 0.93 1.58 14.81 16.00 11.81(GACA)4 25 1 24 4.00 96.00 100-2000 250 0.95 0.95 22.85 23.04(GACAC)3 20 2 18 10.00 90.00 100-1000 182 0.94 0.96 16.87 16.20(TGTC)4 4 0 4 0.00 100.00 100-600 41 0.69 0.95 2.78 4.00(AGG)5 13 0 13 0.00 100.00 100-1000 71 0.89 0.99 11.59 13.00(ACTG)4 17 2 15 11.76 88.24 100-2500 35 0.89 0.99 13.28 13.24(TCC)5 4 0 4 0.00 100.00 600-2500 24 0.74 0.98 2.96 4.00(GTG)5 23 2 21 8.70 91.30 150-1500 161 0.94 0.98 19.67 19.17(CAG)3 10 0 10 0.00 100.00 100-1000 88 0.88 0.97 8.79 10.00(CAC)5 17 1 16 5.88 94.12 100-1500 159 0.94 0.96 14.96 15.06(AG)8 T 3 0 3 0.00 100.00 100-500 18 0.66 0.98 1.98 3.00(AG)8 C 11 1 10 9.09 90.91 100-800 91 0.86 0.97 8.62 9.09(GA)8 T 4 0 4 0.00 100.00 100-400 8 0.97 0.98 3.89 4.00(TG)8 A 10 0 10 0.00 100.00 100-1000 80 0.94 0.99 9.40 10.00(GA)8 YG 7 0 7 0.00 100.00 100-750 65 0.81 0.96 5.74 7.00(GT)8 YC 5 0 5 0.00 100.00 200-800 57 0.79 0.94 3.92 5.00Total 189 9 180 49.43 1550.57 1469 13.82 16.13 162.11 171.80Mean 11.81 0.56 11.25 3.09 96.91 91.81 0.86 1.01 10.13 10.74MB: No. of monomorphic bands, PB: No. of Polymorphic bands, MM (%): Monomorphism percentage, PM (%): Polymorphism percentage, PIC: Polymorphisminformation content, MI: Marker index, EMR: Effective multiplex ratio, AEI: Assay efficiency index
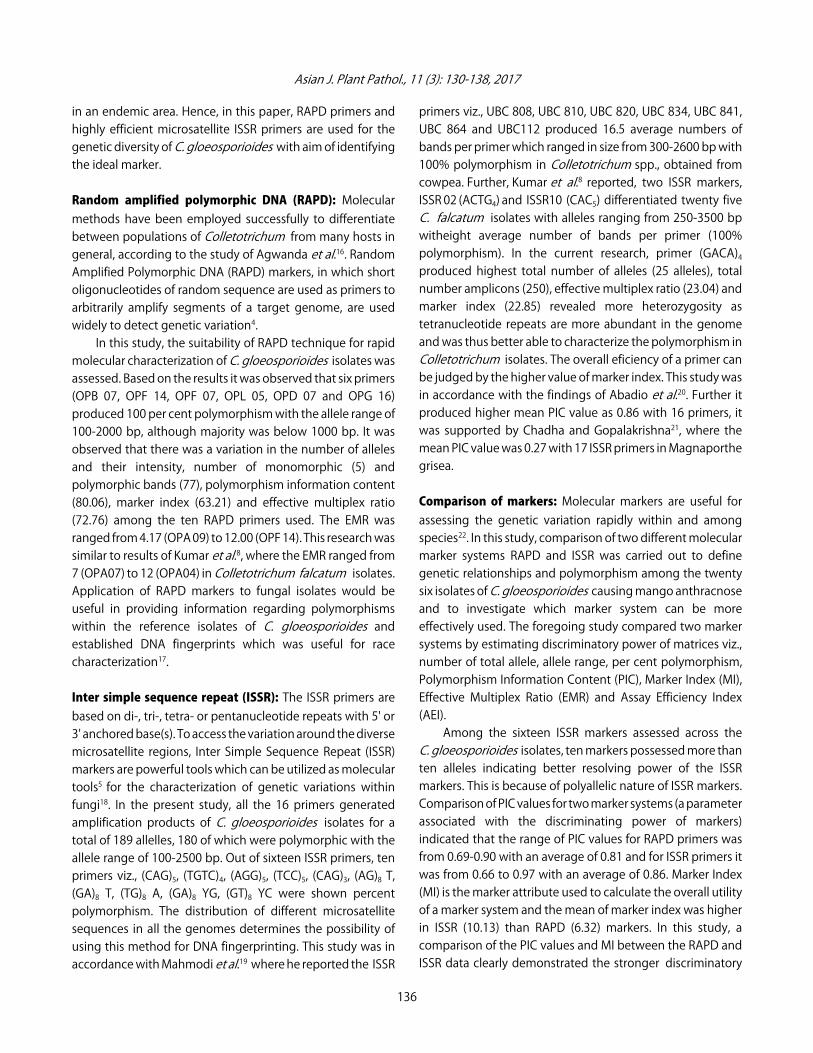
100-2500 bp in size (Table 2, Fig. 2). The number of allelesrevealed by each marker ranged from 3 alleles in (AG)8 T to 25alleles in (GACA)4, with an average of 11.81 alleles per locus.With the average of 96.91 per cent polymorphism producedby sixteen ISSR primers, percent polymorphism was detectedby the primers (CAG)5, (TGTC)4, (AGG)5, (TCC)5, (CAG)3, (AG)8 T,(GA)8 T, (TG)8 A, (GA)8 YG and (GT)8 YC. PolymorphismInformation Content (PIC), a measure of gene diversity was anaverage of 0.86 with a range of 0.66 by (AG)8 T to 0.97 by (GA)8T primer. A convenient estimate of marker utility maytherefore, be devised from the product of information asmeasured by PIC and the number of polymorphic bands perassay unit. The maximum marker index value of 22.85 wasobserved in the primer (GACA)4 and the minimum marker index of 1.98 was observed in the primer (AG)8 T. Among thesixteen ISSR primers used, (GACA)4 produced highest EMR of23.04 and the primer (AG)8 T produced lowest EMR of 3.00.
Comparison of RAPD and ISSR marker systems fortheir efficacy in assessing the genetic diversity ofC. gloeosporioides isolates: The mean number of allele perassay unit, number of polymorphic and monomorphic bandsper assay unit in ISSR analysis was 11.81, 11.25 and 0.56respectively, which were superior over RAPD primersaccounting 8.20, 7.70 and 0.50 alleles (Table 3). The ISSRmarker index (10.13) indicative of marker utility and meanpolymorphic information content per assay (0.86) wasgreater than the value of RAPD, which has 6.32 and 0.81respectively, is due to ISSR’s higher effective multiplex ratio(10.74). The mean genotypic gene diversity was 1.80 for RAPDanalysis, while for ISSR it was 1.01, despite the higher multiplexratio and marker index. Further, the higher percentage ofpolymorphic bands obtained from ISSR analysis (96.91%)compared to RAPD (93.81%).
134

Asian J. Plant Pathol., 11 (3): 130-138, 2017
Fig. 2(a-f): DNA fingerprint of C. gloeosporioides isolates by ISSR primers (a) (GACA)3, (b) (GTG)5, (c) (CAC)5, (d) (GACA)4, (e) (CAG)5and (f) (ACTG)4M: Marker (100 bp), 1: MCG 1, 2: MCG 2, 3: MCG 3, 4: MCG 4, 5: MCG 5, 6: MCG 6, 7: MCG 7, 8: MCG 8, 9: MCG 9, 10: MCG 10, 11: MCG 11, 12: MCG 12,13: MCG 13, 14: MCG 14, 15: MCG 15, 16: MCG 16, 17: MCG 17, 18: MCG 18, 19: MCG 19, 20: MCG 20, 21: MCG 21, 22: MCG 22, 23: MCG 23, 24: MCG 24,25: MCG 25 and 26: MCG 26
Table 3: Comparative analysis of banding patterns generated by RAPD and ISSR Components RAPD ISSRNumber of assay units 10.00 16.00Total amplicans 519.00 1469.00Total No. of alleles 82.00 189.00Mean No. of allele per assay unit 8.20 11.81No. of polymorphic bands per assay unit 7.70 11.25Mean (%) polymorphism per assay 93.81 96.91Number of monomorphic bands per assay unit 0.50 0.56Mean PIC per assay 0.81 0.86Mean genotypic gene diversity 1.80 1.01Mean marker index (MI) 6.32 10.13Effective multiplex ratio 7.28 10.74Assay efficiency index 7.40 11.81RAPD: Random amplified polymorphic DNA, ISSR: Inter simple sequence repeats
The ISSR marker system outperformed in all markerparameters i.e., higher allele number, total amplified bands,
EMR, MI as well as PIC except the mean genotypic genediversity revealed best by the RAPD marker system.Considering these parameters, it confirmed that the ISSRtechnique is very potent to evaluate genetic diversity amongthe C. gloeosporioides isolates, also it could be highlypolymorphic and have a significant discriminative powerwhen compared to RAPD. Further, from the studies it wasobserved that ISSR primers could clearly distinguish theisolates according to their virulent nature but it was not so inRAPD. Thus, microsatellites are ideal markers for assessing thegenetic diversity of C. gloeosporioides isolates.
The present study was aimed to analyse the moleculardiversity of C. gloeosporioides isolates, causing anthracnosedisease of mango from various places of Tamil Nadu, India.Variability in terms of morphological, physiological andgenetical was important to study the biology of the pathogen
135
M 1 2 3 4 5 6 7 8 9 10 11 12 13 14 15 16 17 18 19 20 21 22 23 24 25 26 M 1 2 3 4 5 6 7 8 9 10 11 12 13 14 15 16 17 18 19 20 21 22 23 24 25 26
M 1 2 3 4 5 6 7 8 9 10 11 12 13 14 15 16 17 18 19 20 21 22 23 24 25 26
(a) (b)
(c) M 1 2 3 4 5 6 7 8 9 10 11 12 13 14 15 16 17 18 19 20 21 22 2324 25 26
(d)
(e)
M 1 2 3 4 5 6 7 8 9 10 11 12 13 14 15 16 17 18 19 20 21 22 23 24 25 26 M 1 2 3 4 5 6 7 8 9 10 11 12 13 14 15 16 17 18 19 20 21 22 23 24 25 26
(f)
Asian J. Plant Pathol., 11 (3): 130-138, 2017
in an endemic area. Hence, in this paper, RAPD primers andhighly efficient microsatellite ISSR primers are used for thegenetic diversity of C. gloeosporioides with aim of identifyingthe ideal marker.
Random amplified polymorphic DNA (RAPD): Molecularmethods have been employed successfully to differentiatebetween populations of Colletotrichum from many hosts ingeneral, according to the study of Agwanda et al.16. RandomAmplified Polymorphic DNA (RAPD) markers, in which shortoligonucleotides of random sequence are used as primers toarbitrarily amplify segments of a target genome, are usedwidely to detect genetic variation4.In this study, the suitability of RAPD technique for rapid
molecular characterization of C. gloeosporioides isolates wasassessed. Based on the results it was observed that six primers(OPB 07, OPF 14, OPF 07, OPL 05, OPD 07 and OPG 16)produced 100 per cent polymorphism with the allele range of100-2000 bp, although majority was below 1000 bp. It wasobserved that there was a variation in the number of allelesand their intensity, number of monomorphic (5) andpolymorphic bands (77), polymorphism information content(80.06), marker index (63.21) and effective multiplex ratio(72.76) among the ten RAPD primers used. The EMR wasranged from 4.17 (OPA 09) to 12.00 (OPF 14). This research wassimilar to results of Kumar et al.8, where the EMR ranged from7 (OPA07) to 12 (OPA04) in Colletotrichum falcatum isolates.Application of RAPD markers to fungal isolates would beuseful in providing information regarding polymorphismswithin the reference isolates of C. gloeosporioides andestablished DNA fingerprints which was useful for racecharacterization17.
Inter simple sequence repeat (ISSR): The ISSR primers arebased on di-, tri-, tetra- or pentanucleotide repeats with 5' or3' anchored base(s). To access the variation around the diversemicrosatellite regions, Inter Simple Sequence Repeat (ISSR)markers are powerful tools which can be utilized as moleculartools5 for the characterization of genetic variations withinfungi18. In the present study, all the 16 primers generatedamplification products of C. gloeosporioides isolates for atotal of 189 allelles, 180 of which were polymorphic with theallele range of 100-2500 bp. Out of sixteen ISSR primers, tenprimers viz., (CAG)5, (TGTC)4, (AGG)5, (TCC)5, (CAG)3, (AG)8 T,(GA)8 T, (TG)8 A, (GA)8 YG, (GT)8 YC were shown percentpolymorphism. The distribution of different microsatellitesequences in all the genomes determines the possibility ofusing this method for DNA fingerprinting. This study was inaccordance with Mahmodi et al.19 where he reported the ISSR
primers viz., UBC 808, UBC 810, UBC 820, UBC 834, UBC 841,UBC 864 and UBC112 produced 16.5 average numbers ofbands per primer which ranged in size from 300-2600 bp with100% polymorphism in Colletotrichum spp., obtained fromcowpea. Further, Kumar et al.8 reported, two ISSR markers,ISSR 02 (ACTG4) and ISSR10 (CAC5) differentiated twenty fiveC. falcatum isolates with alleles ranging from 250-3500 bpwitheight average number of bands per primer (100%polymorphism). In the current research, primer (GACA)4produced highest total number of alleles (25 alleles), totalnumber amplicons (250), effective multiplex ratio (23.04) andmarker index (22.85) revealed more heterozygosity astetranucleotide repeats are more abundant in the genomeand was thus better able to characterize the polymorphism inColletotrichum isolates. The overall eficiency of a primer canbe judged by the higher value of marker index. This study wasin accordance with the findings of Abadio et al.20. Further itproduced higher mean PIC value as 0.86 with 16 primers, itwas supported by Chadha and Gopalakrishna21, where themean PIC value was 0.27 with 17 ISSR primers in Magnaporthegrisea.
Comparison of markers: Molecular markers are useful forassessing the genetic variation rapidly within and amongspecies22. In this study, comparison of two different molecularmarker systems RAPD and ISSR was carried out to definegenetic relationships and polymorphism among the twentysix isolates of C. gloeosporioides causing mango anthracnoseand to investigate which marker system can be moreeffectively used. The foregoing study compared two markersystems by estimating discriminatory power of matrices viz.,number of total allele, allele range, per cent polymorphism,Polymorphism Information Content (PIC), Marker Index (MI),Effective Multiplex Ratio (EMR) and Assay Efficiency Index(AEI).Among the sixteen ISSR markers assessed across the
C. gloeosporioides isolates, ten markers possessed more thanten alleles indicating better resolving power of the ISSRmarkers. This is because of polyallelic nature of ISSR markers.Comparison of PIC values for two marker systems (a parameterassociated with the discriminating power of markers)indicated that the range of PIC values for RAPD primers wasfrom 0.69-0.90 with an average of 0.81 and for ISSR primers itwas from 0.66 to 0.97 with an average of 0.86. Marker Index(MI) is the marker attribute used to calculate the overall utilityof a marker system and the mean of marker index was higherin ISSR (10.13) than RAPD (6.32) markers. In this study, acomparison of the PIC values and MI between the RAPD andISSR data clearly demonstrated the stronger discriminatory
136

Asian J. Plant Pathol., 11 (3): 130-138, 2017
power of ISSR primers. Mean of effective multiplex ratio foreach of these marker systems in this study (7.28 for RAPD and10.74 for ISSR) suggested that ISSR marker systems wereeffective in determining polymorphism. It may be due tohighly polymorphic, abundant nature of the microsattelitesdue to slippage in DNA replication23. The ISSR technique hasspecific and higher levels of polymorphism with morereproducibility than RAPD technique due to the use of longeroligonucleotide sequences, allowing more stringent annealingconditions in PCR amplification24.Cluster analysis was carried out on two sets of marker
profiling data based on RAPD and ISSR. The results based onthe two DNA marker profiles broadly grouped twenty sixisolates into two clusters. However, formation of subclusterswithin the main cluster varied between RAPD and ISSR. Thesimilarity coefficients of C. gloeosporioides based on 10 RAPDmarkers and sixteen ISSR markers ranged from 65.00-88.00and 59.50-78.00%, respectively. The cluster formation wasobserved at the minimum of 59% similarity value, indicatingthe presence of considerable divergence between the isolates.The cluster analysis of the RAPD data confirmed thepresence of high diversity at molecular level among theC. gloeosporioides isolates under the study. The results ofISSR analysis demonstrated, not only high diversity amongstudied isolates but also ISSR markers can be highlypolymorphic. Comparison of the DNA profile performance of current
experiment indicated that ISSR technique was moreinformative in detecting genetic diversity in C. gloeosporioidesthan RAPD technique and it was supported byMirmajlessi et al.10 in Rhizoctonia solani. Similar results havebeen found by Mahmodi et al.19, that high level ofpolymorphism detected by ISSR-PCR technique, suitable forthe discrimination of Pseudocercospora griseola causingangular leaf spot of bean. The utility of a marker system is abalance between the level of polymorphism detected andthe extent of an assay which can identify multiplepolymorphisms25. Comparative studies in different speciesusing various marker systems were successfully conducted byother researchers and concluded that ISSR would be a bettertool than RAPD for phylogenetic studies26. While consideringall, the results of the present study clearly depicted that theISSR primer can be well adopted for the molecular variabilitystudies.
CONCLUSION
The diversity of 26 isolates of C. gloeosporioides isolateswere analyzed using the primers of RAPD and ISSR using the
molecular parameters. The valuing parameters clearly showedthat the polymorphism percentage, assay efficiency index andmarker utility was higher in ISSR primers.
SIGNIFICANCE STATEMENT
Analyzing morphological and molecular diversity of thepathogen C. gloeosporioides, causing mango anthracnosedisease is important to control the disease. Here, this studyrevealed that ISSR was the best choice to study the geneticdiversity compare to RAPD primer.
ACKNOWLEDGMENT
The authors would like to thank the University GrantsCommission (No. F.14-2 /2010/ (SA-III)), GOI, New Delhi, Indiafor providing finacial support.
REFERENCES
1. Powell, W., M. Morgante, C. Andre, M. Hanafey, J. Vogel,S. Tingey and A. Rafalski, 1996. The comparison of RFLP,RAPD, AFLP and SSR (microsatellite) markers for germplasmanalysis. Mol. Breed., 2: 225-238.
2. Russell, J.R., J.D. Fuller, M. Macaulay, B.G. Hatz, A. Jahoor,W. Powell and R. Waugh, 1997. Direct comparison of levels ofgenetic variation among barley accessions detected by RFLPs,AFLPs, SSRs and RAPDs. Theor. Applied Genet., 95: 714-722.
3. Davila, J.A., Y. Loarce, L. Ramsay, R. Waugh and E. Ferrer, 1999.Comparison of RAMP and SSR markers for the study of wildbarley genetic diversity. Hereditas, 131: 5-13.
4. Williams, J.G.K., A.R. Kubelik, K.J. Livak, J.A. Rafalski andS.V. Tingey, 1990. DNA polymorphisms amplified by arbitraryprimers are useful as genetic markers. Nucl. Acids Res.,18: 6531-6535.
5. Zietkiewicz, E., A. Rafalski and D. Labuda, 1994. Genomefingerprinting by Simple Sequence Repeat (SSR)-anchoredpolymerase chain reaction amplification. Genomics,20: 176-183.
6. Welsh, J. and M. McClelland, 1990. Fingerprinting genomesusing PCR with arbitrary primers. Nucleic Acids Res.,18: 7213-7218.
7. Milbourne, D., R. Meyer, J.E. Bradshaw, E. Baird andN. Bonar et al., 1997. Comparison of PCR-based markersystems for the analysis of genetic relationships in cultivatedpotato. Mol. Breed., 3: 127-136.
8. Kumar, N., T. Jhang and T.R. Sharma, 2011. Molecular andpathological characterization of Colletotrichum falcatuminfecting subtropical Indian sugarcane. J. Phytopathol.,159: 260-267.
137

Asian J. Plant Pathol., 11 (3): 130-138, 2017
9. Tymon, A.M. and J.K. Pell, 2005. ISSR, ERIC andRAPD techniques to detect genetic diversity in theaphid pathogen Pandora neoaphidis. Mycol. Res.,109: 285-293.
10. Mirmajlessi, S.M., N. Safaie, H.A. Mostafavi, M. Mansouripourand S.B. Mahmoudy, 2012. Genetic diversity among crownand root rot isolates of Rhizoctonia solani isolated fromcucurbits using PCR based techniques. Afr. J. Agric. Res.,7: 583-590.
11. Archana, S., K. Prabakar and T. Raguchander, 2014. VirulenceVariation of Colletotrichum gloeosporioides (Penz.) Penz.and evaluation of varietal susceptibility against mangoanthracnose. Trends Biosci., 7: 415-421.
12. Knapp, J.E. and J.M. Chandlee, 1996. RNA/DNA mini-prepfrom a single sample of orchid tissue. Biotechniques,21: 54-56.
13. Anderson, J.A., G.A. Churchill, J.E. Autrique, S.D. Tanksley andM.E. Sorrells, 1993. Optimizing parental selection for geneticlinkage maps. Genome, 36: 181-186.
14. Mariette, S., V.L. Corre, F. Austerlitz and A. Kremer, 2002.Sampling within the genome for measuring withinpopulation diversity: Trade offs between markers. Mol. Ecol.,11: 1145-1156.
15. Rohlf, F.J., 1990. NTSYS-pc Numerical Taxonomy andMultivariate Analysis System. 1st Edn., Exeter Publishers,New York.
16. Agwanda, C.O, P. Lashermes, P. Trouslot, M.C. Combes andA. Charrier, 1997. Identification of RAPD markers for resistanceto coffee berry disease, Colletotrichum kahawae, in Arabicacoffee. Euphytica, 97: 241-248.
17. Weeds, P.L., S. Chakraborty, C.D. Fernandes, M.J.D.A. Charchar,C.R. Ramesh, Y. Kexian and S. Kelemu, 2003. Genetic diversityin Colletotrichum gloeosporioides from Stylosanthes spp.at centers of origin and utilization. Phytopathology,93: 176-185.
18. Lu, G., P.F. Cannon, A. Reid and C.M. Simmons, 2004. Diversityand molecular relationships of endophytic Colletotrichumisolates from the Iwokrama forest reserve, Guyana. Mycol.Res., 108: 53-63.
19. Mahmodi, F., J.B. Kadir, A. Puteh, S.S. Pourdad, A. Nasehi andN. Soleimani, 2014. Genetic diversity and differentiation ofColletotrichum spp. isolates associated with Leguminosaeusing multigene loci, RAPD and ISSR. Plant Pathol. J.,30: 10-24.
20. Abadio, A.K.R., S.S. Lima, M.F. Santana, T.M.F. Salomao andA. Sartorato et al., 2012. Genetic diversity analysis of isolatesof the fungal bean pathogen Pseudocercospora griseolafrom central and southern Brazil. Genet. Mol. Res.,11: 1272-1279.
21. Chadha, S. and T. Gopalakrishna, 2007. Comparativeassessment of REMAP and ISSR marker assays for geneticpolymorphism studies in Magnaporthe grisea. Curr. Sci.,93: 688-692.
22. Chakravarthi, B.K. and R. Naravaneni, 2006. SSR marker basedDNA fingerprinting and diversity study in rice (Oryza sativa L.). Afr. J. Biotechnol., 5: 684-688.
23. Seehalak, W., N. Tomooka, A. Waranyuwat, P. Thipyapong,P. Laosuwan, A. Kaga and D.A. Vaughan, 2006. Geneticdiversity of the Vigna germplasm from Thailand and neighboring regions revealed by AFLP analysis.Genet. Resour. Crop Evol., 53: 1043-1059.
24. Reddy, M.P., N. Sarla and E.A. Siddiq, 2002. Inter simplesequence repeat (ISSR) polymorphism and its application inplant breeding. Euphytica, 128: 9-17.
25. Sharma, P.N., M. Kaur, O.P. Sharma, P. Sharma and A. Pathania,2005. Morphological, pathological and molecular variabilityin Colletotrichum capsici, the cause of fruit rot of chilliesin the subtropical region of North-Western India.J. Phytopathol., 153: 232-237.
26. Ajibade, S.R., N.F. Weeden and S.M. Chite, 2000. Inter simplesequence repeat analysis of genetic relationships in thegenus Vigna. Euphytica, 111: 47-55.
138