communications in soil science - usda ars · communications in soil science and plant analysis...
TRANSCRIPT
~
.;Jr
communications in
soil scienceand
...
Communications in Soil Science and Plant Analysis
Communications in Soil Science and Plant Analysis presentscurrent and important papers, symposia, and reviews in all areas ofcrop production, devoting particular attention to the mineral con-tent of soils and plants and plant nutrition. This unique publica-tion fully examines soil chemistry, minerology, fertility, soil testing,soil-crop nutrition, plant analysis, mineral metabolism and plantphysiology, methods of soil and plant analysis, liming and fertili-zation of soils, and techniques for correcting deficiencies. Interna-tional in scope and application, the journal considers plants andsoils of aU climates, including subtropical and tropical. In addition,its direct reproduction format permits rapid publication of impor-tant developments, keeping readers abreast on research at the fron-tiers of their field.
Whether engaged in basic or applied investigations or in com-municating techniques and information directly to growers,Communications in Soil Science and Plant Analysis provides an ex-cellent source and forum for agronomists, horticulturalists, tlori-culturalists, and foresters concerned with increasing crop yields.
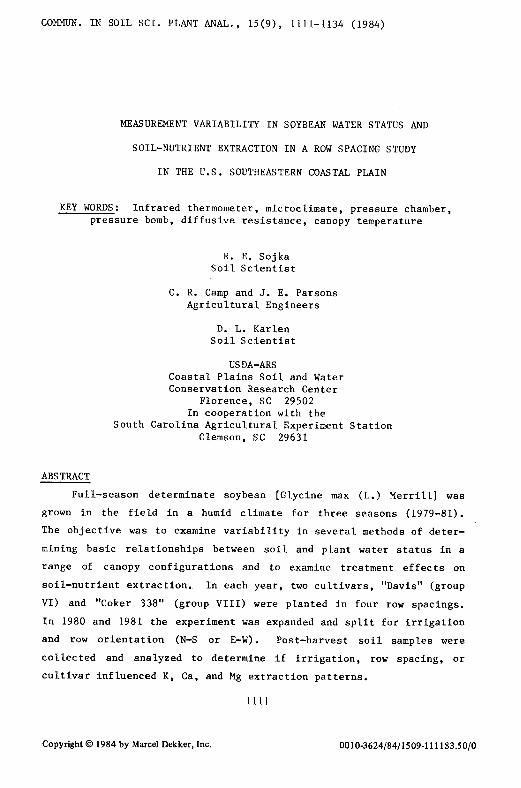
1112 SOJKA ET AL.
During the growing seasons, parallel leaf diffusive resistance
(R ) was poorly correlated with xylem pressure potential (~), canopys x
temperature (T ), canopy minus air temperature (~T), leaf vapor pres-c
sure deficit (LVPD) , and atmospheric vapor pressure deficit (VPD) in
single factor correlations. Xylem pressure potential was highly
correlated with T , ftr, VPD, and LVPD, but was poorly correlated withc
soil water potential. Both ~ and T were significantly affected byx c
the imposition of shade from a 60% shading cloth within as little as 1
minute of shade imposition. The impact of cultivar on seasonal ~ wasx
significant and was nearly half the magnitude of the observed dif-
ference caused by irrigation. Irrigation raised ~ by only 2.2 barsx
over the two-year observation period, in spite of large differences in
soil water potential when irrigation was imposed. The impact of
canopy configuration was not measureable in any water relations
parameter except infrared-determined T. Correlation of T andc c
~ was significantly more reliable when limited to a single variety,xrow spacing, and row orientation. Aspect of infrared temperature
measurement also significantly affected observed T .c
Analysis of post-harvest soil samples indicated that narrow (50
cm) row spacing in 1980 and irrigation in 1981 significantly decreased
post-harvest Mehlich No. I extractable K, but none of the cultural
practices influenced extractable Ca or Mg at P(0.05). In 1980, ex-
tractable K within soybean rows was significantly greater than between
rows. Similar trends were observed for Ca and Mg in 1980 and for all
3 nutrients in 1981, but those differences were not significant at
P(0.05). Overall, these measurements quantify the difficulty in
relating soil and plant water status and identifying nutrient extrac-
tion patterns in sandy soils within the humid U.S. Southeastern
Coastal Plain.
INTRODUCTION
Crop water status and nutient management in the Southeastern
Coastal Plain are greatly affected by numerous factors. Water-holding
capacity of the major soils is commonly lO-iS cm or less of available
36 39soil water per meter of profile' .Soil cation exchange capacity
is usually below S meq/lOO g of soil. Rainfall, though frequently
intense, is generally intermittent, often resulting in frequent cycles
MEASUREMENT VARIABILITY IN SOYBEAN WATER STATUS 1113
of drought and flooding. Wet periods can readily leach the weakly
adsorbed cations. Growing season mean daily relative humidity is
generally high and is accompanied by a nearly total absence of cloud-
less days. Various measurements have been used to assess the impact
of irrigation or other cultural or environmental factors on the result-
ing water status of crops.
In recent years, three commonly reported measurements of plant
water status have included measurements of: (1) leaf diffusive re-
sistance (R) using diffusion porometers, (2) xylem pressure potentials
(~ ) using pressure chambers or plant water potential (~ ) usingx p
psychrometers, and (3) canopy temperature (T) using thermistors,c
thermocouples, or noncontact infrared thermometers. These techniques
have been developed in predominantly dry environments, and only
limited data have been reported for field results with determinate
soybean grown under humid conditions. Only limited work has been
undertaken to identify the sources and quantify the magnitude of error
associated with these techniques when employed in the field under
humid conditions such as those which prevail in the U.S. Southeastern
Coastal Plain and other humid soybean production areas worldwide.
The relative insensitivity of these techniques in discriminating
large differences in field water regime in determinate soybean has45
proven puzzling to researchers. Reicosky and Deaton reported obser-
vational anomalies in ~ of irrigated 'Davis' and 'McNair 800' soybeanx
associated with transient cloudiness during a typical diurnal study.
There was no response, however, in the nonirrigated Davis and only
partial response in nonirrigated McNair 800. In addition, even though
the midday T of the nonirrigated Davis was 7 C higher than the irri-c
gated, ~ was not appreciably different between the irrigation regimesx 53
for either variety. Sojka et al. showed that except for a small
rise in ~ shortly after irrigation, 'Lee 74' soybean quickly reachedx
~ levels similar to their nonirrigated counterparts. A similarx 29
response was observed by Jung and Scott for 'Forrest' soybean. Mean
seasonal midday leaf diffusive resistance in Jung and Scott's study-1 -1
were 0.6 sec cm and 2.7 sec cm for irrigated and nonirrigated
treatments, respectively. They found that irrigation had only a
small effect on ~ as well. Mean seasonal predawn ~ was -4.2 andx x
-5.2 bars and midday values were -11.6 and -12.9 bars for irrigated
SOJKA ET AL
and nonirrigated treatments in each case, respectively. These dif-
ferences are quite small in view of the large differences in soil
water availability among treatments. In general, field determinations
of R have seldom been cited for determinate soybean, particularlys
from humid environments.
In the southern U.S., aeration problems frequently arise with
excess rainfall or unwanted rain following irrigation, or with fluct-7 8 21 31uating shallow water tables" , .Greenhouse data recently col-
lected for Lee soybean48 indicate that R increases i.n response to lows
soil °2 diffusion rates even in the presence of optimum soil water
regimes. The same response has been documented for numerous other43474034 1650species' , , , , .Therefore, new concern must be expressed
regarding interpretation of this traditional water-deficit related
physiological indicator.
Since mean daily relative humidity (RH) in the Southeastern
Coastal Plain is high during the growing season, often above 80%, it
is conceivable that R may be more difficult to assess under fields
conditions where large vapor pressure deficits (VPD) are less
49common. A better understanding of the impact of high humidity (low
VPD) on other water status indicators could help assess the applica-
bility of various meteorologically-based evapotranspiration models as
they relate to irrigation scheduling in the Coastal Plain.27 13Jackson et al. and Ehrler et al. have demonstrated signifi-
cant correlations between T and f and have proposed using liT (Tc x c
minus ambient temperature, TA) integrated over time as an indicator of
crop stress levels. While they have recently described methods for
normalizing data from diverse experimental and environmental condi-24 25 26tions ' , , the impact of some simpler considerations on these
relationships, such as canopy configuration or measurement aspect,
have not yet been thoroughly investigated. The impact of haziness and
intermittent cloudiness on the individual measurements and their
23interrelationships were analyzed theoretically, and a few shaded
baselines reported22, but extensive validation in field-grown crops
has not been reported. A thorough evaluation of IR techniques has yet
to emerge from humid locations. The latter point is especially impor-35 15tant since Linacre and Geiser et al. suggest that the relationship
of liT to VPD under well-watered conditions is not unique across envir-
MEASUREMENT VARIABILITY IN SOYBEAN WATER STATUS 1115
onments, but is affected by both RH and radiation intensity. Such an
effect could have a significant impact on the stress evaluation method24 25 26proposed by Idso et al. ' and Jackson et al. .
Despite these unknowns, there is already great interest in the
use of the IR thermometer and the stress degree-day concept for con-
sultant and on-farm use in the Southeast. Canopy configuration,
transmissivity of the atmosphere (and thus radiation flux density at
the leaf), RH, or aspect of measurement may influence either the
observed values of 'i' , T , I:.T or the relationships of these factors tox c
one another. Therefore, substantial error may result in accurately
determining and integrating stress levels in the absence of simple,
yet appropriate precautions.
Soil and plant water status ultimately influences nutrient ex-
traction, absorption, and accumulation because of its effect on plant12
growth. DeMooy stated that nutrient accumulation by soybean was
proportional to the length of effective drought during a growing
season and the portion of the root system located in water-depleted
soil. Cation absorption is especially responsive to soil-water status
because K is dependent upon diffusion and Ca and Mg are dependent upon
mass flow for movement to soybean roots37. Uptake patterns for these30
cations showed different responses to water stress presumably
because those movement mechanisms differed. Uptake of K was much more30
responsive to soil water status and has also been shown to be in-41
fluenced by soybean root morphology. However, information showing
that field cultural practices which influence plant water status also
influence post-harvest extractable nutrient concentrations is not
readily evident within the literature.
It was with concern for these kinds of limitations that data were
collected and evaluated from three years of soybean water relations
studies conducted at Florence, South Carolina. Numerous observations
of 'i', R , T , I:.T, and VPD were recorded and related to one anotherx s c
under a variety of soybean conditions. The impact of those cultural
management practices on the observations and on the relationship of
the parameters to one another are presented and discussed. Post-
harvest extractable nutrient concentrations are also related to the
cultural management practices because of the influence that wat~r
status has on plant growth, development, and nutrient uptake in this
physiographic region.
SOJKA ET AL.
MATERIAlS AND METHODS
Soybean were grown from 1979 to 1981 at the Coastal Plains Soil
and Water Conservation Research Center in Florence, S. C. Determinate
cultivars, 'Davis' (group VI) and 'Coker 338' (group VIII), were
planted in a randomized complete block design with a split-block
arrangement of treatments in four replicates on 1 May 1979. Four row
spacings (102, 76, 51, and 36 cm) were used, with row spacing whole
plots split for cultivar. Each cultivar subplot was 10.7 m long and 4
rows wide, except in the 36-cm row spacing, which had 5 rows per
subplot. Rows were aligned in a NE-SW direction. The soil, a Norfolk
loamy sand (fine-loamy siliceous thermic Typic Paleudults), was fal-
lowed the previous year and prepared in the spring with cross-
subsoiling to 45-cm depth and disking twice before planting. Fertili-
zer applied was 5-10-30 at 225 kg/ha. Weed control was achieved by
pre-plant incorporation of trifluralin (~, ~, ~,-trifluoro-2,6-dinitro
-!,!-dipropyl-~-toluidine) at 1.75 l/ha and timely cultivation and/or
hand weeding. Plant population was 204,000 plants/ha. Soil matric
potential (~) was monitored with tensiometers in the row at 30-, 60-,s
and 90-cm depths which were read and serviced 2-3 times weekly.
In 1980, the experiment was expanded to include additional splits
of row orientation (N-S and E-W) and irrigation. Plots were subsoiled
and disked as in 1979 and were fertilized with 0-9-27 at the rate of
246 kg/ha. Weed control was the same as in 1979. Planting was on 7
May 1980, and population was 213,000 plants/ha. Tensiometers in 1980
were located in all Davis plots only, at 30-, 60-, 90-, and 120-cm
depths both in the row and midway between the rows and were serviced
and read 2-3 times weekly. Irrigation was initiated at bloom (1
August) and was accomplished by use of bi-wall drip tubing between
plant rows at 36-cm spacing throughout the experiment. When operated
at 0.69 to 0.83 bar pressure, water was uniformly "sprinkled" on the
ground surface in a pattern approximately 50-cm wide (25 cm to each
side of the drip line) giving a uniform distribution of water in the
irrigated plots. In 1980 the plots were irrigated whenever the 30-cm
tensiometers read 250 mb or whenever tensiometers at any depth read
500 mb. In 1981 irrigation was scheduled by a computerized water
balance, but soil water tensions were not allowed to exceed 500 mb at
any soil depth.
MEASUREMENT VARIABILITY IN SOYBEAN WATER STATUS
In 1981, experimental design was similar to that used in 1980.
The 36-cm row spacing was deleted and drip tubing was moved to 50-cm
spacing in the irrigated plots. Tillage was as in previous years.
Fertilizer applied was 0-20-20 at 280 kg/ha. Weed control was with
trifluralin at 1.75 l/ha, tank-mixed with metribuzin [4-Amino-6-(l,
1-dimethylethyl)-3 -(methylthio)-l,2,4-triazin-5(4~)-one] at the rate
of 0.68 l/ha. Planting was on 12 May 1981. Plant population was
192,000 plants/ha. Tensiometer placement was as in the previous year,
but in both cultivars in 1981.
Meteorological data were monitored automatically all three years49with a computer-based data aquisition system. Data were integrated
over 30-min periods and printed at 30-min intervals. The weather
station was located on turf approximately 100 m from the experimental
site.
Canopy temperatures were measured in 1979 using thermistors taped
to the abaxial mid-vein of the center leaflet of the most recently-
matured trifoliate leaf not directly exposed to sunlight. In 1980 and
1981, canopy temperatures were measured using a Raynger II IR ther-1
mometer. Temperatures by the IR thermometer were determined on
cloudfree days or portions of days. Caution was exercised to bring
the instrument into equilibrium with TA before measuring Tc' An
emissivity of 1.00 was used for all readings. The instrument was
aimed at shallow angles and care was exercised to prevent inclusion of
soil or other non-plant material in the instrument viewing field.
Xylem pressure potential (W) was measured using a specially-xbuilt pressure chamber apparatus which allowed rapid sample changing
and minimum tissue distortion at the point of sealing. Standard
sampling involved selecting the uppermost, fully-expanded, fully
sun-exposed mainstem trifoliate for pressurization. Petioles support-
ing the trifoliates were excised with a razor blade approximately 2 cm
above their point of attachment to the mainstem. Samples were immedi-
ately placed in moistened plastic bags upon excision from the mainstem
for transport from the individual plots to the pressure chamber. A
standard pressurization rate of approximately 13.8 bars/min was used,
and total time from excision to determination of end point seldom
exceeded 2 min/sample.
Diffusive resistances of abaxial and adaxial leaf surfaces (Rab
and Rad' respectively) were determined on the first and third leaf
1118 SOJKA ET AL.
49blades of each trifoliate, monitoring one surface per leaf blade.
Parallel leaf diffusive resistance (R ) was calculated for each tri-s
foliate using the equation:
I/R = (I/R b) + (I/R d ) [1]s a aLeaf diffusive resistances were determined on the same trifoliates
subsequently excised for determination of ~. The R determinationsx s
were made only in 1979.
To quantify the effect of fluctuating illumination on ~ andx
infrared measurements of T , both ~ and infrared determined T werec x c
measured on side-by-side plants before and after the imposition of
shade on the canopy. The shading effect was created by positioning
one of two 1.5 m x 1.5 m square shades in the canopy at right angles
to the incoming rays of the sun. One shade was fully opaque (full
shade); the second shade was made of a single thickness of commercial
greenhouse 60% shade cloth (half-shade). Shade effects on response of
the two cultivars were determined on different days for each cultivar.
Effects of cultural practices on post-harvest extractable K, Ca,
and Mg concentrations were measured in 1980 and 1981. Soil samples
were collected from within and between soybean rows which were spaced
50 or 100 cm apart in the N-S-oriented blocks in December of each
year. Samples from 0-15-, 15-30-, 30-60-, and 60-90-cm depths were
air dried, crushed to pass a 2 mm screen, extracted with Mehlich I
solution, and analyzed for K, Ca, and Mg concentrations using atomic
absorption spectrophotometry. Data were analyzed statistically using
analysis of variance for a split, split, split, split plot design.
RESULTS AND DISCUSSION
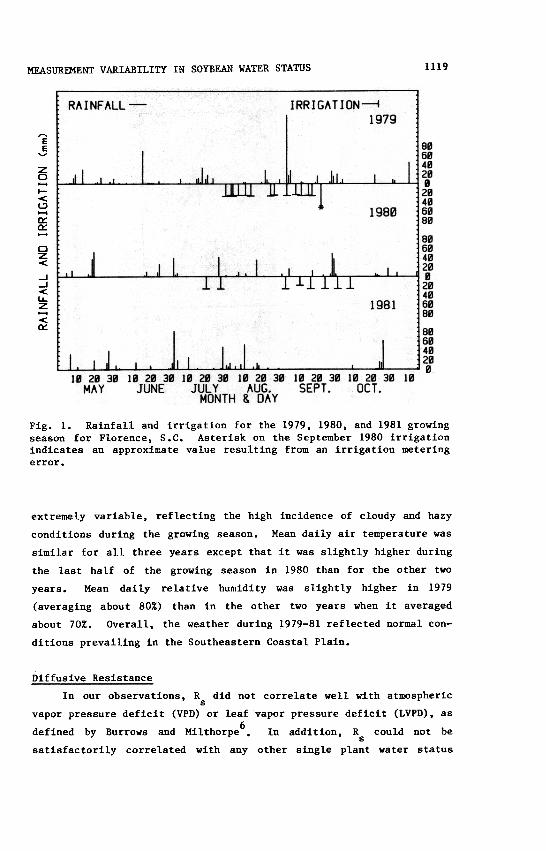
Rainfall and irrigation for 1979, 1980, and 1981 are presented in
Fig. 1. Rainfall during the growing season was 679, 461, and 453 mm,
respectively, for 1979, 1980, and 1981. In addition, 355 and 220 mm
of irrigation water was applied in 1980 and 1981, respectively, the
two years when an irrigation treatment was included in the experiment.
Abnormally high rainfall in 1979 was primarily caused by a hurricane
in September which produced 169 mm of rainfall in one event. Incoming
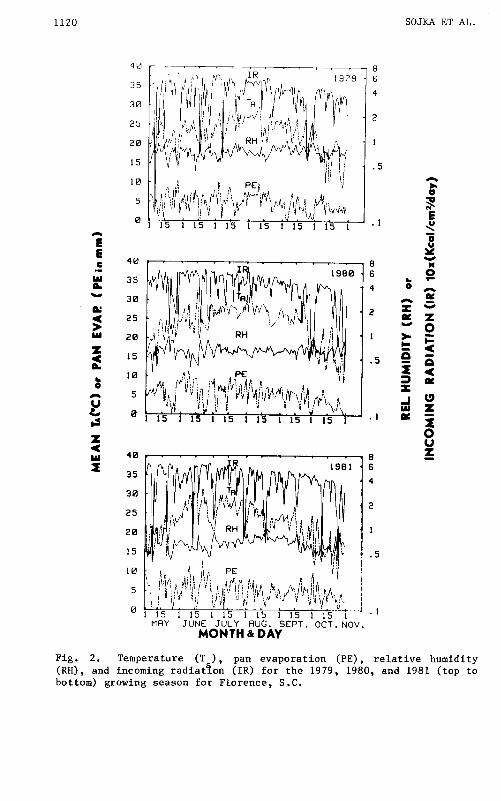
radiation, humidity, air temperature, and pan evaporation for 1979,
1980, and 1981 are presented in Fig. 2. Daily incoming radiation and
pan evaporation were similar for the three years of the study, but
1119MEASUREMENT VARIABILITY IN SOYBEAN WATER STATUS
EE'-'
ZaI-<l.:)
Q:Q:
az<
-.J-.J<lL.Z
<Q:
Fig. 1. Rainfall and irrigation for the 1979, 1980, and 1981 growingseason for Florence, S.C. Asterisk on the September 1980 irrigationindicates an approximate value resulting from an irrigation meteringerror.
extremely variable, reflecting the high incidence of cloudy and hazy
conditions during the growing season. Mean daily air temperature was
similar for all three years except that it was slightly higher during
the last half of the growing season in 1980 than for the other twoyears.
Mean daily relative humidity was slightly higher in 1979
(averaging about 80%) than in the other two years when it averaged
about 70%. Overall, the weather during 1979-81 reflected normal con-
ditions prevailing in the Southeastern Coastal Plain.
Diffusive Resistance
In our observations, R did not correlate well with atmospherics
vapor pressure deficit (VPD) or leaf vapor pressure deficit (LVPD), as6
defined by Burrows and Milthorpe. In addition, R could not bes
satisfactorily correlated with any other single plant water status
MEASUREMENT VARIABILITY IN SOYBEAN WATER STATUS 1121
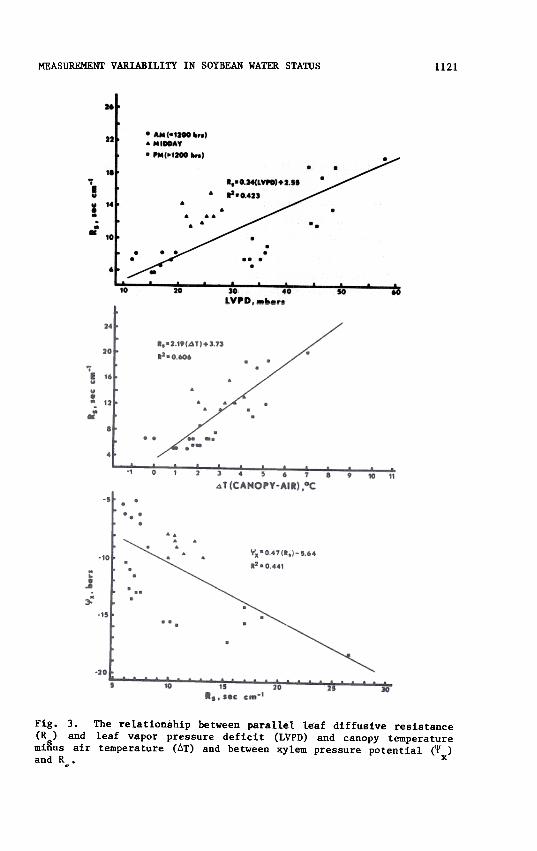
Fig. 3. The relationship between parallel leaf diffusive resistance(R) and leaf vapor pressure deficit (LVPD) and canopy temperature
miHus air temperature (LIT) and between xylem pressure potential ('¥ )xand R~.
SOJKA ET AL1122
indicator (Fig. 3) or with ~. Successful correlation of R withs s
other factors in the environment has not been widely reported for5
field observations with soybean. Brady et al. fit curves to rela-
tionships of R with soil water potential and potential evapotrans-s
piration, but reported low R2 values for the relationships (all below0.4).
46In a later study, Sivakumar and Shaw reported high correlation
of stomatal conductance with ~ and relative growth rate using datas
from a drying episode in mid-summer. But for this correlation to be
meaningful as a diagnostic parameter, the relationship must remain
good even in a fluctuating environment, particularly for physiographic
regions where environmental fluctuations are the norm rather than the
18exception. Hatfield and Carlson presented data which showed that R
sremained almost unchanged as photosynthetic photon flux density varied
-2 -1 9from 25 to 200 NE cm sec. In another paper, Carlson et al.
pr'esented several sets of data relating leaf conductance to leaf water
potentials, none of which resulted in satisfactory R2 values when
considering the two factors alone. Turner and Begg57 point out that
stomatal closure is also affected by species, preconditioning, and
humidity.
Substantial scatter has been reported for field observations of
R in a number of S p ecies for various reasons58,51,52,28,54,32,33s .Various problems relative to porometer performance, and design, and to
application of theory have been investigated4,17,2,3,10. Raschke42
reported stomatal closure does not occur gradually in response to
stress, but rather occurs abruptly upon reaching a stress threshold.
55 57Similar conclusions were drawn by Stange et al. , Turner and Begg ,
60and Zur et al. .
In addition, various nonwater-stress related stomatal stimuli
(e.g. light intensity, plant growth regulating chemicals, soil 02'
etc.) interfere with and complicate interpretation of R. O'Toole and38 s
Chang concluded unequivocally that measurement of R in the fieldswas subject to too much intrinsic variability and artifactual con-
founding to be a useful stress indicator in their rice program. It
would seem that in view of the difficulty in relating R to others
water status indicators reported in field exp~riments that R , at11
best, should be measured and interpreted with great caution with
MEASUREMENT VARIABILITY IN SOYBEAN WATER STATUS 1123
reference to water stress in humid environments. This is particularly
true where numerical values of R are used outside the limited compa-s
rative context of the individual experiments from which they were
derived.
Xylem Pressure Potential
In this study ~ was poorly correlated with soil matric potentialx
(~) for the pooled irrigated and nonirrigated data, which representeds
a ~ range of from nearly 0 to-800 mbars. Regression analysis wass
performed separately for the two varieties and the two years, 1980 and
1981. Correlation of individual'!' values with the mean ~ of thex s
30-and 60-cm depths for the row and row-middle tensiometer locations
was attempted. Results were similar for all cases, with R2 values44
ranging from 0.18 to 0.20. Reicosky et al. , while working on the
same soil with corn under similar environmental conditions, also
suggested that ~ was a poor indicator of plant water stress. Theyx
found that with corn R was more sensitive than ~ to changes in ~ .s 19 x s
In a greenhouse soybean study, Heatherly et al. found a high corre-
lation of '!' with pre-sunrise'!' when data were analyzed for single,x s
dry-down periods. As with R , correlation of '!' with ~ can only bes x s
truly useful if it can be generalized over a prolonged time period in
a fluctuating environment.
Xylem pressure potential (~ ) was highly correlated with T , ~T,x c
and VPD with R2 values of 0.84, 0.67, and 0.90 for the three rela-
49tionships, cespectively, in 1979 .The ~ values used to compilex
these correlations were taken from a highly restrictive set of envir-
onmental conditions which limited observation to unusually clear days
or portions of days. Additional observations of ~ made in 1980 andx
1981, however, indicate that ~ measurements can be subject to signif-x
icant errors due to factors in the field environment which are dif-
ficult to control and are often overlooked when making large numbers
of observations on a routine basis. One such factor is the obstruc-
tion of sunlight by haziness or the occurrence of transient cloudiness
To estimate the possible magnitude of such errors, '!' was determinedx
for side-by-side plants before and after the imposition of shade on
the canopy. The effect of shade imposition for 0-, 1-, and S-min
durations on observed ~ is presented in Table 1. As little as onex
124 SOJKA ET AL.
TABLE
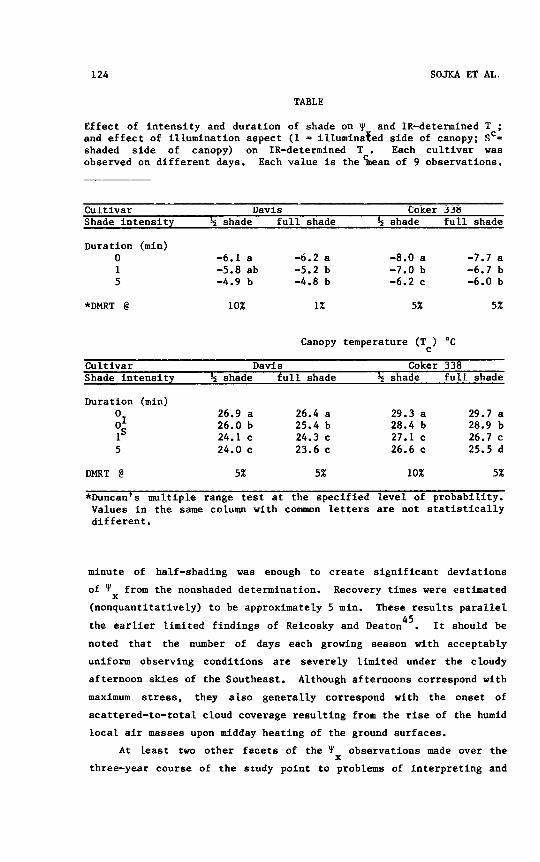
Effect of intensity and duration of shade on ~ and 1R-determined T ;and effect of illumination aspect (I = illuminafed side of canopy; Sc=
shaded side of canopy) on 1R-determined T. Each cu.ltivar wasc
observed on different days. Each value is the mean of 9 observations.
Cultivar Davis Coker 338Shade intensity ~ shade full shade ~ shade full shade
Duration (min)0 -6.1 a -6.2 a -8.0 a -7.7 a1 -5.8 ab -5.2 b -7.0 b -6.7 b5 -4.9 b -4.8 b -6.2 c -6.0 b
5%*DMRT @ 10% 1% 5%
Canopy temperature (T ) .Cc
Cultivar Davis Coker 338Shade intensity ~ shade full shade ~ shade full shade
Duration (min)Or 26.9 a 26.4 a 29.3 a 29.7 aOs 26.0 b 25.4 b 28.4 b 28.9 b1 24.1 c 24.3 c 27.1 c 26.7 c5 24.0 c 23.6 c 26.6 c 25.5 d
DMRT @ 5% 5% 10% 5%
*Duncan's multiple range test at the specified level of probability.Values in the same column with common letters are not statisticallydifferent.
minute of half-shading was enough to create significant deviations
of ~ from the nonshaded determination. Recovery times were estimatedx
(nonquantitatively) to be approximately 5 min. These results parallel45the earlier limited findings of Reicosky and Deaton. It should be
noted that the number of days each growing season with acceptably
uniform observing conditions are severely limited under the cloudy
afternoon skies of the Southeast. Although afternoons correspond with
maximum stress, they also generally correspond with the onset of
scattered-to-total cloud coverage resulting from the rise of the humid
local air masses upon midday heating of the ground surfaces.
At least two other facets of the 'I' observations made over thex
three-year course of the study point to problems of interpreting and
MEASUREMENT VARIABILITY IN SOYBEAN WATER STATUS 1125
utilizing ~ measurements in determinate soybean. The overall meanx
seasonal ~ for irrigated and nonirrigated plots were -8.6 and -10.8x
bars, respectively, averaged over the two years of the irrigation
split. This small (2.2 bar) ~ difference points to poor resolutionx
of water deficits, particularly in view of the severity of the drought
in 1980. In addition, the resolution of actual water deficit is worse
than immediately apparent from the 2.2 bar difference, since pressure
chamber observations were not made shortly after rainfall, but were,
in fact, delayed until higher stresses could be expected in the non-
irrigated treatment, as reflected by 0/ monitoring.s
Various explanations have been offered to explain the poor reso-
lution of plant water status indicators in the face of dramatic
29differences in soil water regimes among treatments. Jung and Scott
proposed that stomatal closure under water stress reduced water loss
rates sufficiently to maintain relatively high ~ even in the face ofx
severely limiting soil water regimes in soybean. The mean seasonal R-1 s
of 2.7 s cm of nonirrigated soybean reported in their work, however,
is quite low, raising some question as to the degree to which it could60limit transpiration. Zur et al. ,for example, showed that in soy-
bean R had a narrow range (from slightly less than one to nearly 4 s-1 s
cm over a ~ range of -10 to -18 bars; only at the -18-bar stressp
level was significant stomatal closure apparent from R measurements.20 11 56 14 s
Several researchers' " have shown that as transpirational
demand increases, plants experience a reduction in root diameter in
response to the increased xylem tension. This can occur at relatively
high ~ , bringing about reduction in root to soil water-film contact,s
and, they proposed, lower ~ due to the increased resistance to waterxentry into the root. Such a response would cause well-watered plants
to have lower ~ than otherwise expected. Furthermore, the effect ofxreduced root diameter on well-irrigated roots would be much more
pronounced than an equal loss of diameter in dry soil since once the
soil is dry, very little root-to-water film contact remains. The net
result would be to impair the resolution of irrigation treatment
differences.
Up to this point, our discussion of results has pooled the obser-
vations for the two cultivars used. However, each year, the cultivar
'Coker 338' produced a signficantly lower ~. The mean seasonal ~ ofx x
1126 SOJKA ET AL
the cultivars 'Davis' and 'Coker 338' for the three-year period were
-10.9 and -12.0 bars, respectively. This is particularly disturbing
when one recognizes that the magnitude of cultivar differences in '¥x
is half the magnitude of irrigation induced differences in'¥. Sojka49 x
and Parsons also reported that Coker 338 had a lower osmotic poten-
tial than Davis.
Canopy Temperature
Factors found to influence ~ also generally affected T asx c
determined with the IR thermometer. In addition, canopy geometry and
aspect of IR temperature determination were found to contribute to
error as well. Table 1 shows that as with ~ ,T is rapidly affectedx c
by shading. Leaf temperatures decline rapidly even upon imposition of
only half-shade. In addition to shading, it was found that aspect of
the measurement, -i.e. aiming the thermometer at the illuminated side
of the canopy (sun at one's back) vs. aiming at the shaded side of the
canopy (sun at one's face), had a significant effect upon the tempera-
ture determination. In these comparisons, ~T was not calculated
because sensible heat of the atmosphere remained stable over the brief
period of observation, and thus, any change in ~T would be governed by
the magnitude and direction of change in T .c
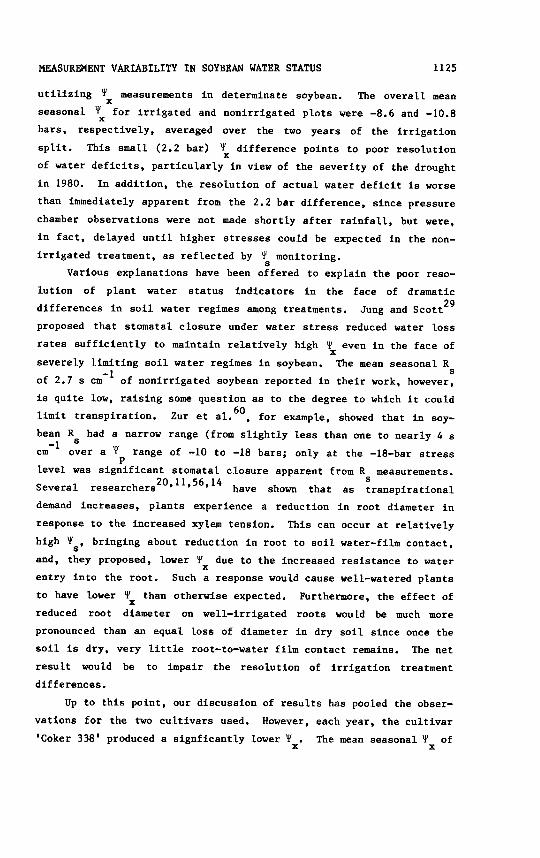
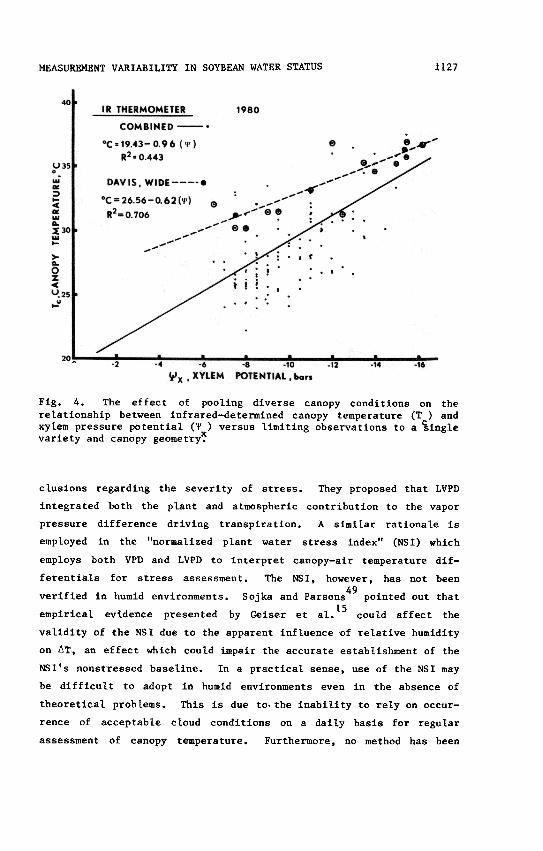
As Fig. 4 demonstrates, the relationship between IR-determined Tc
and ~ is best defined over a limited range of canopy geometry. Whenx
combining all data pairs for the 1980 season, a poor R2 value of 0.44
was obtained. By singling out a limited set of conditions (such as
the 'Davis' cultivar at 102-cm row spacing), the relationship was sub-
stantially improved, giving an R2 of 0.71. Similar results were also
observed in 1981.
Vapor Pressure
Both VPD and LVPD are highly active in bringing about plant water6 19 59 60. 49status responses' , , .SoJka and Parsons found that VPD and
LVPD gave the highest correlations with any other single indicator of
plant water status. They concluded for this reason that VPD and LVPD
were the best parameters for characterizing plant water status in
humid environments. Burrows and Milthorpe6 cautioned that characteri-
zation of crop water status from VPD could result in misleading con-
MEASUREMENT VARIABILITY IN SOYBEAN WATER STATUS 1127
Fig. 4. The effect of pooling diverse canopy conditions on therelationship between infrared-determined canopy temperature (T) andxylem pressure potential ('f) versus limiting observations to a ~inglevariety and canopy geometry~
clusions regarding the severity of stress. They proposed that LVPD
integrated both the plant and atmospheric contribution to the vapor
pressure difference driving transpiration. A similar rationale is
employed in the "normalized plant water stress index" (NSI) which
employs both VPD and LVPD to interpret canopy-air temperature dif-
ferentials for stress assessment. The NSI, however, has not been
verified in humid environments. Sojka and parsons49 pointed out that1 i 15
empiriea ev dence presented by Geiser et al. could affect the
validity of the NSI due to the apparent influence of relative humidity
on ~T. an effect which could impair the accurate establishment of the
NSI's nonstressed baseline. In a practical sense, use of the NSI may
be difficult to adopt in humid environments even in the absence of
theoretical problems. This is due to. the inability to rely on occur-
rence of acceptable cloud conditions on a daily basis for regular
assessment of canopy temperature. Furthermore, no method has been

1128 SOJKA ET At.
70
1979
Soybean 060
§
D
DC
50
..c 40E
0a..>30.J
8g20
0
~o0010
BB 5 Ie 20 2S 3015
VPD mb
Fig. 5. The relationship between leaf vapor pressure deficit (LVPD)and vapor pressure deficit (VPD) for three time periods: circles
(0800-1200 hr), squares (1200-1300 hr), and triangles (1400-1800 hr).
devised to cope with the influence of sensible heat in row crops with
incomplete canopy coverage.
In this study, VPD and LVPD were highly correlated (Fig. 5) with
LVPD being approximately double the value of VPD. Determination of
LVPD ultimately has the same practical limitations as the NSI since
both rely on accurate assessment of 8£. If a simple relationship
exists between VPD and LVPD, however, it~is conceivable that VPD alone
could serve as a reliable indicator of stress.
Nutrient Extraction Patterns
Chemical analysis of post-harvest soil samples showed lower
average extractable K concentrations (39 vs. 45 mg/kg in 1980, and 44
vs. 50 mg/kg in 1981) in narrow (51 cm) compared to wide (102 cm) row
soybean, but this difference was significant at P(0.05) only in 1980.
Irrigation significantly reduced average profile K concentrations from
1129MEASUREMENT VARIABILITY IN SOYBEAN WATER STATUS
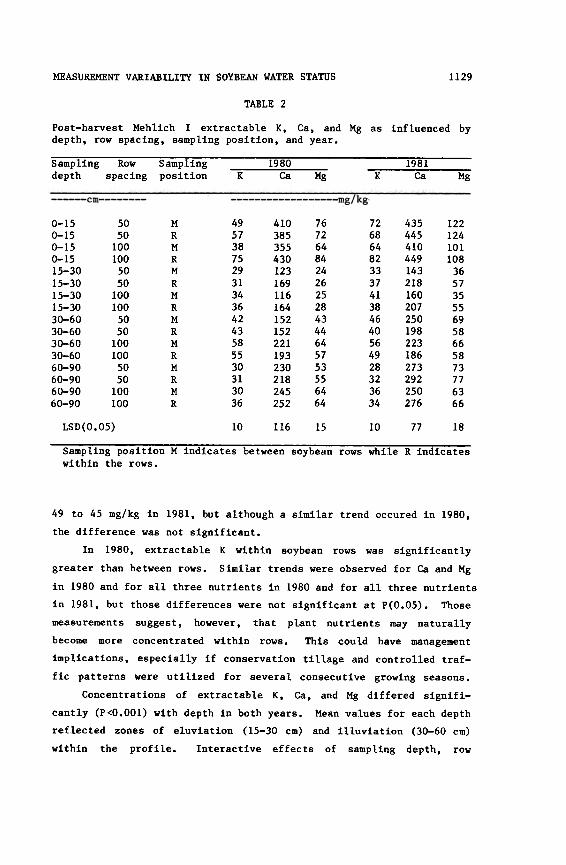
TABLE 2
Post-harvest Mehlich I extractable K, Ca, and Mg as influenced bydepth, row spacing, sampling position, and year.
Sampling Row Sampling 1980 1981depth spacing position K Ca Mg K Ca Mg
0-150-150-150-1515-3015-3015-3015-3030-6030-6030-6030-6060-9060-9060-9060-90
5050
1001005050
1001005050
1001005050
100100
49573875293134364243585530313036
410385355430123169116164152152221193230218245252
76726484242625284344645753556464
435445410449143218160207250198223186273292250276
122124101108
365735556958665873776366
MRMRMRM
RMRMRMRM
R
72686482333741384640564928323634
LSD(0.05) 10 116 15 10 77 18
Sampling position M indicates between soybean rows while R indicateswithin the rows.
49 to 45 mg/kg in 1981, but although a similar trend occured in 1980,
the difference was not significant.
In 1980, extractable K within soybean rows was significantly
greater than between rows. Similar trends were observed for Ca and Mg
in 1980 and for all three nutrients in 1980 and for all three nutrients
in 1981, but those differences were not significant at P(0.05). Those
measurements suggest, however, that plant nutrients may naturally
become more concentrated within rows. This could have management
implications, especially if conservation tillage and controlled traf-
fic patterns were utilized for several consecutive growing seasons.
Concentrations of extractable K, Ca, and Mg differed signifi-
cantly (P<0.001) with depth in both years. Mean values for each depth
reflected zones of eluviation (15-30 cm) and illuviation (30-60 cm)
within the profile. Interactive effects of sampling depth, row
MEASUREMENT VARIABILITY IN SOYBEAN WATER STATUS 1131
This subsequently influences plant growth, development, and nutient
accumulation, but quantifying those effects on nutrient extraction
patterns require extensive and positional soil sampling procedures.
REFERENCES
1. Mention of a trademark, proprietary product, or vendor does notconstitute a guarantee or warranty of the production by the U.S.Department of Agriculture and does not imply its approval to theexclusion of other products or vendors that may also be suitable.
2. Bell, C. J. and L. D. Incoll. 1981. A handpiece for the simul-taneous measurement of photosynthetic rate and leaf diffusiveconductance II. Calibration. J. Expt. Bot. 32:1135-1142.
3. Bell, C. J. and G. R. Squire. 1981. Comparative measurementswith two water vapour diffusion porometers (dynamic and steadystate). J. Expt. Bot. 32:1143-1156.
4. Berkowitz, G. A. and N. W. Hopper. 1980. A method of increasingthe accuracy of diffusive resistance porometer calibrations.Ann. Bot. 45:723-727.
5. Brady, R. A., S. M. Goltz, W. L. Powers, and E. T. Kanemasu.1975. Relation of soil water potential to stomatal resistance ofsoybean. Agron. J. 67:97-99.
6. Burrows, F. J. and F. L. Milthorpe. 1976. Stomatal conductancein the control of gas exchange. p. 102-152. In T. T. Kozlowski(Ed.) Water deficits and plant growth. Academic Press, NY.
7. Campbell, R. B. 1973. Flue-cured tobacco yield and oxygen con-tent of soils in lysimeters, flooded for various periods. Agron.J.65:783-796.
8. Campbell, R. B. and C. J. Phene. 1977. Tillage, matric poten-tial, oxygen, and millet yield relations in layered soils.Trans. ASAE 20:271-275.
9. Carlson, R. E., N. N. Momen, O. Arjmand, and R. H. Shaw. 1979.Leaf conductance and leaf-water potential relationships for twosoybean cultivars grown under controlled irrigation. Agron. J.
71:321-325.10. Chapman, D. C. and R. L. Parker. 1981. A theoretical analysis
of the diffusion porometer: steady state diffusion through twofinite cylinders of different radii. Agric. Meteorol. 23:9-20.
11. Cole, P. J. and A. M. Alston. 1974. Effects of transient dehy-dration on absorption of chloride by wheat roots. Plant and Soil
40: 243-247.12. DeMooy, C. J., J. Pesek, and E. Spaldon. 1973. Mineral nutrition.
In C. B. Caldwell (ed.) Soybeans: Improvement, production, anduses. Agronomy 16:267-352. Am. Soc. of Agron., Madison, Wis.
13. Ehrler, W. 1., S. B. Idso, R. D. Jackson, and R. J. Reginato.1978. Wheat canopy temperature: Relation to plant water poten-
tial. Agron. J. 70:251-256.14. Faiz, S. H. A. and P. E. Weatherly. 1978. Further investigations
into the location and magnitude of the hydraulic resistances inthe soil plant system. New Phytologist 81:1028.
15. Geiser, K. M., D. C. Slack, E. R. Allred, and K. W. Stange.1982. Irrigation scheduling using crop canopy -air temperaturedifference. Trans. ASAE 25:689-694.
MEASUREMENT VARIABILITY IN SOYBEAN WATER STATUS 1133
33. Kaufmann, M. R., 1982b. Evaluation of season, temperature, andwater stress effects on stomata using a leaf conductance model.Plant Physiol. 69:1023-1026.
34. Kozlowski, T. T. and S. G. pallardy. 1979. Stomatal responses
of Fraxinus pennsylvanica seedlings during and after flooding.
Physiol. Plant. 46:155-158.
35. Linacre, E. T. 1967. Climate and the evaporation from crops.
J. Irrig. Drainage Div. Am. Soc. Civil Eng. 93:61-79.
36. Long, F. L., H. F. Perkins, J. R. Carrecker, and J. M. Daniels.1969. Morphological, chemical, and physical characteristics ofeighteen representative soils of the Atlantic Coast Flatwoods.Georgia Agric. Exp. Stn. Res. Bull. 59.
37. Oliver, S. and S. A. Barber. 1966. An evaluation of the mecha-nisms governing the supply of Ca, Mg, K, and Na to soybean roots(Glycine~ L.). Soil Sci. Soc. Am. Proc. 30:80-86.
38. O'Toole, J. C. and T. T. Chang. 1978. Drought and rice improve-ment in perspective. IRRI Res. Paper Sere No. 14. Int. RiceRes. Inst., Manila, Phillipines. 27 p.
39. Peele, T. C., O. W. Beale, and F. F. Lesesne. 1970. The physi-cal properties of some South Carolina soils. South CarolinaAgric. Exp. Stn. Tech. Bull. 1037.
40. Pereira, J. S. and T. T. Kozlowski. 1977. Variations amongwoody angiosperms in response to flooding. Physiol. Plant.41:184-192.
41. Raper, C. D., Jr., and S. A. Barber. 1970. Rooting system ofsoybeans. II. Physiological effectiveness as nutrient absorp-tion surfaces. Agron. J. 70:585-588.42. Raschke, K. 1975. Stomatal action. Ann. Rev. Plant Physiol.26:309-340.
43. Regehr, D. L., F. A. Bazzaz, and W. R. Boggess. 1975. Photo-synthesis, transpiration, and leaf conductance of Populusdeltoides in relation to flooding and drought. Photsynthetica9:52-61.
44. Reicosky, D. C., R. B. Campbell, and C. W. Doty. 1976. Cornplant water stress as influenced by chiseling, irrigation, andwater table depth. Agron. J. 68:499-503.
45. Reicosky, D. C. and D. E. Deaton. 1979. Soybean water extrac-
tion, leaf water potential and evapotranspiration during drought.
Agron. J. 71:45-50.46. Sivakumar, M. V. K. and R. H. Shaw. 1978. Relative evaluation
of water stress indicators for soybean. Agron. J. 70:619-623.47. Smucker, A. J. M. 1975. Interactions of soil oxygen and water
stresses upon growth, disease, and production of navy beans.Report of the Bean Improvement Cooperative. pp. 72-75.
48. Sojka, R. E. 1984. Diffusive resistance, stomatal density, K,Ca, and Mg concentrations, and growth of Lee soybean as influ-enced by soAl-oxyg~n diffusion rate. Soil Sci.(In_~).49. Sojka, R. E. and J. E. Parsons. 1983. Soybean water status andcanopy microclimate relationships at four row spacings. Agron.J. 75:961-968.
50. Sojka, R. E. and L. H. Stolzy. 1980. Soil-oxygen effects onstomatal response. Soil Sci. 130:350-358.
51. Sojka, R. E., L. H. Stolzy, and R. A. Fischer. 1979. Comparisonof diurnal drought response of selected wheat cultivars. Agron.
J. 71:329-335.
SOJKA ET AI.
52. Sojka, R. E., L. H. Stolzy, and R. A. Fischer. 1981. Seasonaldrought response of selected wheat cultivars. Agron. J. 73:838-845.
53. Sojka, R. E., H. D. Scott, J. A. Ferguson, and E. M. Rutledge.1977. Relation of plant water status to soybean growth. Soil
Sci. 123: 182-187.54. Squire, G. R. and C. R. Black. 1981. Stomatal behavior in the
field. .!!!. P. G. Jarvis and T. A. Mansfield (Eds.) Soc. forExpt. Bio. Seminar Series, Vol. 8, Stomatal Physiology: Meeting,Lancaster, England. Dec. 19-20, 1979. Cambridge Univ. Press.p. 223-245.
55. Stange, K. W., D. C. Slack, E. R. Allred, and K. M. Geiser.1981. Relationship between canopy-air temperature differences andstomatal diffusion resistance. Paper #81-2010, Am. Soc. Ag. Eng.
56. Tinker, P. B. 1976. Roots and water. Transport of water toplant roots in soil. Philos. Trans, R. Soc. London, Series B273:445-461.
57. Turner, N. C. and J. E. Begg. 1981. Plant-water relations andadaptation to stress. Plant and Soil 58:97-131.
58. Turner, N. C. and J. Y. Parlange. 1970. Analysis of operationand calibration of a ventilated diffusion porometer. PlantPhysiol. 46:175-177.
59. Wien, H. C., E. J. Littleton, and A. Ayanaba. 1979. Droughtstress of cowpea and soybean under tropical conditions. p.283-301. In H. Mussell and R. C. Staples (Eds.) Stress Physi-ology in C~p Plants. Wiley Interscience, NY.
60. Zur, B., J. W. Jones, and K. J. Boote. 1983. Field evaluationof a water relations model for soybean I. Validity of somebasic assumptions. Agron. J. 75:272-280.