common market feasibility study
DESCRIPTION
Market feasibility AnalysisTRANSCRIPT

1 Table of Contents THE COMMON MARKET FEASIBILTY STUDY
Table of Contents
Table of Contents .......................................................................................................................................... 1
Executive Summary ....................................................................................................................................... 9
Funding Acknowledgement ...................................................................................................................... 9
Introduction .............................................................................................................................................. 9
Comparable Distribution Centers ........................................................................................................... 10
Demand Analysis ..................................................................................................................................... 11
Supply Analysis ........................................................................................................................................ 12
Site Recommendations ........................................................................................................................... 14
Business Structure .................................................................................................................................. 15
Economic Benefit Analysis ...................................................................................................................... 16
Environmental Impact Analysis ............................................................................................................... 18
Conclusions & Recommendations .......................................................................................................... 19
Introduction ................................................................................................................................................ 21
History of the Common Market Project ................................................................................................. 22
Study Team ............................................................................................................................................. 24
Study Goals ............................................................................................................................................. 25
Comparable Local Food Distribution Centers ............................................................................................. 27
Background ............................................................................................................................................. 27
Defining the Business .......................................................................................................................... 27
Definitions ........................................................................................................................................... 27
Comparable Businesses .......................................................................................................................... 28
Similar Operations .............................................................................................................................. 28
Methodology ....................................................................................................................................... 28
2 Table of Contents THE COMMON MARKET FEASIBILTY STUDY
Results ................................................................................................................................................. 29
Conclusions ......................................................................................................................................... 31
Estimated Mark-up of Farmer Goods ..................................................................................................... 31
Methodology ....................................................................................................................................... 31
Interviewees ........................................................................................................................................ 31
Interview Questions ............................................................................................................................ 32
Quantitative Results ............................................................................................................................ 32
Qualitative Analysis ............................................................................................................................. 33
Demand Analysis ......................................................................................................................................... 35
Methodology ........................................................................................................................................... 35
Summary of Survey Responses ............................................................................................................... 35
Operations .......................................................................................................................................... 35
Purchasing & Replenishment Process ................................................................................................. 36
Products .............................................................................................................................................. 37
Demographics of Customers ............................................................................................................... 38
Barriers and Value Components ......................................................................................................... 38
Conclusions ............................................................................................................................................. 39
Product Lines ....................................................................................................................................... 39
Operations .......................................................................................................................................... 40
Prospective Customers ....................................................................................................................... 40
Supply Analysis ............................................................................................................................................ 41
Methodology ........................................................................................................................................... 41
Summary of Survey Responses ............................................................................................................... 41
Descriptions of Farming Operations (Questions 1 – 7) ....................................................................... 41
Products, Volume, Market Readiness (Questions 8 – 15) .................................................................. 42
Sales and Marketing ............................................................................................................................ 43
3 Table of Contents THE COMMON MARKET FEASIBILTY STUDY
Expectations (Questions 28 -- 32) ....................................................................................................... 45
Conclusions ............................................................................................................................................. 46
Supply Calculation and Seasonality Analysis .......................................................................................... 47
Summary ............................................................................................................................................. 47
Produce ............................................................................................................................................... 47
Poultry ................................................................................................................................................. 48
Beef ..................................................................................................................................................... 49
Dairy .................................................................................................................................................... 49
Conclusion ........................................................................................................................................... 50
Feasibility of Proposed Site ......................................................................................................................... 52
Introduction ............................................................................................................................................ 52
The Existing Building ............................................................................................................................... 52
Program Facility Requirements ............................................................................................................... 53
Process and Findings ............................................................................................................................... 54
Conclusions for Proposed Facility ........................................................................................................... 55
Recommendation .................................................................................................................................... 56
Architectural Design and Analysis Products (Appendix G document list) .............................................. 56
Business Structure Tables ........................................................................................................................... 57
For-Profit Corporation Owned by Project Partners ................................................................................ 57
Buyers’ Co-operative ............................................................................................................................... 58
Joint Venture with Existing For-Profit Distributor .................................................................................. 59
Non-Profit Corporation ........................................................................................................................... 60
Economic Impact of Common Market ........................................................................................................ 61
Assumptions ............................................................................................................................................ 61
Value of Additional Agricultural Production ........................................................................................... 61
Employment Generation ......................................................................................................................... 62

4 Table of Contents THE COMMON MARKET FEASIBILTY STUDY
State and Local Tax Effect ....................................................................................................................... 63
Quantitative Benefit to Farmers ............................................................................................................. 64
Non-Quantitative Benefits to Farmers.................................................................................................... 66
Environmental Impact Analysis ................................................................................................................... 67
Conversion Factors and Assumptions ..................................................................................................... 68
Greenhouse Gas Exhaust Estimations .................................................................................................... 69
Locally Grown Products Transported to Philadelphia Prior to the Common Market ......................... 69
Long Distance Transportation of Farm Products to Philadelphia ....................................................... 71
Consolidated Transportation Model of Locally Grown Farm Products to Common Market .............. 73
Common Market Driven Reduction in Greenhouse Gases ..................................................................... 76
Consolidated Local Distribution Model Vs. Current Fragmented Local Distribution .......................... 76
Replacement of Products Shipped Long Distances by Locally-Grown Product .................................. 78
Solar Energy Opportunities for Distribution Center ............................................................................... 80
Electricity Generation and Cost Savings ............................................................................................. 82
Green House Gas Emissions Reductions and Cost Savings ................................................................. 84
Solar Recommendations ..................................................................................................................... 85
Conclusions & Recommendations .............................................................................................................. 86
Appendix A. Terminology ........................................................................................................................... 92
Appendix B. Interviews with Comparable Businesses ............................................................................... 93
Interview A .............................................................................................................................................. 93
Interview B .............................................................................................................................................. 95
Interview C .............................................................................................................................................. 96
Interview D .............................................................................................................................................. 98
Appendix C: Dairy Pricing .......................................................................................................................... 100
Appendix D: Mark Up Estimation Interviews ............................................................................................ 101
Appendix E: Demand Sector Interviews ................................................................................................... 106

5 Table of Contents THE COMMON MARKET FEASIBILTY STUDY
Institutions ............................................................................................................................................ 106
Management Approach .................................................................................................................... 106
Demographics ................................................................................................................................... 108
Ordering ............................................................................................................................................ 108
Delivery ............................................................................................................................................. 110
Invoicing ............................................................................................................................................ 111
Products ............................................................................................................................................ 111
Suppliers ............................................................................................................................................ 112
Food Source ...................................................................................................................................... 113
Grocery Stores ...................................................................................................................................... 114
Management Approach .................................................................................................................... 114
Demographics ................................................................................................................................... 116
Ordering ............................................................................................................................................ 116
Delivery ............................................................................................................................................. 119
Invoicing ............................................................................................................................................ 120
Products ............................................................................................................................................ 120
Suppliers ............................................................................................................................................ 121
Food Sources ..................................................................................................................................... 121
Coffee Shops ......................................................................................................................................... 123
Management Approach .................................................................................................................... 123
Demographics ................................................................................................................................... 124
Ordering ............................................................................................................................................ 125
Delivery ............................................................................................................................................. 127
Invoicing ............................................................................................................................................ 127
Products ............................................................................................................................................ 127
Suppliers ............................................................................................................................................ 128
6 Table of Contents THE COMMON MARKET FEASIBILTY STUDY
Food Sources ..................................................................................................................................... 129
Caterers ................................................................................................................................................. 130
Management Questions ................................................................................................................... 130
Demographics ................................................................................................................................... 131
Ordering ............................................................................................................................................ 131
Delivery ............................................................................................................................................. 133
Invoicing ............................................................................................................................................ 134
Products ............................................................................................................................................ 134
Co-ops ................................................................................................................................................... 136
Management Questions ................................................................................................................... 136
Demographics ................................................................................................................................... 138
Ordering ............................................................................................................................................ 138
Delivery ............................................................................................................................................. 140
Invoicing ............................................................................................................................................ 141
Products ............................................................................................................................................ 141
Suppliers ............................................................................................................................................ 142
Food source ....................................................................................................................................... 142
Restaurants ........................................................................................................................................... 144
Management Approach .................................................................................................................... 144
Demographics ................................................................................................................................... 145
Ordering ............................................................................................................................................ 146
Delivery ............................................................................................................................................. 148
Invoicing ............................................................................................................................................ 149
Products ............................................................................................................................................ 149
Suppliers ............................................................................................................................................ 150
Food Sources ..................................................................................................................................... 150
7 Table of Contents THE COMMON MARKET FEASIBILTY STUDY
Estimated Revenues from Wholesale Purchasers ................................................................................ 152
Restaurant/Retailer Interview Transcripts........................................................................................ 156
Institution Interview Transcripts ....................................................................................................... 159
Appendix F: Supply Side Interviews ......................................................................................................... 163
Processed Dairy ..................................................................................................................................... 163
General Information ......................................................................................................................... 163
Products ............................................................................................................................................ 164
Marketing and Sales .......................................................................................................................... 166
Expectations ...................................................................................................................................... 172
Fruit Sector ............................................................................................................................................ 174
General Information ......................................................................................................................... 174
Products ............................................................................................................................................ 174
Marketing and Sales .......................................................................................................................... 177
Expectations ...................................................................................................................................... 182
Meat Sector ........................................................................................................................................... 185
General Information ......................................................................................................................... 185
Products ............................................................................................................................................ 186
Marketing and Sales .......................................................................................................................... 191
Expectations ...................................................................................................................................... 198
Vegetable Sector ................................................................................................................................... 201
General Information ......................................................................................................................... 201
Products ............................................................................................................................................ 202
Marketing and Sales .......................................................................................................................... 204
Expectations ...................................................................................................................................... 210
Appendix G: Architectural Design and Analysis Products ......................................................................... 213
Site Plan and Location Maps ................................................................................................................. 214
8 THE COMMON MARKET FEASIBILTY STUDY
Existing Building Ground and Second Floor Plans and Photographs .................................................... 215
Proposed Building Plans and Elevations with Photographs of Façade ................................................. 217
Common Market Schematic Floor Plan ................................................................................................ 218
Common Market Schematic Elevation – Glenwood Avenue Façade .................................................... 219
Common Market Schematic Elevation and Diagrammatic Section ...................................................... 220
Common Market Schematic Floor Plan ................................................................................................ 221
Common Market Schematic Floor Plan - Alternate Space .................................................................... 222
Feasibility Program ............................................................................................................................... 223
Opinion of Probable Cost – Summary ................................................................................................... 225
Opinion of Probable Cost – Common Market Fit-Out .......................................................................... 226
Opinion of Probable Cost – Base Building Work ................................................................................... 228
Structural Fundamental Design Report ................................................................................................ 230
Report on Food Distribution Center Cost Factors ................................................................................. 232
Appendix H: PA Seasonality Chart ............................................................................................................ 237
9 Executive Summary THE COMMON MARKET FEASIBILTY STUDY
Executive Summary
Funding Acknowledgement
This study has been funded by the Commonwealth of Pennsylvania Department of Community and
Economic Development's First Industries Fund. The First Industries Fund is "a grant and loan program
aimed at strengthening Pennsylvania's agriculture and tourism industries" and "…is part of PA Grows,
the Pennsylvania Department of Agriculture's new initiative designed to assist agricultural producers in
gaining access to the capital they need to begin, continue, or expand their businesses." The funding for
this project has proven critical in demonstrating the viability of the Common Market model. The
opportunity to apply for the First Industries Fund motivated the project partners to formalize their idea
into a grant-winning proposal, generating the funding to produce this study that validates the
hypothesis and proves the concept's viability. The accompanying business plan charts the course for the
launch of the Common Market, coinciding with the growing season in the spring of 2008. The applicant
of record, 3002 CBMoore, LLC and the Common Market project partners thank the Commonwealth of
Pennsylvania and the Department of Community and Economic Development for this opportunity.
Introduction
In both Philadelphia and around the United States, there has been an increasing awareness of the
benefits of and demand for locally grown food. Purchasers of "local foods" realize a value and benefit in
freshness and regional flavor; a sense of food security and support for the regional economy. Yet
despite the rising demand for local and regionally produced farm products, many likely purchasers cite
an inability to reliably and/or affordably source it. Numerous studies indicate that sufficient market
demand exists to support local and regional supply; however there is a lack of distribution infrastructure
to support wholesale sales volumes. This in turn limits the amount of locally produced farm food that
finds its way to Philadelphia area consumers outside of the fragmented, direct farmer-to-consumer
retail sales of farm markets, community supported agriculture and small-scale direct wholesale to
restaurants.
The vision for the Common Market grew out of a collective desire to affect these supply constraints
while simultaneously improving both the viability of local farms and the food security of Philadelphians.
This study tests the premise that a values-driven wholesale distributor of food grown in the
Philadelphia region can catalyze the necessary infrastructure to both supply the wholesale needs of
the Philadelphia market and incentivize regional farmers to grow and sell more product regionally.
The study also seeks to develop a model that allows for start-up subsidy to capitalize and grow the
10 Executive Summary THE COMMON MARKET FEASIBILTY STUDY
distribution enterprise yet can operate independent of subsidy once an appropriate scale is reached.
If feasible, the project's partners seek to leverage the operation to further enhance the food security
of the Philadelphia region and the viability of local farms through ancillary nonprofit and
entrepreneurial activities.
Low-income urban and rural farm communities bear the brunt of the fragmented and unsustainable
regional food system in the Philadelphia metropolitan area. Despite being in close proximity to some of
the richest farmland in America, access to locally grown food is extremely limited for most
Philadelphians. Likewise, farmers are adjacent to the third largest market for food in the US yet many
struggle to earn an adequate income due to the mainstream distribution system that favors product
from global competitors. The Common Market is a proposed solution to this market inefficiency as a
means to enhance regional food self-reliance by creating an efficient local food distribution
infrastructure that will connect local farmers to urban communities.
Many Pennsylvania growers do not operate on a scale that enables them to devote adequate resources
to transportation and sales at their individual farming operations. This, in turn, inhibits their access to
the mainstream distribution network. Where local farmers do participate in the large-scale wholesale
market, a given farm and its products' identity are rarely maintained. This leads to a farm-side loss of
potential earnings due to unrealized margins and lost marketing opportunities. The Common Market
seeks to change the way that local food is sold and marketed to institutions, grocery stores and
restaurants. It will benefit both customers and suppliers by creating an alternative to the global food
supply chain. There will also be an associated positive environmental impact achieved through the
proposed activities central to the project.
Comparable Distribution Centers
The Common Market model is proposed as a distributor of locally and regionally produced foods and
will source its product directly from local and regional farms in a “market-ready” form or in raw form
that it will process into a market-ready product. This business model differentiates itself from other
traditional food distributors in that the emphasis is on dealing directly with regional farmers and
specializing in the distribution of their products thereby eliminating the various intermediaries typically
present in the conventional food distribution chain1. In addition, the Common Market business model is
driven by values that place farmer representation and fairness to producers first.
After conducting research on similar enterprises, it was determined that few businesses exist that are
identical in scope and mission to the Common Market. However there is much discussion regarding the
need for such enterprises from a wide variety of organizations involved in progressive agriculture and
food security issues, projects associated with various non-profits (some within local or state
government) and institutions of higher learning and rural coalitions. There are also several attempts to
1 The term “conventional” as used in this context refers to the common trade description of the food distribution
chain and is not to be confused with the counterpoint to “organic” food.
11 Executive Summary THE COMMON MARKET FEASIBILTY STUDY
form “virtual” or on-line food distribution networks to promote local markets for local growers which
leave the actual physical aspects (i.e., the logistics, sales and management) up to the suppliers and
buyers. Nevertheless, the information collected in the interviews provides important insight into the
requirements necessary for the start-up of The Common Market.
While no exact Common Market "equivalent" exists in the region, there has been a growth in the
organic farm cooperative model. While the consolidation and distribution of local-organic has expanded
to meet the market demand, little has been accomplished for the non-certified organic and Integrated
Pest Management (IPM) growers of local product beyond small-scale cross docking and truck sharing in
the Philadelphia area. Larger wholesale buyers surveyed in this study and others indicate price and
product preferences that are not met by the niche organic growers and cooperatives. The local-organic
cooperative distribution model does, however, present a successful small-scale example for the
consolidation, sales and distribution of locally-grown seasonal farm products in urban markets. This
model has proven to be both viable and profitable in the long-term and several PA examples have
demonstrated strong growth in recent years. The Common Market seeks to build on this model and the
market enthusiasm for locally and sustainably grown products, yet will incorporate a market-based
facility for distribution rather than the farm-side combined consolidation/distribution model commonly
found in organic cooperatives.
Demand Analysis
The study of the demand for locally-grown food is central to proving the feasibility of this proposed
enterprise. While certain assumptions about local demand were made by the project partners based on
their collective experience in the "local food industry" in order to craft the Common Market concept, it
was necessary to validate these assumptions and gather additional demand specific data to conduct
business planning.
Prospective customers for the Common Market were identified and categorized by type and then
surveyed in focus group format. Three general categories were identified: 1) retailers, 2) retail food
service, and 3) non-retail food service. The general categories were sub-divided further into six
prospective customer types: food co-ops and grocery stores in the general retail category; restaurants
and coffee shops in the retail food service sector; and, institutions and caterers in the non-retail food
service sector.
The survey questionnaire was designed to ascertain the following information from the panels:
• Descriptions of how their businesses operate, including core values,
• Purchasing and replenishment processes, including factors involved in purchasing decisions,
choosing suppliers, the mechanics of ordering and product delivery, and billing,
• Products (local) they use and those they would be interested in using, including quality and
packaging requirements,
• Demographics of their customers,
12 Executive Summary THE COMMON MARKET FEASIBILTY STUDY
• Barriers to purchasing locally produced foods and the value components (if any) that enter into
sourcing decisions.
Among the findings, there was general consensus that working with a supplier on a year-round basis was
important to maintaining and growing the relationship and therefore was preferable to seasonal
relationships. There was a strong preference for local over organic with certain conditions and
responses indicated a strong interest in a one-stop business that, in addition to supplying a variety of
different locally produced food products, could also source out-of-season products and products not
produced locally from family farm producers and fair trade sources.
Barriers to purchasing more local product were consistent among respondents. All indicated a lack of a
good distribution network, inconvenience, difficulty in procuring consistent supply and quality, inability
to get everyday deliveries, lack of knowledge about what is produced and when it is available (and the
time constraint to find out), and seasonal limitations. Institutional respondents indicated that local
producers and suppliers lacked the size, scale or sophistication to work with them.
Survey results indicate an excellent opportunity for a business like the Common Market. Respondents
universally expressed a strong interest in a service-oriented distributor that specialized in a variety of
locally produced agricultural food products. The survey panel results demonstrate there is unmet
demand for both products and services of the Common Market in the Philadelphia area. In addition, the
results provide a clear picture of the type of services and product lines potential customers want and
therefore will help shape the operating model for the business.
Supply Analysis
Equally fundamental to the feasibility of the Common Market concept is the ability and willingness of
regional farmers to produce sufficient quantity and quality to meet the demand of the Philadelphia
market for local products. Prospective farmer suppliers for the Common Market were identified and
categorized by type. Three general categories were identified: 1) fruit and vegetable growers, 2) dairy
farmers, and 3) meat producers. The fruit and vegetable category was sub-divided between the two and
interviewed separately. Nearly every farmer interviewed was a generational farmer, that is, they grew
up on farms, had relatives that farmed or had been involved in farming in some way all their lives. The
respondents represented farms from Pennsylvania (Berks, Columbia, Cumberland, Lancaster, Lebanon,
Northumberland counties), Maryland (Baltimore county) and New Jersey (Salem county). Farms ranged
in size from 6 to 900 acres. The vegetable farms ranged from small (6 acres) to larger operations of 120
acres. Tree fruit farms tend to be larger due to the space required in traditional orchard practices and
the panelists' operations ranged from 110 to 900 acres.
Like the aforementioned demand study, a similarly designed supply study was conducted by surveying a
wide variety of Philadelphia area growers. The survey questionnaire was designed to ascertain the
following information from the participants:
• Descriptions of their farming operations, including ownership, capacity, farming experience, and
basic farming practices
13 Executive Summary THE COMMON MARKET FEASIBILTY STUDY
• Products produced on the farm, wholesale market readiness, potential or interest in producing
new or different products
• Current sales and marketing practices and experience and/or barriers to participating in the
wholesale trade
• Interest in working with a business like the Common Market model
The panel participants, along with the analysis of Pennsylvania (PA) state and United States Department
of Agriculture (USDA) statistical data, indicate that enough products are produced in close proximity to
Philadelphia to support a distribution business proposed by the Common Market (in terms of product
mix and volume). The panel respondents operate financially successful farms and have found ways to
market that sustain them economically. Many of the farmers interviewed have focused their
operations on direct-retail and direct-wholesale sales. Nevertheless, respondents indicated an interest
in working with a business like the Common Market. Common Market managers will need to focus
significant efforts on developing a reliable network of farms to meet the wholesale demand of their
target markets. More "wholesale ready" farms need to be identified while other farms need to both
expand existing operations to diversify their sales into wholesale markets facilitated by the proposed
business. Key elements for farmer participation include the organizational, operational and capital
issues identified below.
Organizationally, there is a clear desire on the part of producers to work with a wholesaler or
distributor that will provide better access to local markets and treat them in more respectful, non-
exploitative manner. Therefore, the Common Market’s value proposition for prospective suppliers
should be to provide transparency, vested interest for producers, transportation services, professional
sales representation, secure financial backing to ensure timely payment, and quick and fair dispute
resolution.
Operationally, the Common Market will require a facility to receive, store, prepare, assemble and
ship products; trucks to deliver (and possibly pickup from farms) products; and a staff for logistics (for all
trucking and internal handling), sales and management. Sales will require adequate staffing to maintain
regular, consistent, informed contact with the customer base while prospecting for new customers.
Capacity to produce certain value-added product would increase farmer interest. Specifically this would
include a USDA butchering facility with storage and freezing equipment and freezer storage for both
meats and fresh produce items for out-of-season sales.
Capital will be an important component to the success of the Common Market. Appropriate
capitalization of facilities will be necessary to provide the necessary services to interest farmers and
products for customers. In addition, farmers participating in the producer panels indicated a strong
desire for fast pay. Therefore, the Common Market will require adequate access to cash to cover the
spread between fast payment terms and its receivables.
14 Executive Summary THE COMMON MARKET FEASIBILTY STUDY
Site Recommendations
One premise for the need of the Common Market in facilitating a sustainable, local agricultural economy
is the creation of distribution efficiencies. The study team has observed that the majority of local farm
product sold in the Philadelphia market is transported by means of a fragmented, inefficient system of
independent growers and shippers. By applying best practices of logistics systems and distribution
location theory, the Common Market study team was able to evaluate proposed warehouse facilities
based both on the financial operating feasibility as well as optimal location.
Efficiencies of this project are rooted in creating a market-based point of agricultural product
aggregation or consolidation and physical distribution or outbound logistics. By locating the facility
close to the market, the operation will be more efficiently responsive to the gravity of demand through
shortened outbound logistics and response times. The project will also seek to consolidate the inbound
logistics of the farm products by coordinating farm-side trucking, pickup routes and cross docking
opportunities. Once the operation reaches scale, the Common Market will explore creating supply-side
points of consolidation or shipping points in the farm communities to most efficiently move larger
volumes of diverse products to the market-based distribution facility.
The grantee is the owner of a suitably sized and located warehouse facility so the potential use of that
space was analyzed first. Once it was determined that it was cost prohibitive to build out the grantee's
warehouse, potential leasehold sites were considered based on proximity to highways and the market.
After analyzing several potential locations, the Common Market management team decided to share the
excess capacity of an existing distribution facility operated by a nonprofit organization dealing in food
security for low-income constituents. There exists a great partnership possibility with this organization
to help the Common Market achieve some its urban focused, mission based activities.
Feasibility of Proposed Grantee Owned Site
The purpose of the facility Study is to determine space requirements, functional relationships of
operation components, potential for growth, and an opinion of probable cost utilizing an existing
building owned by the partners as a potential model. The building originally proposed is a 60,000
square foot masonry warehouse located in North Philadelphia close to the ramps of highways US1 and I-
76.
A space mapping program for the proposed Common Market was assembled, a schematic plan for
utilizing the existing building was prepared, and an opinion of probable cost based on the program
design for the existing building was developed.
There appears to be three major hindrances to the feasibility of utilizing the existing building for the
Common Market: The first is the financial investment needed to repair and outfit the existing building
to make it ready for use by an operating entity. The second is the limited area of space available for the
Common Market, which does not allow for future expansion of the distribution center, and the third is
the lack of a second loading dock to enhance efficiency of the operation. An associated drawback is the
15 Executive Summary THE COMMON MARKET FEASIBILTY STUDY
location of the building for loading and unloading. Although the building is easily accessible from major
transportation routes, and the access streets are wider than the typical Philadelphia street, the building
is not oriented to easily receive back-in loading.
Although the existing building would provide the Common Market with a well planned and functionally
organized space to start their business, it would be expensive to outfit, not allow for future growth of
the business and it is possible if not likely that its ability to function in this space would be short lived.
Recommendation
It was determined that although the building allows for a well functioning distribution center at its
inception, future growth of the business is not possible in the space available. More importantly, the
initial necessary capital improvement and fit-out costs make start-up in the existing facility infeasible.
The current facility owned by project partners is therefore ideal for neither the startup nor the at-
scale/growth phases of this enterprise. It was suggested that the partners seek an existing cold-storage
facility with excess capacity to take advantage of sunk infrastructure costs borne by another entity.
The project will be best served in its start-up phase by locating at a facility that is already equipped for
cold storage and distribution. The prohibitive cost of outfitting a space at startup will financially cripple
this project and hinder its probability of success. The group should seek to partner with an existing
distribution operation/facility where it can utilize low-cost, excess capacity until it has grown to a size
that justifies major capital outlays on refrigeration and investments in space toward future growth. Said
entity was found and the project team is excited that there is also enough facility capacity to allow for
the growth of the Common Market for the foreseeable future.
Business Structure
After carefully considering several different business structures, weighing the numerous needs of the
project partners with the legal, tax and funding implications of each, the recommendation of this study
is that the Common Market be launched as a Pennsylvania nonprofit corporation. It should be
organized in a way that will give it maximum flexibility, allowing managers to determine whether it
should transition into a 501(c)3 federal nonprofit or a for profit corporation in the future.
The business structures considered in our study were as follows: a for-profit corporation owned by the
project partners, a buyer-owned cooperative, a joint venture with an existing for-profit produce
distributor and finally, a board controlled nonprofit. The management team consulted with a seasoned
corporate attorney with specific experience in launching and growing mission-based enterprises such as
the nonprofit The Reinvestment Fund (TRF) based in Philadelphia. The strong focus on the social benefit
of the proposed project in conjunction with the need to raise significant start-up funding to achieve this
impact made the nonprofit structure the natural selection. This structure also allows for varying levels
of participation by project partners in the governance of the organization without profit motive.
16 Executive Summary THE COMMON MARKET FEASIBILTY STUDY
Partners will participate to further their respective organization's mission while expanding their impact
on food access, security and local farm preservation through this collective effort.
The Common Market's values will be embedded in its by-laws. These values include commitment to
local farmers and to expanding local food access to low-income urban residents, as well as sourcing local
and sustainably-produced supply. While the Common Market will seek foundation dollars to fund the
early capitalization and operations of the business, the goal of the project partners is to operate the
enterprise without subsidy within a few years of startup. Operating surplus of the Common Market will
be reinvested in local food promotion programs, food access in under-served urban communities and
creating value-added entrepreneurial opportunities in Philadelphia and the surrounding rural counties.
Economic Benefit Analysis
The preceding sections summarize the necessary market components, facility requirements, costs and
corporate structure to prove the viability of the Common Market as a model concept. After processing
the data produced though this feasibility study, operating assumptions and projections were used to
develop a financial model that empirically supports the anecdotal conclusion that this is a viable,
worthwhile project. Beyond proving the demand for and internal financial viability of this project, it is
important to demonstrate the potential external economic impact of the Common Market's operations.
For the economic benefit analysis, we project that all of the Common Market’s sales represent
additional farm product that would not have been sold otherwise. For the purposes of demonstrating
potential economic benefit, we use as an example source farms that are located in the following nine
Pennsylvania counties: Adams, York, Lancaster, Chester, Bucks, Dauphin, Lebanon, Berks and Schuylkill.
These counties were selected because they are located within 150 miles of Philadelphia and they had
over 1,000 people employed in the agriculture sector in 2000, as measured by the Federal Bureau of
Economic Analysis. The other main assumption is that supply from each county will be proportional to
the relative value of its agriculture production to that of the total of the nine counties.
The sales growth assumptions used for financial modeling of this project are extremely conservative.
The low estimates are derived by the study team's conclusion that sales growth in the short term will be
limited by supply and it will take time to develop a reliable supply network of farms that grow on a
wholesale scale and meet the Common Market's product values. There is also an opportunity to source
product from non-Pennsylvania farms in the adjacent states of New Jersey, Delaware, Virginia and
Maryland. The impact on those States is not considered in this study.
The most significant findings of this economic benefit analysis are summarized below:
Value of Additional Agricultural Production The wholesale value of agriculture product sold by the
Common Market is projected to start at $137k in its first year of operations and grow to $1.4M by the
end of the fifth year of operations. In addition to the direct economic impact, the multiplier effect on
each of the nine counties of sales to the Common Market can be quantified using an economic model
17 Executive Summary THE COMMON MARKET FEASIBILTY STUDY
known as IMPLAN that captures the linkages in an economy. Combining both the direct and indirect
economic impact of the Common Market yields a total additional economic impact of $264k in the first
year of operations and grows to $2.7M by the end of the fifth year.
Employment Generation
The Common Market will generate jobs, both directly and indirectly in Philadelphia and the nine
Pennsylvania counties supplying the distribution center. According to employment projections in the
business plan, the Common Market will launch with 2.5 full-time equivalent (FTE) employees and grow
to employ 5 FTE employees by its fifth year of operations. The direct sales of agricultural product to the
Common Market will generate jobs in the nine rural Pennsylvania counties that are the primary
suppliers to the distribution center. Based on sales projections, the Common Market will create 2.0 FTE
external jobs in its first year and job creation will grow to 20.53 FTE by the fifth year of operations.
There is also an associated job multiplier resulting Common Market operations. The Penn State
Cooperative Extension’s IMPLAN economic impact model for every Pennsylvania county quantified this
ripple effect into an “employment multiplier,” similar to the “output multiplier” above. For the nine
counties expected to supply the Common Market, this employment multiplier ranged from 1.3 to 2.1,
meaning that for each FTE job created, an additional 0.3 to 1.1 FTE jobs were generated.
Combining the distribution center jobs, farm jobs and ripple effect jobs generated as a result of the
Common Market yields 5.9 total additional FTE jobs in the first year of operations and grows to 39.9 by
the end of the fifth year.
State and Local Tax Effect
The Common Market’s primary effect on state and local taxes will be the Pennsylvania Personal Income
Tax and the Philadelphia Wage Tax of direct employees of the Distribution Center. Based on
employment projections in the business plan, the Common Market will generate $4,600 of additional
direct tax revenue in its first year of operations, growing to $12,000 by its fifth year of operations. The
tax benefit of jobs potentially created by indirect and multiplying effects is more subjective.
Quantitative Benefit to Farmers
The Common Market benefits farmers economically by giving them a venue to sell additional
production. The value of agriculture product sold by the Common Market is projected to start at $137k
in its first year of operations and grow to $1.4M by the end of the fifth year of operations. This is
equivalent to purchasing all the production of more than one median farm of the nine primary source
counties in its first year of operations. By its fifth year of operations, the Common Market will purchase
the equivalent of all the production of more than 12 farms.
Non-Quantitative Benefits to Farmers
There exists numerous non-quantitiative potential benefits to farmers generated through the creation
of the Common Market. A few are mentioned below and are expounded upon later in this study:
18 Executive Summary THE COMMON MARKET FEASIBILTY STUDY
• Increased efficiency in marketing and delivering local foods,
• Sustainable future for mid-sized farms,
• Farmland preservation ,
• Support for institutional purchasing of local foods,
• Better crop coordination and understanding of market demand.
Environmental Impact Analysis
The environmental impact analysis estimated the reduction in greenhouse gas production resulting from
the replacement of farm products coming from conventional food distribution channels with the same
foods originating from farms within 150 miles of Philadelphia. The analysis shows that by year 5, local
sourcing of food products by the Common Market will reduce greenhouse gas emissions by 454,000 lbs,
carbon dioxide equivalent (CO2E). The potential to reduce greenhouse gas emissions by consolidation of
current delivery of local farm products to Philadelphia was also studied. If half of the amount of local
food products currently brought to into Philadelphia by farm trucks is consolidated into Common
Market routes, the reduction in greenhouse gas generation in year 5 will be about 10,000 lbs, CO2E, a
small fraction of the reduction estimated for replacement of food items from the national supply but
still a significant reduction.
The Common Market operation can create a demand for farm products from certified organic farms and
conceivably can lower the use of environmentally damaging synthetic inputs as farms transition to
organic status. However, the analysis revealed that the amount of certified organic farmland needed to
satisfy the Common Market demand for organic food items is quite low and negligible compared to the
amount of land being farmed with organic methods in the supply area of the Common Market and
therefore the reduction in environmental impacts due to conversion of farmland to organic methods is
insignificant.
Solar collectors installed on the roof of the Common Market can generate about 40 percent of the
power required by the warehouse refrigeration units resulting in avoided greenhouse emissions from
fossil fuel power plants of 457,000 lbs CO2E annually and a saving of $36,000 a year in electric power
costs. For both these reasons, the study recommends installation of solar collectors.
19 Executive Summary THE COMMON MARKET FEASIBILTY STUDY
Conclusions & Recommendations
The Common Market model, born out of the collective desire of Philadelphia-based individuals and
organizations to impact the supply constraints of local food, has been demonstrated through this study
to be both feasible and in great demand. This project has the potential to significantly expand the
amount of food grown and consumed within the Philadelphia region simultaneously improving the food
security of consumers while enhancing the viability of local farm communities. While the demand for
this model of values-based distribution holds great potential, the implementation of the business will
prove challenging while project partners balance the group's social mission and the need to operate a
fiscally efficient, low margin enterprise.
After conducting market research to find a comparable operating model, the study team found no other
operation that perfectly mirrored the Common Market platform. This created a challenge for the study
team which had to draw more assumptions while testing the financial viability of the business. It also
allowed the study team to shift certain aspects of the business in response to the research, extracting
best practices from numerous different yet successful models and bending the CM model to better
serve supply and demand-side stakeholders. The core value proposition and proposed service of the
Common Market was widely regarded by interview participants to be the "missing link" for the
Philadelphia local food economy. This enthusiastic response coupled with the observation of the
profitable and growing local-organic distribution model suggests strong market opportunity for the
Common Market. It is the hope of the project partners that the model will prove to be replicable in
other markets.
Demand sector analysis provided affirmation of the project partners' identification of need for the
Common Market. While most respondents indicated a commitment to purchasing locally, the barriers
to doing so seemed to multiply in correlation to the quantity of food purchased. Herein lies one of the
greatest market niche opportunities for the project. Being able to meet the stringent licensing,
regulatory and insurance requirements will open significant sales channels. The ability to source and
consolidate all products currently grown locally will create significant competitive advantage for a
distributor seeking to serve the institutional clientele. With this said, it may behoove the Common
Market to limit its sales to fruits and vegetables at start-up due to lower regulatory hurdles. All
categories of buyers expressed the need to have a year-round supply of product. This will necessitate
both season-extending efforts locally and relationships with like-valued growers in warmer climates.
Fair-trade sourcing should be considered to round out product offerings.
The most important attribute of any food distribution enterprise should be reliability- both in delivery
and quality. For this reason the ability of this business to grow and maintain strong buyer relationships
will hinge upon its supply network. While wholesale demand is strong and growing, the historic absence
of a distributor like the one proposed in this study has allowed demand to significantly outstrip supply.
Adopting a slow-growth approach to sales will be important while the Common Market builds
relationships with farmers and fine-tunes logistics. The nascent effort should never promise what it
cannot provide. The Common Market's reliability to its customers must also match payment
consistency with farmers if it is to earn their trust and long-term commitment.
20 Executive Summary THE COMMON MARKET FEASIBILTY STUDY
While the facility owned by project partners proved to be a non-cost effective option, it opened up an
opportunity to find an optimally located, low cost facility. The overall financial viability of the project is
enhanced by cost and location of this vital distribution component. It is recommended that if possible,
the project locate in a facility where it uses an existing distributor's excess capacity. This will allow the
project to lower its overall cost basis at startup and learn from an existing operator.
The best organizational model for achieving the project's various goals will be nonprofit. This will allow
the group to raise the necessary start-up capital and platform for achieving the group's social mission.
While this business form will not have as strong of a direct tax benefit for Philadelphia and the
Commonwealth of Pennsylvania, there exists a multitude of ancillary economic benefits, job creation
and income tax benefits resulting from its operations. Consolidation of distribution routes and the
replacement in the Philadelphia marketplace of food grown thousands of miles away will benefit the
global as well as local environments. The project also has the opportunity to employ additional energy
saving techniques to supply its extensive fuel and power needs.
This study demonstrates that the Common Market model is feasible and would prove to be a much
needed solution to the barriers preventing more prolific selling and buying of locally grown farm
products in the Philadelphia region. It is suggested that the complete business planning of the Common
Market follow this somewhat parallel feasibility study.
21 Introduction THE COMMON MARKET FEASIBILTY STUDY
Introduction
In both Philadelphia and around the United States, there has been an increasing awareness of the
benefits of and demand for locally grown food. Purchasers of "local foods" realize a value and benefit in
freshness and regional flavor; a sense of food security and support for the regional economy. Yet
despite the rising demand for local and regionally produced farm products, many would be purchasers
cite an inability to reliably and/or affordably source it. Numerous studies indicate that sufficient market
demand exists to support local and regional supply; however there is a lack of distribution infrastructure
to support wholesale sales volumes. This in turn limits the amount of locally produced farm food that
finds its way to consumers outside of the fragmented, direct farmer-to-consumer retail sales of farm
markets, community supported agriculture and small-scale direct wholesale to restaurants. The
importance of these efforts cannot be underestimated since the growing market demand for wholesale
quantities of local products comes as a result of these direct retail efforts. When locally-grown product
does make it through the wholesale distribution system for consumption in a local market, rarely does it
maintain the identity of the source farm nor is it differentiated as a locally produced item.
The vision for the Common Market grew out of a collective desire to affect these supply constraints
while simultaneously improving both the viability of local farmers and the food security of
Philadelphians. Low-income urban and rural farm communities often bear the brunt of the fragmented,
inefficient and unsustainable regional food system in the Philadelphia metropolitan area. Despite being
close to some of the richest farmland in America, access to locally grown food is extremely limited for
most Philadelphians. Likewise, area farmers are adjacent to the third largest market for food in the US
yet many struggle to earn an adequate income due to the dominant, conventional distribution system
that favors product from global competitors. The Common Market is a proposed solution to this
market inefficiency as a means to enhance regional food self-reliance by creating an efficient local food
distribution infrastructure that will connect local farmers to urban communities.
Many Pennsylvania growers do not operate on a scale that enables them to devote adequate resources
to transportation and sales at their individual farming operations. This, in turn, inhibits their access to
the mainstream distribution network. Furthermore, many local and regional farmers are producing food
items that are in high demand but the mainstream food distribution network will not handle them due
to their scale, issues of seasonality, and the perceived risk involved. This includes items such as raw
dairy products and heirloom and traditional produce varieties that do not ship well. Where local
farmers do participate in the large-scale wholesale market, a given farm and its products identity are
rarely maintained. This leads to a farm-side loss of potential earnings due to unrealized margins and lost
marketing opportunities. The Common Market seeks to serve the needs of the region's farmers by
supplying consolidated sales and transportation support while expanding the reliability and ease of
access to locally grown products for the city's consumers. Underserved urban communities will also
benefit through linkages to low cost, nutrient rich, in-season glut production.
22 Introduction THE COMMON MARKET FEASIBILTY STUDY
History of the Common Market Project
One day in the fall of 2004, Robert Pierson of Farm to City agreed to meet Tatiana Granados of EPRA,
Haile Johnston and another former employee of the Urban Nutrition Initiative to address the food
insecurity of low income Philadelphia neighborhoods. The goal of the meeting was to brainstorm how
the group could utilize Farm to City's contacts with local farmers to provide food for the nascent retail
cooperative efforts of the East Park Revitalization Alliance (EPRA) in the Strawberry Mansion
neighborhood of North Philadelphia and to UNI's A Little Taste of Everything (ALTOE) in West
Philadelphia. ALTOE and EPRA envisioned pooling their purchases of local produce in order to negotiate
lower wholesale prices while sharing the transport costs of ALTOE's truck. They also hoped to connect
with additional burgeoning groups who expressed desire to form buying clubs in other low income
neighborhoods.
After discussing the idea over lunch in the Reading Terminal Market's Food Court, Pierson lamented that
while demand for locally-grown products continued to grow, the supply of products from the patchwork
of farmers bringing food into the city was not nearly enough. Pierson began to describe the fragmented
and inefficient way local farm products were getting to the city and how these inefficiencies lead to
higher costs for local products. After pondering the problem for a moment, the group began to
hypothesize that an adaptation of the ALTOE/EPRA idea for consolidation could be applied to potentially
solve regional distribution inefficiencies. It was here that the idea for the Common Market was born.
Following this inspiring meeting, the Pennsylvania Department of Community and Economic
Development with partnering state agencies announced that the Commonwealth Financing Authority
had approved guidelines and had begun accepting applications for the First Industries Fund aimed at
strengthening Pennsylvania’s agriculture and tourism industries. With the knowledge that the
agriculture program was to focus on businesses and non-profit organizations that undertake projects
relating to the promotion and development of agriculture within Pennsylvania, participants of this early
meeting saw this as an opportunity to prove the viability of their budding idea. The First Industries Fund
has specific agricultural and agriculture-related areas of focus that include "…the sale of farm
commodities at wholesale; the sale of farm commodities at retail by urban and rural supermarkets
located in underserved areas; farmers’ markets" and committed to providing grants to fund
predevelopment and feasibility studies. With the right mix of organizations and individuals active in the
Philadelphia access and education movements around local food, the original vision developed into a
First Industries Proposal that was funded to produce this study.
The alliance of businesses and organizations that have come together for this project are driven by the
shared goals of increasing the market for locally-produced farm products and improving the food
security of Philadelphians. The groups have a history of collaboration on projects designed to achieve
these goals. Collectively, the partners account for a significant portion of all locally grown agricultural
food products that currently come to market in the region. Through their support and operation of
outdoor farmers' markets, community supported agriculture (CSA) subscriptions, retail food
cooperatives, and buying clubs; creation and distribution of local agriculture products and guidebook;
and the creation and application of school curricula, the partners have been instrumental in raising
23 Introduction THE COMMON MARKET FEASIBILTY STUDY
awareness about the health, environmental and economic benefits of locally grown agricultural food
products and in bringing them to market. Two of the partners helped to create and launch the "Buy
Fresh, Buy Local" campaign for Southeast Pennsylvania.
The project partners, all Pennsylvania entities, are:
• 3002 CBMoore LLC, the private owner and developer of the Eastern Loft Building which was the
proposed site for the Common Market food distribution center and applicant of record to the
PADCED's First Industries Grant Program,
• Amsterdam Produce Enterprise, works with farms and farmers to enhance local food systems;
private sector wholesale produce broker and sales agent for local farmers; owner has 22 years
of experience in this field,
• East Park Revitalization Alliance (EPRA), a nonprofit organization dedicated to revitalizing the
low-income community adjacent to East Fairmount Park in the Strawberry Mansion and
Brewerytown neighborhoods. EPRA is currently coordinating efforts to open a retail food
cooperative on west Girard Avenue in north Philadelphia and is opening a food cupboard as
well,
• White Dog Community Enterprises, a nonprofit organization and its Fair Food program is
dedicated to bringing locally grown food into the Philadelphia marketplace and promoting a
humane, sustainable agriculture for the Greater Philadelphia region,
• Farm to City, a business started in 2000 connects farmers and urban customers year-round
through farmers' markets, CSAs, and a local farm products buying club called Winter Harvest,
• Mariposa Co-op, a food cooperative active for 34 years in West Philadelphia, has 400 members,
• Swarthmore Co-op, a food cooperative with 800 members has served the Swarthmore area
since 1937. The Co-op recently doubled its retail space and is a key component of the
Swarthmore business district's revitalization project,
• Urban Nutrition Initiative, part of the University of Pennsylvania's Center for Community
Partnerships, has taught nutrition and urban farming in Philadelphia public schools since 1999,
• Weavers Way Co-op, a food cooperative with 3000 members serving the Mount Airy, Chestnut
Hill and Germantown communities in Northwest Philadelphia for over 30 years.
Project partners, individually or collectively:
• Represent over $2,000,000 in purchasing power that can be directed to locally-produced
agricultural products,
• Own a warehouse facility that is suitable in size and zoning designation for a distribution center,
• Work directly with dozens of farmers throughout the region,

24 Introduction THE COMMON MARKET FEASIBILTY STUDY
• Have access to many other farmers who can supply the proposed center,
• Have the mission and capacity to promote and market the proposed distribution center to many
potential buyers,
• Operate programming designed to facilitate local agricultural purchasing at both retail and
wholesale quantities.
As a project team focusing on the demand side of the industry with strong connections to the local
supply side, the partners are unrivaled in these qualifications in Southeastern Pennsylvania.
Study Team
The study team for this project was comprised of a combination of project partner organizations and
outside consultants with skills specific to the detailed scopes of work derived from the group's original
DCED proposal. The tasks were grouped into the following categories:
• Feasibility Study: Supply and demand study and analysis as well as research into the proposed
business model,
• Facility Design: Architectural and engineering conceptual plans. Evaluation of proposed facility
and recommendations for project location,
• Entity Formation: Legal and accounting reviews and recommendations,
• Business Planning: Crafting the roadmap for the project once deemed financially feasible.
The individuals and organizations that were hired under contract with the applicant of record and
grantee, 3002 CBMoore LLC, are listed below along with their primary duties:
• A.P.E. Inc.: Wholesale distribution consultant services,
• Continuum Architecture and Design: Facility feasibility and design as described above,
• East Park Revitalization Alliance (EPRA): Business plan and feasibility study coordination, EPRA
also hired the law firm Spector, Gadon, and Rosen, P.C. for legal and tax accounting
recommendations toward entity formation,
• Robert Pierson: Supply and demand survey coordination and the environmental impact
assessment which was assisted, under sub-contract, by SILPA, Inc.,
• Lee Sargard: Business plan and feasibility study review, data compilation and final presentation
preparation.
25 Introduction THE COMMON MARKET FEASIBILTY STUDY
Study Goals
The stated goal of the Common Market application to the Pennsylvania Department of Community and
Economic Development (DCED) "First Industries" grant program was: "To create a business plan for a
local agricultural products distribution center with retail and food processing elements in Philadelphia
that will be implemented by project partners."
The above goal was achieved by the following specific activities as outlined in our original DCED First
Industries Application:
• Study the feasibility of a local agricultural products distribution center in the Brewerytown
section of Philadelphia to be located in a building owned by a project partner; the feasibility
study will include a food co-op, other retail outlets and value-added food processing businesses
in the same building as the distribution center,
• Refine the concept based on the feasibility study,
• Prepare a conceptual architectural and engineering design for the facility,
• Prepare legal and accounting recommendations for the business structure,
• Create a business plan.
The following is a list of ancillary goals related to this study and the creation of the Common Market:
• Promote and develop agriculture in Southeastern Pennsylvania by the construction and
operation of a locally grown agricultural products distribution center,
• Increase sales of regionally grown agricultural food products within the Philadelphia
metropolitan area,
• Improve food security in the Philadelphia region,
• Operate the distribution center after its startup phase without public or private subsidy,
• Job creation in both the rural and urban communities of Philadelphia,
• Catalyze the revitalization of low income urban neighborhoods through food,
• Increase the access to locally grown agricultural products in a low income urban neighborhood,
• Stimulate the formation of food cooperatives and buying clubs supplied by the distribution
center,
• Catalyze the development of entrepreneurial enterprises related to food processing.
26 Introduction THE COMMON MARKET FEASIBILTY STUDY
By creating the distribution infrastructure to better connect the consumptive needs of urban
communities with the production and sales needs of the rural farm community, the market demand for
locally grown products will have the means by which to grow. The distribution center will facilitate an
increase in demand for locally grown food products due to increased convenience in ordering, sourcing
and delivery. This in turn will:
• Increase the economic viability of the farms in the region who fill orders for the Common
Market,
• Help to stabilize individual farm and regional agricultural economy directly and indirectly by
increased business with agricultural service industries,
• Prevent loss of farmland to suburban residential and commercial development,
• Preserve the rural cultures upon which agricultural production depends.

27 Comparable Local Food Distribution Centers THE COMMON MARKET FEASIBILTY STUDY
Comparable Local Food Distribution Centers
Background
The value proposition of the Common Market model was drawn from the project partners' perception
of need and gaps in service within the market for locally grown food. The model design was originally
constructed based on academic research into the "best practices" of commodity logistics coupled with
the group's social mission. To better understand the applied practice and economics of the proposed
model, benchmarking interviews were conducted with a concentration on operational questions. A
separate product pricing study of comparable mission-based distributors was performed as well. The
following two studies allowed the project partners to better define the Common Market and translate
some of its hypothetical constructs into a stronger working model.
Defining the Business
The Common Market will be a distributor of locally and regionally produced foods and will source
its product directly from local and regional farms in a “market-ready” form or in raw form that it
will process into a market-ready product. This business model differentiates itself from other
traditional food distributors in that the emphasis is on dealing directly with regional farmers and
specializing in the distribution of their products thereby eliminating the various intermediaries
typically present in the conventional food distribution chain2. In addition, the Common Market
business model will be driven by values that place farmer representation and fairness to producers
first. This model allows the regional farmer to participate in the wholesale trade in a manner that
will optimize his or her economic benefit by maximizing the prices received for their products
while minimizing their logistics and sales resource requirements (both of which constitute
significant and often overlooked costs of selling wholesale).
The Common Market’s business operations will be defined by its client base and the services
provided to those clients. Generally speaking the market area is the greater Philadelphia region
however this will eventually be refined by constraints based on (1) scale (i.e., the capitalized
infrastructure of the business), (2) size (i.e., the volume of business it intends to pursue) and
transportation costs (3). Any of these is a potentially limiting factor in determining (a) the client
base and (b) the market area.
Definitions
The Common Market study team defines a “distributor” as: a firm at the receiving end of the
marketing system, usually a wholesaler, which supplies produce to retail, foodservice outlets
and/or to jobbers. (Refer to Appendix A, “Terminology.”) A distributor is typically characterized by
the following:
• short lead times for deliveries,
2 The term “conventional” as used in this context refers to the common trade description of the food distribution
chain and is not to be confused with the counterpoint to “organic” food.
28 Comparable Local Food Distribution Centers THE COMMON MARKET FEASIBILTY STUDY
• ability to fulfill orders “off-the-shelf”,
• fulfill smaller orders (based on quantity & dollar value),
• frequent deliveries,
• wide and varied customer base.
A further distinction can be made between a shipping-point distributor and a market-based
distributor.3 Simply stated a “shipping-point” distributor is physically based or originates its
deliveries in proximity to its suppliers. A “market-based distributor” is physically based in the
market area it serves, regardless of the where its product originates. In industry terms, the
“shipping-point distributor” acts more like a “shipper” where the “market-based distributor” is
more likely to be a “receiver.” These differences are significant in defining the business operations
and it is logistics (a measure of time and distance constraints) that distinguishes the two. The
Common Market will be a market-based distributor and will receive product from local and
regional farms for further distribution to its customer base.
Comparable Businesses
Similar Operations
A search was conducted to identify business operations that were similar in scope and mission to
The Common Market. The primary purpose was to (1) see if anyone else, anywhere, was doing
something similar and (2) if so, to gain understanding of what they were doing, to learn from their
experience and apply it to the Common Market business model. A second was to identify the
various infrastructure components necessary to start up and operate the business. Finally it was
important to see how similar operations worked directly with farmers and to be able to address
important issues in the development of the business model and subsequent recruitment of farmer
suppliers.
Once identified, an effort would be made to contact a select few in order gain understanding about
how those businesses operated.
Methodology
The criteria for a similar operation were (1) it is a food distribution business that specializes in
selling and distributing food produced on local or regional farms and, preferably, (2) it is located
geographically within the heart of the market it serves. Web search, word of mouth, industry
experience were the primary methods used to identify similar operations.
The following key word combinations for the web search:
• farm based food distribution,
• local farm based food distribution,
• distributors of farm based food,
• distributors of locally produced food,
3 “shipping-point distributor” and “market-based distributor” are the author’s terms
29 Comparable Local Food Distribution Centers THE COMMON MARKET FEASIBILTY STUDY
• distribution centers for locally produced food,
• local food distribution centers,
• food distribution centers,
• farmer cooperatives,
• farmer cooperatives distribution sale.
Results
Few operations were identified that met the specific criteria for a “similar operation.” There were a
couple notable exceptions, with whom further contact may be worthwhile. Several businesses were
identified that act as farmers’ agents, sell into a specific market area (or areas) and distribute the
products directly to end users.
The following are notable results of the web-search:
1. Black River Produce, Proctersville, VT
Started in 1978, delivering fresh, local produce to local restaurants in the Proctorsville area.
Since then, BRP has slowly grown to where it now distributes throughout Vermont and into
parts of western New Hampshire, northern Massachusetts, and eastern New York. Black
River Produce has a central warehouse, trucking center, and retail store. It has x
refrigerated trucks that deliver at least x days a week. Black River Produce distributes local
foods such as Grafton Cheese, Cold Valley apples, and Butter and Cheese produced in
Vermont. However, especially in the non-growing season, they rely on buying produce from
markets in California and Boston. BRP buys all of its fish and seafood from the Boston
market.
2. Home Grown Wisconsin; Madison , WI
Started in 1996, Home Grown Wisconsin is a cooperative of 25 family farms. The farms
range in size from a few to over 100 acres and work together to distribute organic food
products to restaurants in Chicago, Milwaukee, and Madison. Co-op members grow over
400 varieties of fruit and vegetables, including heirloom varieties. The co-op sells fresh
produce, eggs, organic beef, chicken, lamb and flowers. Although many farmers within the
cooperative have been certified organic for years, in 2005 it was decided that all coop
members must be certified.
3. Coop Partners Warehouse; Minneapolis, MN
Coop Partners Warehouse sells perishable grocery items to co-ops and restaurants from
Duluth, to the Twin Cities, LaCrosse and Milwaukee. In sourcing product, it actively seeks
local producers and quality-conscious growers who exhibit genuine commitment to the
land and to organic principles. According to its mission statement, Coop Partners
Warehouse is committed to fostering sustainable farming practices and organic agriculture
by supporting local producers, small farmers, and family farms.
4. Local Harvest; Kansas City, MO
A wholesale and retail "corner" grocer with three locations in Kansas City, Local Harvest
offers farm fresh and locally grown organic/sustainably grown food with an emphasis on
heirloom veggies and heritage meats. Its newest location has a cafe/deli for those who want
or need good food quickly or to sit and eat in a space created for the community. Also offer
30 Comparable Local Food Distribution Centers THE COMMON MARKET FEASIBILTY STUDY
their version of a multifarmer CSA. Local Harvest in Kansas City is not affiliated with
LocalHarvest.org.
5. Vermont Quality Meats Cooperative; North Claredon, VT
Vermont Quality Meats is a cooperative of farmers offering lamb, goat, pork, and other
products from animals grown on small family farms and fed primarily on milk and grain.
They are processed at a USDA inspected slaughterhouse and supplied fresh to customers.
The cooperative delivers weekly with its own trucks to VT, ME, MA, CT, and NY.
6. Carolina Organic Growers, Inc.; Asheville, NC
Carolina Organic Growers, Inc. is a farmers’ cooperative made up of small family farms
located in North Carolina. COG serves restaurants, grocers, buying clubs, festivals and
conferences, offering exceptional variety, professional sales, and dependable delivery.
7. Tuscarora Organics Growers; Hustontown, PA
TOG works with over twenty producers and ships tens of thousands of cases of produce
annually. The product is consolidated and shipped from its warehouse facility in Fulton
County, PA. The primary market for TOG is the Washington, D.C. metro area.
Four of these businesses were contacted. Using an open-ended interview format, the following
information was gathered to create profiles of those operations:
• mission, goals, values,
• form of ownership,
• size and type of facility,
• area served,
• type of customer served,
• size of farms served,
• revenue sources,
• invoicing and payment policies,
• contracts,
• use of technology in operations, sales, delivery,
• product offerings,
• annual sales (ask for annual budget if non-profit corporation),
• margin (markup policies),
• operational cost elements and percent of budget,
• maintenance of farm identity,
• quality control,
• ordering systems,
• delivery systems,
• barriers, problems.
Summaries of the interviews follow in Appendix B.

31 Comparable Local Food Distribution Centers THE COMMON MARKET FEASIBILTY STUDY
Conclusions
Few businesses exist that are similar in scope and mission to the Common Market. However there
is much discussion regarding the need for such enterprises from a wide variety of organizations
involved in progressive agriculture and food security issues, projects associated with various non-
profits (some within local or state government) and institutions of higher learning and rural
coalitions. There are also several attempts to form “virtual” or on-line food distribution networks
to promote local markets for local growers which leave the actual physical aspects (i.e., the logistics,
sales and management) up to the suppliers and buyers. Nevertheless, the information collected in
the interviews provides important insight into the requirements necessary for the start-up of The
Common Market.
Estimated Mark-up of Farmer Goods
Methodology
To understand the expected mark-up of farmer goods for the Common Market Project, additional and
follow-up interviews of similar operations were conducted. The experiences of other local food
distribution organizations, primarily with 501©3 status like the Common Market may become, provide
examples of effective price setting to sustain viable food distribution for local markets.
The criteria for a similar operation, as defined by this study, is a food distribution business that:
• specializes in selling and distributing food produced on local or regional farms,
• is located geographically within the heart of the market it serves.
Interviewees
The following organizations were interviewed, followed by brief descriptions of their businesses.
Interview transcripts are available in Appendix D. Identifications of operations have been made
anonymous for confidentiality purposes.
1. OPERATION E
Started to deliver local produce to restaurants in a city, the operation has gradually grown to
distribute throughout parts of New England. It distributes local foods, however, especially in the
non-growing season, it rely on buying produce from markets in other parts of the country to
remain competitive year round.
2. OPERATION A
The operation is a nonprofit organization that connects local farmers with markets by opening
sales channels for locally produced food. They act as a sales agent for several grower-packers of
fresh fruit and vegetables who are based primarily in New England.
3. OPERATION C
The operation is a cooperative of meat producers. It is a marketing and distribution cooperative
serving primarily restaurants in several urban areas.
32 Comparable Local Food Distribution Centers THE COMMON MARKET FEASIBILTY STUDY
4. OPERATION F
The operation originated as a program of a state-wide sustainable-agriculture nonprofit.
Recently, it has transitioned to its own LLC, buying from farmers and working with a local
produce distributor to market product to institutional buyers in the state.
5. OPERATION G and one of its retailers
The operation is a cooperative of dairy farmers that sells to distributors in a mid-Atlantic region.
The retailer sells the cooperative's products via one of their distributors. While not interviewed
for this report, both the cooperative and the retailer provided pricing information on dairy for
this report vital to the Common Market’s understanding of dairy distribution, as outlined in
Appendix A.
Interview Questions
1) How do you set your prices?
2) What is the approximate average mark-up you apply to farm products you purchase?
3) How flexible is this mark-up?
4) Once fixed costs are applied, what is your approximate net profit margin?
5) Does mark-up vary depending on growing methods? For example, if you distribute both
Certified Organic and conventional produce, do you mark them up the same?
6) Do you add fuel surcharges to your deliveries, or is delivery cost built in to the price for your
customers?
7) What is your minimum order for delivery?
8) Do you offer volume discounts?
9) What are your payment terms?
Quantitative Results
1. How do you set your prices?
Of the five interviewees, all set their prices to ensure that they break even at year’s end with no
specific net profit margin sought. Two of these use a specific mark-up percentage, derived from
a formula that accounts for their fixed costs, to reach their breakeven point, while the other two
rely on experience and market factors to evaluate mark-up, adjusting mark-up amounts on a
product-by-product basis.
2. What is the approximate average mark-up you apply to farm products you purchase?
Mark-up percentages varied for each distribution business based on the fixed costs for each
business. Variance on these numbers is consistent with the fact that each of these operations is
structured slightly differently, which affects the quantity of fixed cost they incur and the dollar
amount of mark-up, as each seeks to break even as their sales goal.
3. How flexible is this mark-up?
75% of the interviewees confirmed mark-up flexibility on a per product basis to some extent.
One of these identified a range of 8% depending on the item, though they have an end number
that is generally sought, while the other two said the flexibility is solely dependent on market
demand for that item.
4. Once fixed costs are applied, what is your approximate net profit margin?
33 Comparable Local Food Distribution Centers THE COMMON MARKET FEASIBILTY STUDY
100% of those interviewed did not offer a specific net profit margin percentage, as each
interviewee stressed that breaking even is challenge enough for local food distribution models.
One interviewee with non-profit status confirmed a loss each year since inception, which is
supplemented by private grants to keep the business functioning.
5. Does mark-up vary depending on growing methods? For example, if you distribute both Certified
Organic and conventional produce, do you mark them up the same?
Of the 3 responses to this question, one distributor said ‘No, there is no noticeable variance
based on growing method.’ One other specified that mark-up varies more on quality and
availability than on growing method. The third respondent stated that Certified Organic
produce merits a higher mark-up in his business, as he throws more organic product away,
based on its shorter shelf life.
6. Do you add fuel surcharges to your deliveries, or is delivery cost built in to the price for your
customers?
50% of those interviewed are not responsible for the actual delivery. Of the other two
interviewees, one did and one did not include a delivery charge to account for fuel. The lone
fuel surcharge from the sample group was $8.50/stop, and this distributor indicated that some
buyers refuse to pay the surcharge.
7. What is your minimum order for delivery?
75% of interviewees did not have specific minimums. For each, in cases when delivery is clearly
inefficient, they request to add more to the sale. The one operation’s minimum order was $50.
100% established that they are willing to deliver small amounts to regular customers who
typically place large orders.
8. Do you offer volume discounts?
One interviewee of three that answered this question offers a volume discount totaling 3% for
annual purchases over $200,000/yr.
9. What are your payment terms?
Of the three respondents to this question, two operate on a net 30-day schedule and the other
on net 14. Each acknowledged that the average customer pays less frequently, ranging from 35-
60 days to remit payment.
Qualitative Analysis
1. Each business was slightly different in its design and mission. Two of the respondents identified
their operations as “mission-driven,” indicating that obtaining fair prices for farmers was their
primary goal, as long as they can sustain their businesses by breaking even on a yearly basis.
2. As each business is different, fixed costs (and subsequently the mark-up required to cover them)
varied. For OPERATION A, fixed costs were approximately 10% of revenue, as this operation
brokers deals without the cost of actual delivery, which is the responsibility of the producer.
Comparatively, OPERATION C was around 30%, including delivery, marketing, and processing
costs for the meat product. In addition, interviewees did not specify how much return on
investment is calculated into their fixed costs.
3. Price flexibility was a common theme among all the interviewees. Their businesses do not
operate by applying a flat mark-up to each purchase to attain a specific net profit margin.

34 THE COMMON MARKET FEASIBILTY STUDY
Instead, as one respondent described, “you have to tug and pull for profit where you can, but it
is hard in the produce world.”
4. Experience has a prevailing theme in each of the interviews, with respondents acknowledging
that they price certain products based largely on what they have learned as players in the food
distribution industry.
Dairy Pricing Analysis
Please see Appendix C for information regarding dairy pricing.
Interview Transcripts for Estimated Product Mark-ups
Please see Appendix D for to review the interview transcripts. The transcripts have been made
anonymous at the request of interview participants.
35 Demand Analysis THE COMMON MARKET FEASIBILTY STUDY
Demand Analysis
Methodology
Prospective customers for the Common Market were identified and categorized by type. Three
general categories were identified: 1) retailers, 2) retail food service, and 3) non-retail food service. The
general categories were sub-divided further into six prospective customer types: food co-ops and
grocery stores in the general retail category; restaurants and coffee shops in the retail food service
sector; and, institutions and caterers in the non-retail food service sector. Once identified, panels of 2
to 3 individuals were assembled from each of the six sectors. Each individual panel was interviewed by a
team from the project using a questionnaire consisting of 35 questions. The same questionnaire was
used for each panel. The interview teams were comprised of 2 or 3 interviewers and a scribe.
The survey questionnaire was designed to ascertain the following information from the panels:
• Descriptions of how their businesses operate, including core values,
• Purchasing and replenishment processes, including factors involved in purchasing decisions,
choosing suppliers, the mechanics of ordering and product delivery, and billing,
• Products (local) they use and those they would be interested in using, including quality and
packaging requirements,
• Demographics of their customers,
• Barriers to purchasing locally produced foods and the value components (if any) that enter into
sourcing decisions.
A review of the panel interviews reveals significant opportunity for the Common Market. The data
provides a fairly clear indication of how the Common Market should prioritize targeting customer
prospects. In addition the panel interviews provide insight into the local products and services
prospective customers have strong interest in. Additional and follow-up interviews were conducted to
estimate potential revenues associated with operating the proposed Common Market business model
for financial planning. Finally, the interview data provides useful instruction regarding ways the
Common Market can enhance its value proposition with prospective customers through its day-to-day
operations and conduct of customer service.
Summary of Survey Responses
Operations
Operations for four of the respondent groups (grocery stores, food coops, restaurants and coffee shops)
follow a fairly regular routine that may vary depending on the day of the week but repeat with weekly
regularity. There is greater day-to-day and seasonal variation for caterers. Since the institutional

36 Demand Analysis THE COMMON MARKET FEASIBILTY STUDY
respondents were less involved in operations, it was difficult to ascertain this information. Typically,
mornings are busy with receiving deliveries and preparation work which included meal prep at
restaurants and coffee shops and set-up for grocers and food coops. Ordering is done in the afternoon.
The big operational problems are congestion due to space limitations (for storage and work, often
compounded by several orders arriving at once) and ongoing personnel challenges (short staffing
resulting from various factors). No-shows or late arrivals of deliveries and staff aggravate problems.
Almost all the individual respondents indicated the things they enjoy most about their jobs and or
businesses were the things they rarely had the opportunity to do. All indicated a strong desire to grow
their businesses through strong relationships with suppliers who provide the highest quality. There was
also consensus that increasing the selection of local product would help achieve these goals.
Reducing deliveries by increasing the volume and variety of business with individual vendors would ease
many of the day-to-day operational challenges mentioned above. Individual vendors can also ease
operational challenges by being timely in their deliveries, timing communication to less-busy times of
the day and understanding the daily work routine in order to ensure the customer is ready to order
when they call.
Purchasing & Replenishment Process
The salient points are (for specific details refer to the individual panel summaries in Appendix E):
• Without exception, there is a heavy reliance on telephone communication. While some of the
individual respondents like the convenience of computer-based transactions and
communications such as email, they all value the personal communication that happens with
telephone interaction. There is only a limited amount of computer generated ordering,
• There is a strong tendency towards just-in-time delivery with very short lead time (in fact, all
indicated a desire (if not need) to order on a next-day-delivery basis) due to:
o Space constraints,
o Unpredictability of their businesses,
• Respondents indicated a strong preference for delivery (as opposed to picking up at a
warehouse or other location). There is universal acceptance of minimum orders and pretty
consistently the respondents prefer a dollar minimum (which ranged from $100 - $125, mostly
at $100) to a case minimum. The argument against case minimums seemed to be based on
need to break cases (i.e., order partial cases) which seemed difficult to achieve with existing
suppliers. Some respondents indicated a willingness to either “plus-up” to meet minimums or
pick-up at warehouse if delivery minimums could not be met.
In addition, respondents indicated a strong preference for frequent deliveries (ranging from 2 or
3 per week to daily) and early-in-the-day deliveries (all indicated the earlier the better with
times ranging from 4:30 to 9:30 a.m.),
• Communication is extremely important. Most respondents indicated a preference to be called
by their suppliers and several voiced concern that not enough farmers called on a consistent
basis. There is a strong need for frequent information updates regarding availability with
adequate lead time. This refers both to items becoming available (or not) and when there are
gaps or temporary shortages that will affect individual deliveries,
37 Demand Analysis THE COMMON MARKET FEASIBILTY STUDY
• Regarding the billing process, three key points were fairly consistent among the respondents:
o Prefer invoice to accompany delivery,
o Generally want a separate packing slip (bill of lading) to accompany delivery,
o Generally want a consolidated invoice with weekly or monthly statement summaries.
• The respondents consistently rank the following (in the order shown) as the most important
factors in working with a vendor:
o Quality of product and service,
o Ethics/principles of supplier/relationship,
o Price.
The only exception was the institutional respondents who ranked price as the single most
important factor in choosing a vendor.
The respondents were also asked about the number of suppliers they had. The numbers varied with the
size and type of the business and ranged from less than 10 to several hundred.
Finally, there was general consensus that working with a supplier on a year-round basis was important
to maintaining and growing the relationship and therefore was preferable to seasonal relationships. The
responses indicated a strong interest in a one-stop business that, in addition to supplying a variety of
different locally produced food products, could also source out of season products and products not
produced locally from family farm producers and fair trade sources.
Products
There was a strong interest among the respondents for a “clearinghouse” type supplier for “all locally
available” products. For larger operations (e.g. Whole Foods) anything different from what is going
through their warehouse is interesting. Specifically, respondents listed the following as locally produced
farm products they would be interested in purchasing:
• Produce:
o Fresh fruits and vegetables,
o Frozen (tentative interest in some specialty items such as berries or tomato puree).
• Dairy, including:
o Cheese,
o Yogurt,
o Butter,
o Fluid milk.
• Meats:
o Raw cuts, fresh and frozen,
o Cold cuts,
o Sausages & pates.
• Cider and juices,
• Maple syrup and honey,
• Baked goods.
38 Demand Analysis THE COMMON MARKET FEASIBILTY STUDY
Respondents indicated a strong preference for local over organic with certain conditions. There was a
stated preference meat and poultry that is pastured, raised without antibiotics and not produced on
factory farms. There was also a stated preference for dry aged beef and for more goat products.
Regarding pack and packaging responses varied depending on the type of business. For example,
grocery stores and food co-ops had some interest in consumer or retail packs and frozen meat for re-
sell. Restaurants had little or no interest in either and want freshly butchered meat. Institutional buyers
wanted portion-packed meat (and dairy and produce in the case of the elder facility). Respondents
generally wanted product packed and graded to industry standards with caterers, coffee shops,
restaurants, and institutions looking to minimize any excessive packaging and retail-oriented additions
(i.e., PLU stickers on produce). Without exception, every respondent indicated they were either looking
for the highest quality available or, in the case of the institutional respondents, the highest quality
available for the price they were paying.
Demographics of Customers
The customer base of prospective Common Market customers tended toward an educated, higher
income demographic, with the exception of the elder care facility (whose clients tended to be poor,
inner-city residents). Restaurant clientele varied by business from “young, hip” (with racial and ethnic
diversity) to very high income. One caterer indicated a heavy tendency toward wealthy clientele.
Coffee shops and food coops tended to reflect whatever ethnic and socio-economic demographic
diversity exists in the neighborhoods within which they are located. Grocers tend to serve clientele that
can afford to shop at their stores.
Barriers and Value Components
When asked rank the value of local, organic, conventionally produced farm products, respondents (with
the exception of the institutional respondents) valued locally produced first, with a slight preference for
local organic or locally “responsibly produced.”
With the exception of the institutional respondents, all indicated they purchased locally produced farm
foods. (The institutional respondents indicated, for example they purchased milk from Wawa however
it is not verified that Wawa’s milk actually originates entirely from local dairy farms although it is a
locally based business.) Locally produced products included: dairy, milk, yogurt, eggs, maple syrup,
honey, produce, bread, tofu, sauerkraut, salsa, ice cream, meats, other bakery items, turkey, ham,
bacon, and cheese.
Respondents considered farm or producer identity important. All (with exception of the institutional
respondents) were personally interested. Grocers and food co-ops felt it was important to their
customers and would welcome any point of purchases (p.o.p.) material. Others stressed the importance
of farm and producer identity as a way of engaging their staff in the source of food they purchased.
Barriers to purchasing more local product were consistent among respondents. All indicated a lack of a
good distribution network, inconvenience, difficulty in procuring consistent supply and quality, inability
to get everyday deliveries, lack of knowledge about what is produced and when it is available (and the
time constraint to find out), and seasonal limitations. They only respondent who indicated that local

39 Demand Analysis THE COMMON MARKET FEASIBILTY STUDY
producers and suppliers lacked the size, scale or sophistication to work with them were the institutional
respondents.
Conclusions
Survey results indicate an excellent opportunity for a business like the Common Market. Respondents
universally expressed a strong interest in a service-oriented distributor that specialized in a variety of
locally produced agricultural food products. The survey panel results demonstrate there is unmet
demand for both products and services of the Common Market in the Philadelphia area. In addition, the
results provide a clear picture of the type of services and product lines potential customers want and
therefore will help shape the operating model for the business.
Based on the survey responses, the Common Market’s value proposition for prospective customers
should be to provide frequent deliveries of diversified products of consistent and excellent quality.
While products will necessarily have to be competitively price, they will also be differentiated by their
origin and therefore capable of commanding a modest premium when coupled with service. Service
and product combined are what will bring the market premium.
Successfully meeting this unique selling proposition will significantly impact Common Market
operations. The business will require facilities and knowledge to handle a diversified product line. In
addition, due to the stated needs for frequent delivery, the business will be forced to maintain an
inventory against prospective sales and therefore not source product on a “pre-sold” basis once it
reaches significant scale. In turn, this exposes the business to increased risk for unsold product and
therefore requires a suitable product mark-up to cover shrink.
Product Lines
Potential product lines for the Common Market include locally farmed:
• fresh produce (fruits and vegetables),
• dairy (cheese, yogurt and other market-ready items such as fluid milk and butter),
• meats of all kinds (fresh and frozen),
• honey and maple syrup,
• cider and juices.
Within these general categories opportunities may exist for value added products such as locally
produced frozen produce items and baked goods. Further exploration of producer capabilities for
products is necessary to determine if there are worthwhile opportunities for the Common Market to
engage in various value-added enterprises in order to make certain locally produced agricultural
products market-ready. Examples include dairy processing for fluid milk and by-products, butchering for
locally raised meats and a freezing operation.
40 Demand Analysis THE COMMON MARKET FEASIBILTY STUDY
Finally, based on panel responses, the Common Market should explore possibilities to provide a full-
service product line on a year-round basis. This would necessitate sourcing certain products directly
from farmers and producers from outside the region that share core values with the Common Market’s
local producers and produce items that are either contra-seasonal to the local season or are not
produced locally. In addition, there was a stated interest in demand for fair-traded products such as
coffee and chocolate.
Operations
To meet the product and service demands of prospective customers, Common Market will require a
facility to receive, store, prepare, and ship products; trucks to deliver (and possibly pickup from farms)
products; and a staff for logistics (for all trucking and internal handling), sales and management.
On the logistics side, the business will have to be equipped to meet the demands of frequent and timely
delivery. This may require more than one truck, depending on the size of the customer base, where
they are located and the size of orders.
Sales will require adequate staffing to maintain regular, consistent, informed contact with the customer
base while prospecting for new customers. In addition, information from producers will have to find its
way to the sales staff in an expeditious manner.
Prospective Customers
Food cooperatives and grocers are the optimal target customer for the Common Market. This is due to
the potential volume, product diversity, delivery and service demands they would require. Within this
group, food cooperatives represent the best fit for the Common Market due to shared values and the
potential to reach consumers with the “buy local” message.
Restaurants and coffee shops are also prospective customers. Restaurants are extremely needy in the
area of service and somewhat capricious in their ordering. While seeming to represent a good
opportunity for the Common Market, attention must be paid to the amount of service required to
supply them. On the other hand, coffee shops seem to require less attention despite similarities in their
operations.
Caterers due to their very nature should not be considered as part of a prospective core customer base.
While it won’t hurt to develop relationships with caterers and maintain contact with them,
opportunities will be ad hoc.
The best opportunities with institutions will be with those institution serving clients with high enough
incomes to permit purchasing decisions to place value on locally produced food before price. Mission-
driven institutions that make budgetary provisions to accommodate those values, while not necessarily
serving the demographic that can readily afford it, should also be targeted.
41 Supply Analysis THE COMMON MARKET FEASIBILTY STUDY
Supply Analysis
Methodology
Prospective farmer suppliers for the Common Market were identified and categorized by type. Three
general categories were identified: 1) fruit and vegetable growers, 2) dairy farmers, and 3) meat
producers. The fruit and vegetable category was sub-divided between the two and interviewed
separately. Once identified, panels of 3 to 5 individuals were assembled from each of the four groups.
Panel interviews were conducted by the project team using a questionnaire consisting of thirty-two
questions. The same questionnaire was used for each panel, with modifications made regarding
relevance to the different types of farming operations present. The interview teams were comprised of
3 or 5 interviewers and a scribe.
The survey questionnaire was designed to ascertain the following information from the participants:
• Descriptions of their farming operations, including ownership, capacity, farming experience, and
basic farming practices,
• Products produced on the farm, wholesale market readiness, potential or interest in producing
new or different products,
• Current sales and marketing practices and experience and/or barriers to participating in the
wholesale trade,
• Interest in working with a business like the Common Market model.
Summary of Survey Responses
Descriptions of Farming Operations (Questions 1 – 7)
A total of 15 respondents participated in the four panels. Of the fifteen, 13 were farmers. The
remaining two represented businesses that served as marketing and sales organizations for producers.
In the case of vegetables, the one participant does the sales and marketing for a growers’ cooperative.
In the case of dairy, the one participant is the sales and marketing person for a business that works with
many organic dairy farmers and coordinates the processing of their milk, which is then sold under the
business’ brand. Of the thirteen farmer respondents on the panel, all were full time farmers with the
exception of one meat producer. Additionally, nearly every farmer was a generational farmer, that is,
they grew up on farms, had relatives that farmed or had been involved in farming in some way all their
lives. The respondents represented farms from Pennsylvania (Berks, Columbia, Cumberland, Lancaster,
Lebanon, Northumberland counties), Maryland (Baltimore county) and New Jersey (Salem county).
Farms ranged in size from 6 to 900 acres. The vegetable farms ranged from small (6 acres) to larger
operations of 120 acres. Tree fruit farms tend to be larger due to the space required in traditional
orchard practices and the panelists operations ranged from 110 to 900 acres. With meat producers

42 Supply Analysis THE COMMON MARKET FEASIBILTY STUDY
there was also a large range of land used depending on the size (output) and cultural practices.
Pasturing requires more land than a confinement operation and all the participants grazed their animals
to some degree. Meat producers’ farms ranged from 27 to more than 250 acres. The two farmer
participants on the dairy panel have farms of 110 and 300 acres. While interesting in terms of land use,
size alone is not necessarily a good measure for describing output. (Information regarding output is
included in the next section.)
Farmers were also asked if they were farming at capacity and whether they had plans or an interest in
expanding (or contracting) their operations in the future. The question regarding capacity led to two
types of responses: one pertained to land use of their existing farms and their ability to purchase
additional property. The second type of response referred to capacity to manage more and indirectly is
indicative of scale.
Two of the three vegetable growers felt they were operating at full capacity while the third was not and
had a strong interest in shifting some of his farm resources (land and management) into more vegetable
production. With the fruit growers, they were all at full capacity regarding land use however there was
an expressed interest from two of the growers to replace processing apple production to fresh market.
Among the meat producers two were at full capacity but only one of the remaining three expressed any
plans to increase production. The two dairy farmers were at full capacity and the only possible changes
in production would involve a shift to different products or marketing channels.
Products, Volume, Market Readiness (Questions 8 – 15)
The respondents produce a wide variety of farm fresh foods and market that produce in an equally
diverse manner. With the exception of the milk processor, none of the farms sold their products
exclusively into the wholesale trade although most had some wholesale experience at varying levels of
volume. Even the cooperative, which sells exclusively into the wholesale market, has grower members
who sold some of their produce directly to consumers (hereafter referred to as “direct retail.”)
Fresh produce included a full variety of seasonally grown fruits and vegetables. This also includes a
small volume of greenhouse grown greens in the winter and some storage crops such as onions and
potatoes. Tree fruit includes sweet and tart cherries, apricots, nectarines, peaches, plums, pears, and
apples. Several to many varieties of each type of fruit is produced by the growers. In addition to
seasonally available fruit, apples are stored for sale throughout most of the year and one grower made
cider. Vegetables are too numerous to mention but are those types typically grown seasonally in the
region. With the exception of one fruit grower that produces apple cider, none of the fruit or vegetable
growers does any processing of their produce.
The dairy farmers also produced a wide range of product. One farmer specializes in raw milk aged
cheeses but also sells fresh cheeses, ricotta and yogurt. The other dairy farmer produces pasteurized-
homogenized and non-homogenized fluid milk for sale at his farm (with limited wholesale sales). This
farm also produces buttermilk but has it processed off the farm.
Livestock farmers raise a range of meat animals including chickens (broilers for meat and laying hens for
eggs), turkeys, beef cattle, pigs, lambs, and goats. Meat “products” depend on the market for which
they are prepared: most poultry is processed as whole, half or quarter birds with little or no processing
43 Supply Analysis THE COMMON MARKET FEASIBILTY STUDY
as cuts. Beef, pork, lamb and goats are generally butchered and processed into cuts with the packaging
consistent of market requirements – when sold from the farm as whole, half or quarters, the cuts are
packaged differently than when sold wholesale. All of the poultry producers butchered and processed
their animal under the farm exemption and therefore are limited to selling their product either directly
to retail customers or wholesale to restaurants. (Note: in order to package poultry for re-sale through a
retail outlet, it must be processed at a USDA licensed facility.)
With the exception of one fruit grower and the milk processor, all the farms fall into the small to
medium sized operations. At 700+ delivered truck loads per year, the one fruit grower/packer could be
considered a larger sized operation. Some farmers were very small operators selling 12 – 15 pigs per
year strictly through direct retail. Another meat producer, the largest among the respondents,
produced 400 pigs and 800 broilers per year for market.
All the farmers produced seasonally. As mentioned, apple growers offset their seasonality through cold
storage. Broiler, lamb, beef and some pork producers freeze product for off-season sales. One meat
producer indicated he is able to keep a “set” of pigs available year round for slaughter and market.
There was little discussion from the dairy producers regarding seasonality issues.
Nearly every farmer had some ability to prepare product for the wholesale market. In the case of the
vegetable growers, one indicated that he had a washing line but implied he did not have a grading line.
This might be a necessary investment if he wishes to increase his wholesale business. The cheese
producer indicated she would need a cup filler in order to pack yogurt for resale (she currently packs
yogurt in bulk that can be refilled into deli cups by a retailer) but her aged cheeses are wholesale ready.
For meat producers, access to butchers is their major requirement for entering into the wholesale
market. Cost and or access to poultry processing facilities limits the type of wholesale market their
product can be sold in. Currently, none of the panel participants sold chicken or other poultry for resale
to retail outlets.
None of the meat producers were certified organic although several practiced organic farming methods.
Most grazed their animals and avoided confinement practices. The dairy processor is a certified organic
operation and therefore all its producers are certified. In addition, the processor has a food safety
certification. One dairy farm does have a raw milk and raw milk cheese license. Both dairy farms have
processing permits and the farm bottler also has a food handling certification and a wholesale milk
license. One fruit grower has one small trial block of apples that are certified organic. The large fruit
operation has a Good Handling Practices certification through the PA Department of Agriculture. One
vegetable farmer is certified organic and the all the farms in the cooperative are certified organic.
Sales and Marketing
Respondents were asked a series of questions regarding their sales and marketing practices. They were
asked how they sell their farm produce and what type of markets they sold to (e.g., direct retail,
wholesale). They were also asked who did their sales, their experiences with different customer types,
how they arrived at pricing, did they enter into any fixed-price arrangements, do third party sales
through brokers or agents, terms of payment, the amount of time spent on sales and marketing,
importance of maintaining farm or brand identity in the marketplace, and barriers or obstacles they
44 Supply Analysis THE COMMON MARKET FEASIBILTY STUDY
confront in trying new approaches to sales (e.g., changing from direct retail to wholesale). Although
most of the farmers represented oriented their sales to direct retail, almost all had some experience in
the wholesale market.
The mechanics of sales were similar between the fruit and vegetable growers. They face fewer barriers
to transitioning between wholesale and direct retail, primarily due to the lack of regulation that is faced
by dairy and meat producers. The biggest limitations faced for fruit and vegetable growers in this
respect have to do with the size and scale of their operations. It is difficult for an operation that packs
and ships 700+ loads of fruit annually to consider direct retailing – so much of the operation’s
infrastructure is oriented to the wholesale market. Conversely, for the smaller operators making a
bigger commitment to wholesaling will require some investment in packing and grading equipment and
possibly on-farm refrigeration and refrigerated transportation.
With the exception of the cooperative and the milk processor (who act as sales agents for a group of
farmers) all of the farmers present did their own sales. Depending on the operation (regardless of the
type of operation) the time spent was minimal (several hours a week) to full time. There also was a
range of what could be described as passive sales at one extreme (on-line ordering system, newsletter)
to active sales (aggressively calling customers for orders), and everything in between. Again, this is
dependent on the size of operation (how much product needs to be sold) and the type and the
percentage of wholesale sales in the total mix.
Wholesale customer types also varied across all sectors. The large fruit producer and one vegetable
grower focused most of their wholesale efforts on warehouse accounts that were either large retailers
or wholesale distributors. Another vegetable grower sold the majority of their wholesale product
through the Vineland Auction or commission houses in the Philadelphia Regional Wholesale Market
(Terminal Market). The large dairy processor sold its milk products through distributors to various
accounts. Several of the meat producers, some of the vegetable growers and the two dairy farms did
some restaurant sales and a limited amount of small shop sales. One fruit grower and the dairy farm
processing their own milk also sold some product wholesale through the cooperative that participated
in the vegetable panel. A number of meat producers, the cheese producer and two of the fruit growers
sold product to other farm stands on a wholesale basis.
Experiences were pretty universal. Everyone expressed concerns regarding integrity and business
practices (the strongest negatives came from the fresh produce growers), credit worthiness and pay
practices, and difficulty in customer maintenance. The last being especially noted among restaurant
accounts. Telephone communication supplemented with fax and email was the standard for taking
orders and communicating with customers. A meat producer and the cooperative utilize an on-line
ordering system but not exclusively. Pay terms ranged from C.O.D. to 30 days, with most extending
terms to an average of 14 days.
Pricing also varied with sector. Fruit and vegetable growers follow a “general market” which is
determined through communication with buyers and other sellers. The farm processor sets its
wholesale milk price based on the state minimum. Meat producers tended to work off a percentage of
their retail sale price (anywhere from 10 to 25 percent less). In the fresh produce sector there was some
45 Supply Analysis THE COMMON MARKET FEASIBILTY STUDY
interest in long term fixed price arrangements but also resistance due to past experiences when market
prices fell below contract pricing. There is a strong tendency among those producers to follow the
market. However it should be noted that fruit pricing, especially for apples, tends to be stable
throughout a season compared to vegetable prices (which can be highly volatile). The same holds true
for dairy and meat and therefore there might be a stronger interest among these producers for a fixed
price arrangement that provided guaranteed volumes.
Nearly every farmer looks to maintain their name or brand in the market. The large fruit grower
indicated there are times when quality is not the best and at those times they will pack their product in
a second label in order to protect the first quality brand in the market.
Finally, respondents were questioned about barriers and obstacles they perceived in trying new
approaches to sales and marketing, especially with regard to wholesale. The following were frequently
mentioned: distance from markets, sales and marketing support (and trustworthy customers). Less
important but still significant were availability of affordable land to purchase or rent in order to expand
operations and capital. The dairy farm processor and several meat producers indicated certain
regulatory issues that would impact or inhibit their ability to move into more wholesale. In the case of
the dairy farm, it would need to have a Grade A license in order to sell across state lines. Poultry
producers would be required to have their birds processed off farm at a USDA facility in order to pack
for resale through retail outlets. Interestingly, labor, market access, and management skills or resources
did not rank as serious barriers to any of the participants.
Expectations (Questions 28 -- 32)
Respondents were asked a series of questions regarding their possible interests in working with a
distributor like the Common Market. Specifically they were directed to enumerate the type of services
that would be useful and interesting to them, payment terms, dispute resolution, ownership aspects,
and expectations from such a relationship. Almost universally, there was a strongly expressed interest
in minimizing the transportation burden of getting their goods to the Common Market. Not only are
transportation costs high, many farmers lacked the capability. (This also is a limitation in their current
marketing practices). There was a strong interest in the Common Market picking up product at the
farm. Some meat producers mentioned interest in a centralized slaughtering and butchering facility,
which would take care of the concerns regarding local facilities and the lack of USDA inspectors. There
was also interest in limited processing for value-added products, specifically a freezing operation that
could take certain fresh produce items in season and freeze for off-season sales (e.g., sweet corn).
Although not universally stated, it seemed implicit that most of the farmers would appreciate
“dedicated” and professional staff promoting and selling their product, especially in Philadelphia.
Philadelphia is recognized as a very important market (or potential market) for all the producers.
However, without exception, none cared to deliver into the city!
Payment terms ranged from 14 days to 30 days. On this point there was some discussion of ownership
or organizational structure. Among the vegetable group there was an interest in a modified model
based on the Vineland Auction where members would receive dividend checks at the end of the year
but some of that money would be held back in a sort of bond to be used as operating cash for the
46 Supply Analysis THE COMMON MARKET FEASIBILTY STUDY
business. (Since none of the other panels had participants who sold through the Vineland Auction, this
structure was not discussed in those venues.) There was not strong interest in a formal cooperative
however there was an expressed interest among all the respondents in ensuring that producers would
somehow be vested stakeholders. Transparency was a big issue.
One final note, the large milk processor expressed interest in working with the Common Market as a
distributor for its product. On the other hand, the representative from the grower-cooperative saw the
Common Market as potentially operating at cross-purposes with its business and is not sure being a
supplier to the Common Market would be in its interest.
Conclusions
The 15 panel participants clearly produce enough products between them to support a distribution
business proposed by the Common Market (in terms of product mix and volume). For the most part, the
respondents operate financially successful farms and have found ways to market that sustain them
economically. Size, scale and an interest in “direct wholesaling” indicate that sourcing adequate volumes
of product (at least in a logistically efficient manner) to support the business may present a problem for
the Common Market. Therefore, the question remains whether farmers and farming operations
represented in the panels (or similar operators) are interested or willing to change their current sales
and marketing practices and work with a distributor like the Common Market. Nevertheless,
respondents indicated an interest in working with a business like the Common Market. Key elements
for farmer participation include organizational and operational issues.
Organizationally, there is a clear desire on the part of producers to work with a wholesaler or distributor
that will provide better access to local markets and treat them in more respectful, non-exploitative
manner. Therefore, the Common Market’s value proposition for prospective suppliers should be to
provide transparency, vested interest for producers, transportation services, professional sales
representation, secure financial backing to ensure timely payment, and quick and fair dispute resolution.
Operationally, the Common Market will require a facility to receive, store, prepare, and ship products;
trucks to deliver (and possibly pickup from farms) products; and a staff for logistics (for all trucking and
internal handling), sales and management. Sales will require adequate staffing to maintain regular,
consistent, informed contact with the customer base while prospecting for new customers. Capacity to
produce certain value-added product would increase farmer interest. Specifically this would include a
USDA butchering facility with storage and freezing equipment and freezer storage for both meats and
processed produce items for out-of-season sales.
Capital will be an important component to the success of the Common Market. Appropriate
capitalization of facilities will be necessary to provide the necessary services to interest farmers and
products for customers. In addition, farmers participating in the producer panels indicated a strong
desire for fast pay. Therefore, the Common Market will require adequate access to cash to cover the
spread between fast payment terms and its receivables.
47 Supply Analysis THE COMMON MARKET FEASIBILTY STUDY
Supply Calculation and Seasonality Analysis
Summary
It is vital for the Common Market to understand the supply capacity of local production to best serve the
marketplace. To do this, research was compiled on the availability of produce, poultry, beef, and milk in
the region that will supply the Common Market.
For the purposes of this research, the fourteen closest Pennsylvania counties to Philadelphia were
identified as potential Common Market suppliers. They are: Adams, Berks, Bucks, Chester, Cumberland,
Dauphin, Delaware, Lancaster, Lebanon, Lehigh, Montgomery, Northampton, Perry, and York Counties.
When the Common Market is fully functioning, it is highly likely that supply will come from other
surrounding counties in New Jersey, Delaware, Maryland, and other Pennsylvania counties not
researched in this report.
Statistical data was gathered in two primary methods. First, Ag Census data (primarily from 2002) was
analyzed to understand total production of the products studied for the fourteen county region
surrounding Philadelphia. In addition, supplemental agricultural statistics for the entire state of PA were
incorporated in some cases.
Second, data was gathered from both the Penn St. University Ag Map and Fair Food Project databases.
The PSU Ag Map is an online agricultural directory for all of Pennsylvania. This directory connects farms
to the general public by providing free, searchable listings that describe each farm and the services and
products they provide. The Fair Food Project, a program of the nonprofit White Dog Community
Enterprises, is dedicated to connecting farmers to the Philadelphia marketplace. Since 2001, it has been
compiling a database of farmers who have sought its services, attended events, or come in contact with
the organization in some way.
The combination of the Ag Map and Fair Food databases provides a basic view of potential supply for
the Common Market. These farms are generally smaller than the average PA farm, focus on direct sales
to the consumer or wholesale entity, and farm in a sustainable manner, meaning their approach to
agriculture considers the environmental well-being of the land, animals, and consumers they serve.
Coupled with the Ag Census data that provides an overarching view of all the agricultural production in
PA, the report intends to show potential supply capacity for the Common Market.
Produce
In 2002, the state of Pennsylvania farmed over 50,000 acres of produce, according to agricultural census
data. To meet the wholesale needs of these produce farmers, Pennsylvania has a well-developed
private auction system that consists of 12 auctions throughout the state.
Recent research on the feasibility of a Shipping Point Market System revealed that produce auctions are
effectively able to meet the wholesale needs of PA farmers. In addition, the Shipping Point Market
System research indicated that for the most part, PA produce farmers do not struggle to access the
wholesale marketplace. With these findings in mind, the Common Market will seek direct relationships
with produce farmers, as opposed to purchasing through the auction system.
48 Supply Analysis THE COMMON MARKET FEASIBILTY STUDY
The Penn St. Ag Map and Fair Food Project databases contain 363 produce farmers in the 14 county
region surrounding Philadelphia. These farms are of varying size and product type, all classified under
the heading “produce,” which complicates understanding the total quantity of production, as individual
products grown are not differentiated. Nonetheless, ag census data and the two supplemental
databases can provide some insight into specific products:
Apples: According to Ag Census data, 169,500 tons of apples were grown for fresh market sale in the
region surrounding Philadelphia on 662 different farms in 2002. These figures translate to 256 tons of
apples per farm per year, but we can assume many of them are sold out of the state via large
distribution channels. The Fair Food database offers a sub-category of “tree fruit,” Based on the number
of growers classified in that group, only 55, about 14,000 tons of apples (and peaches, nectarines, etc.)
would be in production to potentially serve the Philadelphia marketplace.
Sweet Corn: Ag Census data shows that the average yield for fresh market sweet corn in 2006 was
5700 lbs./acre. With 17,400 acres harvested, Pennsylvania produced almost 50,000 tons of fresh market
sweet corn in 2006. Clearly, not all of this corn would be available for the Common Market. Further Ag
Census analysis shows that 11% of PA sweet corn is produced in Lancaster County alone, totalling 5,500
tons. The Ag Map and Fair Food Databases contain 52 produce farmers in Lancaster County, with no
indication of what each produces. Estimations of fresh market sweet corn production for Lancaster can
be projected by applying the state average to a range of producer numbers:
• If 10% of the 52 produce farmers from Lancaster grow sweet corn at the state average yield,
then 14.82 tons annually are produced,
• 15%= 22.23 tons,
• 20%= 29.64 tons.
These extrapolations may not present an exact assessment of produce supply for the Common Market.
Nonetheless, they do show that Pennsylvania has ample production to serve wholesale markets in
general, either via large distribution channels, the auction system, or smaller distributors.
Poultry
Poultry is the second largest agricultural commodity produced in Pennsylvania, accounting for $600
million of farm products according to the 2002 agricultural census. Recent statistics from the National
Chicken Council indicate that Pennsylvania ranks 16th among U.S. states in poultry production.
According to agricultural census data, the 14 county region surrounding Philadelphia produced 86
million broiler chickens in 2002, and the average chicken farm produced over 68,000 birds that year. For
the purposes of the Common Market, this data provides little significance, as farmers who produce
68,000 birds per year are almost exclusively selling to one of the six corporate poultry processors in the
state.
The poultry farmer best suited for the Common Market has a combination of the following traits:
49 Supply Analysis THE COMMON MARKET FEASIBILTY STUDY
• Produces chicken in a “sustainable” method. Examples of sustainable chicken husbandry
include raising the birds on pasture, not giving them growth hormones and not feeding them
animal byproduct,
• Processes chicken at small, independent USDA-certified facility,
• Markets product direct to either consumers or the wholesale marketplace.
Agricultural statistics to quantify the number of producers who fit this description do not exist. By
merging the producer data provided by Penn State Universities Ag Map and The Fair Food Project, some
portrait of sustainable poultry supply for the Common Market can be surmised.
The Ag Map and Fair Food databases indicated 54 farms in the surrounding region that produce poultry
for meat consumption. Further research is necessary to quantify the total number of chickens and other
poultry produced. A conservative estimate of 50 birds per farm per year would equal a supply of 2700
birds to possibly serve the Common Market, and 100 birds per farm would yield 5400.
Beef
Pennsylvania ranks 21st in the U.S. for beef production with the southwestern portion of the state having
the largest area of production. According to the agricultural census, PA contained 14,700 beef farms
that produced 212,234 beef cows in 2002 (avg. 14.43 cows/farm)
Recent research has shown that many of these cows are owned under contract by one of four
companies that control 85% of the beef marketplace nationally. These companies typically send cattle
to feedlots in the American Midwest, where environmental conditions and policies better suit the
feedlot system. Nonetheless, according to the PA Beef Council, PA has 4,600 feedlots feeding anywhere
from 1 cow to over 1,000, and two of the nation’s 10 largest meat processing plants reside in
Pennsylvania.
The Common Market will not source beef through large corporations or meat processors. The farmer
most apt to serve the Common Market will be independent, produce his product using humane,
sustainable methods, and process his product at small, independent USDA-Certified processors.
By combining the databases for Penn St. University’s Ag Map and the Fair Food Project, a total of 69
farmers were identified as having beef to sell in the 14 county region surrounding Philadelphia.
Reliable data is not available for the average size of these 69 farmers operations. By applying the 14.43
beef cows/farm average from the 2002 Ag Census, the 69 beef producers in our region produce almost
1000 cows per year.
Dairy
For the purpose of this research, the portion on dairy will focus solely on fluid milk to serve the Common
Market.
The dairy industry in Pennsylvania is the largest segment of agricultural economy in the state, and PA is
the fourth largest dairy state in the U.S. PA dairy farms vary largely in size, and almost all of the milk
produced is sold through the conventional dairy marketplace.
50 Supply Analysis THE COMMON MARKET FEASIBILTY STUDY
Because dairy farmers in the southeastern United States are disappearing at rates faster than in
Pennsylvania, milk in PA has become an export product. Research was inconclusive in assessing the
quantity of milk that stays in PA, versus the quantity that is exported.
Milk produced in Pennsylvania for sale through the Common Market will have characteristics that
differentiate it from the conventional marketplace. Milk ideal for serving the Common Market is
• Processed and marketed through independent channels, not the large conventional
marketplace,
• Produced in a “sustainable” manner. Potential examples of sustainable dairy farming include
feeding the cows grass (as opposed to grain), not pasteurizing the milk (known as raw dairy,
requiring permits from PA Department of Ag for resale), and omitting growth hormones and
unnecessary antibiotics when raising cows.
Based on these stipulations, Ag Census data for milk supply to the Common Market is largely non-
applicable. The PSU Ag Map and Fair Food Project Databases indicate 43 small-scale dairy producers in
the 14 county region surrounding Philadelphia. These dairy producers are generally geared toward
direct sales and process their own product. In some cases, these dairy farmers are selling some of their
product to larger buyers (Horizon Milk for example) and keeping their highest quality milk for direct
sales.
Since size and quantity of production of these dairy farmers varies greatly and is not statistically
available, supply potential of milk for the Common Market is largely inconclusive. While it is clear that
vast quantities of milk are produced in Pennsylvania, to serve markets like the Common Market, it may
be necessary to gear farmers toward more sustainable production or sales channels conducive to the
independent marketplace.
Conclusion
Without extensive research, it is difficult to comprehensively calculate the supply potential for the
Common Market. Analysis of agricultural census data demonstrates that Pennsylvania is a national
leader in agricultural production, particularly in the produce, poultry, beef, and dairy segments.
Nonetheless, without research to show the sales channels for these products or account for the quantity
of production demanded by the marketplace, supply chain capacity for the Common Market is largely
based on conjecture.
To better support these conjectures and provide a level of significance to help the Common Market
proceed, analysis of the Penn State University (PSU) Agricultural (Ag) Map and Fair Food Project
databases was applied. These databases contain farmers who fit the general description of farmers
most apt to sell to the Common Market. While surely not complete lists of possible farmers for the
Common Market, these lists provide some perspective on available supply for the Common Market.
To conclude, ample supply of produce, poultry, beef, and milk are produced in Pennsylvania. To best
understand how that supply can be linked to the Common Market, further, more extensive research is
required.
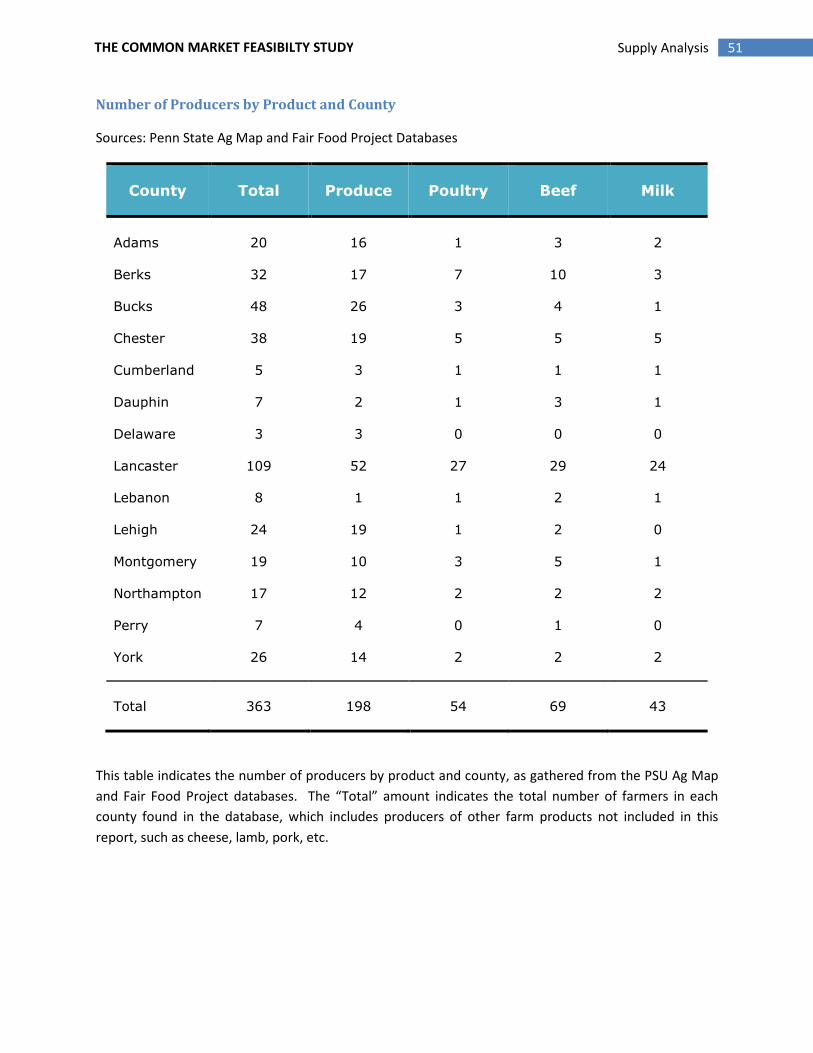
51 Supply Analysis THE COMMON MARKET FEASIBILTY STUDY
Number of Producers by Product and County
Sources: Penn State Ag Map and Fair Food Project Databases
County Total Produce Poultry Beef Milk
Adams 20 16 1 3 2
Berks 32 17 7 10 3
Bucks 48 26 3 4 1
Chester 38 19 5 5 5
Cumberland 5 3 1 1 1
Dauphin 7 2 1 3 1
Delaware 3 3 0 0 0
Lancaster 109 52 27 29 24
Lebanon 8 1 1 2 1
Lehigh 24 19 1 2 0
Montgomery 19 10 3 5 1
Northampton 17 12 2 2 2
Perry 7 4 0 1 0
York 26 14 2 2 2
Total 363 198 54 69 43
This table indicates the number of producers by product and county, as gathered from the PSU Ag Map
and Fair Food Project databases. The “Total” amount indicates the total number of farmers in each
county found in the database, which includes producers of other farm products not included in this
report, such as cheese, lamb, pork, etc.
52 Feasibility of Proposed Site THE COMMON MARKET FEASIBILTY STUDY
Feasibility of Proposed Site
Introduction
The purpose of the facility study is to determine space requirements, functional relationships of
operation components, potential for growth, and an opinion of probable cost utilizing an existing
building owned by the partners as a potential model. The building originally proposed is a 60,000
square foot masonry warehouse located in North Philadelphia close to the ramps of highways US-1 and
I-76.
A space program for the proposed Common Market was assembled, a schematic plan for utilizing the
existing building was prepared, and an Opinion of Probable Cost based on the actual program
accommodated in the existing building was developed. It was determined that although the building
allows for a well functioning distribution center at its inception, future growth of the business is not
possible in the space available. Additionally, the initial necessary capital improvement and fit-out costs
make start-up in the existing facility infeasible. The current facility owned by project partners is
therefore ideal for neither the startup nor the at-scale/growth phases of this enterprise. It is suggested
that the partners seek an existing cold-storage facility with excess capacity to take advantage of sunk
infrastructure costs borne by another entity.
The Existing Building
The existing building is a 60,000 square foot warehouse located at 3002 Cecil B. Moore Avenue in the
Brewerytown neighborhood of Philadelphia. The building is a two-story masonry structure originally
built in the 1930’s as a warehouse facility for Railway Express. The building has prominent facades on
two sides: Cecil B. Moore Avenue to the north and Glenwood Avenue to the east. The building is
adjacent to railroad tracks on the west side, and the south side abuts a vacant property.
Built in the simple Modernistic style typical of industrial buildings erected in the 1920’s and 30’s, the
brick facades present a rhythm to the street, alternating solid piers and large expanses of windows. The
facades are highlighted with a geometric tile motif drawing from the Art Deco and Art Moderne styles of
the era. The predominant structure of the building is concrete with some steel and wood support
members and the typical floor height is 12 to 15 feet. The building has vehicle loading access from both
streets. The Glenwood Avenue side has two large garage openings, and the Cecil B. Moore Avenue side
has a loading dock and ramp accessing the second floor of the building.
The existing building is currently in very poor condition. The roof and its support members were
removed because they were damaged beyond repair and were posing a life-safety risk, the majority of
the windows have been removed and the few remaining are damaged, missing glass, and boarded up.
53 Feasibility of Proposed Site THE COMMON MARKET FEASIBILTY STUDY
The building’s brick façade is cracking in places, has weed trees growing through it in places, and has
areas of missing, cracked and damaged brick. Overall, however, the structure itself is in good condition
but the building needs immediate attention to prevent further deterioration.
The building is conveniently located to access the city’s major transportation routes, US-1, I-76, I-95 and
I-676. The neighborhood is served by several bus lines and is close to public trolleys and the subway
line. Cecil B. Moore Avenue and Glenwood Avenue are both 34 feet wide two-way streets providing
easy vehicular access to the building.
The building was purchased by the current owners for development as commercial work space for
artists and creative businesses. The building has been planned with parking for 24 cars on the ground
floor and 42 workspaces ranging from 200 to 700 square feet with a large community space on the
second floor. A 14,480 square foot area on the ground floor of the building has been designated as the
space to be studied for the Common Market.
Program Facility Requirements
Minimum programming requirements necessary for operating a financially sustainable distribution
business have been identified as:
Receiving and Shipping: Loading dock area for receiving and shipping product. Preference is for two
docks, one for loading and one for unloading to minimize inefficiencies.
Staging Area: Located adjacent to loading dock area, providing space to stage product after unloading
and prior to loading. Preference is for an additional intermediate staging area that links storage and
food preparation areas to primary staging adjacent to loading docks.
Coolers: Cold storage for perishable products. Depending upon the product a variety of storage
temperatures is required and as a result multiple coolers will be needed. Using a similar facility as a
basis for cooler requirements, it was determined that five coolers of the following size dimensions are
required:
23’-0” x 15’-6”
22’-6” x 15’-9”
15’-9” x 17’-3”
33’-6” x 32”-0”
19’-0” x 54’-0”
Three-phase electrical service will be required to operate the coolers.
54 Feasibility of Proposed Site THE COMMON MARKET FEASIBILTY STUDY
Dry Storage: Areas for storing some food items such as canned and dried goods and for storing packing
materials and supplies is required.
Re-Pack Area: Areas designated for re-packing and re-grading product is required. Adjacent to these
areas specific food-safety criteria such as hand wash sinks need to be accommodated.
Enterprise Areas: These areas include food preparation for adding value to product such as cutting
fresh produce for specific clients.
Employee Areas: Spaces for employees such as break areas, changing areas, and lavatories are to be
provided.
Office Space: Anticipated staff includes: Receiver, Shipper, Materials Handler(s), Quality Control,
Compliance, Drivers, Accounting and Office Management, Sales and Marketing, Management. For
purposes of initial planning two offices and two workstations are required.
Incubator Space: Space for future incubator businesses related to Common Market mission.
In addition to the specific programming areas, the facility will require forklifts, pallet jacks, hand trucks,
work area equipment (such as scales, baggers, closure equipment, etc.) and at least one delivery truck.
Process and Findings
An initial program was established based on information provided and an estimate of likely space
requirements for each programmed area. Using the program, the Common Market was planned in the
14,480 square feet of open space running primarily along Cecil B. Moore Avenue on the ground floor of
the existing building. The Common Market will utilize one of the existing garage openings on Glenwood
Avenue. It was noted that the existing height of the garage door and height below the existing beams
inside the building is approximately 12’-6” to 12’-9”. The height of a standard delivery truck is 12’-6”;
therefore the plan assumes site work to depress the concrete slab at the driveway and inside the
building.
All program spaces were accommodated within the existing building; however there is little to no room
for future growth of the program.
Because of the expanse of glass along Cecil B. Moore Avenue, it was logical to plan the administrative
areas along that wall. Situating the open work station areas towards the center of the space allows
some daylight to penetrate into the distribution center. The proposed incubator spaces are located
closest to the main entrance of the building and the intersection of Columbia and Glenwood in
anticipation of the continued neighborhood revitalization and the intersection as a focus of activity.
The loading dock is situated for access on all sides allowing for flexibility in loading and unloading of
goods. Since the building does not have a loading dock in this location, a concrete dock will need to be

55 Feasibility of Proposed Site THE COMMON MARKET FEASIBILTY STUDY
built. The main staging area is directly adjacent to the dock with additional staging located between the
loading dock and re-packing area.
The five programmed coolers are located around the perimeter of the distribution space allowing for
easy access from the wide central circulation space. The salad preparation room cooler is directly
accessible from the re-packing area and adjacent to the food preparation (enterprise) area.
Food preparation sinks and utilities are centralized and clustered with the toilet room plumbing areas.
Dry storage is located convenient to both food preparation and re-packing areas.
Overall, the majority of the program can be adequately accommodated in the existing 14,480 square
feet of space.
As an alternate, the program was planned in the adjacent 11,380 square foot space running primarily
along Glenwood Avenue, and the area of proposed parking for the future fit-out of the upper level of
the building was moved to the Cecil B. Moore Avenue side. It was determined early that the Common
Market minimum program requirements could not be adequately accommodated in this space.
An Opinion of Probable Cost was prepared for the work required to fit-out the existing building for use
as the Common Market. The estimate was separated into two phases: Base Building Work; the work
required to make the existing building habitable and functional and Common Market Fit-out; the work
required to fit-out the completed base building for the Common Market only. The Base building work
was estimated at $3,442,016 and the Common Market work was estimated at $201,431.
Conclusions for Proposed Facility
There appears to be three major hindrances to the feasibility of utilizing the existing building for the
Common Market: The first is the financial investment needed to repair and outfit the existing building
to make it ready for use by an operating entity. The second is the limited area of space available for the
Common Market, which does not allow for future expansion of the distribution center, and the third is
the lack of a second loading dock to enhance efficiency of the operation. Another drawback is the
location of the building for loading and unloading. Although the building is easily accessible from major
transportation routes, and the access streets are wider than the typical Philadelphia street, the building
is not oriented to easily receive back in loading.
Although the existing building would provide the Common Market with a well planned and functionally
organized space to start its business, it would be expensive to outfit, not allow for future growth of the
business and it is possible if not likely that its ability to function in this space would be short lived.
56 Feasibility of Proposed Site THE COMMON MARKET FEASIBILTY STUDY
Recommendation
The project will be best served in its start-up phase by locating at a facility that is already equipped for
cold storage and distribution. The prohibitive cost of outfitting a space at startup will financially cripple
this project and hinder its probability of success. The group should seek to partner with an existing
distribution operation/facility where it can utilize low-cost, excess capacity until it has grown to a size
that justifies major capital outlays on refrigeration and investments in space toward future growth.
Architectural Design and Analysis Products (Appendix G document list)
Please see Appendix G for the following supporting documents.
• Site Plan and Location Maps
• Existing Building Ground and Second Floor Plans and Photographs
• Proposed Building Plans and Elevations with photographs of Existing Facade
• Common Market Schematic Floor Plan
• Common Market Schematic Elevation – Glenwood Avenue Facade
• Common Market Schematic Elevation and Diagrammatic Section
• Common Market Schematic Floor Plan
• Common Market Schematic Floor Plan - Alternate Space
• Feasibility Program
• Opinion of Probable Cost - Summary
• Opinion of Probable Cost – Common Market Fit-Out
• Opinion of Probable Cost – Base Building Work
• Structural Fundamental Design Report
• Report on Food Distribution Center Cost Factors

57 Business Structure Tables THE COMMON MARKET FEASIBILTY STUDY
Business Structure Tables
For-Profit Corporation Owned by Project Partners
Start-up Funding • Difficulty qualifying for grants and corporate
sponsorships
• Possibility of outside investors
Profit • Distributed to owners/ shareholders
• Limited opportunity to use profit to support
mission
• Higher tax burden
Governance • Managed by GM (a CM employee)
• Controlled by board elected by owners/
shareholders
Opportunities • Profit motivation can make company focus on
operating efficiency
Risks • Mission may be lost in attempt to maximize
efficiencies and profits
• Unclear how ownership would be assigned
• Lose credibility in non-profit world
•
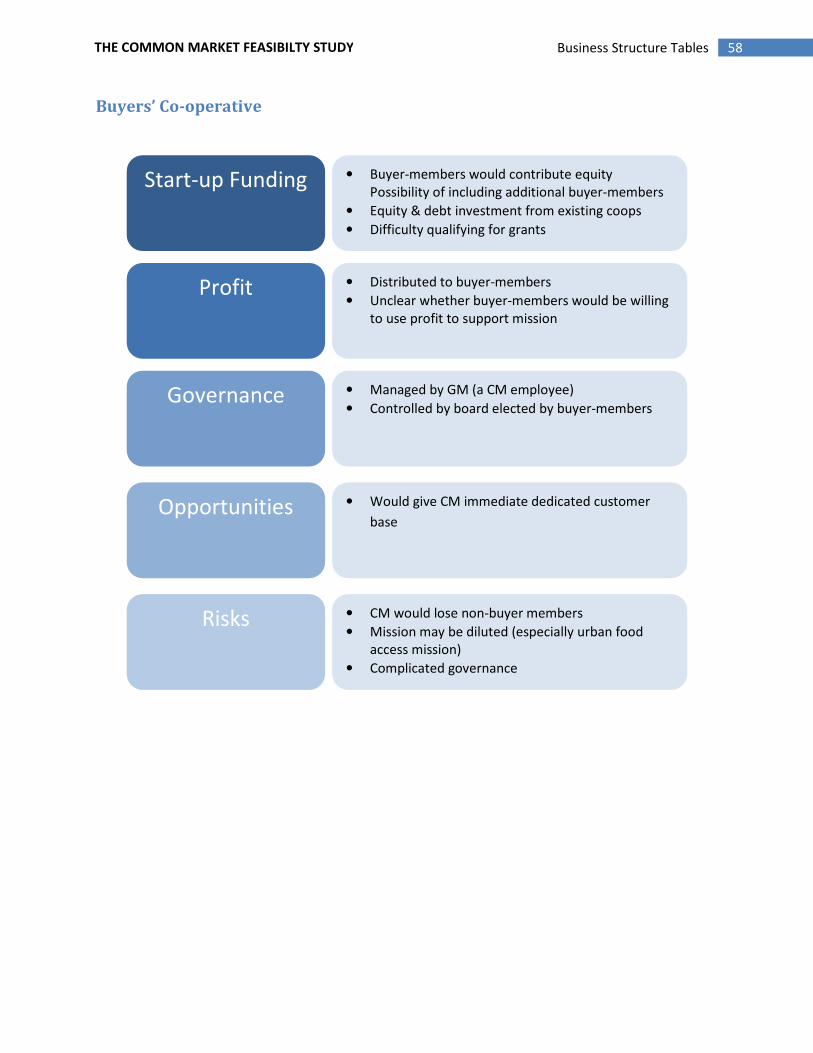
58 Business Structure Tables THE COMMON MARKET FEASIBILTY STUDY
Buyers’ Co-operative
Start-up Funding • Buyer-members would contribute equity
Possibility of including additional buyer-members
• Equity & debt investment from existing coops
• Difficulty qualifying for grants
Profit • Distributed to buyer-members
• Unclear whether buyer-members would be willing
to use profit to support mission
Governance • Managed by GM (a CM employee)
• Controlled by board elected by buyer-members
Opportunities • Would give CM immediate dedicated customer
base
Risks • CM would lose non-buyer members
• Mission may be diluted (especially urban food
access mission)
• Complicated governance
• Many original CM project partners lose control
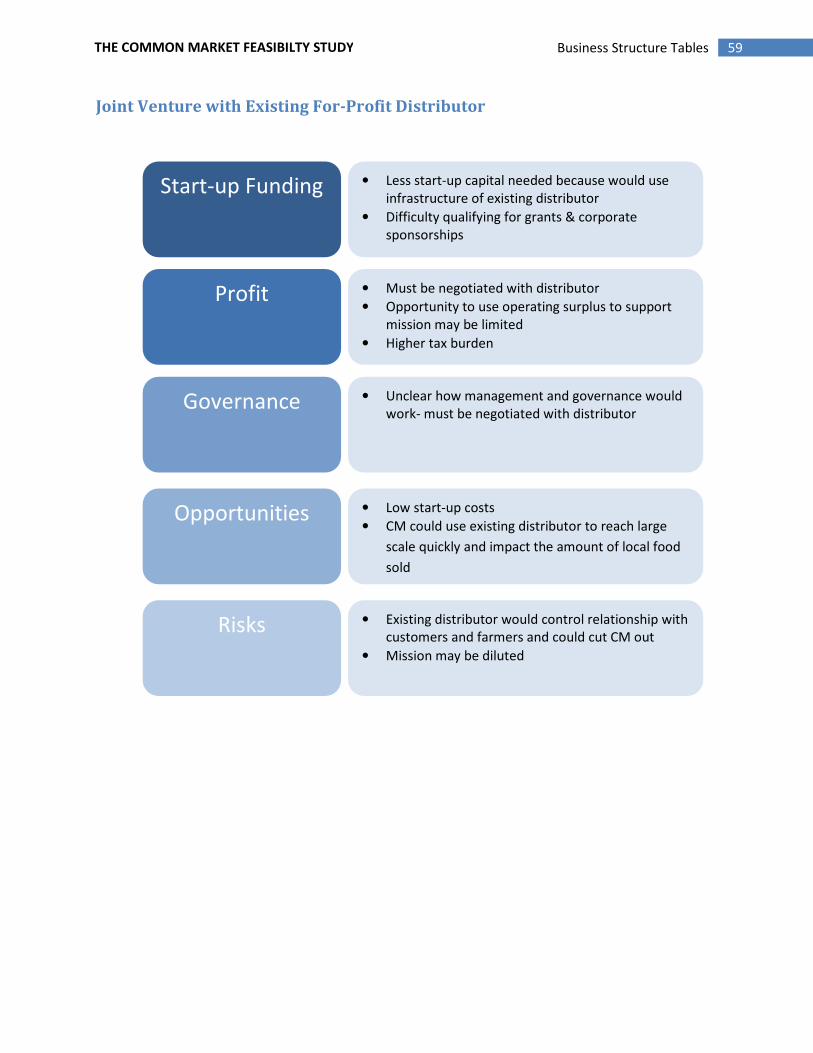
59 Business Structure Tables THE COMMON MARKET FEASIBILTY STUDY
Joint Venture with Existing For-Profit Distributor
Start-up Funding • Less start-up capital needed because would use
infrastructure of existing distributor
• Difficulty qualifying for grants & corporate
sponsorships
Profit • Must be negotiated with distributor
• Opportunity to use operating surplus to support
mission may be limited
• Higher tax burden
Governance • Unclear how management and governance would
work- must be negotiated with distributor
Opportunities • Low start-up costs
• CM could use existing distributor to reach large
scale quickly and impact the amount of local food
sold
Risks • Existing distributor would control relationship with
customers and farmers and could cut CM out
• Mission may be diluted
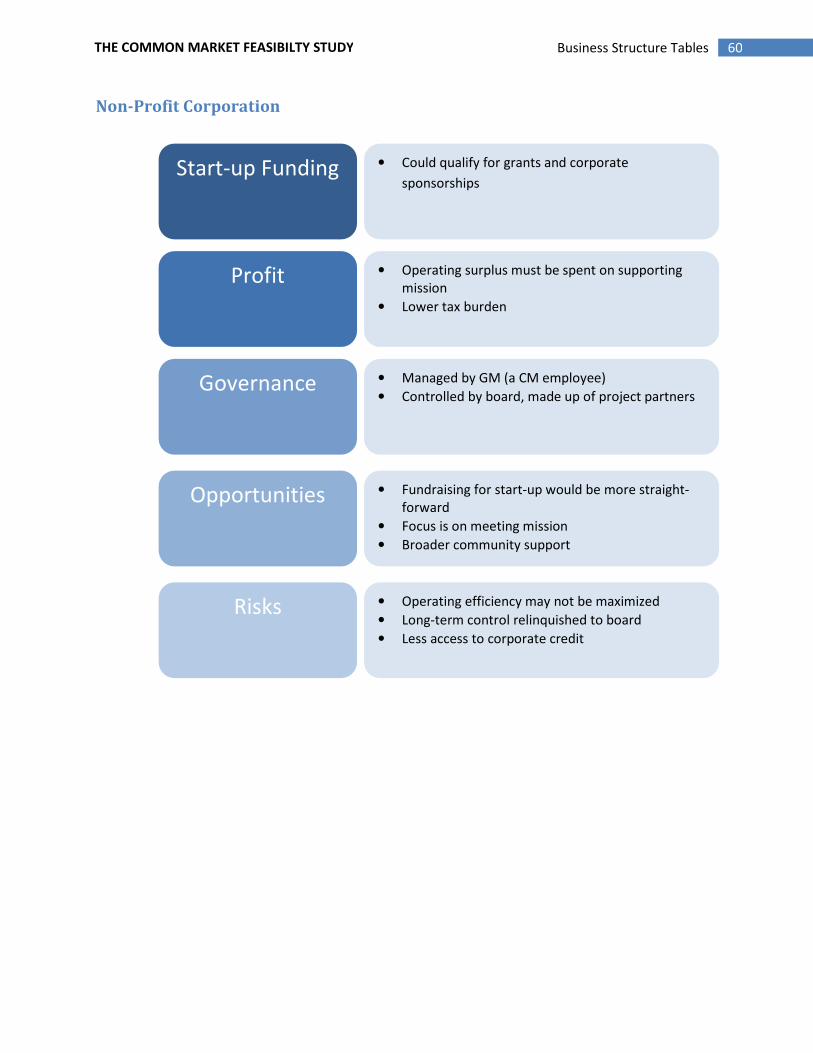
60 Business Structure Tables THE COMMON MARKET FEASIBILTY STUDY
Non-Profit Corporation
Start-up Funding • Could qualify for grants and corporate
sponsorships
Profit • Operating surplus must be spent on supporting
mission
• Lower tax burden
Governance • Managed by GM (a CM employee)
• Controlled by board, made up of project partners
Opportunities • Fundraising for start-up would be more straight-
forward
• Focus is on meeting mission
• Broader community support
Risks • Operating efficiency may not be maximized
• Long-term control relinquished to board
• Less access to corporate credit
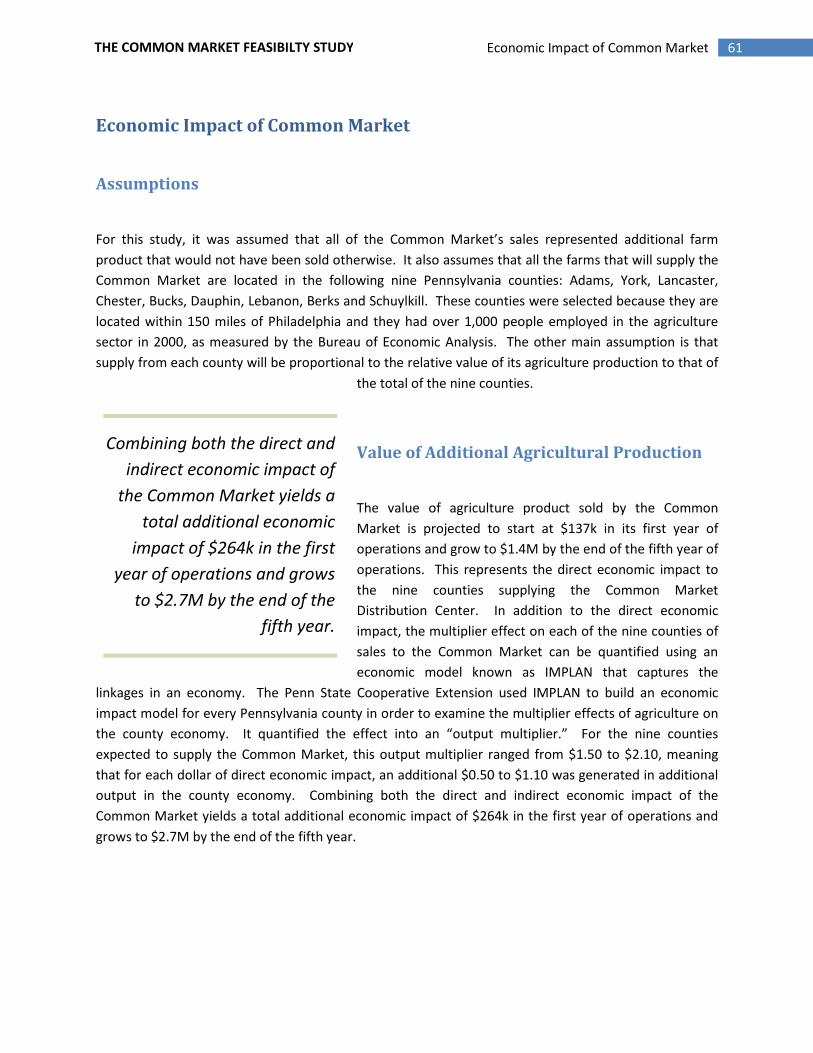
61 Economic Impact of Common Market THE COMMON MARKET FEASIBILTY STUDY
Economic Impact of Common Market
Assumptions
For this study, it was assumed that all of the Common Market’s sales represented additional farm
product that would not have been sold otherwise. It also assumes that all the farms that will supply the
Common Market are located in the following nine Pennsylvania counties: Adams, York, Lancaster,
Chester, Bucks, Dauphin, Lebanon, Berks and Schuylkill. These counties were selected because they are
located within 150 miles of Philadelphia and they had over 1,000 people employed in the agriculture
sector in 2000, as measured by the Bureau of Economic Analysis. The other main assumption is that
supply from each county will be proportional to the relative value of its agriculture production to that of
the total of the nine counties.
Value of Additional Agricultural Production
The value of agriculture product sold by the Common
Market is projected to start at $137k in its first year of
operations and grow to $1.4M by the end of the fifth year of
operations. This represents the direct economic impact to
the nine counties supplying the Common Market
Distribution Center. In addition to the direct economic
impact, the multiplier effect on each of the nine counties of
sales to the Common Market can be quantified using an
economic model known as IMPLAN that captures the
linkages in an economy. The Penn State Cooperative Extension used IMPLAN to build an economic
impact model for every Pennsylvania county in order to examine the multiplier effects of agriculture on
the county economy. It quantified the effect into an “output multiplier.” For the nine counties
expected to supply the Common Market, this output multiplier ranged from $1.50 to $2.10, meaning
that for each dollar of direct economic impact, an additional $0.50 to $1.10 was generated in additional
output in the county economy. Combining both the direct and indirect economic impact of the
Common Market yields a total additional economic impact of $264k in the first year of operations and
grows to $2.7M by the end of the fifth year.
Combining both the direct and
indirect economic impact of
the Common Market yields a
total additional economic
impact of $264k in the first
year of operations and grows
to $2.7M by the end of the
fifth year.
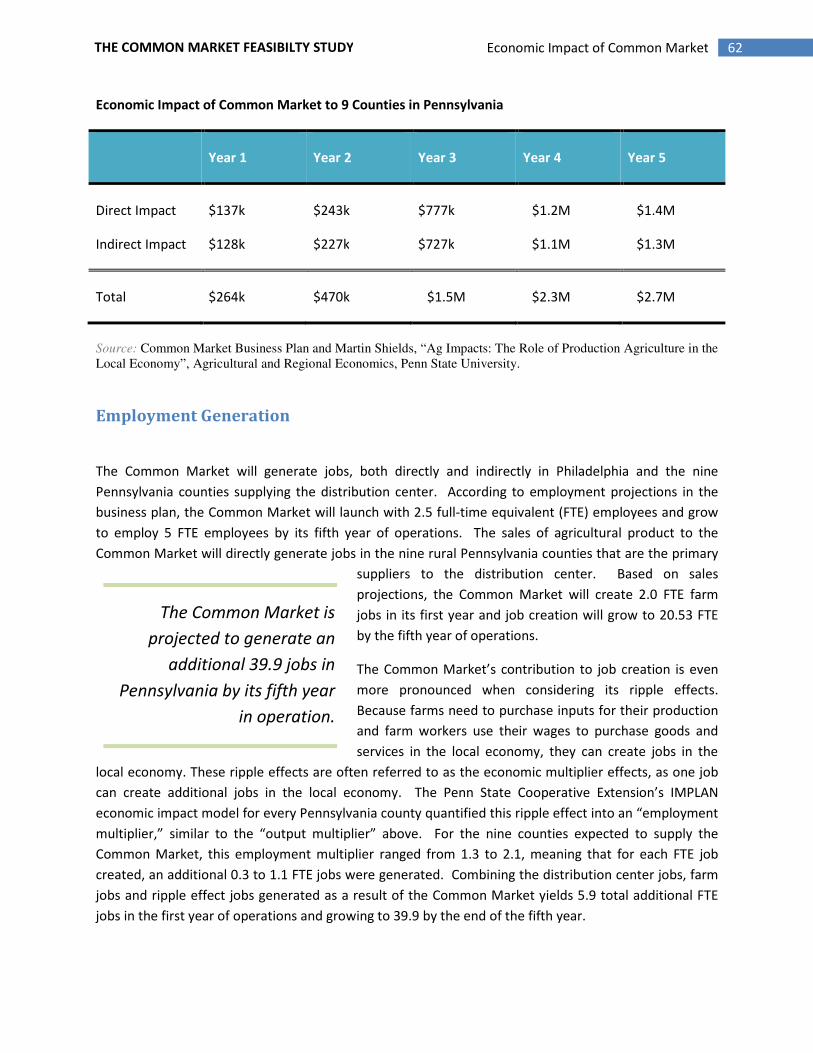
62 Economic Impact of Common Market THE COMMON MARKET FEASIBILTY STUDY
Economic Impact of Common Market to 9 Counties in Pennsylvania
Year 1 Year 2 Year 3 Year 4 Year 5
Direct Impact $137k $243k $777k $1.2M $1.4M
Indirect Impact $128k $227k $727k $1.1M $1.3M
Total $264k $470k $1.5M $2.3M $2.7M
Source: Common Market Business Plan and Martin Shields, “Ag Impacts: The Role of Production Agriculture in the
Local Economy”, Agricultural and Regional Economics, Penn State University.
Employment Generation
The Common Market will generate jobs, both directly and indirectly in Philadelphia and the nine
Pennsylvania counties supplying the distribution center. According to employment projections in the
business plan, the Common Market will launch with 2.5 full-time equivalent (FTE) employees and grow
to employ 5 FTE employees by its fifth year of operations. The sales of agricultural product to the
Common Market will directly generate jobs in the nine rural Pennsylvania counties that are the primary
suppliers to the distribution center. Based on sales
projections, the Common Market will create 2.0 FTE farm
jobs in its first year and job creation will grow to 20.53 FTE
by the fifth year of operations.
The Common Market’s contribution to job creation is even
more pronounced when considering its ripple effects.
Because farms need to purchase inputs for their production
and farm workers use their wages to purchase goods and
services in the local economy, they can create jobs in the
local economy. These ripple effects are often referred to as the economic multiplier effects, as one job
can create additional jobs in the local economy. The Penn State Cooperative Extension’s IMPLAN
economic impact model for every Pennsylvania county quantified this ripple effect into an “employment
multiplier,” similar to the “output multiplier” above. For the nine counties expected to supply the
Common Market, this employment multiplier ranged from 1.3 to 2.1, meaning that for each FTE job
created, an additional 0.3 to 1.1 FTE jobs were generated. Combining the distribution center jobs, farm
jobs and ripple effect jobs generated as a result of the Common Market yields 5.9 total additional FTE
jobs in the first year of operations and growing to 39.9 by the end of the fifth year.
The Common Market is
projected to generate an
additional 39.9 jobs in
Pennsylvania by its fifth year
in operation.
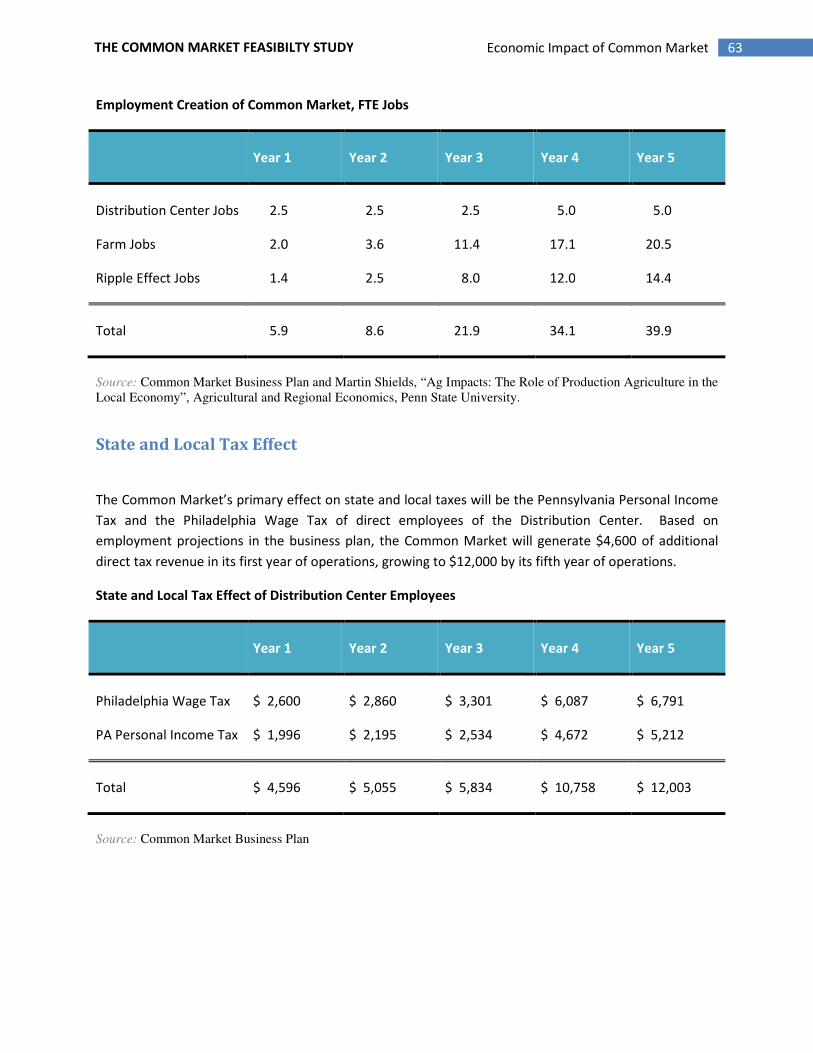
63 Economic Impact of Common Market THE COMMON MARKET FEASIBILTY STUDY
Employment Creation of Common Market, FTE Jobs
Year 1 Year 2 Year 3 Year 4 Year 5
Distribution Center Jobs 2.5 2.5 2.5 5.0 5.0
Farm Jobs 2.0 3.6 11.4 17.1 20.5
Ripple Effect Jobs 1.4 2.5 8.0 12.0 14.4
Total 5.9 8.6 21.9 34.1 39.9
Source: Common Market Business Plan and Martin Shields, “Ag Impacts: The Role of Production Agriculture in the
Local Economy”, Agricultural and Regional Economics, Penn State University.
State and Local Tax Effect
The Common Market’s primary effect on state and local taxes will be the Pennsylvania Personal Income
Tax and the Philadelphia Wage Tax of direct employees of the Distribution Center. Based on
employment projections in the business plan, the Common Market will generate $4,600 of additional
direct tax revenue in its first year of operations, growing to $12,000 by its fifth year of operations.
State and Local Tax Effect of Distribution Center Employees
Year 1 Year 2 Year 3 Year 4 Year 5
Philadelphia Wage Tax $ 2,600 $ 2,860 $ 3,301 $ 6,087 $ 6,791
PA Personal Income Tax $ 1,996 $ 2,195 $ 2,534 $ 4,672 $ 5,212
Total $ 4,596 $ 5,055 $ 5,834 $ 10,758 $ 12,003
Source: Common Market Business Plan
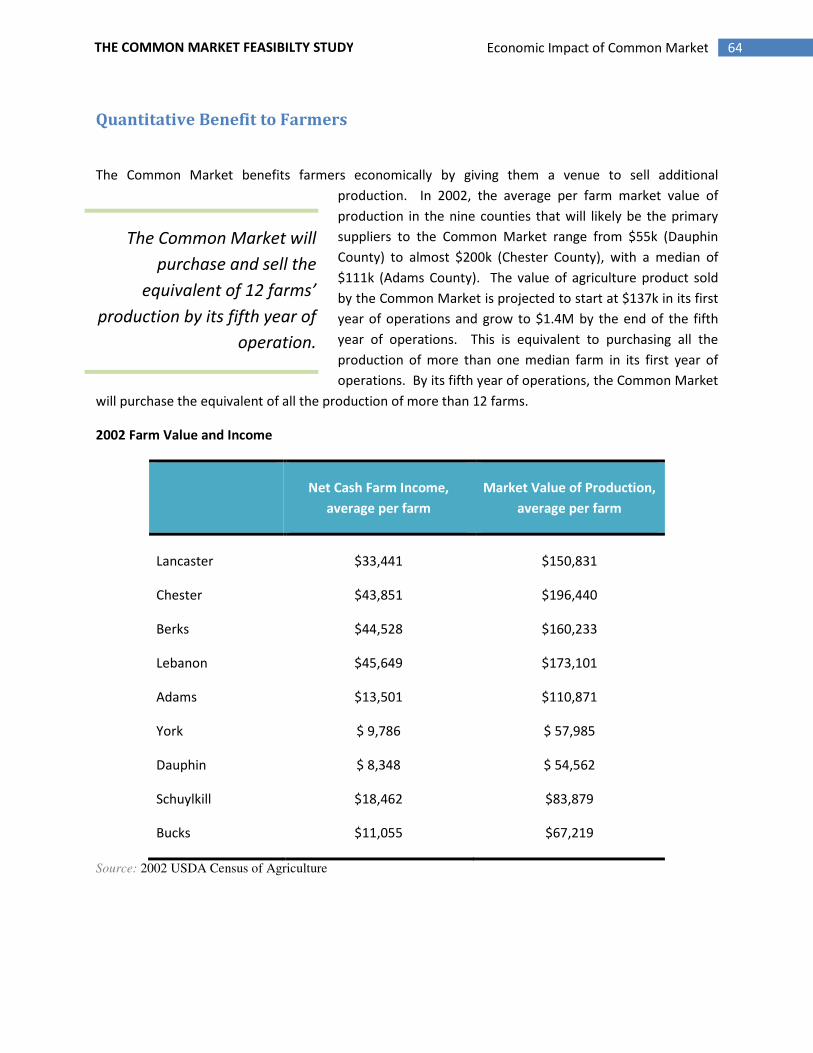
64 Economic Impact of Common Market THE COMMON MARKET FEASIBILTY STUDY
Quantitative Benefit to Farmers
The Common Market benefits farmers economically by giving them a venue to sell additional
production. In 2002, the average per farm market value of
production in the nine counties that will likely be the primary
suppliers to the Common Market range from $55k (Dauphin
County) to almost $200k (Chester County), with a median of
$111k (Adams County). The value of agriculture product sold
by the Common Market is projected to start at $137k in its first
year of operations and grow to $1.4M by the end of the fifth
year of operations. This is equivalent to purchasing all the
production of more than one median farm in its first year of
operations. By its fifth year of operations, the Common Market
will purchase the equivalent of all the production of more than 12 farms.
2002 Farm Value and Income
Net Cash Farm Income,
average per farm
Market Value of Production,
average per farm
Lancaster $33,441 $150,831
Chester $43,851 $196,440
Berks $44,528 $160,233
Lebanon $45,649 $173,101
Adams $13,501 $110,871
York $ 9,786 $ 57,985
Dauphin $ 8,348 $ 54,562
Schuylkill $18,462 $83,879
Bucks $11,055 $67,219
Source: 2002 USDA Census of Agriculture
The Common Market will
purchase and sell the
equivalent of 12 farms’
production by its fifth year of
operation.
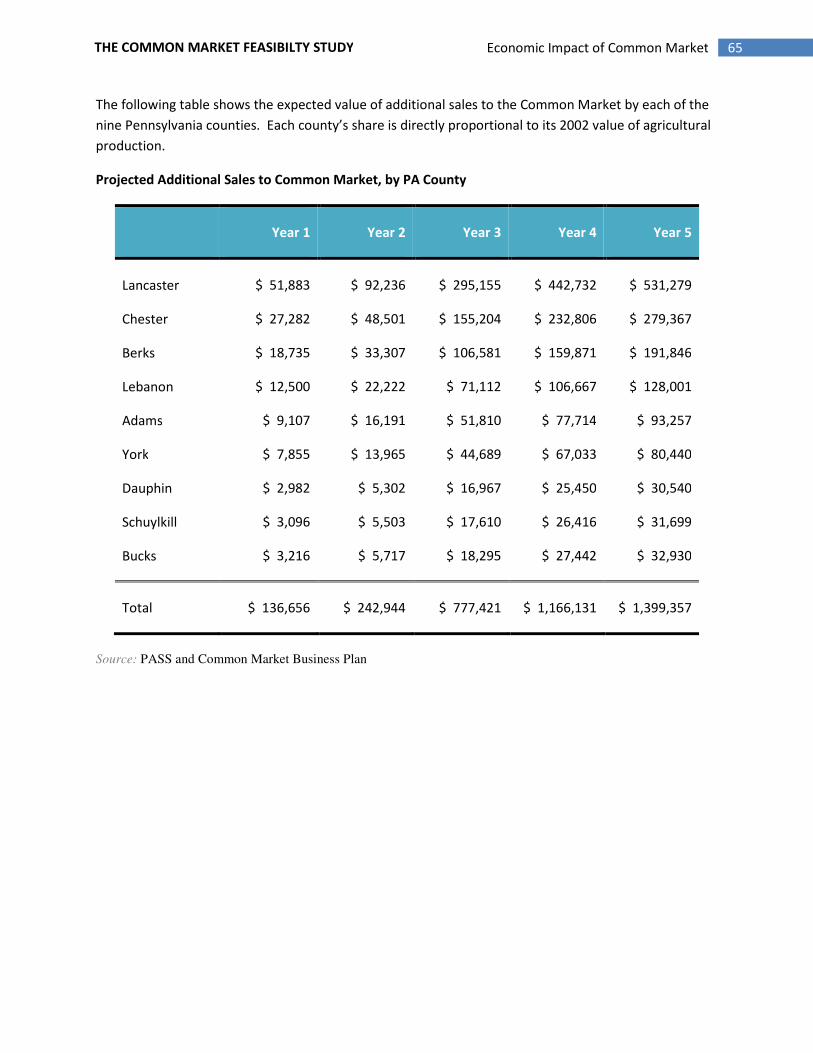
65 Economic Impact of Common Market THE COMMON MARKET FEASIBILTY STUDY
The following table shows the expected value of additional sales to the Common Market by each of the
nine Pennsylvania counties. Each county’s share is directly proportional to its 2002 value of agricultural
production.
Projected Additional Sales to Common Market, by PA County
Year 1 Year 2 Year 3 Year 4 Year 5
Lancaster $ 51,883 $ 92,236 $ 295,155 $ 442,732 $ 531,279
Chester $ 27,282 $ 48,501 $ 155,204 $ 232,806 $ 279,367
Berks $ 18,735 $ 33,307 $ 106,581 $ 159,871 $ 191,846
Lebanon $ 12,500 $ 22,222 $ 71,112 $ 106,667 $ 128,001
Adams $ 9,107 $ 16,191 $ 51,810 $ 77,714 $ 93,257
York $ 7,855 $ 13,965 $ 44,689 $ 67,033 $ 80,440
Dauphin $ 2,982 $ 5,302 $ 16,967 $ 25,450 $ 30,540
Schuylkill $ 3,096 $ 5,503 $ 17,610 $ 26,416 $ 31,699
Bucks $ 3,216 $ 5,717 $ 18,295 $ 27,442 $ 32,930
Total $ 136,656 $ 242,944 $ 777,421 $ 1,166,131 $ 1,399,357
Source: PASS and Common Market Business Plan
66 Economic Impact of Common Market THE COMMON MARKET FEASIBILTY STUDY
Non-Quantitative Benefits to Farmers
• Increased efficiency in marketing and delivering local foods. The Common Market distribution
center would provide an alternative to the currently fragmented distribution of local food from
farmer to wholesale buyer. This would reduce farmers’ time, expense, and energy consumption
involved in making individual deliveries. Buyers would have access to a consolidated, reliable
supply and wide variety of locally grown products.
• Sustainable future for mid-sized farms. Mid-sized farms have been squeezed by the
globalization of agricultural production. Large farms have been able to achieve economies of
scale to compete on price and small farms have been able to tap direct retail opportunities like
CSAs and farmers’ markets. Midsized farms, which represent a significant proportion of
Pennsylvania farms, need new wholesale options because they are generally too large for retail
channels but too small to compete successfully on a global scale.
• Farmland preservation. Insofar as a local food distribution center would be successful in
supporting and stimulating the region’s farmers, it would also help achieve the many positive
environmental benefits of a healthy regional agriculture, including working farm landscapes, and
land stewardship of nearby areas.
• Support for institutional purchasing of local foods. A local foods distribution center can be a
significant resource for expanding government and institutional efforts to increase consumption
of locally grown foods. For example, area hospitals and universities are actively seeking to
purchase more locally grown fresh produce and the Common Market could become a critical
component in ensuring a steady supply of locally grown foods into these systems.
• Better crop coordination and understanding of market demand. The greater communication
between urban buyers and rural growers that will be facilitated by the Common Market will be
to the farmer's benefit. Understanding a specific buyer's desire will allow the farmers to grow
the food to meet that demand thereby insuring more reliable and profitable sales outlets for
their products. Growing to meet specialty demand for obscure and ethnic varieties will also
increase profitability.

67 Environmental Impact Analysis THE COMMON MARKET FEASIBILTY STUDY
Environmental Impact Analysis
The Common Market will have a positive impact on the environment by sourcing products from local
and sometimes from organic farms thereby replacing similar products currently grown on out-of-state
conventional farms and transported long distances to markets in Philadelphia. The reduction in
environmental impacts is due to lower vehicle emissions to transport food and elimination of synthetic
chemicals used in fertilizers and pesticides. Food transportation vehicles and the manufacture of
agricultural chemicals use fossil fuels and result in release of carbon dioxide (CO2), nitrogen oxides and
other greenhouse gases implicated in global warming.4 Agricultural chemicals have other environmental
impacts, on water quality and plant and animal habitat. Another way that the Common Market can have
a positive environmental impact compared to conventional food warehouse operations is to generate
some of its own power for refrigeration from solar energy.
This section of the feasibility study presents estimates of the positive impacts that can be attributed to
the Common Market based on the amount of local farm products it sells, the expected transition from
conventional farming practices using energy-consuming chemicals to organic farming methods that the
Common Market sourcing will encourage, and the electric power it generates for its own use in years 1,
3, and 5 of its operation as projected in the business plan.
First, three farm product shipping scenarios will be examined for their greenhouse gas generation:
� Transportation of local farm products to Philadelphia prior to startup of the Common Market,
� Long distance shipping of farm products the average distance traveled by food in the United
States,
� Transportation of farm products to the Common Market.
These results will be compared to show the estimated:
� Reduction in greenhouse gases due to consolidation of local trucking operations by the Common
Market,
� Reduction in vehicle emissions due to replacement of long distance shipping with local trucking
operations to the Common Market.
Subsequent sections will present:
� Estimates of the conversion of farms from synthetic inputs to organic inputs; estimates of the
reduction in synthetic input use by local farms due to proposed distribution center,
� Findings on the use of solar energy collectors to supply power to the Common Market
refrigeration units; identification of costs and funding sources; recommendations.
4 The Intergovernmental Panel on Climate Change 2001 report 'Climate Change 2001: The Scientific Basis'.
Contribution of Working Group I to the Third Assessment Report of the Intergovernmental Panel on Climate
Change, Cambridge University Press.

68 Environmental Impact Analysis THE COMMON MARKET FEASIBILTY STUDY
Conversion Factors and Assumptions
Table 1 lists some of the conversion factors and assumptions used in the sections that follow. Global
warming potential is expressed in equivalent CO2 or CO2E - the concentration of CO2 that would cause
the same level of radiative forcing (RF) as a given type and concentration of all the greenhouse gases in a
combustion source.5
Table 1. Conversion factors and assumptions used in the transportation impact analysis.
Item Year 1 Year 3 Year 5
Common Market: cases of
product/week6 225 1,280 2,300
Percent product type cases by year
Vegetable (assumption) 60% 46% 45%
Fruit (assumption) 40% 29% 31%
Meat, poultry, dairy (assumption) 0% 26% 24%
Case type
Vegetables
and melons
Tree fruit Meat/Poultry/
Dairy
Case weight, lbs (typical for industry) 25 35 40
Truck factors by truck type Long distance
tractor-trailer
Local farm
truck
Common Market
truck
Truck capacity (assumption) 22 pallets 1,250 lbs 10 pallets
Cases/pallet (assumption) 48 NA 36
Truck fuel diesel gasoline diesel
Truck fuel efficiency, miles/gallon7 6.1 17.2 6.1
CO2E emissions, lbs/gallon 20.97 20.71 20.97
5 http://en.wikipedia.org/wiki/Carbon_dioxide_equivalent
6 From Common Market Business Plan.
7 Bureau of Transportation Statistics, National Transportation Statistics. “Combination Truck Fuel Economy.” 1999
69 Environmental Impact Analysis THE COMMON MARKET FEASIBILTY STUDY
Greenhouse Gas Exhaust Estimations
Locally Grown Products Transported to Philadelphia Prior to the Common Market
Information in the Philadelphia Wholesale Local Food Guide8 was used to estimate the sales by local
farms of their products to buyers in Philadelphia. Although this listing is not complete, it does give an
indication of the current commercial efforts to bring local farm products to Philadelphia markets. As
such, the estimates developed here represent an unknown fraction of the total local food products
transported to Philadelphia and a corresponding fraction of the greenhouse gas emissions generated.
The guide lists 17 local farms that deliver product to Philadelphia. These farms, numbered 1 -17, and
their distances from Philadelphia are shown in Table 2. Also show in this table is an estimate of the
number of trips each farm makes to Philadelphia each week during its growing season based on
information given in the guide. A trip correction factor takes into account the length of each farm’s
growing season and knowledge of combined trip purpose (e.g., to deliver products and sell at a farmers’
market). Finally, the table shows the calculated annual one-way miles traveled for product delivery for
each farm and the total miles for all 17 farms.
8 Wholesale Guide to Local Farm Products, 2007. Fair Food Project of the White Dog Community Enterprises.
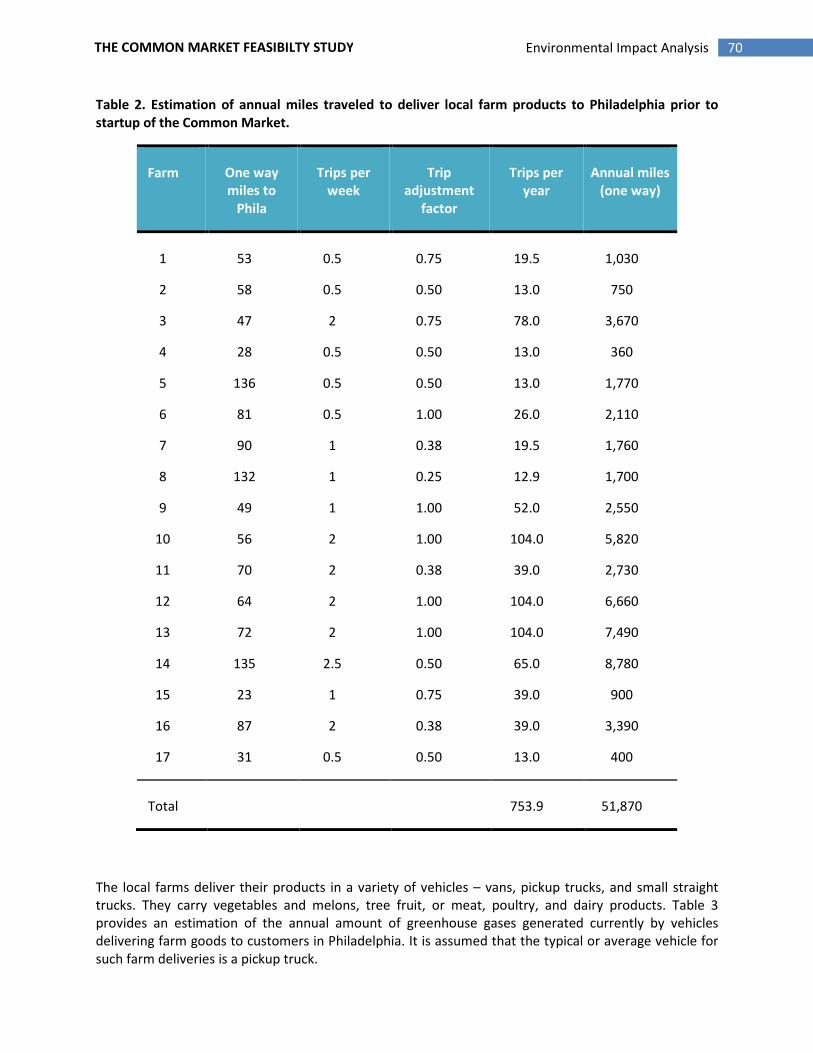
70 Environmental Impact Analysis THE COMMON MARKET FEASIBILTY STUDY
Table 2. Estimation of annual miles traveled to deliver local farm products to Philadelphia prior to
startup of the Common Market.
Farm One way
miles to
Phila
Trips per
week
Trip
adjustment
factor
Trips per
year
Annual miles
(one way)
1 53 0.5 0.75 19.5 1,030
2 58 0.5 0.50 13.0 750
3 47 2 0.75 78.0 3,670
4 28 0.5 0.50 13.0 360
5 136 0.5 0.50 13.0 1,770
6 81 0.5 1.00 26.0 2,110
7 90 1 0.38 19.5 1,760
8 132 1 0.25 12.9 1,700
9 49 1 1.00 52.0 2,550
10 56 2 1.00 104.0 5,820
11 70 2 0.38 39.0 2,730
12 64 2 1.00 104.0 6,660
13 72 2 1.00 104.0 7,490
14 135 2.5 0.50 65.0 8,780
15 23 1 0.75 39.0 900
16 87 2 0.38 39.0 3,390
17 31 0.5 0.50 13.0 400
Total 753.9 51,870
The local farms deliver their products in a variety of vehicles – vans, pickup trucks, and small straight
trucks. They carry vegetables and melons, tree fruit, or meat, poultry, and dairy products. Table 3
provides an estimation of the annual amount of greenhouse gases generated currently by vehicles
delivering farm goods to customers in Philadelphia. It is assumed that the typical or average vehicle for
such farm deliveries is a pickup truck.
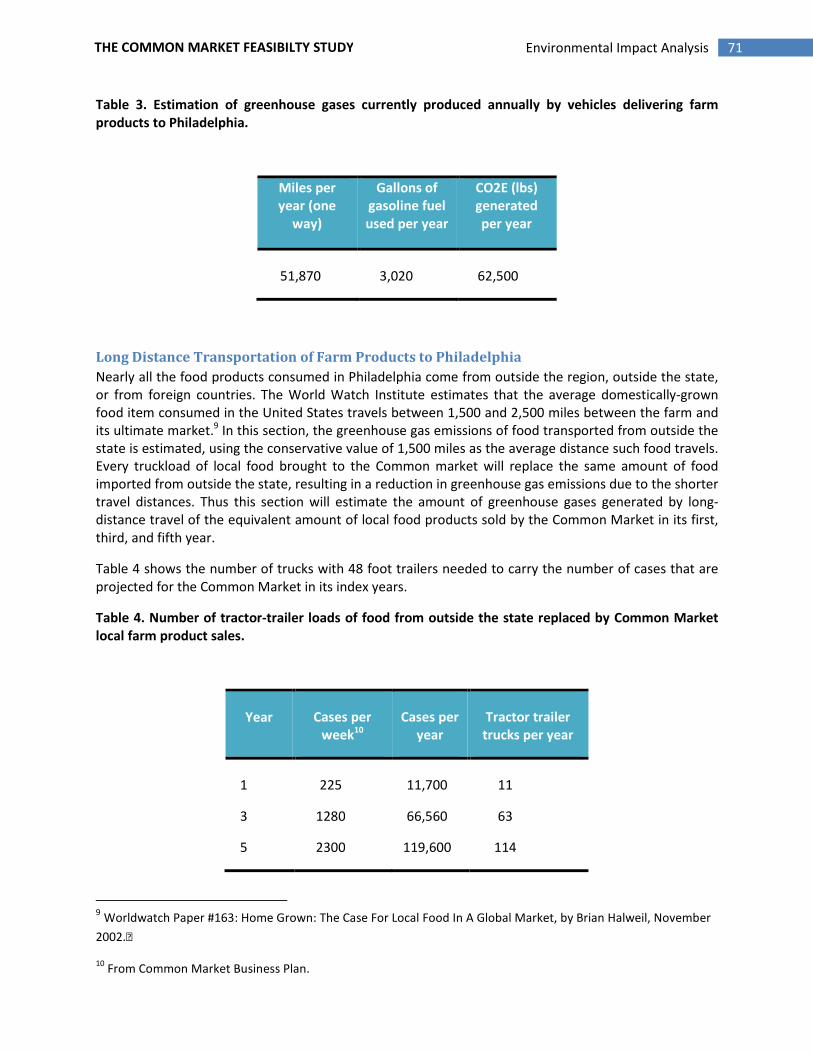
71 Environmental Impact Analysis THE COMMON MARKET FEASIBILTY STUDY
Table 3. Estimation of greenhouse gases currently produced annually by vehicles delivering farm
products to Philadelphia.
Miles per
year (one
way)
Gallons of
gasoline fuel
used per year
CO2E (lbs)
generated
per year
51,870 3,020 62,500
Long Distance Transportation of Farm Products to Philadelphia
Nearly all the food products consumed in Philadelphia come from outside the region, outside the state,
or from foreign countries. The World Watch Institute estimates that the average domestically-grown
food item consumed in the United States travels between 1,500 and 2,500 miles between the farm and
its ultimate market.9 In this section, the greenhouse gas emissions of food transported from outside the
state is estimated, using the conservative value of 1,500 miles as the average distance such food travels.
Every truckload of local food brought to the Common market will replace the same amount of food
imported from outside the state, resulting in a reduction in greenhouse gas emissions due to the shorter
travel distances. Thus this section will estimate the amount of greenhouse gases generated by long-
distance travel of the equivalent amount of local food products sold by the Common Market in its first,
third, and fifth year.
Table 4 shows the number of trucks with 48 foot trailers needed to carry the number of cases that are
projected for the Common Market in its index years.
Table 4. Number of tractor-trailer loads of food from outside the state replaced by Common Market
local farm product sales.
Year Cases per
week10
Cases per
year
Tractor trailer
trucks per year
1 225 11,700 11
3 1280 66,560 63
5 2300 119,600 114
9 Worldwatch Paper #163: Home Grown: The Case For Local Food In A Global Market, by Brian Halweil, November
2002.
10 From Common Market Business Plan.
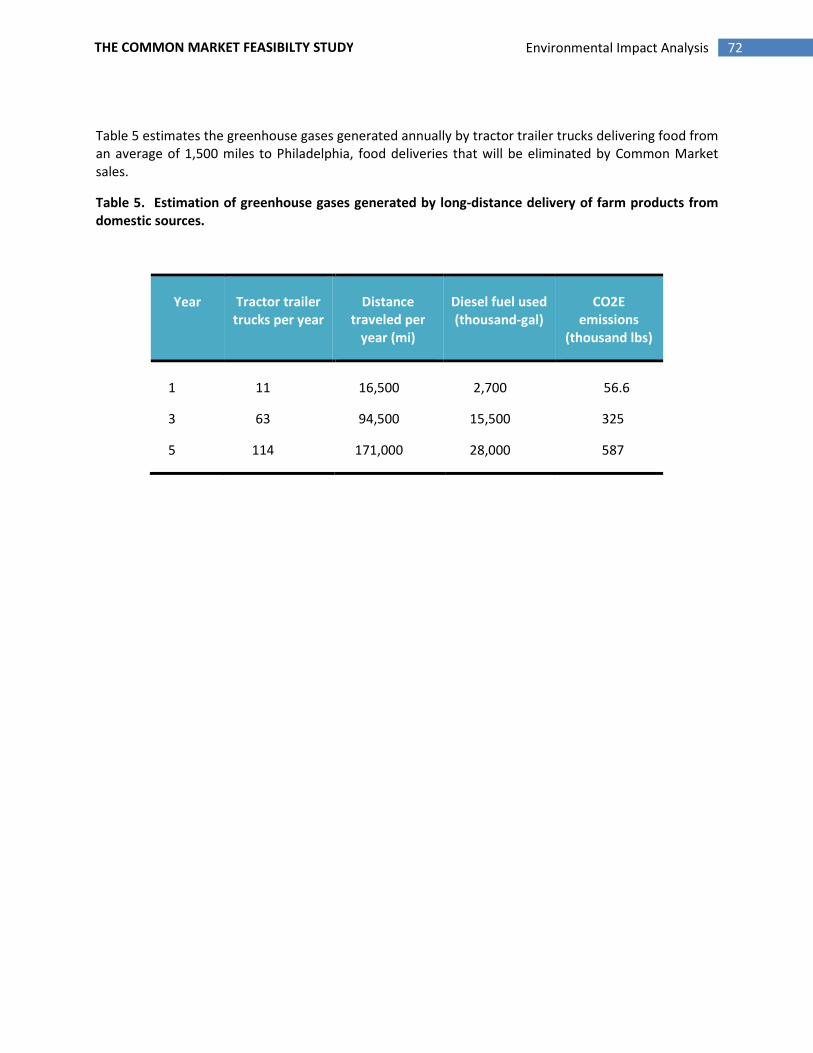
72 Environmental Impact Analysis THE COMMON MARKET FEASIBILTY STUDY
Table 5 estimates the greenhouse gases generated annually by tractor trailer trucks delivering food from
an average of 1,500 miles to Philadelphia, food deliveries that will be eliminated by Common Market
sales.
Table 5. Estimation of greenhouse gases generated by long-distance delivery of farm products from
domestic sources.
Year Tractor trailer
trucks per year
Distance
traveled per
year (mi)
Diesel fuel used
(thousand-gal)
CO2E
emissions
(thousand lbs)
1 11 16,500 2,700 56.6
3 63 94,500 15,500 325
5 114 171,000 28,000 587

73 Environmental Impact Analysis THE COMMON MARKET FEASIBILTY STUDY
Consolidated Transportation Model of Locally Grown Farm Products to Common Market
Philadelphia is surrounded by significant farm areas, in Pennsylvania, New Jersey, Maryland and
Delaware. For the purpose of this study, it was assumed that the food sold by the Common Market will
come from different farm areas in Pennsylvania within 150 miles of Philadelphia depending on the food
type typically produced in these areas: vegetables and melons – Lancaster County; tree fruit in Adams
County, and meat, poultry and dairy in Lehigh County. Four routes were defined to deliver farm
products to the Common Market and their one-way travel distances determined (Table 6). Sales of
meat, poultry, and dairy products will start in Year 3. The cases of local farm products transported in the
index years was given in Table 4 above.
Table 6. Common Market food trucking routes
Route Round Trip Food Type Distance
(one way
miles)
1 Philadelphia –
Biglersville –
Philadelphia
Tree fruit 137
2 Phliadelphia –
Quarryville –
Philadelphia
Vegetables
Melons
64
3 Philadelphia –
Kutztown –
Philadelphia
Vegetables
Dairy, Meat
Poultry
71
4 Phliadelphia –
Biglersville –
Quarryville –
Philadelphia
Tree fruit
Vegetables
150

74 Environmental Impact Analysis THE COMMON MARKET FEASIBILTY STUDY
One of the routes combines transport of tree fruit and vegetables to make more efficient use of the
truck. The selection of areas supplying the Common Market is conservative with respect to distance:
other farm areas closer to Philadelphia – e.g. southern New Jersey – could have been used resulting in
even large positive environmental impacts.
Once the routes were defined and the total cases of farm products divided by product type (see Table
1), the cases were consolidated onto skids for transport. Table 7 shows number of trucks, the weekly
trip frequency, the season, and the trips per year for the routes used to deliver the amount of farm
products needed to satisfy the projections in the business plan.
Table 7. Common Market farm product annual trips by route and year.
Year Route Route season,
frequency
Quantity, by
food type
Trucks per
active week
Number of
active weeks
Trips per
year
1 R4 every week
May – August
2.5 skids, fruit
3.75 skids,
vegetables
1 16 16
R2 every other week
Sept – March
3.75 skids,
vegetables
1 18 18
R4 every other week
Sept – March
5 skids, fruit
3.75 skids,
vegetables
1 18 18
3 R1 every week 10 skids, fruit 1 52 52
R2 every week 2/week, 8 skids,
vegetables
2 52 104
R3 every week 9 skids,
meat/poultry diary
1 52 52
5 R1 every week
3/week, 7 skids, fruit 3 52 156
R2 every week
3/week, 10 skids,
vegetables
3 52 156
R3 every week 2/week, 8 skids,
meat/poultry diary
2 52 104
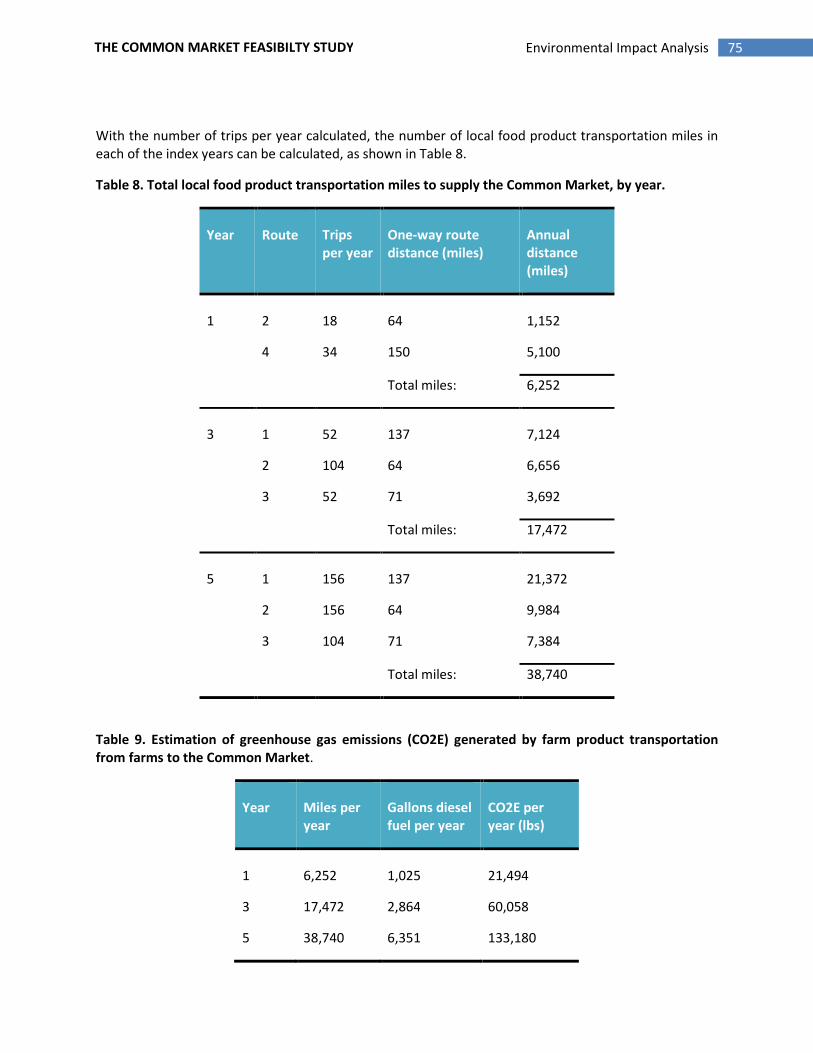
75 Environmental Impact Analysis THE COMMON MARKET FEASIBILTY STUDY
With the number of trips per year calculated, the number of local food product transportation miles in
each of the index years can be calculated, as shown in Table 8.
Table 8. Total local food product transportation miles to supply the Common Market, by year.
Year Route Trips
per year
One-way route
distance (miles)
Annual
distance
(miles)
1 2 18 64 1,152
4 34 150 5,100
Total miles: 6,252
3 1 52 137 7,124
2 104 64 6,656
3 52 71 3,692
Total miles: 17,472
5 1 156 137 21,372
2 156 64 9,984
3 104 71 7,384
Total miles: 38,740
Table 9. Estimation of greenhouse gas emissions (CO2E) generated by farm product transportation
from farms to the Common Market.
Year Miles per
year
Gallons diesel
fuel per year
CO2E per
year (lbs)
1 6,252 1,025 21,494
3 17,472 2,864 60,058
5 38,740 6,351 133,180
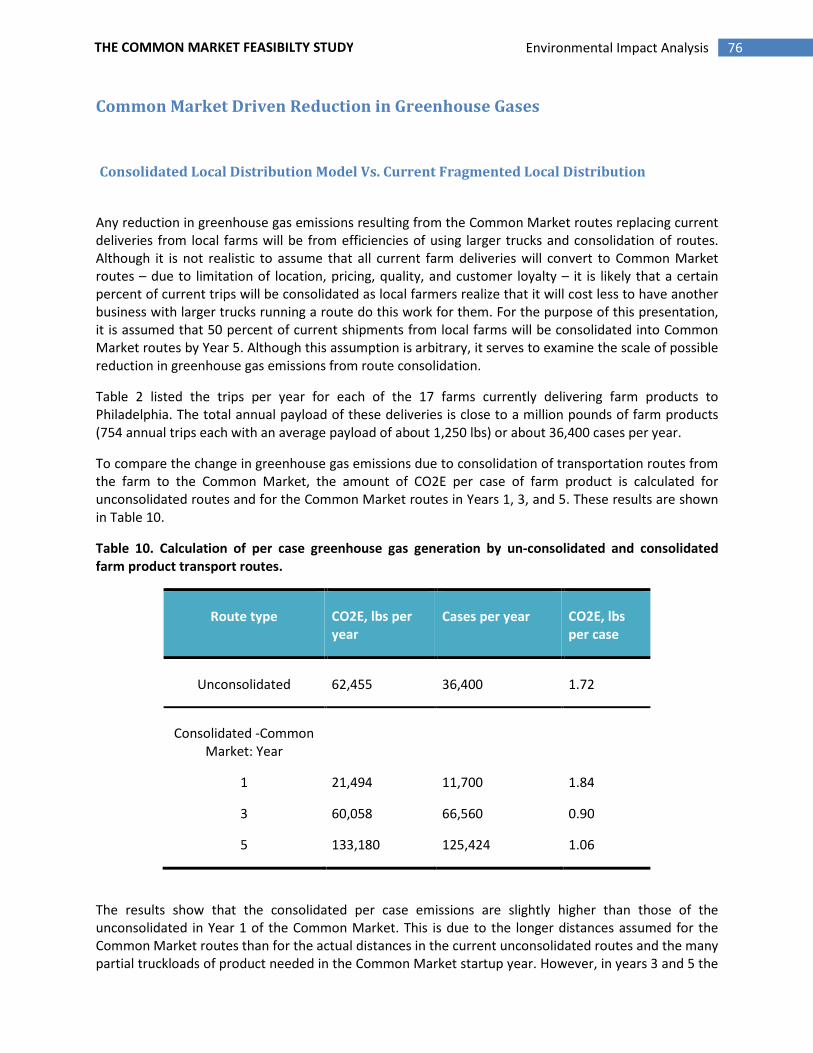
76 Environmental Impact Analysis THE COMMON MARKET FEASIBILTY STUDY
Common Market Driven Reduction in Greenhouse Gases
Consolidated Local Distribution Model Vs. Current Fragmented Local Distribution
Any reduction in greenhouse gas emissions resulting from the Common Market routes replacing current
deliveries from local farms will be from efficiencies of using larger trucks and consolidation of routes.
Although it is not realistic to assume that all current farm deliveries will convert to Common Market
routes – due to limitation of location, pricing, quality, and customer loyalty – it is likely that a certain
percent of current trips will be consolidated as local farmers realize that it will cost less to have another
business with larger trucks running a route do this work for them. For the purpose of this presentation,
it is assumed that 50 percent of current shipments from local farms will be consolidated into Common
Market routes by Year 5. Although this assumption is arbitrary, it serves to examine the scale of possible
reduction in greenhouse gas emissions from route consolidation.
Table 2 listed the trips per year for each of the 17 farms currently delivering farm products to
Philadelphia. The total annual payload of these deliveries is close to a million pounds of farm products
(754 annual trips each with an average payload of about 1,250 lbs) or about 36,400 cases per year.
To compare the change in greenhouse gas emissions due to consolidation of transportation routes from
the farm to the Common Market, the amount of CO2E per case of farm product is calculated for
unconsolidated routes and for the Common Market routes in Years 1, 3, and 5. These results are shown
in Table 10.
Table 10. Calculation of per case greenhouse gas generation by un-consolidated and consolidated
farm product transport routes.
Route type CO2E, lbs per
year
Cases per year CO2E, lbs
per case
Unconsolidated 62,455 36,400 1.72
Consolidated -Common
Market: Year
1 21,494 11,700 1.84
3 60,058 66,560 0.90
5 133,180 125,424 1.06
The results show that the consolidated per case emissions are slightly higher than those of the
unconsolidated in Year 1 of the Common Market. This is due to the longer distances assumed for the
Common Market routes than for the actual distances in the current unconsolidated routes and the many
partial truckloads of product needed in the Common Market startup year. However, in years 3 and 5 the
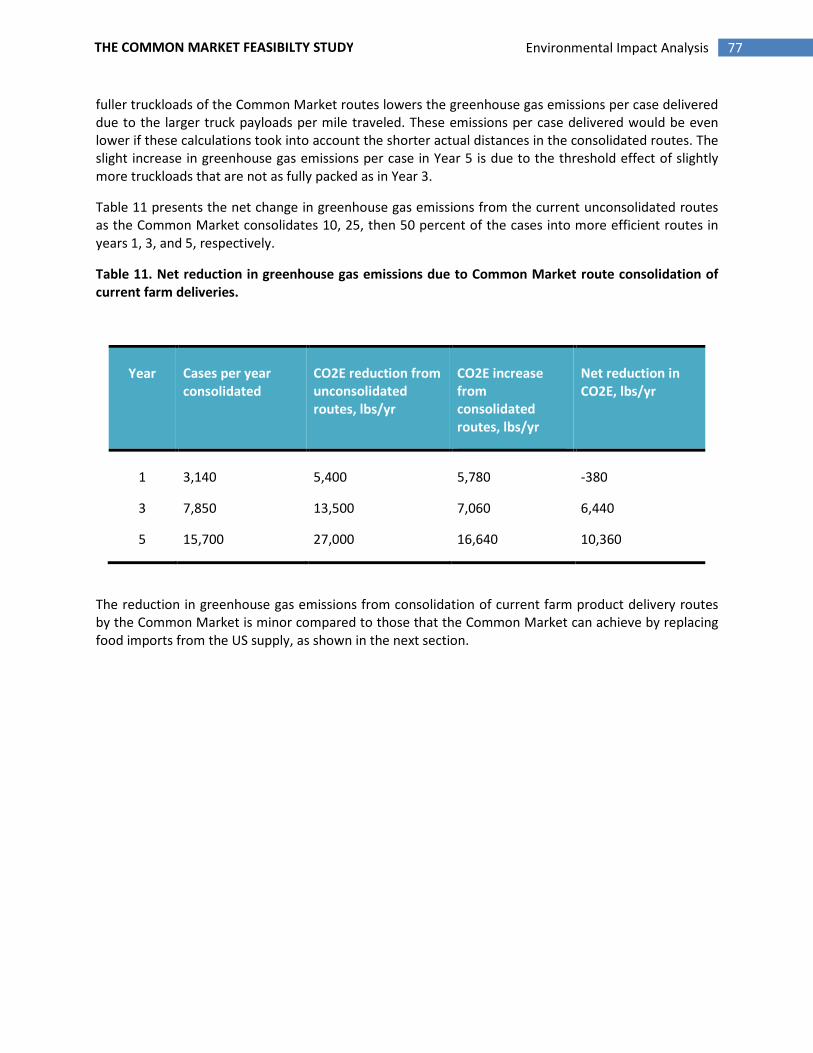
77 Environmental Impact Analysis THE COMMON MARKET FEASIBILTY STUDY
fuller truckloads of the Common Market routes lowers the greenhouse gas emissions per case delivered
due to the larger truck payloads per mile traveled. These emissions per case delivered would be even
lower if these calculations took into account the shorter actual distances in the consolidated routes. The
slight increase in greenhouse gas emissions per case in Year 5 is due to the threshold effect of slightly
more truckloads that are not as fully packed as in Year 3.
Table 11 presents the net change in greenhouse gas emissions from the current unconsolidated routes
as the Common Market consolidates 10, 25, then 50 percent of the cases into more efficient routes in
years 1, 3, and 5, respectively.
Table 11. Net reduction in greenhouse gas emissions due to Common Market route consolidation of
current farm deliveries.
Year Cases per year
consolidated
CO2E reduction from
unconsolidated
routes, lbs/yr
CO2E increase
from
consolidated
routes, lbs/yr
Net reduction in
CO2E, lbs/yr
1 3,140 5,400 5,780 -380
3 7,850 13,500 7,060 6,440
5 15,700 27,000 16,640 10,360
The reduction in greenhouse gas emissions from consolidation of current farm product delivery routes
by the Common Market is minor compared to those that the Common Market can achieve by replacing
food imports from the US supply, as shown in the next section.
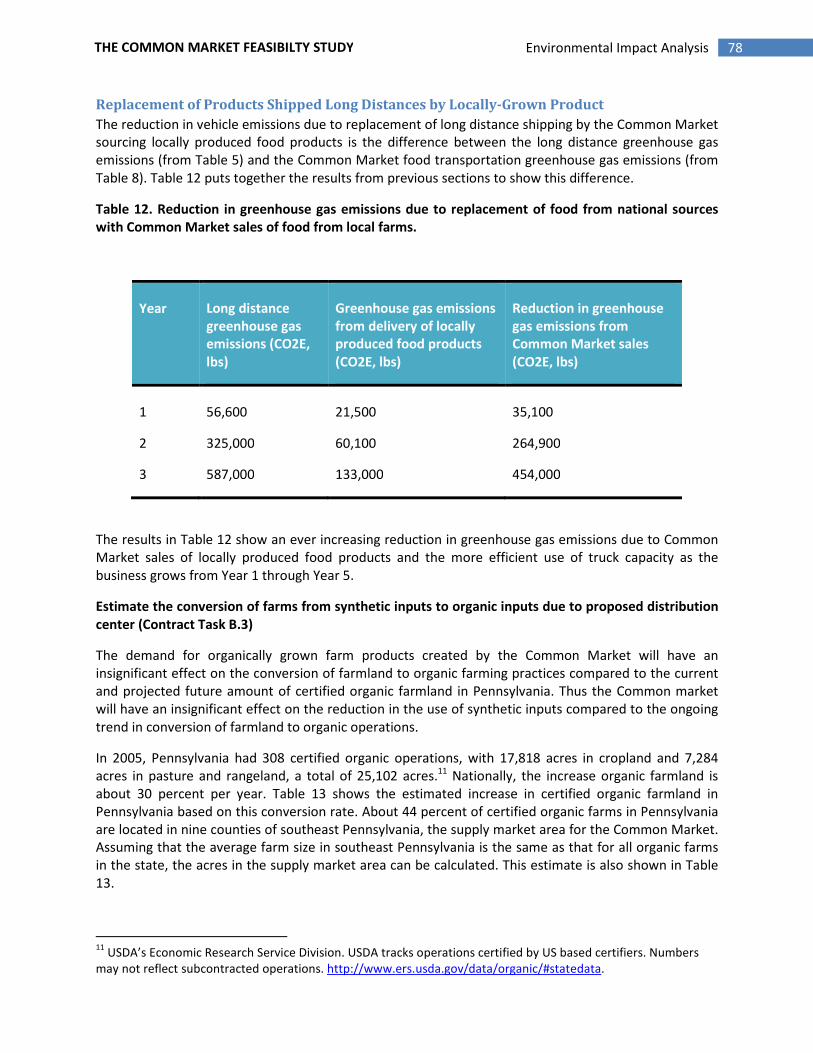
78 Environmental Impact Analysis THE COMMON MARKET FEASIBILTY STUDY
Replacement of Products Shipped Long Distances by Locally-Grown Product
The reduction in vehicle emissions due to replacement of long distance shipping by the Common Market
sourcing locally produced food products is the difference between the long distance greenhouse gas
emissions (from Table 5) and the Common Market food transportation greenhouse gas emissions (from
Table 8). Table 12 puts together the results from previous sections to show this difference.
Table 12. Reduction in greenhouse gas emissions due to replacement of food from national sources
with Common Market sales of food from local farms.
Year Long distance
greenhouse gas
emissions (CO2E,
lbs)
Greenhouse gas emissions
from delivery of locally
produced food products
(CO2E, lbs)
Reduction in greenhouse
gas emissions from
Common Market sales
(CO2E, lbs)
1 56,600 21,500 35,100
2 325,000 60,100 264,900
3 587,000 133,000 454,000
The results in Table 12 show an ever increasing reduction in greenhouse gas emissions due to Common
Market sales of locally produced food products and the more efficient use of truck capacity as the
business grows from Year 1 through Year 5.
Estimate the conversion of farms from synthetic inputs to organic inputs due to proposed distribution
center (Contract Task B.3)
The demand for organically grown farm products created by the Common Market will have an
insignificant effect on the conversion of farmland to organic farming practices compared to the current
and projected future amount of certified organic farmland in Pennsylvania. Thus the Common market
will have an insignificant effect on the reduction in the use of synthetic inputs compared to the ongoing
trend in conversion of farmland to organic operations.
In 2005, Pennsylvania had 308 certified organic operations, with 17,818 acres in cropland and 7,284
acres in pasture and rangeland, a total of 25,102 acres.11 Nationally, the increase organic farmland is
about 30 percent per year. Table 13 shows the estimated increase in certified organic farmland in
Pennsylvania based on this conversion rate. About 44 percent of certified organic farms in Pennsylvania
are located in nine counties of southeast Pennsylvania, the supply market area for the Common Market.
Assuming that the average farm size in southeast Pennsylvania is the same as that for all organic farms
in the state, the acres in the supply market area can be calculated. This estimate is also shown in Table
13.
11
USDA’s Economic Research Service Division. USDA tracks operations certified by US based certifiers. Numbers
may not reflect subcontracted operations. http://www.ers.usda.gov/data/organic/#statedata.
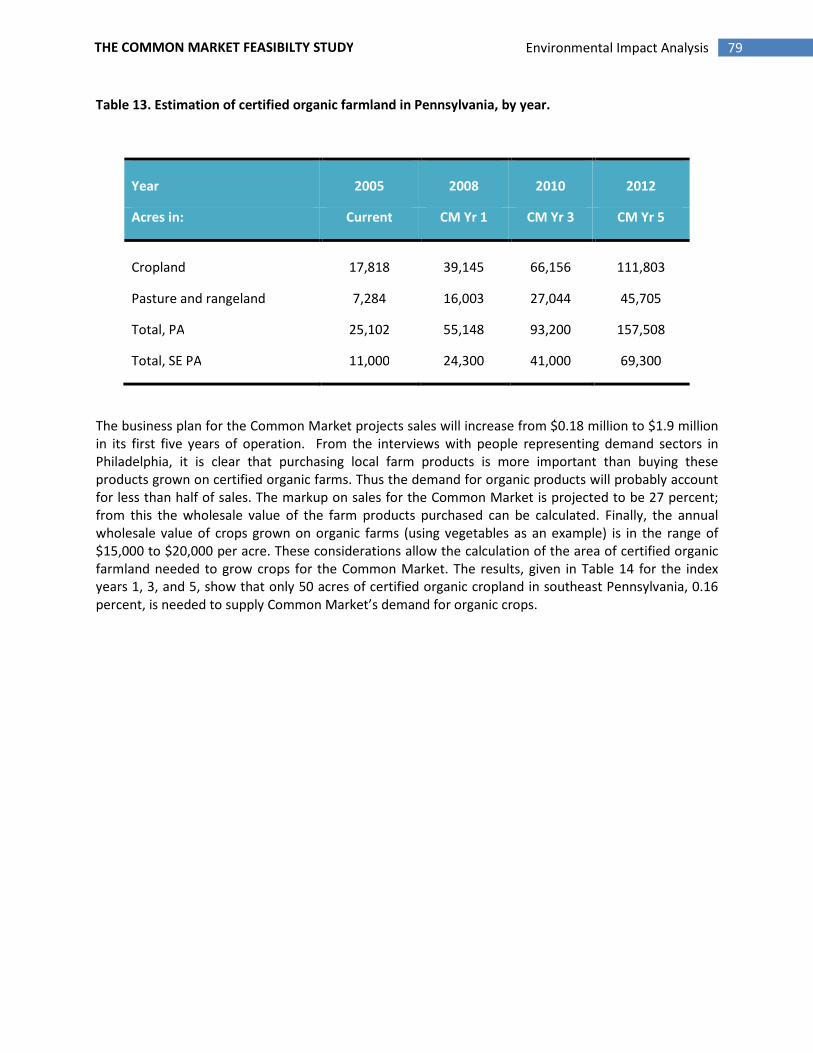
79 Environmental Impact Analysis THE COMMON MARKET FEASIBILTY STUDY
Table 13. Estimation of certified organic farmland in Pennsylvania, by year.
Year 2005 2008 2010 2012
Acres in: Current CM Yr 1 CM Yr 3 CM Yr 5
Cropland 17,818 39,145 66,156 111,803
Pasture and rangeland 7,284 16,003 27,044 45,705
Total, PA 25,102 55,148 93,200 157,508
Total, SE PA 11,000 24,300 41,000 69,300
The business plan for the Common Market projects sales will increase from $0.18 million to $1.9 million
in its first five years of operation. From the interviews with people representing demand sectors in
Philadelphia, it is clear that purchasing local farm products is more important than buying these
products grown on certified organic farms. Thus the demand for organic products will probably account
for less than half of sales. The markup on sales for the Common Market is projected to be 27 percent;
from this the wholesale value of the farm products purchased can be calculated. Finally, the annual
wholesale value of crops grown on organic farms (using vegetables as an example) is in the range of
$15,000 to $20,000 per acre. These considerations allow the calculation of the area of certified organic
farmland needed to grow crops for the Common Market. The results, given in Table 14 for the index
years 1, 3, and 5, show that only 50 acres of certified organic cropland in southeast Pennsylvania, 0.16
percent, is needed to supply Common Market’s demand for organic crops.
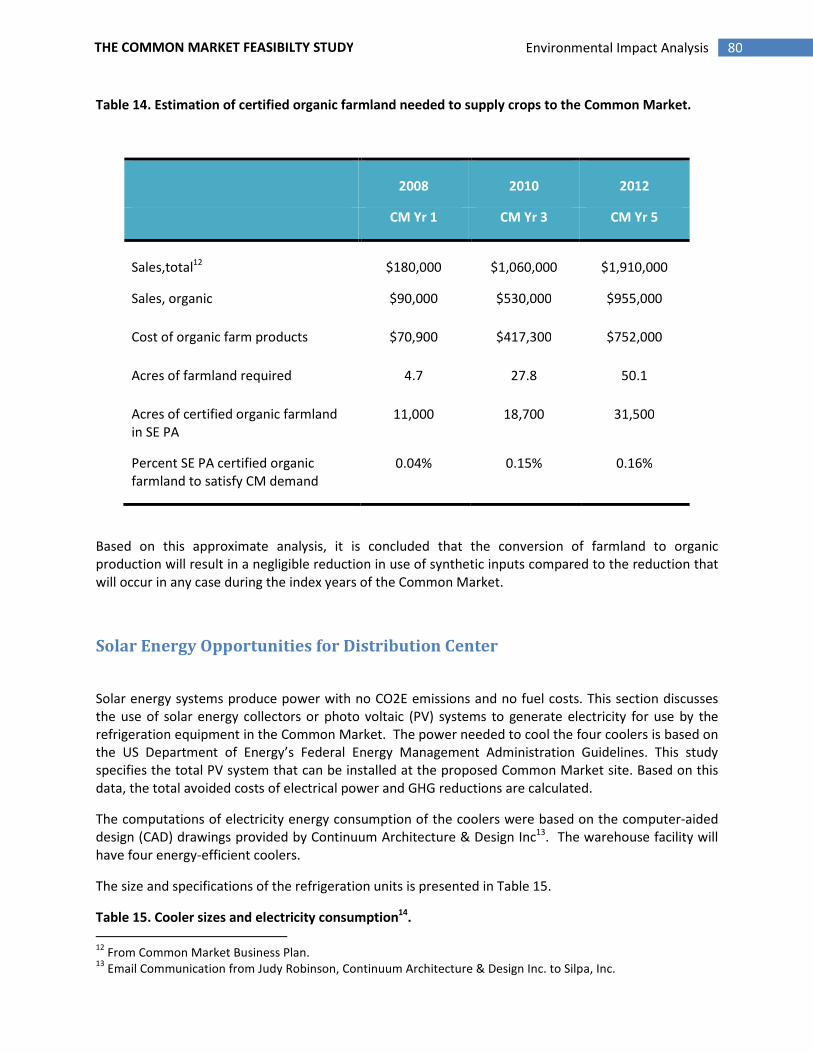
80 Environmental Impact Analysis THE COMMON MARKET FEASIBILTY STUDY
Table 14. Estimation of certified organic farmland needed to supply crops to the Common Market.
2008 2010 2012
CM Yr 1 CM Yr 3 CM Yr 5
Sales,total12 $180,000 $1,060,000 $1,910,000
Sales, organic $90,000 $530,000 $955,000
Cost of organic farm products $70,900 $417,300 $752,000
Acres of farmland required 4.7 27.8 50.1
Acres of certified organic farmland
in SE PA
11,000 18,700 31,500
Percent SE PA certified organic
farmland to satisfy CM demand
0.04% 0.15% 0.16%
Based on this approximate analysis, it is concluded that the conversion of farmland to organic
production will result in a negligible reduction in use of synthetic inputs compared to the reduction that
will occur in any case during the index years of the Common Market.
Solar Energy Opportunities for Distribution Center
Solar energy systems produce power with no CO2E emissions and no fuel costs. This section discusses
the use of solar energy collectors or photo voltaic (PV) systems to generate electricity for use by the
refrigeration equipment in the Common Market. The power needed to cool the four coolers is based on
the US Department of Energy’s Federal Energy Management Administration Guidelines. This study
specifies the total PV system that can be installed at the proposed Common Market site. Based on this
data, the total avoided costs of electrical power and GHG reductions are calculated.
The computations of electricity energy consumption of the coolers were based on the computer-aided
design (CAD) drawings provided by Continuum Architecture & Design Inc13. The warehouse facility will
have four energy-efficient coolers.
The size and specifications of the refrigeration units is presented in Table 15.
Table 15. Cooler sizes and electricity consumption14
.
12
From Common Market Business Plan. 13
Email Communication from Judy Robinson, Continuum Architecture & Design Inc. to Silpa, Inc.
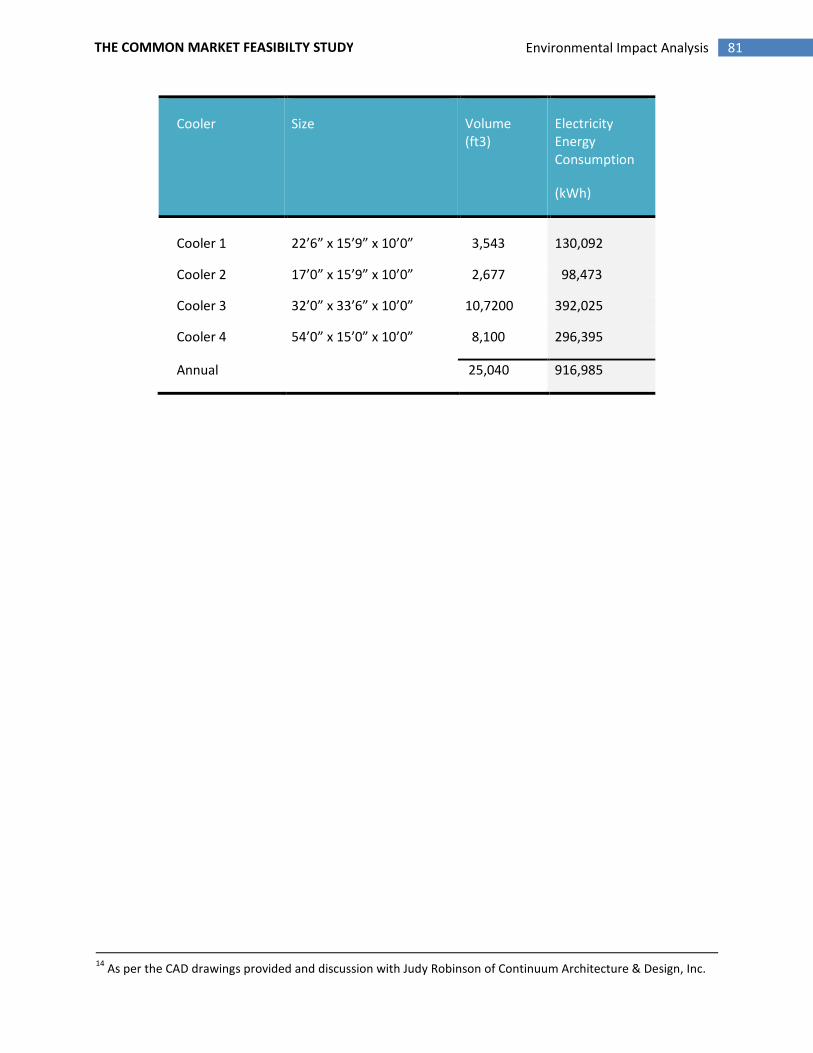
81 Environmental Impact Analysis THE COMMON MARKET FEASIBILTY STUDY
Cooler Size Volume
(ft3)
Electricity
Energy
Consumption
(kWh)
Cooler 1 22’6” x 15’9” x 10’0” 3,543 130,092
Cooler 2 17’0” x 15’9” x 10’0” 2,677 98,473
Cooler 3 32’0” x 33’6” x 10’0” 10,7200 392,025
Cooler 4 54’0” x 15’0” x 10’0” 8,100 296,395
Annual 25,040 916,985
14
As per the CAD drawings provided and discussion with Judy Robinson of Continuum Architecture & Design, Inc.
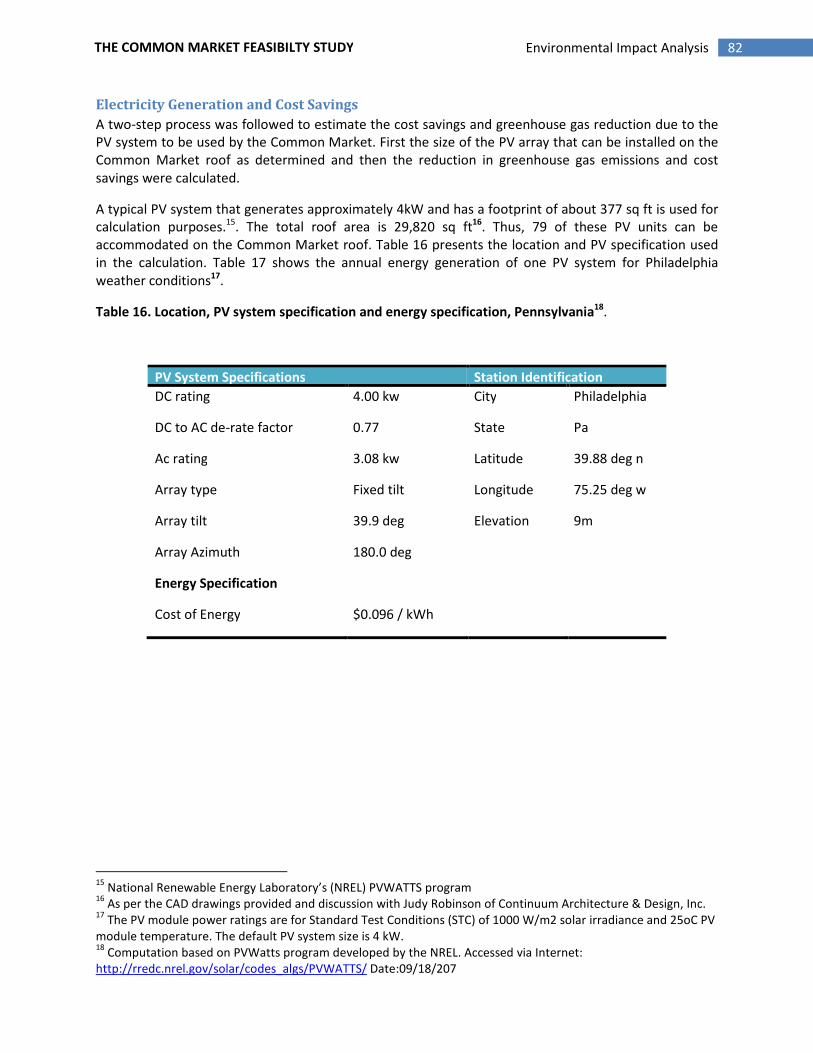
82 Environmental Impact Analysis THE COMMON MARKET FEASIBILTY STUDY
Electricity Generation and Cost Savings
A two-step process was followed to estimate the cost savings and greenhouse gas reduction due to the
PV system to be used by the Common Market. First the size of the PV array that can be installed on the
Common Market roof as determined and then the reduction in greenhouse gas emissions and cost
savings were calculated.
A typical PV system that generates approximately 4kW and has a footprint of about 377 sq ft is used for
calculation purposes.15. The total roof area is 29,820 sq ft16. Thus, 79 of these PV units can be
accommodated on the Common Market roof. Table 16 presents the location and PV specification used
in the calculation. Table 17 shows the annual energy generation of one PV system for Philadelphia
weather conditions17.
Table 16. Location, PV system specification and energy specification, Pennsylvania18.
PV System Specifications Station Identification
DC rating 4.00 kw City Philadelphia
DC to AC de-rate factor 0.77 State Pa
Ac rating 3.08 kw Latitude 39.88 deg n
Array type Fixed tilt Longitude 75.25 deg w
Array tilt 39.9 deg Elevation 9m
Array Azimuth 180.0 deg
Energy Specification
Cost of Energy $0.096 / kWh
15
National Renewable Energy Laboratory’s (NREL) PVWATTS program 16
As per the CAD drawings provided and discussion with Judy Robinson of Continuum Architecture & Design, Inc. 17
The PV module power ratings are for Standard Test Conditions (STC) of 1000 W/m2 solar irradiance and 25oC PV
module temperature. The default PV system size is 4 kW. 18
Computation based on PVWatts program developed by the NREL. Accessed via Internet:
http://rredc.nrel.gov/solar/codes_algs/PVWATTS/ Date:09/18/207
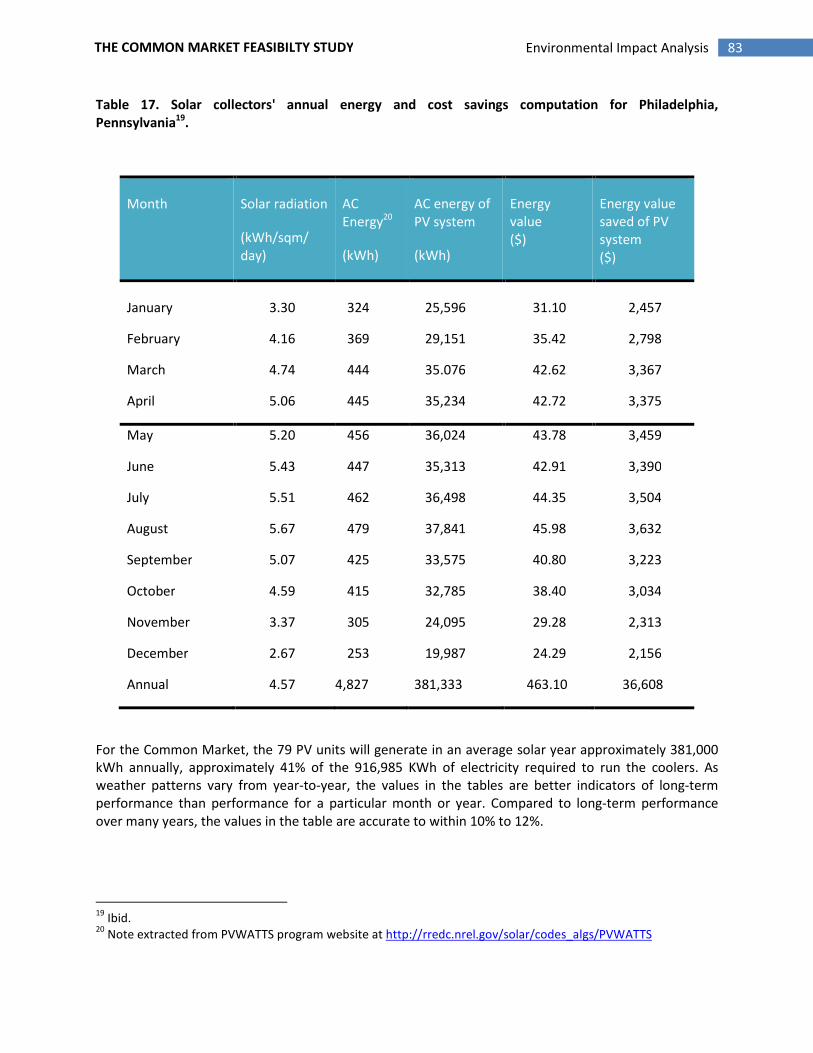
83 Environmental Impact Analysis THE COMMON MARKET FEASIBILTY STUDY
Table 17. Solar collectors' annual energy and cost savings computation for Philadelphia,
Pennsylvania19
.
Month Solar radiation
(kWh/sqm/
day)
AC
Energy20
(kWh)
AC energy of
PV system
(kWh)
Energy
value
($)
Energy value
saved of PV
system
($)
January 3.30 324 25,596 31.10 2,457
February 4.16 369 29,151 35.42 2,798
March 4.74 444 35.076 42.62 3,367
April 5.06 445 35,234 42.72 3,375
May 5.20 456 36,024 43.78 3,459
June 5.43 447 35,313 42.91 3,390
July 5.51 462 36,498 44.35 3,504
August 5.67 479 37,841 45.98 3,632
September 5.07 425 33,575 40.80 3,223
October 4.59 415 32,785 38.40 3,034
November 3.37 305 24,095 29.28 2,313
December 2.67 253 19,987 24.29 2,156
Annual 4.57 4,827 381,333 463.10 36,608
For the Common Market, the 79 PV units will generate in an average solar year approximately 381,000
kWh annually, approximately 41% of the 916,985 KWh of electricity required to run the coolers. As
weather patterns vary from year-to-year, the values in the tables are better indicators of long-term
performance than performance for a particular month or year. Compared to long-term performance
over many years, the values in the table are accurate to within 10% to 12%.
19
Ibid. 20
Note extracted from PVWATTS program website at http://rredc.nrel.gov/solar/codes_algs/PVWATTS
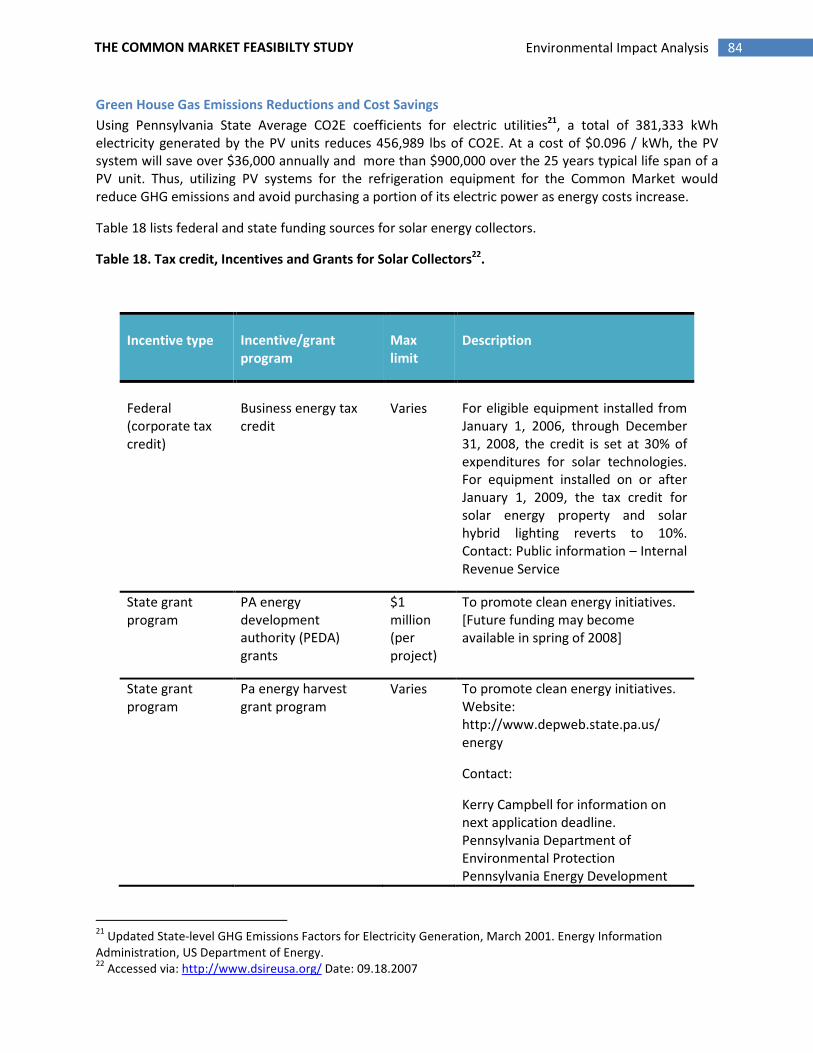
84 Environmental Impact Analysis THE COMMON MARKET FEASIBILTY STUDY
Green House Gas Emissions Reductions and Cost Savings
Using Pennsylvania State Average CO2E coefficients for electric utilities21, a total of 381,333 kWh
electricity generated by the PV units reduces 456,989 lbs of CO2E. At a cost of $0.096 / kWh, the PV
system will save over $36,000 annually and more than $900,000 over the 25 years typical life span of a
PV unit. Thus, utilizing PV systems for the refrigeration equipment for the Common Market would
reduce GHG emissions and avoid purchasing a portion of its electric power as energy costs increase.
Table 18 lists federal and state funding sources for solar energy collectors.
Table 18. Tax credit, Incentives and Grants for Solar Collectors22
.
Incentive type Incentive/grant
program
Max
limit
Description
Federal
(corporate tax
credit)
Business energy tax
credit
Varies For eligible equipment installed from
January 1, 2006, through December
31, 2008, the credit is set at 30% of
expenditures for solar technologies.
For equipment installed on or after
January 1, 2009, the tax credit for
solar energy property and solar
hybrid lighting reverts to 10%.
Contact: Public information – Internal
Revenue Service
State grant
program
PA energy
development
authority (PEDA)
grants
$1
million
(per
project)
To promote clean energy initiatives.
[Future funding may become
available in spring of 2008]
State grant
program
Pa energy harvest
grant program
Varies To promote clean energy initiatives.
Website:
http://www.depweb.state.pa.us/
energy
Contact:
Kerry Campbell for information on
next application deadline.
Pennsylvania Department of
Environmental Protection
Pennsylvania Energy Development
21
Updated State-level GHG Emissions Factors for Electricity Generation, March 2001. Energy Information
Administration, US Department of Energy. 22
Accessed via: http://www.dsireusa.org/ Date: 09.18.2007
85 Environmental Impact Analysis THE COMMON MARKET FEASIBILTY STUDY
Authority (717) 772-5985
Local grant
program (pa)
Sustainable
development fund
grant program (PECO
territory)
$25,000 Companies and organizations that
are end-users of renewable energy,
advanced clean energy and energy-
conserving products and
technologies. Website:
http://www.trfund.com/sdf/grants.ht
ml
Contact:
Roger Clark, Sustainable
Development Fund
718 Arch Street, Suite 300 north
Philadelphia, PA 19106
phone: (215) 574-5814
Solar Recommendations
Incorporating a solar energy collection system into the Common Market has several advantages:
� Clean energy production for 41 percent of cooler power requirements,
� Utility cost savings,
� Possible federal incentives and grants.
Based on the results of the data and analysis of the overall benefits, it is recommended that the
Common Market integrate PV units in the proposed site.
86 Conclusions & Recommendations THE COMMON MARKET FEASIBILTY STUDY
Conclusions & Recommendations
The Common Market model, born out of the collective desire of Philadelphia-based individuals and
organizations to impact the supply constraints of local food, has been demonstrated through this study
to be both feasible and in great demand. This project has the potential to significantly expand the
amount of food grown and consumed within the Philadelphia region simultaneously improving the food
security of consumers while enhancing the viability of local farm communities. While the demand for
this model of values-based distribution holds great potential, the implementation of the business will
prove challenging while project partners balance the group's social mission and the need to operate a
fiscally efficient, low margin enterprise.
After conducting market research to find a comparable operating model, the study team found no other
operation that perfectly mirrored the Common Market platform. This created a challenge for the study
team which had to draw more assumptions while testing the financial viability of the business. It also
allowed the study team to shift certain aspects of the business in response to the research, extracting
best practices from numerous different yet successful models and bending the CM model to better
serve supply and demand-side stakeholders. The core value proposition and proposed service of the
Common Market was widely regarded by interview participants to be the "missing link" for the
Philadelphia local food economy. This enthusiastic response coupled with the observation of the
profitable and growing local-organic distribution model suggests strong market opportunity for the
Common Market. It is the hope of the project partners that the model will prove to be replicable in
other markets.
Demand sector analysis provided affirmation of the project partners' identification of need for the
Common Market. While most respondents indicated a commitment to purchasing locally, the barriers
to doing so seemed to multiply in correlation to the quantity of food purchased. Herein lies one of the
greatest market niche opportunities for the project. Being able to meet the stringent licensing,
regulatory and insurance requirements will open significant sales channels. The ability to source and
consolidate all products currently grown locally will create significant competitive advantage for a
distributor seeking to serve the institutional clientele. With this said, it may behoove the Common
Market to limit its sales to fruits and vegetables at start-up due to lower regulatory hurdles. All
categories of buyers expressed the need to have a year-round supply of product. This will necessitate
both season-extending efforts locally and relationships with like-valued growers in warmer climates.
Fair-trade sourcing should be considered to round out product offerings.
The following salient points were revealed through the demand-side interviews:
Operations
• Most prefer morning deliveries and place orders in the afternoons,
87 Conclusions & Recommendations THE COMMON MARKET FEASIBILTY STUDY
• The greatest operational challenges result from space constraints for product storage and
preparation as well as ongoing personnel problems; no-shows and late arrivals of deliveries and
staff aggravates problems,
• Looking for strong supplier relationships with purveyors of the greatest variety of high quality
products.
Purchasing and Replenishment
• Heavy reliance on telephone communication and personal communication,
• Strong desire for frequent deliveries; Just-in-time or night before ordering when possible,
• Buyers want delivery and are not interested in pick-up,
• Regarding the billing process, three key points were fairly consistent among the respondents:
o Prefer invoice to accompany delivery,
o Generally want a separate packing slip (bill of lading) to accompany delivery,
o Generally want a consolidated invoice with weekly or monthly statement summaries,
• The respondents consistently rank the following (in the order shown) as the most important
factors in working with a vendor:
o Quality of product and service,
o Ethics/principles of supplier/relationship,
o Price. The only exception was the institutional respondents who ranked price as the
single most important factor in choosing a vendor,
• Year round supply is critical to strong and consistent vendor/supplier relationship.
Product
• Strong preference for local over organic,
• Preference for pastured, antibiotic-free and humanely-raised animal products,
• There exists a variety of preferences for packaging and processing depending on the buyer but
the institutional buyers seek produce that has been washed and cut.
Barriers to purchasing local products
• Lack of reliable distribution that meet a variety of size, regulatory and insurance requirements,
• Wholesale product identity as "local" and farm identification and information,
• Lack of "point-of-purchase" support material,
• Year-round supply or seasonality,
• Lack of knowledge about products and availability,
• Product form (whole vs. processed).
The most important attribute of any food distribution enterprise should be reliability- both in delivery
and quality. For this reason the ability of this business to grow and maintain strong buyer relationships
will hinge upon its supply network. While wholesale demand is strong and growing, the historic absence
of a distributor like the one proposed in this study has allowed demand to significantly outstrip the
supply capacity of the current fragmented distribution system for locally grown products. Adopting a

88 Conclusions & Recommendations THE COMMON MARKET FEASIBILTY STUDY
slow-growth approach to sales will be important while the Common Market builds relationships with
farmers and fine-tunes logistics. The nascent effort should never promise what it cannot provide. The
Common Market's reliability to its customers must also match payment consistency with farmers if it is
to earn their trust and long-term commitment.
The panel participants, along with the analysis of Pennsylvania (PA) state and United States Department
of Agriculture (USDA) statistical data, indicate that enough products are produced in close proximity to
Philadelphia to support a distribution business proposed by the Common Market (in terms of product
mix and volume). Maintaining strong relationships with farmers based on trust will be imperative to
growing a reliable supply network. These relationships will be further enhanced by adhering to the
following suggestions made by interview participants:
Organizationally, there is a clear desire on the part of producers to work with a wholesaler or
distributor that will provide better access to local markets and treat them in more respectful, non-
exploitative manner. Therefore, the Common Market’s value proposition for prospective suppliers
should be to provide transparency, vested interest for producers, transportation services, professional
sales representation, secure financial backing to ensure timely payment, and quick and fair dispute
resolution.
Operationally, the Common Market will require a facility to receive, store, prepare, assemble and
ship products; trucks to deliver (and possibly pickup from farms) products; and a staff for logistics (for all
trucking and internal handling), sales and management. Sales will require adequate staffing to maintain
regular, consistent, informed contact with the customer base while prospecting for new customers.
Capacity to produce certain value-added product would increase farmer interest. Specifically this would
include a USDA butchering facility with storage and freezing equipment and freezer storage for both
meats and fresh produce items for out-of-season sales.
Capital will be an important component to the success of the Common Market. Appropriate
capitalization of facilities will be necessary to provide the necessary services to interest farmers and
products for customers. In addition, farmers participating in the producer panels indicated a strong
desire for fast pay. Therefore, the Common Market will require adequate access to cash to cover the
spread between fast payment terms and its receivables.
While the facility owned by project partners proved to be a non-cost effective option, it opened up an
opportunity to find an optimally located, low cost facility. The overall financial viability of the project is
enhanced by cost and location of this vital distribution component. It is recommended that if possible,
the project locate in a facility where it uses an existing distributor's excess capacity. This will allow the
project to lower its overall cost basis at startup and learn from an existing operator.
One premise for the need of the Common Market in facilitating a sustainable, local agricultural economy
is the creation of distribution efficiencies. The study team has observed that the majority of local farm
product sold in the Philadelphia market is transported by means of a fragmented, inefficient system of
independent growers and shippers. By applying best practices of logistics systems and distribution
location theory, the Common Market study team was able to evaluate proposed warehouse facilities
based both on the financial operating feasibility as well as optimal location.
89 Conclusions & Recommendations THE COMMON MARKET FEASIBILTY STUDY
Efficiencies of this project are rooted in creating a market-based point of agricultural product
aggregation or consolidation and physical distribution or outbound logistics. By locating the facility
close to the market, the operation will be more efficiently responsive to the gravity of demand through
shortened outbound logistics and response times. The project will also seek to consolidate the inbound
logistics of the farm products by coordinating farm-side trucking, pickup routes and cross docking
opportunities. Once the operation reaches scale, the Common Market will explore creating supply-side
points of consolidation or shipping points in the farm communities to most efficiently move larger
volumes of diverse products to the market-based distribution facility.
The grantee is the owner of a suitably sized and located warehouse facility so the potential use of that
space was analyzed first. Once it was determined that it was cost prohibitive to build out the grantee's
warehouse, potential leasehold sites were considered based on proximity to highways and the market.
After analyzing several potential locations, the Common Market management team decided to share the
excess capacity of an existing distribution facility operated by a nonprofit organization dealing in food
security for low-income constituents. There exists a great partnership possibility with this organization
to help the Common Market achieve some its urban focused, mission based activities.
After carefully considering several different business structures, weighing the numerous needs of the
project partners with the legal, tax and funding implications of each, the recommendation of this study
is that the Common Market be launched as a Pennsylvania nonprofit corporation. It should be
organized in a way that will give it maximum flexibility, allowing managers to determine whether it
should transition into a 501(c)3 federal nonprofit or a for profit corporation in the future.
The strong focus on the social benefit of the proposed project in conjunction with the need to raise
significant start-up funding to achieve this impact made the nonprofit structure the natural selection.
This structure also allows for varying levels of participation by project partners in the governance of the
organization without profit motive. Partners will participate to further their respective organization's
mission while expanding their impact on food access, security and local farm preservation through this
collective effort.
While nonprofit structure will not have as strong of a direct tax benefit for Philadelphia and the
Commonwealth of Pennsylvania, there exists a multitude of ancillary economic benefits, job creation
and income tax benefits resulting from its operations. The following are the most significant potential
external economic benefits resulting from Common Market operations:
Value of Additional Agricultural Production The wholesale value of agriculture product sold by the
Common Market is projected to start at $137k in its first year of operations and grow to $1.4M by the
end of the fifth year of operations. In addition to the direct economic impact, the multiplier effect on
each of the nine counties of sales to the Common Market is projected to be $264k in the first year of
operations and grows to $2.7M by the end of the fifth year
Employment Generation
The Common Market will generate jobs, both directly and indirectly in Philadelphia and the nine
Pennsylvania counties supplying the distribution center. According to employment projections in the
90 Conclusions & Recommendations THE COMMON MARKET FEASIBILTY STUDY
business plan, the Common Market will launch with 2.5 full-time equivalent (FTE) employees and grow
to employ 5 FTE employees by its fifth year of operations. The direct sales of agricultural product to the
Common Market will generate jobs in the nine rural Pennsylvania counties that are the primary
suppliers to the distribution center. Based on sales projections, the Common Market will create 2.0 FTE
external farm jobs in its first year and job creation will grow to 20.53 FTE by the fifth year of operations.
There is also an associated job multiplier resulting Common Market operations which ranged from 1.3 to
2.1, meaning that for each FTE job created, an additional 0.3 to 1.1 FTE jobs were generated.
Combining the distribution center jobs, farm jobs and ripple effect jobs generated as a result of the
Common Market yields 5.9 total additional FTE jobs in the first year of operations and grows to 39.9 by
the end of the fifth year.
State and Local Tax Effect
The Common Market’s primary effect on state and local taxes will be the Pennsylvania Personal Income
Tax and the Philadelphia Wage Tax of direct employees of the Distribution Center. Based on
employment projections in the business plan, the Common Market will generate $4,600 of additional
direct tax revenue in its first year of operations, growing to $12,000 by its fifth year of operations. The
tax benefit of jobs potentially created by indirect and multiplying effects is more subjective.
Quantitative Benefit to Farmers
The Common Market benefits farmers economically by giving them a venue to sell additional
production. The value of agriculture product sold by the Common Market is projected to start at $137k
in its first year of operations and grow to $1.4M by the end of the fifth year of operations. This is
equivalent to purchasing all the production of more than one median farm of the nine primary source
counties in its first year of operations. By its fifth year of operations, the Common Market will purchase
the equivalent of all the production of more than 12 farms.
Non-Quantitative Benefits to Farmers
There exists numerous non-quantitiative potential benefits to farmers generated through the creation
of the Common Market. A few are mentioned below:
• Increased efficiency in marketing and delivering local foods,
• Sustainable future for mid-sized farms,
• Farmland preservation,
• Support for institutional purchasing of local foods,
• Better crop coordination and understanding of market demand.
Consolidation of distribution routes and the replacement in the Philadelphia marketplace of food grown
thousands of miles away will benefit the global as well as local environments. The project also has the
opportunity to employ additional energy saving techniques to supply its extensive fuel and power needs.
The analysis shows that by year 5, local sourcing of food products by the Common Market will reduce
greenhouse gas emissions by 454,000 lbs, carbon dioxide equivalent (CO2E). The potential to reduce
91 Conclusions & Recommendations THE COMMON MARKET FEASIBILTY STUDY
greenhouse gas emissions by consolidation of current delivery of local farm products to Philadelphia was
also studied. If half of the amount of local food products currently brought to into Philadelphia by farm
trucks is consolidated into Common Market routes, the reduction in greenhouse gas generation in year
5 will be about 10,000 lbs, CO2E, a small fraction of the reduction estimated for replacement of food
items from the national supply but still a significant reduction.
Solar collectors installed on the roof of the Common Market can generate about 40 percent of the
power required by the warehouse refrigeration units resulting in avoided greenhouse emissions from
fossil fuel power plants of 457,000 lbs CO2E annually and a saving of $36,000 a year in electric power
costs. For both these reasons, the study recommends installation of solar collectors.
This study demonstrates that the Common Market model is feasible and would prove to be a much
needed solution to the barriers preventing more prolific selling and buying of locally grown farm
products in the Philadelphia region. It is suggested that the complete business planning of the Common
Market follow this somewhat parallel feasibility study leading to the launch of this project.
92 Appendix A. Terminology THE COMMON MARKET FEASIBILTY STUDY
Appendix A. Terminology
Distributor: Firm at the receiving end of the marketing system, usually a wholesaler, which supplies
produce to retail, foodservice outlets and/or to jobbers.
F.O.B.: Meaning “free-on-board.” A pricing term indicating that the quoted price includes the cost of
loading the goods into transport vessels at the specified place.
Foodservice: Includes such mass-feeding operations as restaurants, school cafeterias and hospital and
military commissaries. Increasingly, retail stores are capitalizing on foodservice opportunities in their
own stores, offering more carry-out and ready-to-eat choices. This phenomenon is referred to as home-
meal replacement.
Jobber: One who buys goods in bulk and sells them to retailers.
Mark up: Difference between the warehouse cost and the ultimate retail price of an item, expressed as
a percentage of warehouse cost. For example, if the cost of a certain item shipped to the retail
warehouse is 50 cents, and the same item is sold in the retail for $1, the markup is 100 percent.
Receiver: Anyone, whether a retail chain or chain store, co-op, voluntary, wholesaler or terminal market
operator, who receives shipments [of product from producers]. {my brackets}
Shipper: Any person operating at the shipping point who is engaged in the business or purchasing
[product] from growers or others [or producers], and whose operations may include distributing such
produce in commerce by resale or other methods, or who handles such produce [product] on joint
accounts with others. {my brackets}
Shipping point: Point at which shipment of produce is begun [also referred to as “point-of-origin”] {my
brackets}
Wholesale: The segment of the produce [product] distribution chain often referred to as the middle
market.
Wholesaler: A middle-market produce [product] handler. There are several types, including terminal
market and service wholesalers. A terminal market wholesaler is located on a terminal with other
wholesalers; sells to other wholesalers, distributors and retailers who shop the market regularly; and
does not have exclusive customers. A service wholesaler serves exclusive customers; offers store-door
and/or chain warehouse delivery; and could be located anywhere, on or off the market.
93 Appendix B. Interviews with Comparable Businesses THE COMMON MARKET FEASIBILTY STUDY
Appendix B. Interviews with Comparable Businesses
Interviews
Disclaimer
The contents of this Appendix are confidential and intended solely for the use of the Common Market
partners. Discussion of particular details pertaining to the individual businesses profiled in this section
outside of the Common Market partners is prohibited. Publication of the contents of this section, unless
approved by the author is also prohibited.
Interview A
Date: 5/23 & 8/2/06
Contact: Founder & (for want of better description) general manager
Legal Organization: 501c3; (non-profit w/ income generated from trade activities)
Physical plant:
• Currently physical plant consists of rented office space.
• When business started, rented warehouse with thousands of square feet and coolers.
• Leased x trucks
• [in x year of operation OPERATION A leased its warehouse space and got rid of the trucks.
At that point, business changed from warehousing and handling to acting as grower agent,
providing sales, marketing and logistics support to growers.]
Sales: ~$x in annual sales on volume of thousands of packages
Employees: x (not all work directly with produce operations)
Overview:
OPERATION A is a nonprofit marketing organization that acts as a sales agent for several grower-
packers of fresh fruit and vegetables who are based primarily in New England. In addition, it
represents a cooperative of African-American watermelon growers in the south. It also provides
marketing and logistics support to its grower-packers.
Product line:
Fresh fruits and seasonal vegetables
• Strawberries
• Lettuce (red and green leaf, Boston, Romaine Hearts)
• Summer vegetables, including heirloom tomatoes
• Small fruit (red currants, red raspberries, gooseberries
• New England peaches (premium place pack and “farm-stand” basket)
• New York sweet cherries
• Nectarines
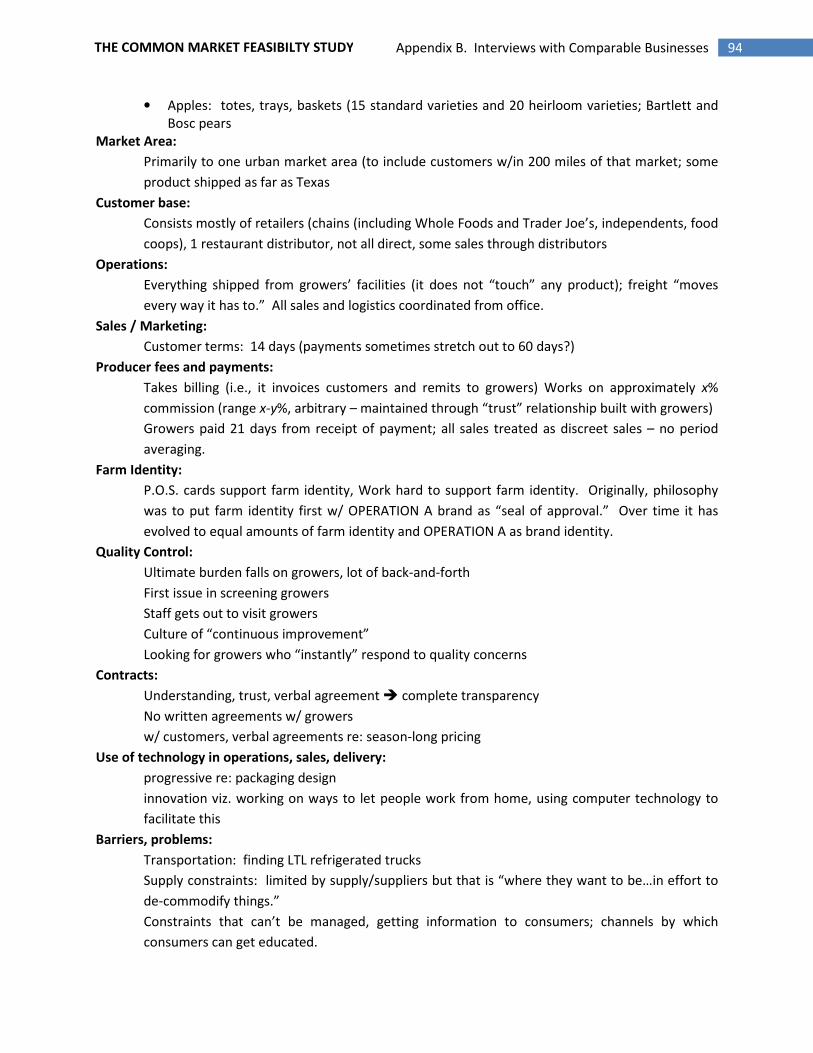
94 Appendix B. Interviews with Comparable Businesses THE COMMON MARKET FEASIBILTY STUDY
• Apples: totes, trays, baskets (15 standard varieties and 20 heirloom varieties; Bartlett and
Bosc pears
Market Area:
Primarily to one urban market area (to include customers w/in 200 miles of that market; some
product shipped as far as Texas
Customer base:
Consists mostly of retailers (chains (including Whole Foods and Trader Joe’s, independents, food
coops), 1 restaurant distributor, not all direct, some sales through distributors
Operations:
Everything shipped from growers’ facilities (it does not “touch” any product); freight “moves
every way it has to.” All sales and logistics coordinated from office.
Sales / Marketing:
Customer terms: 14 days (payments sometimes stretch out to 60 days?)
Producer fees and payments:
Takes billing (i.e., it invoices customers and remits to growers) Works on approximately x%
commission (range x-y%, arbitrary – maintained through “trust” relationship built with growers)
Growers paid 21 days from receipt of payment; all sales treated as discreet sales – no period
averaging.
Farm Identity:
P.O.S. cards support farm identity, Work hard to support farm identity. Originally, philosophy
was to put farm identity first w/ OPERATION A brand as “seal of approval.” Over time it has
evolved to equal amounts of farm identity and OPERATION A as brand identity.
Quality Control:
Ultimate burden falls on growers, lot of back-and-forth
First issue in screening growers
Staff gets out to visit growers
Culture of “continuous improvement”
Looking for growers who “instantly” respond to quality concerns
Contracts:
Understanding, trust, verbal agreement � complete transparency
No written agreements w/ growers
w/ customers, verbal agreements re: season-long pricing
Use of technology in operations, sales, delivery:
progressive re: packaging design
innovation viz. working on ways to let people work from home, using computer technology to
facilitate this
Barriers, problems:
Transportation: finding LTL refrigerated trucks
Supply constraints: limited by supply/suppliers but that is “where they want to be…in effort to
de-commodify things.”
Constraints that can’t be managed, getting information to consumers; channels by which
consumers can get educated.
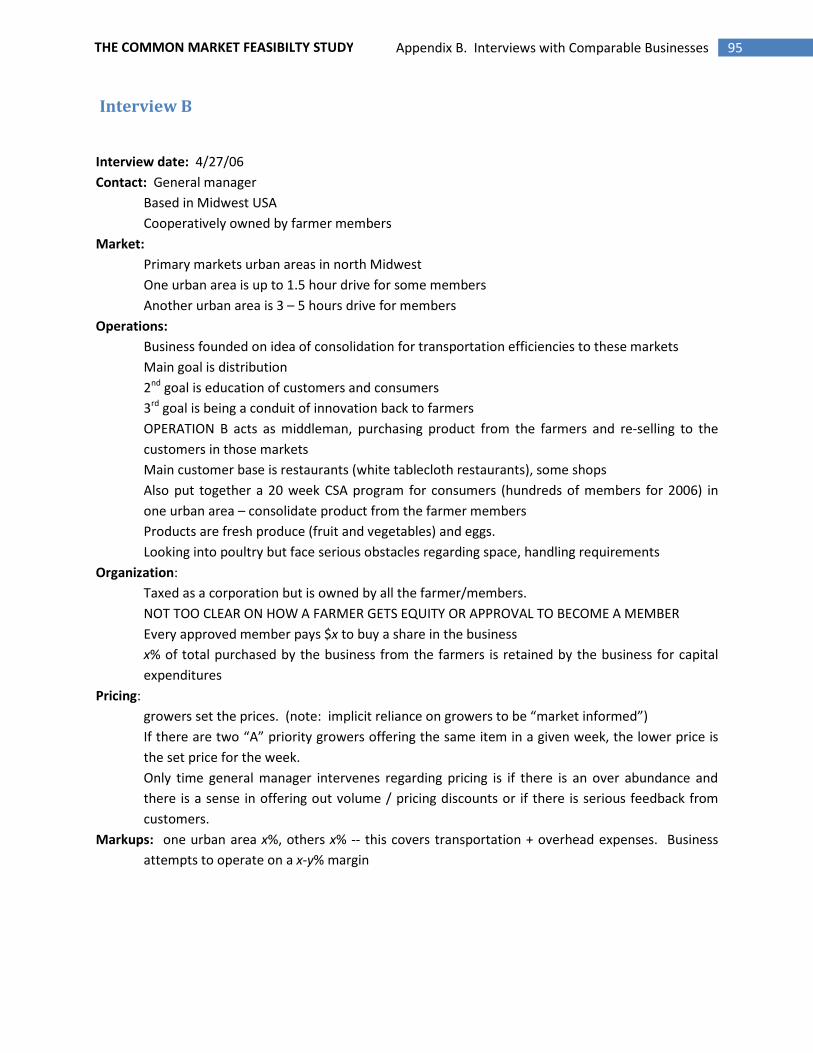
95 Appendix B. Interviews with Comparable Businesses THE COMMON MARKET FEASIBILTY STUDY
Interview B
Interview date: 4/27/06
Contact: General manager
Based in Midwest USA
Cooperatively owned by farmer members
Market:
Primary markets urban areas in north Midwest
One urban area is up to 1.5 hour drive for some members
Another urban area is 3 – 5 hours drive for members
Operations:
Business founded on idea of consolidation for transportation efficiencies to these markets
Main goal is distribution
2nd goal is education of customers and consumers
3rd goal is being a conduit of innovation back to farmers
OPERATION B acts as middleman, purchasing product from the farmers and re-selling to the
customers in those markets
Main customer base is restaurants (white tablecloth restaurants), some shops
Also put together a 20 week CSA program for consumers (hundreds of members for 2006) in
one urban area – consolidate product from the farmer members
Products are fresh produce (fruit and vegetables) and eggs.
Looking into poultry but face serious obstacles regarding space, handling requirements
Organization:
Taxed as a corporation but is owned by all the farmer/members.
NOT TOO CLEAR ON HOW A FARMER GETS EQUITY OR APPROVAL TO BECOME A MEMBER
Every approved member pays $x to buy a share in the business
x% of total purchased by the business from the farmers is retained by the business for capital
expenditures
Pricing:
growers set the prices. (note: implicit reliance on growers to be “market informed”)
If there are two “A” priority growers offering the same item in a given week, the lower price is
the set price for the week.
Only time general manager intervenes regarding pricing is if there is an over abundance and
there is a sense in offering out volume / pricing discounts or if there is serious feedback from
customers.
Markups: one urban area x%, others x% -- this covers transportation + overhead expenses. Business
attempts to operate on a x-y% margin
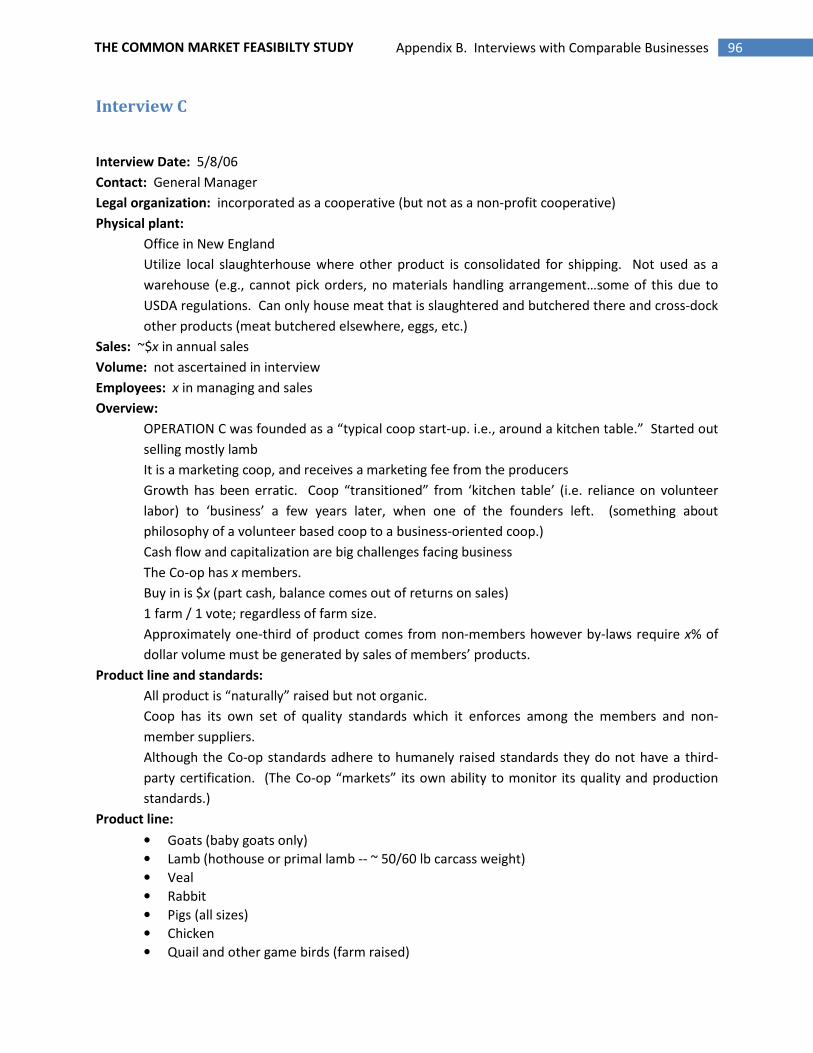
96 Appendix B. Interviews with Comparable Businesses THE COMMON MARKET FEASIBILTY STUDY
Interview C
Interview Date: 5/8/06
Contact: General Manager
Legal organization: incorporated as a cooperative (but not as a non-profit cooperative)
Physical plant:
Office in New England
Utilize local slaughterhouse where other product is consolidated for shipping. Not used as a
warehouse (e.g., cannot pick orders, no materials handling arrangement…some of this due to
USDA regulations. Can only house meat that is slaughtered and butchered there and cross-dock
other products (meat butchered elsewhere, eggs, etc.)
Sales: ~$x in annual sales
Volume: not ascertained in interview
Employees: x in managing and sales
Overview:
OPERATION C was founded as a “typical coop start-up. i.e., around a kitchen table.” Started out
selling mostly lamb
It is a marketing coop, and receives a marketing fee from the producers
Growth has been erratic. Coop “transitioned” from ‘kitchen table’ (i.e. reliance on volunteer
labor) to ‘business’ a few years later, when one of the founders left. (something about
philosophy of a volunteer based coop to a business-oriented coop.)
Cash flow and capitalization are big challenges facing business
The Co-op has x members.
Buy in is $x (part cash, balance comes out of returns on sales)
1 farm / 1 vote; regardless of farm size.
Approximately one-third of product comes from non-members however by-laws require x% of
dollar volume must be generated by sales of members’ products.
Product line and standards:
All product is “naturally” raised but not organic.
Coop has its own set of quality standards which it enforces among the members and non-
member suppliers.
Although the Co-op standards adhere to humanely raised standards they do not have a third-
party certification. (The Co-op “markets” its own ability to monitor its quality and production
standards.)
Product line:
• Goats (baby goats only)
• Lamb (hothouse or primal lamb -- ~ 50/60 lb carcass weight)
• Veal
• Rabbit
• Pigs (all sizes)
• Chicken
• Quail and other game birds (farm raised)
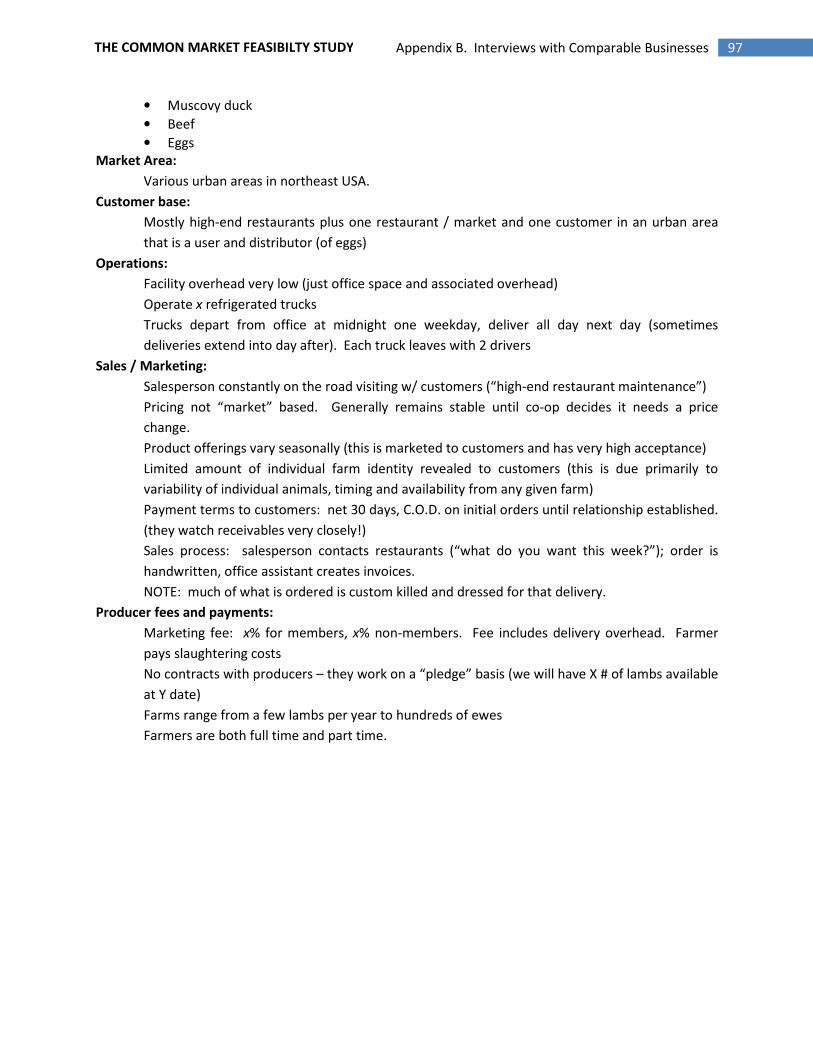
97 Appendix B. Interviews with Comparable Businesses THE COMMON MARKET FEASIBILTY STUDY
• Muscovy duck
• Beef
• Eggs
Market Area:
Various urban areas in northeast USA.
Customer base:
Mostly high-end restaurants plus one restaurant / market and one customer in an urban area
that is a user and distributor (of eggs)
Operations:
Facility overhead very low (just office space and associated overhead)
Operate x refrigerated trucks
Trucks depart from office at midnight one weekday, deliver all day next day (sometimes
deliveries extend into day after). Each truck leaves with 2 drivers
Sales / Marketing:
Salesperson constantly on the road visiting w/ customers (“high-end restaurant maintenance”)
Pricing not “market” based. Generally remains stable until co-op decides it needs a price
change.
Product offerings vary seasonally (this is marketed to customers and has very high acceptance)
Limited amount of individual farm identity revealed to customers (this is due primarily to
variability of individual animals, timing and availability from any given farm)
Payment terms to customers: net 30 days, C.O.D. on initial orders until relationship established.
(they watch receivables very closely!)
Sales process: salesperson contacts restaurants (“what do you want this week?”); order is
handwritten, office assistant creates invoices.
NOTE: much of what is ordered is custom killed and dressed for that delivery.
Producer fees and payments:
Marketing fee: x% for members, x% non-members. Fee includes delivery overhead. Farmer
pays slaughtering costs
No contracts with producers – they work on a “pledge” basis (we will have X # of lambs available
at Y date)
Farms range from a few lambs per year to hundreds of ewes
Farmers are both full time and part time.

98 Appendix B. Interviews with Comparable Businesses THE COMMON MARKET FEASIBILTY STUDY
Interview D
Interview Date: 4/20/06
Contact: President/owner
Legal organization: S-Corp; x shareholders
Physical plant:
x units at Philadelphia Produce Market
thousands of square feet on sales, storage, and preparation floor
Space allocated ~ 50% cooler area, 50% dry
x coolers racked x high
Office area x square feet (x workstations in common area; x workstations in executive area)
Sales: ~$x in annual sales
Volume: thousands of packages per week move through business
Hours of operation: 24/7 on most weekdays
Employees: x in managing, administration, sales, handlers, and other
With exception of management and administrative personnel, shop is 100% union (note:
according to owner, this increases the “prevailing wage” by a factor of x% plus adds benefits
business might otherwise not pay.)
Operations:
Regarding cooler racking: requires specialized handling equipment due to narrow corridors in
limited space; need to have 1 forklift for each cooler. Business has $x invested in forklifts!
(leasing no longer a worthwhile options for much business equipment, especially those pieces of
equipment with short lifespan).
Design has to be “everything” proof. Needs to avoid bottlenecks in selection and storage.
Operational Costs as percentage of budget:
Costs of goods = ~ x% gross profit (see discussion on margins)
Operational costs = x% of gross profit
Margins:
“target margins often fall short of market pricing” therefore business looks $ per box (mark-up)
rather than percentage margin (in pricing strategies)
Target margins: low volume specialty items � x%
Commodity items � x%
Gross profit generally ~ x%, good years x-y%
Sales, etc.:
Area served is primarily the Northeast / Mid-Atlantic and into the Carolinas
All sales are f.o.b. the store, shipped via buyer or customer truck
Arrange very few deliveries, do not operate delivery trucks
Customer type: foodservice and all levels of retail
Sourcing: work directly with some farms, indirectly with some farms through brokers, import
directly (and indirectly) from growers
Contracts: none with buyers or suppliers except short term arrangements (typically for
promotions)
99 Appendix B. Interviews with Comparable Businesses THE COMMON MARKET FEASIBILTY STUDY
Work strong brand identification for produce
Invoicing and payment policies:
“invoice weakly (and weekly) and pay quickly.” Customer terms: 21 days, cut-off after
28 days
Since most purchases are “Price After Sale” policy is to settle with suppliers quickly and
pay upon receipt of invoice.
Ordering from suppliers mostly based on “anticipation” of customer orders (thinking for
customers); little ordered against specific customer orders (mostly due to the lead time involved
– short lead time from customers, longer lead time from suppliers); order cycle follows transit
times from shippers (mostly (for retail)) in Sunday a.m. out Sunday night / Monday morning; in
Wednesday out Thursday).
Technology:
Windows based computer system, industry designed custom software package with integrated
accounting, inventory, sales; capable of (and does) integrating with customers’ internet
platforms.
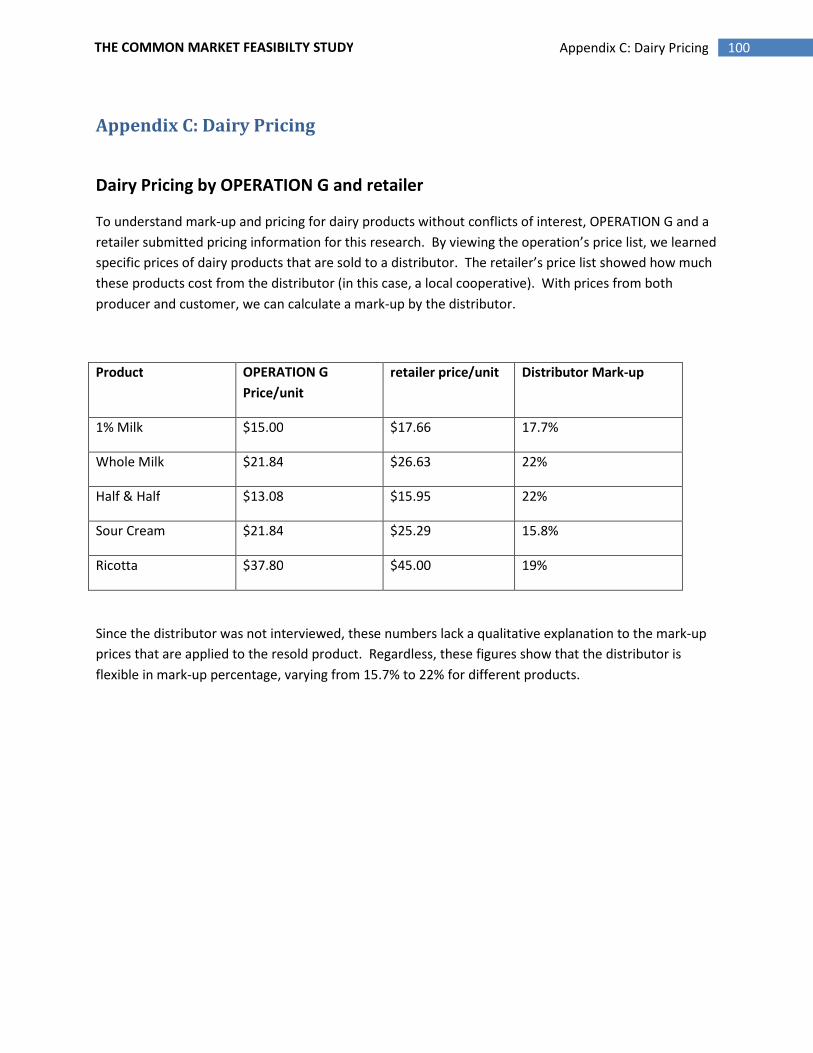
100 Appendix C: Dairy Pricing THE COMMON MARKET FEASIBILTY STUDY
Appendix C: Dairy Pricing
Dairy Pricing by OPERATION G and retailer
To understand mark-up and pricing for dairy products without conflicts of interest, OPERATION G and a
retailer submitted pricing information for this research. By viewing the operation’s price list, we learned
specific prices of dairy products that are sold to a distributor. The retailer’s price list showed how much
these products cost from the distributor (in this case, a local cooperative). With prices from both
producer and customer, we can calculate a mark-up by the distributor.
Product OPERATION G
Price/unit
retailer price/unit Distributor Mark-up
1% Milk $15.00 $17.66 17.7%
Whole Milk $21.84 $26.63 22%
Half & Half $13.08 $15.95 22%
Sour Cream $21.84 $25.29 15.8%
Ricotta $37.80 $45.00 19%
Since the distributor was not interviewed, these numbers lack a qualitative explanation to the mark-up
prices that are applied to the resold product. Regardless, these figures show that the distributor is
flexible in mark-up percentage, varying from 15.7% to 22% for different products.
101 Appendix D: Mark Up Estimation Interviews THE COMMON MARKET FEASIBILTY STUDY
Appendix D: Mark Up Estimation Interviews
OPERATION E
1. How do you set your prices?
- By calculating my fixed costs, I know what I have to make to break even at year’s end. We mark
up our product to cover our costs; that is our break-even point and we are content with that.
2. What is the approximate average mark-up you apply to farm products you purchase?
- x%. We’d prefer y-z% of course, but pricing is an art and you have to know what the market
will bear.
3. How flexible is this mark-up?
- You learn that some things can be marked up more than others, but the average mark-up is
eventually where we end up. Also, If I am sitting on something that hasn’t sold, then I need to
adjust my price, since it isn’t as fresh.
4. Once fixed costs are applied, what is your approximate net profit margin?
- See Question #1
5. Does mark-up vary depending on growing methods? For example, if you distribute both Certified
Organic and conventional produce, do you mark them up the same?
-We throw away more organic produce, since it has a shorter shelf life; therefore we need to
make more on them—a bit higher mark-up, which depends on the product (Note: no specific
number was offered).
6. Do you add fuel surcharges to your deliveries, or is delivery cost built in to the price for your
customers?
-As fuel prices have escalated, we have considered it. We build it into the price, instead, since
some buyers will refuse to pay the surcharge. If that happens, then our billing office will have to
deal with it, so we decided it works better to not have a surcharge, but build the fuel cost in to
the bottom line.
7. What is your minimum order for delivery?
-$x minimum order—that’s really low. It costs us $x just to run the truck and make a delivery.
We have some flexibility—good customers who order a lot per week may need something they
forgot to order, so we will drop it off even though it is under the minimum.
8. Do you offer volume discounts?
-We just started to do this to compete with Sysco and other big guys, who offer rebates to
customers that purchase the most product. It feels like a deal to the customer, but the cost is
built in somewhere. We’ll do a x% rebate for buyers who purchase over $x/yr.
9. What are your payment terms?
-We do net 30 days to our customers, and we average around 35 days, which is pretty good.

102 Appendix D: Mark Up Estimation Interviews THE COMMON MARKET FEASIBILTY STUDY
We pay farmers up to 30 days, but some small farmers can be Cash On Delivery (COD).
Additional Notes:
-25-30% of the business goes to retail customers. Those customers buy 95% of Certified Organic
Produce he sells.
-OPERATION E sells non-local produce to compete with other distributors, especially in the
winter. Around 20-25% of his product is local in height of season. The rest of the time,
approximately 6-7% is local.
OPERATION A
1) How do you set your prices?
-I call it the “dignity price.” It is a subjective, non-formulaic system. Through discussion, I gauge
the price point where the farmer loses his/her dignity. Through my experience, I usually know
about what that price will be. I ask questions like, “What do you think is a great price? What is
a price that is unfair to you? What is the average price you sold this item for last year?” From
there, I apply a mark-up to cover my costs.
2) What is the approximate average mark-up you apply to farm products you purchase?
- My average gross mark-up is x%. That is what I shoot for to cover my costs.
3) How flexible is this mark-up?
- It varies per item, often depending on the farmer’s dignity price and what the market will bear.
Consistently, I mark-up in the y-z% range.
4) Once fixed costs are applied, what is your approximate net profit margin?
- Zero. Our operation is mission driven, so my goal is to cover my costs to keep functioning,
while helping farmers as much as possible. The x% average is the mark-up I have calculated to
make that happen.
5) Does mark-up vary depending on growing methods? For example, if you distribute both Certified
Organic and conventional produce, do you mark them up the same?
- No. The range stays pretty consistent regardless of growing method.
6) Do you add fuel surcharges to your deliveries, or is delivery cost built in to the price for your
customers?
- Non-applicable. The organization does not deliver the product from the farm to the wholesale
customer.
7) What is your minimum order for delivery?
- I set no minimum. In situations where the delivery will be particularly inefficient for the
farmer, I will ask the buyer to add to the order or adjust his/her delivery schedule.
8) Do you offer volume discounts?
103 Appendix D: Mark Up Estimation Interviews THE COMMON MARKET FEASIBILTY STUDY
- Not as a policy. The accounts I have with the best commitment—those who have been regular,
high volume customers over a period of time are bound to get a better price. I pay a lot of
attention to who the buyer is.
9) What are your payment terms?
- I seek 14 day payment from my customers. Some of them stretch it out to 60 days, which is
incredibly difficult to my cash flow.
Additional Notes:
- Currently, the x% mark-up does not cover OPERATION A's fixed costs, but they have other funding (as a
non-profit) continue the business. He foresees his x% mark-up covering costs in five more years, based
on his yearly sales figures. He anticipates x% growth yearly. He forecasts $x million in gross revenue
this year, and $x million in five years. With a x% mark-up he will have a net income of $x, which will
cover his fixed costs.
- To contribute to the company’s growth, he has increased his efforts to sell more year-round items,
including storage apples and winter root crops and shelf-stable value-added items.
OPERATION C
1. How do you set your prices?
- Until recently, we set our price at about x% across the board with no flexibility. Now we are
allowing ourselves to shift the end price with supply and demand from the marketplace. For
example, demand increases for lamb at Easter. Originally, we would not change the price, but
now we are to help the cooperative continue.
2. What is the approximate average mark-up you apply to farm products you purchase?
- x% is the absolute minimum. We need to make that to cover our costs. We charge farmers
either y% (member) or z% (non-member) to market and deliver their product. Across the board,
we add a mark-up before sale, which is passed on to the customer. The farmers that have
whole animals pay for slaughtering and processing at cost. That makes our average total mark-
up a range, and we end up at x% give or take.
3. How flexible is this mark-up?
- The farmer fees stay the same. The mark-up on top of that to the restaurant can vary a little,
which depends on the customer and other dynamics, though x% is pretty standard.
4. Once fixed costs are applied, what is your approximate net profit margin?
- With our new system off being sensitive to supply and demand in the market we are hoping for
a small profit, but it is difficult. When our prices were more fixed, we covered costs.
5. Does mark-up vary depending on growing methods? For example, if you distribute both Certified
Organic and conventional produce, do you mark them up the same?

104 Appendix D: Mark Up Estimation Interviews THE COMMON MARKET FEASIBILTY STUDY
- This question was not answered.
6. Do you add fuel surcharges to your deliveries, or is delivery cost built in to the price for your
customers?
- We add $x/stop surcharge. Since our average order is hundreds of dollars, most customers do
not have a problem with these few extra dollars.
7. What is your minimum order for delivery?
- We do not use a minimum order. Our base customer list is fairly standard, meaning most of
our customers order a fair volume and understand how our business works.
8. Do you offer volume discounts?
- No.
9. What are your payment terms?
- We seek net 30 days from our customers. 45 days is the average from our customers.
Additional Notes:
- OPERATION C delivers once/week. They attempted to add another delivery day to one of their
markets and it failed.
- Pricing example: A farmer with whole lamb will sell it more $x/pound. The organization will
pay the farmer $x/lb, which is x% less than the farmer’s price (member marketing fee), minus
the cost of processing. The org will try to sell that lamb for a minimum of $x/lb., which is a x%
increase from the farmer’s price, but preferably higher, since the $x price is x% and fixed costs
usually amount to x%.
- OPERATION C does not keep an inventory if possible. 90% of their product line is fresh, not
frozen meat.
OPERATION F
1. How do you set your prices?
- With experience in distribution, I know what I can and can’t sell things for. As a result, I know I
can’t take everything, meaning some products don’t work for the customer base I have because
my buyers can find the product a lot cheaper from another distributor. They are willing to pay
more for a local product, but maybe not always. It takes experience to learn those things.
2. What is the approximate average mark-up you apply to farm products you purchase?
- It really depends on the product, its availability, and what I know I can sell it for. (Note:
Martha’s real number example was x% mark-up, but she did not specify any other hard
numbers).
3. How flexible is this mark-up?
- It has to be flexible. It really depends on my costs in the long run.
4. Once fixed costs are applied, what is your approximate net profit margin?

105 Appendix D: Mark Up Estimation Interviews THE COMMON MARKET FEASIBILTY STUDY
- I tug and pull when I can to get a % here or there, but I set prices to cover costs and am pretty
happy with that because it is good for the farmers. Produce is a difficult business. Annually, I
shoot for my “break-even” point.
5. Does mark-up vary depending on growing methods? For example, if you distribute both Certified
Organic and conventional produce, do you mark them up the same?
- The variance in pricing and mark-up is more tied to the quality and availability of a product
than the way it is grown.
6. Do you add fuel surcharges to your deliveries, or is delivery cost built in to the price for your
customers?
- Non-applicable. We do not do the actual delivering.
7. What is your minimum order for delivery?
- We do not have minimum orders. However if you do not prioritize us in you buying, apparent
by 1 or 2 case orders, then a conversation has to take place to determine if doing business is the
best situation for all involved.
8. Do you offer volume discounts?
- Not answered.
9. What are your payment terms?
- Non-applicable (see Additional Notes).
Additional Notes:
- OPERATION F does not deliver products, instead working with a distributor to deliver it for
them. It buys from farmers and is responsible for getting the product to the warehouse. It sells
the product to a distributor who incorporates the items into his inventory system. It sets up the
sale of the product with the customer, but the point of sale is to the distributor, who is
technically selling it to the organization's customer.
- In this system, the distributor markets the local product to his customers in addition to the
marketing OPERATION F does to theirs. The operation is responsible for unsold product, even
though the distributor has technically bought it from them.
- Example: OPERATION F buys a flat of strawberries for $x and sells it to the distributor for $y
(y% mark-up). The organization’s money is made at that point. The distributor incorporates the
product into his inventory and receives avg. of $z for the flat.
106 Appendix E: Demand Sector Interviews THE COMMON MARKET FEASIBILTY STUDY
Appendix E: Demand Sector Interviews
Institutions
Focus Group Date:
November 20, 2006
Management Approach
Question 1: What is your typical day like?
INSTITUTION REP 3: There is no typical day. I play a corporate role, and I’m not involved in the day-to-
day operations. I operate at the food service director level—ordering, inventory, staff scheduling,
trouble shooting of financials, peer reviews, insuring that we meet state and federal standards. Lots of
internal corporate meetings. Examples of troubleshooting: not enough turkeys—what to do; finding out
what kind of support staff need to do their work; dealing with problems of compliance on regulatory
issues (longterm care is extremely regulated).
INSTITUTION REP 2: I’m an administrator. I operate three buildings involved in large volume feeding (500
meals a day). I plan budgets. I meet with students. I manage catering events. There is a seasonality to
our work—the level of work goes way up in the fall, drops at the holidays, slows down by the end of
May. There is an ebb and flow to volume patterns. We have limited storage facilities, turn inventory
three times a week. We have a very diversified menu, with lots of venues on campus.
INSTITUTION REP 1: I manage three dining halls and the catering operations. There is a director of
purchasing who makes most of our purchases, but I manage orders for catering events. When school is
in session I spend lots of time on catering events: two major events a week, but something every day. It
might be an event for the president, the board, alumnae, donors—generally an adult audience, but with
some student oriented catered events.
Question 2: What part of your job do you like the best?
INSTITUTION REP 1: I like creating menus for special events.
INSTITUTION REP 2: I like pushing the envelope, exposing students to things they haven’t experienced
before. Teaching students about making wise, healthy food choices, about widening their palate. I like
hosting special events with foods they might not have tried.
INSTITUTION REP 3: Having a positive influence on employees and patients. Having an influence on
people—that’s what I like. For example, I’m involved now in a project for dining enhancement: making
the whole eating experience more appealing to residents.
107 Appendix E: Demand Sector Interviews THE COMMON MARKET FEASIBILTY STUDY
Question 3. What are the rough spots in your day?
INSTITUTION REP 1: Personnel problems: people not showing up, or not understanding expectations. I
also dread breakdowns in communication, problems with purveyors, mixups with deliveries. And that
always happens. It never turns out the way you want.
INSTITUTION REP 3: The rough spots always involve personalities at different levels. There are demands
from the corporate level: “Drop everything and do this.”
Nothing from INSTITUTION REP 2.
Question 4. What ideas do you have to improve problem areas?
INSTITUTION REP 1: I’m new to campus dining (x years). The tack I’m taking is to train component chefs,
mentor them, push them to take a greater role in their operations. All of them are different, with
different skill sets and personalities. I’ve also been reaching out to other areas of the campus, looking
for overlaps between what they want and what we can offer. We’ve worked with nutrition classes;
gotten students to help in the dining hall; have tried to build awareness of organic, locally grown and fair
trade. In fact, students have worked with us to reinstitute Fair Trade coffee. However, our students are
not naturally drawn to these issues. Only 5 percent are vegetarian (even if they are more vocal than
before). Compare that with 35% at another university in the area and 50% at a nearby college.
No answers from INSTITUTION REP 2 or INSTITUTION REP 3.
Question 5. What are your business's goals and standards and how do you go about meeting them?
INSTITUTION REP 3: There’s been a big push to enhance dining in the dining halls. Not just the food on
the plate, but the atmosphere, the ambiance, the activities leading up to dining. (We operate x homes,
all in Philadelphia.)
INSTITUTION REP 2: When I first came my goals were simple: break even, and keep students off the
president’s back. Now, we’ve just created an auxiliary services branch for food service that will work
outside of the university budget process. It will change how we do things, will be more entrepreneurial
in approach. We want to be more creative in thinking about the bond between students and the food
service. We also want to provide better rewards for better service.
INSTITUTION REP 1: Our goals are driven by our customers. It’s tough to figure out what our customers
are asking for—especially the undergrads. But our goal is to make the food service a vibrant part of the
university community.
Questions 6 and 7: What else that is important to you? What else do you do?

108 Appendix E: Demand Sector Interviews THE COMMON MARKET FEASIBILTY STUDY
INSTITUTION REP 2: We have our hands in lots of things on campus, and see our department as an ally
to other departments in terms of providing services. We’re happy to assist in events where others get
the credit and glory. As a self-operating department, we’re constantly vigilant in supporting and
endorsing the university’s vision. We are a partner in the university as opposed to just a vendor.
INSTITUTION REP 1: I have a strong belief in the power of food service to have an impact on the
community. I think of this when approaching every job.
INSTITUTION REP 3: I was brought in to bring each of our x buildings into self-operation. Still have some
buildings that must be transitioned. The others are currently being run by nutrition management and
one is outsourced to a food services company.
Demographics
Question 8: What are the demographics of your customers?
INSTITUTION REP 3: Most of our buildings have x beds; one has hundreds. There are over a thousand
residents overall. They are inner city, predominantly black residents, from a poorer socioeconomic
background—medicare, medicaid, not for profit. Not high end. But while our residents are lower
income, they have diverse racial and cultural backgrounds. Recently, our residents have been getting
younger and sicker as hospitals toss them out quicker. They are 60 to 70, mostly. Lots of different
nationalities. At one center we have a very large Korean population and are looking into a Korean menu.
INSTITUTION REP 1 and INSTITUTION REP 2: Thousands of students live on campus. 55% are female. The
majority are white. Predominantly middle class—not real wealthy or real poor. Over a thousand
commute full time. There are hundreds of fulltime faculty and staff. These three categories are our
primary users. In addition, we have thousands of evening graduate and undergraduate students and
hundreds of adjunct faculty. And then we have our catering demographics, which is essentially our
alumnae base. We don’t get many requests for ethnic foods, though there are African American groups
that want African American food. The population drops way down on weekends.
Ordering
Question 9: What is your ordering process?
INSTITUTION REP 2: We make a distinction between ordering and purchasing. We’re in the x year of an
x-year contract with a national distributor as our primary wholesale distributor/supplier of frozen and
grocery. We’re committed to buying most but not all items from them. There are a number of produce,
meat and dairy products we order elsewhere. And we still try to bid one supplier against another.
The ordering process works this way: Dining halls feed orders into a central area. We tell suppliers that
our ordering process is low-maintenance. Our computer talks to their computer. It’s a high-tech
arrangement. There used to be sales reps, talking to each manager from building to building. Now all
sales reps work directly with the Purchasing Manager.
109 Appendix E: Demand Sector Interviews THE COMMON MARKET FEASIBILTY STUDY
We have a short list of other preferred distributors. We try to solidify these relationships during the
summer months, when it’s slower, and project out volume for the next year.
Question about Common Market: How will you guarantee the wholesomeness and safety of foods?
Liability issues. Get GAP certified. (There was a discussion of this issue, with input from one interviewer,
who said Common Market will not inspect every grower, but the insurance will be on Common Market.)
INSTITUTION REP 3: We also buy from a national distributor; we have an agreement to be part of an
acute care purchasing group with them. When we look at their order guide online, we can see which
products are part of our purchasing group agreement—for which we get big discounts.
INSTITUTION REP 1: We often go out of the national distributor for produce, fish and cheeses. Use a
regional produce supplier for some stuff.
[INSTITUTION REP 2 had to leave after Question 9.]
Question 10: How often are items ordered?
INSTITUTION REP 1: We place orders to the major distributor three days a week. Some stuff is delivered
every day of the week: Bread through a regional bakery, paper goods, dairy through a regional dairy
processor.
INSTITUTION REP 3: We have the same approach as the university, and some of the same sub-vendors.
Question 11: How do you place your orders (phone, fax, email, website)?
It was already established that most orders are made online. Here, INSTITUTION REP 3 and INSTITUTION
REP 1 talk about exceptions. Questions 12, 13 and 14 were redundant, and not answered.
INSTITUTION REP 3: We use a computer system. It’s all online; we can do it from home. Each building
makes its own orders. There’s almost no interaction with people. However, we do fax in our bread
order for the week, and some vendors will call us.
INSTITUTION REP 1: For special orders, we call people up and talk to them—about what they have, the
quality of the meat, etc.
Question 15: How much flexibility in order size is important?
Not relevant to either, since they order such large quantities.
Question 16: What do you need to know about product availability?
INSTITUTION REP 3: We need to know in advance if something is not available. We have to comply with
a law that requires meals to be planned in advance. Can’t make menu changes—affects both the laws
and our customers.
110 Appendix E: Demand Sector Interviews THE COMMON MARKET FEASIBILTY STUDY
INSTITUTION REP 1: We have a cycle menu in each dining hall. There’s coordination among the three
dining halls—with the same offerings on the same days. But each dining hall has its own special things,
as well. Meal cycles are decided at the beginning of each semester.
Question 17: What seasonality issues are there?
INSTITUTION REP 1: We don’t work seasonality of food into the dining experience, but there is
seasonality to our demand. In the summer, from mid-May to end of August, we serve hundreds as
opposed to the thousands meals a day during the school year. There is a separate cycle menu for
summer.
INSTITUTION REP 3: We must have fresh fruits and veggies as seasonally available. Again, it’s a
regulation. We change the menu around specifically for summer, but meal quantity doesn’t change
seasonally.
Question 18: What drives your purchases: quality or price [quality organic for produce, pastured for
meats, dairy, poultry, eggs]
INSTITUTION REP 3 and INSTITUTION REP 1: Ethics has nothing to do with it. Quality and price are the
factors, with price first. INSTITUTION REP 3 works for a company that does care about quality.
Question 19: What other rules of thumb do you have for purchasing decisions?
INSTITUTION REP 1: For catering operations, purveyors must give specific quantities, based on the size
of the event. Must also provide quality products. Need to buy unusual things in specific quantities. The
regional produce supplier and a regional meat distributor are both accommodating in this way. The
former charges for breaking cases. The latter doesn’t, directly, but their high prices cover the service.
INSTITUTION REP 3: History determines who we purchase from. If a vendor is crappy, we go to someone
else.
Question 20: What do you want in an ideal ordering process? (patterns, cycles, lead times)
INSTITUTION REP 1: We want to order at least three times a week. We typically place an order one day
before. Each of our vendors has a different required lead time, but short lead time is ideal. But we also
do lots of advanced planning of our menu, as mentioned before, so once set, lots of items and quantities
are predetermined.
INSTITUTION REP 3: Our menu is on a four week cycle. We don’t need to order a day in advance, but we
do it because we can. We’d like getting one big order once a week if we had the space for storage.
Delivery
Question 21: What are your delivery expectations? (pick up, delivery, etc.)
111 Appendix E: Demand Sector Interviews THE COMMON MARKET FEASIBILTY STUDY
INSTITUTION REP 3 and INSTITUTION REP 1: For both, everything is delivered; no pick-up. Would never
consider pick-up except for real specialty stuff (in INSTITUTION REP 1’s case), but even that is very, very
rare.
Question 22: When (day and time) and how items are delivered or picked up
INSTITUTION REP 3 and INSTITUTION REP 1: Most of their deliveries come before 10 in the morning—
works well for both.
Question 23: Would you pick up order if supplier warehouse were close?
Already answered.
Invoicing
Question 24: What is the best way to invoice? (Assumption is consolidated invoicing and a simple
process)
INSTITUTION REP 1: All of our invoices go through the purchasing director. The invoice comes with the
order itself—not a packing slip. 45-day payment cycle. Receiver doesn’t consolidate invoices. He passes
them on to each dining hall, which passes them on to purchasing. The receiver will check quality.
INSTITUTION REP 3: A packing slip comes with each order. A bill comes once a week, consolidated for
the week. They then match these up with the packing slips.
Products
Question 25: What types of products are you interested in?
INSTITUTION REP 1: There is no student demand for local/organic. But if we were to purchase locally,
we’d be interested in produce that would have an impact on students—tomatoes and chickens; a small
group responds to organic in general. We might also be interested in local dairy and meat. In the fall,
apples and root crops.
INSTITUTION REP 3: We don’t get great produce. It would be great to improve it, especially for salads,
tomatoes, melons, fruits. However, most of our cooked veggies are frozen. We do have an older
population that still remembers growing up on a farm. They’re aware of the quality of fresh food. By the
way, we must have chicken three days a week, because of resident demand.
Question 26: What are your quality requirements for produce, dairy, and animal products? [USDA
grades; organic vs. conventional, pastured animal vs. CAF products]
INSTITUTION REP 3: We want whole cases of fresh food that don’t go rotten in two days. But our
clientele wouldn’t know or care about organic. They’d roll their eyes.
INSTITUTION REP 1: I’m not sure how students would respond to organic or local; some would.
112 Appendix E: Demand Sector Interviews THE COMMON MARKET FEASIBILTY STUDY
Question 27: What are your packaging requirements for produce, dairy and animal products?
INSTITUTION REP 3: Our meats must come in frozen. They must be portion sized. Our dairy needs to be
in 4 ounce and 8 ounce containers, though we also have milk dispensers for the cooks. Produce can
come in cases. Doesn’t need to be prewashed and bagged.
INSTITUTION REP 1: Produce in cases is fine. As far as meat goes, we’d prefer pre-cut, mostly frozen, but
not all. And we do do a carving station a few times a week. And we do more fresh veggies now, as
opposed to frozen. Lots of them are pre-cut, but not always.
Question 28: How much of each item do you purchase every year and what price do you pay?
INSTITUTION REP 1: We work on the basis of an x percent food cost. For every dollar we charge for food,
that many cents goes toward the purchase of the food. With catering, the figure is closer to x percent
food cost. Our cost per student per day is around $x (may not be accurate; would need to double check).
Other colleges can charge much more, because tuition is so much higher. There is an enormous amount
of waste in our food service operation.
INSTITUTION REP 3: We have no waste at all. Our food budget per resident per day is $x a day for the
food cost for all meals. Many food companies, like a managed services provider, do it for much less. $x is
not shabby.
Suppliers
Question 29: How many suppliers do you have?
INSTITUTION REP 3: We have a chemical (cleaning) supplier; the national distributor; did have a separate
produce supplier, but not now; we have an outside paper company; an outside ice cream supplier; and
an office supplies vendor.
INSTITUTION REP 1: We have lots of vendors—12 or 14 vendors for food only—which doesn’t include
the additional specialty vendors like the regional produce supplier or meat distributor.
Question 30: How important is maintaining year round supply with one supplier? Why? Or … What
would make it important?
INSTITUTION REP 1: I like the idea of one phone call, one delivery for all local produce. Would this have
an impact on, or upset our other vendors? Not at all—it would only be about x percent or so of our total
purchases.
INSTITUTION REP 3: Same with us. It wouldn’t matter. In fact, it would be fun to do cherry picking,
getting better produce in the summer from local sources.
113 Appendix E: Demand Sector Interviews THE COMMON MARKET FEASIBILTY STUDY
Food Source
Question 31: How do you value the local / organic / conventional options? (local/organic;
local/conventional; organic; conventional)
INSTITUTION REP 1: Organic would come first for us, local second. Organic would mean much more to
the students. Is there an opportunity to make local more important by working with departments?
Maybe. For example, the Nutrition/Nursing Department, which taught a farm to table class. But as for
the kitchen staff, very few would have any gut attachment to any of these issues.
INSTITUTION REP 3: Organic wouldn’t mean much to our clients, but taste would mean a lot. Locally
grown would mean something to them.
Questions 32 and 33: Do you purchase locally produced agricultural products? If so, what local
products do you purchase?
INSTITUTION REP 3: We buy dairy products from a regional dairy processor. That’s about it.
INSTITUTION REP 1: We also buy the regional dairy processor, plus bakery goods from the regional
bakery. Nothing else, really, except for area pork (ham). Not purchasing more from that vendor is strictly
a price issue. We used to buy lots more from them.
Question 34: For locally produced items, how important is it to maintain the identity of farms
producing them (branding)?
Neither were interested in farm identity.
Question 35: What do you see as barriers to purchasing more locally produced foods?
INSTITUTION REP 3: Must be delivered—and in a clean truck used strictly for produce—and, from an
“approved vendor.” This does not mean approved internally, but rather approved because it meets
state, local and federal codes. (She’s not 100 percent sure what it means.) In other words, the source
must have a good reputation, be reliable and sanitary. You must be aware of the approval process; you
must provide the necessary insurance and guarantees for institutional buyers.
INSTITUTION REP 1: Price is the major complication. There’s no customer pressure to do local. If there
were, price wouldn’t be a problem or a barrier. We need to create, grow an interest in local, then all
barriers can be overcome.

114 Appendix E: Demand Sector Interviews THE COMMON MARKET FEASIBILTY STUDY
Grocery Stores
Focus Group Date:
September 8, 2006
One of the interviewers explains the purpose of the interview, and about the Common Market Basket
sheet.
Management Approach
Question 1: What is your typical day like?
GROCERY 2: Get up first thing in the morning and go to The Terminal Market 2x a week to backfill w/
local or certified organic produce for the store. He’d prefer to have certified organic if it’s imported.
Back to store to set up, and then he and his partner make sandwiches. Store opens in the morning, and
stays open late enough so that people returning home from work can shop. Gets deliveries throughout
the day. Once weekly he goes to pick-up milk. The store is open 7 days/week, and he and his partner
switch off days.
GROCERY 1: As store and farmstand manager, he’s in charge of the growing, but also of sales in the
market. Early, he collects the picking crew and assigns a pick list for the day. Then he arranges for their
buyer to go and pick-up items from local farms for the market. Store opens in the morning, but not fully
stocked until later. Mid-day he goes out on the farm to check on what items will be ready for the next
day, what’s in, what’s not. By late day, he puts together a list of what they’ll need to need to buy for
tomorrow. Everything that they can’t buy locally, they get from the Terminal Market. Then it’s shut
down time. He took over farming operations first, then business operations. They don’t do any prepared
foods onsite, and struggled with that, but they do bring in prepared/value-added items. Only being open
seasonally, they already have enough problems getting enough staff. The farmer does all the spraying
(pesticides/fertilizers).
GROCERY 3: Typical day changes with the seasons, right now it would be on the road five days a week,
waking up in his PA home base, and first thing reading emails to maintain the different wants and needs
for the stores in different regions. Today, he then went and met with an orchard to walk the farm and
get projections on availability. Next week he’ll be in a southern state, and the next in a northern one.
Typically at this time he drives thousands of miles a week. He sits in on contract meetings with the
growers, but his indirect superiors set those up. He’s the daily maintainer. In winter he runs the off-
loading of the boats coming in from South America.
Question 2: What part of your job do you like the best?
GROCERY 1: Mornings, when his day is the slowest. If you screw up the morning, you can’t catch up. I
literally lose stuff in the field. But if you get it done, you’re set. I love my field crew; they are all from one
family.
115 Appendix E: Demand Sector Interviews THE COMMON MARKET FEASIBILTY STUDY
GROCERY 3: When he’s able to get off the computer or out of the car. When he gets to the farm and he
can see the grower get really excited, and then share that enthusiasm and photos with the people in the
corporate offices. When the farmer shows up with the product. When he can just order an item off a list
and get a happy surprise.
Question 3: What are the rough spots in your day?
GROCERY 1: Labor issues and customers. Because they already offer such a variety, customers just
expect so much. Day to day, I can’t guarantee you what I’ll have, let alone next week.
GROCERY 3: When there are problem arrivals, when we agree to purchase something, and that’s not
what arrives. I have to do a lot of good cop/bad cop.
GROCERY 2: I don’t want to do prepared foods, but my partner does. We do everything ourselves, and
have to watch that we don’t do too much. You never feel like you did all right.
Question 4: What ideas do you have to improve the problem areas?
GROCERY 3: Communication. How can I make things better in the future so that we don’t have this
problem again?
GROCERY 2: We’re going to hire some people to take some of the labor burden off of us. But then we’ll
have a whole new set of problems.
GROCERY 1: When you start hiring more staff, you also have to hire someone for upper management.
You always hold the ideal of what could happen, but it never quite gets there all the way. There’s never
enough time, and I have two store managers.
Question 5: What are your business’s goals and standards and how do you go about meeting them?
GROCERY 2: Basically, not to go out of business. In five years to either sell for a profit, or at least be a
self-sustaining business. Our standards are really high. If I wouldn’t eat or cook it, I don’t want anyone
else too, either. They’re our neighbors.
GROCERY 1: We hired a business advisor to help us with an x-year plan. We met those goals in fewer
years. We keep meeting them, so our financial goals are being met, but not his personal goals of owning
his own farm. Our quality standards are being met. Our customers and our staff make sure we do that.
Lots of customers.
GROCERY 3: My goal is to put a face on the PR machine of the national chain. I try to live that everyday
when I deal with growers.
GROCERY 2: Meeting our financial goals, seeing the faces of new customers, a lot of new ones this
summer, and a lot of them are gardeners, so they know what they’re looking for.
GROCERY 1 asks if GROCERY 2 is seeing the customers switch their buying preference from Certified
Organic to Local?
116 Appendix E: Demand Sector Interviews THE COMMON MARKET FEASIBILTY STUDY
GROCERY 2: Agrees, but says the sellers at the Terminal Market don’t care at all.
Question 6. What else is important to you?
Question 7. What else do you do?
GROCERY 1: Variety. Sitting down with the seed catalogs, and getting the farmer to open up to a new
variety. First triumph was okra—the farmer allowed him to grow it on his time and sell it to the stand.
Now they as a farm they grow it, and he has a blank check in choosing the varieties. They try something
new every year. Now we’re focusing on beans. Never been able to get a large-scale hot pepper
operation going. Mushrooms never really worked out in large amounts. I can’t stand to go to the grocery
store, I’ll get ‘in trouble’ with the customers if someone catches me in a farm shirt.
GROCERY 3: I’m the conscience of the buying department. I’m the one that is reminding the national
merchandiser about what was talked about at their general meetings.
GROCERY 2: Trying to help customers figure out what to cook for dinner. Encouraging them that they
can do it themselves.
Demographics
Question 8: What are the demographics of your customers?
GROCERY 3: More than just saying Black or White, wealthy or poor, I’d say they are people with food
awareness, and we serve them on a bunch of different levels. It’s people who know ingredients.
GROCERY 2: It’s a group with kids, that is looking for a nice neighborhood. They would rather buy than
rent, and a lot of them are first-time buyers. Most people walk there, and are educated and of a certain
economic class. Mostly White and Asian, some African-American.
GROCERY 1: The uber-rich, very demanding. Average income is $120,000 a year, 35-50 year-old mothers
with tremendous amounts of money. All are willing to drive around for 6 hours just to do all their
shopping. They are an informed shopper, and mostly White.
Ordering
Question 9. What is your ordering process?
GROCERY 3: Since the stores pull from our own distribution centers, they match our availability to their
par list. Individual stores are also now mandated to do ‘back-door’ deals with local growers, due to
increasing customer demand for local. Department Managers can set up the paper work, and then they
and the Team Leaders [form] their own separate relationships with those producers for their store,
individually. Not every store has done it yet, but will within the next several months.
117 Appendix E: Demand Sector Interviews THE COMMON MARKET FEASIBILTY STUDY
GROCERY 2: We contact the farmers or they contact us. We have very limited space, so we order around
that. There are things we just have to have, and then things we’ll back fill from the Terminal. We have a
weekly budget, per section, and try to spread that out with the different farmers.
GROCERY 1: Yeah, I have to spread it out to all the farmers, too, because they’re all friends of ours. I
have my farmer friends (mostly non-chemical growers) and the farmer has his farmer friends (old-school
growers). We do play favorites, the smaller the farm the more likely we are to buy from you.
Questions 10, 12, 14, already dealt with in earlier answers.
Question 11. How do you place your orders (phone, fax, email, website)?
GROCERY 2: All of the above, fax first, and then phone.
GROCERY 1: Only phone. Would do web if I could be sure about the accountability. Personal contact is
important.
GROCERY 3: Predominantly the phone, but also the web.
Question 13. I order from supplier’s website, how does this compare to fax, telephone, email or other
ways to order?
GROCERY 1: The value of a good website is invaluable. It should be informational, with a window of
availability/seasonality. I’d actually buy more from a site like that.
GROCERY 3: In the initial part it would be good, the phone (next best thing to face-to-face) is key.
GROCERY 1: I don’t know how people farmed without cell phones.
GROCERY 2: I use the web, but the phone is important, and certainly knowing the source farm is
important.
GROCERY 1: If you do this correctly, you will do so much volume it will be really successful.
Question 15. How much flexibility do you need in order size? What is a reasonable minimum order?
(Cases or dollars?)
GROCERY 3: We talk pallets, but we’ll deal in boxes to support the farmers. We try to be flexible.
GROCERY 2: I think a dollar amount is better than a case minimum. If they have a huge minimum, we try
to work around it.
GROCERY 1: As a seller, we might impose it, but as a buyer, we try to be flexible. We’ll have some
neighbor bring us a ¼ flat of something, and take it. (Selling) we’ll be charging a premium for splits, soon.
GROCERY 2: We’re so small scale, but soon we’ll need to have a better idea. But we don’t worry about
splits.
118 Appendix E: Demand Sector Interviews THE COMMON MARKET FEASIBILTY STUDY
Question 16. What do you need to know about product availability?
GROCERY 3: That’s my whole job, knowing it and making sure the flow is smooth thru the transitions.
Question 17. What seasonability issues are there? (Would you be willing to buy frozen, local fruit in
the off months?)
GROCERY 3: We try to balance people’s belief that they should be able to get what they want, when
they want, with what’s really available. Or they read something in a magazine, and want it NOW, even
though the magazines are not always great on seasonality. I’ll get it if they want it, but you better come
and buy it, then! Local frozen makes sense to me, but is not within my buying sphere.
GROCERY 2: I’d be willing to buy frozen. I’d rather pay a little more in electricity and enhance local
buying.
GROCERY 1: It would not work for us. Our customers are pretty good on seasonality (and they are not
open in the Winter). It is fine for value-added products, though. Local (frozen) meats have done well for
us.
Question 18. What drives your purchasing: quality or price? (Growing method, organic/conventional,
grade, pastured/CAFO)
GROCERY 1: Ethics are #1, I know all the farmers and their methods, and their quality is tops. Price, we
don’t care, just don’t bullshit me on stuff.
GROCERY 2: We met a lot of them through a nonprofit, so they came with a ‘voucher.’ With the
purveyors at the Terminal, we deal with people that we’ve been referred to [by] others that we trust. I
have good relationships down at the Terminal.
GROCERY 3: Quality is the defining choice, then growing method & ethics. Also who you deal with on the
farm.
An interviewer asks GROCERY 3 about their perspective on illegal workers.
GROCERY 3: We have 3rd party audits. If there is a problem, we’ll ask them to fix it, and if they don’t,
we’ll shut them out.
Question 19. What other rules of thumb do you have for purchasing decisions?
GROCERY 3: Loose guidelines, if it’s a cold call from a new potential farm/supplier, I’ll just be straight up
about what we expect.
GROCERY 2: Ditto, if you don’t bring me the thing, I won’t give you the money.
GROCERY 1: Ditto, it’s the honesty issue.
Question 20.What do want in an ideal ordering process? (Patterns, cycles, lead times?)
119 Appendix E: Demand Sector Interviews THE COMMON MARKET FEASIBILTY STUDY
GROCERY 2: We’re so small, that within a week is good. Get deliveries 4 days a week. Lead-time for
information? As soon as you know (the grower).
GROCERY 1: For us everything is geared towards the weekend. We want to order early in the week to
receive on Thursday for weekend.
GROCERY 2: Ditto, I’ll go on Tuesday and Friday for pick-ups.
GROCERY 1 & GROCERY 2 agree that Sunday is their busiest day.
GROCERY 3: Bulk of ordering is geared towards end of week purchasing, but the stores and centers do
receive daily.
Delivery
Question 21. What are your delivery expectations? (Pick up or delivery)
GROCERY 1: Delivery, but the farmer's going to go and look at the farm and products.
GROCERY 3: Both, it depends on what items are and quantity.
GROCERY 2: Both, but I like going and looking, so I like to pick-up.
GROCERY 1: I can tell everything, by the field crew, what’s going on at a farm.
GROCERY 3: (Agrees) What’s going on with the farm, where’s their pond at?
Question 22. When (day and time) is best for delivery; or pick up?
GROCERY 3: The distribution centers take delivery on appointment, and the logistics are very detailed.
The ‘back door’ deliveries to specific stores by farmers are more flexible. Whichever Team Leader that’s
on duty, will have to receive it.
GROCERY 2: Before opening, but we take it whenever. I don’t really like getting it after we open,
because I can’t really check to make sure if it is correct/complete.
GROCERY 1: It’s better in the afternoon, so I can be there to see it.
GROCERY 3: The Common Market will definitely have to have a ‘Strike System” for monitoring quality of
deliveries.
Question 23 already dealt with in other answers.
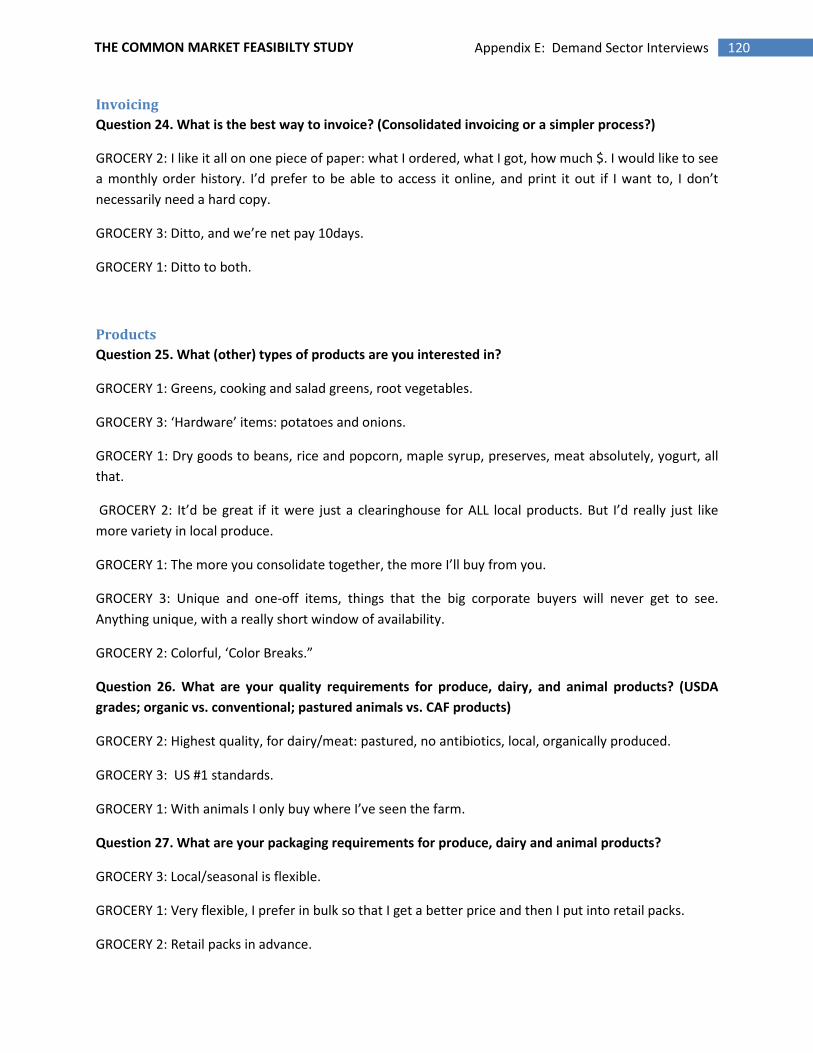
120 Appendix E: Demand Sector Interviews THE COMMON MARKET FEASIBILTY STUDY
Invoicing
Question 24. What is the best way to invoice? (Consolidated invoicing or a simpler process?)
GROCERY 2: I like it all on one piece of paper: what I ordered, what I got, how much $. I would like to see
a monthly order history. I’d prefer to be able to access it online, and print it out if I want to, I don’t
necessarily need a hard copy.
GROCERY 3: Ditto, and we’re net pay 10days.
GROCERY 1: Ditto to both.
Products
Question 25. What (other) types of products are you interested in?
GROCERY 1: Greens, cooking and salad greens, root vegetables.
GROCERY 3: ‘Hardware’ items: potatoes and onions.
GROCERY 1: Dry goods to beans, rice and popcorn, maple syrup, preserves, meat absolutely, yogurt, all
that.
GROCERY 2: It’d be great if it were just a clearinghouse for ALL local products. But I’d really just like
more variety in local produce.
GROCERY 1: The more you consolidate together, the more I’ll buy from you.
GROCERY 3: Unique and one-off items, things that the big corporate buyers will never get to see.
Anything unique, with a really short window of availability.
GROCERY 2: Colorful, ‘Color Breaks.”
Question 26. What are your quality requirements for produce, dairy, and animal products? (USDA
grades; organic vs. conventional; pastured animals vs. CAF products)
GROCERY 2: Highest quality, for dairy/meat: pastured, no antibiotics, local, organically produced.
GROCERY 3: US #1 standards.
GROCERY 1: With animals I only buy where I’ve seen the farm.
Question 27. What are your packaging requirements for produce, dairy and animal products?
GROCERY 3: Local/seasonal is flexible.
GROCERY 1: Very flexible, I prefer in bulk so that I get a better price and then I put into retail packs.
GROCERY 2: Retail packs in advance.
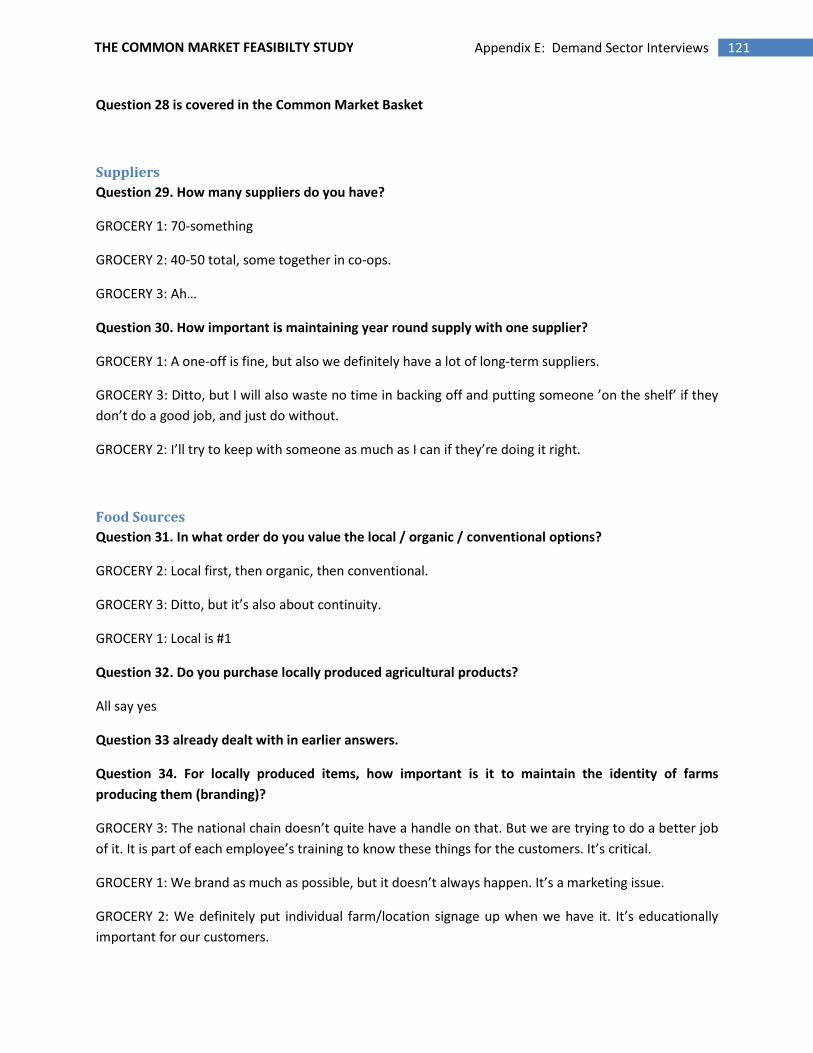
121 Appendix E: Demand Sector Interviews THE COMMON MARKET FEASIBILTY STUDY
Question 28 is covered in the Common Market Basket
Suppliers
Question 29. How many suppliers do you have?
GROCERY 1: 70-something
GROCERY 2: 40-50 total, some together in co-ops.
GROCERY 3: Ah…
Question 30. How important is maintaining year round supply with one supplier?
GROCERY 1: A one-off is fine, but also we definitely have a lot of long-term suppliers.
GROCERY 3: Ditto, but I will also waste no time in backing off and putting someone ’on the shelf’ if they
don’t do a good job, and just do without.
GROCERY 2: I’ll try to keep with someone as much as I can if they’re doing it right.
Food Sources
Question 31. In what order do you value the local / organic / conventional options?
GROCERY 2: Local first, then organic, then conventional.
GROCERY 3: Ditto, but it’s also about continuity.
GROCERY 1: Local is #1
Question 32. Do you purchase locally produced agricultural products?
All say yes
Question 33 already dealt with in earlier answers.
Question 34. For locally produced items, how important is it to maintain the identity of farms
producing them (branding)?
GROCERY 3: The national chain doesn’t quite have a handle on that. But we are trying to do a better job
of it. It is part of each employee’s training to know these things for the customers. It’s critical.
GROCERY 1: We brand as much as possible, but it doesn’t always happen. It’s a marketing issue.
GROCERY 2: We definitely put individual farm/location signage up when we have it. It’s educationally
important for our customers.

122 Appendix E: Demand Sector Interviews THE COMMON MARKET FEASIBILTY STUDY
All agree that the Common Market will be important to brand.
Question 35. What do you see as barriers to purchasing more locally produced foods?
GROCERY 1: Only issue is when a (local) season ends prematurely, and then all of a sudden forced to
source something from NY. How well the Common Market will be able to keep up with the demand. You
almost have to auction it off online. The farmers run out and then what happens?
GROCERY 2: The customer’s lack of knowledge about what’s local. Avocados, oranges… people want
what they want. Having to turn people away because I don’t have something.
GROCERY 3: Re-gearing our corporate ‘culture’ to directly deal with the producer. To really deliver on
this promise we’ve made, we’ll have to retool o[u]r process. Which is happening, because we have to,
we helped create the monster, and now the customers expect it.
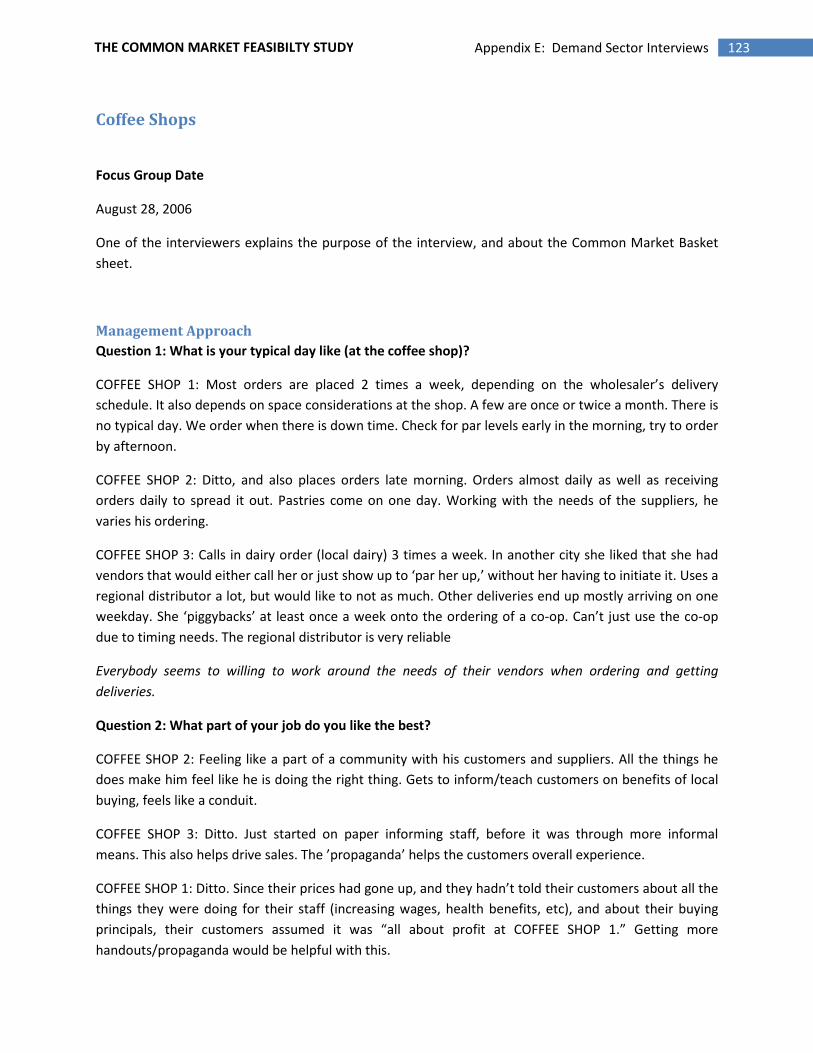
123 Appendix E: Demand Sector Interviews THE COMMON MARKET FEASIBILTY STUDY
Coffee Shops
Focus Group Date
August 28, 2006
One of the interviewers explains the purpose of the interview, and about the Common Market Basket
sheet.
Management Approach
Question 1: What is your typical day like (at the coffee shop)?
COFFEE SHOP 1: Most orders are placed 2 times a week, depending on the wholesaler’s delivery
schedule. It also depends on space considerations at the shop. A few are once or twice a month. There is
no typical day. We order when there is down time. Check for par levels early in the morning, try to order
by afternoon.
COFFEE SHOP 2: Ditto, and also places orders late morning. Orders almost daily as well as receiving
orders daily to spread it out. Pastries come on one day. Working with the needs of the suppliers, he
varies his ordering.
COFFEE SHOP 3: Calls in dairy order (local dairy) 3 times a week. In another city she liked that she had
vendors that would either call her or just show up to ‘par her up,’ without her having to initiate it. Uses a
regional distributor a lot, but would like to not as much. Other deliveries end up mostly arriving on one
weekday. She ‘piggybacks’ at least once a week onto the ordering of a co-op. Can’t just use the co-op
due to timing needs. The regional distributor is very reliable
Everybody seems to willing to work around the needs of their vendors when ordering and getting
deliveries.
Question 2: What part of your job do you like the best?
COFFEE SHOP 2: Feeling like a part of a community with his customers and suppliers. All the things he
does make him feel like he is doing the right thing. Gets to inform/teach customers on benefits of local
buying, feels like a conduit.
COFFEE SHOP 3: Ditto. Just started on paper informing staff, before it was through more informal
means. This also helps drive sales. The ’propaganda’ helps the customers overall experience.
COFFEE SHOP 1: Ditto. Since their prices had gone up, and they hadn’t told their customers about all the
things they were doing for their staff (increasing wages, health benefits, etc), and about their buying
principals, their customers assumed it was “all about profit at COFFEE SHOP 1.” Getting more
handouts/propaganda would be helpful with this.
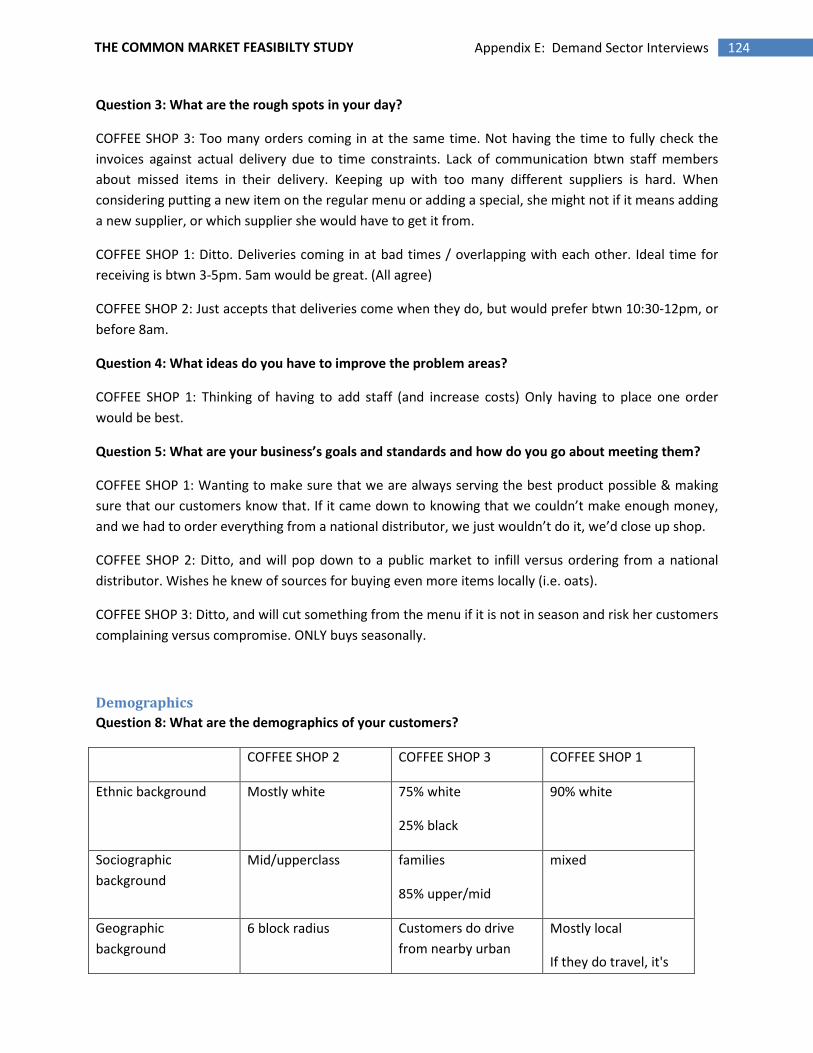
124 Appendix E: Demand Sector Interviews THE COMMON MARKET FEASIBILTY STUDY
Question 3: What are the rough spots in your day?
COFFEE SHOP 3: Too many orders coming in at the same time. Not having the time to fully check the
invoices against actual delivery due to time constraints. Lack of communication btwn staff members
about missed items in their delivery. Keeping up with too many different suppliers is hard. When
considering putting a new item on the regular menu or adding a special, she might not if it means adding
a new supplier, or which supplier she would have to get it from.
COFFEE SHOP 1: Ditto. Deliveries coming in at bad times / overlapping with each other. Ideal time for
receiving is btwn 3-5pm. 5am would be great. (All agree)
COFFEE SHOP 2: Just accepts that deliveries come when they do, but would prefer btwn 10:30-12pm, or
before 8am.
Question 4: What ideas do you have to improve the problem areas?
COFFEE SHOP 1: Thinking of having to add staff (and increase costs) Only having to place one order
would be best.
Question 5: What are your business’s goals and standards and how do you go about meeting them?
COFFEE SHOP 1: Wanting to make sure that we are always serving the best product possible & making
sure that our customers know that. If it came down to knowing that we couldn’t make enough money,
and we had to order everything from a national distributor, we just wouldn’t do it, we’d close up shop.
COFFEE SHOP 2: Ditto, and will pop down to a public market to infill versus ordering from a national
distributor. Wishes he knew of sources for buying even more items locally (i.e. oats).
COFFEE SHOP 3: Ditto, and will cut something from the menu if it is not in season and risk her customers
complaining versus compromise. ONLY buys seasonally.
Demographics
Question 8: What are the demographics of your customers?
COFFEE SHOP 2 COFFEE SHOP 3 COFFEE SHOP 1
Ethnic background Mostly white 75% white
25% black
90% white
Sociographic
background
Mid/upperclass families
85% upper/mid
mixed
Geographic
background
6 block radius Customers do drive
from nearby urban
Mostly local
If they do travel, it's

125 Appendix E: Demand Sector Interviews THE COMMON MARKET FEASIBILTY STUDY
hospital/office
theater
staff/actors/patrons
areas, for food
Some combine trips to
local businesses and a
co-op
veg/vegan
Local enthusiasts
Museum and arts
program staff
Weekends - tourists
Ordering
Question 9. What is your ordering process?
COFFEE SHOP 3: For some things a running clipboard, or worksheet with par levels, or a par ‘trigger’ list
(what item’s level triggers an order). No computer in shop (one at home), all ordering done by hand.
Cross checks w/pastry chef. Space considerations always drive ordering as well as seasonal responses.
All ordering done by phone. Piggybacks w/ co-op 2x week, 4x would just be too time consuming.
COFFEE SHOP 1: Ditto. Prefers phone calls, web ordering extends her day even further, interferes with
customer interactions, uses the fax machine some.
COFFEE SHOP 2: Phone is best. Keeps inventories daily, orders daily
Regarding computers:
COFFEE SHOP 1: If had to order via the web, could adjust to it. They do split up some of the ordering
with other staff members, but only the owners do the web ordering, so that would mean they
could/would not be able to delegate it. They recommend against a sophisticated web page. They really
appreciate being called, versus having to make the call. They might not remember to call, and then that
vendor has lost a sale.
Both COFFEE SHOP 1 & COFFEE SHOP 2 agree though, that having a web presence has really helped sales
Questions 10, 11, 12, 13, 14, already dealt with in earlier answers.
Question 15. How much flexibility do you need in order size? What is a reasonable minimum order?
(Cases or dollars?)
COFFEE SHOP 2: If a minimum order is $x, that’s okay. Quantity: xbushel is a bit much, but split cases
would be great. Even paying extra. Charge to split up a case would be fine. Hates separate fuel charges,
it messes up his costing.
COFFEE SHOP 3: $x minimum would be a dream. The regional distributor does more. OR x item
minimum. As much as she can consolidate ordering/deliveries she will. 3x week milk delivery is
necessary for her.
COFFEE SHOP 1: $ amount vs. item minimum better for them
126 Appendix E: Demand Sector Interviews THE COMMON MARKET FEASIBILTY STUDY
Question 16. What do you need to know about product availability?
COFFEE SHOP 1: Need to know pre-delivery if item is not available. What’s very difficult is crafting a
regular menu around local items, and then sometimes they’re not available. They’re forced to substitute
with another product, and it doesn’t taste the same. Regular menu stays very consistent. Need to be
able to count on availability. Can do specials if something is new/limited seasonal availability, but with
that don’t worry so much about advance notice.
COFFEE SHOP 3: They have so many everyday regulars that they keep the menu very consistent All agree
on this as a particularly coffee shop necessity.
Question 17. What seasonability issues are there? (Would you be willing to buy frozen, local fruit in
the off months?)
All agree they would love to be able to buy local year round (and frozen) for consistency.
COFFEE SHOP 1: 5lb/ 2 1/2lb containers would be best. (All agree)
Question 18. What drives your purchasing: quality or price? (Growing method, organic/conventional,
grade, pastured/CAFO)
COFFEE SHOP 3: Would love to say certified organic, but price is very important. She will pay more for
quality. Certification not important at all. Would pay x% more for organic.
COFFEE SHOP 1: Would rather buy local/not certified organic, than certified organic/not local. Principals
drive everything. Will pay more, but how much they can, there is a limit to. Local the priority & knowing
your suppliers is most important. Not having to add a new supplier is key (they already have so many).
COFFEE SHOP 2: Ditto. Trusts a nonprofit, and so if not certified would trust the Common Market to
make the decision on suppliers.
COFFEE SHOP 1: Being able to do farm tours with the Common Market would be great for their
customers.
Question 19. What other rules of thumb do you have for purchasing decisions?
COFFEE SHOP 1: LEGAL operators (i.e. baked/prepared goods), nice people/suppliers and no high
fructose corn syrup.
Question 20. What do want in an ideal ordering process? (Patterns, cycles, lead times?)
COFFEE SHOP 1: Ideal lead-time is a day before, but outside max is 2½ days. Confirmation is great.
127 Appendix E: Demand Sector Interviews THE COMMON MARKET FEASIBILTY STUDY
Delivery
Question 21. What are your delivery expectations? (Pick up or delivery)
All agree on delivery.
Question 22 already dealt with in earlier answers.
Question 23. Would you pick up order if the supplier warehouse were close? Ask to clarify.
All agree that they do now, and would continue to, but only to supplement.
Invoicing
Question 24. What is the best way to invoice? (Consolidated invoicing or a simpler process?)
COFFEE SHOP 3: Prefers COD. Hates packing slips, prefers invoice.
COFFEE SHOP 1: COD & ditto.
COFFEE SHOP 2: Would be happy to be billed, but would need a packing slip with each delivery.
Products
Question 25.What (other) types of products are you interested in?
COFFEE SHOP 1: Would love to see some really good baked goods. If there [are] items like avocados or
lemons, bananas that we use that cannot be purchased locally—stuff that we have to go to the
Restaurant Depot for—would love to be able to get through the CM from a larger network of good
family farms.
COFFEE SHOP 2: Ditto and (locally) off-season items, but that our customers still want. For coffee shops,
especially, it is hard to teach/fight the customer’s perception of what’s available by season.
COFFEE SHOP 3: Ditto and dry goods (flour, etc). Bulk orders of items like the S&C pickles. More locally
made value-added items.
COFFEE SHOP 2: Recyclable and/or locally made paper goods (Cups, straws, coffee filters, toilet paper.
All agree they would adapt to new/different products if available at the Common Market
An interviewer asks, “When you first heard about the Common Market what was most exciting to
you?”
COFFEE SHOP 1: Location, pick up & delivery options. Feeling like it would increase our connectedness to
a larger community.
128 Appendix E: Demand Sector Interviews THE COMMON MARKET FEASIBILTY STUDY
COFFEE SHOP 3: Ditto and that by having a pool of suppliers, you could overall have enough quantity
available.
COFFEE SHOP 1: Has had to use too many conventional suppliers, this would give us more options.
Might even bring down costs or even out seasonal fluctuations.
Question 26. What are your quality requirements for produce, dairy, and animal products? (USDA
grades; organic vs. conventional; pastured animals vs. CAF products)
COFFEE SHOP 1: NO factory farms
Ditto all
COFFEE SHOP 1: Cocoa products are really hard to source based on our principles and needing high
quality.
COFFEE SHOP 3: Needs quality, that trumps everything
Question 27. What are your packaging requirements for produce, dairy and animal products?
COFFEE SHOP 3: Standard plastic jugs for milk, meats cryovac’d, the less packaging the better. If we
could get items delivered in re-usable tubs that were stackable or collapsible, that would be great.
Deposit is fine. Stackable baskets that nested into each other for spacing consideration…would be
willing to buy her tubs. They should be Food grade plastic.
Question 28 is covered in the Common Market Basket
Suppliers
Question 29. How many suppliers do you have?
COFFEE SHOP 2: 14, ballpark
COFFEE SHOP 3: 8 or 9 (all raw materials)
COFFEE SHOP 1: Up to 15
Question 30. How important is maintaining year round supply with one supplier?
COFFEE SHOP 3: Very important
COFFEE SHOP 1: Ditto
COFFEE SHOP 2: Ditto
129 Appendix E: Demand Sector Interviews THE COMMON MARKET FEASIBILTY STUDY
Food Sources
Question 31 already dealt with in earlier answers.
Question 32. Do you purchase locally produced agricultural products?
All say yes
Question 33. If so, what local products do you purchase?
All reply Turkey, bacon, ham, dairy, produce, eggs cheese & honey
Question 34. For locally produced items, how important is it to maintain the identity of farms
producing them (branding)?
COFFEE SHOP 1: Important for their customers, and for them personally.
COFFEE SHOP 3: Ditto
COFFEE SHOP 2: Ditto
Question 35. What do you see as barriers to purchasing more locally produced foods?
COFFEE SHOP 3: Lack of knowledge, time constraints on personally searching out these items.
COFFEE SHOP 1: Produce is the only thing, due to availability.
COFFEE SHOP 2: Lack of knowing what else is out there.
All express their excitement about the retail aspect of the Common Market, as well.

130 Appendix E: Demand Sector Interviews THE COMMON MARKET FEASIBILTY STUDY
Caterers
An interviewer briefly describes the Common Market project and explains the purpose of the interviews.
Management Questions
Question 1: What does your typical day look like?
CATERER 1: It changes day-to-day. Could be big on one day or another, depending on whether it’s a
corporate client or a social client. For her, months are even more significant: December is a huge month.
September, October, May and June are also very active. Corporate and university clients in the fall. July
is the slowest month. February and March are also quite slow. The seasonality makes it tough, with x full
time people to keep employed.
CATERER 2: Since she’s new and part time, there is no typical day, yet. But a busy day would involve
making breakfast and lunch for guests having a conference, and perhaps an evening reception—though
no alcohol is allowed, so this is less frequent. Shops at end of day for next day. There are x people at
most events—and there could be two groups of that size on a single day.
Question 2. What part of your job do you like best?
CATERER 2: Likes shopping for produce—and baking.
CATERER 1: Loves cooking, but doesn’t do much of it anymore. Also doesn’t make orders—chefs and
staff have a system for recording ordering needs, and making at one time during the day. If she ordered,
she would buy more local, but has to push it [with] her chefs, who would be more amenable if it were
easier to order local from a consolidated supplier. She also loves designing events, coming up with
concepts.
Question 3. What are the rough spots in your day?
CATERER 1: More paperwork as business grows.
CATERER 2: Keeping up with email—and going to lots of different stores to shop.
Question 4. What ideas do you have to improve problem areas?
CATERER 2: In terms of buying local, she doesn’t have a set menu, so she can be open about cooking
around the seasonally available.
CATERER 1: Lots of wholesale is delivered to them, but they have to go out for the ethnic and Asian
products (including seitan and tofu). If they could send a guy to one place for these products, instead of
lots of locations, that would save a lot of time and headaches.
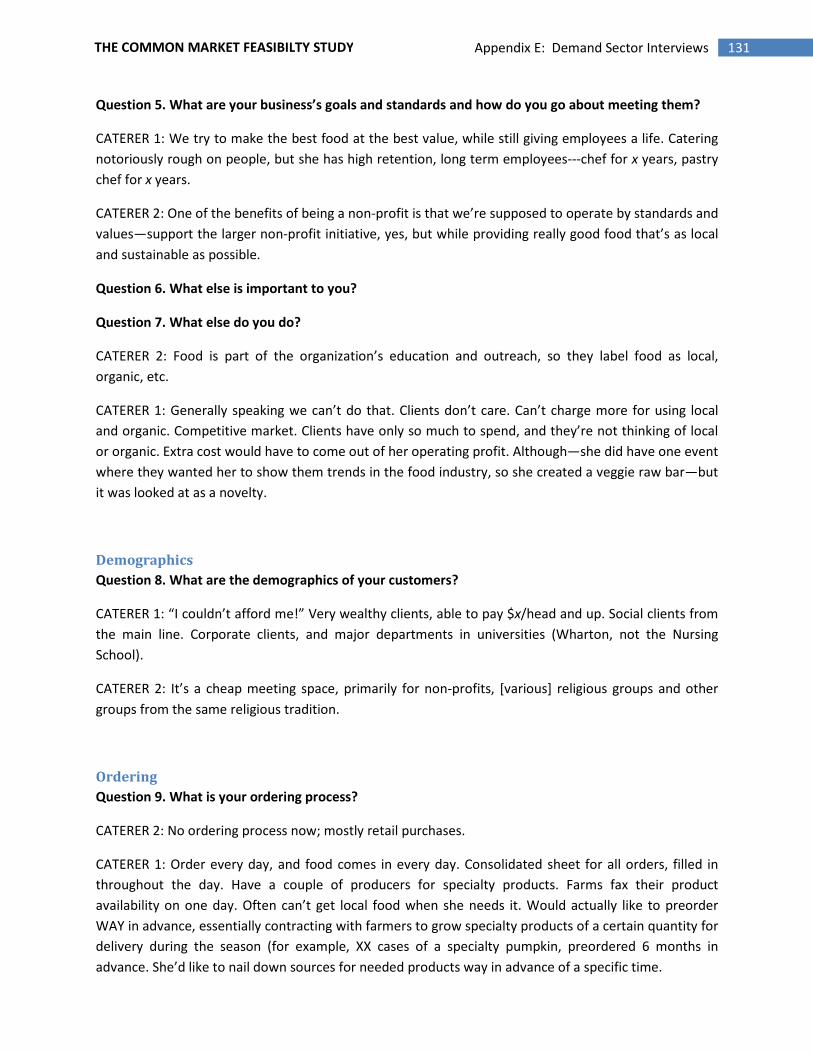
131 Appendix E: Demand Sector Interviews THE COMMON MARKET FEASIBILTY STUDY
Question 5. What are your business’s goals and standards and how do you go about meeting them?
CATERER 1: We try to make the best food at the best value, while still giving employees a life. Catering
notoriously rough on people, but she has high retention, long term employees---chef for x years, pastry
chef for x years.
CATERER 2: One of the benefits of being a non-profit is that we’re supposed to operate by standards and
values—support the larger non-profit initiative, yes, but while providing really good food that’s as local
and sustainable as possible.
Question 6. What else is important to you?
Question 7. What else do you do?
CATERER 2: Food is part of the organization’s education and outreach, so they label food as local,
organic, etc.
CATERER 1: Generally speaking we can’t do that. Clients don’t care. Can’t charge more for using local
and organic. Competitive market. Clients have only so much to spend, and they’re not thinking of local
or organic. Extra cost would have to come out of her operating profit. Although—she did have one event
where they wanted her to show them trends in the food industry, so she created a veggie raw bar—but
it was looked at as a novelty.
Demographics
Question 8. What are the demographics of your customers?
CATERER 1: “I couldn’t afford me!” Very wealthy clients, able to pay $x/head and up. Social clients from
the main line. Corporate clients, and major departments in universities (Wharton, not the Nursing
School).
CATERER 2: It’s a cheap meeting space, primarily for non-profits, [various] religious groups and other
groups from the same religious tradition.
Ordering
Question 9. What is your ordering process?
CATERER 2: No ordering process now; mostly retail purchases.
CATERER 1: Order every day, and food comes in every day. Consolidated sheet for all orders, filled in
throughout the day. Have a couple of producers for specialty products. Farms fax their product
availability on one day. Often can’t get local food when she needs it. Would actually like to preorder
WAY in advance, essentially contracting with farmers to grow specialty products of a certain quantity for
delivery during the season (for example, XX cases of a specialty pumpkin, preordered 6 months in
advance. She’d like to nail down sources for needed products way in advance of a specific time.
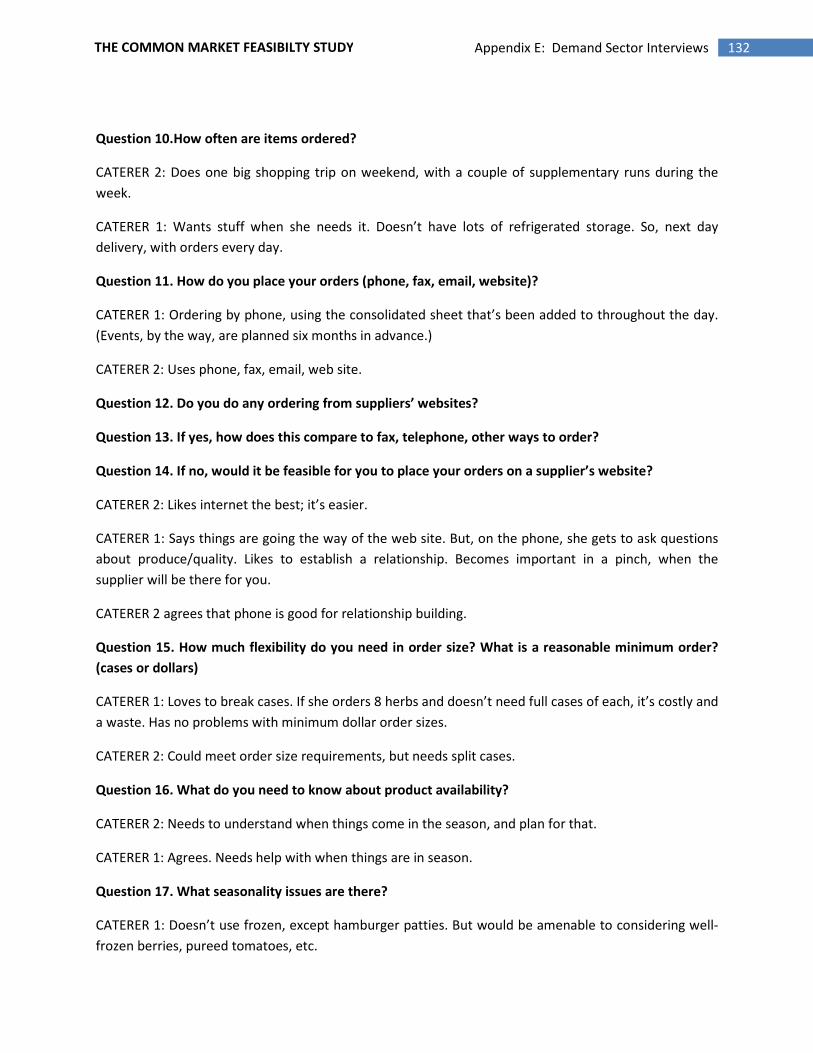
132 Appendix E: Demand Sector Interviews THE COMMON MARKET FEASIBILTY STUDY
Question 10.How often are items ordered?
CATERER 2: Does one big shopping trip on weekend, with a couple of supplementary runs during the
week.
CATERER 1: Wants stuff when she needs it. Doesn’t have lots of refrigerated storage. So, next day
delivery, with orders every day.
Question 11. How do you place your orders (phone, fax, email, website)?
CATERER 1: Ordering by phone, using the consolidated sheet that’s been added to throughout the day.
(Events, by the way, are planned six months in advance.)
CATERER 2: Uses phone, fax, email, web site.
Question 12. Do you do any ordering from suppliers’ websites?
Question 13. If yes, how does this compare to fax, telephone, other ways to order?
Question 14. If no, would it be feasible for you to place your orders on a supplier’s website?
CATERER 2: Likes internet the best; it’s easier.
CATERER 1: Says things are going the way of the web site. But, on the phone, she gets to ask questions
about produce/quality. Likes to establish a relationship. Becomes important in a pinch, when the
supplier will be there for you.
CATERER 2 agrees that phone is good for relationship building.
Question 15. How much flexibility do you need in order size? What is a reasonable minimum order?
(cases or dollars)
CATERER 1: Loves to break cases. If she orders 8 herbs and doesn’t need full cases of each, it’s costly and
a waste. Has no problems with minimum dollar order sizes.
CATERER 2: Could meet order size requirements, but needs split cases.
Question 16. What do you need to know about product availability?
CATERER 2: Needs to understand when things come in the season, and plan for that.
CATERER 1: Agrees. Needs help with when things are in season.
Question 17. What seasonality issues are there?
CATERER 1: Doesn’t use frozen, except hamburger patties. But would be amenable to considering well-
frozen berries, pureed tomatoes, etc.
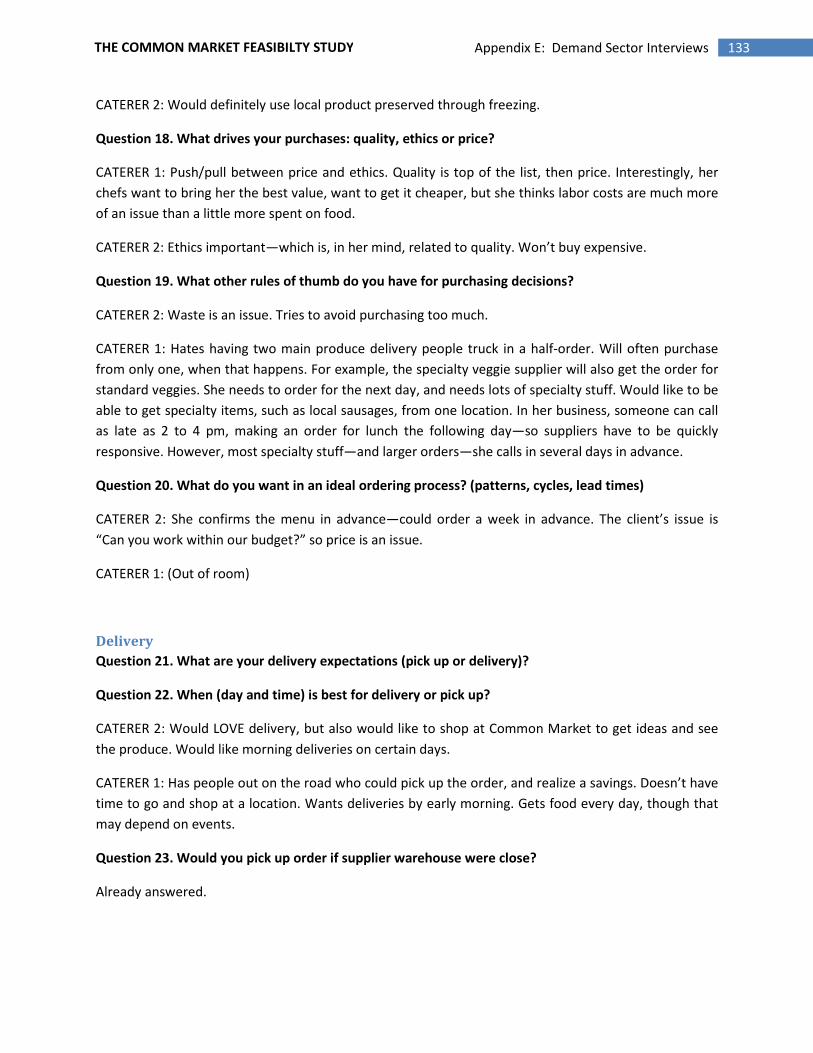
133 Appendix E: Demand Sector Interviews THE COMMON MARKET FEASIBILTY STUDY
CATERER 2: Would definitely use local product preserved through freezing.
Question 18. What drives your purchases: quality, ethics or price?
CATERER 1: Push/pull between price and ethics. Quality is top of the list, then price. Interestingly, her
chefs want to bring her the best value, want to get it cheaper, but she thinks labor costs are much more
of an issue than a little more spent on food.
CATERER 2: Ethics important—which is, in her mind, related to quality. Won’t buy expensive.
Question 19. What other rules of thumb do you have for purchasing decisions?
CATERER 2: Waste is an issue. Tries to avoid purchasing too much.
CATERER 1: Hates having two main produce delivery people truck in a half-order. Will often purchase
from only one, when that happens. For example, the specialty veggie supplier will also get the order for
standard veggies. She needs to order for the next day, and needs lots of specialty stuff. Would like to be
able to get specialty items, such as local sausages, from one location. In her business, someone can call
as late as 2 to 4 pm, making an order for lunch the following day—so suppliers have to be quickly
responsive. However, most specialty stuff—and larger orders—she calls in several days in advance.
Question 20. What do you want in an ideal ordering process? (patterns, cycles, lead times)
CATERER 2: She confirms the menu in advance—could order a week in advance. The client’s issue is
“Can you work within our budget?” so price is an issue.
CATERER 1: (Out of room)
Delivery
Question 21. What are your delivery expectations (pick up or delivery)?
Question 22. When (day and time) is best for delivery or pick up?
CATERER 2: Would LOVE delivery, but also would like to shop at Common Market to get ideas and see
the produce. Would like morning deliveries on certain days.
CATERER 1: Has people out on the road who could pick up the order, and realize a savings. Doesn’t have
time to go and shop at a location. Wants deliveries by early morning. Gets food every day, though that
may depend on events.
Question 23. Would you pick up order if supplier warehouse were close?
Already answered.
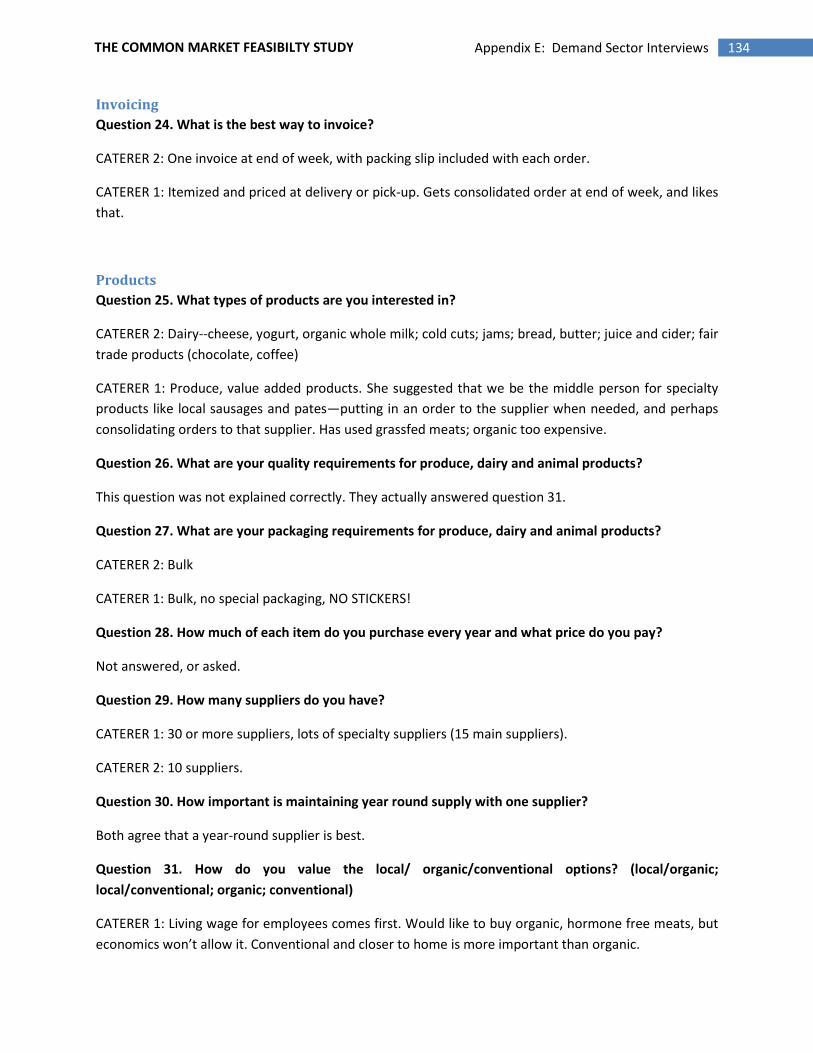
134 Appendix E: Demand Sector Interviews THE COMMON MARKET FEASIBILTY STUDY
Invoicing
Question 24. What is the best way to invoice?
CATERER 2: One invoice at end of week, with packing slip included with each order.
CATERER 1: Itemized and priced at delivery or pick-up. Gets consolidated order at end of week, and likes
that.
Products
Question 25. What types of products are you interested in?
CATERER 2: Dairy--cheese, yogurt, organic whole milk; cold cuts; jams; bread, butter; juice and cider; fair
trade products (chocolate, coffee)
CATERER 1: Produce, value added products. She suggested that we be the middle person for specialty
products like local sausages and pates—putting in an order to the supplier when needed, and perhaps
consolidating orders to that supplier. Has used grassfed meats; organic too expensive.
Question 26. What are your quality requirements for produce, dairy and animal products?
This question was not explained correctly. They actually answered question 31.
Question 27. What are your packaging requirements for produce, dairy and animal products?
CATERER 2: Bulk
CATERER 1: Bulk, no special packaging, NO STICKERS!
Question 28. How much of each item do you purchase every year and what price do you pay?
Not answered, or asked.
Question 29. How many suppliers do you have?
CATERER 1: 30 or more suppliers, lots of specialty suppliers (15 main suppliers).
CATERER 2: 10 suppliers.
Question 30. How important is maintaining year round supply with one supplier?
Both agree that a year-round supplier is best.
Question 31. How do you value the local/ organic/conventional options? (local/organic;
local/conventional; organic; conventional)
CATERER 1: Living wage for employees comes first. Would like to buy organic, hormone free meats, but
economics won’t allow it. Conventional and closer to home is more important than organic.
135 Appendix E: Demand Sector Interviews THE COMMON MARKET FEASIBILTY STUDY
CATERER 2: Closer/local over organic/far away.
Question 32. Do you purchase locally produced agricultural products?
Yes
Question 33. If so, what local products do you purchase?
No additional answers to this question.
Question 34. For locally produced items, how important is it to maintain the identity of farms
producing them (branding)?
CATERER 1: Her employees like to know who the farmer is—like to have a connection/relationship with
him/her. Keeps employees grounded as to what the connection is. Could be more conscious of branding
things to clients as being from certain farms—possible marketing opportunity there, but most clients
don’t care.
CATERER 2: It’s enough to know that it’s from the Common Market. SHE’d like to know names of
producers; not sure customers would care as much. Likes passing info along to guests—gets them
thinking more about the food and where it comes from.
Question 35. What do you see as barriers to purchasing more locally produced foods?
CATERER 2: Availability: Being able to go to one place—a distribution issue.
CATERER 1: Seasonality is a big problem. Limited availability at certain times of the year. Clients have the
expectation that they can have anything at any time.
136 Appendix E: Demand Sector Interviews THE COMMON MARKET FEASIBILTY STUDY
Co-ops
Focus Group Date:
August 16, 2006
An interviewer explains the purpose of this interview. It will be used to test the questions for the other
demand side interviews and should be conducted as if they were not partners in the same project. At
the end there will be an evaluation.
Management Questions
Question 1: What does your typical day look like (at the co-op store?)
CO-OP 1: Process orders in the morning; x people do all the ordering. Then meet other member of the
co-op. Price the items and put them out in the store.
CO-OP 2: Ordering is different per product group: Produce: daily. Orders are placed the night before in
the evening for produce. Food distributor picks it up early in the morning and has the shipment ready
the next day. Organic produce: twice a week from an organic growers' group. Corn is bought directly
from a farmer. It is not frustrating to do that for one product, it is one more call. Dairy: x times a week.
CO-OP 3: Day looks the same like CO-OP 2. A lot of suppliers with all different schedules. At the CO-OP 3
there is one person responsible per product group (meat, dairy, produce etc)
Question 2. What part of your job do you like best?
CO-OP 3: Dealing with customers and suppliers.
CO-OP 2 agrees and adds working for the community to it. CO-OP 1 agrees with these comments.
Question 3. What are the rough spots in your day?
For CO-OP 2 the main issue is that there is not enough space for unloading if suppliers come at the same
time. Another issue is the no shows of the volunteers. This is a big concern for CO-OP 1 as well. For CO-
OP 3 people issues are also the main concern. Because the co-op is thinly staffed, it causes problems if
an employee does not show. Both CO-OP 2 and CO-OP 3 have deliveries several days a week. With no-
shows this becomes difficult. CO-OP 1 adds to the rough spots that suppliers are sometimes out of stock
unexpectedly.
Question 4. What ideas do you have to improve problem areas?
The space problem at CO-OP 2 is currently [being] addressed. For the dedication of volunteers there
should be a change in the bylaws of the co-op. As part of their membership people are required to work
a certain number of hours per year; the dedication is therefore not big. In other co-ops volunteers get a
bigger discount. This is what he wants for CO-OP 2. (CO-OP 2: x hours per year per adult).

137 Appendix E: Demand Sector Interviews THE COMMON MARKET FEASIBILTY STUDY
CO-OP 1 adds that at CO-OP 1 it is x hours per month. He agrees that changing the requirement could
help.
CO-OP 3 realizes that most employees are there for the money and do not work with passion. Good
management should help to get more dedicated people.
An interviewer asks if the Common Market can help to create an experience for the volunteers. Go there
for a visit, go to a farm…They all agree this could help.
Question 5. What are your business’s goals and standards and how do you go about meeting them?
CO-OP 1 says that the main goal is to represent what the members want. Co-op membership should give
them good and affordable quality. The co-op is a real part of the community. CO-OP 2 agrees and adds
to that that of course the store size is a goal but more important the customer service. The customer
group is diversified and it is important to explain the rules and regulations of the co-op. Communication
is key. They all agree with that. CO-OP 3 adds growing the business as an important goal.
Question 6. What else is important to you?
They agree that having more local products is important. According to CO-OP 2 the members like it.
Local meat would be a good addition. Freshness and quality of produce is important says CO-OP 3. Also
the processed goods can be local. Having good quality local products should be possible year round.
An interviewer asks if freshness or local is more important to customers, would they buy frozen local
vegetables instead of fresh produce from further away?
CO-OP 3 thinks both things are important. Customers would like both and are willing to pay for it. Price
does not have to be the main issue. For the CO-OP 3 members it is not about discounted prices. CO-OP 2
co-op members perceive the prices as low. For CO-OP 1 price is a mixed issue, produce is cheaper but
packaged goods are more expensive. CO-OP 1 wants to add to the other points that educating the
customers is essential. They all agree. According to CO-OP 2, customers want to know more about the
background of the products.
An interviewer: could the CM help in making storyboards with the background? Yes. Or have a website
with all the producer profiles? Yes
Question 7. What else do you do?
Answered in other questions.
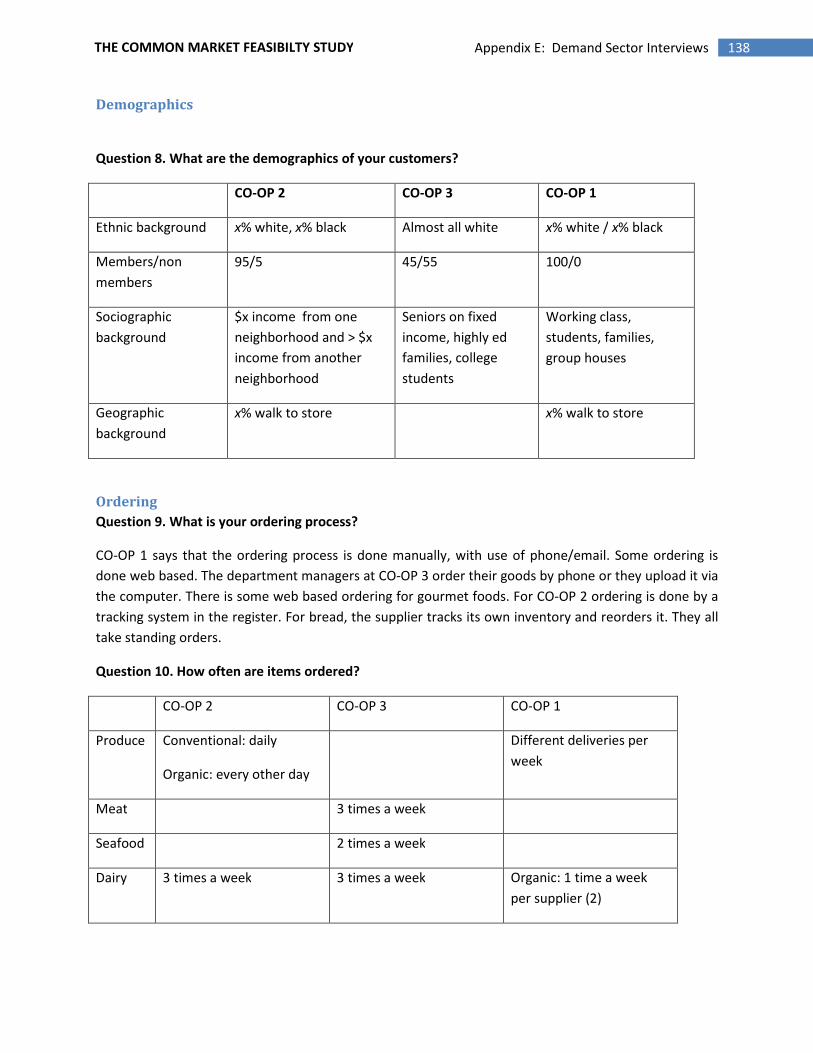
138 Appendix E: Demand Sector Interviews THE COMMON MARKET FEASIBILTY STUDY
Demographics
Question 8. What are the demographics of your customers?
CO-OP 2 CO-OP 3 CO-OP 1
Ethnic background x% white, x% black Almost all white x% white / x% black
Members/non
members
95/5 45/55 100/0
Sociographic
background
$x income from one
neighborhood and > $x
income from another
neighborhood
Seniors on fixed
income, highly ed
families, college
students
Working class,
students, families,
group houses
Geographic
background
x% walk to store x% walk to store
Ordering
Question 9. What is your ordering process?
CO-OP 1 says that the ordering process is done manually, with use of phone/email. Some ordering is
done web based. The department managers at CO-OP 3 order their goods by phone or they upload it via
the computer. There is some web based ordering for gourmet foods. For CO-OP 2 ordering is done by a
tracking system in the register. For bread, the supplier tracks its own inventory and reorders it. They all
take standing orders.
Question 10. How often are items ordered?
CO-OP 2 CO-OP 3 CO-OP 1
Produce Conventional: daily
Organic: every other day
Different deliveries per
week
Meat 3 times a week
Seafood 2 times a week
Dairy 3 times a week 3 times a week Organic: 1 time a week
per supplier (2)

139 Appendix E: Demand Sector Interviews THE COMMON MARKET FEASIBILTY STUDY
Question 11. How do you place your orders (phone, fax, email, website)?
According to CO-OP 2 a part of the ordering system is integrated in the POS system, which emails orders
automatically.
An interviewer asks what they think about the idea of the CM having a web based database in which
companies can place orders for the future.
CO-OP 2 thinks it is a good idea, especially if it is possibly to see next week's produce. As an example of a
good database system CO-OP 2 mentions a regional distributor's system, which has features that show
value, size, yield factor, suggested retail price and a quality report. CO-OP 3 and CO-OP 1 agree that this
is a good database to follow. CO-OP 1 adds that an internet based system would have his preference.
Question 12. Do you do any ordering from suppliers’ websites?
Question 13. If yes, how does this compare to fax, telephone, other ways to order?
Question 14. If no, would it be feasible for you to place your orders on a supplier’s website?
These questions were already dealt with in earlier answers. There is some web based ordering and they
would like to increase it.
Question 15. How much flexibility do you need in order size? What is a reasonable minimum order?
(cases or dollars)
An interviewer explains that this question is important for the CM project in case they want to do
deliveries.
A $x minimum would be a reasonable minimum order size. CO-OP 1 adds that one of his suppliers has a
minimum of $x. Sometimes there is a minimum in cases. For local cheeses and honey it is important to
have a wide assortment. It should be therefore be possible to order small amounts, says CO-OP 2.
Question 16. What do you need to know about product availability?
CO-OP 3 sees knowledge about availability as a good selling point to customers; they will anticipate that
new produce will arrive in season. The contacts between produce managers and the buyers are a good
way of knowing what will be in the market adds CO-OP 2. CO-OP 1 agrees with these two points.
Question 17. What seasonality issues are there?
CO-OP 2 wants to have a sheet with when what is coming to educate customers. CO-OP 3 says that
customers are used to have some produce year round; it would help to tell them more about the
background of the produce in the store.
An interviewer asks if they think that customers will prefer local food even if it is from a larger region,
e.g. not California but North Carolina? Would they see that already as progress?
140 Appendix E: Demand Sector Interviews THE COMMON MARKET FEASIBILTY STUDY
They all think that customers would see that as progress. However, foods from Philadelphia and direct
surroundings will sell best according to CO-OP 2. CO-OP 1 would substitute products to products from
local farmers. The CM can play a part in creating a kind of season extension locally with extending the
local region. The price aspect should not be forgotten, if prices are much higher, it will be difficult, CO-
OP 3 adds. Furthermore, frozen local meat cannot substitute fresh meat, so that is needed fresh year
round.
An interviewer: Would people shift from fresh produce from far to frozen or canned vegetables from the
area?
According to CO-OP 3, there won’t be a shift from fresh to frozen, but frozen local foods would have
preference over frozen products from another area. The conclusion is that local frozen summer produce
cannot really compete with fresh produce from elsewhere.
Question 18. What drives your purchases: quality, ethics or price?
CO-OP 2: 1. quality, 2. ethics, 3. price
CO-OP 3: 1. quality and ethics, 3. price
CO-OP 1: 1. Ethics, 2. quality and price
Question 19. What other rules of thumb do you have for purchasing decisions?
They all agree that customer demand is what drives the business.
Question 20. What do you want in an ideal ordering process? (patterns, cycles, lead times)
Flexibility in ordering the most important issue for CO-OP 3, in both time and quantity. More frequent
deliveries would make it possible to keep the inventory down. CO-OP 2 agrees with that and adds that
more regular (preferable daily) in a standard format would be great. Just in Time (JIT) management
would be perfect. Another issue is timing of deliveries or pickups; as early in am as possible. Before the
customers come in, goods should be on the shelves.
Would the CM be big enough to do this? It cannot start with it but can work towards it.
Delivery
Question 21. What are your delivery expectations (pick up or delivery)?
Both CO-OP 3 and CO-OP 1 prefer deliveries because of either volume or the lack of a refrigerator truck.
CO-OP 2 on the other hand picks up most items and would pick up more if he would have a refrigerator
truck (cheeses etc).
An interviewer says that there is a packaging to keep goods temporarily refrigerated and is recyclable,
which the CM could possibly provide.
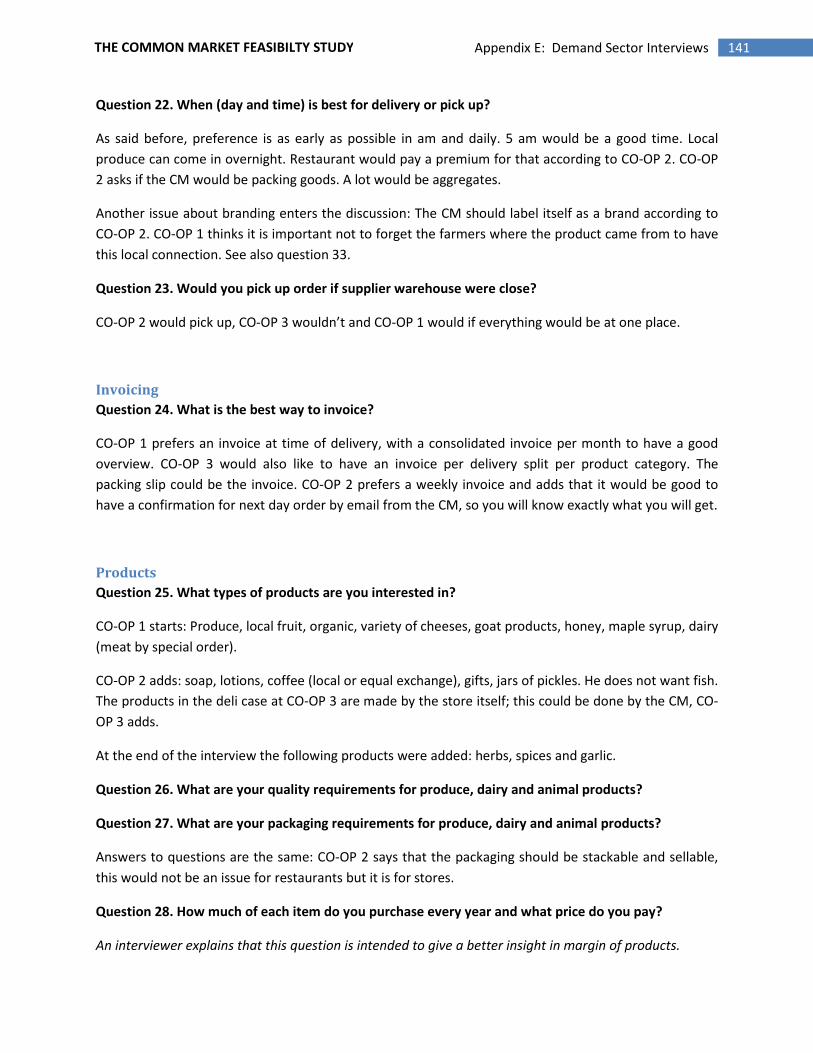
141 Appendix E: Demand Sector Interviews THE COMMON MARKET FEASIBILTY STUDY
Question 22. When (day and time) is best for delivery or pick up?
As said before, preference is as early as possible in am and daily. 5 am would be a good time. Local
produce can come in overnight. Restaurant would pay a premium for that according to CO-OP 2. CO-OP
2 asks if the CM would be packing goods. A lot would be aggregates.
Another issue about branding enters the discussion: The CM should label itself as a brand according to
CO-OP 2. CO-OP 1 thinks it is important not to forget the farmers where the product came from to have
this local connection. See also question 33.
Question 23. Would you pick up order if supplier warehouse were close?
CO-OP 2 would pick up, CO-OP 3 wouldn’t and CO-OP 1 would if everything would be at one place.
Invoicing
Question 24. What is the best way to invoice?
CO-OP 1 prefers an invoice at time of delivery, with a consolidated invoice per month to have a good
overview. CO-OP 3 would also like to have an invoice per delivery split per product category. The
packing slip could be the invoice. CO-OP 2 prefers a weekly invoice and adds that it would be good to
have a confirmation for next day order by email from the CM, so you will know exactly what you will get.
Products
Question 25. What types of products are you interested in?
CO-OP 1 starts: Produce, local fruit, organic, variety of cheeses, goat products, honey, maple syrup, dairy
(meat by special order).
CO-OP 2 adds: soap, lotions, coffee (local or equal exchange), gifts, jars of pickles. He does not want fish.
The products in the deli case at CO-OP 3 are made by the store itself; this could be done by the CM, CO-
OP 3 adds.
At the end of the interview the following products were added: herbs, spices and garlic.
Question 26. What are your quality requirements for produce, dairy and animal products?
Question 27. What are your packaging requirements for produce, dairy and animal products?
Answers to questions are the same: CO-OP 2 says that the packaging should be stackable and sellable,
this would not be an issue for restaurants but it is for stores.
Question 28. How much of each item do you purchase every year and what price do you pay?
An interviewer explains that this question is intended to give a better insight in margin of products.
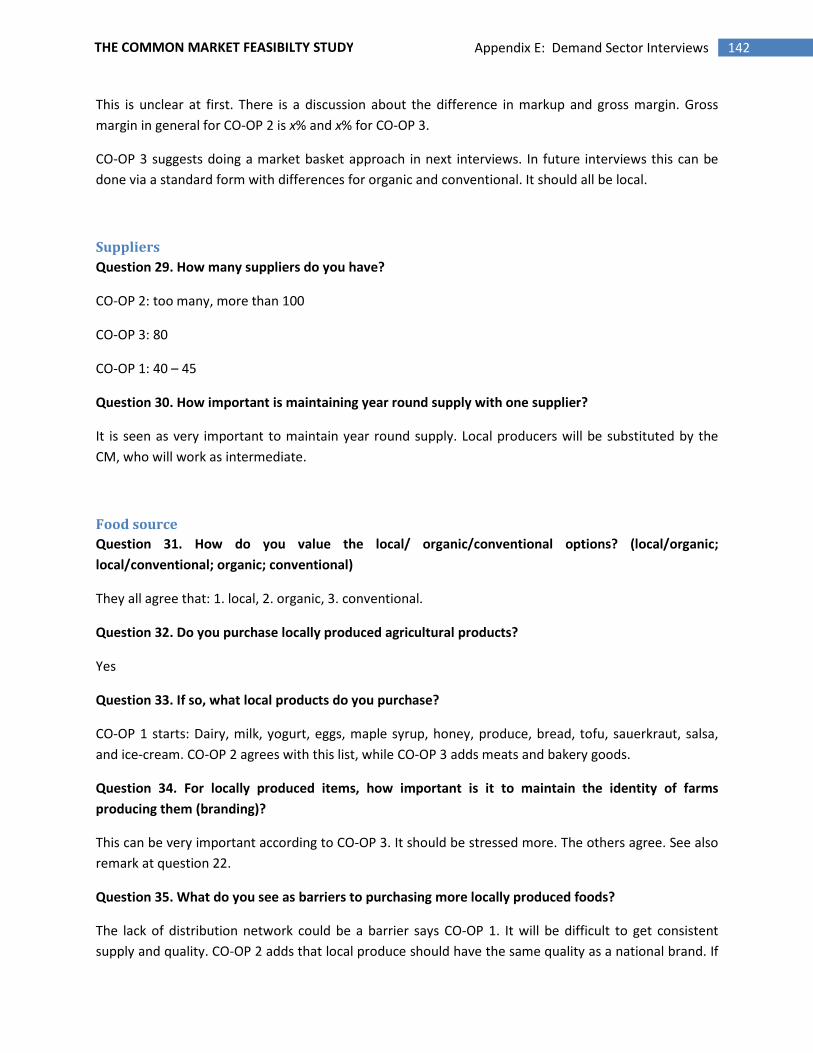
142 Appendix E: Demand Sector Interviews THE COMMON MARKET FEASIBILTY STUDY
This is unclear at first. There is a discussion about the difference in markup and gross margin. Gross
margin in general for CO-OP 2 is x% and x% for CO-OP 3.
CO-OP 3 suggests doing a market basket approach in next interviews. In future interviews this can be
done via a standard form with differences for organic and conventional. It should all be local.
Suppliers
Question 29. How many suppliers do you have?
CO-OP 2: too many, more than 100
CO-OP 3: 80
CO-OP 1: 40 – 45
Question 30. How important is maintaining year round supply with one supplier?
It is seen as very important to maintain year round supply. Local producers will be substituted by the
CM, who will work as intermediate.
Food source
Question 31. How do you value the local/ organic/conventional options? (local/organic;
local/conventional; organic; conventional)
They all agree that: 1. local, 2. organic, 3. conventional.
Question 32. Do you purchase locally produced agricultural products?
Yes
Question 33. If so, what local products do you purchase?
CO-OP 1 starts: Dairy, milk, yogurt, eggs, maple syrup, honey, produce, bread, tofu, sauerkraut, salsa,
and ice-cream. CO-OP 2 agrees with this list, while CO-OP 3 adds meats and bakery goods.
Question 34. For locally produced items, how important is it to maintain the identity of farms
producing them (branding)?
This can be very important according to CO-OP 3. It should be stressed more. The others agree. See also
remark at question 22.
Question 35. What do you see as barriers to purchasing more locally produced foods?
The lack of distribution network could be a barrier says CO-OP 1. It will be difficult to get consistent
supply and quality. CO-OP 2 adds that local produce should have the same quality as a national brand. If
143 Appendix E: Demand Sector Interviews THE COMMON MARKET FEASIBILTY STUDY
there are complaints, the CM should track this. Availability and completeness will be the main issues.
CO-OP 3 sees barriers in the ordering process and the number of people to deal with.
An interviewer: what do you think of the idea of people putting their own order in at the CM website?
That would be great but it should be prepaid. Now it is possible by deposit only. This could be done for
specialty products such as heritage breed meats.
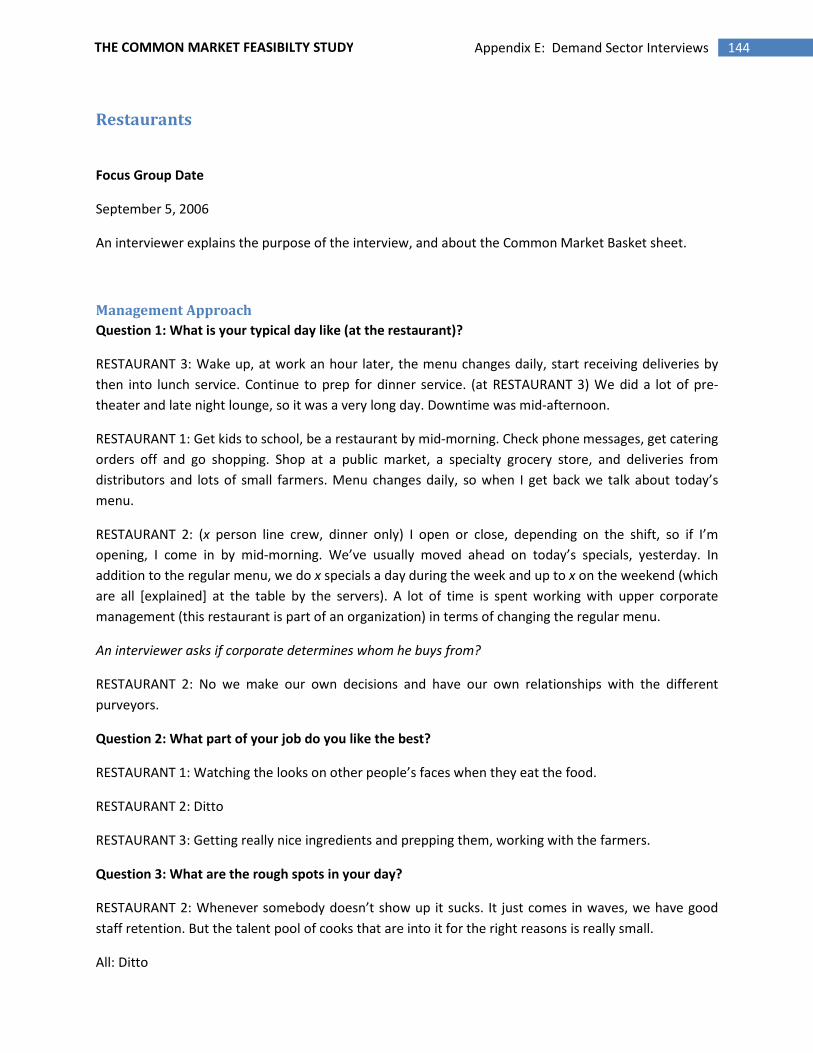
144 Appendix E: Demand Sector Interviews THE COMMON MARKET FEASIBILTY STUDY
Restaurants
Focus Group Date
September 5, 2006
An interviewer explains the purpose of the interview, and about the Common Market Basket sheet.
Management Approach
Question 1: What is your typical day like (at the restaurant)?
RESTAURANT 3: Wake up, at work an hour later, the menu changes daily, start receiving deliveries by
then into lunch service. Continue to prep for dinner service. (at RESTAURANT 3) We did a lot of pre-
theater and late night lounge, so it was a very long day. Downtime was mid-afternoon.
RESTAURANT 1: Get kids to school, be a restaurant by mid-morning. Check phone messages, get catering
orders off and go shopping. Shop at a public market, a specialty grocery store, and deliveries from
distributors and lots of small farmers. Menu changes daily, so when I get back we talk about today’s
menu.
RESTAURANT 2: (x person line crew, dinner only) I open or close, depending on the shift, so if I’m
opening, I come in by mid-morning. We’ve usually moved ahead on today’s specials, yesterday. In
addition to the regular menu, we do x specials a day during the week and up to x on the weekend (which
are all [explained] at the table by the servers). A lot of time is spent working with upper corporate
management (this restaurant is part of an organization) in terms of changing the regular menu.
An interviewer asks if corporate determines whom he buys from?
RESTAURANT 2: No we make our own decisions and have our own relationships with the different
purveyors.
Question 2: What part of your job do you like the best?
RESTAURANT 1: Watching the looks on other people’s faces when they eat the food.
RESTAURANT 2: Ditto
RESTAURANT 3: Getting really nice ingredients and prepping them, working with the farmers.
Question 3: What are the rough spots in your day?
RESTAURANT 2: Whenever somebody doesn’t show up it sucks. It just comes in waves, we have good
staff retention. But the talent pool of cooks that are into it for the right reasons is really small.
All: Ditto
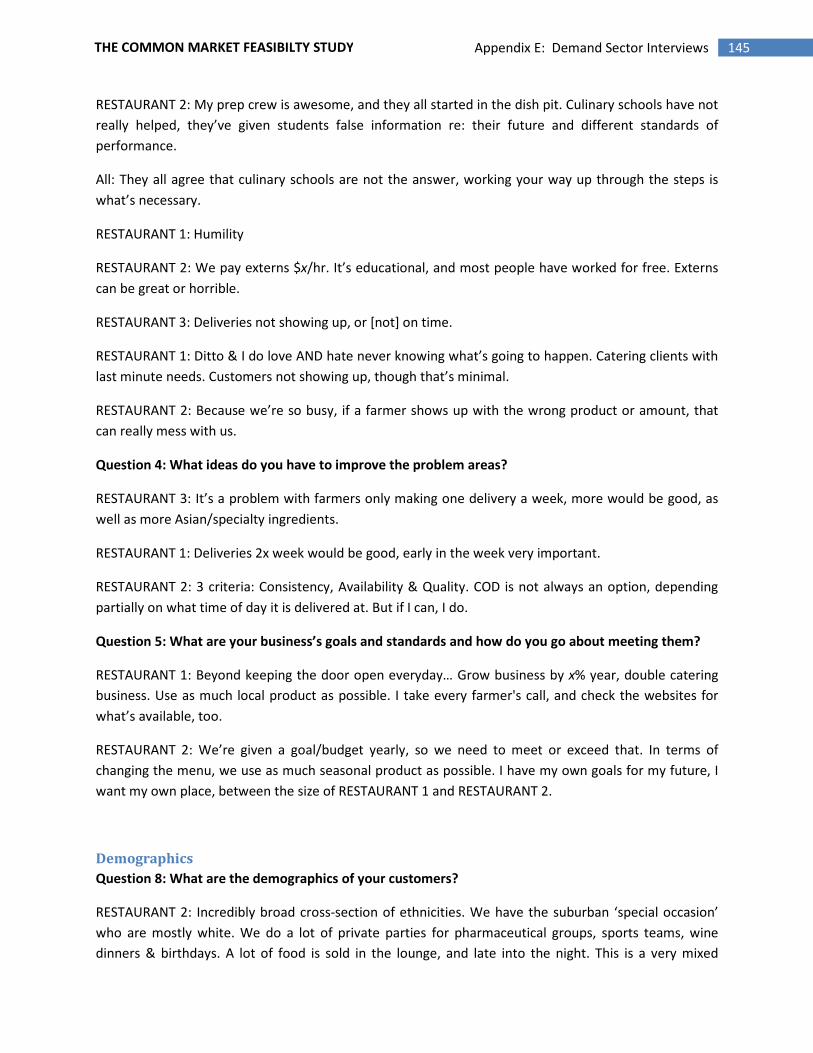
145 Appendix E: Demand Sector Interviews THE COMMON MARKET FEASIBILTY STUDY
RESTAURANT 2: My prep crew is awesome, and they all started in the dish pit. Culinary schools have not
really helped, they’ve given students false information re: their future and different standards of
performance.
All: They all agree that culinary schools are not the answer, working your way up through the steps is
what’s necessary.
RESTAURANT 1: Humility
RESTAURANT 2: We pay externs $x/hr. It’s educational, and most people have worked for free. Externs
can be great or horrible.
RESTAURANT 3: Deliveries not showing up, or [not] on time.
RESTAURANT 1: Ditto & I do love AND hate never knowing what’s going to happen. Catering clients with
last minute needs. Customers not showing up, though that’s minimal.
RESTAURANT 2: Because we’re so busy, if a farmer shows up with the wrong product or amount, that
can really mess with us.
Question 4: What ideas do you have to improve the problem areas?
RESTAURANT 3: It’s a problem with farmers only making one delivery a week, more would be good, as
well as more Asian/specialty ingredients.
RESTAURANT 1: Deliveries 2x week would be good, early in the week very important.
RESTAURANT 2: 3 criteria: Consistency, Availability & Quality. COD is not always an option, depending
partially on what time of day it is delivered at. But if I can, I do.
Question 5: What are your business’s goals and standards and how do you go about meeting them?
RESTAURANT 1: Beyond keeping the door open everyday… Grow business by x% year, double catering
business. Use as much local product as possible. I take every farmer's call, and check the websites for
what’s available, too.
RESTAURANT 2: We’re given a goal/budget yearly, so we need to meet or exceed that. In terms of
changing the menu, we use as much seasonal product as possible. I have my own goals for my future, I
want my own place, between the size of RESTAURANT 1 and RESTAURANT 2.
Demographics
Question 8: What are the demographics of your customers?
RESTAURANT 2: Incredibly broad cross-section of ethnicities. We have the suburban ‘special occasion’
who are mostly white. We do a lot of private parties for pharmaceutical groups, sports teams, wine
dinners & birthdays. A lot of food is sold in the lounge, and late into the night. This is a very mixed
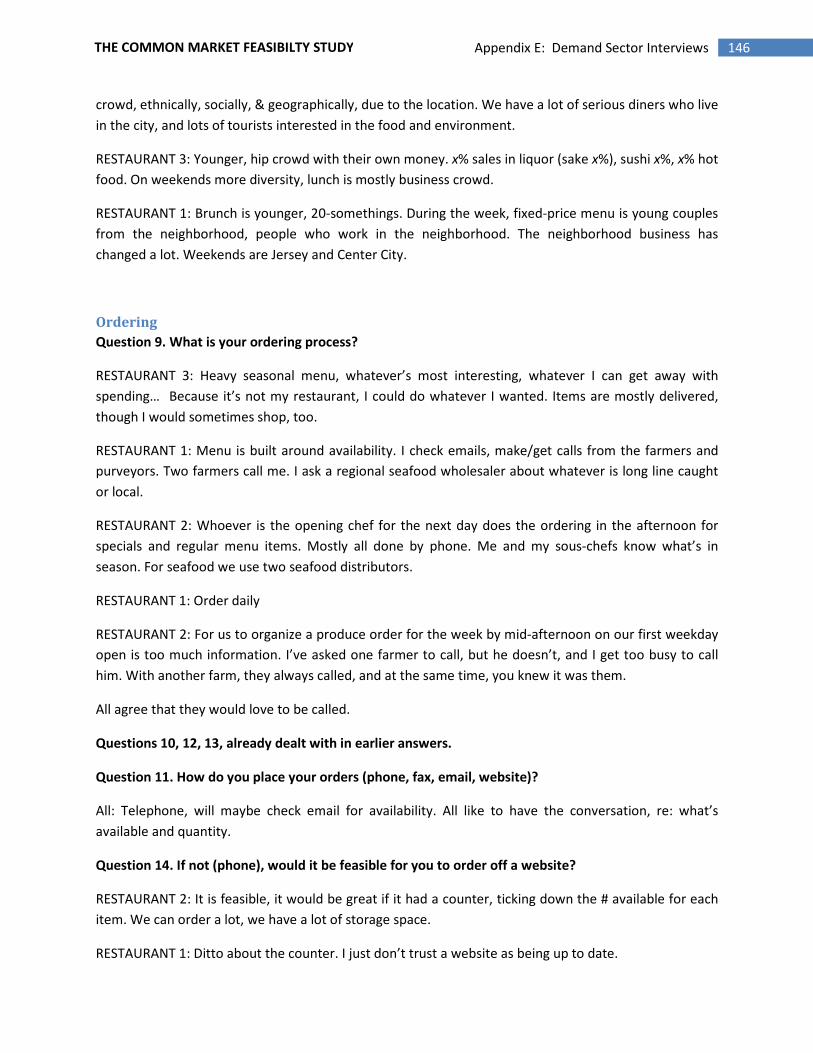
146 Appendix E: Demand Sector Interviews THE COMMON MARKET FEASIBILTY STUDY
crowd, ethnically, socially, & geographically, due to the location. We have a lot of serious diners who live
in the city, and lots of tourists interested in the food and environment.
RESTAURANT 3: Younger, hip crowd with their own money. x% sales in liquor (sake x%), sushi x%, x% hot
food. On weekends more diversity, lunch is mostly business crowd.
RESTAURANT 1: Brunch is younger, 20-somethings. During the week, fixed-price menu is young couples
from the neighborhood, people who work in the neighborhood. The neighborhood business has
changed a lot. Weekends are Jersey and Center City.
Ordering
Question 9. What is your ordering process?
RESTAURANT 3: Heavy seasonal menu, whatever’s most interesting, whatever I can get away with
spending… Because it’s not my restaurant, I could do whatever I wanted. Items are mostly delivered,
though I would sometimes shop, too.
RESTAURANT 1: Menu is built around availability. I check emails, make/get calls from the farmers and
purveyors. Two farmers call me. I ask a regional seafood wholesaler about whatever is long line caught
or local.
RESTAURANT 2: Whoever is the opening chef for the next day does the ordering in the afternoon for
specials and regular menu items. Mostly all done by phone. Me and my sous-chefs know what’s in
season. For seafood we use two seafood distributors.
RESTAURANT 1: Order daily
RESTAURANT 2: For us to organize a produce order for the week by mid-afternoon on our first weekday
open is too much information. I’ve asked one farmer to call, but he doesn’t, and I get too busy to call
him. With another farm, they always called, and at the same time, you knew it was them.
All agree that they would love to be called.
Questions 10, 12, 13, already dealt with in earlier answers.
Question 11. How do you place your orders (phone, fax, email, website)?
All: Telephone, will maybe check email for availability. All like to have the conversation, re: what’s
available and quantity.
Question 14. If not (phone), would it be feasible for you to order off a website?
RESTAURANT 2: It is feasible, it would be great if it had a counter, ticking down the # available for each
item. We can order a lot, we have a lot of storage space.
RESTAURANT 1: Ditto about the counter. I just don’t trust a website as being up to date.
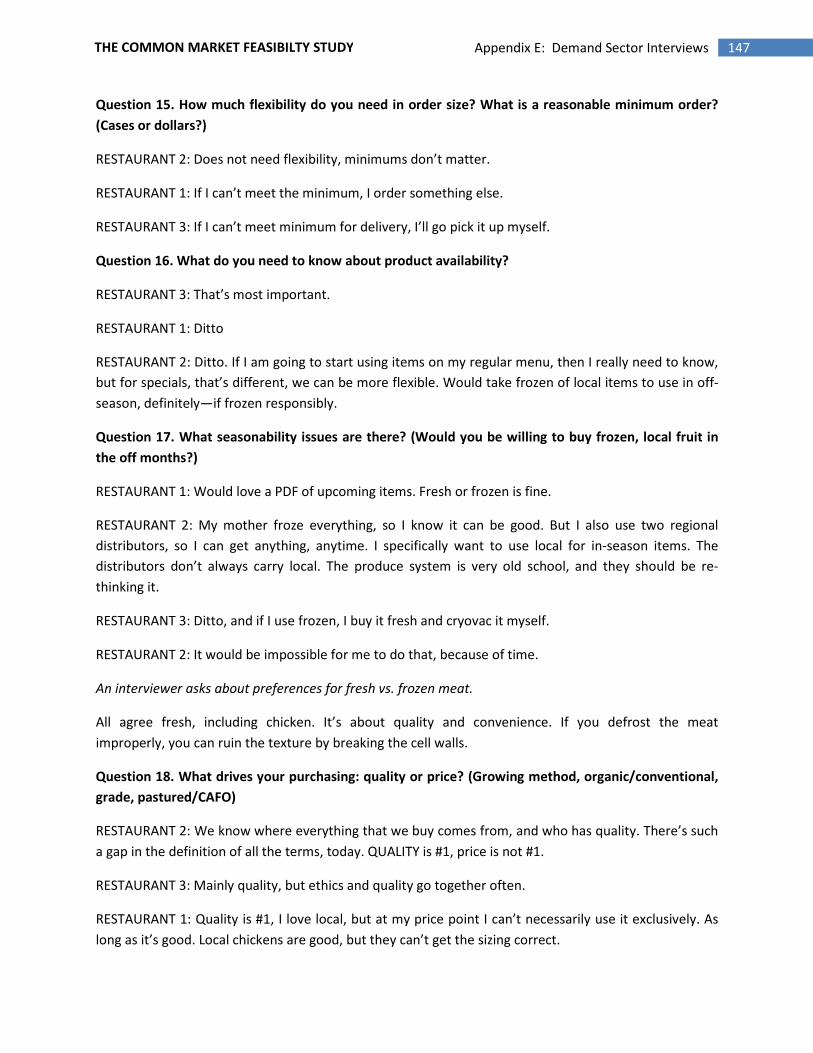
147 Appendix E: Demand Sector Interviews THE COMMON MARKET FEASIBILTY STUDY
Question 15. How much flexibility do you need in order size? What is a reasonable minimum order?
(Cases or dollars?)
RESTAURANT 2: Does not need flexibility, minimums don’t matter.
RESTAURANT 1: If I can’t meet the minimum, I order something else.
RESTAURANT 3: If I can’t meet minimum for delivery, I’ll go pick it up myself.
Question 16. What do you need to know about product availability?
RESTAURANT 3: That’s most important.
RESTAURANT 1: Ditto
RESTAURANT 2: Ditto. If I am going to start using items on my regular menu, then I really need to know,
but for specials, that’s different, we can be more flexible. Would take frozen of local items to use in off-
season, definitely—if frozen responsibly.
Question 17. What seasonability issues are there? (Would you be willing to buy frozen, local fruit in
the off months?)
RESTAURANT 1: Would love a PDF of upcoming items. Fresh or frozen is fine.
RESTAURANT 2: My mother froze everything, so I know it can be good. But I also use two regional
distributors, so I can get anything, anytime. I specifically want to use local for in-season items. The
distributors don’t always carry local. The produce system is very old school, and they should be re-
thinking it.
RESTAURANT 3: Ditto, and if I use frozen, I buy it fresh and cryovac it myself.
RESTAURANT 2: It would be impossible for me to do that, because of time.
An interviewer asks about preferences for fresh vs. frozen meat.
All agree fresh, including chicken. It’s about quality and convenience. If you defrost the meat
improperly, you can ruin the texture by breaking the cell walls.
Question 18. What drives your purchasing: quality or price? (Growing method, organic/conventional,
grade, pastured/CAFO)
RESTAURANT 2: We know where everything that we buy comes from, and who has quality. There’s such
a gap in the definition of all the terms, today. QUALITY is #1, price is not #1.
RESTAURANT 3: Mainly quality, but ethics and quality go together often.
RESTAURANT 1: Quality is #1, I love local, but at my price point I can’t necessarily use it exclusively. As
long as it’s good. Local chickens are good, but they can’t get the sizing correct.
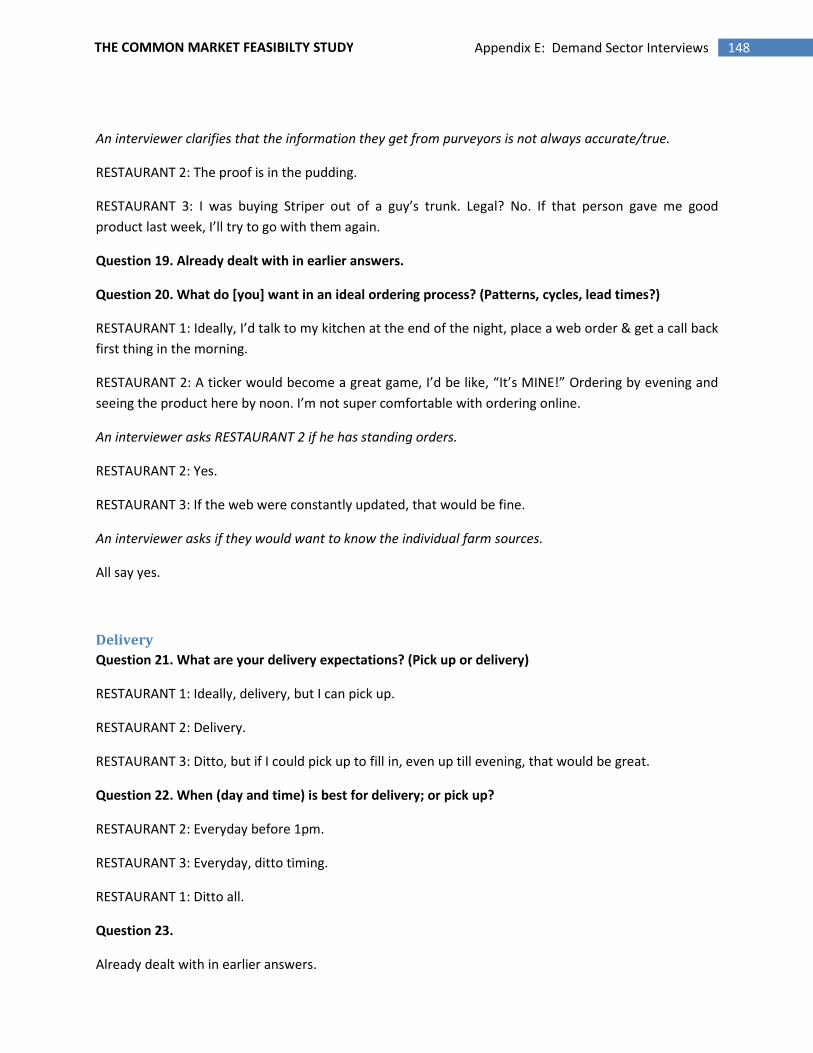
148 Appendix E: Demand Sector Interviews THE COMMON MARKET FEASIBILTY STUDY
An interviewer clarifies that the information they get from purveyors is not always accurate/true.
RESTAURANT 2: The proof is in the pudding.
RESTAURANT 3: I was buying Striper out of a guy’s trunk. Legal? No. If that person gave me good
product last week, I’ll try to go with them again.
Question 19. Already dealt with in earlier answers.
Question 20. What do [you] want in an ideal ordering process? (Patterns, cycles, lead times?)
RESTAURANT 1: Ideally, I’d talk to my kitchen at the end of the night, place a web order & get a call back
first thing in the morning.
RESTAURANT 2: A ticker would become a great game, I’d be like, “It’s MINE!” Ordering by evening and
seeing the product here by noon. I’m not super comfortable with ordering online.
An interviewer asks RESTAURANT 2 if he has standing orders.
RESTAURANT 2: Yes.
RESTAURANT 3: If the web were constantly updated, that would be fine.
An interviewer asks if they would want to know the individual farm sources.
All say yes.
Delivery
Question 21. What are your delivery expectations? (Pick up or delivery)
RESTAURANT 1: Ideally, delivery, but I can pick up.
RESTAURANT 2: Delivery.
RESTAURANT 3: Ditto, but if I could pick up to fill in, even up till evening, that would be great.
Question 22. When (day and time) is best for delivery; or pick up?
RESTAURANT 2: Everyday before 1pm.
RESTAURANT 3: Everyday, ditto timing.
RESTAURANT 1: Ditto all.
Question 23.
Already dealt with in earlier answers.
149 Appendix E: Demand Sector Interviews THE COMMON MARKET FEASIBILTY STUDY
Invoicing
Question 24. What is the best way to invoice? (Consolidated invoicing or a simpler process?)
All agree that an all-in-one bill/invoice is the best.
RESTAURANT 1: Bill w/delivery is fine, staff should know the prices of products so that they respect it.
RESTAURANT 2: Bill with delivery insures prompt payment, and when I can I pay cash on the spot.
RESTAURANT 3: Ditto
An interviewer asks if they would want to see a monthly consolidated statement of their purchases from
the Common Market.
RESTAURANT 1 and RESTAURANT 3 say yes, RESTAURANT 2 says it doesn’t matter; he already gets that
information from his company’s corporate offices.
Products
Question 25.What (other) types of products are you interested in?
All say, Everything!
An interviewer asks what else? Flour, beef, chickens…
RESTAURANT 2: Don’t need anything jarred, but anything local, seasonal & fresh would be great.
RESTAURANT 3: Ditto
An interviewer asks about prepared/value added foods that they might be interested in.
RESTAURANT 1 & RESTAURANT 3: S&C pickles.
Question 26. What are your quality requirements for produce, dairy, and animal products? (USDA
grades; organic vs. conventional; pastured animals vs. CAF products)
RESTAURANT 2: I don’t have ‘requirements,’ and from what I’ve read, all these labels make me
confused. Like “Organic,” I don’t know how to trust any of that on a store shelf, especially.
RESTAURANT 3: Beef, I like pasture-raised, with a grain finish. Chicken, pasture-raised. Or dry-aged beef.
Local produce is better.
RESTAURANT 1: Ditto
Question 27. What are your packaging requirements for produce, dairy and animal products?
RESTAURANT 3: Waterproofed/Waxed boxes…
RESTAURANT 2: Things like potatoes and onions should be pre-rinsed; otherwise they’re super messy.
150 Appendix E: Demand Sector Interviews THE COMMON MARKET FEASIBILTY STUDY
RESTAURANT 3: Micro-greens should be rinsed.
Question 28 is covered in the Common Market Basket; RESTAURANT 1 had some interesting numbers
to add to that.
RESTAURANT 1: I spend $x with various farmers
RESTAURANT 1 & RESTAURANT 3 say they both try to use all local dairy products.
Suppliers
Question 29. How many suppliers do you have?
RESTAURANT 3: 15
RESTAURANT 1: 15
RESTAURANT 2: 10-11
Question 30. How important is maintaining year round supply with one supplier?
RESTAURANT 1: Very important, for the continuity of product and maintaining a good relationship with
my suppliers.
RESTAURANT 2: Consistency is what’s important, so yes, it is very important.
RESTAURANT 3: Ditto
Food Sources
Question 31. In what order do you value the local/organic/
conventional options?
RESTAURANT 2: #1: Local, #2:Conventional, #3 Certified Organic
RESTAURANT 3: Ditto, certification not important.
RESTAURANT 1: Ditto
Question 32. Do you purchase locally produced agricultural products?
Already dealt with in earlier answers, and all say yes.
Question 33. If so, what local products do you purchase?
In addition to their earlier answers, all say they will try anything once.
RESTAURANT 2: Some other things are just superior, i.e., growing climate, strain, and soil.
151 Appendix E: Demand Sector Interviews THE COMMON MARKET FEASIBILTY STUDY
Question 34. For locally produced items, how important is it to maintain the identity of farms
producing them (branding)?
RESTAURANT 2: Absolutely. Especially to get my service staff excited about it. They then translate their
enthusiasm to the customer. Our customers don’t necessarily know how involved we are in local buying
before they get here, so it becomes just another level of service and quality that we can give them.
RESTAURANT 3: Ditto
RESTAURANT 1: If they’re going all the way to my restaurant, they’re adventurous and want to know all
about it.
Question 35. What do you see as barriers to purchasing more locally produced foods?
RESTAURANT 3: Everyday delivery would help; prices could maybe be better, more stream-lined.
RESTAURANT 2: If the convenience was there for the buyer, maybe they’d order more, and then the
trucks would be fuller in general, and want/need to deliver more often.
RESTAURANT 1: There’s no barrier for me.
RESTAURANT 2: It’s almost purely convenience for me. I may spend $x a year on ingredients, we gross $x
million a year here. Another restaurant in the organization (where he was formerly a sous-chef) is a $x
million a year gross restaurant, and they would definitely buy, especially if there were more Asian
ingredients available. Most of my peers in the organization would be very interested. I was up in NYC
visiting a chef friend who buys 2x a week at the Greenmarket, which is very convenient for him, but not
for me. But I learned that a lot of those farmers drive straight past Philly, and don’t stop. Maybe this
could make it worthwhile for them to deliver to the Common Market.
152 Appendix E: Demand Sector Interviews THE COMMON MARKET FEASIBILTY STUDY
Estimated Revenues from Wholesale Purchasers
Methodology:
To understand the expected revenues generated by the Common Market Project, interviews of potential
buyers were conducted. Emphasis was placed on institutional buyers, though restaurants and a retailer
were interviewed as well. By understanding how much these buyers purchase, the Common Market can
estimate the potential revenues associated with local food distribution.
Since the purchasing volume of institutions varies vastly from the other buyers interviewed, interview
results are most clearly understood when analyzed separately. Therefore, this report features two sets
of results 1) restaurants/retailers and 2) institutions.
Interviewees:
Interviewees were selected based on local food buying history or interest in local food purchasing once
a more effective distribution system is in place. The Fair Food Project, a program of the White Dog
Community Enterprises, supplied interviewees based on their experience consulting with buyers to
assist them in local food purchasing. The following businesses were interviewed, followed by brief
descriptions of their businesses. Interview transcripts are available in Appendices A and B.
1. COFFEE SHOP 1
Operating two locations in Philadelphia, COFFEE SHOP 1 purchases a large majority of their
product from local farmers or farm cooperatives. It is well known in Philadelphia as not only a
coffeehouse, but also an option for light breakfast and lunch. The data in this report is for their
larger location.
2. RESTAURANT 4
RESTAURANT 4, opened for over twenty years, is widely known in Philadelphia for their local
food purchasing. Former chefs now own several of their own restaurants around Philadelphia
continuing to buy product directly from area farmers.
3. CO-OP 1
CO-OP 1 is a member-owned food cooperative in Philadelphia. The Co-op has a strong local
buying commitment, which includes produce, dairy, and several value-added products.
4. RESTAURANT 5
RESTAURANT 5, a bar and restaurant for a few years, purchases a large majority of their product
from local farmers directly.
5. INSTITUTION 4
INSTITUTION 4 is a preparatory school serving over 1000 meals a day during the school year.
Located 40 miles from Philadelphia, the school’s dining services are contracted to an outside
food service company.
INSTITUTION 5
INSTITUTION 5 is boarding school serving hundreds of students in Bucks County Pennsylvania.
Located 35 miles from Philadelphia, the school's dining services are operated by a national food
service company.

153 Appendix E: Demand Sector Interviews THE COMMON MARKET FEASIBILTY STUDY
6. INSTITUTION 6
INSTITUTION 6 is a retirement community located in Chester County, PA. Serving an average of
700 meals daily, the dining services are self-operated.
7. INSTITUTION 7
Located 11 miles from Philadelphia, INSTITUTION 7 is a college with an enrollment of
approximately 1500 students. The college’s dining services are self-operated.
Interview Questions:
1. How much of the following products do you order per week?
Produce:
Meat:
Milk:
Cheese and Other Dairy:
Eggs (restaurants/retailers only):
Total of these five product groups:
2. What percentage of this product is from local farm sources?
Produce:
Meat:
Milk:
Cheese and Other Dairy:
3. Do these quantities vary seasonally?
4. What terms of payment do your distributors operate on?
5. How often are the following products delivered each week?
Produce:
Meat:
Milk:
Cheese and Other Dairy:
6. What is the ideal number of days you would like your distributors to deliver?
7. Would the amount you order change if deliveries were added or subtracted?
8. What factors have created the delivery schedule you operate on?
Quantitative Results: Restaurants/Retailers
1. How much of the following products do you order per week?
Averages totaled from all four respondents, with exception to meat, since one respondent does
not sell any meat
Produce: $1375
Meat: $1250
Milk: $389
Cheese and Other Dairy: $206
Eggs: $160
Total of these four product groups: $3380
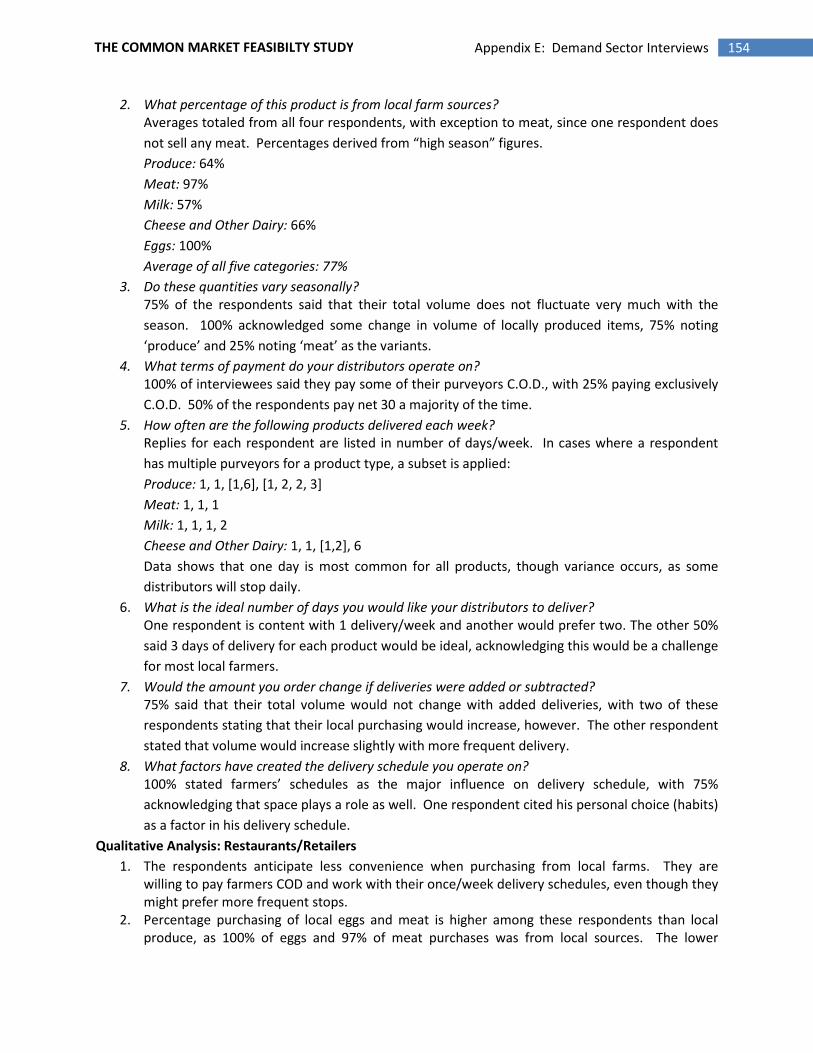
154 Appendix E: Demand Sector Interviews THE COMMON MARKET FEASIBILTY STUDY
2. What percentage of this product is from local farm sources?
Averages totaled from all four respondents, with exception to meat, since one respondent does
not sell any meat. Percentages derived from “high season” figures.
Produce: 64%
Meat: 97%
Milk: 57%
Cheese and Other Dairy: 66%
Eggs: 100%
Average of all five categories: 77%
3. Do these quantities vary seasonally?
75% of the respondents said that their total volume does not fluctuate very much with the
season. 100% acknowledged some change in volume of locally produced items, 75% noting
‘produce’ and 25% noting ‘meat’ as the variants.
4. What terms of payment do your distributors operate on?
100% of interviewees said they pay some of their purveyors C.O.D., with 25% paying exclusively
C.O.D. 50% of the respondents pay net 30 a majority of the time.
5. How often are the following products delivered each week?
Replies for each respondent are listed in number of days/week. In cases where a respondent
has multiple purveyors for a product type, a subset is applied:
Produce: 1, 1, [1,6], [1, 2, 2, 3]
Meat: 1, 1, 1
Milk: 1, 1, 1, 2
Cheese and Other Dairy: 1, 1, [1,2], 6
Data shows that one day is most common for all products, though variance occurs, as some
distributors will stop daily.
6. What is the ideal number of days you would like your distributors to deliver?
One respondent is content with 1 delivery/week and another would prefer two. The other 50%
said 3 days of delivery for each product would be ideal, acknowledging this would be a challenge
for most local farmers.
7. Would the amount you order change if deliveries were added or subtracted?
75% said that their total volume would not change with added deliveries, with two of these
respondents stating that their local purchasing would increase, however. The other respondent
stated that volume would increase slightly with more frequent delivery.
8. What factors have created the delivery schedule you operate on?
100% stated farmers’ schedules as the major influence on delivery schedule, with 75%
acknowledging that space plays a role as well. One respondent cited his personal choice (habits)
as a factor in his delivery schedule.
Qualitative Analysis: Restaurants/Retailers
1. The respondents anticipate less convenience when purchasing from local farms. They are
willing to pay farmers COD and work with their once/week delivery schedules, even though they
might prefer more frequent stops.
2. Percentage purchasing of local eggs and meat is higher among these respondents than local
produce, as 100% of eggs and 97% of meat purchases was from local sources. The lower
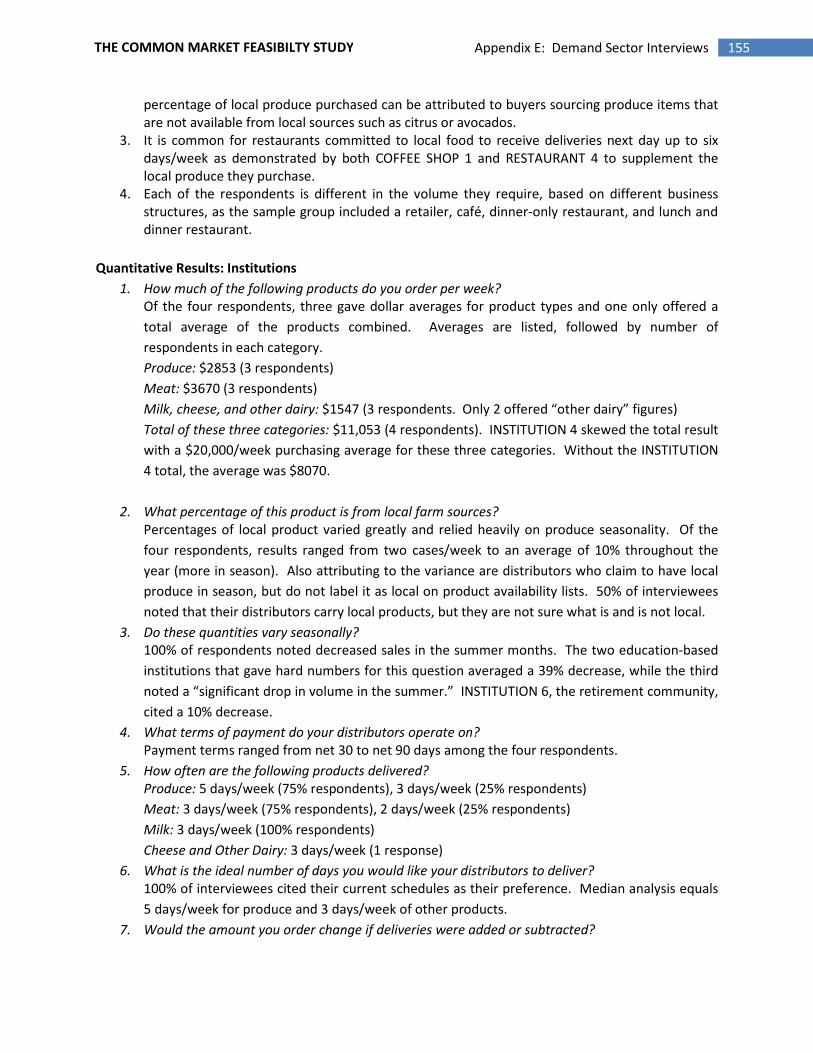
155 Appendix E: Demand Sector Interviews THE COMMON MARKET FEASIBILTY STUDY
percentage of local produce purchased can be attributed to buyers sourcing produce items that
are not available from local sources such as citrus or avocados.
3. It is common for restaurants committed to local food to receive deliveries next day up to six
days/week as demonstrated by both COFFEE SHOP 1 and RESTAURANT 4 to supplement the
local produce they purchase.
4. Each of the respondents is different in the volume they require, based on different business
structures, as the sample group included a retailer, café, dinner-only restaurant, and lunch and
dinner restaurant.
Quantitative Results: Institutions
1. How much of the following products do you order per week?
Of the four respondents, three gave dollar averages for product types and one only offered a
total average of the products combined. Averages are listed, followed by number of
respondents in each category.
Produce: $2853 (3 respondents)
Meat: $3670 (3 respondents)
Milk, cheese, and other dairy: $1547 (3 respondents. Only 2 offered “other dairy” figures)
Total of these three categories: $11,053 (4 respondents). INSTITUTION 4 skewed the total result
with a $20,000/week purchasing average for these three categories. Without the INSTITUTION
4 total, the average was $8070.
2. What percentage of this product is from local farm sources?
Percentages of local product varied greatly and relied heavily on produce seasonality. Of the
four respondents, results ranged from two cases/week to an average of 10% throughout the
year (more in season). Also attributing to the variance are distributors who claim to have local
produce in season, but do not label it as local on product availability lists. 50% of interviewees
noted that their distributors carry local products, but they are not sure what is and is not local.
3. Do these quantities vary seasonally?
100% of respondents noted decreased sales in the summer months. The two education-based
institutions that gave hard numbers for this question averaged a 39% decrease, while the third
noted a “significant drop in volume in the summer.” INSTITUTION 6, the retirement community,
cited a 10% decrease.
4. What terms of payment do your distributors operate on?
Payment terms ranged from net 30 to net 90 days among the four respondents.
5. How often are the following products delivered?
Produce: 5 days/week (75% respondents), 3 days/week (25% respondents)
Meat: 3 days/week (75% respondents), 2 days/week (25% respondents)
Milk: 3 days/week (100% respondents)
Cheese and Other Dairy: 3 days/week (1 response)
6. What is the ideal number of days you would like your distributors to deliver?
100% of interviewees cited their current schedules as their preference. Median analysis equals
5 days/week for produce and 3 days/week of other products.
7. Would the amount you order change if deliveries were added or subtracted?
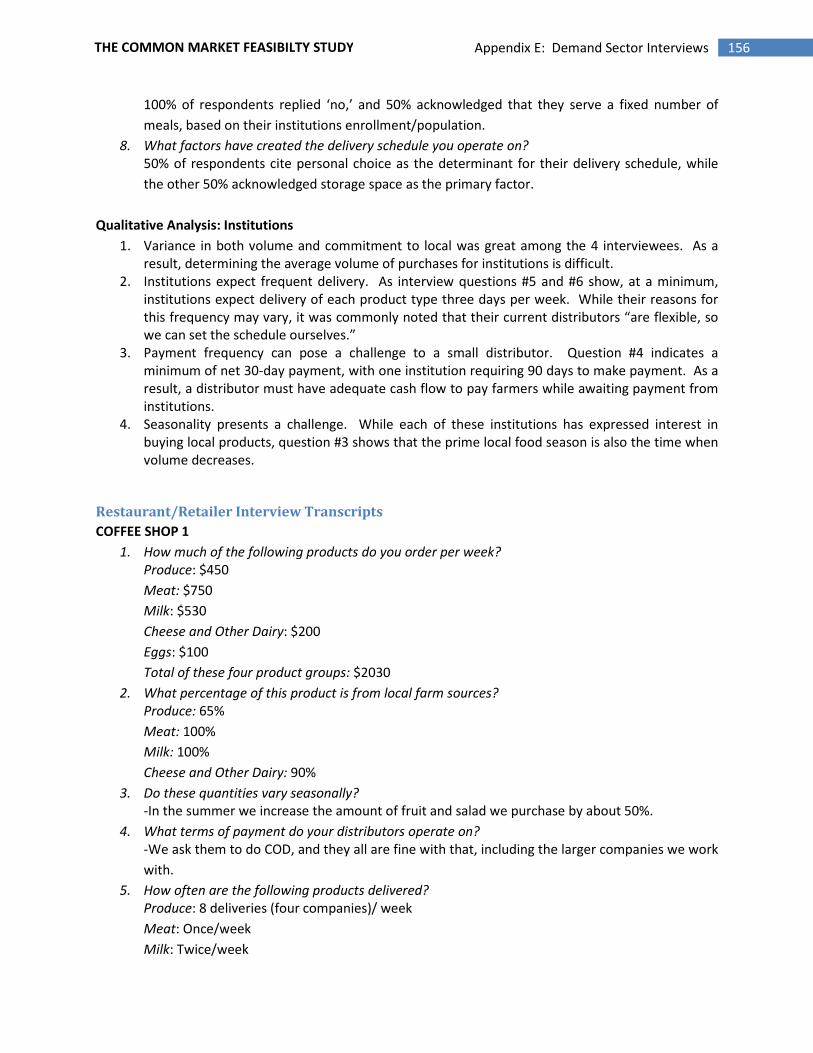
156 Appendix E: Demand Sector Interviews THE COMMON MARKET FEASIBILTY STUDY
100% of respondents replied ‘no,’ and 50% acknowledged that they serve a fixed number of
meals, based on their institutions enrollment/population.
8. What factors have created the delivery schedule you operate on?
50% of respondents cite personal choice as the determinant for their delivery schedule, while
the other 50% acknowledged storage space as the primary factor.
Qualitative Analysis: Institutions
1. Variance in both volume and commitment to local was great among the 4 interviewees. As a
result, determining the average volume of purchases for institutions is difficult.
2. Institutions expect frequent delivery. As interview questions #5 and #6 show, at a minimum,
institutions expect delivery of each product type three days per week. While their reasons for
this frequency may vary, it was commonly noted that their current distributors “are flexible, so
we can set the schedule ourselves.”
3. Payment frequency can pose a challenge to a small distributor. Question #4 indicates a
minimum of net 30-day payment, with one institution requiring 90 days to make payment. As a
result, a distributor must have adequate cash flow to pay farmers while awaiting payment from
institutions.
4. Seasonality presents a challenge. While each of these institutions has expressed interest in
buying local products, question #3 shows that the prime local food season is also the time when
volume decreases.
Restaurant/Retailer Interview Transcripts
COFFEE SHOP 1
1. How much of the following products do you order per week?
Produce: $450
Meat: $750
Milk: $530
Cheese and Other Dairy: $200
Eggs: $100
Total of these four product groups: $2030
2. What percentage of this product is from local farm sources?
Produce: 65%
Meat: 100%
Milk: 100%
Cheese and Other Dairy: 90%
3. Do these quantities vary seasonally?
-In the summer we increase the amount of fruit and salad we purchase by about 50%.
4. What terms of payment do your distributors operate on?
-We ask them to do COD, and they all are fine with that, including the larger companies we work
with.
5. How often are the following products delivered?
Produce: 8 deliveries (four companies)/ week
Meat: Once/week
Milk: Twice/week
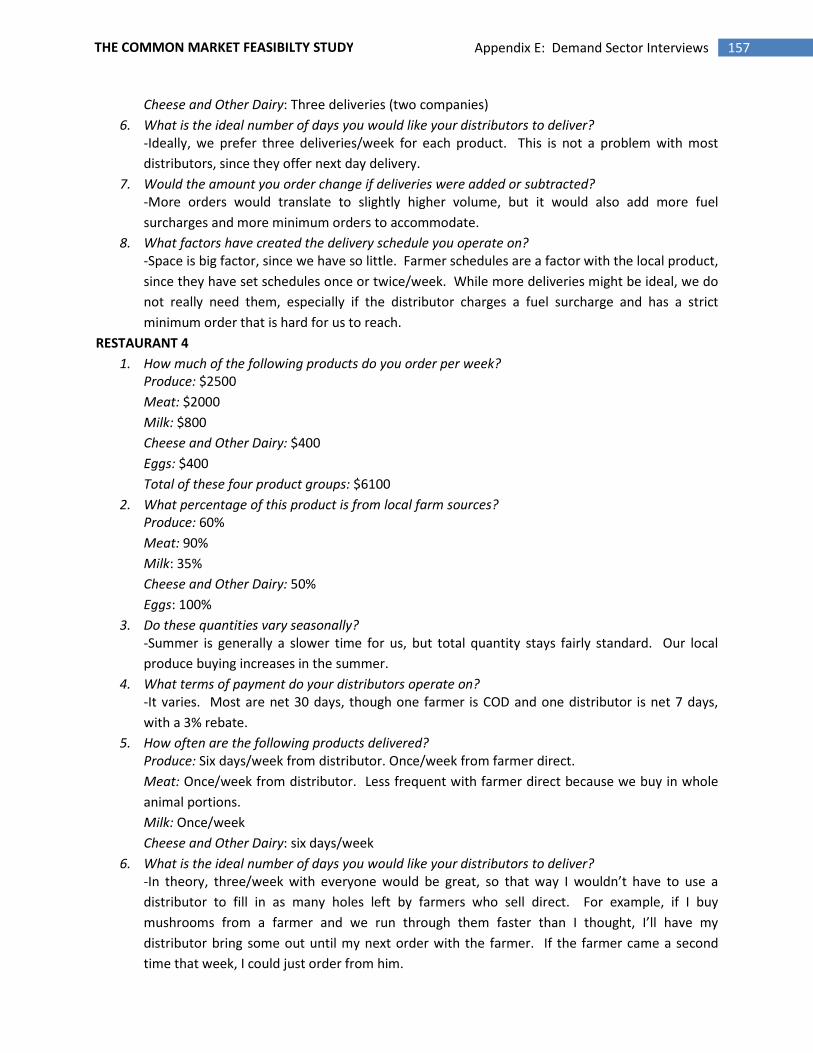
157 Appendix E: Demand Sector Interviews THE COMMON MARKET FEASIBILTY STUDY
Cheese and Other Dairy: Three deliveries (two companies)
6. What is the ideal number of days you would like your distributors to deliver?
-Ideally, we prefer three deliveries/week for each product. This is not a problem with most
distributors, since they offer next day delivery.
7. Would the amount you order change if deliveries were added or subtracted?
-More orders would translate to slightly higher volume, but it would also add more fuel
surcharges and more minimum orders to accommodate.
8. What factors have created the delivery schedule you operate on?
-Space is big factor, since we have so little. Farmer schedules are a factor with the local product,
since they have set schedules once or twice/week. While more deliveries might be ideal, we do
not really need them, especially if the distributor charges a fuel surcharge and has a strict
minimum order that is hard for us to reach.
RESTAURANT 4
1. How much of the following products do you order per week?
Produce: $2500
Meat: $2000
Milk: $800
Cheese and Other Dairy: $400
Eggs: $400
Total of these four product groups: $6100
2. What percentage of this product is from local farm sources?
Produce: 60%
Meat: 90%
Milk: 35%
Cheese and Other Dairy: 50%
Eggs: 100%
3. Do these quantities vary seasonally?
-Summer is generally a slower time for us, but total quantity stays fairly standard. Our local
produce buying increases in the summer.
4. What terms of payment do your distributors operate on?
-It varies. Most are net 30 days, though one farmer is COD and one distributor is net 7 days,
with a 3% rebate.
5. How often are the following products delivered?
Produce: Six days/week from distributor. Once/week from farmer direct.
Meat: Once/week from distributor. Less frequent with farmer direct because we buy in whole
animal portions.
Milk: Once/week
Cheese and Other Dairy: six days/week
6. What is the ideal number of days you would like your distributors to deliver?
-In theory, three/week with everyone would be great, so that way I wouldn’t have to use a
distributor to fill in as many holes left by farmers who sell direct. For example, if I buy
mushrooms from a farmer and we run through them faster than I thought, I’ll have my
distributor bring some out until my next order with the farmer. If the farmer came a second
time that week, I could just order from him.
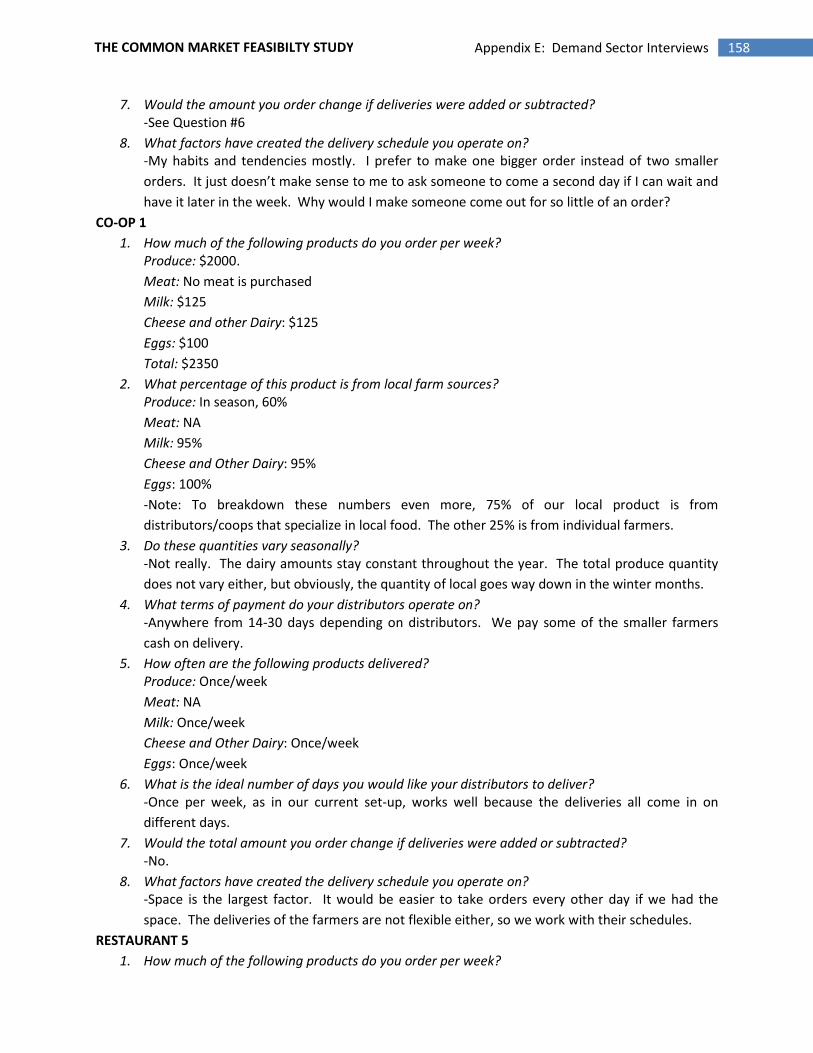
158 Appendix E: Demand Sector Interviews THE COMMON MARKET FEASIBILTY STUDY
7. Would the amount you order change if deliveries were added or subtracted?
-See Question #6
8. What factors have created the delivery schedule you operate on?
-My habits and tendencies mostly. I prefer to make one bigger order instead of two smaller
orders. It just doesn’t make sense to me to ask someone to come a second day if I can wait and
have it later in the week. Why would I make someone come out for so little of an order?
CO-OP 1
1. How much of the following products do you order per week?
Produce: $2000.
Meat: No meat is purchased
Milk: $125
Cheese and other Dairy: $125
Eggs: $100
Total: $2350
2. What percentage of this product is from local farm sources?
Produce: In season, 60%
Meat: NA
Milk: 95%
Cheese and Other Dairy: 95%
Eggs: 100%
-Note: To breakdown these numbers even more, 75% of our local product is from
distributors/coops that specialize in local food. The other 25% is from individual farmers.
3. Do these quantities vary seasonally?
-Not really. The dairy amounts stay constant throughout the year. The total produce quantity
does not vary either, but obviously, the quantity of local goes way down in the winter months.
4. What terms of payment do your distributors operate on?
-Anywhere from 14-30 days depending on distributors. We pay some of the smaller farmers
cash on delivery.
5. How often are the following products delivered?
Produce: Once/week
Meat: NA
Milk: Once/week
Cheese and Other Dairy: Once/week
Eggs: Once/week
6. What is the ideal number of days you would like your distributors to deliver?
-Once per week, as in our current set-up, works well because the deliveries all come in on
different days.
7. Would the total amount you order change if deliveries were added or subtracted?
-No.
8. What factors have created the delivery schedule you operate on?
-Space is the largest factor. It would be easier to take orders every other day if we had the
space. The deliveries of the farmers are not flexible either, so we work with their schedules.
RESTAURANT 5
1. How much of the following products do you order per week?
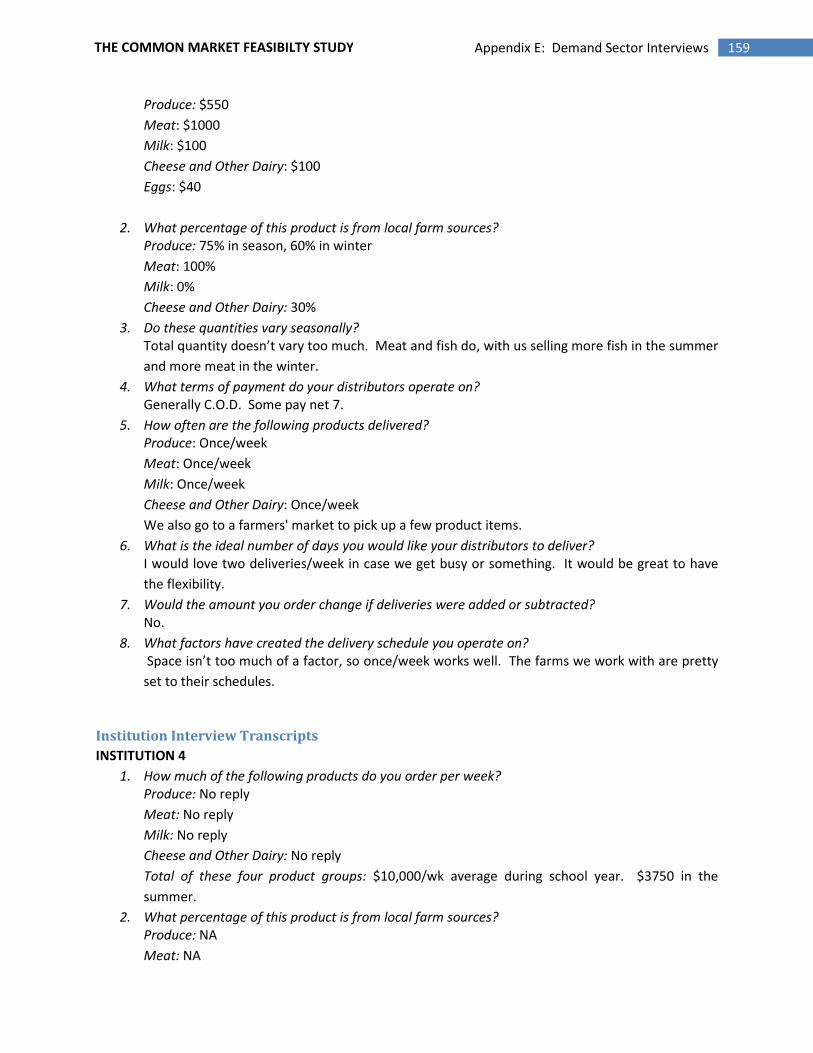
159 Appendix E: Demand Sector Interviews THE COMMON MARKET FEASIBILTY STUDY
Produce: $550
Meat: $1000
Milk: $100
Cheese and Other Dairy: $100
Eggs: $40
2. What percentage of this product is from local farm sources?
Produce: 75% in season, 60% in winter
Meat: 100%
Milk: 0%
Cheese and Other Dairy: 30%
3. Do these quantities vary seasonally?
Total quantity doesn’t vary too much. Meat and fish do, with us selling more fish in the summer
and more meat in the winter.
4. What terms of payment do your distributors operate on?
Generally C.O.D. Some pay net 7.
5. How often are the following products delivered?
Produce: Once/week
Meat: Once/week
Milk: Once/week
Cheese and Other Dairy: Once/week
We also go to a farmers' market to pick up a few product items.
6. What is the ideal number of days you would like your distributors to deliver?
I would love two deliveries/week in case we get busy or something. It would be great to have
the flexibility.
7. Would the amount you order change if deliveries were added or subtracted?
No.
8. What factors have created the delivery schedule you operate on?
Space isn’t too much of a factor, so once/week works well. The farms we work with are pretty
set to their schedules.
Institution Interview Transcripts
INSTITUTION 4
1. How much of the following products do you order per week?
Produce: No reply
Meat: No reply
Milk: No reply
Cheese and Other Dairy: No reply
Total of these four product groups: $10,000/wk average during school year. $3750 in the
summer.
2. What percentage of this product is from local farm sources?
Produce: NA
Meat: NA
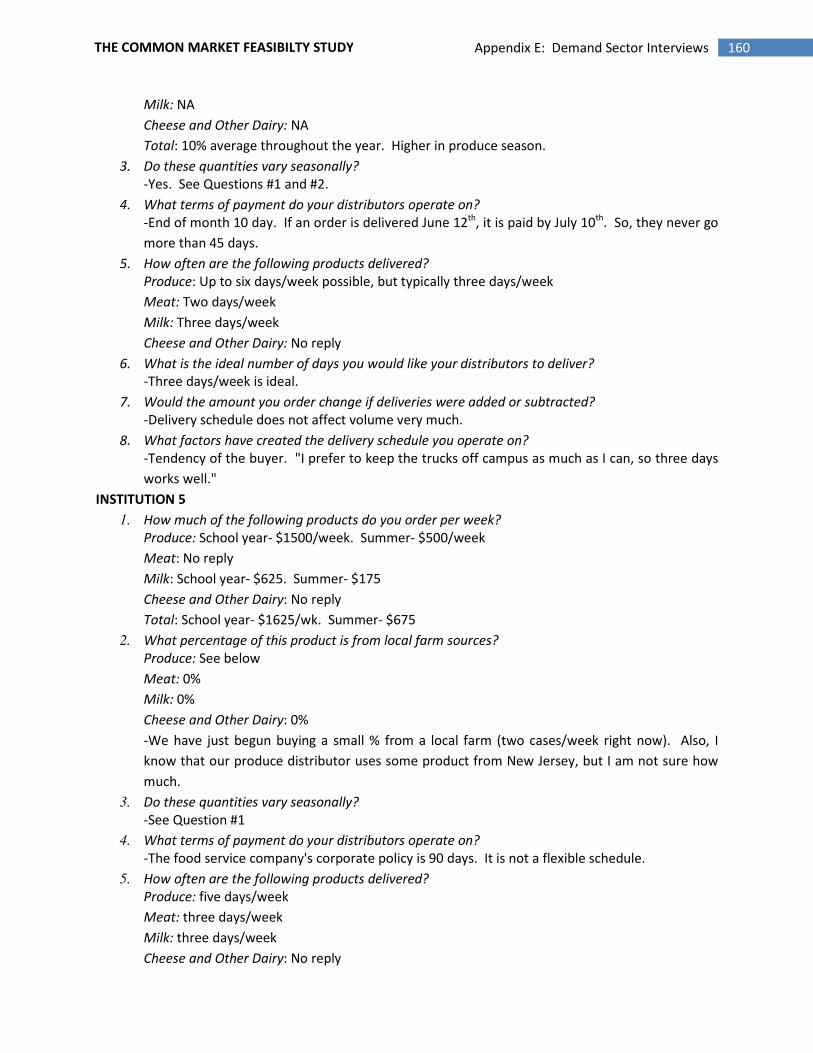
160 Appendix E: Demand Sector Interviews THE COMMON MARKET FEASIBILTY STUDY
Milk: NA
Cheese and Other Dairy: NA
Total: 10% average throughout the year. Higher in produce season.
3. Do these quantities vary seasonally?
-Yes. See Questions #1 and #2.
4. What terms of payment do your distributors operate on?
-End of month 10 day. If an order is delivered June 12th, it is paid by July 10th. So, they never go
more than 45 days.
5. How often are the following products delivered?
Produce: Up to six days/week possible, but typically three days/week
Meat: Two days/week
Milk: Three days/week
Cheese and Other Dairy: No reply
6. What is the ideal number of days you would like your distributors to deliver?
-Three days/week is ideal.
7. Would the amount you order change if deliveries were added or subtracted?
-Delivery schedule does not affect volume very much.
8. What factors have created the delivery schedule you operate on?
-Tendency of the buyer. "I prefer to keep the trucks off campus as much as I can, so three days
works well."
INSTITUTION 5
1. How much of the following products do you order per week?
Produce: School year- $1500/week. Summer- $500/week
Meat: No reply
Milk: School year- $625. Summer- $175
Cheese and Other Dairy: No reply
Total: School year- $1625/wk. Summer- $675
2. What percentage of this product is from local farm sources?
Produce: See below
Meat: 0%
Milk: 0%
Cheese and Other Dairy: 0%
-We have just begun buying a small % from a local farm (two cases/week right now). Also, I
know that our produce distributor uses some product from New Jersey, but I am not sure how
much.
3. Do these quantities vary seasonally?
-See Question #1
4. What terms of payment do your distributors operate on?
-The food service company's corporate policy is 90 days. It is not a flexible schedule.
5. How often are the following products delivered?
Produce: five days/week
Meat: three days/week
Milk: three days/week
Cheese and Other Dairy: No reply
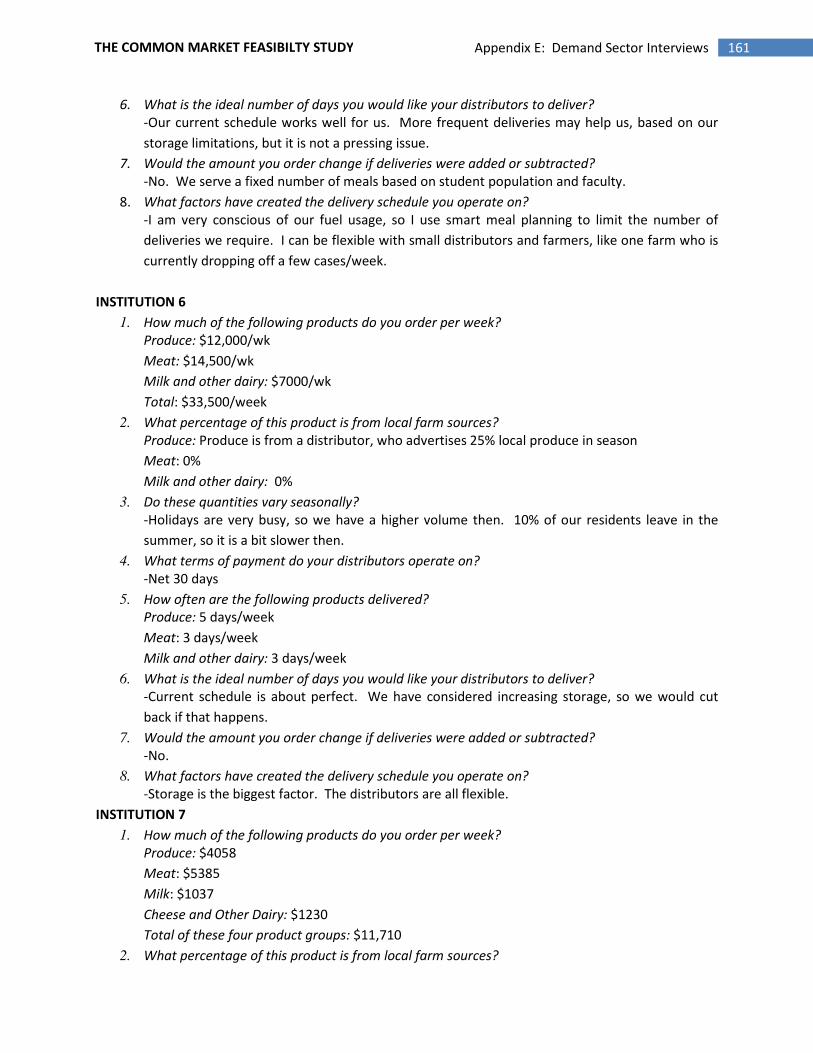
161 Appendix E: Demand Sector Interviews THE COMMON MARKET FEASIBILTY STUDY
6. What is the ideal number of days you would like your distributors to deliver?
-Our current schedule works well for us. More frequent deliveries may help us, based on our
storage limitations, but it is not a pressing issue.
7. Would the amount you order change if deliveries were added or subtracted?
-No. We serve a fixed number of meals based on student population and faculty.
8. What factors have created the delivery schedule you operate on?
-I am very conscious of our fuel usage, so I use smart meal planning to limit the number of
deliveries we require. I can be flexible with small distributors and farmers, like one farm who is
currently dropping off a few cases/week.
INSTITUTION 6
1. How much of the following products do you order per week?
Produce: $12,000/wk
Meat: $14,500/wk
Milk and other dairy: $7000/wk
Total: $33,500/week
2. What percentage of this product is from local farm sources?
Produce: Produce is from a distributor, who advertises 25% local produce in season
Meat: 0%
Milk and other dairy: 0%
3. Do these quantities vary seasonally?
-Holidays are very busy, so we have a higher volume then. 10% of our residents leave in the
summer, so it is a bit slower then.
4. What terms of payment do your distributors operate on?
-Net 30 days
5. How often are the following products delivered?
Produce: 5 days/week
Meat: 3 days/week
Milk and other dairy: 3 days/week
6. What is the ideal number of days you would like your distributors to deliver?
-Current schedule is about perfect. We have considered increasing storage, so we would cut
back if that happens.
7. Would the amount you order change if deliveries were added or subtracted?
-No.
8. What factors have created the delivery schedule you operate on?
-Storage is the biggest factor. The distributors are all flexible.
INSTITUTION 7
1. How much of the following products do you order per week?
Produce: $4058
Meat: $5385
Milk: $1037
Cheese and Other Dairy: $1230
Total of these four product groups: $11,710
2. What percentage of this product is from local farm sources?
162 Appendix E: Demand Sector Interviews THE COMMON MARKET FEASIBILTY STUDY
Produce: 3%
Meat: 0%
Milk: 0%
Cheese and Other Dairy: 0%
3. Do these quantities vary seasonally?
-Significant drop in volume in the summer
4. What terms of payment do your distributors operate on?
-Net 30 days
5. How often are the following products delivered?
Produce: five days/week
Meat: three/week
Milk: three/week
Cheese and Other Dairy: three/week
6. What is the ideal number of days you would like your distributors to deliver?
-Current schedule is our preference
7. Would the amount you order change if deliveries were added or subtracted?
-No. Fixed number of meals, so volume stays constant
8. What factors have created the delivery schedule you operate on?
-Space is a small factor. Our distributors are all very flexible, so we can set the schedule
ourselves.
163 Appendix F: Supply Side Interviews THE COMMON MARKET FEASIBILTY STUDY
Appendix F: Supply Side Interviews
Processed Dairy
Focus Group Date
March 27, 2007
General Information
Question 1. How long have you been farming?
Question 2. Where is your farm located?
Question 3. Is farming your full-time (or primary) occupation?
Question 4. Briefly describe your farming operation
Question 5. How much land do you farm?
Question 6. Is your farm currently operating at full capacity?
Question 7. Do you have plans to expand (or contract) your farming operations in the near future?
DAIRY 2: I am an n generation farmer. We’ve had a family farm and been located in County 3 for many
years. We milk registered jersey dairy cows. I came home to farm and started making raw milk aged
cheeses. We added pasteurized and include yogurt and fresh cheeses like ricotta. We have a
manufacturing permit for raw products and a permit for raw milk sales on the farm so just started a
dairy CSA with milk, yogurt, raw and fresh cheese. People have to come get it on the farm. We do all of
this full time, and our cows are pasture-based and supplemented with TMR and hay. We are not
certified organic but do use organic practices. The only reason we would not be certified is because we
are not purchasing organic feed. But other than that, very sustainable. We don’t even dry treat, which
entails giving antibiotic in the udder when the cows dry off. The farm is x acres in pasture or hay. We are
not on good soil. It is a huge dairy area and there is lot of development pressure in the state but not in
that area. Also we are bordered so not a lot of pressure to develop but also not a lot of farmland. For
expanding. We are operating at full milking capacity with x cows. We don’t have room, land, or barn
space for more but we are not processing at full capacity. Last year we processed just shy of half and the
rest we sold to dairy farmers USA.
164 Appendix F: Supply Side Interviews THE COMMON MARKET FEASIBILTY STUDY
DAIRY 1: I am an n generation farmer. My dad started the farm and opened the retail afterwards. We
have x milking Holsteins. No cheese, and buttermilk is the one cultured product. The rest is all milk: 2%,
chocolate and other flavors (strawberry, vanilla, orange cream) and we started doing butter. We’re
processing almost all cows. Between the farms we have hundreds of acres. Similar to DAIRY 2, we graze
as much as possible. Don’t use Bst. We are not organic because we don’t purchase organic feed. We
aren’t at full capacity and do have room to milk more cows and process more.
DAIRY 3: I am here representing the person who started the business several yrs ago with his father. The
farm is on x acres in County 4. We produce organic hay to supplement farms. We represent and market
products from an organic farming co-op in County 1. There are x farms on board that we purchase milk
from. DAIRY 3 is not a coop but we market their product. All farms are certified organic. We are
currently in the comfortable position where we have, not waiting list, but no problems sourcing milk.
Also, there is going to be an abundance of organic milk in the next few months. When the business
started there were a few farms and it increased a few years ago. We have a healthy product and a niche
market. My model is to keep it simple and do it right, not get in over our head. In terms of products, we
have a full line of minimally pasteurized milk and the cows are all on a grass-fed based diet. We have
homogenized and unhomogenized, ricotta cheese that is co-packed, and whipped cream, which is kind
of a recognized product. We have co-packers up and down east coast. We also do butter, buttermilk,
and sour cream. We just opened up a new facility in County 5 with a processor and there have
capabilities of spray drying milk and churning our own butter in a few weeks so we can be more
competitive with healthier product. It can be more complimentary by making it ourselves and the other
company is a little overpriced right now. For customers, I feel like we’re a baseball team that wins on the
road but can’t win at home. Our product travels to New York and Florida and I see it on store shelves but
when I go to local stores, I can’t find our product. Local isn’t more important than organic but I think the
interest level is heightened when it's local and organic, it can be a win/win. There is now a push for the
company to be more recognized locally and to have people understand where the milk is coming from.
Products
Question 8. What is produced at the farm?
Question 9. What are the “marketable” products?
Question 10. What is the annual volume produced at your farm
Question 11. Describe the volume in terms of seasonality.
Question 12. Are there specific production cycles that pertain to your operation or type of operation?
DAIRY 3: I wish I knew the annual volume in terms of pounds. I know we grew very significantly in a
couple years and only procuring what we’re utilizing, we’re not wasting and we’re growing at a
reasonable rate. Part of that success is having great staff on board and a great operations manager in
charge of procuring milk. The manager does a great job so not affected by the wintertime because of
relationship with farmers. I don’t believe we have production cycle challenges.
165 Appendix F: Supply Side Interviews THE COMMON MARKET FEASIBILTY STUDY
DAIRY 1: We produce milk and buttermilk. We also have unhomogenized milk. I’d say the annual volume
produced is thousands of lbs/day. We do a good bit of wholesaling now to a regional farmer-owned
coop and a buying club and also have a stand at a public market and a few restaurants. We service the
local restaurants directly.
DAIRY 2: We produce raw milk, cheeses, yogurts, fresh cheeses. We don’t have much of anything that
uses the pasteurizer. All are marketable products. Raw milk is not something we sell anywhere except
off the farm because we are not interested in the equipment cost. Our yogurt is not being packed Grade
A, so to sell it other than off farm, we will need a cup filler that packages at grade a. The cost/benefit is
something we are wrestling with. We can sell the yogurt in a 10lb tub and customers than dish it out in
deli container. Ricotta and fresh cheeses have a short shelf life. We make them on one day, customers
get it on the next day and it lasts for about 10 days after that so there has to be a quick turnaround.
Most of the fresh cheeses we sell at Farmers’ Markets. Hard cheeses we are always ready to sell at half,
quarter, full wheel. Sometimes in the winter we don’t do the fresh stuff when we’re not going to sell
enough at the Farmers’ Market to warrant using the pasteurizer but we always have the aged cheeses.
And we’ve found restaurants that use the ricotta so we did do that throughout winter. The sales do
affect production. For instance, if it’s going to snow on a sat or sun, we back off.
Question 13. Wholesale Market readiness of products:
What do you produce that is market ready for wholesale trade? How so?
What do you produce that is not market ready for wholesale trade? What needs to be done in order
to make it market ready for wholesale trade?
Answered above
Question 14. What resources do you have at your farm (or at your disposal) to prepare products for
market?
Do you have any of the following: packing line for produce, sorting, grading, storage, cooling,
refrigeration, and freezing facilities
DAIRY 1: We bottle in both glass and plastic. We do glass at the home store and the public market. We
can do it in other places but need a deposit. We do have a pasteurizer and homogenizer. We do a cream
line which is unhomogenized milk. It’s picking up some, still not a best seller but enough to make it
worthwhile. The glass bottle is cost prohibitive because the bottle itself is expensive. We sub the butter
out off-farm using our product. It’s the only thing we sub out. There is no facility for buttermilk.
DAIRY 3: The problem we have is we don’t get the bottles back, only about 30%. And the deposit doesn’t
fully cover cost. We are capturing milk from many different parts and shipping. We homogenize,
pasteurize or ship to 4-5 different processing facilities. We contract out all the processing but we do
want to produce more products ourselves (butter, sour cream and buttermilk) and would like to expand
maybe to yogurt. Organic ricotta cheese we produce in bulk industrial, and have organic buttermilk for
salad dressing lines. The ingredient business is a big part of what we do. It’s a nice way of balancing and
166 Appendix F: Supply Side Interviews THE COMMON MARKET FEASIBILTY STUDY
getting quality ingredients for quality finished products. People are becoming more aware of organic
and natural and seeing it as important. We are certified organic in food safety.
DAIRY 2: We have a small pasteurizer, refrigerator, and aging room.
Question 15. Do you participate in any certification programs such as organic certification, food-safety
certification, GAP certification, special product licenses (e.g., raw milk license), or any other regulatory
or voluntary certification program? Please describe.
DAIRY 2: We have a raw milk license and that’s it. And a standard processing license. We looked into
“certified naturally grown” through the humane society but it's a lot of paperwork or requires silly things
that doesn’t make sense like the calves have to touch each other or something. We don’t feel like it’s as
necessary since we interact with almost all of our customers at the farmers’ market.
DAIRY 3: We are certified through the QAI in food safety and organic certification. We don’t do PCO
because that’s more on the crop side. But we have considered switching. However, you can switch
anytime you like and can still go natural with PCO.
DAIRY 1: We are certified in food safety as a part of food handling, not GAPS and also have a processing
and wholesale license.
Marketing and Sales
Question 16. Describe how you sell the production from your farm?
• wholesale / direct retail trade
• sales handled internally at farm by owner, operator, employee
• works w/ external agents or brokers or other (e.g., member of wholesale cooperative)
DAIRY 1: We have a retail store at the home plant. Also sell to a public market, do wholesaling to a
coffeshop and restaurant and a few other stores. Our biggest thing is getting in to our home base area.
We started at the market about 8 yrs ago and it does good for us. A lot of regular customers come in.
1/3 of our volume is sold wholesale and the rest is retail. Out of wholesale, a regional farmer-owned co-
op is our biggest wholesaler in volume. We get our products to Philadelphia through that co-op.
DAIRY 3: We have a small retail location at our office facility that doesn’t do much volume. We sell most
of our product through a distributor who in turn sells to retailers. My job is to be the liaison between the
distributor and retailer and also to be the liaison between the ingredient company and the
manufacturing facility. 75% of the operation is retail and 25% wholesale but it's [a] growing segment.
(NOTE: the way Common Market is defining wholesale, their whole operation would be wholesale). Q:
Mostly large scale distributors? An organic food distributor under the unified umbrella is the largest
distributor but we do deal with smaller distributors. I’ve had conversations with a co-op trying to spark
that relationship- it makes sense. Currently also Frankfort Farms and shoppers in NYC are delivering
product.
167 Appendix F: Supply Side Interviews THE COMMON MARKET FEASIBILTY STUDY
DAIRY 2: We mostly sold at a few farmers markets in Washington, D.C. That’s our bulk. We are 75%
retail, 25% wholesale and prior to that were 90/10. I don’t want to do any more farmers markets and
started approaching restaurants and stores. We handle sales and have helpers for farmers markets,
wholesale is just us, and my husband is the primary person for contacts.
Question 17. Describe customer base
Question 18. Describe experiences with various customer types, especially any experiences with
wholesale distributors (including cooperatives)
DAIRY 2: Restaurants are difficult to deal with. They need a weekly call to talk about what they need. We
did a deal with a restaurant group in D.C. for 5 yrs until this year. UPS lost a box of cheese (hundreds of
dollars worth) and within a week the group decided they didn’t want our cheese anymore. I found the
chef arrogant and demanding (he said once the cheese wasn’t professionally packed- it’s a wheel of
cheese. And was upset the wheels were not same size). Note: Wheel =10lbs. The common market in
another out-of-state city is a co-op and they have been the best customers. They and a D.C. store are
the best retail store outlets. The store calls and picks up at the market in that city. [The out-of-state]
Common Market makes an effort to promote local and we have our own corner of the cheese island
where they promote us as local. Farmers markets are the best for setting our own prices, deal with
customer and get paid right away. I’ve had chefs say, this stuff is great, can you fax me a description of
inexpensive ones? There aren’t any that inexpensive
DAIRY 1: Sometimes with a buying club it’s a question of when seeing the envelope in the mail. All of us
sometimes have to call them or sometimes they call you and that is just how it goes with wholesale. Also
weather related issues are sometimes involved, and we have cancellations. With doing retail, you can
set your own price and you know what going to sell. When the buying club orders x half gallons of 2%
when they usually order less, its kind of hard. We have to go out and get it from our retail outlet. Also,
it’s nice to have orders on time. We process 3 times a week and sometimes we don’t have the order in
until we’re done processing for that day. With direct wholesale and not working through others, we
have no generalities about types. Lot of times customers say they are restricted on spending so they cut
back on cream and next time they say I ran out of cream, bring me more. With the bigger places, their
hands are tied on dollars, and they cut things like buying higher priced cheese. Some of the regional
farmer-owned co-op challenge is prices and then the service charge. We don’t adjust our price for the
co-op.
DAIRY 3: I can relate to both stories very much. On a small scale, someone used to order x and wants
many more. We run in to the same problems no matter how small and big. Yesterday, we were short
350 daisies and that’s when you start juggling. I can also relate to DAIRY 2’s story about the chef. I just
turned salesman and was a chef. But I don’t say that when I go in to talk to a chef because they will have
the attitude that I don’t know their situation or problems. There are the same problems trying to supply
restaurants. Getting the product from point a to point b is always the stumbling block and the biggest
issue. Getting from processing facility to chef with a snap of a finger would be great. You are judged in
the food industry by food costs because everyone knows how to cook but not everyone knows how to
do that cheaply. People don’t know enough about pricing and transportation costs.
168 Appendix F: Supply Side Interviews THE COMMON MARKET FEASIBILTY STUDY
Question 19. If you are already selling wholesale, describe the following:
• communication with customers
• system for filling orders, packing, and shipping
• ordering cycle by week and season
• how you get your product to market
• a preference regarding delivering to your customers or having them pick up at farm
• producer willingness to supply under contract at fixed price
DAIRY 3: This is an all-encompassing question and we’ve already touched base on it a little.
Communication with customers and dealing w/distributors- it’s all about educating, not only the end
users but also the retailer that provides the product and the distributor that purchases it from us. If they
don’t understand then it’s not a good sale because they can’t justify the price. You have to build a
relationship with them (distributors), that’s key. When I switched from food service to sales, I was lucky
to have a wife that said just communicate with people and sell relationships. People buy from people
they like. In terms of logistics for communication, its email, fax and website. I like to get in front of
distributors and present them with products and pricelist. Once that relationship established, it’s a
weekly call or order depending on customer and ranging from email to visiting. One national organic
distributor has private label organic milk. Extended shelf life of other milk will sell nationally better.
Another organic distributor good there because produce taking on other products. We deliver fresh
three times a week and don’t charge because they are also 80% of “retail” business. The former
distributor is not a very well liked company. They sell a lot of whipped cream but are a little difficult to
communicate with.
DAIRY 1: In terms of getting product to people, I deliver locally and to the regional co-op warehouse. If
the volume was big enough, we could possibly deliver ourselves to Philly. It if was a substantial order
once or twice a week could bring it and maybe fill with produce or something to substitute on way
down. There’s very few wholesale pick up at the farm.
DAIRY 3: (To DAIRY 1) It’s probably a good idea to figure out if we can deliver together and what synergy
there is between us. That’s what’s intriguing but again, we have to see how to get from point a to point
b.
DAIRY 2: A regional processor takes delivery to an urban area for us for 20. If enough is being delivered
we could do it ourselves but for now it’s easier to go to the processor's location. I prefer any
communication where I don’t have to talk to customers on the phone. I like talking to customers at
farmers markets but I hate calling on the phone. Most communication on the phone is done by my
husband. That’s why it’s good to have people good at diff things. We don’t do much shipping and try to
discourage. We do have a weekly delivery route and we can deliver to anyone within that circle on that
day. That works well for us and we’re trying to build that up. There’s not really an ordering cycle. We
drive ourselves directly to customers, except for a couple stores, and pretty much drive ourselves. We’d
169 Appendix F: Supply Side Interviews THE COMMON MARKET FEASIBILTY STUDY
rather deliver because too many people on the farm can be distracting. We do have a small on farm
store but it’s at house. You can easily get bogged down when you have people show up. We resisted it
with raw milk but now have that have CSA. A certain minimum order for weekly deliveries but if just get
ricotta, it can’t be under x bucks. But most don’t just get ricotta. We are willing to supply at fixed price.
Question 20. What are your terms of payment with your wholesale customers?
DAIRY 2: I wish we took credit cards but we haven’t gotten around to it yet. We say net 15 days.
Everyone except the restaurant group had no problem with that and a lot will pay right away. One store
sends a check within two weeks. If we did more wholesale, we might have to be more strict about how
quickly get paid but with the farmers market we get paid right away so we can afford to let another
things slide.
DAIRY 1: Wholesale we ask to get paid right away or within 2 weeks.
DAIRY 3: net 10 on retail (distributor) and net 20 on ingredient.
Question 21. If you are selling directly to a wholesale customer, how do you come up with a price?
Question 22. Do you have any fixed or long-term pricing (and / or volume) arrangements with any
customers? If not, do you have an interest in this sort of arrangement?
Question 23. What arrangements do you have with brokers, sales agents, cooperatives in terms [of]
commission rates or other means of payment for their services?
Question 24. How much time do you spend with sales and marketing?
DAIRY 3: To come up with a price, I do homework to see what our competitors charging and then make
our own margins within reason. Ok with fixed or long term pricing. We do some private label milk for a
few different companies- there’s less margin but its more consistent business. I kind of like it because I
don’t have to sell or market the product because their names on it. Even if the names weren’t on the
container, with the common market might have standing order. We don’t utilize brokers because I don’t
personally believe in them. I think they sleep all day, watch cartoons and take money. There’s a time and
a place for brokers and sales reps and expanding the sales team but I’m not willing to do that as of yet. I
spend 100% of my time on sales and marketing because that’s my job description. Hopefully we will get
to expand and I want to have sales team in 2 years.
DAIRY 2: We figure out our retail price first and figured that x% is marketing so, if we don’t have to take
to market, price it x% less. It’s not cheap cheese and it’s not inexpensive cheese. There is a market for it;
you just have to work harder. We had a restaurant with a standing order for ricotta but they changed
menus quarterly. We have two vendors at the farmers market who make pastas and tarts with our
ricotta so they have standing orders. We don’t work with brokers or sales agents. I’m always open to co-
op selling agreements and paying commission for that. Tuscorora Model is great and PA cheese makers
should look into it. I know someone applied for a grant to put together a PA cheese alliance coop for
selling with commission paid. We are more than happy to participate in that. I guess we spend not
enough time on sales and marketing.
170 Appendix F: Supply Side Interviews THE COMMON MARKET FEASIBILTY STUDY
DAIRY 1: Our price for wholesale is mostly the state minimum pricing for milk. For retail, we sell cheaper
at our store but other stores have to sell at least for retail. Kind of new at most of this and not many
accounts besides buying club and the regional farmer-owned co-op. We don’t do anything with co-ops
and brokers. For sales and marketing, probably should get out there more with our product.
Question 25. Is it important to you to maintain your farm’s identity or brand in the market?
Question 26. How important is the “brand” and “identity” of the customers you sell to, especially if
they are re-selling your products (as in the case of wholesale distributors)?
DAIRY 3: Brand and identity is obviously very important, especially in what we do. We want to expand
the line, and sell some byproduct to help drive milk sales. It’s just so important to keep customer base
and shelf space. If you lose it, out of sight out of mind and they find someone else. We have to do trade
shows, even if we’re not gaining sales, just to show face. Same with farmers markets and smaller events,
and tastings at smaller retailers. You can’t just sell it as organic milk anymore, you also have to explain
that its from local, sustainable farms, grass fed cows, etc. So it’s all about the name. Ultra pasteurized is
an advantage in some major retailers. Even in our private label business, we have strict standards
regarding what’s on the label like it has to have a storyboard on the product that meets some criteria. A
very minimal percentage of the business is glass and that I sometimes challenging to fit info on a small
label.
DAIRY 1: Our milk is mostly sold in retail store so we don’t have a lot of labels so cant relate to a lot of
that there. Q; In the future would it be important? Could you use labeling to point out characteristics
that are selling point? A: It doesn’t say anything on the packaging and that could be very important for
common market- to get the story to the end customer. 10% of business is glass.
DAIRY 2: It’s very important to keep our brand on the products and maintain our identity. A store/buyer
says the best reason to do the farmers market is to get the name and brand out there. The slow grow
concept has helped us. Another vegetable farmer that sells at another farmers market is reselling our
cheese and people recognized it. It’s very important to us that our customers know our story. Going to
wholesale, its kind of difficult to put story on a piece of cheese- we prefer to sell it by the wheel. The
out-of-state common market and the D.C. store will sell cheese for you with signs on the island and we’ll
come down and sample on customer days. The market is a higher end store that knows how to keep the
story with the cheese and they sell enough to make it worth our while. They have a great system of
colors and signs for organic and local. It used to be a very small, hole in the wall store and then took
over an old gym across the street and are now very big. They’re thousands of square feet and still
maintaining their integrity. It is a coop that is member owned and stuff they sell is local and mostly
organic. It’s in a very affluent neighborhood. The owner doubles the price on our cheese and it will sell
because people are willing to buy local. Also, I have an Amish neighbor who makes Romano cheese so
we are distributing for them.
DAIRY 3: We stopped making cheese. We only did cheddar-aged cheddar but the aging was too much
work and there was inconsistency with cheese makers.
171 Appendix F: Supply Side Interviews THE COMMON MARKET FEASIBILTY STUDY
DAIRY 2: There was a huge demand for artisan-style European cheese and the market is flooded with
mediocre grass fed cheese. You can’t just sell on the grass-fed concept because the market is flooded.
You need to take it to the next level. We have cheddar aged in black wax, feta, wallaby natural wind,
Leicester aged in yellow wax, hot pepper jack is dragon’s breath, Gouda style with a natural rind.
Everything has its own name.
Question 27. What barriers and / or obstacles do you face in trying new or alternative approaches to
sales and marketing?
• Distance from wholesale customers
• Sales and marketing support
• Size of farm
• Availability of affordable land to purchase or rent
• Local ordinances
• Labor
• Capital to expand operation or purchase necessary equipment to make farm produce market
ready
• Market access
• Optimizing now, doesn’t make sense to change
• Regulations or required certifications
• Lack of trustworthy customers or wholesalers
• Lack of management skills to oversee expansion or changes in existing operations
DAIRY 2: Our number one greatest obstacle is labor and not enough time to do it all. For the cheese we
have to start at least 2 months in advance to increase our inventory and we’re not getting paid for that.
So to hire someone to increase our sales, we would need to have a big chunk of money. That’s more an
issue of capital rather than finding labor. Eventually the (un)availability of land to rent will be a problem,
especially if we want to produce all own feed so we don’t have to buy feed.
DAIRY 1: To go out of the state you need to be certified to grade a to go out of state so can’t go to a
different state. Having a Grade A plant entails certification and paper work and more hoops to jump
through. No problem with substance, just all the paperwork, money, hoops. There’s an annual
inspection but the initial one is pretty strict. They give you a white glove treatment. We are inspection
now but to be certified in grade a would take a lot. Once there, maintaining is ok, but it’s the initial
investment. Philly is an opportunity for us because it’s not going out of state.
DAIRY 3; Distance from wholesale customers because of transportation. Transportation is the bad seed.
172 Appendix F: Supply Side Interviews THE COMMON MARKET FEASIBILTY STUDY
Expectations
Question 28. What sort of services could a wholesale distributor offer in order to interest you in
working with them? (This can include sales & marketing services, facilities, packing, cold storage,
processing and / or other market preparation.)
Question 29. What terms of payment do you expect from a wholesaler?
Question 30. What are your expectations regarding problem and / or dispute resolution? (includes
quality issues, contractual disputes (i.e., price adjustments, changes in market situations, etc.)
Question 31. Are any of the following points important to you with regard to the customers you work
with?
• Ownership
• Legal organization that provides opportunity for vendor ownership such as a cooperative or
shareholder in other-than-cooperative legal structure
• Transparency
• Core values and mission
• Fair trade
• Terms of payment
Question 32. Describe how you would envision working with a wholesale distributor like the Common
Market
DAIRY 3: The wholesale distributor gets the product to the end users and knows people in and around
Philly who want the product. So hopefully a relationship can be built. Working hand in hand is key and
can’t be heavy on one side or the other- can’t hold each other hostage. I wouldn’t have come if I didn’t
want those end results and willing to do whatever it takes to make that happen. We have to think two
steps down the line and make sure as we move forward, that the common market does have the end
users best interest in mind and willing to meet manufacturers halfway. Meetings like this can be the
catalyst.
DAIRY 1: Can I say ditto? Not much left to say. A regional processor does come to County 1.
DAIRY 2: I would love to deliver to somewhere in a nearby part of County 1. The bulk of our sales are in a
different state and I feel guilty that we don’t sell more in PA (but I’m also not that guilt tripped). Philly is
a pain for us to get to and the common market would be something we’d like to participate in if we
didn’t have to get the cheese to Philadelphia. I’d like some sort of consolidation point or halfway point
for farmers to drop to. I think it’s important to work with someone who meets our core values and
mission. I decline to deal with some farms near me who want to sell cheese because they’re shady and
tell customers what they want to hear. Integrity is so important and when you lose that you have to
start over. So far we can afford to be selective and hope to be the case in the future. We would like to

173 Appendix F: Supply Side Interviews THE COMMON MARKET FEASIBILTY STUDY
buy a cup filler to put yogurt in 6 oz cups and really wholesale products and so we wrestle with when to
make that expenditure. This sort of thing would be a catalyst to make that expenditure. Right now we’re
selling x quarts of yogurt in one morning. Not sure how much the regional processor would take if think
competing. Think prices too high but I’m ok with where prices are and not willing to compromise.
174 Appendix F: Supply Side Interviews THE COMMON MARKET FEASIBILTY STUDY
Fruit Sector
March 22, 2007
General Information
Question 1. How long have you been farming?
Question 2. Where is your farm located?
Question 3. Is farming your full-time (or primary) occupation?
Question 4. Briefly describe your farming operation
Question 5. How much land do you farm?
Question 6. Is your farm currently operating at full capacity?
Question 7. Do you have plans to expand (or contract) your farming operations in the near future?
ORCHARD 1: We’ve been farming for many years in County 2. It is my full time occupation and we have
hundreds of acres in fruit tress. We haul hundreds of trail-loads [per] year- apples, peaches, pears,
plums and cherries. Medium packing with storage. Pack fruit for other growers. We are not at full
capacity- at half the capacity we plan. We are making changes away from processing to fresh because
processing under pressure. Strive to be on top end of innovation, like dwarf trees, etc. We have a ways
to go but every year we plant over 1000 new trees.
ORCHARD 2: We are an x generation farm and have been farming for many yrs. We are located in
County 1 and grow apples, peaches, pears, plums and cherries. Mostly it’s apples and peaches. We also
make apple cider and that’s a product I’d like to push a lot. In terms of capacity, we don’t have all the
land in trees at this point and there are some vacant acres. We’re planting new trees every year but just
some here and there.
ORCHARD 3: Farm is located in County 2. It is my full time occupation. My children are showing some
interest in becoming more involved on the farm. We have a little under x acres but a fair amount of that
is woodland. Processing not viable anymore so we are getting into fresh. We are getting out of one
market (processing) so cutting back there but overall expect growth. We grow just about every tree fruit
that can be grown and a few not supposed to be able to. In terms of capacity, have plans to gear up and
expand and each year planting a fair amount of trees.
Products
Question 8. What is produced at the farm?
Question 9. What are the “marketable” products?

175 Appendix F: Supply Side Interviews THE COMMON MARKET FEASIBILTY STUDY
ORCHARD 1: Could market tree ripe piece of fruit, like peaches, nectarines, apples, as something that
you can’t get elsewhere and we have the ability to do that because close to an urban area. Sell peaches
with the fuzz on at premium. Other products: sweet cherries, (fresh market tart cherries with stems),
peaches (yellow- normal, low and high acid, and white low acid) nectarine (high acid yellow, low acid
white), pears (Bosc, red Bartlett, and Asian), apples (processing and fresh, 14 different varieties of
whatever apple can be grown[)]. Not “club variety” like pineta like niche varieties. 13 different varieties
grow commercially to fresh market- braeburn, whatever you want. Do it in volume so we can get it
done. Using MCP gas at a narrow window at harvest time that stops the production trigger of ethylene
in the fruit. It keeps them for a long time from expiring. On certain varieties it can distort the flavor, like
gala. But golden delicious makes it better, “brings a good apple right there.” Right now we have 18 lbs
of empire in regular storage. Every year, every apple is different. More of an art than many realize.
Tens of thousands bushels of apple each year and did not do any controlled-atmosphere storage (ca
storage reduces oxygen and increases nitrogen).
ORCHARD 2: We grow apples, peaches, pears, cherries and plums. Cherries (sweet and a few tart) come
in season in the middle of June. Don’t grow nectarines. Peaches in season from the second week in July
to mid Sept. Plums have 10 different varieties on a dozen trees including prune, santarosa, methyl,
shiro, starts delicious, and vignette. Pears (Bosc, Bartlett and Asian- organic). There is a 4-acre block of
apples we are trying to grow organically but it’s been a bit of a challenge. Emphasis across the season is
apples and peaches. Try to fresh market everything. Did MCP on some of the apples last year and liked
the results from that. Rent controlled-atmosphere storage in County 2 but usually only use that for
largest quantities of red, golden delicious and staymen. Don’t grow enough pink ladies and usually have
to buy some from Virginia. The cameo is a really good apple and we planted in the organic block and
seems like it's working out alright.
ORCHARD 3: We grow strawberries, then sweet and tart cherries, apricots (a lot of varieties), plums-
close to 20 varieties, peaches (white and yellow) from early in the season to as late as can possibly grow
and nectarines. Fair amount of donut peaches. Early apples in July (Overall 30 varieties and some
heirlooms), pears (Bosc, Bartlett, and Asians), black and red raspberries, blueberries. We also raise
some vegetables, chestnuts, and my daughter is doing shallots, sweet corn, and some tomatoes.
Question 10. What is the annual volume produced at your farm?
Question 11. Describe the volume in terms of seasonality.
ORCHARD 3: Our volume went down when we were pushed out of the factory but it will get back up.
Produced x bushels of apples in past years. x bushel[s] of apples [this year]. Peaches- haven’t even kept
track, in season x boxes a day. Can meet whatever the need in apples. Planting more strawberries,
every year doubling and the same with all the berries. (Use the berries mostly for farmers markets,
don’t really want to wholesale berries.) Truckers have deposits on cardboard and bring pack.
ORCHARD 1: Everything we grow goes through the packinghouse and have x loads a year. Heavy to
apples, then peach and nectarine together and then sweet cherries by far the smallest volume. Buy lots
of ripe sweet cherries and strawberries from New York State and resell them. Apples are our main game
but peach season is compressed to 6 weeks. Apples give the long time volume because have 10 months
176 Appendix F: Supply Side Interviews THE COMMON MARKET FEASIBILTY STUDY
to market whereas with the peaches, only have 6 weeks. Love strawberries but pretty touchy. Farmers
markets are wonderful but we don’t do it because give too many headaches. x crates of peaches year
and x or so of nectarines. Wooden crate holds about 25 lbs universal. It’s a convenient way to harvest
fruit and grade in orchard. Tree ripened fruit is graded as it is harvested and the crate is designed so air
could flow in bottom and out the top, sides don’t come all the way up and becomes a convenient and
economic way to harvest, cool and transport. Problem comes with getting them recycled back. Good
thing is also that it gives image to the retailer that they grew it. All about the image and we charge a
premium for fuzz. I don’t worry about what name is on the crate and what customer says if it’s growing
or not.
ORCHARD 2: Apples are the main things we grow. Sell about x bushel[s] in a season. Have a retail
outlet so can move certain amount through that. x bushel[s] sold wholesale. Have cider apples off the
grater. Peaches were x half-bushels last year. Retail a lot of peaches. Sell to Amish families for canning.
Peaches something we can easily get rid of at a good price. Hand sort most of the peaches but open to
tree run (not grading). Do not pack anything into boxes or cardboard. Everything is packed in
returnable wooden crates- charge deposits on them and they come back. Most plums and cherries sold
wholesale. Pears sold half and half. Wholesale didn’t start until the late 1980s. Go locally, take in
wooden crates and get them back and save money on the boxes.
Question 12. Are there specific production cycles that pertain to your operation or type of
operation?
Question 13. Wholesale Market readiness of products:
What do you produce that is market ready for wholesale trade? How so?
What do you produce that is not market ready for wholesale trade? What needs to be done in order
to make it market ready for wholesale trade?
Question 14. What resources do you have at your farm (or at your disposal) to prepare products for
market?
Do you have any of the following: packing line for produce, sorting, grading, storage, cooling,
refrigeration, and freezing facilities
ORCHARD 2: Don’t grade peaches out in the orchard. Bring in and repack. Last year when the crop was
big, some varieties were coming off the trees nice so were selling tree run (not graded). We do grade,
have a crew that grades peaches by hand and have customer base for #2 peaches. Apples have an old
packing line. It’s old but has the capacity to do 6 or 7 different scales on it. It can grade large, medium
and small. Small bag is 3 lb bag, medium and large graded by inches. Grader for apples, peaches are
hand graded. Cherries, plums, and pears don’t get graded. Terms of resources, we have storage but no
ca storage. Just have three different rooms about 34 degrees and no pre-cooling.
ORCHARD 3: We pick all peaches and field grade. Do a lot of field grading with apples. Spot pick in
orchard. Had success with smaller colleges because not a smaller shiny apple and looks like an apple.
177 Appendix F: Supply Side Interviews THE COMMON MARKET FEASIBILTY STUDY
People can tell with the peaches fuzz and finish that they are straight from orchard. We have two small
storages and intentions to build a bigger one. We have a small grader that’s not even set up. If we build
a bigger cooler maybe will start to use it but right now don’t much. Tend to pick everything into half-
bushel crates.
ORCHARD 1: Regular packing line and put more in this year. Have the ability to grade fuzzy peaches and
put sticker on them. Most customers don’t want stickers but some do. Also have the ability to remove
fuzz. Apples put on loaders that can sort by color and weight. Can wax them. Fuzz, labels, box- every
customer wants different combo and can do it. Peaches and nectarines have most marketability and
uniqueness of item. “Apple can be an apple but a good peach is hard to beat”. Do half-bushel crate,
ports, willing to do whatever needs to be done. Away from pre-cooling peaches because used when not
enough refrigeration in storage. When pre-cool have to run across the line and wash because fuzz all
went to the bottom of the bin. Felt removing a market option by hydro cooling. Contaminated water
could be a problem too because one rotten peach could spread pores. Turning red and inking may
discolor fruit so a lot more negative to it than positives and now that we have more storage and
horsepower to cool, got away from pre-cooling. Market changed from hard packed to tree ripened. Can
keep apples in storage and with mcp/ca can have a two-year-old apple and never know it. Even though
that’s possible though, like it to be out next week. Limit of good piece of fruit coming up soon. Like to
be done and get in to others. Don’t like selling apples against peaches, rather sell peaches. Everything
good at the beginning of the series.
Question 15. Do you participate in any certification programs such as organic certification, food-
safety certification, GAP certification, special product licenses (e.g., raw milk license), or any other
regulatory or voluntary certification program? Please describe.
ORCHARD 1: Certified by USDA for packinghouse for sanitation, trace back, and not sure if GAP but is
USDA. Do not have certification in the field. Any piece of fruit that comes in, can trace it through the
line. Box has code, delivered date, came from x farm and field, and gives time of spray applications and
wind of day. Can do for what we grow, for other growers can only trace to info on delivery to us. Fruit
and Vegetable inspection association did the inspection so is GAP. Looked at 20 firms and USDA was
most reasonable. Have a thing on the wall.
ORCHARD 2: Don’t know of certifications. Do know that just started organic block and want to be
certified organic for that.
ORCHARD 3: Made phone call to USDA and spoke with them and said just one person certified and we
don’t know what we’re doing. Not required right now, charging a lot, have to be two of them to come
out and don’t know what the guidelines are. They said to just wait.
Marketing and Sales
Question 16. Describe how you sell the production from your farm?
• wholesale / direct retail

178 Appendix F: Supply Side Interviews THE COMMON MARKET FEASIBILTY STUDY
• sales handled internally at farm by owner, operator, employee
• works w/ external agents or brokers or other (e.g., member of wholesale cooperative)
ORCHARD 1: I’m the guy that does the selling. We have a 150 customer base, 120 active. Processing
product like tart cherries and apples is to coop and 98% of processing goes to one plant. Sell some
product through a fruit broker but they enabled us, and on side agreed to agree. Me and three others
are marketing in a non-structured cooperative in that we agree to support customer that needs product
and are short that day. Sell $1 million back and forth a year and price never an issue. Use brokers and
street sales at Hunts’ point and Philadelphia and have direct-buy customers from Florida to NYC and
Detroit. Direct to chain sales. More brokers from distribution standpoint than inability to sell.
Transportation is issue. Have to be able to get truckload out the door. Milk runs in Ohio with 6-8
customers in truck. Pick-up trucks and 20 boxes at a time. No customer more than 8% of sales and wide
range of types of customers. One of the reasons farming out to a broker is the relieving of trucking and
transport. Transportation is becoming an increasingly difficult issue. Use broker because the
computerization of major markets has narrowly defined what people order on daily basis and have to
package things together on truck to make it cost efficient. Retailers are becoming very insensitive to
problems and want things like minimal inventory, just in time delivery. It’s getting more advantageous
to sell close to home. Not selling to Whole Foods directly but orders are problematic- too small and too
often. Worth it to let someone else broker it out so selling to whole foods through broker.
ORCHARD 2: We wholesale only on a local level. Don’t take delivery trucks as far as Philly- West Chester
is usually as far as we get. Northern part of Maryland and a little in to York County. Half of sales are
retail and half are wholesale. We work a little with a farmer cooperative and a company in the area
that delivers products to farmers markets in Philly, NJ and Maryland and distributes apple cider. The
product I’m most excited about selling is apple cider. Lots of people pick up wholesale at place.
ORCHARD 3: Deliver wholesale in Philly and while there sell at farmers’ markets. Have a deal to make
cider with a guy that processes it with his apples. Retail to wholesale breakdown is wholesale is higher
than retail and retail is mostly farmers markets, with some on farm sales. Raise a lot of fruit that I have
to move so still selling to a processor. Handle all own sales.
Question 17. Describe customer base
Question 18. Describe experiences with various customer types, especially any experiences with
wholesale distributors (including cooperatives)
ORCHARD 2: Have had good experiences with farm coop. Most wholesale customers are people dealt
with for years and they have a real understanding if we don’t have product. Try to make sure people get
what promised they’ll get but a little more difficult with the coop because they want notice further
ahead of time about what we’re going to have. I like to sell it as I have it and don’t like to hold on to it. A
large regional distributor bought some apples couple years ago once time but basically neutral
experience with larger wholesale.
179 Appendix F: Supply Side Interviews THE COMMON MARKET FEASIBILTY STUDY
ORCHARD 1: Generally, the closer a marketer can get to end user, the more successful your operation
will be because you can match the product to the customer better. There is a great need for a middle
man but profitability decreases when increase distance. So whenever you can sell more direct and get
lineage shorter the better. The problem becomes the financial strength of the person dealing with. See
a lot of people under-capitalized in the business. 80-90 percent of people listed in blue book from Philly
have no or bad credit rating. Dealt with some people who break out of business and you’re not paid.
Have to have financial integrity behind whoever gets involved in this thing.
ORCHARD 3: I don’t have a whole lot extra to say. Dealt with different situations for a long time and,
like ORCHARD 1, can’t deal with trust and getting burned.
Question 19. If you are already selling wholesale, describe the following:
• communication with customers
• system for filling orders, packing, and shipping
• ordering cycle by week and season
• how you get your product to market
• preference regarding delivering to your customers or having them pick up at farm
• producer willingness to supply under contract at fixed price
ORCHARD 3: Keep communication simple. Usually make the deals over the phone and deliver. I
eventually want to get a fax but stick to the phone right now. Ordering cycle is 2-3 days. He is taking a
product to the market himself and would rather customer picked it up there. In terms of fixed price
contracts, one of the bigger wholesalers did the same thing (when price dropped, they disappeared).
ORCHARD 2: Usual communication is by phone and fax, I’m not a computer guy at all. For filling orders:
delivery drivers get orders together- pick their own orders and have trucks on road 4 days a week, in
October 5 days a week. Usually need to know orders a day or two in advance but have customers who
are notorious for being last minute. I tell them I need to know at least the day before. I would prefer
people pick up product at the fruit farm but do have trucks on the road. Don’t contract at fixed price
and volume too small to be interested.
ORCHARD 1: Communication is by phone mostly. Receive orders by email but not tied into any edic
system, let brokers do that. Some fax but mostly phone. If lucky we’ll get a 3 day lead time but a lot of
stuff happens that day. Like to deliver product ourselves- sell more and get more on the truck and can
sell more kinds of things on the truck. Problem is that if it’s the wrong product, the buyer has option of
rejection. Rather put it in my truck or my contract trucks and ship because can sell more that way. Like
to have the option of contract. Price goes down, won’t sell anything and price goes up. Have to lock
him in and have experience loyalty on the contract. Have to supply the right product. Normally when
give contract price, only as good as the market that day. Apples are a little less volatile than vegetable.
180 Appendix F: Supply Side Interviews THE COMMON MARKET FEASIBILTY STUDY
Advantageous to lock in percent of cost at fixed price if they held their commitment on the volume.
Doesn’t have to be much of a discount but would know if could.
Question 20. What are your terms of payment with your wholesale customers?
Question 21. If you are selling directly to a wholesale customer, how do you come up with a price?
Question 22. Do you have any fixed or long-term pricing (and / or volume) arrangements with any
customers? If not, do you have an interest in this sort of arrangement?
Question 23. What arrangements do you have with brokers, sales agents, cooperatives in terms
commission rates or other means of payment for their services?
Question 24. How much time do you spend with sales and marketing?
ORCHARD 1: We do have arrangements with brokers, sale agents. Some work on commission, some
work on per box unit. Go in to high overhead at the terminal market probably 15% plus handling charge
of 25cents. Direct consignment sale- fixed delivered cost to them and suggested return price. Getting
away from open door to terminal markets because strength of apple and peach market can force the
issue and make buyers more responsible. If there is product there that’s not what they want to have,
have to give them latitude to go in to consignment. 7-8% commission sales. I don’t have a problem
giving 8% to Wal-Mart because I don’t want to be tied to them and in their computer system. Dealings
back and forth with other apple, mostly in 50cent a box and responsible for payment too. Terms of
payment- like 21 days. At 60 days cut off and no delivery. At 75 shut them down and take control of
checking accounts. 2 accounts in Philly through PACA are shut down. If you have a good market you can
do that, if it’s a sloppy one, you tend not to. Recovered some and some guys foreclosing their holdings
today. Whatever it is we get in to with the common market, have to have financial strength in people
selling to it to. I spend 80% on sales and marketing.
ORCHARD 2: Payment with customers is COD unless they fill out an application for credit with bank
reference. Usually like terms of payment to be net 30 days. Even on COD, make an exception for the
Amish community and do net 30 right away. See integrity and honesty in almost all plain people. Don’t
have a lot of big accounts behind 30 days. Most accounts keep up. Do have one bakery that
disappeared and owes us a little over 1000 bucks. Coming up with price is mostly supply and demand..
Look up produce catalogues, talk to people on phone like other County 1 growers. Don’t have long term
pricing arrangements. Selling at normal wholesale price and working with them on getting a better deal
for them because of their markup. 40-50% of time on sales and marketing because also involved in
marketing.
ORCHARD 3: Most stuff is COD. One person dealt with about 20-30 days. Tend to get strung out
sometimes about payment but mostly ok if straight up and have good luck. Hope my son takes over
sales and marketing soon, I’m too flexible and easy and he’s more hardcore.
Question 25. Is it important to you to maintain your farm’s identity or brand in the market?

181 Appendix F: Supply Side Interviews THE COMMON MARKET FEASIBILTY STUDY
Question 26. How important is the “brand” and “identity” of the customers you sell to, especially if
they are re-selling your products (as in the case of wholesale distributors)?
ORCHARD 3: A few places we sell to in urban areas use our name in the store and college and I like that.
Something that puts name out there is important. At the same time, when selling a lot of fruit, if
customer chooses not to do that but still paying and take product, can be ok with that.
ORCHARD 2: Feel similar to ORCHARD 3. I want to put name on product and like to see our name on
the product. For apple cider, we private label for about 4-5 different orchards. Most of apples in our
cider we get from somewhere else. Don’t grow enough apples to use in cider and don’t custom press
for people. We do pasteurize.. We blend as many different apples as can.
ORCHARD 1: No matter what I do, an apple I grow is still an eastern apple and has a multitude of things
that could be wrong with it. Try to pack to a certain quality standard, and if can’t meet it, change label
on the box. You can put the best box of fruit out there and in transit or over time don’t want your name
on the fruit after while. Nice to have name on things but if crate of fruit makes a guy a buck and doesn’t
have my name on it, that’s fine. The guy who bought it knows where he bought it from. Mostly in
produce, name has not stuck and don’t see it as significant.
Question 27. What barriers and / or obstacles do you face in trying new or alternative approaches to
sales and marketing?
• Distance from wholesale customers
• Sales and marketing support
• Size of farm
• Availability of affordable land to purchase or rent
• Local ordinances
• Labor
• Capital to expand operation or purchase necessary equipment to make farm produce market
ready
• Market access
• Optimizing now, doesn’t make sense to change
• Regulations or required certifications
• Lack of trustworthy customers or wholesalers
• Lack of management skills to oversee expansion or changes in existing operations
182 Appendix F: Supply Side Interviews THE COMMON MARKET FEASIBILTY STUDY
ORCHARD 2: I like how I’m doing things. I’m not a pusher for change and maybe that’s a detriment
sometimes, maybe the company needs someone that’s a visionary. Looking at the list: distance from
wholesale customers is a big deal. Not into contracting truckers. We deliver what we can and in
balance to buy another 10 wheeler or small tractor-trailer. Did hire a guy to do some local deliveries last
year. However, our major crunch is from September through November so if we have a big truck, what
do we do with it the rest of the year? Happy with the size of the farm- x acres but a few are vacant and
waiting for something and don’t want to expand. Not affordable for land in County 1. Labor not a
difficult issue- have two Mexicans full time and 4-5 other FT. Put an ad in the local papers- budget
(Amish newspaper) and County 1 farm news. In the summertime have guys out of school to pick
peaches. Blessed with customers and wholesalers that we can trust. Not a lot of people have taken
advantage. I think I can always manage better. Work closely and well together, for the most part. Like
where we’re at but want to be open to change, especially positive and good change.
ORCHARD 3: Distance to customers is a hike but adjusting. Size of farm- big thing is growing less than
when growing for processing but hopefully will build volume back up. Labor going to be a problem
especially depending on what happens with the farm. Being small and maxed on fruit, can pay more for
labor. However it is hard work picking fruit and if take help away through immigration legislation, labor
could be a big issue. Could expand and do stuff with capital. Decent customers and my son has
management skills.
ORCHARD 1: Start up demand would be limited until had enough fires to make the transportation a
non-issue. Have to be a piggyback in the beginning. Don’t see getting size, shape or right fruit for
customer as problem. To make it work, need to have credit worthiness of people doing the purchasing.
Another issue, with multiple buyers tend to use highest price buyers as lead. Historically from County 1
and feel that a lot of growers don’t attribute enough cost to what they are doing. Basically, they sell too
cheap. In order to be in business, must sell product that covers fixed cost for item on day plus variable
cost on continuation. Sell little in to County 1 right now because always someone down there that’s
cheaper. So pulled out completely. Problematic for continuing relationship. Poor marketing sometimes
and sometime very excellent marketing strategies.
Expectations
Question 28. What sort of services could a wholesale distributor offer in order to interest you in
working with them? (This can include sales & marketing services, facilities, packing, cold storage,
processing and / or other market preparation.)
Question 29. What terms of payment do you expect from a wholesaler?
Question 30. What are your expectations regarding problem and / or dispute resolution? (includes
quality issues, contractual disputes (i.e., price adjustments, changes in market situations, etc.)
Question 31. Are any of the following points important to you with regard to the customers you work
with?
183 Appendix F: Supply Side Interviews THE COMMON MARKET FEASIBILTY STUDY
• Ownership
• Legal organization that provides opportunity for vendor ownership such as a cooperative or
shareholder in other-than-cooperative legal structure
• Transparency
• Core values and mission
• Fair trade
• Terms of payment
Question 32. Describe how you would envision working with a wholesale distributor like the Common
Market
ORCHARD 1: I’m not adverse to an ownership position in a market. I think it would be advantageous to
have ownership position from the control point of integrity of people doing the business. One more set
of eyes. Not everyone in business situation should be in business and should have gaps or oversight.
21-day terms gives week to get in to sell it, a week to be paid and a week to pay him back. Rejections
and problems are day to day and where integrity comes up. Best way is to solve problems is that day
(potatoes are bad, what do you want to do?). Seller has to know product. Every piece of fruit grown
can have a problem and have to recognize it and have integrity of buyer and seller come together. If
coop, have to have transparency in the books. But probably have to have contingency fund for non-
payments so have it go 12-14 and cover bad debts. Can't or don’t want to trace debt to sack of
potatoes, should be spread over.
ORCHARD 2: I don’t know what else to add. For services, a way to come to our place and pick the
product up would definitely help us. We’re not even in the Philly area and had to hire trucker last
summer. A lot of people that pick up at our place and go sell in farmers markets. I’m okay with net 30
days for payment. For dispute resolution, I’ve felt like over the years, if approached with a problem, just
turn around and ask what to do to make right. Hate selling bad product and sometimes that happens. If
the customer wants to send it back or throw it out and needs credit, willing to work with that. Not
doubting people on the phone with issues. Just want to be willing to work.
ORCHARD 3: I disagree with ORCHARD 2. Trucking is just another thing and to me, that’s going to be
where the markup comes in- delivering to the city. Wouldn’t prefer to deliver but yes I do and one way
or the other somebody pays for it. Where’s the cost per mile? I’m envisioning setting up a cooler and
being palletized and have the burden be on farmer to get to you. Like to be part of this and have a little
bit of a lock (out in the open and other people sell). Payment is loose so talk to my son. In the past I’ve
always resolved disputes myself. Some of buyers complain about anything and might as well-cut losses
and move on. You've got to resolve it but the good people, when they complain, you have to make
right. Others after three or four times. Like to be part of it in terms of ownership in coop etc.
Interested in working with it. If I can't get it or don’t have it, I’ll try to find a place to get it.
184 Appendix F: Supply Side Interviews THE COMMON MARKET FEASIBILTY STUDY
ORCHARD 1: Something like this in the terminal market in Philly was going to get done and is now put
on the back shelf. Back shelf is really recent and is because real estate is too valuable in the naval yard.
Come up with another grand plan situation, if this should be a portion of it or separate?
ORCHARD ?: People trying to force into negotiations that there would be houses there solely dedicated
to pa produce. But never understood someone has to run business and people that are brokers do
receive some pa product. Deal is yes we will work toward that end and then never have something
happening. Will move to Camden because every operator there living in New Jersey and eager to move
across river because of rent and operation of market. Find out when over there that business on other
side of the river.
ORCHARD 1: Terminal guys are short-term thinkers and have been battered and beat so many days of
their life. Glad not on the street selling product. Different world.
ORCHARD ?: Big issue, handling huge amounts of cash and work like hell and real challenge like
restaurant operators- really good and profits go up nose and cant
ORCHARD 1: Working in city has a lot of cost and have to be careful that cost isn’t prohibitive.
ORCHARD 3: Access and parking?
185 Appendix F: Supply Side Interviews THE COMMON MARKET FEASIBILTY STUDY
Meat Sector
Focus Group Date
March 27, 2007
General Information
Question 1. How long have you been farming?
Question 2. Where is your farm located?
Question 3. Is farming your full-time (or primary) occupation?
Question 4. Briefly describe your farming operation
Question 5. How much land do you farm?
Question 6. Is your farm currently operating at full capacity?
Question 7. Do you have plans to expand (or contract) your farming operations in the near future?
MEAT FARM 5: Family has been farming for many years but I got in a few years ago. We are in the
Northwest corner of County 6. I farm part-time raising pastured hogs, beef cattle. I’m in the process of
selling the farm at this point so here to provide experience. I would like to keep going with hogs if I can
get a partner. I have less than a hundred acre[s of] farm that’s a mix of pasture and hay field. We’re
probably not at full capacity. More than ten acres is woodland. I’m not expanding with the current
operation but still interested in staying involved in pork. It’s a real noticeable product and you can really
tell the difference in pork when it's raised sustainably.
MEAT FARM 4: I’ve been on this farm x yrs. It’s located in County 5. Before that, I worked at my father’s
vineyard and thought I would never farm but now farming is my primary occupation. It’s a multi-species
grazing farming operation with poultry for meat and eggs, turkeys for thanksgiving, grass fed lamb and
goats. Less than a hundred acre[s on the] farm and farming 2/3 of it; the rest is brush and woodland. We
are not operating at full capacity. We are expanding 30% annually on average. This year I plan on
expanding but mostly trying to expand what we already offer and utilize what we have rather than
adding more livestock. Working smarter not harder.
MEAT FARM 3: We are x yrs in operation in another state. Farming is my retirement occupation and I’ve
never been busier. Myself, my wife, my daughter and her husband all work full-time on the farm. It’s a
diversified pasture operation- eggs, poultry, pork, lamb and beef (lesser on the beef) and its rapidly
expanding. We have less than a hundred acres and are only using about 4-½% of farm in winter because
of rotational pasture and only 7% in the summer of available land. We can get to 50% and still have
reserve land use without bad impact. We just completed a negotiation to buy another farm and

186 Appendix F: Supply Side Interviews THE COMMON MARKET FEASIBILTY STUDY
discussing buying and leasing other farms so that we can have a direct impact on the products raised
that we’re marketing. Currently marketing beef raised on other small farms in area. Last year the
majority of lamb and pork was from others, this year it will be ours.
MEAT FARM 2: I’ve been farming since I was old enough to drive a tractor. In my college years I worked
in Colorado and Montana for ranches as a wrangler and on cattle. My wife and I purchased our farm x
years ago. It’s located in County 7. I farm full-time and am a forester full-time. My time is split almost
evenly though my income is not. The farm is a grass based livestock operation where we raise, process
and market 100% grass fed beef, lamb, pork, pasture poultry, eggs and shitake mushrooms. We are
focused on direct marketing. We hold a farmers market The farmers market is the same as the poultry
pick up day and we share customers among farms. It’s an expanding and successful operation. The farm
is more than a hundred acres, half is wood lot and the rest is pasture. We farm organically (though
aren’t certified) and haven’t used chemical or additives in x yrs. We are not at full capacity; I don’t know
when one is. We are in the mode of expansion with the market side and the production side we are
trying to keep balanced.
MEAT FARM 1: I’ve been farming most of my life except for college. I’ve been involved in the pig
business x years, managing over a thousand sows for different companies. Current farm is right over the
line from County 8. MEAT FARM 1 is part of our family farm with my brother and my dad and I work for
that farm. The chickens are mine but the hogs are part of another farm. The pigs are raised in a deep-
bedded situation in an old PA bank barn. We grow hundreds of acres of wheat so we have the
advantage of cheap straw and pile up manure. Farming is my full time occupation, though the pigs and
chickens are less than 20% of time and the rest is driving the truck and hauling grain for the rest of the
farm. The farm is over a thousand acres all together, a lot of it is redded ground. MEAT FARM 1 is not in
full capacity in chicken but we are in pork. I might even cut back a little at this point just because I might
end up with x sows and the barn would be just that much too full and that’s a pain sometimes. The
chicken I can see expanding by 30% this year. Last yr we raised hundreds of birds and sold them all retail
at a couple farmers markets, 2-3 stores and 4-5 restaurants. If my heart lies in anything, it’s in the
Central Susquehanna Valley. The area has a real buy fresh buy local emphasis that seems to be taking
off, and with less expensive diesel fuel that seems to make it all the more exciting. I talked to a nonprofit
employee a lot and thought about going to Philly. We can cover a lot of that later but my point is I’m
starting to think more about my local community and work out that way. I’m not selling everything, I
took hogs to the auction this morning, but in the winter I sold x hogs to local people for butchering and
demanded and got the money I needed.
Products
Question 8. What is produced at the farm?
Question 9. What are the “marketable” products?
Question 10. What is the annual volume produced at your farm?
Question 11. Describe the volume in terms of seasonality.
187 Appendix F: Supply Side Interviews THE COMMON MARKET FEASIBILTY STUDY
Question 12. Are there specific production cycles that pertain to your operation or type of operation?
MEAT FARM 4: My volume is probably thousands of broilers a year. Last year had x lambs, x goat kids
(expansion with specialty with that) and some pigs direct marketed, x turkeys, thousands of dozen eggs.
Almost all of that was from June through November. Over the winter we are shifting our emphasis on
more lamb and goat products because no trouble doing that in winter. I thought I had to do everything
in season when there’s the opportunity to market it (in the winter the lane to our farm gets really bad).
For the CSAs that I work with, a number are starting to do winter markets and so I’m marketing lamb
through them. My big emphasis in expanding is finding products to market year round. Chickens are
whole (fresh or frozen) and I’m processing about x every week, on a certain day each week starting the
end of May. Lambs I can sell in half and whole but most of them are cuts. The goat kids I’m not sure yet,
I’m thinking about specialty meat with a specialty label- like specialty sausages but something that
doesn’t say goat on it. Turkeys are like chickens and strictly thanksgiving.
MEAT FARM 3: For eggs, we produce thousands of dozen[s] a year. A few thousand we sell on the farm
and most go to restaurants. It’s seasonal for numbers because colder weather lowers numbers. The
turkeys we raise and hatch our own heritage birds on farm. Hundreds last yr, when co-oping with others
we’ve done more hundreds or so last year. For the broilers we’ve produced hundreds. They are seasonal
through October and, co-oping with others, we can supply year round. Produced thousands last year but
sold many more thousands. We run the whole gamut from whole birds, whole steer, whole pigs and also
cuts. Eggs are dozen cases to restaurants (cases of 30, tried to get away from 15). The minimum order is
x dozen. For pigs, we birthed x last year on our own, had a total of about x and co-oped x. They’re not
really seasonal. We’re working on doing breeding in warmer weather rather than cold. We have x sows
now and hope to see more. Through experimenting with the lambs, we found out that we should put
the fence in front and let the lambs do hay mowing. We had a few groups of x brought in and harvested
at 100-120lbs. We had x last year and can do more this year. For beef, we had a limited amount of grass
fed beef. The jerseys marble out well at 18-20 months. They are smaller but we’re satisfied. They are
grass-fed and grain -finished (they have some grain access but are not feedlotted)
MEAT FARM 2: We produce grass-fed beef, pasture poultry including boiler chickens and turkeys, free
range eggs, wood lot pork, and work with another farm on 100% grass fed lamb for us. We raise half of
the beef we sell from birth to finish, and as the markets have grown we worked with other farmers. All
of the products are marketable. We direct market so we don’t take anything to auction or sell as a live
animal or custom. 70-80% of the business is customer/direct or pre-ordered. But that is shifting because
we are working with a processor for the third year with labeling and retailing with stores and off the
farm at farmers markets. The poultry we process ourselves and work under exemption. We have x head
of beef cattle, x pigs, x lambs, thousands of broiler chickens, hundreds turkeys, and our chickens
produce x dozen eggs a day. For seasonality, the poultry is strictly June through November but with the
addition of a walk-in freezer are selling year round. We’re working on a wintering system with the beef
cattle (switching to hay to increase gains). The lambs are strictly born in the spring and processed in the
fall. Hogs we bring in for the spring, graze and harvest in fall but processing and selling pork year round
by working with other farms.

188 Appendix F: Supply Side Interviews THE COMMON MARKET FEASIBILTY STUDY
MEAT FARM 1: We produce pork and chicken. All cuts of pork are marketable, 6 kinds of sausage,
boneless chops, spare ribs, baby back ribs, etc. We keep the inventory balanced somehow. We do
ground pork and hams for Easter and Christmas. Right now everything is based on farmers markets and
restaurants (we have one restaurant that takes all our bacon, every piece). Everything we sell pork-wise
is frozen, we can’t deal with fresh. We get the pork done at a butcher in the area and they do a
magnificent job- everything is labeled, and we use their recipe. Hundreds of hogs a year. hundreds
chickens and going up this yr because of the restaurant. We have whole birds, ¼ birds, Cornish hens
(real niche), roasters (specialty one farmers markets with working people). Grow out of grass and
pastured. Brood inside. Someone processes the chickens for us. Our pork is market ready and we can
put it into any kind of pack you want right now. 2 8oz chops in a pack for retail but restaurants get it in
10lb packs and sausage in 5 lbs pack and other want loose, not roped and in casing. Restaurants are a
little “chippy.” They’re nice people and some are more high end than others but it doesn’t matter. The
lady taking all of our bacon and sausage just does a small breakfast tray. The chicken is seasonal, the
pork is year round. I always keep records of what sows are what and who’s breeding. Pork is available all
the time and have a set of pigs ready all the time. It’s not completely up to speed yet, I took x hogs to
the auction this morning and it bites the tar out of me but I have another group of pigs coming and time
marches on. Didn’t have to do that all winter long. Sort of custom deal. Use a butcher for local people,
not for resale. I would like to see us doing x hogs a week for ourselves and not have to sell any to the
butcher (live hogs off the loading dock). Our personal weight for the farmers market is 310-320. The
Berkshire breed (at least half) gets a little fat cover on them the end of it. That extra 75-100 lbs makes all
the difference. Some like them to be 260-270. But for fattening them up, $4 corn is not fun. Once they
get over 270, you see the feed covers go nutso.
MEAT FARM 5: Our product is pork in halves, wholes, and cuts. All are frozen and we do most of our
selling through farmers markets and direct sales. We have x pigs a year and can sell everything. Only
challenge is balancing out so that you don’t have a bunch of this and a bunch of that. We can sell
boneless loins and bacon like it’s going out of style, but let’s talk about ribs and other stuff. For
seasonality, we try to space it out with the frozen product throughout the winter. Not sure what else to
add.
Question 13. Wholesale Market readiness of products:
What do you produce that is market ready for wholesale trade? How so?
What do you produce that is not market ready for wholesale trade? What needs to be done in order
to make it market ready for wholesale trade?
MEAT FARM 3: We work closely with a butcher in the restaurant/retail cut business for x generations
and can prepare anyway the customer wants. We do fresh and frozen (for restaurants we’ll do large cuts
fresh and on occasion have frozen in case they need it before we deliver again). For retail cuts we will
package one steak per pack, 2 lamb and 2 pork chops per pack. They can be prepared and packed in an
industry acceptable manner. In wintertime we work through a distributor but fortunate to have a
processor in-state inspected with capabilities to do all packaging. We’re in good shape to present to
market. Now, if my butcher has a heart attack tomorrow, I’m in trouble. Deer season doesn’t impact us
189 Appendix F: Supply Side Interviews THE COMMON MARKET FEASIBILTY STUDY
because it’s not a big part of business. The long pole in the tent is the processing. We are seriously
looking at developing our own capability to butcher the pigs, lambs, steers and we’ll bring carcasses and
have our own processing facilities. We do have a slaughtering facility and do our own finishing. Yes and
no for market ready. Like if restaurants want frenched pork chops or lamb chops or in chicken, everyone
is looking for the airline breast (a skinless breast with one wing stub). We are looking into developing
capability with a processing center. It wouldn’t be on the farm but we would own and operate it
ourselves. We currently work with the neighborhood grocery store but the meat cutter is retiring in a
year or two. I do not cryovac for wholesale, it’s all in a loose plastic bag. All the beef is dry aged for 2-4
weeks, lambs a week, chicken 48 hrs. For pricing, I take whatever the base line price is or whatever my
cost is and what is going to restaurants is marked up x% and retail x%.
MEAT FARM 2: I am set up to do beef and pork and lamb. I work with 4 to 5 different butchers, 1 USDA
and restaurant customer and very ready for packaging. We’re doing it in different ways for restaurants
cuts, fresh, and frozen. The chickens would be the weak link in the wholesaling. Although we process on
the farm and have the flexibility with dress and cut, we work under exemption and are not allowed to
retail through a retailer without going through a USDA plant and I’m not aware of any plant in
neighborhood. Poultry processing is missing in our area. What we do is legal but I’m not sure if a retailer
could resell. I think they can buy and sell retail in the store as long as they don’t repackage them.
Fortunate to find a processor who’s certified organic, specializing in grass fed and nitrate free. Another
thing we’ve done well that’s related to all of this is pet food. Processing organs with lean meat and fat
and poultry. Local natural grass fed pet food is going for good prices.
MEAT FARM 1: Like the others said, the pork is probably market ready. USDA processed all the way
through. We’re not organic and probably never will be. We have a lot of ground and have corn, soybean,
etc. We have a person who buys the soybeans and processes them and we buy back. With the chicken,
my processor does it so I can sell it to a restaurant but cannot sell to a retailer without a subscription or
sign up sort of thing. The poultry business is crazy. Another producer is two miles from me and does
things I can't do. But I’m not worried and I think I can retail all the chickens I need to retail and be alright
with that.
MEAT FARM 5: We sell halves and wholes. Selling live animals cut anyway you want is always a
challenge. And we sell cuts at the farmers market. Do basically all the farmers market and don’t do any
other. In packaging we found size really becomes issue. Even selling ham ends, people don’t want them
that big. One thing to look at, particularly when a small business, is inventory and inventory control
(especially having more parts of the animal to sell than chops and loins). Figuring out how to control
inventory is essential for the little guy to survive. Also, a growing number of people are raw feeding their
pets so looking for organ meats.
MEAT FARM 4: In the last storm over the weekend I went to the pet expo and got a new customer about
that. So many people are doing raw food stuff. I was also talking with one of the CSAs about doing a pet
share. In terms of wholesale market readiness, I’ve spent the winter being really confused about that.
I’m doing a lot of wholesale without realizing it and I don’t have a price difference. I charge the most for
being at the farmers market but you can buy at the farm at same price I’m selling to the CSA. For
chickens it's the same way as anybody else in terms of what’s ready but I’m not doing chicken cut ups.
190 Appendix F: Supply Side Interviews THE COMMON MARKET FEASIBILTY STUDY
For lamb I could do anything, I’m not doing cryovac but my processor can. But I also think there’s a
quaintness of butcher paper and no one’s asking about cryovac and chefs didn’t want it because they
feel like it deteriorates the quality and makes it fragile.
An interviewer asks, in dealing with processors, see any limitations down the road?
MEAT FARM 3: I’ve been through at least 10 butchers, all good but their capabilities vary and the
storage space to hang beef or lamb is limited. The people I work with now have a lot of space and
they’re not going to run out anytime soon.
MEAT FARM 4: A butcher is where we live and deer season is a problem.
MEAT FARM 2: One processor was a restaurant distributor in wholesale and have toned down and
started to focus on custom and niche and have capacity. Have vehicles (I’m looking at a vehicle) and,
something for you to consider, there are great old butcher plants in these urban areas and if you could
ship sides on the rail, you could maybe use something like that.
MEAT FARM 1: Problem lies not in butchering but in processing. I have an offer from someone to do
everything but they didn’t want a mess of x hogs a week and losing ham and bacon.
MEAT FARM 5: At the farmers market, it’s a problem if you can’t look someone in the face and say for
sure “that’s my ham and that’s my side.” If I can’t do that than I’m not any better than a supermarket.
It’s very important to customers. The sides I’m not as concerned about. And not happy if bring in big
animals. The other issue with pork that makes it different from other meats is that when you’re curing
hams and bacons, everyone’s cure and smoke process is different, so consistency of product in a central
distribution center is not going to be there. Hams and bacons and some sausages are different.
?: One of the complaints I’ve heard forever, and heard in demand, is not just curing, it’s also the size of
the steak, thickness of cut and a lot of issues in centralizing meat in general.
MEAT FARM 2: In forestry, when you’re working with anything on a natural system, you want to reduce
it to all the same and chefs want consistency and breeders strive for consistency but we all know that
the same dame and same sire can produce a different animal.
Question 14. What resources do you have at your farm (or at your disposal) to prepare products for
market?
Do you have any of the following: packing line for produce, sorting, grading, storage, cooling,
refrigeration, and freezing facilities
Question 15. Do you participate in any certification programs such as organic certification, food-safety
certification, GAP certification, special product licenses (e.g., raw milk license), or any other regulatory
or voluntary certification program? Please describe.
MEAT FARM 2: We have cold storage and processing on the farm, cooling, refrigeration and freezing. No
certification. I’m in local food organizations but not certified at this time by anyone but our customers.
191 Appendix F: Supply Side Interviews THE COMMON MARKET FEASIBILTY STUDY
MEAT FARM 1: We have chest freezers at home holding our pork. I don’t foresee a big walk-in cooler.
The chicken run a lot through the processor and sell fresh (or freeze for next week if can't sell). We’re
not certified organic and probably never will be. We are antibiotic and hormone-free and can look
people in the eye and trust. Open as far as we’ve done as much farm business as we can but it can get
tricky. People come and look on the farm. No questions about GE seed for soy and corn. Lot of people
come and ask if its organic and we say its not but here’s why… and the people say that’s all we want to
know anyway. It’s a certain amount for pork chops and when people ask why it’s not organic, I tell them
the prices would double. There’s a price point.
MEAT FARM 5: People really want to know how it was raised and handled. When dealing with pigs, the
only thing keeping us from being certified organic is the feed. If I look at the feed costs for a pork chop,
you can’t pay me enough for that pork chop. We have freezers and a USDA stamp on seal is the only
certification. Organic is more of a marketing issue than a production issue.
An interviewer comments, in asking this question we wanted to get into GAP certification. But we
think there are only two people who can certify and some stores want to require it. Don't know if it
applies to animal growers.
Some in the audience didn’t even know what it was and who certifies it.
MEAT FARM 4: We have a walk-in. For poultry, we process on one day, everything is in the walk in
cooler until it's delivered and whatever is left by the weekend goes in to the freezers. Other meats come
back frozen from butcher. No certification.
MEAT FARM 3: We don’t process on the farm and I don’t want to. We have a poultry processor and the
butcher does the others. We have a walk in: the first half is the fridge, the second is the freezer. It will be
for sale when we get the new building up. We also have a refrigerated truck we are selling because it’s
too small. For certification, we also get the question with phone calls of people looking for organic. We
then explain that we do everything organic except for grain and tell them honestly. When we started,
we wanted the markets local and wanted to buy everything we can local. I’m a member of an old time
farmers club and they say they’re not using GMO stuff anymore because the yields are low and it didn’t
make sense. Using x tons of feed a month, it doesn’t make sense to ship in.
Marketing and Sales
Question 16. Describe how you sell the production from your farm?
• wholesale / direct retail trade
• sales handled internally at farm by owner, operator, employee
• works w/ external agents or brokers or other (e.g., member of wholesale cooperative)
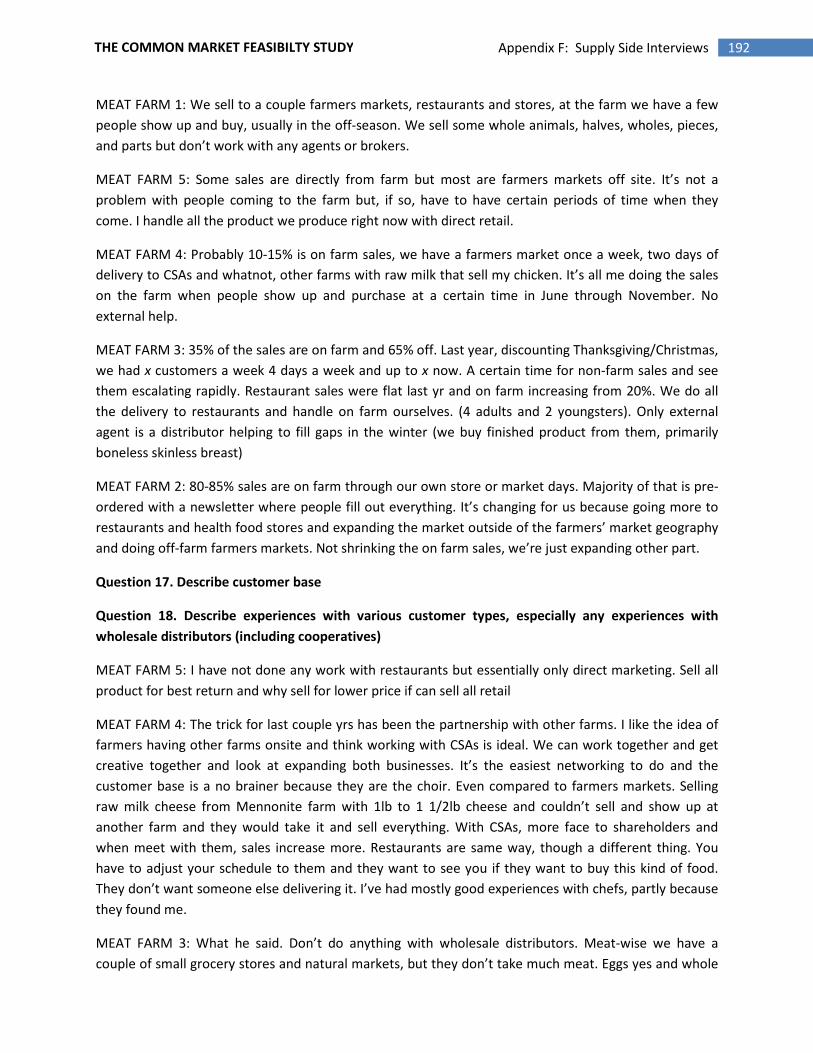
192 Appendix F: Supply Side Interviews THE COMMON MARKET FEASIBILTY STUDY
MEAT FARM 1: We sell to a couple farmers markets, restaurants and stores, at the farm we have a few
people show up and buy, usually in the off-season. We sell some whole animals, halves, wholes, pieces,
and parts but don’t work with any agents or brokers.
MEAT FARM 5: Some sales are directly from farm but most are farmers markets off site. It’s not a
problem with people coming to the farm but, if so, have to have certain periods of time when they
come. I handle all the product we produce right now with direct retail.
MEAT FARM 4: Probably 10-15% is on farm sales, we have a farmers market once a week, two days of
delivery to CSAs and whatnot, other farms with raw milk that sell my chicken. It’s all me doing the sales
on the farm when people show up and purchase at a certain time in June through November. No
external help.
MEAT FARM 3: 35% of the sales are on farm and 65% off. Last year, discounting Thanksgiving/Christmas,
we had x customers a week 4 days a week and up to x now. A certain time for non-farm sales and see
them escalating rapidly. Restaurant sales were flat last yr and on farm increasing from 20%. We do all
the delivery to restaurants and handle on farm ourselves. (4 adults and 2 youngsters). Only external
agent is a distributor helping to fill gaps in the winter (we buy finished product from them, primarily
boneless skinless breast)
MEAT FARM 2: 80-85% sales are on farm through our own store or market days. Majority of that is pre-
ordered with a newsletter where people fill out everything. It’s changing for us because going more to
restaurants and health food stores and expanding the market outside of the farmers’ market geography
and doing off-farm farmers markets. Not shrinking the on farm sales, we’re just expanding other part.
Question 17. Describe customer base
Question 18. Describe experiences with various customer types, especially any experiences with
wholesale distributors (including cooperatives)
MEAT FARM 5: I have not done any work with restaurants but essentially only direct marketing. Sell all
product for best return and why sell for lower price if can sell all retail
MEAT FARM 4: The trick for last couple yrs has been the partnership with other farms. I like the idea of
farmers having other farms onsite and think working with CSAs is ideal. We can work together and get
creative together and look at expanding both businesses. It’s the easiest networking to do and the
customer base is a no brainer because they are the choir. Even compared to farmers markets. Selling
raw milk cheese from Mennonite farm with 1lb to 1 1/2lb cheese and couldn’t sell and show up at
another farm and they would take it and sell everything. With CSAs, more face to shareholders and
when meet with them, sales increase more. Restaurants are same way, though a different thing. You
have to adjust your schedule to them and they want to see you if they want to buy this kind of food.
They don’t want someone else delivering it. I’ve had mostly good experiences with chefs, partly because
they found me.
MEAT FARM 3: What he said. Don’t do anything with wholesale distributors. Meat-wise we have a
couple of small grocery stores and natural markets, but they don’t take much meat. Eggs yes and whole
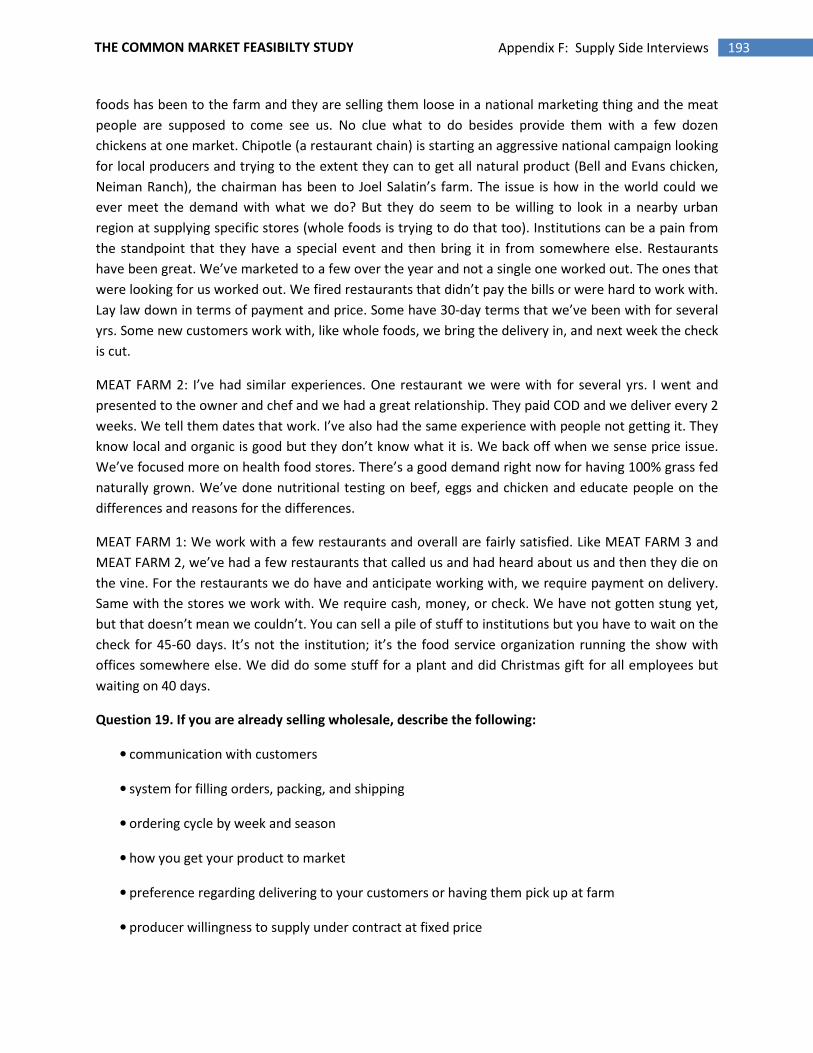
193 Appendix F: Supply Side Interviews THE COMMON MARKET FEASIBILTY STUDY
foods has been to the farm and they are selling them loose in a national marketing thing and the meat
people are supposed to come see us. No clue what to do besides provide them with a few dozen
chickens at one market. Chipotle (a restaurant chain) is starting an aggressive national campaign looking
for local producers and trying to the extent they can to get all natural product (Bell and Evans chicken,
Neiman Ranch), the chairman has been to Joel Salatin’s farm. The issue is how in the world could we
ever meet the demand with what we do? But they do seem to be willing to look in a nearby urban
region at supplying specific stores (whole foods is trying to do that too). Institutions can be a pain from
the standpoint that they have a special event and then bring it in from somewhere else. Restaurants
have been great. We’ve marketed to a few over the year and not a single one worked out. The ones that
were looking for us worked out. We fired restaurants that didn’t pay the bills or were hard to work with.
Lay law down in terms of payment and price. Some have 30-day terms that we’ve been with for several
yrs. Some new customers work with, like whole foods, we bring the delivery in, and next week the check
is cut.
MEAT FARM 2: I’ve had similar experiences. One restaurant we were with for several yrs. I went and
presented to the owner and chef and we had a great relationship. They paid COD and we deliver every 2
weeks. We tell them dates that work. I’ve also had the same experience with people not getting it. They
know local and organic is good but they don’t know what it is. We back off when we sense price issue.
We’ve focused more on health food stores. There’s a good demand right now for having 100% grass fed
naturally grown. We’ve done nutritional testing on beef, eggs and chicken and educate people on the
differences and reasons for the differences.
MEAT FARM 1: We work with a few restaurants and overall are fairly satisfied. Like MEAT FARM 3 and
MEAT FARM 2, we’ve had a few restaurants that called us and had heard about us and then they die on
the vine. For the restaurants we do have and anticipate working with, we require payment on delivery.
Same with the stores we work with. We require cash, money, or check. We have not gotten stung yet,
but that doesn’t mean we couldn’t. You can sell a pile of stuff to institutions but you have to wait on the
check for 45-60 days. It’s not the institution; it’s the food service organization running the show with
offices somewhere else. We did do some stuff for a plant and did Christmas gift for all employees but
waiting on 40 days.
Question 19. If you are already selling wholesale, describe the following:
• communication with customers
• system for filling orders, packing, and shipping
• ordering cycle by week and season
• how you get your product to market
• preference regarding delivering to your customers or having them pick up at farm
• producer willingness to supply under contract at fixed price

194 Appendix F: Supply Side Interviews THE COMMON MARKET FEASIBILTY STUDY
MEAT FARM 4: I try to get customers to call me but usually I have to call them, including the CSAs. I’m
not a high priority because they’re thinking of all they have to do. I do everything over the phone.
Restaurants are the same way- I have to call them. Chefs never call and I don’t expect them to. Different
timetable for restaurants. I don’t have a complicated system. I use QuickBooks for invoicing and
everything is on the computer. I don’t have a refrigerated truck, but I do have a pickup.
MEAT FARM 3: Evenly divided into three categories. Standing orders because tired of calling and try to
guess. 1/3 of them are finally calling or sending email (I prefer email) and those I have to call but they
are worth calling (several hundred $ deliveries). Weekly and biweekly deliveries. Certain weekday
deliveries. A limited number on one of those days. We do have a refrigerated truck. Do have occasions
where customers come to the farm- like if they need on a day beside regular weekday deliveries.
MEAT FARM 2: I use the phone mainly and email is becoming even more popular. We take orders by
phone or through the order form in the newsletter or on the Internet. We have an interactive website
and people can order right off the website and get a response with email. We enter it in a computer
excel spreadsheet and put in the orders by week. We have weekly, seasonal, and monthly deliveries
(flexible). We get our product to the market with a van and are looking in to a truck. Always prefer
people to come to the farm but that’s not always possible. We do add on a delivery fee. Wholesale
customers order by email rather than through website. The web is more for the individual and
wholesale restaurants and others on phone or email. Have deliveries in October to end.
MEAT FARM 1: I do everything over the phone. Some I retail direct to farmers market customers in the
winter (bimonthly delivery). On the wholesale side, some call us, and we call them (both stores and
restaurant). We don’t have a refrigerated truck. We don’t charge a delivery fee but the price is high
enough. We do have a wholesale price sheet though some guys said we shouldn’t. To look at pricing, I
took x% off of my retail price for my wholesale price. Not based on what I knew the costs to be, I priced
everything where I thought I could get people to buy, perhaps lower than I should have. I have had some
price resistance, but not a lot. Restaurants and stores have not really resisted. I’m not going really far for
delivery. The farthest I’m delivering to directly for a restaurant or store is 20-25 miles and hopefully can
hook some together on the same day. Some deliveries are weekly, some every other.
MEAT FARM 3: The price is not fixed in with standing order but my prices don’t fluctuate. If there’s any
significant change it might be in the area of beef around Memorial Day or Labor Day weekend. I take the
price at the butcher and mark it up x%. Around Christmas, the filet mignon out of sight and if marked up,
it would be unreasonably expensive. It’s expensive year round and I can’t keep it in stock. NY strip is
hanging in at less-expensive and can’t keep that in stock.
MEAT FARM 1: It’s great to see numbers but its location, location, location. I saw $7.95 half-gallon
organic raw milk.
MEAT FARM 2: In March we send out a newsletter with all the prices and fixed until next time. You have
to have some parameters.
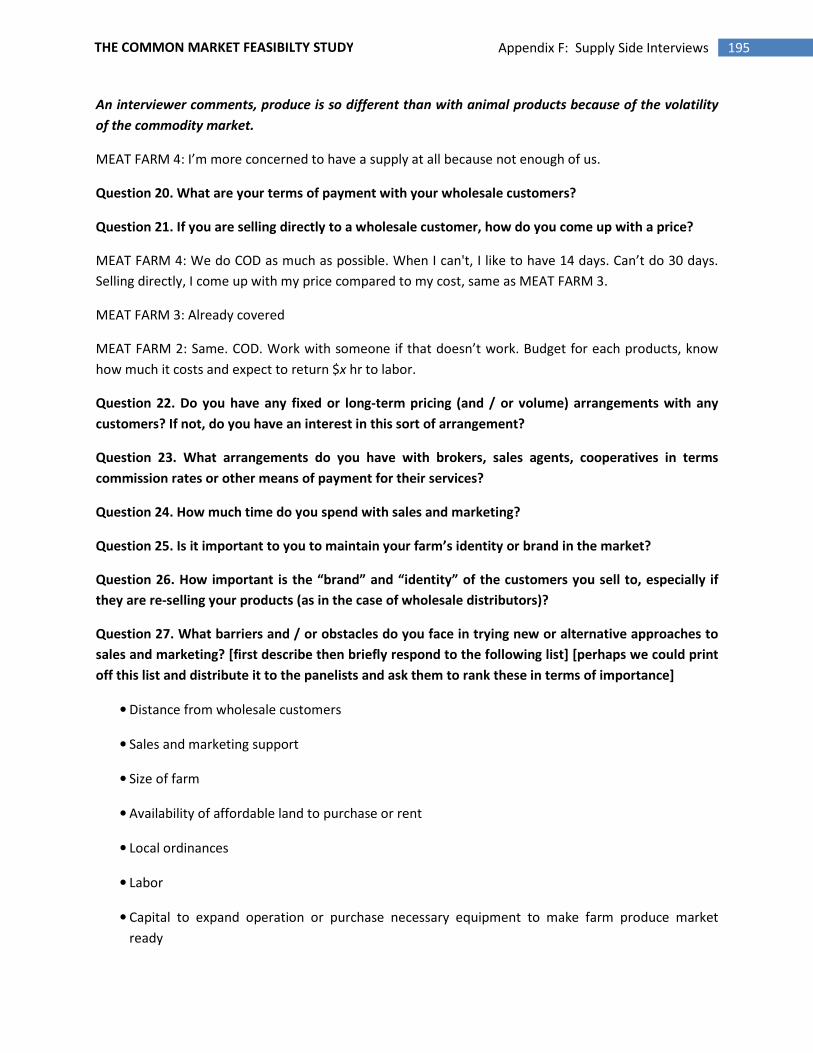
195 Appendix F: Supply Side Interviews THE COMMON MARKET FEASIBILTY STUDY
An interviewer comments, produce is so different than with animal products because of the volatility
of the commodity market.
MEAT FARM 4: I’m more concerned to have a supply at all because not enough of us.
Question 20. What are your terms of payment with your wholesale customers?
Question 21. If you are selling directly to a wholesale customer, how do you come up with a price?
MEAT FARM 4: We do COD as much as possible. When I can't, I like to have 14 days. Can’t do 30 days.
Selling directly, I come up with my price compared to my cost, same as MEAT FARM 3.
MEAT FARM 3: Already covered
MEAT FARM 2: Same. COD. Work with someone if that doesn’t work. Budget for each products, know
how much it costs and expect to return $x hr to labor.
Question 22. Do you have any fixed or long-term pricing (and / or volume) arrangements with any
customers? If not, do you have an interest in this sort of arrangement?
Question 23. What arrangements do you have with brokers, sales agents, cooperatives in terms
commission rates or other means of payment for their services?
Question 24. How much time do you spend with sales and marketing?
Question 25. Is it important to you to maintain your farm’s identity or brand in the market?
Question 26. How important is the “brand” and “identity” of the customers you sell to, especially if
they are re-selling your products (as in the case of wholesale distributors)?
Question 27. What barriers and / or obstacles do you face in trying new or alternative approaches to
sales and marketing? [first describe then briefly respond to the following list] [perhaps we could print
off this list and distribute it to the panelists and ask them to rank these in terms of importance]
• Distance from wholesale customers
• Sales and marketing support
• Size of farm
• Availability of affordable land to purchase or rent
• Local ordinances
• Labor
• Capital to expand operation or purchase necessary equipment to make farm produce market
ready
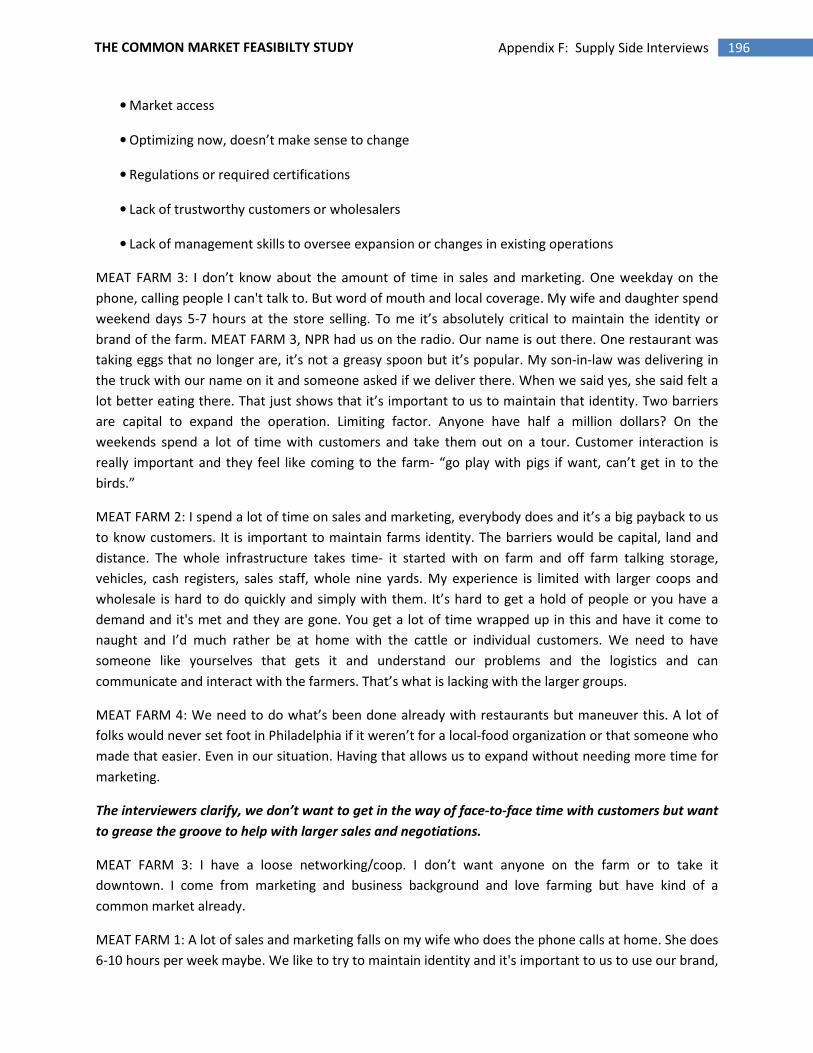
196 Appendix F: Supply Side Interviews THE COMMON MARKET FEASIBILTY STUDY
• Market access
• Optimizing now, doesn’t make sense to change
• Regulations or required certifications
• Lack of trustworthy customers or wholesalers
• Lack of management skills to oversee expansion or changes in existing operations
MEAT FARM 3: I don’t know about the amount of time in sales and marketing. One weekday on the
phone, calling people I can't talk to. But word of mouth and local coverage. My wife and daughter spend
weekend days 5-7 hours at the store selling. To me it’s absolutely critical to maintain the identity or
brand of the farm. MEAT FARM 3, NPR had us on the radio. Our name is out there. One restaurant was
taking eggs that no longer are, it’s not a greasy spoon but it’s popular. My son-in-law was delivering in
the truck with our name on it and someone asked if we deliver there. When we said yes, she said felt a
lot better eating there. That just shows that it’s important to us to maintain that identity. Two barriers
are capital to expand the operation. Limiting factor. Anyone have half a million dollars? On the
weekends spend a lot of time with customers and take them out on a tour. Customer interaction is
really important and they feel like coming to the farm- “go play with pigs if want, can’t get in to the
birds.”
MEAT FARM 2: I spend a lot of time on sales and marketing, everybody does and it’s a big payback to us
to know customers. It is important to maintain farms identity. The barriers would be capital, land and
distance. The whole infrastructure takes time- it started with on farm and off farm talking storage,
vehicles, cash registers, sales staff, whole nine yards. My experience is limited with larger coops and
wholesale is hard to do quickly and simply with them. It’s hard to get a hold of people or you have a
demand and it's met and they are gone. You get a lot of time wrapped up in this and have it come to
naught and I’d much rather be at home with the cattle or individual customers. We need to have
someone like yourselves that gets it and understand our problems and the logistics and can
communicate and interact with the farmers. That’s what is lacking with the larger groups.
MEAT FARM 4: We need to do what’s been done already with restaurants but maneuver this. A lot of
folks would never set foot in Philadelphia if it weren’t for a local-food organization or that someone who
made that easier. Even in our situation. Having that allows us to expand without needing more time for
marketing.
The interviewers clarify, we don’t want to get in the way of face-to-face time with customers but want
to grease the groove to help with larger sales and negotiations.
MEAT FARM 3: I have a loose networking/coop. I don’t want anyone on the farm or to take it
downtown. I come from marketing and business background and love farming but have kind of a
common market already.
MEAT FARM 1: A lot of sales and marketing falls on my wife who does the phone calls at home. She does
6-10 hours per week maybe. We like to try to maintain identity and it's important to us to use our brand,
197 Appendix F: Supply Side Interviews THE COMMON MARKET FEASIBILTY STUDY
maybe for greedy reasons but I like to know that my meat is in there and to look a person in the face
with it whether it’s a chef or a customer at a farmers market. Right now the main barrier to doing
anything is distance. I am over a hundred miles from 30th street station. If I come to Philadelphia, I have
to have a full truck down and need to bring some bucks home. I can’t come home with x, that’s not
going to happen. The good thing about the common market is that I could quickly see myself, not
expanding necessarily but not having to haul pigs to auction. Maybe take x% of production (x pigs a
week) but come home with bacon. I would love to have something within x miles of my house. I don’t
have all the time to be running and maintaining the truck.
MEAT FARM 2: I’m working with a salmon guy and we are carrying stuff in each other’s trucks. If he’s
going to Philly and we’re going to Philly, maybe we work together. Diesel fuel cost and growth of
regional market, maybe affects it.
?: You can have MEAT FARM 3’s old truck carrying your pork products.
MEAT FARM 5: Our sales for live animals are word of mouth or to people we’ve already sold to. Face to
face contact at farmers markets is the best selling and marketing that I do. It’s also all about the
educational process. Talking about brands and things like that: I grew up and worked in Philly, and
people take ownership in vendors at reading terminal market and the ability to put a face with a product
is incredibly important. People are looking for a connection and that’s what farmers are doing with
farmers markets and if you’re in wholesale where people don’t see you, you lose that.
An interviewer comments, as someone who buys wholesale, I have a connection with people I buy
from and the customers trust me as a reliable source to all of you and I think that can work if you do it
right.
MEAT FARM 5: I wasn’t being smart but saying need to have something so people know where product
came from (COUNTY of origin labeling)
Another interviewer comments, Some customers won’t care which farmer grew which product.
MEAT FARM 5: The barriers in the short term and long term: distance is a significant issue. Local
ordinance and local regulations and required certifications are a significant problem. Not sure of size,
MEAT FARM 4 only has so many hours in day and not younger, so labor could become issue at some
point depending on where you are in the stage of operation. Availability of land could change.
MEAT FARM 4: A lot of the same things as MEAT FARM 5 for the same reasons. My main concern with
regulations and requirements, even if we do get more processors, is who’s going to regulate them
because we don’t have the inspectors to do it. The majority of government employees are reaching
retirement age and not finding people to do it.
MEAT FARM 3: Like animal cutters and large animal vets- kids aren’t getting in to it anymore because
there’s more money in pets.
?: when cat kicks you its not a problem.
198 Appendix F: Supply Side Interviews THE COMMON MARKET FEASIBILTY STUDY
MEAT FARM 3: Restaurants trust them and our butcher to handle details. Local and don’t go out beyond
100 miles and trust me as a source.
Expectations
Question 28. What sort of services could a wholesale distributor offer in order to interest you in
working with them? (This can include sales & marketing services, facilities, packing, cold storage,
processing and / or other market preparation.)
Question 29. What terms of payment do you expect from a wholesaler?
Question 30. What are your expectations regarding problem and / or dispute resolution? (includes
quality issues, contractual disputes (i.e., price adjustments, changes in market situations, etc.)
Question 31. Are any of the following points important to you with regard to the customers you work
with?
• Ownership
• Legal organization that provides opportunity for vendor ownership such as a cooperative or
shareholder in other-than-cooperative legal structure
• Transparency
• Core values and mission
• Fair trade
• Terms of payment
Question 32. Describe how you would envision working with a wholesale distributor like the Common
Market
MEAT FARM 4: In a picture perfect world it would be the same kind of interfaces I’ve had with you as a
buyer. I call you and you call me and both of us have done our homework. You know the farms in region
and can call and say the possibility of you doing x amount per week and such and such a date and I know
that you need that. Terms of payment within 14 days would make me really happy.
MEAT FARM 3: agree with MEAT FARM 4
MEAT FARM 2: I would hope that you would have a staff that’s very energetic and knowledgeable with
people who are excited about the product and marketing it, who know of its health aspect and how
different systems affect quality and health and who could work together expanding value added,
processing, different type of packaging and how best to put the farmers face on the food. It’s not just
the market but also the education that would be the edge.
199 Appendix F: Supply Side Interviews THE COMMON MARKET FEASIBILTY STUDY
MEAT FARM 1: Cold storage would be great. 10-14 days on money because can't bank them, we’re not
Cargill and Monsanto. For the bottom, deliver sizable amount of product due to distance with identity to
farm, reasonably quick turnover and good terms on pay.
MEAT FARM 5: I can’t disagree with anything. Thing to add on is issue of looking at processing facilities.
Issue more and more of a problem as we go along. May be stumbling block. But if we do it right, can
only deal with frozen and when chefs want fresh or specialty cut, more volume to deal with may make it
easier to be more responsive to buyers.
MEAT FARM 1: If we had a common slaughterhouse we would have to maintain farmer identity through
that too, not looking at 100 of thousands animals a day. Have to turn that thing for investment. Like
can’t have 40 hogs a week.
MEAT FARM 5: No different than incubator kitchen. Have to look at how to be self-sustaining.
MEAT FARM 2: It also means everyone’s pork has their labels
MEAT FARM 3: With the scale involved that’s possible.
MEAT FARM 1: Can kill them and haul somewhere but afraid for interest just lose in big batch
MEAT FARM 2: How deal with organic in shed, pastured poultry, organic pastured poultry, etc.?
An interviewer says, I think people could look on website for ordering. Telephone is nice but would
want to have some sort of system.
And may limit the product that we sell. Perhaps we won't do any organic. Choice we have to make as
we flesh out business plan.
Also look at trends in industry and how affect
MEAT FARM 2: The trend is huge to local, fresh, getting to know how it was farmed and maybe not if it’s
organic but at least hear how raised. Very educated people ask questions like whether there is soy in
this, if its gm soy, if the grain to the hogs was organic. The market is growing rapidly with a lot of
educated within and lots scrambling trying to find the butcher and ruck. Problems and bright spots the
same, just a few more million people.
MEAT FARM 1: There are a sub niche of people willing to pay for organic, no GMO, etc. When
realistically look at what doing, if we’re going to move pounds, not going to do it organic. Organic
soybeans $x/bushel and not enough of it.
MEAT FARM 3: I just see it exploding. If someone said to me that this year’s average customer count
would be x (and it might be as high as x) I would say you’re out of your mind. In the last 12 to [1]8
months, maybe partly because of omnivores dilemma and other customers are just coming out of the
woodwork.
MEAT FARM 4: We send out a newsletter once a year and already have people proactively calling.
200 Appendix F: Supply Side Interviews THE COMMON MARKET FEASIBILTY STUDY
MEAT FARM 2: Fuel and energy costs work for us and against plus land cost and equip costs.
MEAT FARM 5: Doing a lot of thinking since long emergency, and hit it right on the head and it's not a
fad. Organic is the way we have to do it whether want it or not.
MEAT FARM 1: That’s true even in an area that’s not metro. Buy fresh buy local rep is doing a bang up
job. It’s going to go. If I can sell it within x miles of home, I’m not going to Philly. x miles is a long way.
MEAT FARM 4: There is an educated consumer base but there’s a huge amount that’s not. PASA is
looking at a strategic plan that is consumer base (not farmer) and possibly a benefit, like an employers
benefit package that they be members or like health and wellness program. That would be an explosion
of potentially educated consumers.
MEAT FARM 2: We need an explosion of farmers. People fired up. Success like this will bring people out
of the urban areas.
MEAT FARM 4: There are a lot of experienced interns working on farms now looking for their own land.
MEAT FARM 1: Looking into PASA people as knowledge base. Some people have sows and raise pigs but
don’t know anything. I’m glad to stand up for two hours and could for 2 hrs rattling on about it. There’s
not a knowledge base even for people doing it now. There’s always demand for a knowledge base.
MEAT FARM 2: Penn State had a meeting with PA meat producers on the weak link on processing side.
Had Penn State meat science guys, butchers and producers and the same problem came up- the
knowledge base is gone. Now we want young guy looking for work to walk in to a plant and say they
would love to learn how to butcher.
201 Appendix F: Supply Side Interviews THE COMMON MARKET FEASIBILTY STUDY
Vegetable Sector
Focus Group Date
March 22, 2007
General Information
Question 1. How long have you been farming?
Question 2. Where is your farm located?
Question 3. Is farming your full-time (or primary) occupation?
Question 4. Briefly describe your farming operation
Question 5. How much land do you farm?
Question 6. Is your farm currently operating at full capacity?
Question 7. Do you have plans to expand (or contract) your farming operations in the near future?
FARM 4: I’ve been farming all life but been farming on my own for x yrs on over a hundred acres in
southern County 1. This will be my x year farming FT. In terms of capacity, x of the acres are produce and
I would like to expand, I just need a good outlet. Also, I have x cows of beef cattle and had my last calf
past week. Will have x more heifers in the fall and would like to expand that too.
FARM 1: Been farming for x yrs. We’re n generation. We’re from another state. And that’s where the
farm is too. It is our FT occupation and we have a son who’s come back to the farm. We farm over a
hundred acres of hand picked fresh produce. Farm is about at full capacity right now. There are lots of
other farms around and don’t know if we’re looking to buy more ground.
FARM 2: My farm is located in another state and I’ve been farming for x yrs. It is my FT occupation. The
land is certified organic vegetable farm, over a hundred acres total with x acres of vegetables and x of
hay. I think we are farming at full capacity- some hay could be vegetables but we use it as rotational
right now and it buffers everything. As a whole the farm is changing and redirecting but we are not
necessarily expanding and contracting. We do want to sell more locally.
FARM 3: I am the administrator for a co-op of x farms in County 1, the majority of which are small and
family owned. x are certified organic produce. Wholesale produce with twice-weekly deliveries to two
urban areas. This is our x season in production and we have brought on x new members in 2007. For
capacity, we will be expanding but want to be cautious about growth as well. There is a lot of potential
for growth. Besides produce, we also carry meat, cheese, poultry, and dairy products. The average farm
size varies- one is almost a hundred acres and another is just a few.
202 Appendix F: Supply Side Interviews THE COMMON MARKET FEASIBILTY STUDY
Products
Question 8. What do you produce on farm?
FARM 4: We produce everything in the vegetable end and currently sell wholesale in farmers market in
Philly. We grow strawberries, lettuce, raspberries, green beans and peas- pretty much everything you
can get. We’re putting in peach trees this year and also grow grain crops and hay. I’m a conventional
farmer but thinking about shifting gears. I didn’t do a lot of spraying last year and want to look more into
the organic side and protect interest more than just not spraying. I have two greenhouses- one small
and the other for growing tomatoes in. Also, my parents have two greenhouses. They plant flowers in
the spring but I can use it in the fall, especially for farmers markets. Strawberries come in the beginning
of May, about the first week. I grow on plastic and cover with row cover so start a little bit earlier than
other farms.
FARM 1: We are a sustainable, IPM, drip, no-till farm. We grow sweet corn, tomatoes, eggplants,
peppers, turnips and pumpkins. Don’t have any high tunnels but the location gives us an earlier season
than PA. We start picking strawberries the first of May and tomatoes and corn before the 5th of July.
Our area is close to river and extremely sandy, so it warms up very quickly.
FARM 2: I start with greens (kale, collards, chard, lettuce) then strawberries, tomatoes, peppers,
eggplants, zucchini, yellow squash, and green beans. Haven’t grown carrots but going to try them again.
There isn’t anything we don’t grow (except we don’t have okra). We do have hay. No season extenders
yet but plan to because our location is colder than here.
FARM 3: Our farms grow the whole spectrum. They are mostly diversified farms now specializing in
what’s best for soil. Have everything from raspberries and strawberries, to a tree fruit farmer that’s IPM.
For season extension, it would be great if more farmers looked into that. Right now among our farmers
there are 3 greenhouses that are solar passive and do produce year round things like lettuce mix (even if
in thin supply) and working on building that. One farmer has plastic laid.
Question 9. What are the “marketable” products? What’s market ready in terms of wholesale?
FARM 2: Everything I grow is market ready and packed by USDA standards with stem tags, stickers, twist
ties and in a marked box. I really don’t wholesale potatoes and onions because I save those for
restaurant customers and others.
FARM 1: We don’t put stickers on so those are not supermarket ready. But everything is washed, graded
to quality/size, boxed and palletized except for sweet corn, which goes in bins or lugs to roadside stands.
FARM 4: Wash and package everything we grow and can grade it. I would like to grow some more celery
for wholesale into the fall. Tomatoes and peppers also like to wholesale more of. The little knickknack
stuff that’s extremely labor intensive is where you run in to issues.
FARM 3: We grade and box everything according to standards set out by Tuscorara Organic Growers.
Looking in to getting stickers and tags with pLUs based on Whole Foods meeting.

203 Appendix F: Supply Side Interviews THE COMMON MARKET FEASIBILTY STUDY
Question 10. What is the annual volume produced at your farm?
FARM 1: Every year it varies greatly. This past year, we had tomato crop on x-acre fields. x did great, x
didn’t. Overall we had thousands of boxes tomatoes, thousands of eggplant, thousands of peppers,
thousands of pickles (kirbies in June with a sizer that sizes them). Turnips thousands of bags.
Cantaloupes, watermelons and pumpkins we sell by piece and sold about over a thousand watermelon,
over a thousand cantaloupes and thousands of pumpkins
FARM 4: Last year sold thousands of tomato[es], peppers, strawberries, hundreds of raspberries.
Planting x peach trees next week.
FARM 2: I sell x pallets of tomatoes week, x pallets of eggs, x of peppers, x bins watermelon and the year
before x. Fluctuates a lot. x-pallet truck we send out x times a week and it’s filled. This doesn’t include
CSA or other market
FARM 3: I don’t have a good handle on volume amounts. I know the volume dollar wise because I do the
books. x-pallet truck, ¾ full in summertime in the heat of growing season (first year) and not all produce
Question 11. Describe the volume in terms of seasonality.
Extract from products
Question 12. Are there specific production cycles that pertain to your operation or type of operation?
Can skip
Question 13. Wholesale Market readiness of products:
What do you produce that is market ready for wholesale trade? How so?
What do you produce that is not market ready for wholesale trade? What needs to be done in order
to make it market ready for wholesale trade?
Question 14. What resources do you have at your farm (or at your disposal) to prepare products for
market? Do you have any of the following: packing line for produce, sorting, grading, storage, cooling,
refrigeration, and freezing facilities
FARM 4: I have a washing line. Putting a limited refrigeration walk-in in this year, no freezing, root cellar
but not high tech
FARM 1: Have a packing line for produce, wash all produce in corronated dip tank- pick in to low plastic
bins and submerge in heated water, chlorinate, wash and grade. Have a walk in cooler. We put it in last
year and don’t typically put a lot of things in there. Mostly pick, pack and go out. Things in cooler are
usually the things saving for customers that won't go out that day or corn picking that goes out to
tailgate market the next morning. It has come in handy. Have loading dock that tractor-trailer can go up
to. Not doing pre-cooling. Does go through a grading system.
204 Appendix F: Supply Side Interviews THE COMMON MARKET FEASIBILTY STUDY
FARM 2: We have all of the above except for freezing. Packing lines, cooler (x pallets maybe more),
storage, x cooler[s], loading dock, electric pallet jack, forced air: pulls air in cooler to get heat out and
does 2 pallets at the time. Pre-cool with specific crops to hold for market and have to get field heat out
to hold for longer. Ice machine for leafy greens as well.
FARM 3: At the co-op warehouse have storage, 2 walk ins, refrigerator, but no freezing facilities.
Packing/sorting/grading is done on farm so not familiar with procedures but does happen. Have ice
machine. Farmers have collectively looked at hydro coolers so it is something we’re talking about for
greens and lettuce but there’s the issue of getting product to our biggest customer, who is in Florida
(small retail store owner)
Question 15. Do you participate in any certification programs such as organic certification, food-safety
certification, GAP certification, special product licenses (e.g., raw milk license), or any other regulatory
or voluntary certification program? Please describe.
FARM 3: All of our produce growers are certified organic by PCO, or local organic alliance or others and
certification is a requirement for being in the co-op. Also have raw milk licenses and x farmers applying
for bottling licenses for milk. According to co-worker, we are looking in to GAPS
FARM 2: certified organic
FARM 1: We don’t have any certifications, but I think we could pass a third party audit because when we
looked into joining a statewide growing group, a guy came on the farm to look around and check it out.
FARM 4: I don’t have any certification but don’t have any reason to believe couldn’t pass. I looked at
some materials about requirements and think I could pass.
Marketing and Sales
Question 16. Describe how you sell the production from your farm?
• wholesale / direct retail trade
• sales handled internally at farm by owner, operator, employee
• works w/ external agents or brokers or other
FARM 2: For wholesale sales, I call the buyers or they call me and I send them my availability sheet and
they place an order. I’ve been doing this a long time so I know who’s going to buy usually and don’t have
problems selling. All the sales and marketing falls on me. I do not work with any brokers and have
actually asked Whole Foods to not be a national vendor and to go directly to the local warehouses. I do
sell to an organic food distributor and did sell to large regional distributor but they have gone by the
wayside. Sold on conventional market through several wholesale distributors in a town and have
receivers who have approached us but we’re not interested.
205 Appendix F: Supply Side Interviews THE COMMON MARKET FEASIBILTY STUDY
FARM 1: 50% of the farm's sales is at a produce auction and the Philadelphia Distribution Center and
40% is direct wholesale to farm stands and small stores. Remaining 10% we retail through small
markets. One of us handle[s] all the wholesales that happen from the farm but it’s different at auction or
other market. At the terminal market (Philadelphia Dist. Center), is it sold as local produce or go into
general pool? I don’t know. I can’t say I know what they do with it but I do know the commission is very
high and we don’t know what we got until we get the check. Capitalize on the name. Sometimes the
person at the terminal will hold on to it too long trying to get the dollar. The auction is a co-op so the
farmers own in to it and pay 4% commission but get a dividend back. It has in-house sales and
connections could be made with this group and them. Don’t have to go in and buy a truckload. One
person's job is to look for customers of all shapes and sizes who may be able to pick up specialty items
and help in jams. Your group should talk to him and all the auctioneers in the area. It has the ability to
force air-cooling, do hydro cooling, and has a variety of produce, could probably get something specially
packed and make connection (with the Common Market). A lot of farmers want to take their products to
the block and sell and that’s it. There are guys [a] broker can call and say, give me 15 boxes of this by
3pm and I’m not sure the group couldn’t do that. I believe in the auction system and rather keep the
auctioneers between brokers and me. I bet over half of products that go through the auction with slips
doesn’t go through the auction but through the automated auction. You can fax the load slips in and
deliver to docks. I think that’s a fair and cheap way to sell. The auction can give you high highs and low
lows but it's good for guys that can’t do the marketing and are just focused on growing.
FARM 4: 80% of my operation is direct retail that I sell at farmers markets and the other 20% I sell to
restaurants directly and excess I sell at a produce auction. I don’t like the auction because I don’t believe
its fair in that area and would like to cut it out. The mentality is to get $2/box for tomatoes and, if you
want to get $1000/wk, you take twice as many. It seems like people are willing to work for nothing and
the auction is willing to support the habit. Also, I like to have my name go with stuff and when I sell it
there, I can’t have that. It might be different at the auction if I wasn’t just taking overflow and they knew
me
FARM 1: Since they’ve automated the Auction and buyers know our name, we fax in the load slip, they
auction it and we go down in unload trucks. (Common standard to pack to?) We have to tell them the
count, grading and size to ensure consistency among growers for farmers. I can put a 50/55 count, I can
go in with 112 boxes and first buyer can buy what want and I can also put a minimum on things.
FARM 3: At the co-op, 80% wholesale and 20% csa. We sell to restaurants, small natural food stores and
occasionally sell pallets to Whole Foods in a couple areas and to the regional distribution center
occasionally. Our Florida customer has a store and restaurant that specializes in organic and that is a
direct sale, not through a broker or business.
Question 17. Describe customer base
Question 18. Describe experiences with various customer types, especially any experiences with
wholesale distributors (including cooperatives)
Question 19. If you are already selling wholesale, describe the following:
206 Appendix F: Supply Side Interviews THE COMMON MARKET FEASIBILTY STUDY
• communication with customers
• system for filling orders, packing, and shipping
• ordering cycle by week and season
• how you get your product to market
• preference regarding delivering to your customers or having them pick up at farm
• producer willingness to supply under contract at fixed price
FARM 2: Anyone I’ve had difficulty with has been eliminated as a customer. I’m not doing business if I
begin to have to borrow or steal to do it and I don’t want to bad mouth anyone else. Wholesale produce
is nasty and I don’t want to deal with it. Everybody is trying to sell within a dollar of someone or other.
Regardless of the price for me, I want to go with market. It costs me a certain amount per box before I
even put anything in it yet people still expect me to sell at last year’s prices. Whole foods wants a 2
weeks out projection, want an order in a week out and get upset if they don’t get it. I can’t ship anything
that’s not perfect to Whole Foods because it comes home. Primarily we do the deliveries but have had
some pick up. Only thing wrong is if they pick up and there’s a problem, I have no recourse. I have done
a fixed price contract and will never do again. It wasn’t horrible but I don’t think it really benefited me. If
it was within a few dollars of the current market, it may be different but it’s no different except that
when prices get extreme, buyers hold back. I’m very interested with Whole Foods and seeing if farmers
will get slammed- paying for it to go down and come back if its not perfect. If they turn it down at dock
and you think its right, you can call for USDA inspectors. Whole Foods is fair but their biggest thing is
size- they like a 24 count cucumber not a 23 or 25. If they open the box and 4 are wrong, they can put it
right back on the truck. If the color of the tomatoes is wrong, they’re going right back on the truck.
Whole foods has a nice idea but farmers are going to get slammed. They put perfect produce on the
shelf and so the customers are going to look for the best things. Give them all perfect stuff and give my
restaurant, CSA and farmers market the “garbage.” Whole Foods will tell you what they will pay you and
you can take it or leave it. Negotiated at times but they will usually just pay wholesale price. Another
grocery chain also- came in and took pictures of me and said they wanted to buy local. I got paid late;
they didn’t respond but still put my pictures up and only called me when the picture broke. They tell
everyone who walks in there that I’m there and I’m not. There are other local grocers stores I would like
to sell to but I don’t have time to deliver it at that volume- even if they start ordering same thing at 10
more case. Could deliver to smaller and local. A value-oriented operation like you’re proposing with the
Common Market would be a solution to me. Whole foods is fine and I applaud your efforts and maybe
could be a distributing point going to them but I’m slowing down the wholesale stuff and need to be
paid for something that I have. Knowing what I know, I would have a csa and other projects and keep
food here. Once I shipped stuff to Texas and had to eat the cost of everything on there and pay for the
shipping and charged to repack it. For communication with customers, it’s usually phone calls and
emailing them. Usually mix of them calling me and me calling them but has to be gone a few weeks
before ready to deliver.
207 Appendix F: Supply Side Interviews THE COMMON MARKET FEASIBILTY STUDY
FARM 1: The customers we deal with on the farm are for corn and or tomatoes/cantaloupe. People
place a call-in nightly and order what they want for tomorrow. They start picking early in the morning.
For tomatoes and peppers, when they call in an order I write the name on a dry erase board and
calculate from what was picked. The bulk of stuff gets picked, packed, and sent to auction or Philly. Have
an x ft truck with x pallets and use to deliver. We will deliver to some roadside stands or small stores but
mostly they pick up. We don’t have a refrigeration unit on the truck. We don’t hold anything so we don’t
need to cool the truck. For fixed price, we only did it one other time with tomatoes and it didn’t work
out. In the spring we had settled in to x amount of dollars and it worked when the market price was
higher but when the market was cheap they “did a taste test and didn’t like it” so they left. However, we
do have a fix price on sweet corn and get good money wholesale. White, super sweet, corn from the
region has a local reputation so people are willing to pay x cents ear, x cents in ear. Prices for tomatoes
sold out of the yard- $x/box at a town in a nearby county and can get down to $x. We will sell middle of
that but don’t do the extreme high or low. We’ve had good experiences with the auction, my husband is
happy with the auction, but Philly is questionable. We have to look at whether it was worth going here
(people say paid price there that doesn’t match the slip we got). The only problem with the auction is
getting turned down- every once in while it’s a question of where the farmers’ liability ends. Sometimes
brokers will say to us “hey, it didn’t go where I thought, can we work with you, etc.” One broker from
the auction bought eggplant and went to Florida to sell it. His secretary faxed the USDA report and he
had bought our number 2s and sold them as number 1. He bought the cheaper grade and sold it for the
upper grade. We’re talking here about keeping it local, not talking about someone getting it six days out.
Problem with the other system is that we want to know how it's handled and sold and want to keep our
name on box. At the Terminal market, we drop it off and it's left to commission. We don’t want them to
keep it up there for week and a half, and also don’t want them to send off grade stuff. He has no liability
at all except wanting to keep us as a customer. In terms of communication, for wholesale customers call
every day and we pick to order and they pick up the next time there. For the auction and the
commission house, we're not really dealing directly with brokers, just the office people at auction, and
we don’t usually talk to them as far as filling orders. Phone calls and they call us.
FARM 4: I don’t do a lot of wholesale selling; I used to do more but didn’t have good experiences.
Setting price didn’t work- sold at $x/flat and when it was cheaper at the produce auction they would get
them there. I don’t like contracts for anything, for example, a year ago people were contracting grain for
$x/bushel. I stored mine and saved it and sold it a month ago for almost double. I guess a contract is safe
but I’m more of a risk taker. Most farmers are risk takers, that’s why they’re farmers. For
communication, phone calls and emails. I like emails for wholesale because it’s more convenient, not
able to answer my cell phone when I’m on the tractor, plus it’s nice to have a hard copy.
FARM 3: On the whole we know who our customers are and they know who we are and we feel
comfortable working with them. If someone has a problem and can’t pay their invoice, they can call me
and explain. I know our customers are committed to buying local so we feel good and we know them.
We’ve also met so they have a face. We sold to Whole Foods and excited last year about that account
but then found out it’s not as easy as we thought. So we’re talking with them more- finding that they are
good for taking stuff when we have a lot of it. Also, we had a relationship with person in one state for
Whole Foods’ stores in another state and he would help move it. Difficult working with them because

208 Appendix F: Supply Side Interviews THE COMMON MARKET FEASIBILTY STUDY
have had some rejection of the product. We’re learning that we have to send them what’s perfect and
what’s perfect doesn’t always come out of our fields. But the farmers got a lesson in grading and that
was a good experience overall because want top-level quality for all customers. We also met with folks
in another state to see the operation there and went to the WF local summit. One thing we’re getting
out of Whole Foods, when the farmers are hearing what they want, they are understanding it. It’s
cultures meeting face to face. Success with last year was selling seconds and thirds and calling them
such on price list so restaurants and such could buy at a lower price. Online ordering system. Take
orders by phone and spend 2 whole days a week doing that. Both call and calling. Generalization about
online v phone ordering? Everybody does both and depends on what ordering. Dairy products slightly
different because customers know what they are getting week to week. Other products change every
week and every day have a shipment so it’s often better to have conversation but do send out price list
ahead of time that prompts people.
FARM 2: in finding the perfect product, x% culled out before go to whole foods as not marketable. Some
things culled in field, some go through packing shed and goes to csa customers, farmers market or
compost pile.
Question 20. What are your terms of payment with your wholesale customers?
Question 21. If you are selling directly to a wholesale customer, how do you come up with a price?
Question 22. Do you have any fixed or long-term pricing (and / or volume) arrangements with any
customers? If not, do you have an interest in this sort of arrangement?
Question 23. What arrangements do you have with brokers, sales agents, cooperatives in terms
commission rates or other means of payment for their services?
Question 24. How much time do you spend with sales and marketing?
FARM 2: Terms of payment: PACA standard. The hardest part is getting started with the first check and
then it's fine once they are in the system. I’m always trying to get more money from last year. I spend a
lot more time on sales and marketing with chit chatting, couple hours a week overall.
FARM 3: We have net 15 terms of payment and give a discount of x% if the customer pays within 5 days
and that has worked really well. In determining price- we look at number of different price lists and also
ask farmers what they need to get. We work with individual buyers for price depending on the volume
and adjust the price every week for produce. Sales and marketing is basically what the co-op does so I
would say I spend 40 hours on sales and marketing.
FARM 4: For terms of payment- 2 weeks pay. I come up with a price based on market prices for the area.
x% commission for stuff at auction. I spend more time this time of year than in the summer on sales and
marketing. I’m too busy in the summer. Few hours a week I’ll spend.
FARM 1: For payment-wholesale yard customers pay when they pick up, usually on a daily basis. The
auction is two and a half weeks out. Philadelphia varies greatly sometimes two weeks sometimes a
month. For price they shadow market prices but not as volatile on tomatoes. The auction is a x%
209 Appendix F: Supply Side Interviews THE COMMON MARKET FEASIBILTY STUDY
commission and Philly is x%. Produce auction is a co-op- so pay x% commission but at the end of the
year, take operating expenses out of pool and give back to farmers what is left. But you don’t get all of
that at once. I will get a letter in February with check for x%. The other x% is on hold for x yrs with
balance. That’s used as capital at the auction. Though only get x% do have to claim 100% in that tax year
and pay on it. When in another group had to pay so much as acre based on how much grow.
Question 25. Is it important to you to maintain your farm’s identity or brand in the market?
Question 26. How important is the “brand” and “identity” of the customers you sell to, especially if
they are re-selling your products (as in the case of wholesale distributors)? [How important is the]
integrity of the people [you are] selling to?
FARM 1: It’s very important for our farm's identity to be in the market. We try to achieve the standard.
It’s also important for our product to be represented by people that have integrity and not trying to sell
our number 2 as a number 1, for example.
FARM 2: It’s very important to maintain identity as personal piece and very very important that people
selling or reselling have integrity because not dealing with them.
FARM 3: Both are important. And working on building a brand.
FARM 4: Very important as well. Go through work to make sure high quality and want to make sure
maintained in the market.
Question 27. What barriers and / or obstacles do you face in trying new or alternative approaches to
sales and marketing?
• Distance from wholesale customers
• Sales and marketing support
• Size of farm
• Availability of affordable land to purchase or rent
• Local ordinances
• Labor
• Capital to expand operation or purchase necessary equipment to make farm produce market
ready
• Market access
• Optimizing now, doesn’t make sense to change
• Regulations or required certifications
210 Appendix F: Supply Side Interviews THE COMMON MARKET FEASIBILTY STUDY
• Lack of trustworthy customers or wholesalers
• Lack of management skills to oversee expansion or changes in existing operations
FARM 4: Distance to customers (within x miles), sales and marketing support (could be barrier
depending on customer), labor is extremely hard task for me to find (x guy[s] FT first year), lack of
trustworthy customers could be problem in that the second they could get something cheaper, they
leave.
FARM 1: Distance from wholesale not an issue and live in an area that could use everything grow[n].
Sales and marketing is something – we are maximized out right now and leaning heavily on the auction
for volume of stuff. Labor isn’t really an issue with picking. We house our own migrant workers but
could have problem with truck drivers or more skilled people. We are very dependent on our sons who
are leaving. Growing to maximum of what farm would allow and move product to different area.
Regulations and certifications are not an issue. Trustworthy customers and wholesalers always looking
for good strong relationships is something that is important.
FARM 2: Distance from wholesale customers is incredibly important. Could use help in marketing. I have
wiggle room for size of farm. My state is not a farmer friendly state. Labor is not an issue and I hire A2H
workers. Capital to expand could be a problem because don’t have a lot [of] wiggle room for things like
freezer, etc. Very careful but do have a lot of things already in place. I don’t get worried about getting
rid of what have but trustworthy customers are important- We have got burned hugely when had a
wholesale customer who went under and had thousands back owed to us that year. That sort of thing
has happened twice but concern was when we got burned big like that and would not be in business
today if not for father in law. Therefore we are very careful about going in to new business. It’s not just a
job, it is a lifestyle. It’s also why name and brand is so important. We are always reevaluating what we’re
doing.
FARM 3: The number one thing is time to try things out and then capital to expand. But we want to get
down consistency and quality of what we’re already doing before we expand. Sales and support, some
farmers have labor issues, think room to expand and can always bring on new organic farmers. Good
access to market through website and not looking there. Distance is manageable from us to Philly.
Expectations
Question 28. What sort of services could a wholesale distributor offer in order to interest you in
working with them? (This can include sales & marketing services, facilities, packing, cold storage,
processing and / or other market preparation.)
Question 29. What terms of payment do you expect from a wholesaler?
Question 30. What are your expectations regarding problem and / or dispute resolution? (includes
quality issues, contractual disputes (i.e., price adjustments, changes in market situations, etc.)
211 Appendix F: Supply Side Interviews THE COMMON MARKET FEASIBILTY STUDY
Question 31. Are any of the following points important to you with regard to the customers you work
with?
• Ownership
• Legal organization that provides opportunity for vendor ownership such as a cooperative or
shareholder in other-than-cooperative legal structure
• Transparency
• Core values and mission
• Fair trade
• Terms of payment
Question 32. Describe how you would envision working with a wholesale distributor like the Common
Market
FARM 2: Set up similar to the auction is interesting because farmers have a vested interest in going
forward and willing to put money where mouth is. Getting paid 2 weeks out, could squeak to 3 but
biggest problem is at the beginning of the year- pay early in the spring. Love something that would be
dealing with me and is like me and is not being nasty. Values that are brought to the business is
something that would encourage you to do business with us as opposed to someone else. Don’t care
about organic or not, but want someone to care about local. What can I do to help other farmers and
not get screwed along the way? Not everybody has someone else doing the marketing, like my husband
has in me. Looking for someone who can take some of the hats away from us and we can actually trust
you, that’s a whole another world and I’m almost afraid to trust it. Imagine if I could grow food for
people and they cared about it. Imagine if I could grow food for people. Imagine if I could feed
thousands of families with thousands of shares of a csa. Also, I’m starting a kale and collard project
selling for $x/bunch in inner city neighborhoods. Imagine if we set up a model where farmers were
always winning. Recreating some of the things and following what people want not what you want to
grow. How can I get rid of what I grow as close to my house as possible? How close can I keep it? And
my heart is really in nearby urban areas. I love PA but I feel like I’m jumping ship if crossing the state
line. I love the idea of the Common Market but we need it in my urban area too. Will I help you? Yes, if
you come to my city. I’m tired of giving my money away and if can meet consumer between wholesale
and retail, I’d be really happy there. Helping to make farming a viable profession. No cannery on the east
coast that will custom pack for you.
FARM 1: I’m excited about the thought of produce staying local. Philly is a huge market and just getting
farms into more places is very exciting. We are not unsuccessful in what we’re doing but we don’t
always like the idea of our stuff going to Canada and Florida and want to keep stuff in the area. It’s the
whole bigger picture including the environment. What we need most is sales and marketing service- we
can’t do everything and working really hard to do the growing thing. Other thing I’m interested in is the
processing. For example freezing corn. We don’t grow tons of it but freezing is a great way to deal with

212 THE COMMON MARKET FEASIBILTY STUDY
seconds and seasonality. There’s pressure for farmers to sell and it's getting worse and worse and to
stay in farming, it has it be profitable. The co-op model does appeal- not opposed to that but did hear
talk of buyers co-op as opposed to growers and I don’t have enough understanding of business models
and how they work. Comments about core values, mission, etc, just have integrity to know that. People
should put in the box what it says on the box.
FARM 4: In County 1, there are so many places with houses where there used to be farms. My farm is
preserved and starting to work on more lumps of land. Similar thoughts as everyone else. Main concern
is that everyone makes a fair income but don’t like dealing with someone who wants to rob you of every
last penny they can get out of you. Interested to see how this could work out and decide who buy from
and not buy from. It could be hard to get consistent quality from everybody. And interested to see how
it would work to maintain integrity and brand throughout.
FARM 2: Stall some of products means in long run getting money in spring where need more because
getting money in the winter.
FARM 3: I don’t know what the expectations are for this because coop customers are already customers
and buy directly from us and not sure where we fit in to Common Market model. My concern is that the
common market is one more step from farmers to customers and face-to-face contact is important to
success of business. Do think processing plant would be interesting because we don’t have capital for
that and something that has come up in the meeting. Good to add value to it.
Talk of competition and interest by all in finding ways to have complimentary competition and working
in ways that serve the market and different pieces of the market and work for the ultimate good for
farmers as well.

213 Appendix G: Architectural Design and Analysis
Products
THE COMMON MARKET FEASIBILTY STUDY
Appendix G: Architectural Design and Analysis Products
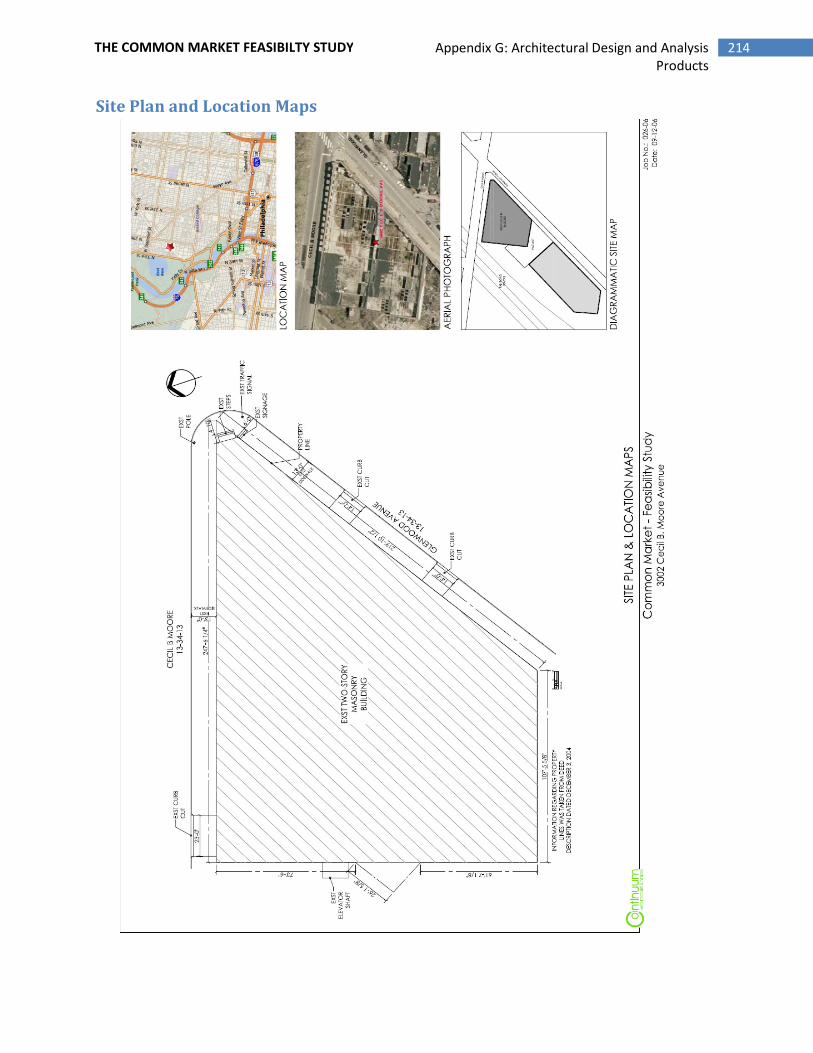
214 Appendix G: Architectural Design and Analysis
Products
THE COMMON MARKET FEASIBILTY STUDY
Site Plan and Location Maps
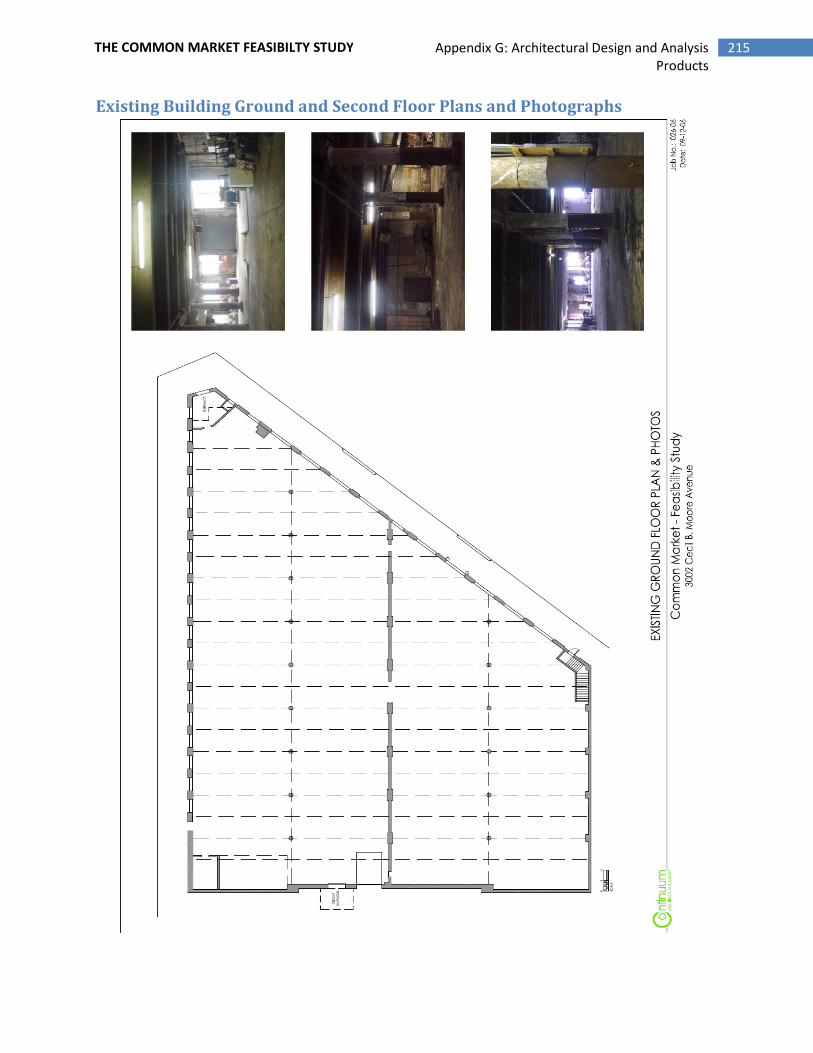
215 Appendix G: Architectural Design and Analysis
Products
THE COMMON MARKET FEASIBILTY STUDY
Existing Building Ground and Second Floor Plans and Photographs
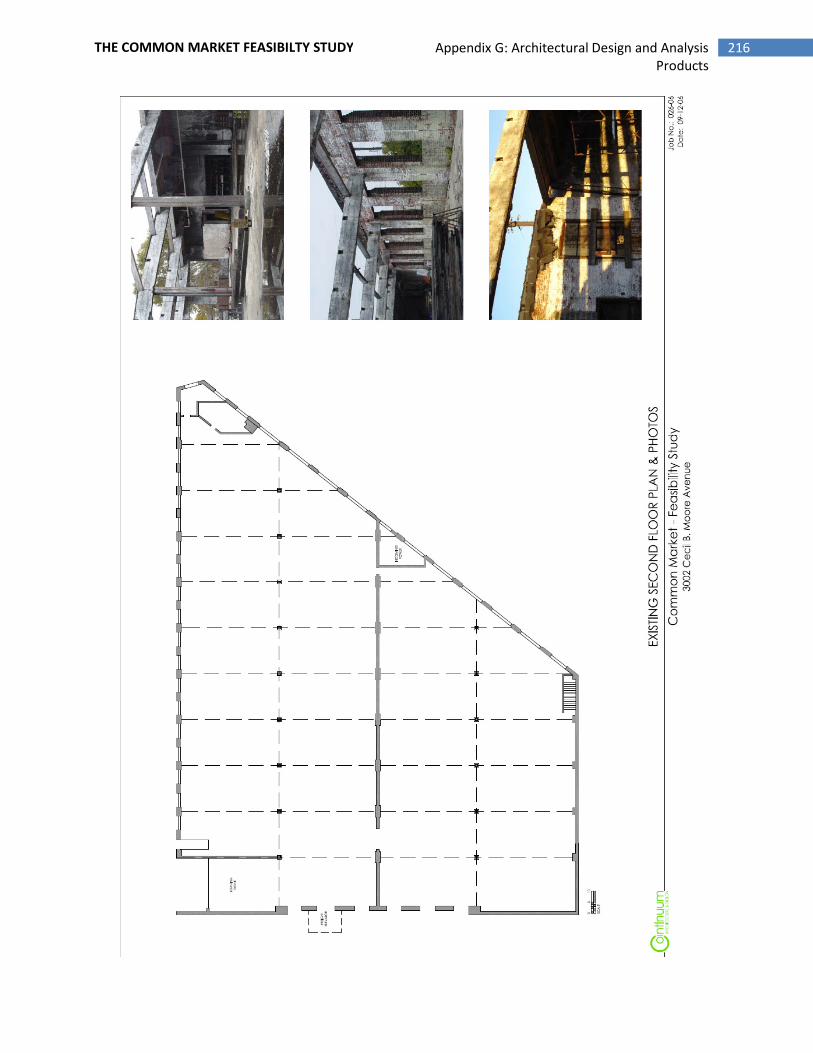
216 Appendix G: Architectural Design and Analysis
Products
THE COMMON MARKET FEASIBILTY STUDY
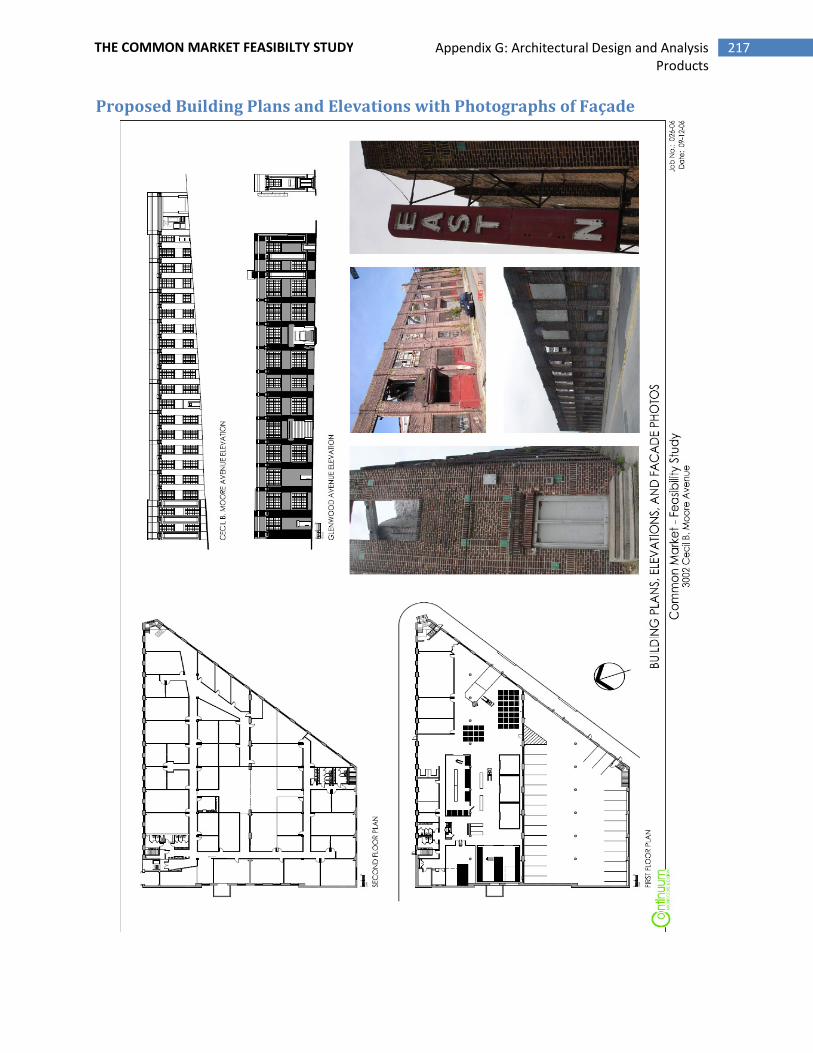
217 Appendix G: Architectural Design and Analysis
Products
THE COMMON MARKET FEASIBILTY STUDY
Proposed Building Plans and Elevations with Photographs of Façade
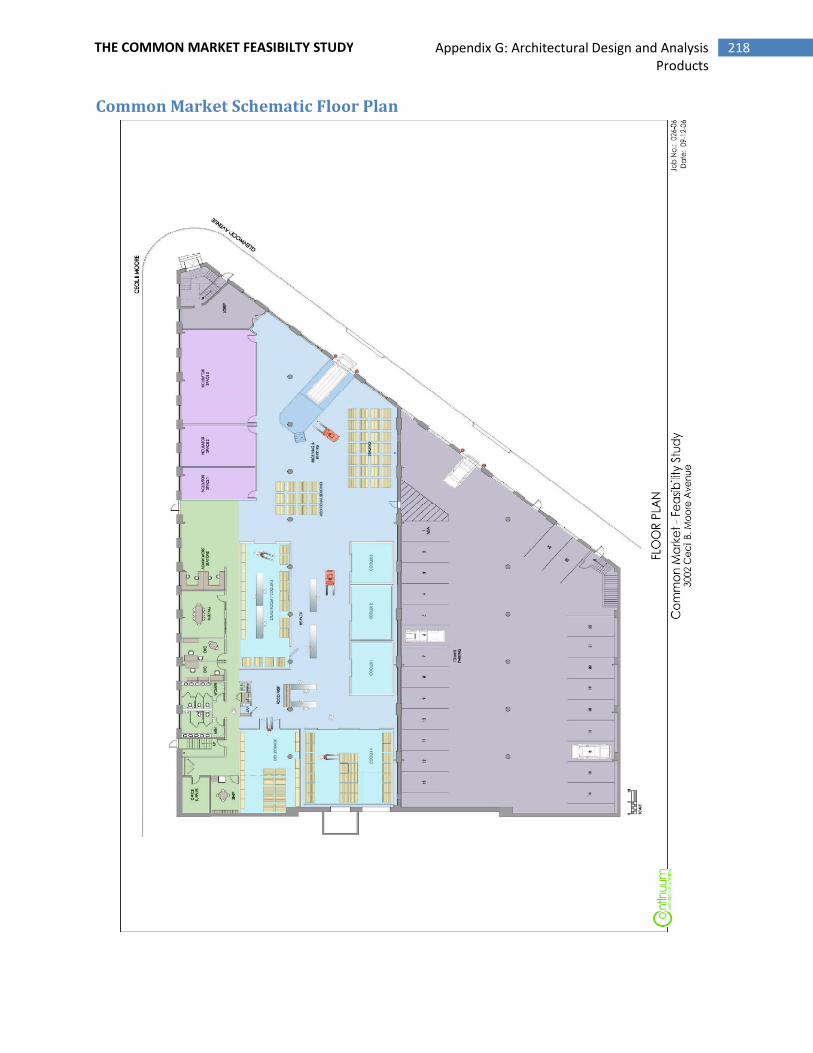
218 Appendix G: Architectural Design and Analysis
Products
THE COMMON MARKET FEASIBILTY STUDY
Common Market Schematic Floor Plan
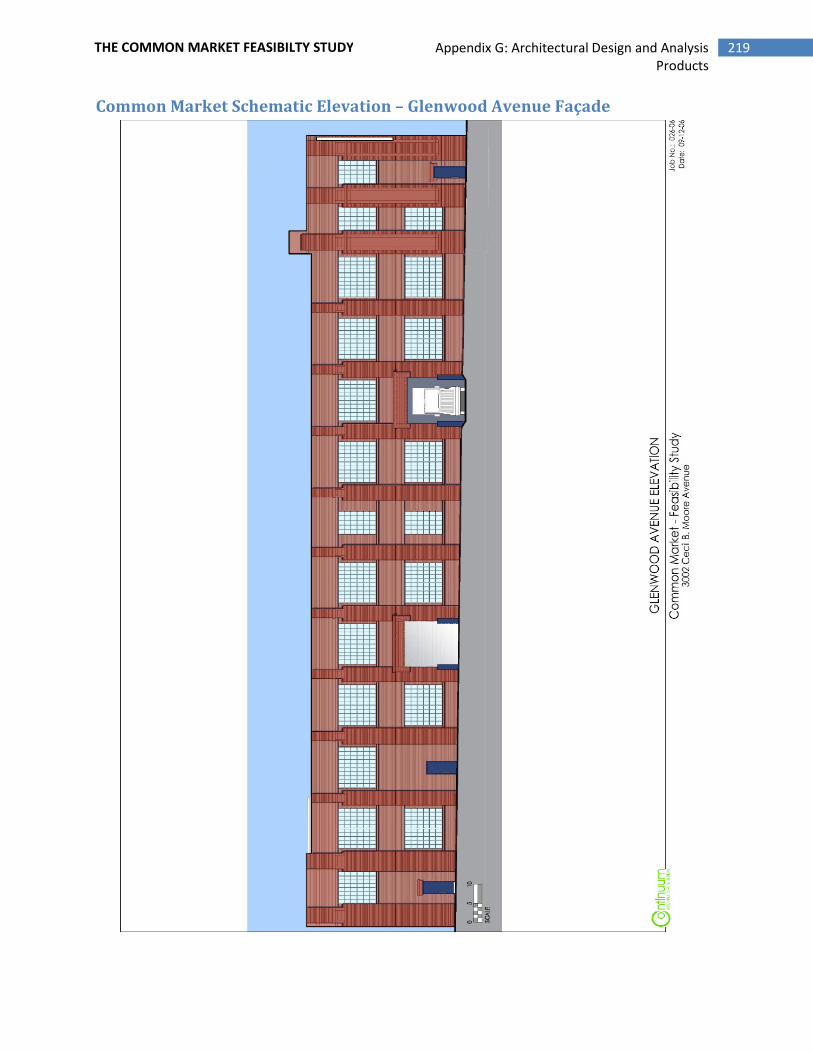
219 Appendix G: Architectural Design and Analysis
Products
THE COMMON MARKET FEASIBILTY STUDY
Common Market Schematic Elevation – Glenwood Avenue Façade
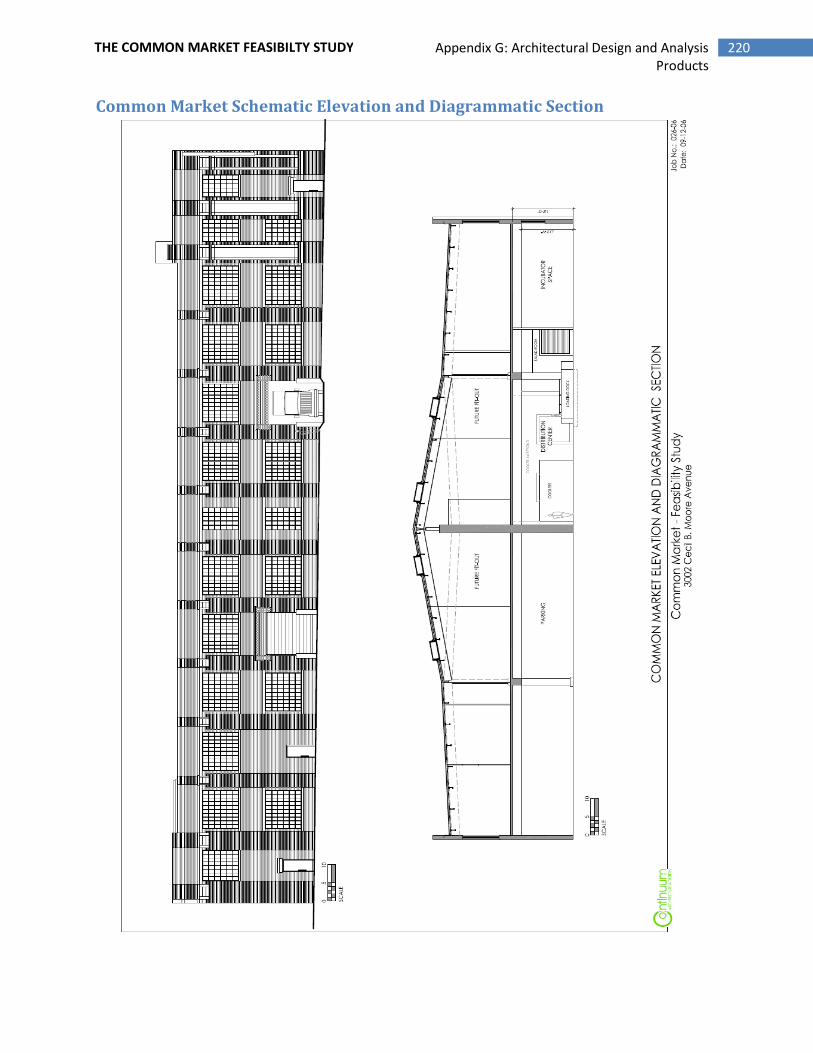
220 Appendix G: Architectural Design and Analysis
Products
THE COMMON MARKET FEASIBILTY STUDY
Common Market Schematic Elevation and Diagrammatic Section
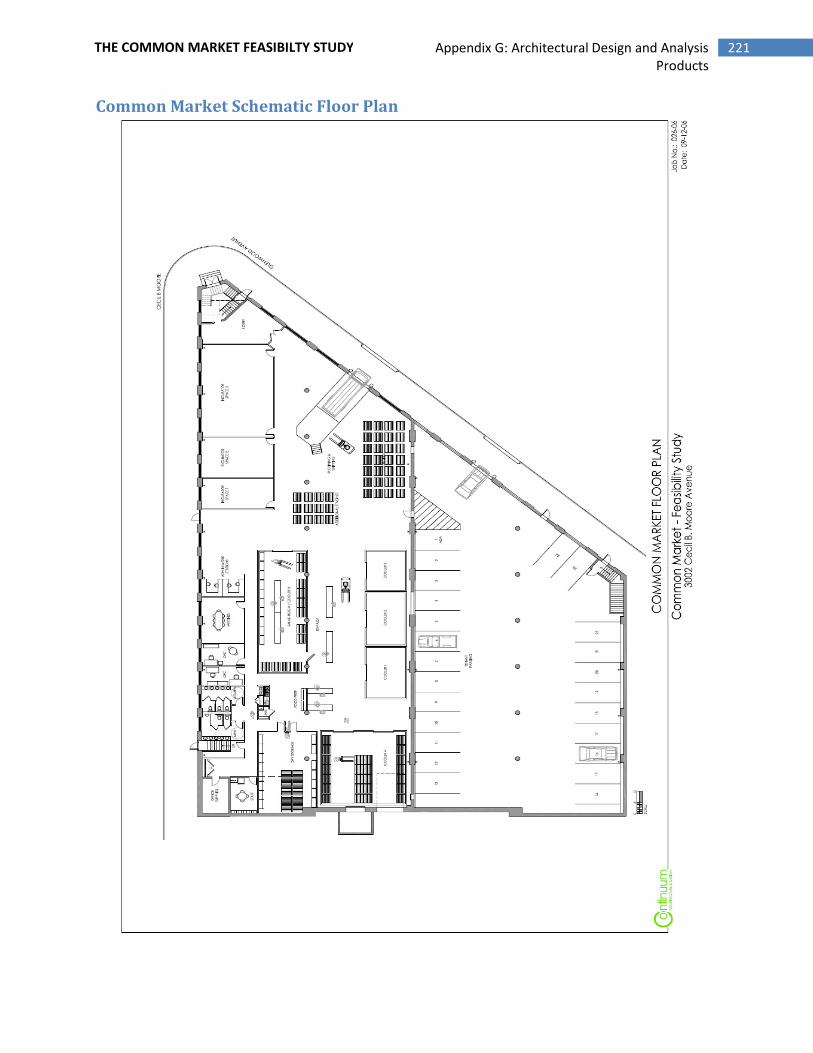
221 Appendix G: Architectural Design and Analysis
Products
THE COMMON MARKET FEASIBILTY STUDY
Common Market Schematic Floor Plan

222 Appendix G: Architectural Design and Analysis
Products
THE COMMON MARKET FEASIBILTY STUDY
Common Market Schematic Floor Plan - Alternate Space
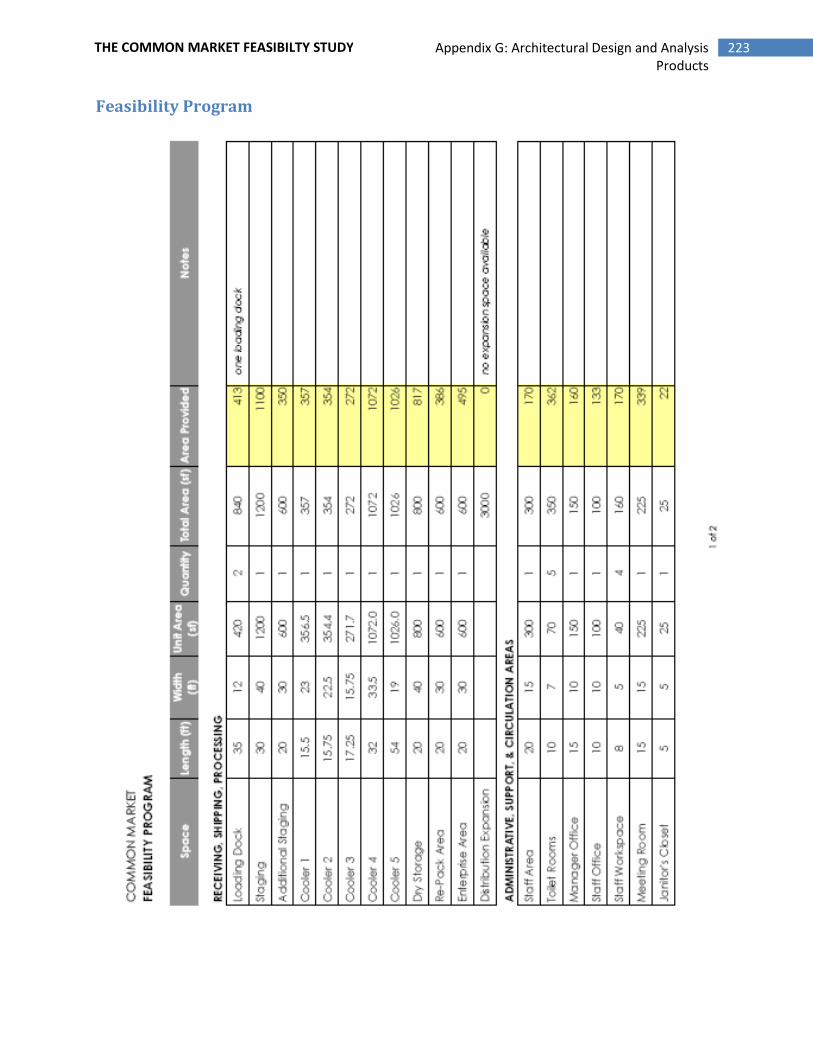
223 Appendix G: Architectural Design and Analysis
Products
THE COMMON MARKET FEASIBILTY STUDY
Feasibility Program
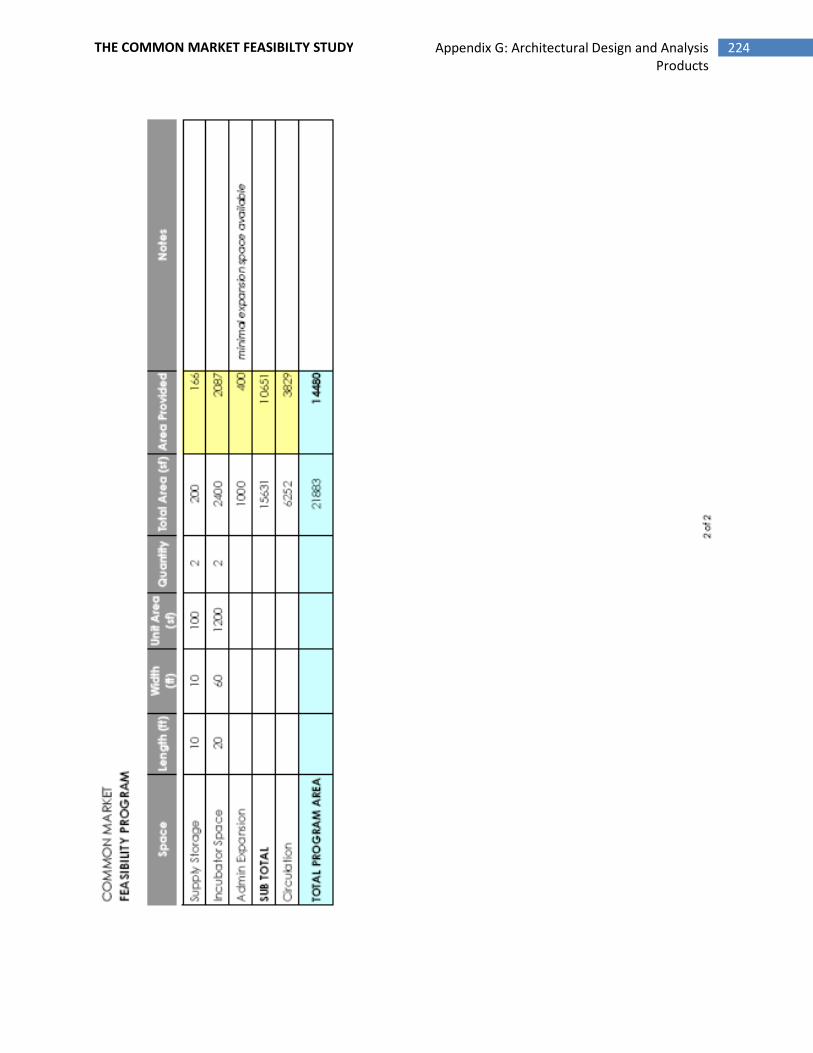
224 Appendix G: Architectural Design and Analysis
Products
THE COMMON MARKET FEASIBILTY STUDY
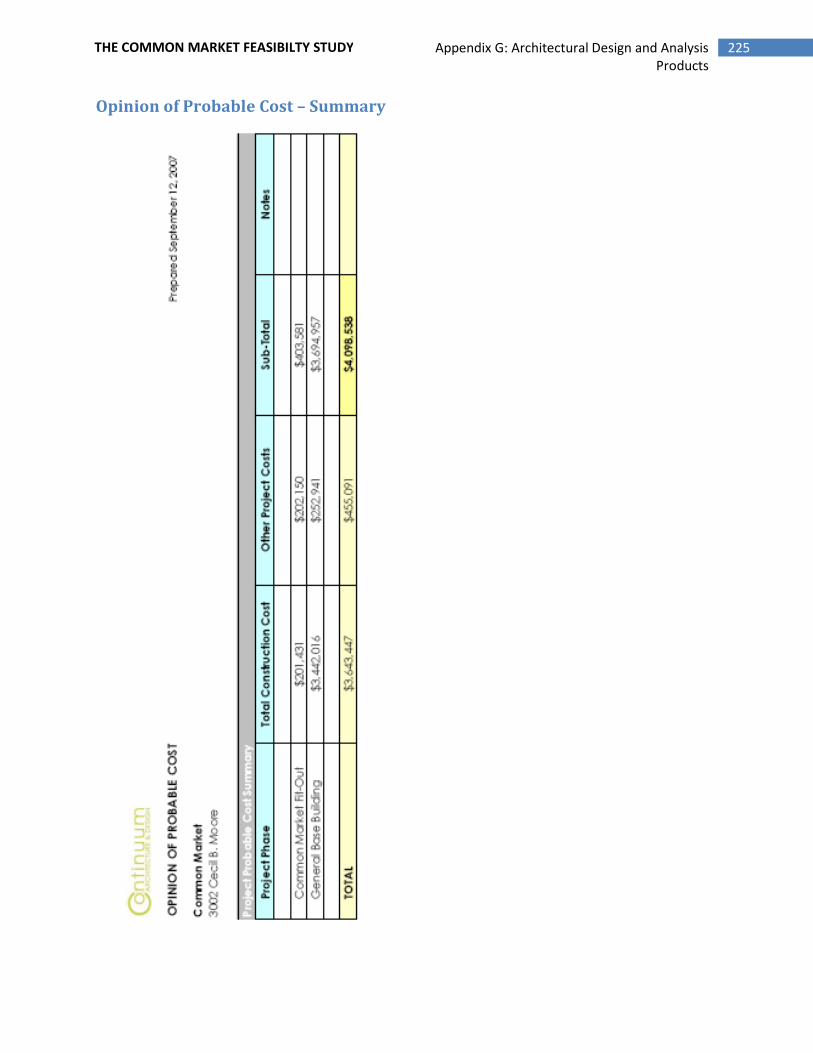
225 Appendix G: Architectural Design and Analysis
Products
THE COMMON MARKET FEASIBILTY STUDY
Opinion of Probable Cost – Summary
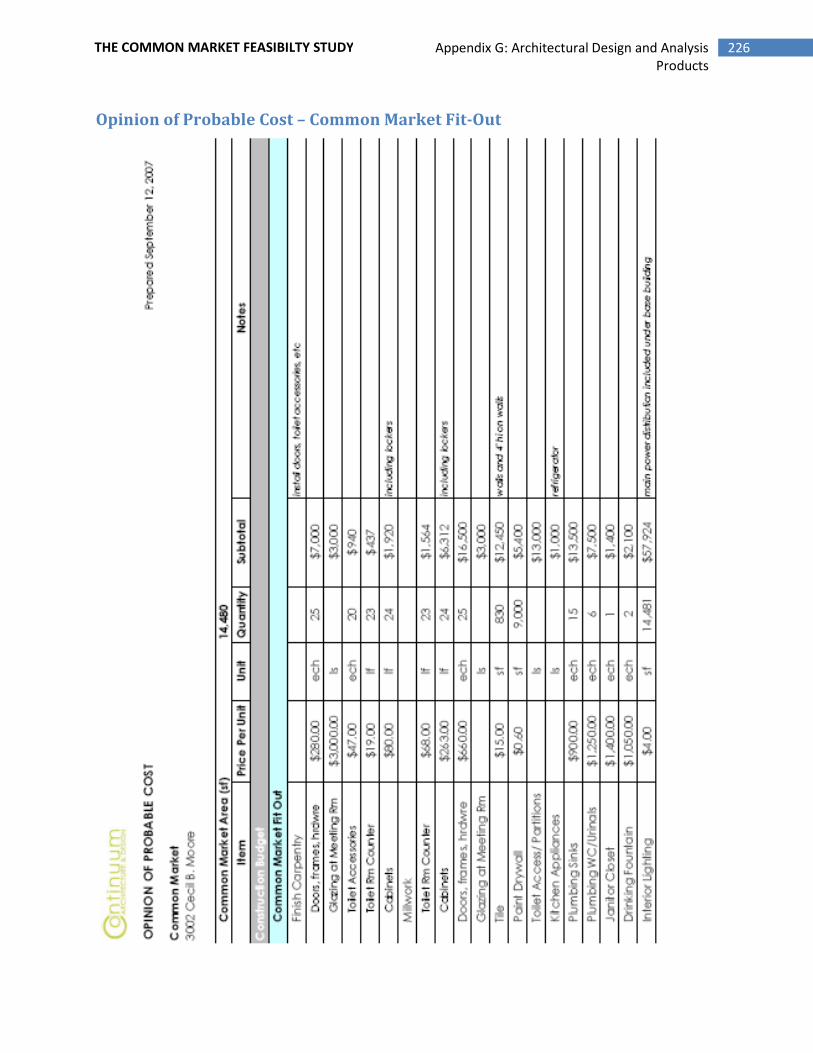
226 Appendix G: Architectural Design and Analysis
Products
THE COMMON MARKET FEASIBILTY STUDY
Opinion of Probable Cost – Common Market Fit-Out
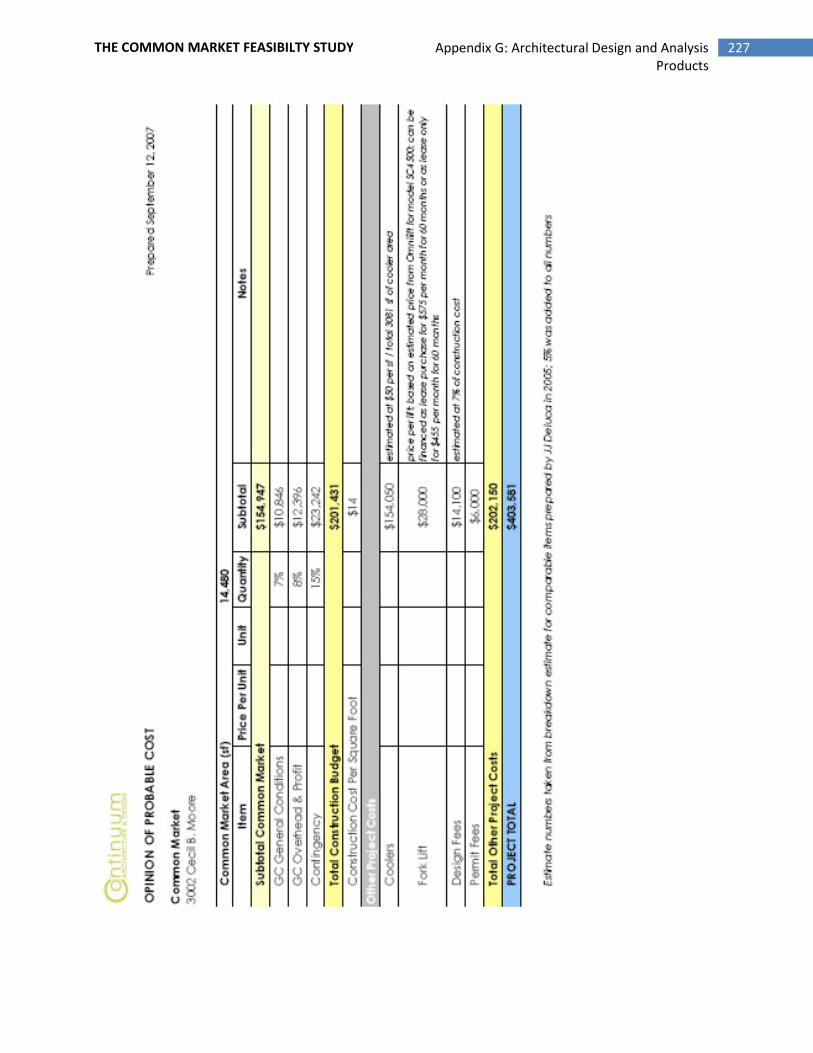
227 Appendix G: Architectural Design and Analysis
Products
THE COMMON MARKET FEASIBILTY STUDY
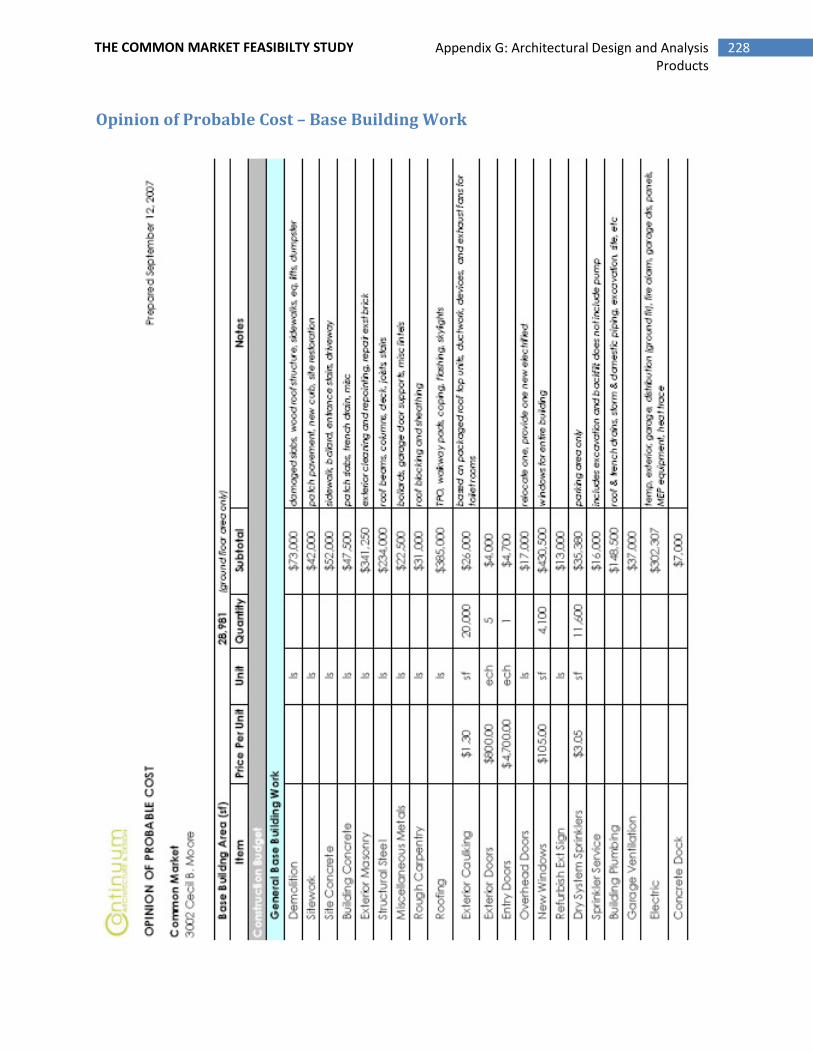
228 Appendix G: Architectural Design and Analysis
Products
THE COMMON MARKET FEASIBILTY STUDY
Opinion of Probable Cost – Base Building Work
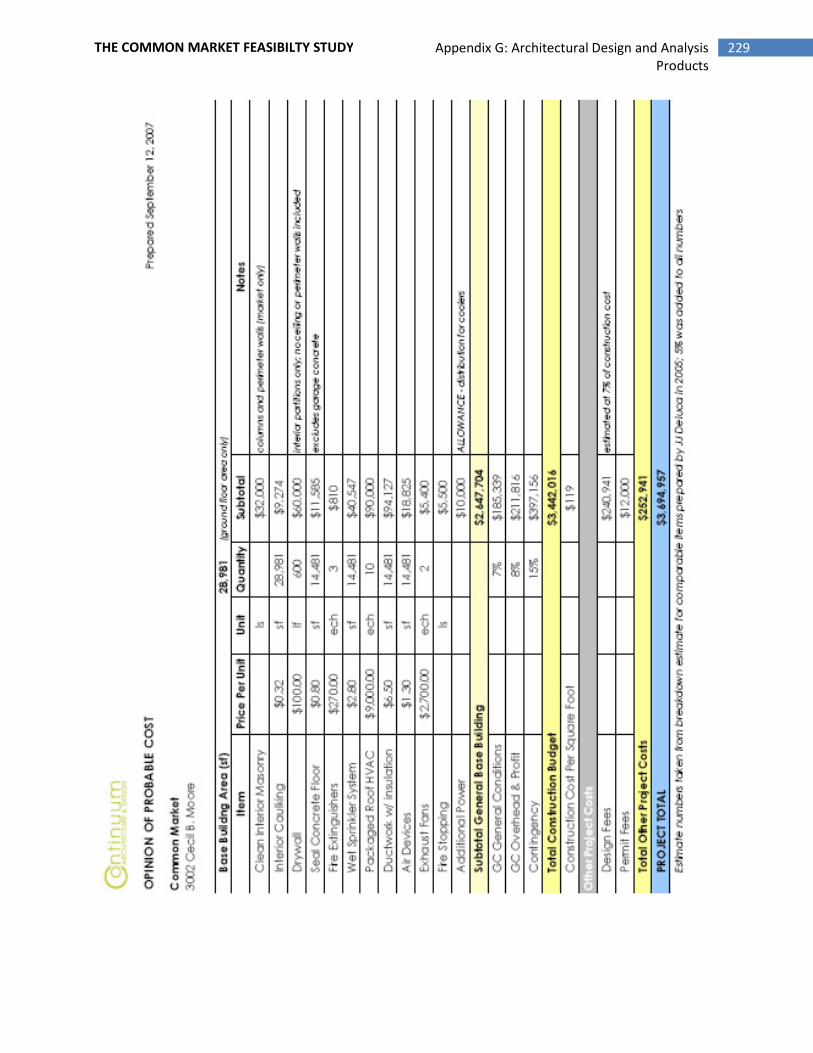
229 Appendix G: Architectural Design and Analysis
Products
THE COMMON MARKET FEASIBILTY STUDY
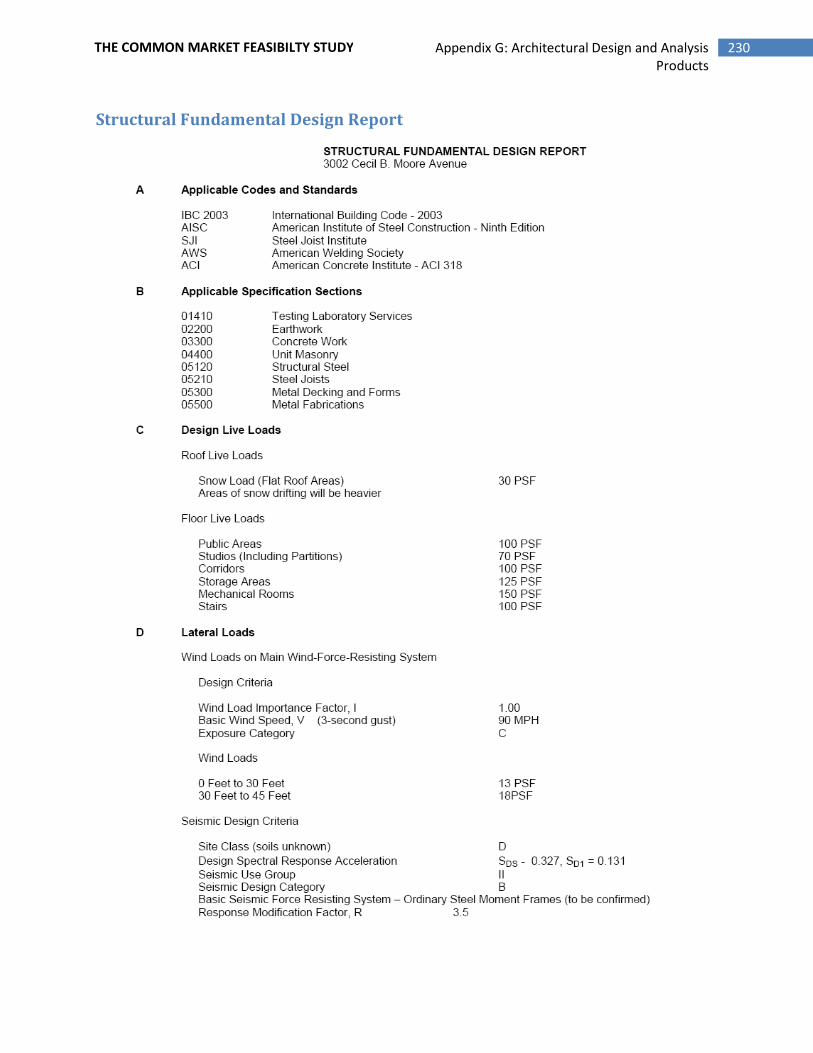
230 Appendix G: Architectural Design and Analysis
Products
THE COMMON MARKET FEASIBILTY STUDY
Structural Fundamental Design Report
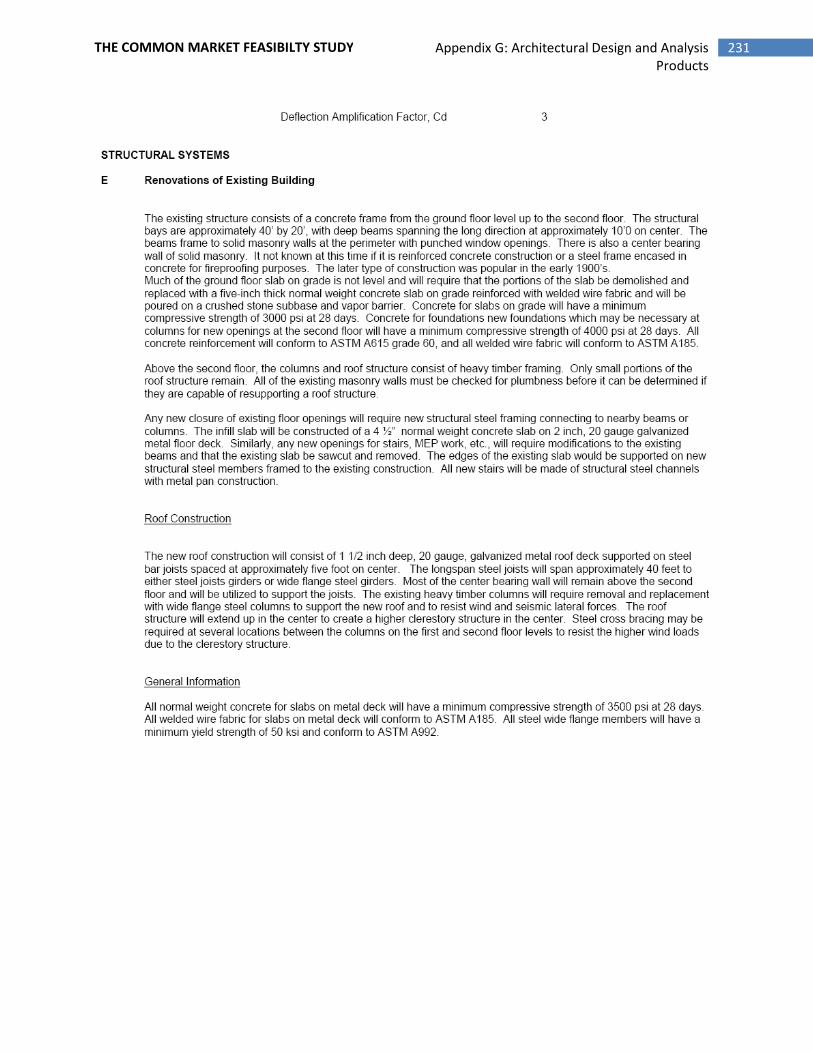
231 Appendix G: Architectural Design and Analysis
Products
THE COMMON MARKET FEASIBILTY STUDY

232 Appendix G: Architectural Design and Analysis
Products
THE COMMON MARKET FEASIBILTY STUDY
Report on Food Distribution Center Cost Factors
A wholesale food distribution business will require a building facility to operate from. More or less, this
will be a warehouse type facility with loading docks, staging and preparation areas, dry and cold storage,
and office space. The size (in terms of square footage) and specifics of the various designated work
areas will depend on (1) the volume of business and (2) the types of operations (enterprises) the
business engages in. In addition, various types of equipment will be necessary to carry out the work of
the business, with some specialized equipment necessary depending, again, on the enterprises of the
business.
A brief description of basic facility and equipment requirements follows. Staffing needs for both labor
and management are also addressed in the report. Finally capitalization and operating costs are
discussed. For this report, we will look at minimum operational requirements.
Building & Facilities
There is a direct relationship between facility size, business volume and business enterprises. However
there is probably a minimum scale necessary to open and operate a financially sustainable distribution
business. There is measurable relationship between facility size and operating costs. However it is
important to assess operational efficiencies when determining the size of the facility. For example, a
small facility may cost less to heat and cool than a larger one but may cause internal logistics problems
due to lack of room to maneuver pallet jacks or stage orders in a way that permits efficient loading of
trucks. Racking may make “efficient” use of space for coolers but might result in difficulties in picking
orders or proper inventory control. This report will consider the “optimal” options for a small scale
operation engaged in a few specialized enterprises (such as re-packing and minimal food preparation).
Receiving and shipping requires a platform of standard dock height with overhead door. It is
possible to operate the business with one bay (i.e., one spot for loading and unloading) however
this will inevitably create internal and external logistics inefficiencies such as logjams with
inbound and outbound trucks, loading and unloading delays, additional costs due to time
required to move product around, and increase likelihood of work-related injuries. Therefore it
is recommended the facility have, at minimum, two bays, if not more.
Staging area: There should be a staging area adjacent to the loading dock area that provides
adequate space to unload and load trucks and stage product after unloading and before loading.
It might be desirable to have an additional staging area that links the storage areas and
enterprise work stations (e.g., re-packing area, food preparation area, etc.). Clear, open
corridors should be maintained that lead directly from the dock area to the various storage and
work areas to provide for smooth, unobstructed movement of product throughout the facility.
Coolers: perishable products require cold storage. The business may require multiple coolers or
coolers that can be divided into separate zones depending on the products handled by the
business. For example, frozen product needs to be stored in cold rooms at below 0° F. Tree
233 Appendix G: Architectural Design and Analysis
Products
THE COMMON MARKET FEASIBILTY STUDY
fruit and “wet” vegetables are typically stored at temperatures between 34 and 38° Fahrenheit
while tomatoes are properly stored at approximately 55°F. Dairy items have varying storage
temperature requirements as well. Further complicating cold storage requirements are
segregation requirements for organic and non-organic fresh produce.
Racking for coolers will definitely maximize usage of floor space but should be carefully
considered with other operational requirements of the business (as discussed previously in this
report). Racking coolers will necessitate use of a forklift for any movement of product in and
out of them.
Finally, due to the heavy energy usage associated with operating cooler, 3-phase electrical
service is definitely desirable for the building.
Dry storage: dry storage space has several purposes. Packing material and other supplies have
to be stored. In addition, certain food items (canned, jarred, dried and otherwise temperature
stabilized processed items) require storage space. (Note, these items will typically be stored for
longer periods of time than perishable items.) Determining whether or not to install racking in
the dry storage must be carefully weighed with any complications that may arise.
Re-pack area: designated work area to re-pack product into specialized packaging for specific
customers or customer types. (e.g., green beans are typically packed in 1 1/9 bushel boxes or 1
bushel crates however food service and some small retail users prefer to purchase green beans
in 5 or 10 lb boxes. In addition to package size, product can be re-graded in the re-pack
process.) An additional use of a re-pack area is to grade distressed product. Depending on the
type of operations that are carried out in this area, several set-ups may be necessary and
various food-safety procedures may be instituted. (Note, certain food-safety protocols may
require specialized equipment such as stainless steel tables, closed drains, etc.)
(Other) enterprise areas: these include food preparation for adding value to products (cutting
fresh produce for food-service, institutional or retail accounts); processing, etc.
Lavatory, break area, and changing areas: lavatories are required, break and lunch area should
be provided for staff, changing area may be required depending on enterprises (may be
required for food safety certification).
Office space: must accommodate sales, purchasing, bookkeeping, operations, and management
staff. A centralized office space, configured for privacy and appropriate work conditions is
desirable to expedite communication. In addition, a modified office located in one or more
work areas may be necessary or desirable to further improve various functions in those areas.

234 Appendix G: Architectural Design and Analysis
Products
THE COMMON MARKET FEASIBILTY STUDY
Equipment
Materials handling equipment
• Forklift(s): loading and unloading trucks, moving product around warehouse. Decision
to be made regarding propane or electric. (Note the bit in Vena profile regarding
purchase vs. leasing of forklifts. Lighter usage demand (and abuse factors) at Common
Market will impact this decision) (Note: regardless of whether farmers are shipping
“pallet quantities” or customers are ordering same, palletizing expedites loading and
unloading and minimizes physical labor for same.)
• Pallet jacks (electric & manual): used for loading and unloading, moving product around
floor when forklift unnecessary or too cumbersome.
• Hand trucks: moving small quantities of supplies or product around warehouse.
Shipping, receiving, inventory control
• Manual or electronic: hardware and software
Re-pack and prep equipment
• Work stations: include various job-appropriate equipment such as tables, sinks, scales,
baggers, closure equipment, etc., made of certification-compliant material
Vehicles
• Truck(s): insulated & refrigerated diesel straight trucks w/ heating capacity (for winter
conditions); “city-van” configuration (14 – 18’ boxes, roll-up doors, need to consider lift-
gates)
Office
• Work stations: Tables, desks, chairs, etc.
• Telecom system: fit-out including landlines & fax
• Computer system:
o Integrated sales, inventory and bookkeeping software
o Integrated network w/ office and warehouse function (i.e., receiver logs in
product, shipper cuts bills of lading at dock)
Staffing
Warehouse:
• Receiver: responsible for receiving all inbound shipments, including product-for-sale and
supplies, etc. In a small operation, the receiver will likely also physically handle the
inbound product and possibly be responsible for putting it in its proper location in the
warehouse. Receiver also responsible for checking inbound shipments for count and
damage, logging inbound shipments and routing receiving paperwork to its proper
destination in the office.
• Shipper: responsible for loading all outbound shipments and related paperwork. This
would include proper counts and sorting for individual orders, proper staging on
delivery trucks for streamlined unloading, bills of lading, etc. In a small operation, the
235 Appendix G: Architectural Design and Analysis
Products
THE COMMON MARKET FEASIBILTY STUDY
shipper will likely also physically load trucks and possible be responsible for pulling and
assembling orders for shipment. Shipper also responsible to assure any changes or
corrections to outbound shipments be routed to the proper destination in the office.
• Material handler(s)
o May include re-packer(s) and prep personnel, depending on various enterprise
requirements
(Note: all 3 positions can be integrated depending on scale & size of operation.
Furthermore, positions can be integrated with more than one full or part-time
individual.)
• Qualtiy control: general quality control (QC) responsibilities include
o inspecting inbound shipments for defects and assurance quality equals or
exceeds standards set forth in purchase or where otherwise stated
o re-packed product meets quality standards set forth by business in the product
it sells
o condition of inventory
o shipments meet quality standards set forth by the business for the products it
sells
o product processed by the business meets quality standards set forth by the
business for the products it sells.
(Note: while it is possible to integrate QC with the previous three positions, this
function is often staffed separately to maintain objectivity)
• Compliance: refers to assurance that any regulatory requirements are complied with.
In terms of the Common Market, these would include
o Food safety certification
o Organic certification (if applicable)
o OSHA and other workplace health & safety requirements
o Governmental regulation regarding food handling procedures, if applicable
(Note: the most natural and non-conflicting position to merge this with is QC)
(Note: many food and warehouse workers in Philadelphia are unionized which will affect
wage rates)
Transportation:
• Driver(s):
o Load trucks (see role of shipper for overlap of responsibility) for deliveries
o Clean out trucks upon return to facility
o Make multiple, timely deliveries on pre-assigned routes
o Maintenance of proper delivery paperwork and procedures
o Full and part time needs to be determined by volume and nature of customer
base.
(note: many food and warehouse workers in Philadelphia are unionized which will affect
wage rates)
Office:
• Accounting / office management
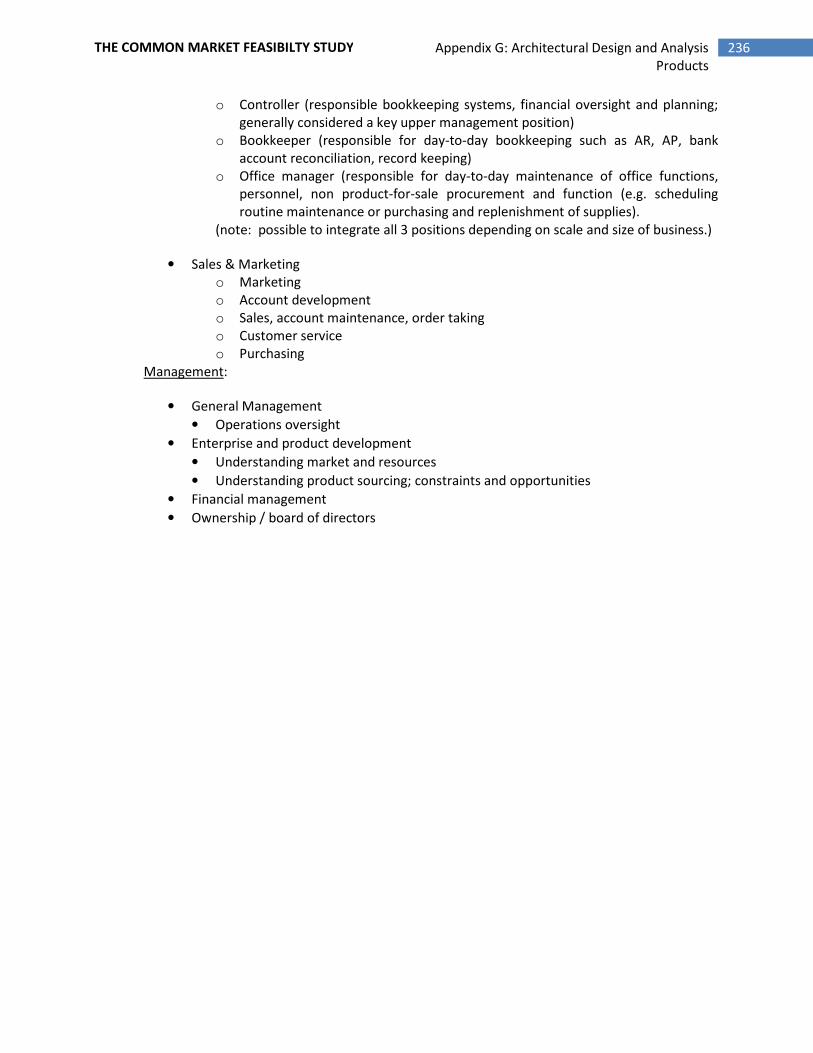
236 Appendix G: Architectural Design and Analysis
Products
THE COMMON MARKET FEASIBILTY STUDY
o Controller (responsible bookkeeping systems, financial oversight and planning;
generally considered a key upper management position)
o Bookkeeper (responsible for day-to-day bookkeeping such as AR, AP, bank
account reconciliation, record keeping)
o Office manager (responsible for day-to-day maintenance of office functions,
personnel, non product-for-sale procurement and function (e.g. scheduling
routine maintenance or purchasing and replenishment of supplies).
(note: possible to integrate all 3 positions depending on scale and size of business.)
• Sales & Marketing
o Marketing
o Account development
o Sales, account maintenance, order taking
o Customer service
o Purchasing
Management:
• General Management
• Operations oversight
• Enterprise and product development
• Understanding market and resources
• Understanding product sourcing; constraints and opportunities
• Financial management
• Ownership / board of directors

237 Appendix H: PA Seasonality Chart THE COMMON MARKET FEASIBILTY STUDY
Appendix H: PA Seasonality Chart

238 Appendix H: PA Seasonality Chart THE COMMON MARKET FEASIBILTY STUDY
PENNSYLVANIA PRODUCE
SEASONALITY CHART
April May June July August Sept October Nov
Fruits
&
Berries
Apples
Blueber
ries
Cantalou
pe
Honeyde
w Melon
Nectari
nes
Peaches
Pears
Pears,
Asian
Plums
Raspber
ry, black
Raspber
ry, red
Strawbe
rries
Waterm
elon
Vegeta
bles
April May June July August Sept October Nov
Asparag
us
Beans,
Green
Beans,
Lima
Beets
Bok
Choy
Bok
Choy,
baby
Broccoli
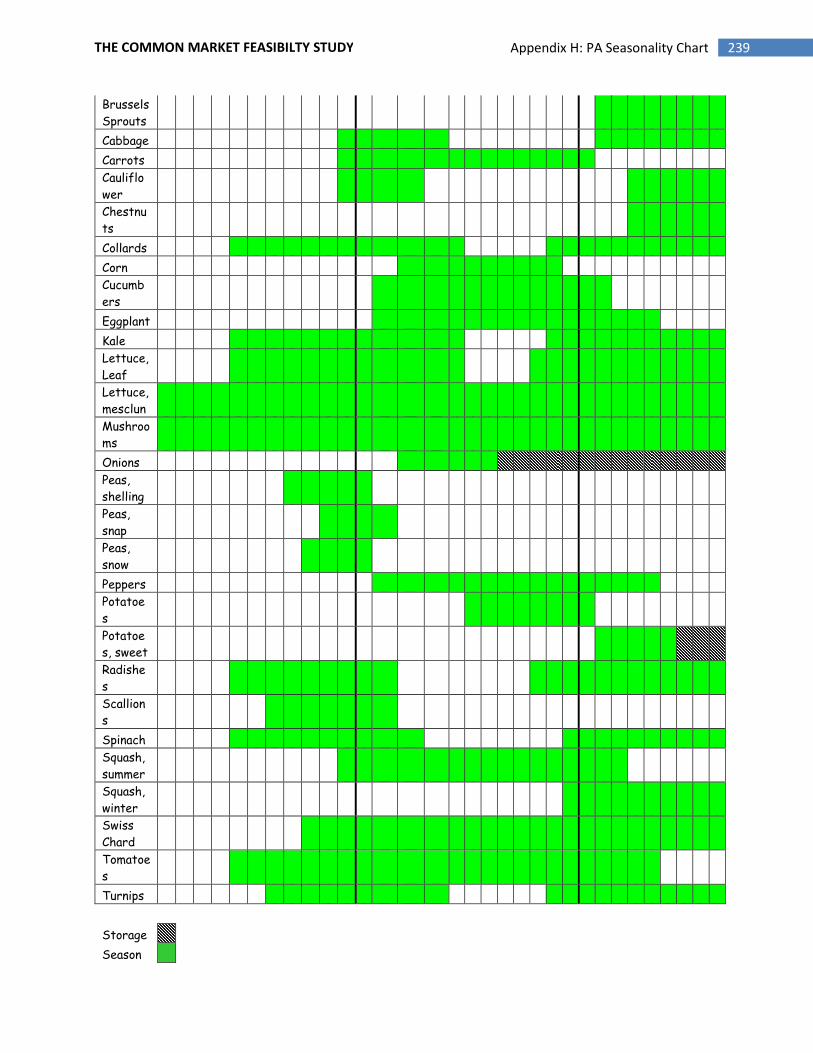
239 Appendix H: PA Seasonality Chart THE COMMON MARKET FEASIBILTY STUDY
Brussels
Sprouts
Cabbage
Carrots
Cauliflo
wer
Chestnu
ts
Collards
Corn
Cucumb
ers
Eggplant
Kale
Lettuce,
Leaf
Lettuce,
mesclun
Mushroo
ms
Onions
Peas,
shelling
Peas,
snap
Peas,
snow
Peppers
Potatoe
s
Potatoe
s, sweet
Radishe
s
Scallion
s
Spinach
Squash,
summer
Squash,
winter
Swiss
Chard
Tomatoe
s
Turnips
Storage
Season

240 Appendix H: PA Seasonality Chart THE COMMON MARKET FEASIBILTY STUDY