commissioning for value focus pack - hmr for value... · commissioning for value focus pack ......
TRANSCRIPT
Commissioning for Value Focus Pack
CCG: Heywood, Middleton & Rochdale
Focus Area : Respiratory Programme Budget Category
1
What is a “Deep Dive” pack?
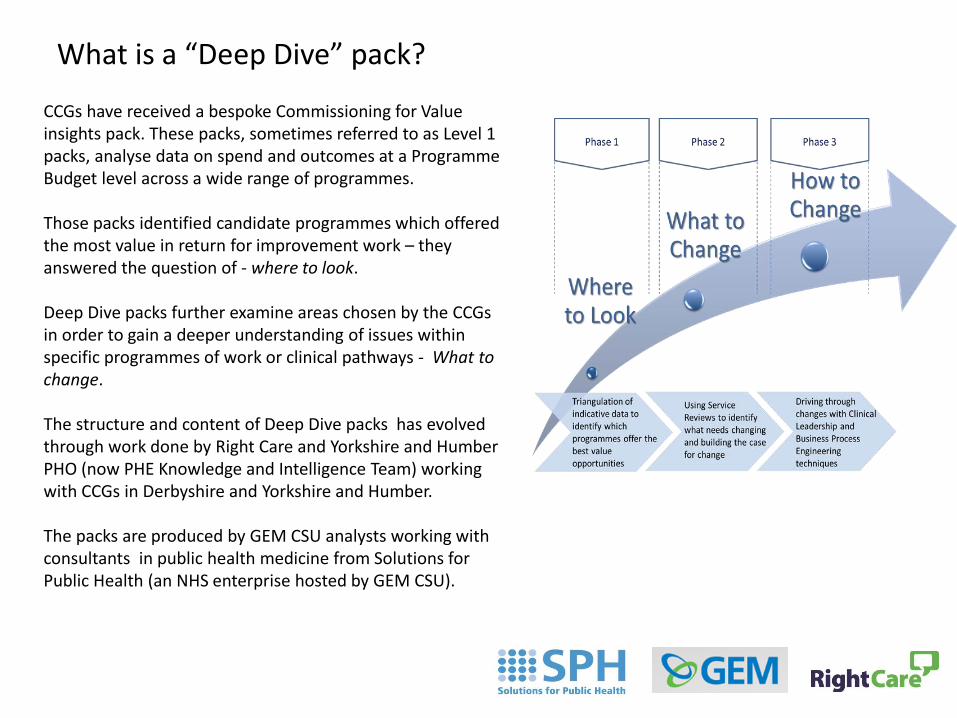
CCGs have received a bespoke Commissioning for Value insights pack. These packs, sometimes referred to as Level 1 packs, analyse data on spend and outcomes at a Programme Budget level across a wide range of programmes. Those packs identified candidate programmes which offered the most value in return for improvement work – they answered the question of - where to look. Deep Dive packs further examine areas chosen by the CCGs in order to gain a deeper understanding of issues within specific programmes of work or clinical pathways - What to change. The structure and content of Deep Dive packs has evolved through work done by Right Care and Yorkshire and Humber PHO (now PHE Knowledge and Intelligence Team) working with CCGs in Derbyshire and Yorkshire and Humber. The packs are produced by GEM CSU analysts working with consultants in public health medicine from Solutions for Public Health (an NHS enterprise hosted by GEM CSU).
2
Contents
1. Background and context
• Aims of the packs
• Packs as part of transformation process
2. Methodology
• Analysis methods
• CCG Benchmarking and Opportunities
3. CCG Analysis
• Respiratory – the context for the deep dive analysis
• Summary messages for pathway stages:
Prevalence
Management in Primary Care
Management in Secondary Care
Mortality
• Opportunity table for indicators in the bottom quintile of benchmark group
4. Where to focus: Understanding practice variation
All Practices: Indicators in the bottom quintile
Top 3 Practices: Opportunities table
5. Bringing it all together, National Guidance
Annexes
• Annex 1 – Spine charts and opportunity tables
• Annex 2 – CCG Cluster Classification
• Annex 3 – Practice Cluster Classification
• Annex 4 – Indicator List
• Glossary
3
The Commissioning for Value phase one packs, produced by NHSE, PHE and NHS Right
Care, included an offer to work with CCGs to develop this Focus Pack, or ‘deep dive’.
The deep dive looks at an agreed programme area to understand variation across the
pathway, including GP practice benchmarking. Working with local intelligence teams, the
deep dive will look to identify opportunities for improvement and support the CCG's
discussion on methods of improving clinical pathways.
Further support is available to use and explore the intelligence in this pack
Aims of the Packs
1. Background and context
4
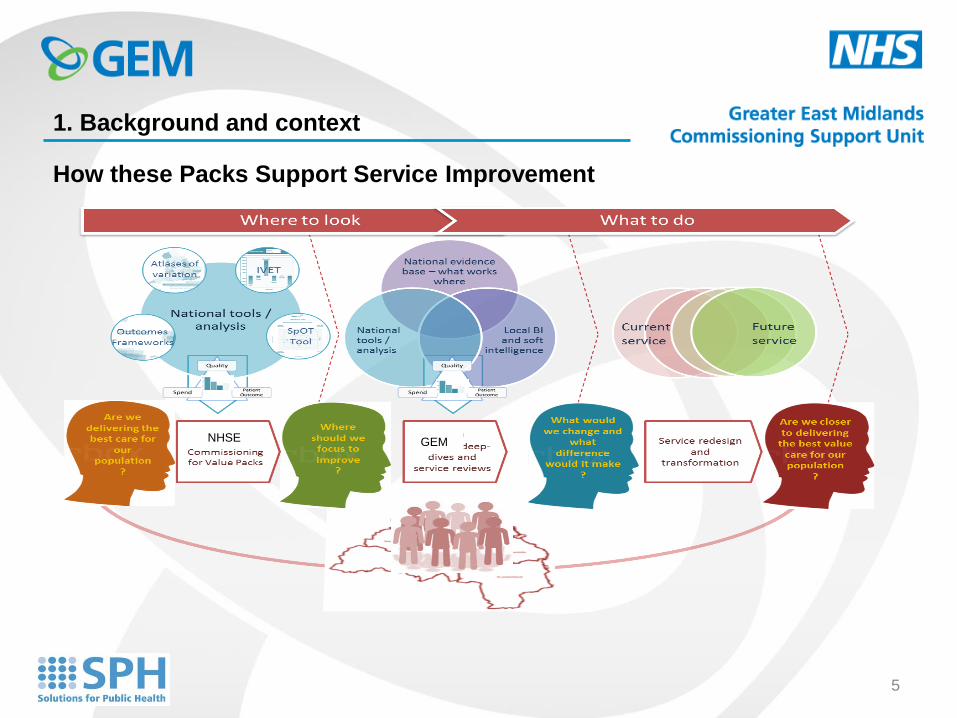
How these Packs Support Service Improvement
NHSE GEM
1. Background and context
5
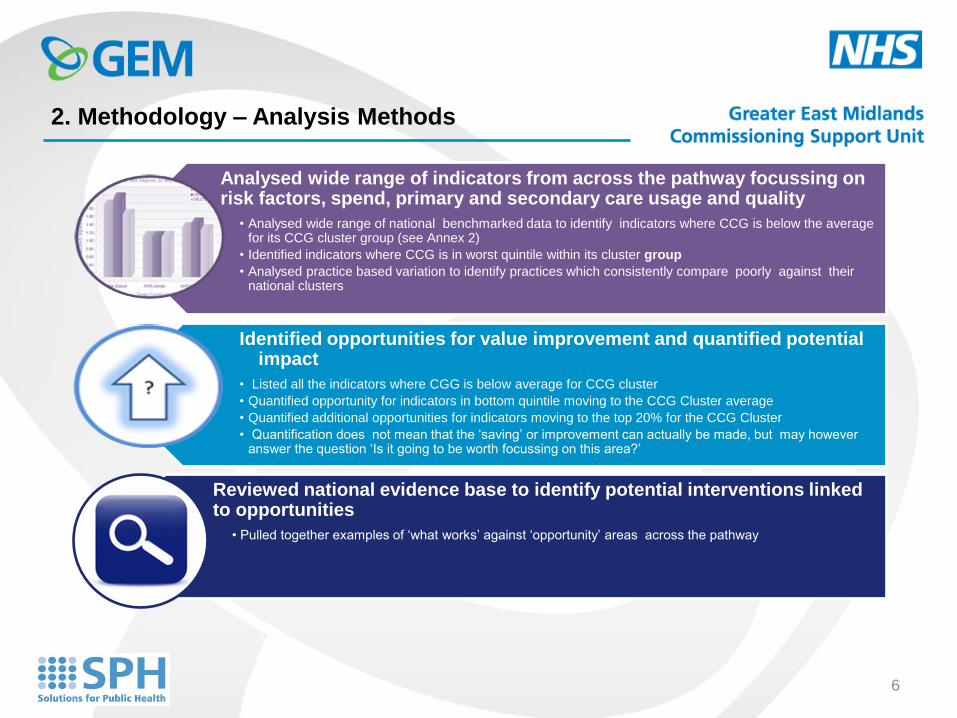
Analysed wide range of indicators from across the pathway focussing on risk factors, spend, primary and secondary care usage and quality
• Analysed wide range of national benchmarked data to identify indicators where CCG is below the average for its CCG cluster group (see Annex 2)
• Identified indicators where CCG is in worst quintile within its cluster group
• Analysed practice based variation to identify practices which consistently compare poorly against their national clusters
Identified opportunities for value improvement and quantified potential impact
• Listed all the indicators where CGG is below average for CCG cluster
• Quantified opportunity for indicators in bottom quintile moving to the CCG Cluster average
• Quantified additional opportunities for indicators moving to the top 20% for the CCG Cluster
• Quantification does not mean that the ‘saving’ or improvement can actually be made, but may however answer the question ‘Is it going to be worth focussing on this area?’
Reviewed national evidence base to identify potential interventions linked to opportunities
• Pulled together examples of ‘what works’ against ‘opportunity’ areas across the pathway
2. Methodology – Analysis Methods
6
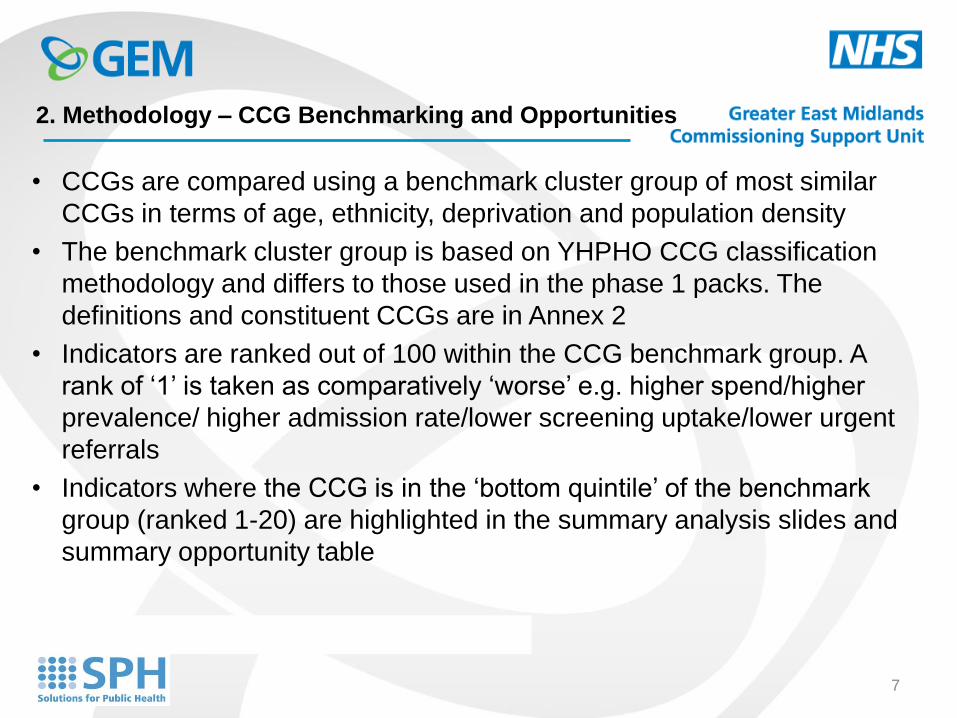
2. Methodology – CCG Benchmarking and Opportunities
• CCGs are compared using a benchmark cluster group of most similar
CCGs in terms of age, ethnicity, deprivation and population density
• The benchmark cluster group is based on YHPHO CCG classification
methodology and differs to those used in the phase 1 packs. The
definitions and constituent CCGs are in Annex 2
• Indicators are ranked out of 100 within the CCG benchmark group. A
rank of ‘1’ is taken as comparatively ‘worse’ e.g. higher spend/higher
prevalence/ higher admission rate/lower screening uptake/lower urgent
referrals
• Indicators where the CCG is in the ‘bottom quintile’ of the benchmark
group (ranked 1-20) are highlighted in the summary analysis slides and
summary opportunity table
7
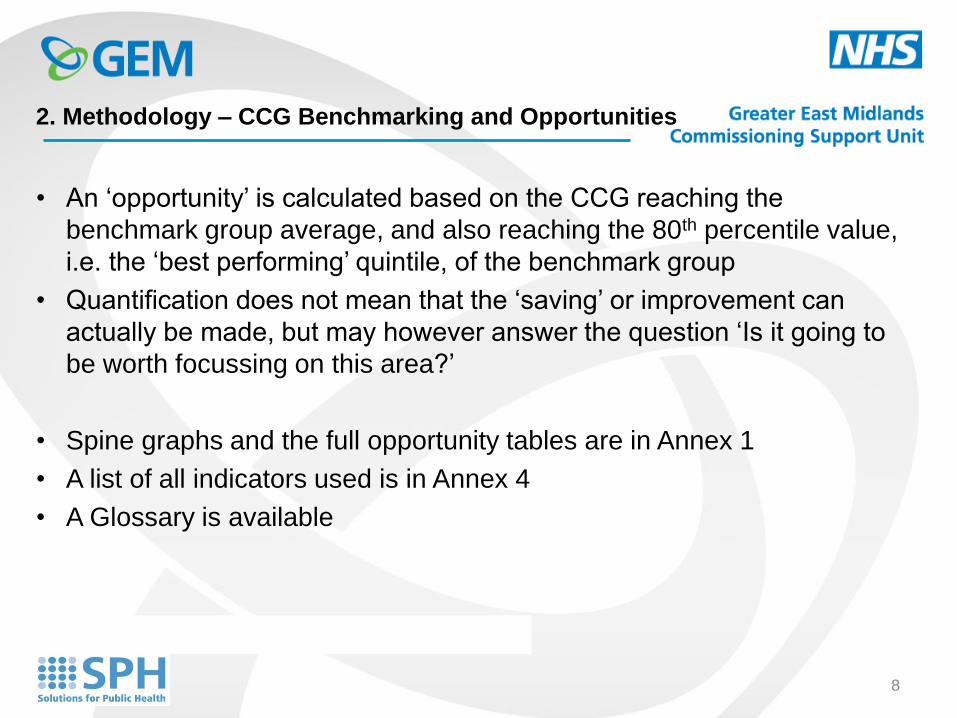
• An ‘opportunity’ is calculated based on the CCG reaching the
benchmark group average, and also reaching the 80th percentile value,
i.e. the ‘best performing’ quintile, of the benchmark group
• Quantification does not mean that the ‘saving’ or improvement can
actually be made, but may however answer the question ‘Is it going to
be worth focussing on this area?’
• Spine graphs and the full opportunity tables are in Annex 1
• A list of all indicators used is in Annex 4
• A Glossary is available
2. Methodology – CCG Benchmarking and Opportunities
8
Deep Dive Pack Phase 1
9
10
11
12
13
The Right Care Commissioning for Value phase 1 pack highlighted that, compared to their comparator CCGs, Heywood, Middleton & Rochdale CCG had:
• Significantly higher prevalence of asthma
• COPD prevalence in the highest quartile in England
• Significantly higher spend on prescribing
• Significantly higher respiratory admission rates across all secondary
care, and non-elective care
• Significantly higher emergency admissions relative to patients on the
register
3. Respiratory – Context for Deep Dive Analysis
14
DDP Phase 1 vs DDP Phase 2 analysis
DDP Phase 2 Differs from DDP Phase 1 analysis
• Different clustering methods
• nearest 10 CCGs vs colour coded-cluster CCGs
• Phase 1, but not phase 2 method included
population size as a clustering metric
• Different years of data
• 2011/12 vs 2012/13 for phase 2
Therefore analysis gives different results
15
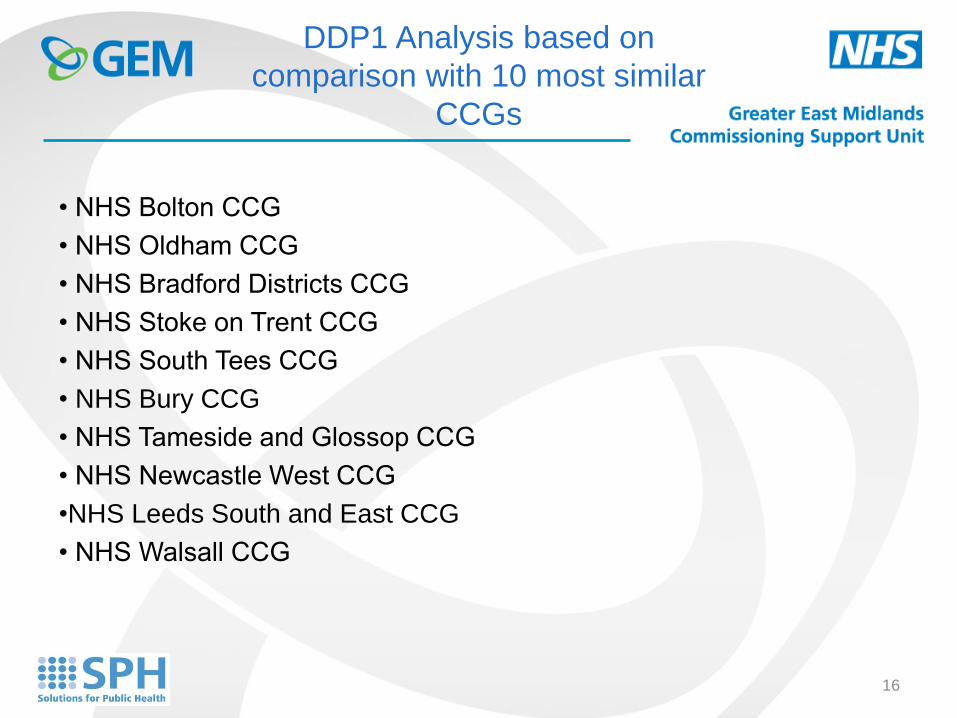
DDP1 Analysis based on
comparison with 10 most similar
CCGs
• NHS Bolton CCG
• NHS Oldham CCG
• NHS Bradford Districts CCG
• NHS Stoke on Trent CCG
• NHS South Tees CCG
• NHS Bury CCG
• NHS Tameside and Glossop CCG
• NHS Newcastle West CCG
•NHS Leeds South and East CCG
• NHS Walsall CCG
16
DDP 2 Analysis based on
comparison with all CCGs in
yellow cluster group
17
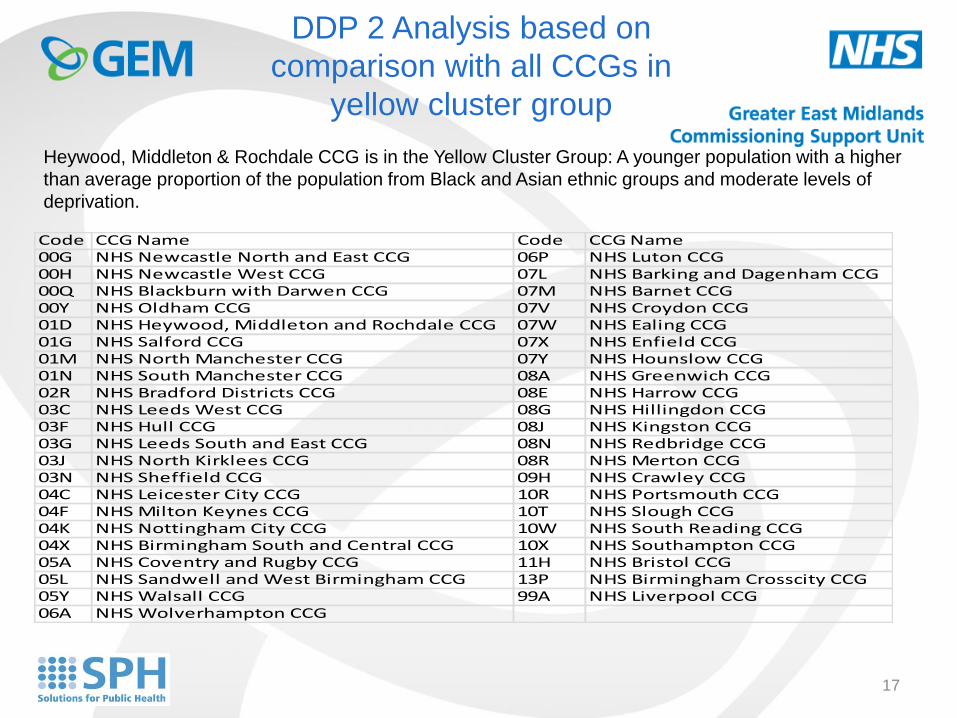
Heywood, Middleton & Rochdale CCG is in the Yellow Cluster Group: A younger population with a higher
than average proportion of the population from Black and Asian ethnic groups and moderate levels of
deprivation.
Code CCG Name Code CCG Name00G NHS Newcastle North and East CCG 06P NHS Luton CCG00H NHS Newcastle West CCG 07L NHS Barking and Dagenham CCG00Q NHS Blackburn with Darwen CCG 07M NHS Barnet CCG00Y NHS Oldham CCG 07V NHS Croydon CCG01D NHS Heywood, Middleton and Rochdale CCG 07W NHS Ealing CCG01G NHS Salford CCG 07X NHS Enfield CCG01M NHS North Manchester CCG 07Y NHS Hounslow CCG01N NHS South Manchester CCG 08A NHS Greenwich CCG02R NHS Bradford Districts CCG 08E NHS Harrow CCG03C NHS Leeds West CCG 08G NHS Hillingdon CCG03F NHS Hull CCG 08J NHS Kingston CCG03G NHS Leeds South and East CCG 08N NHS Redbridge CCG03J NHS North Kirklees CCG 08R NHS Merton CCG03N NHS Sheffield CCG 09H NHS Crawley CCG04C NHS Leicester City CCG 10R NHS Portsmouth CCG04F NHS Milton Keynes CCG 10T NHS Slough CCG04K NHS Nottingham City CCG 10W NHS South Reading CCG04X NHS Birmingham South and Central CCG 10X NHS Southampton CCG05A NHS Coventry and Rugby CCG 11H NHS Bristol CCG05L NHS Sandwell and West Birmingham CCG 13P NHS Birmingham Crosscity CCG05Y NHS Walsall CCG 99A NHS Liverpool CCG06A NHS Wolverhampton CCG
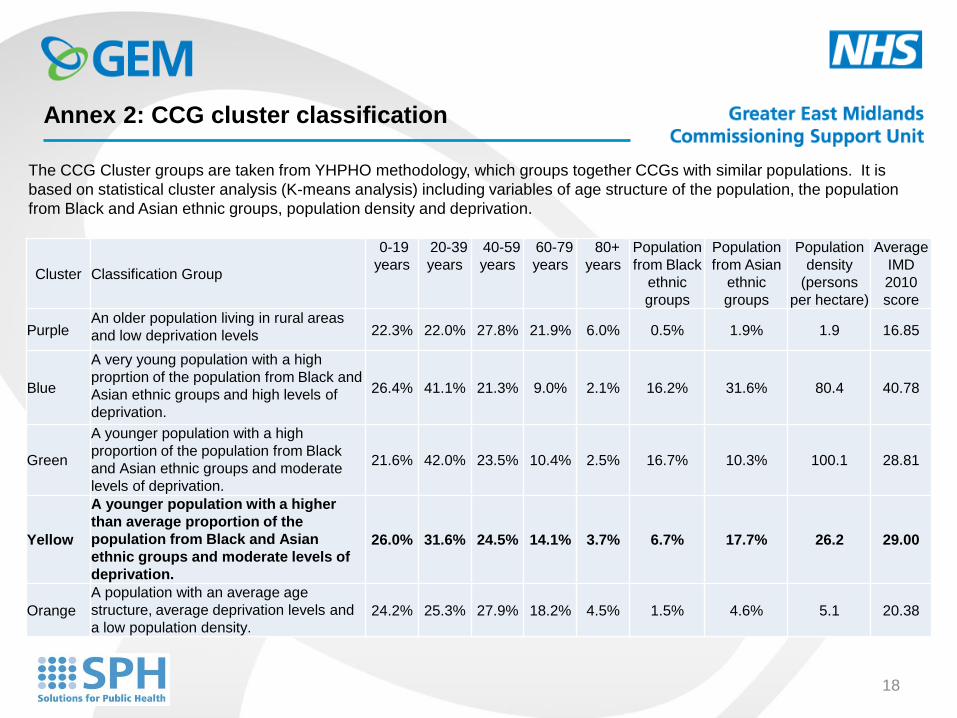
Annex 2: CCG cluster classification
Cluster Classification Group
0-19
years
20-39
years
40-59
years
60-79
years
80+
years
Population
from Black
ethnic
groups
Population
from Asian
ethnic
groups
Population
density
(persons
per hectare)
Average
IMD
2010
score
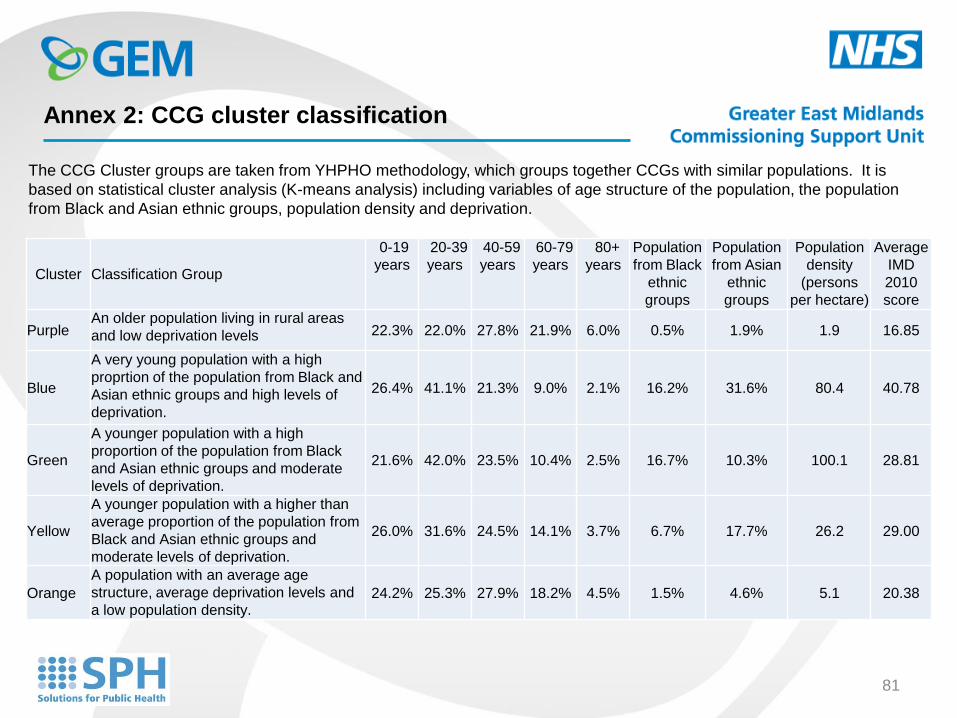
Purple An older population living in rural areas
and low deprivation levels 22.3% 22.0% 27.8% 21.9% 6.0% 0.5% 1.9% 1.9 16.85
Blue
A very young population with a high
proprtion of the population from Black and
Asian ethnic groups and high levels of
deprivation.
26.4% 41.1% 21.3% 9.0% 2.1% 16.2% 31.6% 80.4 40.78
Green
A younger population with a high
proportion of the population from Black
and Asian ethnic groups and moderate
levels of deprivation.
21.6% 42.0% 23.5% 10.4% 2.5% 16.7% 10.3% 100.1 28.81
Yellow
A younger population with a higher
than average proportion of the
population from Black and Asian
ethnic groups and moderate levels of
deprivation.
26.0% 31.6% 24.5% 14.1% 3.7% 6.7% 17.7% 26.2 29.00
Orange
A population with an average age
structure, average deprivation levels and
a low population density. 24.2% 25.3% 27.9% 18.2% 4.5% 1.5% 4.6% 5.1 20.38
The CCG Cluster groups are taken from YHPHO methodology, which groups together CCGs with similar populations. It is
based on statistical cluster analysis (K-means analysis) including variables of age structure of the population, the population
from Black and Asian ethnic groups, population density and deprivation.
18
Deep Dive Phase 2
19
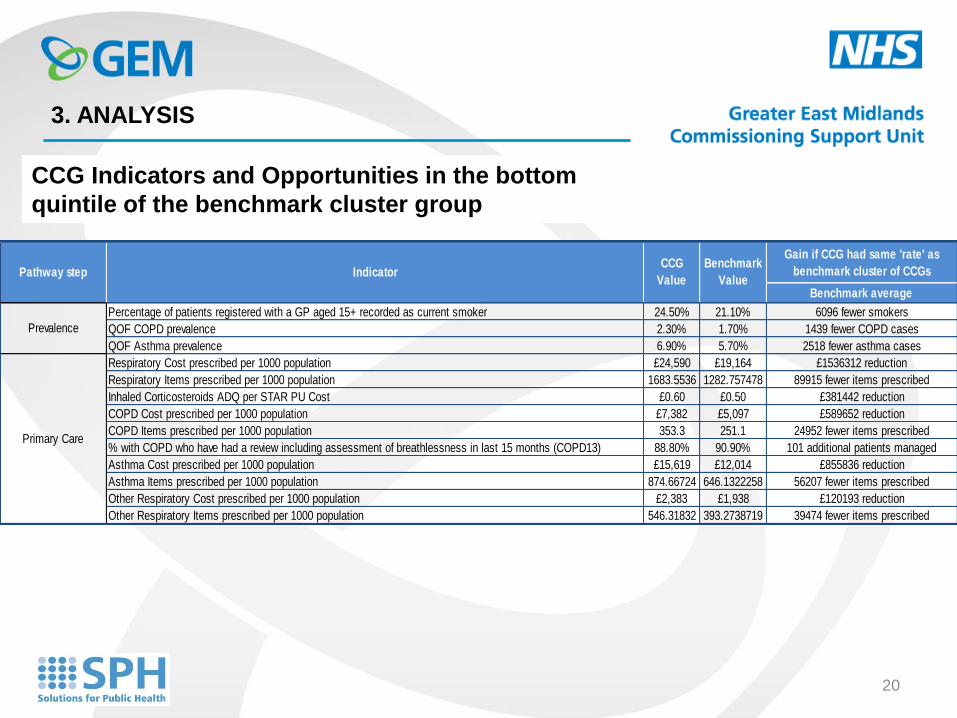
CCG Indicators and Opportunities in the bottom
quintile of the benchmark cluster group
20
3. ANALYSIS
Gain if CCG had same 'rate' as
benchmark cluster of CCGs
Benchmark average
Percentage of patients registered with a GP aged 15+ recorded as current smoker 24.50% 21.10% 6096 fewer smokers
QOF COPD prevalence 2.30% 1.70% 1439 fewer COPD cases
QOF Asthma prevalence 6.90% 5.70% 2518 fewer asthma cases
Respiratory Cost prescribed per 1000 population £24,590 £19,164 £1536312 reduction
Respiratory Items prescribed per 1000 population 1683.5536 1282.757478 89915 fewer items prescribed
Inhaled Corticosteroids ADQ per STAR PU Cost £0.60 £0.50 £381442 reduction
COPD Cost prescribed per 1000 population £7,382 £5,097 £589652 reduction
COPD Items prescribed per 1000 population 353.3 251.1 24952 fewer items prescribed
% with COPD who have had a review including assessment of breathlessness in last 15 months (COPD13) 88.80% 90.90% 101 additional patients managed
Asthma Cost prescribed per 1000 population £15,619 £12,014 £855836 reduction
Asthma Items prescribed per 1000 population 874.66724 646.1322258 56207 fewer items prescribed
Other Respiratory Cost prescribed per 1000 population £2,383 £1,938 £120193 reduction
Other Respiratory Items prescribed per 1000 population 546.31832 393.2738719 39474 fewer items prescribed
Prevalence
Primary Care
Pathway step IndicatorCCG
Value
Benchmark
Value
CCG Indicators and Opportunities in the bottom
quintile of the benchmark cluster group
21
3. ANALYSIS
Gain if CCG had same 'rate' as
benchmark cluster of CCGs
Benchmark average
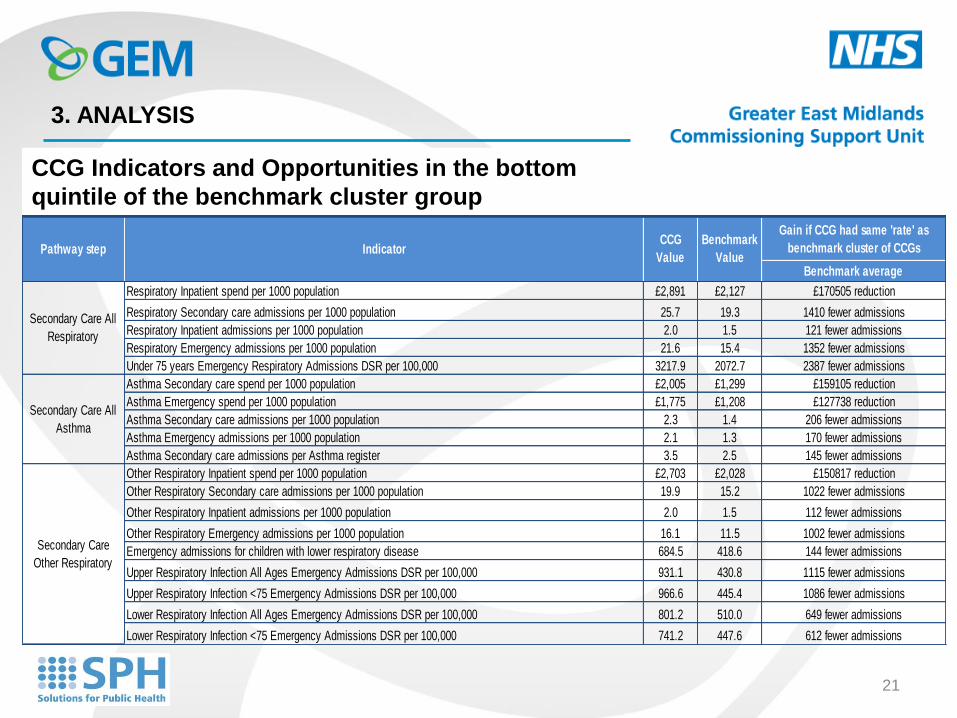
Respiratory Inpatient spend per 1000 population £2,891 £2,127 £170505 reduction
Respiratory Secondary care admissions per 1000 population 25.7 19.3 1410 fewer admissions
Respiratory Inpatient admissions per 1000 population 2.0 1.5 121 fewer admissions
Respiratory Emergency admissions per 1000 population 21.6 15.4 1352 fewer admissions
Under 75 years Emergency Respiratory Admissions DSR per 100,000 3217.9 2072.7 2387 fewer admissions
Asthma Secondary care spend per 1000 population £2,005 £1,299 £159105 reduction
Asthma Emergency spend per 1000 population £1,775 £1,208 £127738 reduction
Asthma Secondary care admissions per 1000 population 2.3 1.4 206 fewer admissions
Asthma Emergency admissions per 1000 population 2.1 1.3 170 fewer admissions
Asthma Secondary care admissions per Asthma register 3.5 2.5 145 fewer admissions
Other Respiratory Inpatient spend per 1000 population £2,703 £2,028 £150817 reduction
Other Respiratory Secondary care admissions per 1000 population 19.9 15.2 1022 fewer admissions
Other Respiratory Inpatient admissions per 1000 population 2.0 1.5 112 fewer admissions
Other Respiratory Emergency admissions per 1000 population 16.1 11.5 1002 fewer admissions
Emergency admissions for children with lower respiratory disease 684.5 418.6 144 fewer admissions
Upper Respiratory Infection All Ages Emergency Admissions DSR per 100,000 931.1 430.8 1115 fewer admissions
Upper Respiratory Infection <75 Emergency Admissions DSR per 100,000 966.6 445.4 1086 fewer admissions
Lower Respiratory Infection All Ages Emergency Admissions DSR per 100,000 801.2 510.0 649 fewer admissions
Lower Respiratory Infection <75 Emergency Admissions DSR per 100,000 741.2 447.6 612 fewer admissions
Secondary Care All
Respiratory
Secondary Care All
Asthma
Secondary Care
Other Respiratory
Pathway step IndicatorCCG
Value
Benchmark
Value
3 / 6 indicators for prevalence are in the bottom quintile of the benchmark group:
1. Percentage of patients registered with a GP aged 15+ recorded as current smoker
2. QOF COPD prevalence
3. QOF Asthma prevalence
Summary: Prevalence
3. ANALYSIS
22
10 / 35 indicators are in the bottom quintile of the benchmark group
Prescribing:
1. Respiratory Cost prescribed per 1000 population
2. Respiratory Items prescribed per 1000 population
3. Inhaled Corticosteroids ADQ per STAR PU Cost
4. COPD Cost prescribed per 1000 population
5. COPD Items prescribed per 1000 population
6. Asthma Cost prescribed per 1000 population
7. Asthma Items prescribed per 1000 population
8. Other Respiratory Cost prescribed per 1000 population
9. Other Respiratory Items prescribed per 1000 population
Summary: Management in Primary Care
3. ANALYSIS
23
10 / 35 indicators are in the bottom quintile of the benchmark group
QOF
10.% with COPD who have had a review including assessment of
breathlessness in last 15 months (COPD13)
Summary: Management in Primary Care
3. ANALYSIS
24
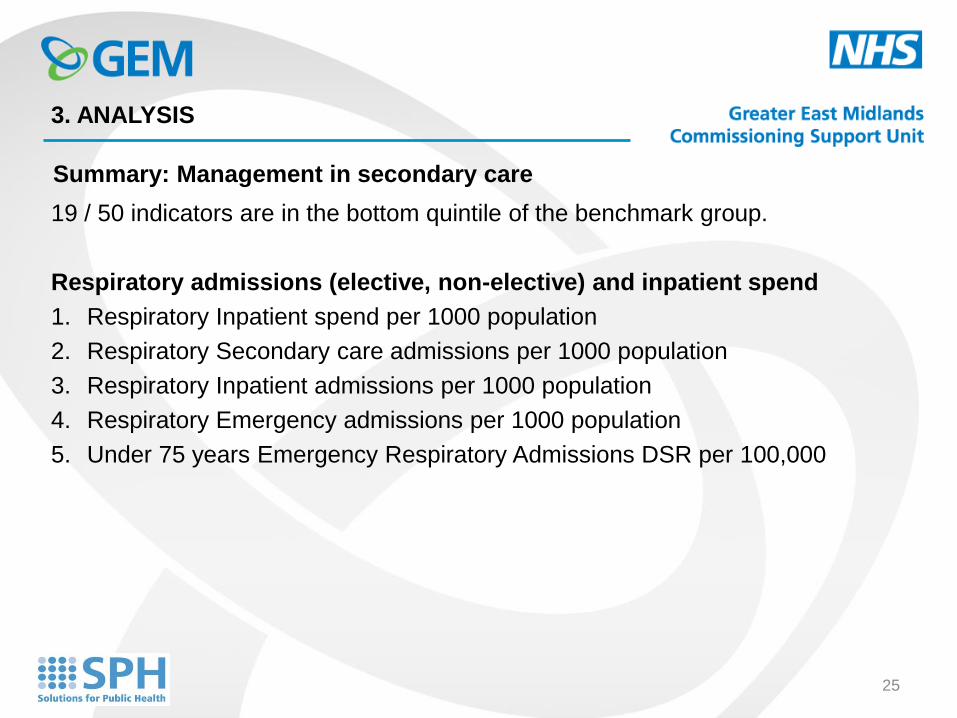
19 / 50 indicators are in the bottom quintile of the benchmark group.
Respiratory admissions (elective, non-elective) and inpatient spend
1. Respiratory Inpatient spend per 1000 population
2. Respiratory Secondary care admissions per 1000 population
3. Respiratory Inpatient admissions per 1000 population
4. Respiratory Emergency admissions per 1000 population
5. Under 75 years Emergency Respiratory Admissions DSR per 100,000
Summary: Management in secondary care
3. ANALYSIS
25
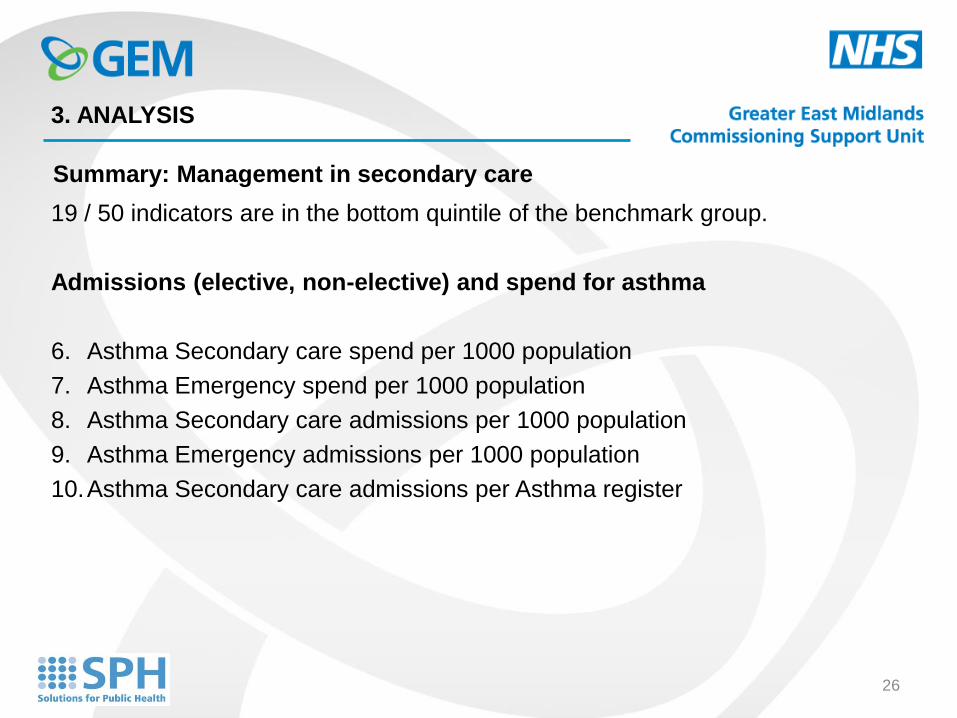
19 / 50 indicators are in the bottom quintile of the benchmark group.
Admissions (elective, non-elective) and spend for asthma
6. Asthma Secondary care spend per 1000 population
7. Asthma Emergency spend per 1000 population
8. Asthma Secondary care admissions per 1000 population
9. Asthma Emergency admissions per 1000 population
10.Asthma Secondary care admissions per Asthma register
Summary: Management in secondary care
3. ANALYSIS
26
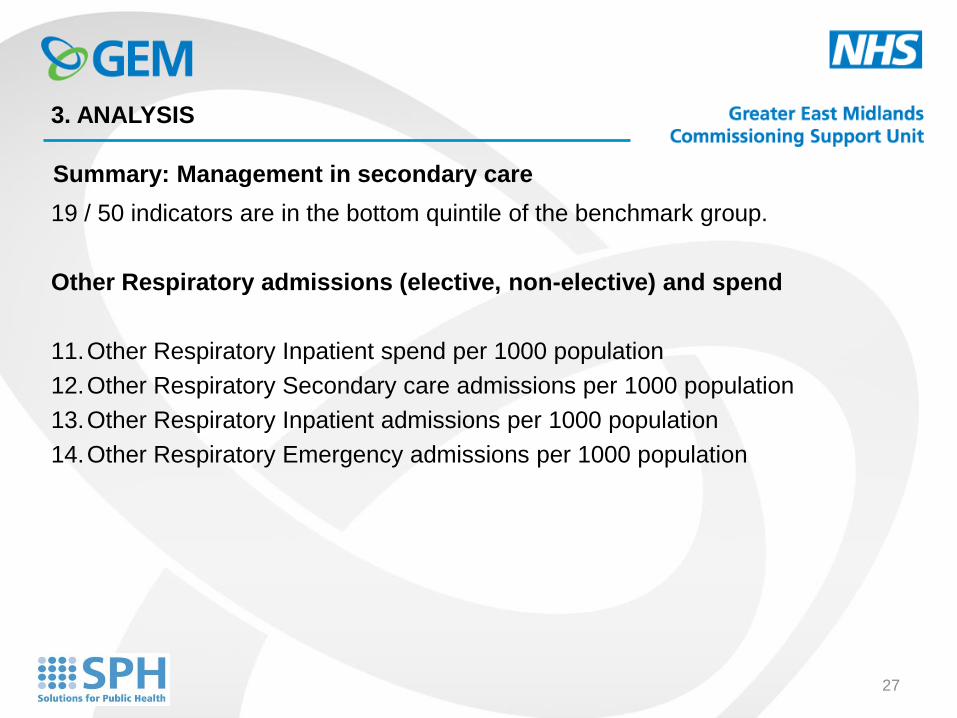
19 / 50 indicators are in the bottom quintile of the benchmark group.
Other Respiratory admissions (elective, non-elective) and spend
11.Other Respiratory Inpatient spend per 1000 population
12.Other Respiratory Secondary care admissions per 1000 population
13.Other Respiratory Inpatient admissions per 1000 population
14.Other Respiratory Emergency admissions per 1000 population
Summary: Management in secondary care
3. ANALYSIS
27
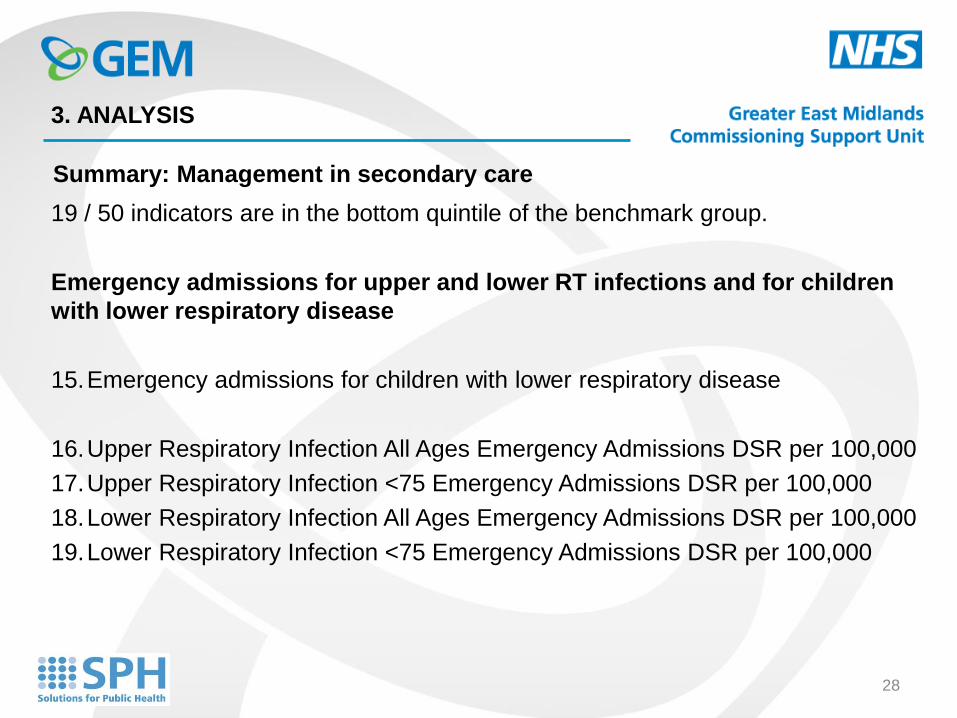
19 / 50 indicators are in the bottom quintile of the benchmark group.
Emergency admissions for upper and lower RT infections and for children
with lower respiratory disease
15.Emergency admissions for children with lower respiratory disease
16.Upper Respiratory Infection All Ages Emergency Admissions DSR per 100,000
17.Upper Respiratory Infection <75 Emergency Admissions DSR per 100,000
18.Lower Respiratory Infection All Ages Emergency Admissions DSR per 100,000
19.Lower Respiratory Infection <75 Emergency Admissions DSR per 100,000
Summary: Management in secondary care
3. ANALYSIS
28
0 / 3 indicators are in the bottom quintile of the benchmark group:
Summary: Mortality
3. ANALYSIS
29
Respiratory Prevalence
30
Respiratory Prevalence
The analysis showed HMR CCG in the bottom quintile of cluster CCGs
for estimates of COPD and asthma prevalence in the registered
population, as well as adult (>15 years of age) smoking prevalence
31
Respiratory Prevalence
•Recorded smoking status in the registered population provides an
estimate of the adult population smoking prevalence
•Smoking prevalence can be reduced by tobacco control which
includes smoking cessation services
•The effectiveness of tobacco control and smoking cessation services
can be evaluated using indicators such as smoking prevalence in the
registered population
•Higher estimates of smoking prevalence suggests comparatively
higher unmet need and an opportunity to offer smoking cessation
interventions to more smokers
•Primary and secondary care services offer opportunities to reduce
smoking prevalence, maximise the number of people who quit smoking
thereby reducing smoking related morbidity and mortality
Hypothesis: smoking prevalence
32
•The relatively higher smoking prevalence in the HMR CCG registered population may reflect relative under-provision and/or lower uptake of smoking cessation services
•Alternative explanations include:
• Better recording of smoking status
• Subgroup(s) of the population with significantly higher smoking rates than would be expected from the known sociodemographic characteristics of the population
• High provision and uptake of smoking cessation services but issues concerning the wider programme of tobacco control
• Higher prevalence rate may be due to chance/random variation/usual cause variation – no CIs or statistical tests have been performed
Smoking prevalence: Explanations to consider
Respiratory Prevalence
33
Respiratory prevalence
Hypothesis: asthma prevalence
o Asthma prevalence in the lower quintile of CCGs reflects higher asthma
prevalence in the population
o To be on the asthma register, patients need a diagnosis of asthma and a
prescription for an asthma drug within the year
o Higher prevalence may reflect CCG population more at risk eg LBW babies,
maternal smoking and secondary exposure of tobacco smoke in children,
environmental and occupational exposure to allergens
o Investment in programmes aiming to decrease the at risk population eg high
quality tobacco control programmes and high quality smoking cessation
services, may reduce population exposure to triggers and thereby reduce the
number of asthma episodes managed by respiratory services in both primary
and secondary care
o Higher asthma prevalence may therefore reflect the need to target action to
further reduce the at risk population
34
Respiratory prevalence
Other explanations to be considered
•Asthma is not preventable therefore estimates of asthma prevalence
cannot be used to evaluate effectiveness of primary prevention
interventions. Interventions are aimed at improving control of asthma
and prevention of asthma attacks.
•Asthma is under-diagnosed due to a combination of patients not
presenting and clinicians not diagnosing /misdiagnosing
• ?higher prevalence rate may reflect better case ascertainment -
desirable
• ?higher prevalence rate may reflect more misdiagnosis and/or
poorer quality assessment with spirometry - undesirable
•?higher prevalence rate may be due to chance/random variation/usual
cause variation – no CIs or statistical tests have been performed
35
Respiratory prevalence
Hypothesis: COPD Prevalence
•Chronic obstructive pulmonary disease (COPD) is the name for a collection of lung diseases including chronic bronchitis, emphysema and chronic obstructive airways disease
•The main cause of COPD is smoking
•Estimated COPD prevalence in the registered population is a marker of historic smoking patterns, as the development of COPD is related to the level of tobacco exposure over time, usually years
•Higher prevalence of COPD reflects higher need for
• Primary prevention (tobacco control) and smoking cessation (to prevent disease progression)
• High quality health care services (primary and secondary care, pulmonary rehab) as defined by QOF and NICE
36
Respiratory Prevalence
COPD Prevalence: Explanations to consider
•COPD is under-diagnosed due to a combination of patients not
presenting and clinicians not diagnosing /misdiagnosing
• ?higher prevalence rate may reflect better case ascertainment -
desirable
• ?higher prevalence rate may reflect more misdiagnosis and/or
poorer quality assessment with spirometry - undesirable
•?higher prevalence rate may be due to chance/random variation/usual
cause variation – no CIs or statistical tests have been performed
37
Respiratory primary care
38
Respiratory primary care
Analysis showed HMR CCG to be in the lower quintile of
cluster CCGs for:
• 9 Prescribing indicators
• 1 QOF indicator - % with COPD who have had a review
including assessment of breathlessness in last 15 months
(COPD13)
39
Respiratory prescribing
Prescribing: Hypothesis
o Examination of the variation in prescribing costs and items
prescribed can be useful in identifying potentially
inappropriate prescribing
o High prescribing costs may point to the need for better
medicines optimisation and better medicines management
both of which support better and more cost-effective
prescribing in primary care
o Optimisation of prescribing
• reduces hospital admissions and associated costs
• helps patients better manage their care with consequent
improvement in health outcomes
• may reduce prescribing costs
40
Respiratory prescribing
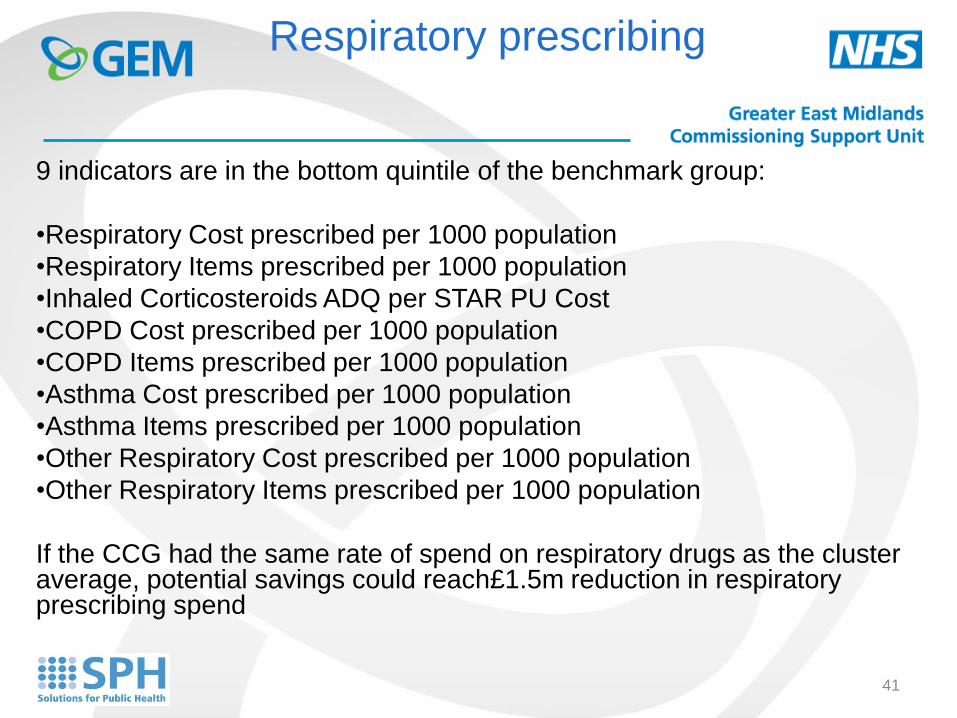
9 indicators are in the bottom quintile of the benchmark group:
•Respiratory Cost prescribed per 1000 population
•Respiratory Items prescribed per 1000 population
•Inhaled Corticosteroids ADQ per STAR PU Cost
•COPD Cost prescribed per 1000 population
•COPD Items prescribed per 1000 population
•Asthma Cost prescribed per 1000 population
•Asthma Items prescribed per 1000 population
•Other Respiratory Cost prescribed per 1000 population
•Other Respiratory Items prescribed per 1000 population
If the CCG had the same rate of spend on respiratory drugs as the cluster average, potential savings could reach£1.5m reduction in respiratory prescribing spend
41
Respiratory prescribing
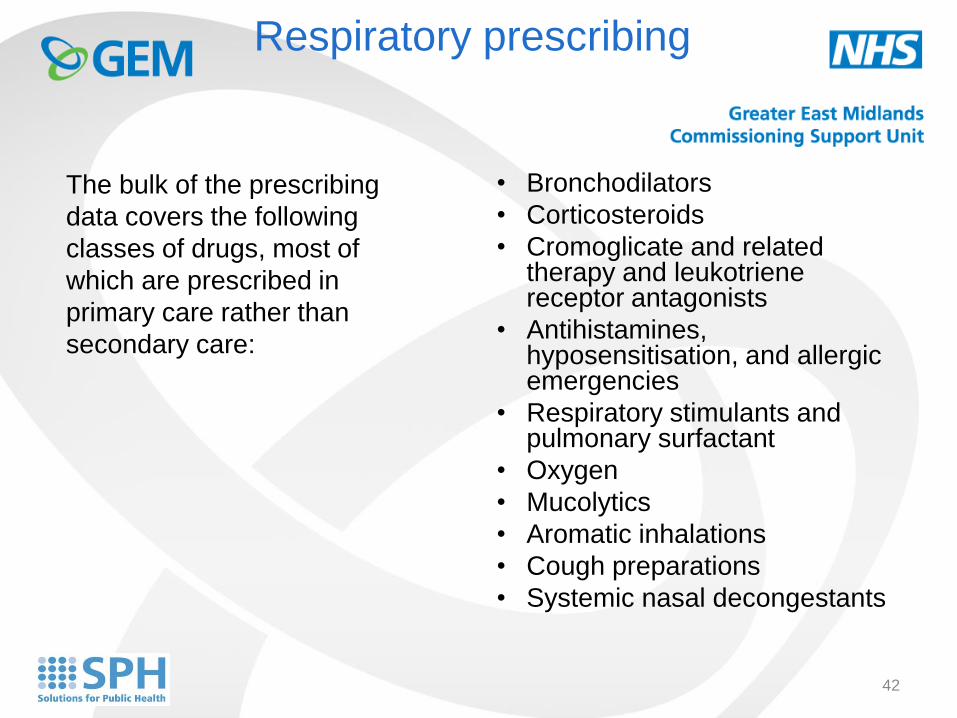
The bulk of the prescribing
data covers the following
classes of drugs, most of
which are prescribed in
primary care rather than
secondary care:
• Bronchodilators
• Corticosteroids
• Cromoglicate and related therapy and leukotriene receptor antagonists
• Antihistamines, hyposensitisation, and allergic emergencies
• Respiratory stimulants and pulmonary surfactant
• Oxygen
• Mucolytics
• Aromatic inhalations
• Cough preparations
• Systemic nasal decongestants
42
Respiratory prescribing
Explanations to consider:
• Prescribing may be appropriate and commensurate with
need ie. high prevalence of asthma and COPD
• Prescribing is suboptimal and requires investigation
• An audit of drugs used in the management of asthma
and COPD could help in the initial investigation of
potentially inappropriate prescribing
• Heads of medicines management could lead
medicine optimisation initiatives to improve healthcare
utilisation, outcomes and reduce spend
43
Respiratory: Management of Asthma and COPD
44
Respiratory primary care
services
The analysis shows the CCG to be in the bottom quintile for
one of the COPD QOF indicators - suggesting that a lower
proportion of patients with COPD are recorded as
benefiting from clinical review with assessment of
breathlessness (every 15 months)
45
Defining high quality primary care in respiratory
disease QOF indicators for smoking, COPD and Asthma
NICE guidance and quality standards for COPD and
Asthma
46
Smoking QOF standards
o Patients with LTCs should have their smoking status
assessed and recorded in their notes within the preceding 15
months
o Patients with LTCs who smoke should be offered smoking
cessation advice or referral to a specialist service, where
available, within the preceding 15 months
o Patients aged 15 years and over should have their
smoking status assessed and recorded in their notes
within the preceding 27 months
o Patients aged 15 years and over who are recorded as
current smokers should be offered support and treatment
within the preceding 27 months
47
High quality COPD care QOF
o The practice produces a register of patients with COPD
o Patients with COPD have a review, undertaken by a
healthcare professional, including an assessment of
breathlessness using the MRC dyspnoea score in
the preceding 15 months
o Patients with COPD are assessed with spirometry and
their FEV1 is recorded within the preceding 15 months.
o Patients with COPD have their diagnosis confirmed by
post bronchodilator spirometry
o Patients with COPD have influenza immunisation in the
preceding 1 September to 31 March
48
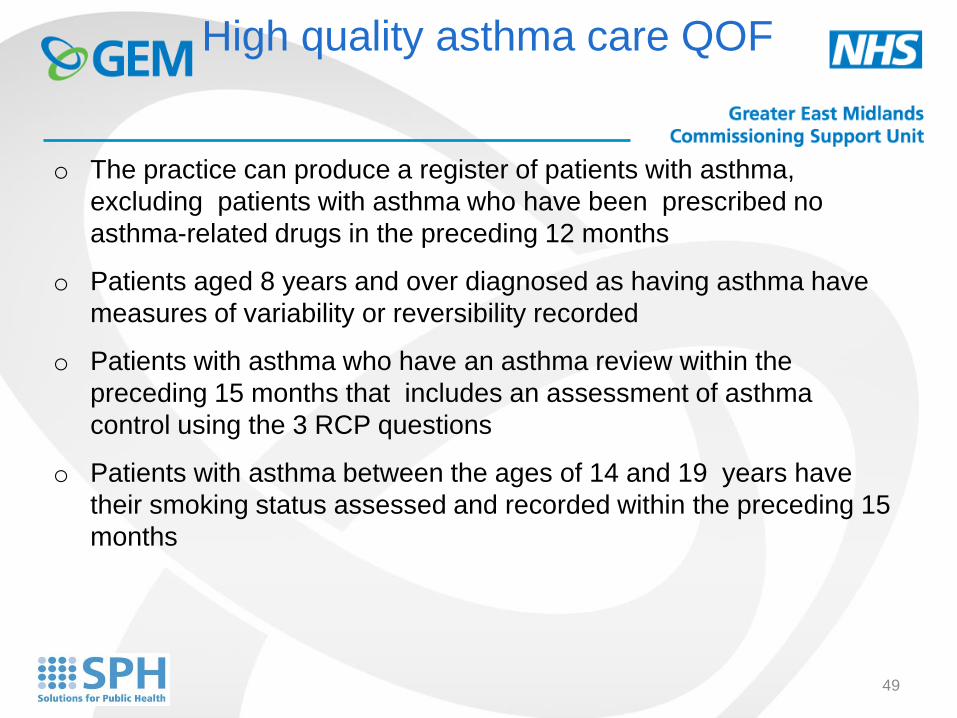
High quality asthma care QOF
o The practice can produce a register of patients with asthma,
excluding patients with asthma who have been prescribed no
asthma-related drugs in the preceding 12 months
o Patients aged 8 years and over diagnosed as having asthma have
measures of variability or reversibility recorded
o Patients with asthma who have an asthma review within the
preceding 15 months that includes an assessment of asthma
control using the 3 RCP questions
o Patients with asthma between the ages of 14 and 19 years have
their smoking status assessed and recorded within the preceding 15
months
49
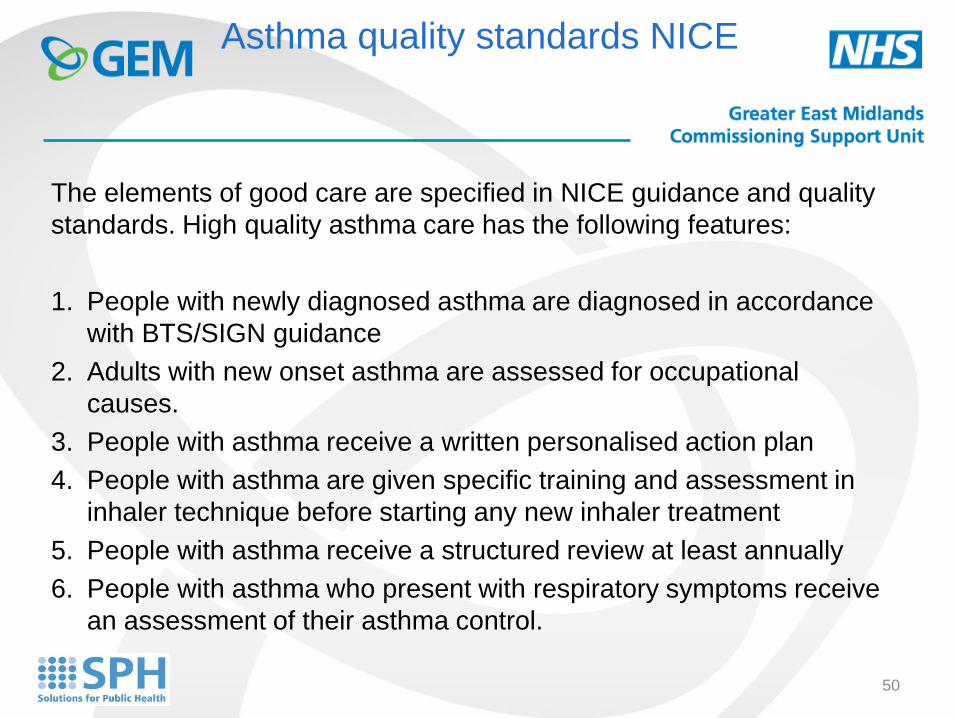
Asthma quality standards NICE
The elements of good care are specified in NICE guidance and quality
standards. High quality asthma care has the following features:
1. People with newly diagnosed asthma are diagnosed in accordance
with BTS/SIGN guidance
2. Adults with new onset asthma are assessed for occupational
causes.
3. People with asthma receive a written personalised action plan
4. People with asthma are given specific training and assessment in
inhaler technique before starting any new inhaler treatment
5. People with asthma receive a structured review at least annually
6. People with asthma who present with respiratory symptoms receive
an assessment of their asthma control.
50
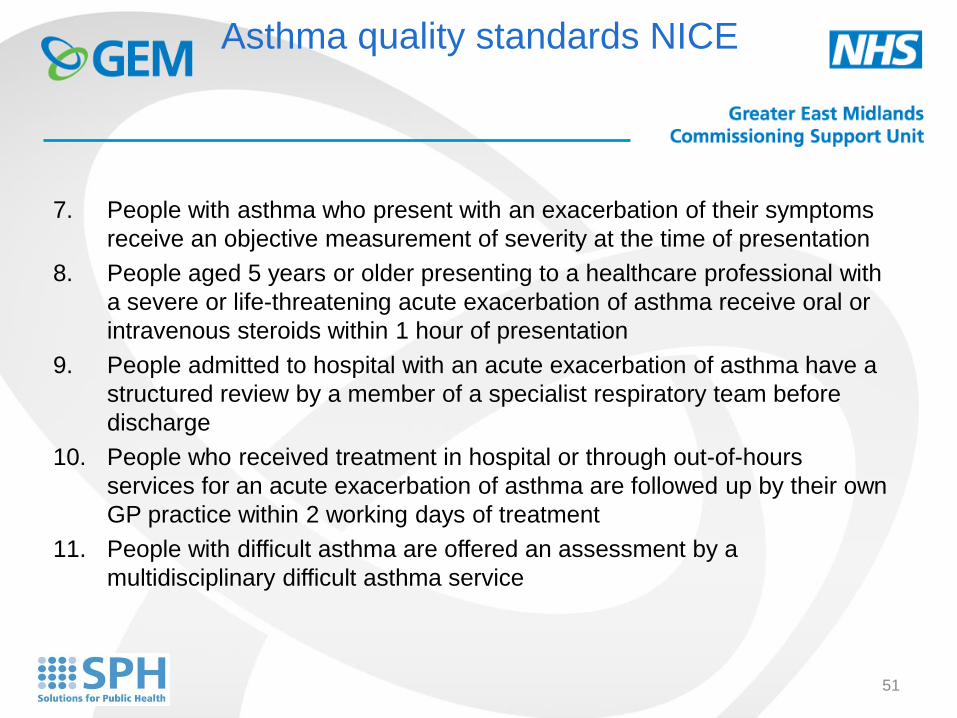
Asthma quality standards NICE
7. People with asthma who present with an exacerbation of their symptoms
receive an objective measurement of severity at the time of presentation
8. People aged 5 years or older presenting to a healthcare professional with
a severe or life-threatening acute exacerbation of asthma receive oral or
intravenous steroids within 1 hour of presentation
9. People admitted to hospital with an acute exacerbation of asthma have a
structured review by a member of a specialist respiratory team before
discharge
10. People who received treatment in hospital or through out-of-hours
services for an acute exacerbation of asthma are followed up by their own
GP practice within 2 working days of treatment
11. People with difficult asthma are offered an assessment by a
multidisciplinary difficult asthma service
51
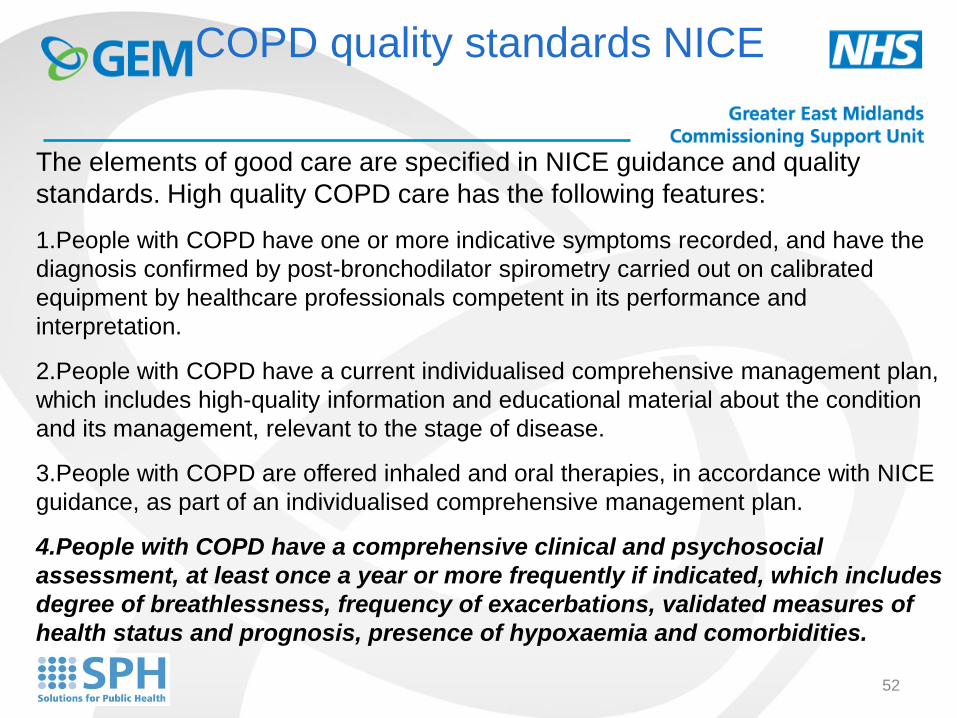
COPD quality standards NICE
The elements of good care are specified in NICE guidance and quality
standards. High quality COPD care has the following features:
1.People with COPD have one or more indicative symptoms recorded, and have the
diagnosis confirmed by post-bronchodilator spirometry carried out on calibrated
equipment by healthcare professionals competent in its performance and
interpretation.
2.People with COPD have a current individualised comprehensive management plan,
which includes high-quality information and educational material about the condition
and its management, relevant to the stage of disease.
3.People with COPD are offered inhaled and oral therapies, in accordance with NICE
guidance, as part of an individualised comprehensive management plan.
4.People with COPD have a comprehensive clinical and psychosocial
assessment, at least once a year or more frequently if indicated, which includes
degree of breathlessness, frequency of exacerbations, validated measures of
health status and prognosis, presence of hypoxaemia and comorbidities.
52
COPD quality standards NICE
5.People with COPD who smoke are regularly encouraged to stop and are
offered the full range of evidence-based smoking cessation support.
6.People with COPD meeting appropriate criteria are offered an effective,
timely and accessible multidisciplinary pulmonary rehabilitation programme.
7.People who have had an exacerbation of COPD are provided with
individualised written advice on early recognition of future exacerbations,
management strategies (including appropriate provision of antibiotics and
corticosteroids for self-treatment at home) and a named contact.
8.People with COPD potentially requiring long-term oxygen therapy are
assessed in accordance with NICE guidance by a specialist oxygen service.
53
COPD quality standards NICE
9.People with COPD receiving long-term oxygen therapy are reviewed in accordance with
NICE guidance, at least annually, by a specialist oxygen service as part of the integrated
clinical management of their COPD.
10.People admitted to hospital with an exacerbation of COPD are cared for by a respiratory
team, and have access to a specialist early supported-discharge scheme with appropriate
community support.
11.People admitted to hospital with an exacerbation of COPD and with persistent acidotic
ventilatory failure are promptly assessed for, and receive, non-invasive ventilation delivered by
appropriately trained staff in a dedicated setting.
12.People admitted to hospital with an exacerbation of COPD are reviewed within 2 weeks of
discharge.
13.People with advanced COPD, and their carers, are identified and offered palliative care that
addresses physical, social and emotional needs.
54
Respiratory primary care
Explanations to be considered:
• Is the annual assessment of COPD patients systematic
in the assessment of breathlessness using the MRC
dyspnoea score?
55
Respiratory Secondary Care
56
Respiratory secondary care
Hypothesis:
o Asthma and COPD are ambulatory care sensitive
conditions
o Ambulatory care sensitive (ACS) conditions are chronic
conditions for which it is possible to prevent acute
exacerbations and reduce the need for hospital admission
through active management, such as vaccination; better
self-management, disease management or case
management; or lifestyle interventions
o Most asthma and COPD is managed in primary care but
effective control requires multidisciplinary teams working
across both primary and secondary care
57
Respiratory secondary care
Hypothesis
o Despite hospital admission for asthma and COPD being largely
preventable, a significant proportion of all acute hospital activity is
related to asthma and COPD.
o Variation in admission rates is likely to reflect variation in how
effectively asthma and COPD are managed particularly in primary
care
o Admissions for respiratory tract infections such as influenza and
pneumonia are also preventable through effective vaccination in at
risk subgroups of the population and high quality primary care
management of RTIs
o These avoidable admissions are costly and offer the opportunity
for significant financial savings
58
Respiratory secondary care
Evidence based interventions for reducing spend and improving
outcomes in ACS conditions:
• Purdy S (2010). Avoiding Hospital Admissions. What does the
research evidence say? London: The King’s Fund.
• NICE clinical guideline and Quality standards for COPD
• British Thoracic Society and Scottish Intercollegiate Guidelines
Network clinical guideline 101 (2008, updated 2011) and NICE
Quality standards for asthma
59
Respiratory secondary care
Indicators are in the bottom quintile of the
benchmark group include those for:
• Hospital admissions (all, emergency) for all
respiratory conditions including ambulatory care
sensitive conditions – asthma and respiratory
tract infections (including influenza and
pneumonia)
• Respiratory spend (all, emergency)
60
Respiratory secondary care
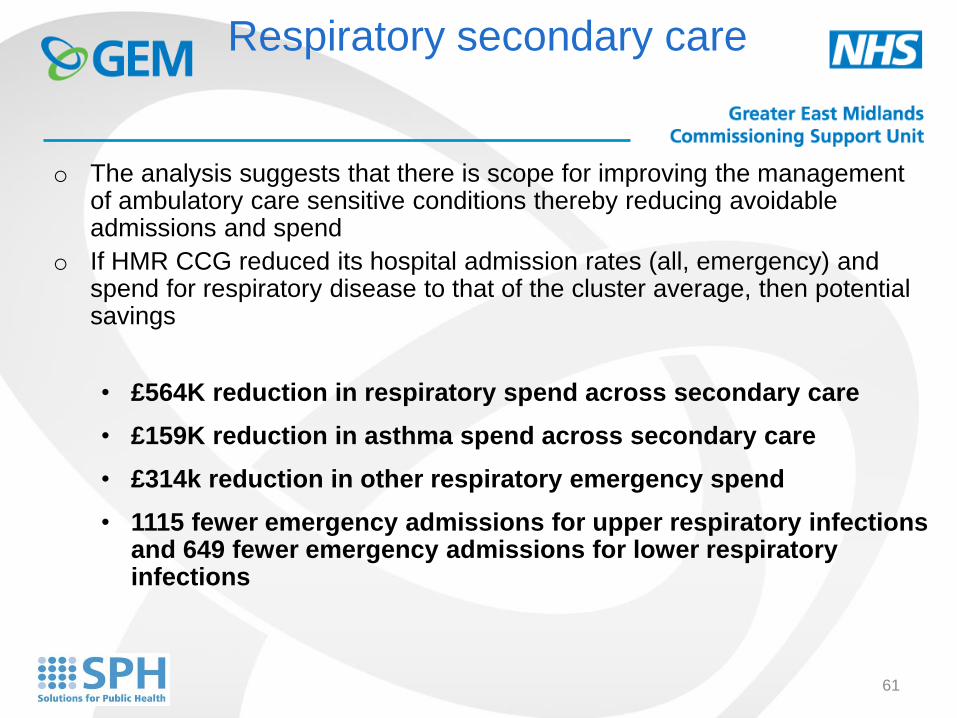
o The analysis suggests that there is scope for improving the management of ambulatory care sensitive conditions thereby reducing avoidable admissions and spend
o If HMR CCG reduced its hospital admission rates (all, emergency) and spend for respiratory disease to that of the cluster average, then potential savings
• £564K reduction in respiratory spend across secondary care
• £159K reduction in asthma spend across secondary care
• £314k reduction in other respiratory emergency spend
• 1115 fewer emergency admissions for upper respiratory infections and 649 fewer emergency admissions for lower respiratory infections
61
0 / 3 indicators are in the bottom quintile of the benchmark group:
Summary: Mortality
3. ANALYSIS
62
• Practices are compared using a benchmark cluster group of the most similar
practices in terms of age, ethnicity, deprivation and population density. The
practice cluster group definitions and constituent practices are in Annex 3.
Practices are compared for all the indicators where data is available at
practice level
• This information is presented here to form the basis of a discussion between
the CCG, the CSU and Public Health about how further analysis could
support practices in reducing unexplained practice variation
• The number of indicators where the practice is in the bottom quintile for the
practice cluster has been compared on the next slide and the opportunities
for the practices with the highest number of indicators in the bottom quintile
has been quantified on the subsequent slide
• Practices will have less influence on management in secondary care than
they do on management in primary care and this should be taken into
account in the way CCGs interpret the information on practice variation
4. Where to focus: Understanding practice variation
63
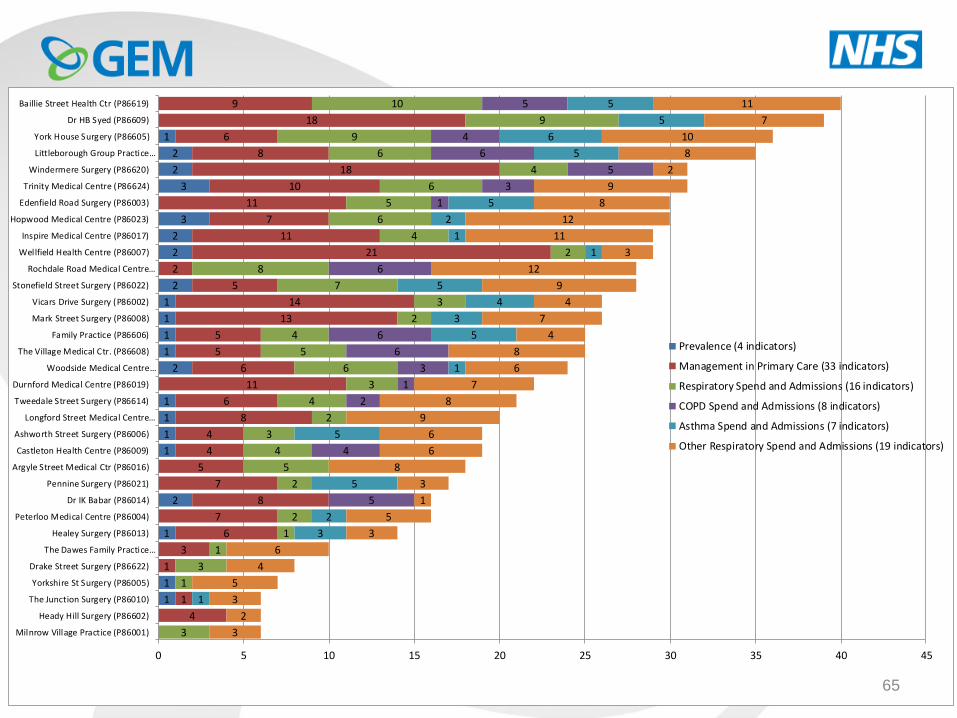
Number of Respiratory indicators in the bottom quintile of the practice cluster
4. Where to focus: Understanding practice variation
Note, some of the data are based on small numbers. Statistical significance has not been tested and should not be inferred. The
data are presented to identify potential areas of improvements rather than providing a definitive comparison of performance.
The chart on the following slide shows the number of Respiratory indicators in the bottom quintile of the practice cluster.
Each coloured bar represents a different set of indicators e.g. dark blue is prevalence. The specific indicators are then
shown in the table on slides 20-24 for the 3 practices with the highest total number of indicators in the bottom quintile
64
4. Where to focus: Understanding practice variation
Each coloured bar
represents a different set
of indicators e.g. dark
blue is prevalence. The
specific indicators are
then shown in the table
on slides 19-23 for the 3
practices with the highest
total number of indicators
in the bottom quintile
1
1
1
2
1
1
1
1
2
1
1
1
1
2
2
2
3
3
2
2
1
4
1
1
3
6
7
8
7
5
4
4
8
6
11
6
5
5
13
14
5
2
21
11
7
11
10
18
8
6
18
9
3
1
3
1
1
2
2
5
4
3
2
4
3
6
5
4
2
3
7
8
2
4
6
5
6
4
6
9
9
10
5
4
2
1
3
6
6
6
1
3
5
6
4
5
1
3
2
5
5
1
5
3
4
5
1
1
2
5
5
6
5
5
3
2
3
5
4
6
3
5
1
3
8
6
6
9
8
7
6
8
4
7
4
9
12
3
11
12
8
9
2
8
10
7
11
0 5 10 15 20 25 30 35 40 45
Milnrow Village Practice (P86001)
Heady Hill Surgery (P86602)
The Junction Surgery (P86010)
Yorkshire St Surgery (P86005)
Drake Street Surgery (P86622)
The Dawes Family Practice…
Healey Surgery (P86013)
Peterloo Medical Centre (P86004)
Dr IK Babar (P86014)
Pennine Surgery (P86021)
Argyle Street Medical Ctr (P86016)
Castleton Health Centre (P86009)
Ashworth Street Surgery (P86006)
Longford Street Medical Centre…
Tweedale Street Surgery (P86614)
Durnford Medical Centre (P86019)
Woodside Medical Centre…
The Village Medical Ctr. (P86608)
Family Practice (P86606)
Mark Street Surgery (P86008)
Vicars Drive Surgery (P86002)
Stonefield Street Surgery (P86022)
Rochdale Road Medical Centre…
Wellfield Health Centre (P86007)
Inspire Medical Centre (P86017)
Hopwood Medical Centre (P86023)
Edenfield Road Surgery (P86003)
Trinity Medical Centre (P86624)
Windermere Surgery (P86620)
Littleborough Group Practice…
York House Surgery (P86605)
Dr HB Syed (P86609)
Baillie Street Health Ctr (P86619)
Prevalence (4 indicators)
Management in Primary Care (33 indicators)
Respiratory Spend and Admissions (16 indicators)
COPD Spend and Admissions (8 indicators)
Asthma Spend and Admissions (7 indicators)
Other Respiratory Spend and Admissions (19 indicators)
65
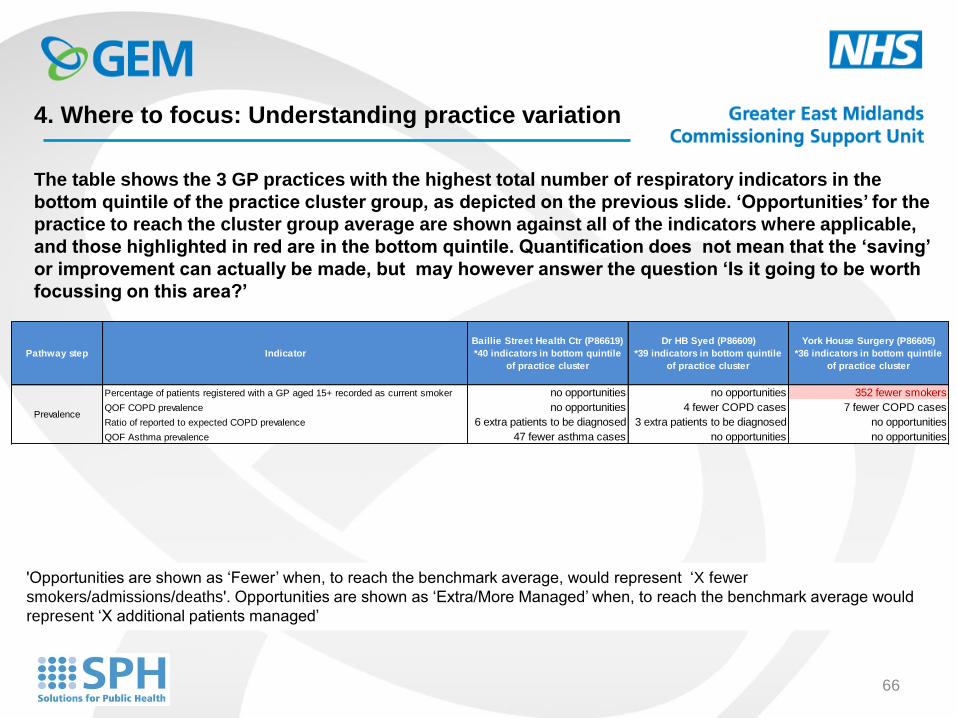
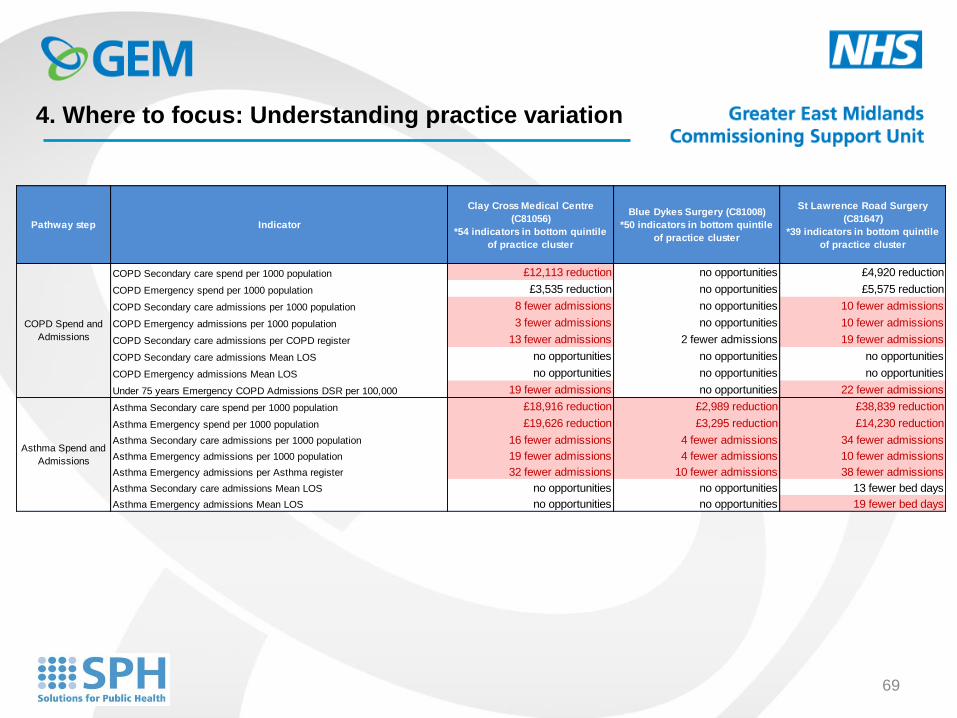
The table shows the 3 GP practices with the highest total number of respiratory indicators in the
bottom quintile of the practice cluster group, as depicted on the previous slide. ‘Opportunities’ for the
practice to reach the cluster group average are shown against all of the indicators where applicable,
and those highlighted in red are in the bottom quintile. Quantification does not mean that the ‘saving’
or improvement can actually be made, but may however answer the question ‘Is it going to be worth
focussing on this area?’
4. Where to focus: Understanding practice variation
'Opportunities are shown as ‘Fewer’ when, to reach the benchmark average, would represent ‘X fewer
smokers/admissions/deaths'. Opportunities are shown as ‘Extra/More Managed’ when, to reach the benchmark average would
represent ‘X additional patients managed’
Pathway step Indicator
Baillie Street Health Ctr (P86619)
*40 indicators in bottom quintile
of practice cluster
Dr HB Syed (P86609)
*39 indicators in bottom quintile
of practice cluster
York House Surgery (P86605)
*36 indicators in bottom quintile
of practice cluster
Percentage of patients registered with a GP aged 15+ recorded as current smoker no opportunities no opportunities 352 fewer smokers
QOF COPD prevalence no opportunities 4 fewer COPD cases 7 fewer COPD cases
Ratio of reported to expected COPD prevalence 6 extra patients to be diagnosed 3 extra patients to be diagnosed no opportunities
QOF Asthma prevalence 47 fewer asthma cases no opportunities no opportunities
Prevalence
66
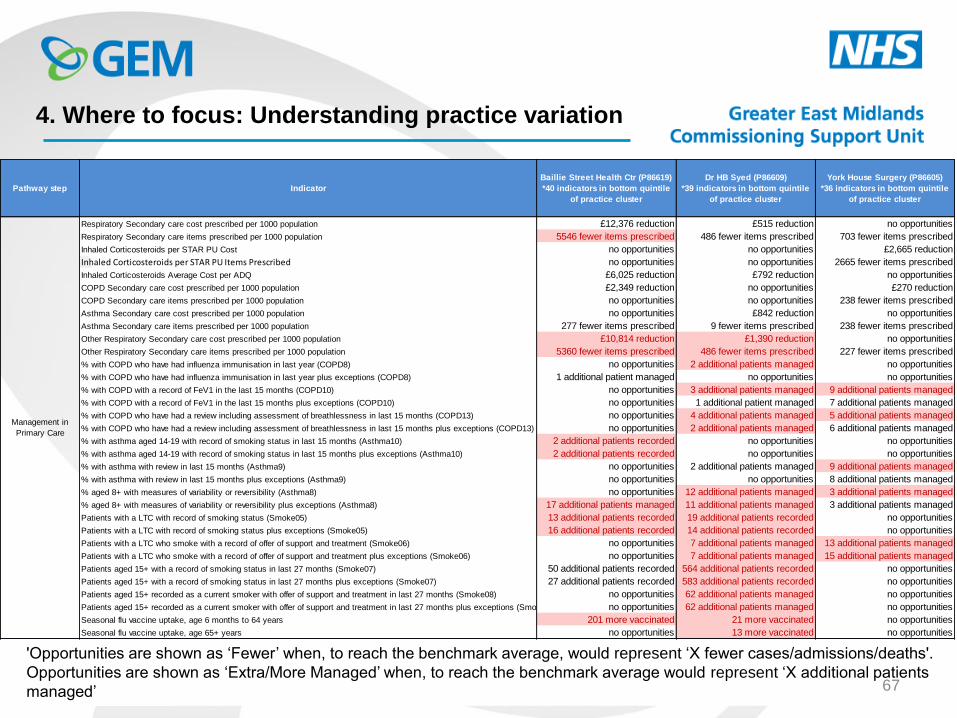
4. Where to focus: Understanding practice variation
'Opportunities are shown as ‘Fewer’ when, to reach the benchmark average, would represent ‘X fewer cases/admissions/deaths'.
Opportunities are shown as ‘Extra/More Managed’ when, to reach the benchmark average would represent ‘X additional patients
managed’
Pathway step Indicator
Baillie Street Health Ctr (P86619)
*40 indicators in bottom quintile
of practice cluster
Dr HB Syed (P86609)
*39 indicators in bottom quintile
of practice cluster
York House Surgery (P86605)
*36 indicators in bottom quintile
of practice cluster
Respiratory Secondary care cost prescribed per 1000 population £12,376 reduction £515 reduction no opportunities
Respiratory Secondary care items prescribed per 1000 population 5546 fewer items prescribed 486 fewer items prescribed 703 fewer items prescribed
Inhaled Corticosteroids per STAR PU Cost no opportunities no opportunities £2,665 reduction
Inhaled Corticosteroids per STAR PU Items Prescribed no opportunities no opportunities 2665 fewer items prescribed
Inhaled Corticosteroids Average Cost per ADQ £6,025 reduction £792 reduction no opportunities
COPD Secondary care cost prescribed per 1000 population £2,349 reduction no opportunities £270 reduction
COPD Secondary care items prescribed per 1000 population no opportunities no opportunities 238 fewer items prescribed
Asthma Secondary care cost prescribed per 1000 population no opportunities £842 reduction no opportunities
Asthma Secondary care items prescribed per 1000 population 277 fewer items prescribed 9 fewer items prescribed 238 fewer items prescribed
Other Respiratory Secondary care cost prescribed per 1000 population £10,814 reduction £1,390 reduction no opportunities
Other Respiratory Secondary care items prescribed per 1000 population 5360 fewer items prescribed 486 fewer items prescribed 227 fewer items prescribed
% with COPD who have had influenza immunisation in last year (COPD8) no opportunities 2 additional patients managed no opportunities
% with COPD who have had influenza immunisation in last year plus exceptions (COPD8) 1 additional patient managed no opportunities no opportunities
% with COPD with a record of FeV1 in the last 15 months (COPD10) no opportunities 3 additional patients managed 9 additional patients managed
% with COPD with a record of FeV1 in the last 15 months plus exceptions (COPD10) no opportunities 1 additional patient managed 7 additional patients managed
% with COPD who have had a review including assessment of breathlessness in last 15 months (COPD13) no opportunities 4 additional patients managed 5 additional patients managed
% with COPD who have had a review including assessment of breathlessness in last 15 months plus exceptions (COPD13) no opportunities 2 additional patients managed 6 additional patients managed
% with asthma aged 14-19 with record of smoking status in last 15 months (Asthma10) 2 additional patients recorded no opportunities no opportunities
% with asthma aged 14-19 with record of smoking status in last 15 months plus exceptions (Asthma10) 2 additional patients recorded no opportunities no opportunities
% with asthma with review in last 15 months (Asthma9) no opportunities 2 additional patients managed 9 additional patients managed
% with asthma with review in last 15 months plus exceptions (Asthma9) no opportunities no opportunities 8 additional patients managed
% aged 8+ with measures of variability or reversibility (Asthma8) no opportunities 12 additional patients managed 3 additional patients managed
% aged 8+ with measures of variability or reversibility plus exceptions (Asthma8) 17 additional patients managed 11 additional patients managed 3 additional patients managed
Patients with a LTC with record of smoking status (Smoke05) 13 additional patients recorded 19 additional patients recorded no opportunities
Patients with a LTC with record of smoking status plus exceptions (Smoke05) 16 additional patients recorded 14 additional patients recorded no opportunities
Patients with a LTC who smoke with a record of offer of support and treatment (Smoke06) no opportunities 7 additional patients managed 13 additional patients managed
Patients with a LTC who smoke with a record of offer of support and treatment plus exceptions (Smoke06) no opportunities 7 additional patients managed 15 additional patients managed
Patients aged 15+ with a record of smoking status in last 27 months (Smoke07) 50 additional patients recorded 564 additional patients recorded no opportunities
Patients aged 15+ with a record of smoking status in last 27 months plus exceptions (Smoke07) 27 additional patients recorded 583 additional patients recorded no opportunities
Patients aged 15+ recorded as a current smoker with offer of support and treatment in last 27 months (Smoke08) no opportunities 62 additional patients managed no opportunities
Patients aged 15+ recorded as a current smoker with offer of support and treatment in last 27 months plus exceptions (Smoke08) no opportunities 62 additional patients managed no opportunities
Seasonal flu vaccine uptake, age 6 months to 64 years 201 more vaccinated 21 more vaccinated no opportunities
Seasonal flu vaccine uptake, age 65+ years no opportunities 13 more vaccinated no opportunities
Management in
Primary Care
67
4. Where to focus: Understanding practice variation
Pathway step Indicator
Baillie Street Health Ctr (P86619)
*40 indicators in bottom quintile
of practice cluster
Dr HB Syed (P86609)
*39 indicators in bottom quintile
of practice cluster
York House Surgery (P86605)
*36 indicators in bottom quintile
of practice cluster
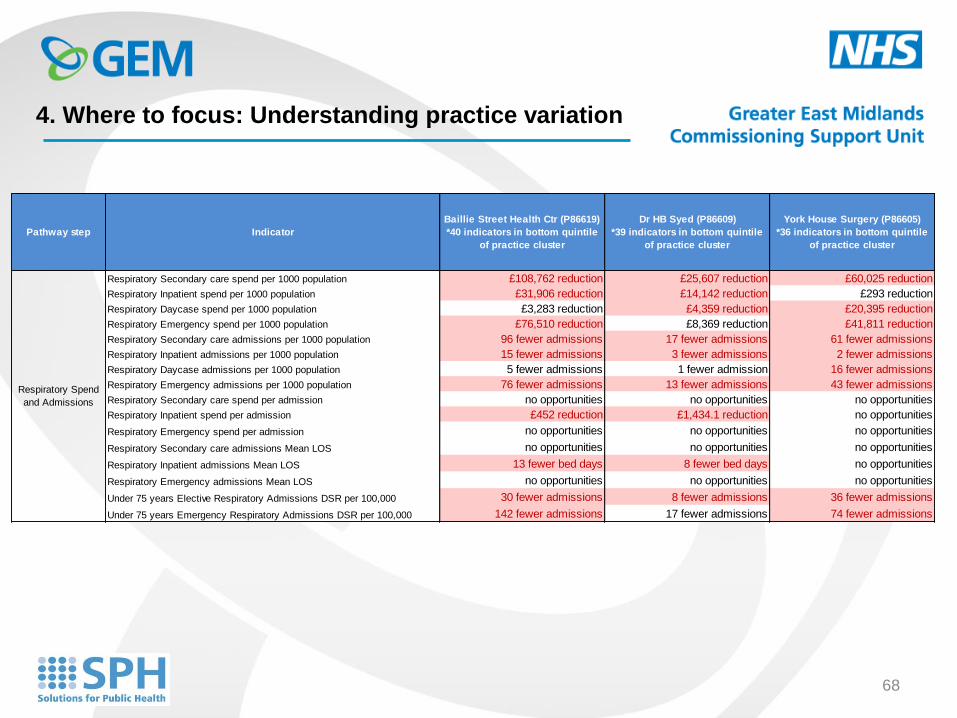
Respiratory Secondary care spend per 1000 population £108,762 reduction £25,607 reduction £60,025 reduction
Respiratory Inpatient spend per 1000 population £31,906 reduction £14,142 reduction £293 reduction
Respiratory Daycase spend per 1000 population £3,283 reduction £4,359 reduction £20,395 reduction
Respiratory Emergency spend per 1000 population £76,510 reduction £8,369 reduction £41,811 reduction
Respiratory Secondary care admissions per 1000 population 96 fewer admissions 17 fewer admissions 61 fewer admissions
Respiratory Inpatient admissions per 1000 population 15 fewer admissions 3 fewer admissions 2 fewer admissions
Respiratory Daycase admissions per 1000 population 5 fewer admissions 1 fewer admission 16 fewer admissions
Respiratory Emergency admissions per 1000 population 76 fewer admissions 13 fewer admissions 43 fewer admissions
Respiratory Secondary care spend per admission no opportunities no opportunities no opportunities
Respiratory Inpatient spend per admission £452 reduction £1,434.1 reduction no opportunities
Respiratory Emergency spend per admission no opportunities no opportunities no opportunities
Respiratory Secondary care admissions Mean LOS no opportunities no opportunities no opportunities
Respiratory Inpatient admissions Mean LOS 13 fewer bed days 8 fewer bed days no opportunities
Respiratory Emergency admissions Mean LOS no opportunities no opportunities no opportunities
Under 75 years Elective Respiratory Admissions DSR per 100,000 30 fewer admissions 8 fewer admissions 36 fewer admissions
Under 75 years Emergency Respiratory Admissions DSR per 100,000 142 fewer admissions 17 fewer admissions 74 fewer admissions
Respiratory Spend
and Admissions
68
4. Where to focus: Understanding practice variation
Pathway step Indicator
Clay Cross Medical Centre
(C81056)
*54 indicators in bottom quintile
of practice cluster
Blue Dykes Surgery (C81008)
*50 indicators in bottom quintile
of practice cluster
St Lawrence Road Surgery
(C81647)
*39 indicators in bottom quintile
of practice cluster
COPD Secondary care spend per 1000 population £12,113 reduction no opportunities £4,920 reduction
COPD Emergency spend per 1000 population £3,535 reduction no opportunities £5,575 reduction
COPD Secondary care admissions per 1000 population 8 fewer admissions no opportunities 10 fewer admissions
COPD Emergency admissions per 1000 population 3 fewer admissions no opportunities 10 fewer admissions
COPD Secondary care admissions per COPD register 13 fewer admissions 2 fewer admissions 19 fewer admissions
COPD Secondary care admissions Mean LOS no opportunities no opportunities no opportunities
COPD Emergency admissions Mean LOS no opportunities no opportunities no opportunities
Under 75 years Emergency COPD Admissions DSR per 100,000 19 fewer admissions no opportunities 22 fewer admissions
Asthma Secondary care spend per 1000 population £18,916 reduction £2,989 reduction £38,839 reduction
Asthma Emergency spend per 1000 population £19,626 reduction £3,295 reduction £14,230 reduction
Asthma Secondary care admissions per 1000 population 16 fewer admissions 4 fewer admissions 34 fewer admissions
Asthma Emergency admissions per 1000 population 19 fewer admissions 4 fewer admissions 10 fewer admissions
Asthma Emergency admissions per Asthma register 32 fewer admissions 10 fewer admissions 38 fewer admissions
Asthma Secondary care admissions Mean LOS no opportunities no opportunities 13 fewer bed days
Asthma Emergency admissions Mean LOS no opportunities no opportunities 19 fewer bed days
COPD Spend and
Admissions
Asthma Spend and
Admissions
69
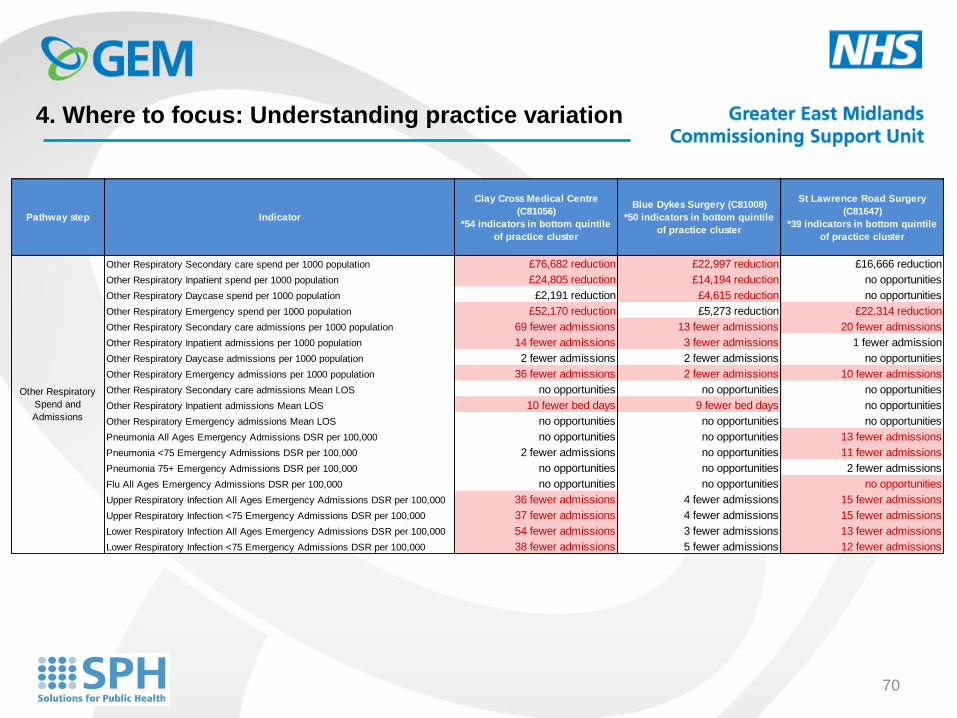
4. Where to focus: Understanding practice variation
Pathway step Indicator
Clay Cross Medical Centre
(C81056)
*54 indicators in bottom quintile
of practice cluster
Blue Dykes Surgery (C81008)
*50 indicators in bottom quintile
of practice cluster
St Lawrence Road Surgery
(C81647)
*39 indicators in bottom quintile
of practice cluster
Other Respiratory Secondary care spend per 1000 population £76,682 reduction £22,997 reduction £16,666 reduction
Other Respiratory Inpatient spend per 1000 population £24,805 reduction £14,194 reduction no opportunities
Other Respiratory Daycase spend per 1000 population £2,191 reduction £4,615 reduction no opportunities
Other Respiratory Emergency spend per 1000 population £52,170 reduction £5,273 reduction £22,314 reduction
Other Respiratory Secondary care admissions per 1000 population 69 fewer admissions 13 fewer admissions 20 fewer admissions
Other Respiratory Inpatient admissions per 1000 population 14 fewer admissions 3 fewer admissions 1 fewer admission
Other Respiratory Daycase admissions per 1000 population 2 fewer admissions 2 fewer admissions no opportunities
Other Respiratory Emergency admissions per 1000 population 36 fewer admissions 2 fewer admissions 10 fewer admissions
Other Respiratory Secondary care admissions Mean LOS no opportunities no opportunities no opportunities
Other Respiratory Inpatient admissions Mean LOS 10 fewer bed days 9 fewer bed days no opportunities
Other Respiratory Emergency admissions Mean LOS no opportunities no opportunities no opportunities
Pneumonia All Ages Emergency Admissions DSR per 100,000 no opportunities no opportunities 13 fewer admissions
Pneumonia <75 Emergency Admissions DSR per 100,000 2 fewer admissions no opportunities 11 fewer admissions
Pneumonia 75+ Emergency Admissions DSR per 100,000 no opportunities no opportunities 2 fewer admissions
Flu All Ages Emergency Admissions DSR per 100,000 no opportunities no opportunities no opportunities
Upper Respiratory Infection All Ages Emergency Admissions DSR per 100,000 36 fewer admissions 4 fewer admissions 15 fewer admissions
Upper Respiratory Infection <75 Emergency Admissions DSR per 100,000 37 fewer admissions 4 fewer admissions 15 fewer admissions
Lower Respiratory Infection All Ages Emergency Admissions DSR per 100,000 54 fewer admissions 3 fewer admissions 13 fewer admissions
Lower Respiratory Infection <75 Emergency Admissions DSR per 100,000 38 fewer admissions 5 fewer admissions 12 fewer admissions
Other Respiratory
Spend and
Admissions
70
CCGs should consider what local intelligence is available to further triangulate with the intelligence in
this pack. This may include:
• Practice variation analyses
• Reviewing referral protocols and guidelines
• Analysis from Acute Trust quality dashboard or other provider data
• Contract monitoring data
• Next step is to move from intelligence to action
• CCG needs to identify from the summary slides where to focus and what could work and which
CCG may be an exemplar to follow
There are also many resources available on www.rightcare.nhs.uk to take forwards the improvement
agenda.
5. Bringing it all together – Where to focus, what could work, who should
we speak to
71
5. National Guidance
• British Lung Foundation (2007) Invisible lives: chronic obstructive pulmonary
disease (COPD) finding the missing millions.
• Department of Health (2010) Consultation on a strategy for services for
chronic obstructive pulmonary disease (COPD) in England – impact
assessment. London: Department of Health
• Healthcare Commission (2006) Clearing the air: a national study of chronic
obstructive pulmonary disease. London: Healthcare Commission.
• NICE (2010) Chronic obstructive pulmonary disease: management of
chronic obstructive pulmonary disease in adults in primary and secondary
care (partial update). NICE clinical guideline 101. London: National Institute
for Health and Clinical Excellence. Available from
www.nice.org.uk/guidance/CG101
72
5. National Guidance
• The Kings fund 2010 : Avoiding Hospital Admissions
• Chronic obstructive pulmonary disease: management of chronic obstructive
pulmonary disease in adults in primary and secondary care. NICE clinical
guideline 12 (2004). [Replaced by NICE clinical guideline 101]
• British Guideline on the Management of Asthma: SIGN101, ISBN 978 1
90581 28 5, May 2008, Revised May 2011, Section 4.3.4 revised Sept 2011,
Section 1 revised Jan 2012
73
Annexes
Annex 1 – Spine charts and opportunity tables
Annex 2 – CCG Cluster Classification
Annex 3 – Practice Cluster Classification
Annex 4 – Indicator List
Glossary
74
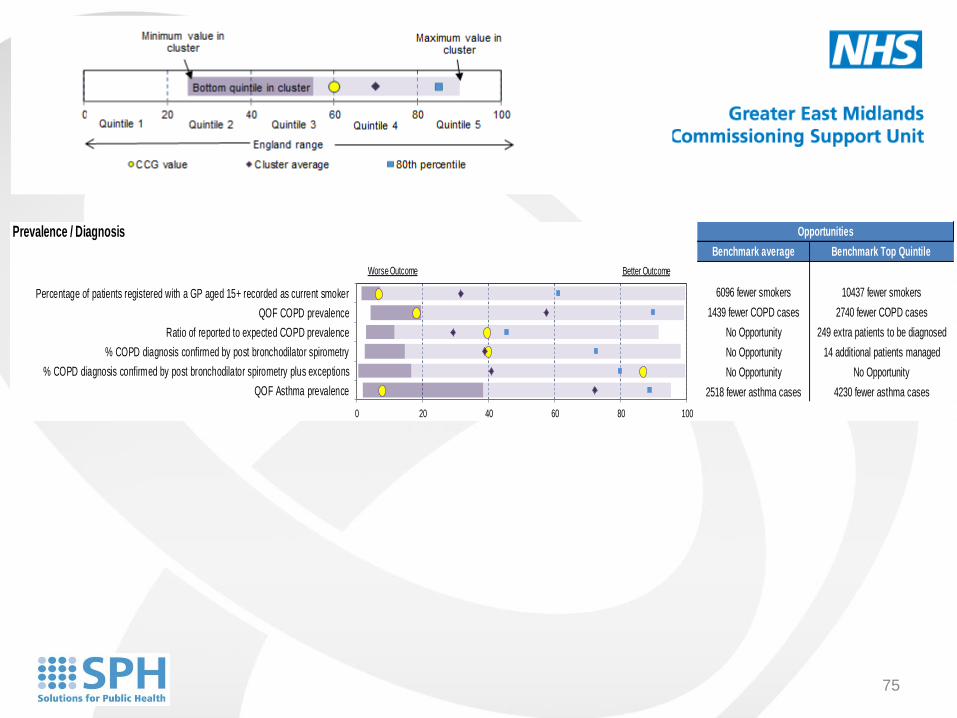
Annex 1: Spine Charts
Prevalence / Diagnosis
Benchmark average Benchmark Top Quintile
6096 fewer smokers 10437 fewer smokers
1439 fewer COPD cases 2740 fewer COPD cases
No Opportunity 249 extra patients to be diagnosed
No Opportunity 14 additional patients managed
No Opportunity No Opportunity
2518 fewer asthma cases 4230 fewer asthma cases
Opportunities
0 20 40 60 80 100
Percentage of patients registered with a GP aged 15+ recorded as current smoker
QOF COPD prevalence
Ratio of reported to expected COPD prevalence
% COPD diagnosis confirmed by post bronchodilator spirometry
% COPD diagnosis confirmed by post bronchodilator spirometry plus exceptions
QOF Asthma prevalence
Worse Outcome Better Outcome
75
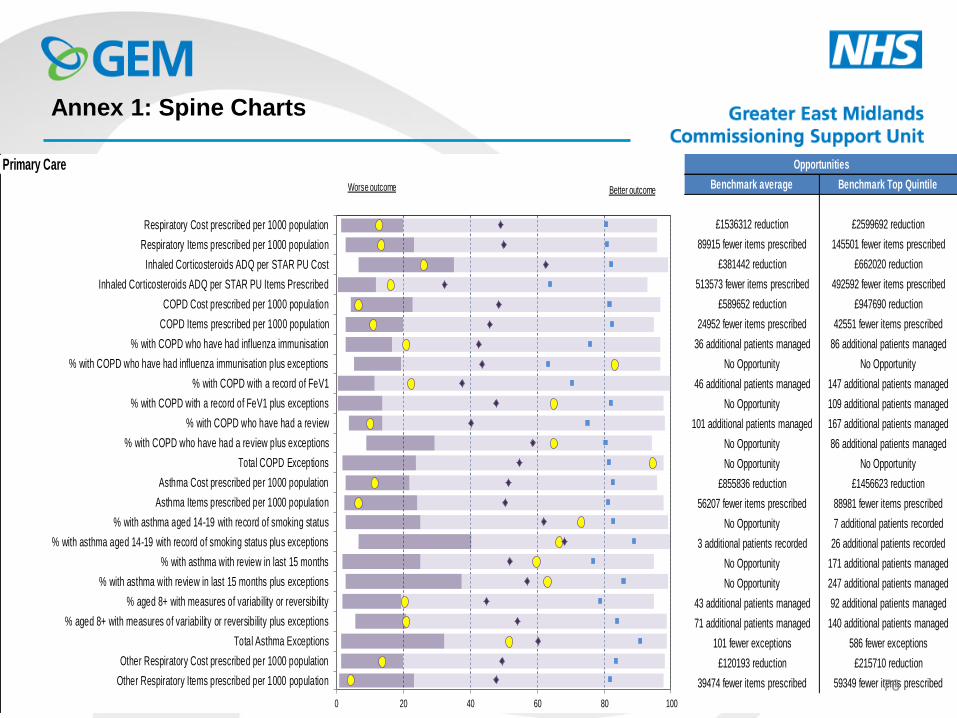
Annex 1: Spine Charts
Primary Care
Benchmark average Benchmark Top Quintile
£1536312 reduction £2599692 reduction
89915 fewer items prescribed 145501 fewer items prescribed
£381442 reduction £662020 reduction
513573 fewer items prescribed 492592 fewer items prescribed
£589652 reduction £947690 reduction
24952 fewer items prescribed 42551 fewer items prescribed
36 additional patients managed 86 additional patients managed
No Opportunity No Opportunity
46 additional patients managed 147 additional patients managed
No Opportunity 109 additional patients managed
101 additional patients managed 167 additional patients managed
No Opportunity 86 additional patients managed
No Opportunity No Opportunity
£855836 reduction £1456623 reduction
56207 fewer items prescribed 88981 fewer items prescribed
No Opportunity 7 additional patients recorded
3 additional patients recorded 26 additional patients recorded
No Opportunity 171 additional patients managed
No Opportunity 247 additional patients managed
43 additional patients managed 92 additional patients managed
71 additional patients managed 140 additional patients managed
101 fewer exceptions 586 fewer exceptions
£120193 reduction £215710 reduction
39474 fewer items prescribed 59349 fewer items prescribed
Opportunities
0 20 40 60 80 100
Respiratory Cost prescribed per 1000 population
Respiratory Items prescribed per 1000 population
Inhaled Corticosteroids ADQ per STAR PU Cost
Inhaled Corticosteroids ADQ per STAR PU Items Prescribed
COPD Cost prescribed per 1000 population
COPD Items prescribed per 1000 population
% with COPD who have had influenza immunisation
% with COPD who have had influenza immunisation plus exceptions
% with COPD with a record of FeV1
% with COPD with a record of FeV1 plus exceptions
% with COPD who have had a review
% with COPD who have had a review plus exceptions
Total COPD Exceptions
Asthma Cost prescribed per 1000 population
Asthma Items prescribed per 1000 population
% with asthma aged 14-19 with record of smoking status
% with asthma aged 14-19 with record of smoking status plus exceptions
% with asthma with review in last 15 months
% with asthma with review in last 15 months plus exceptions
% aged 8+ with measures of variability or reversibility
% aged 8+ with measures of variability or reversibility plus exceptions
Total Asthma Exceptions
Other Respiratory Cost prescribed per 1000 population
Other Respiratory Items prescribed per 1000 population
Worse outcome Better outcome
76
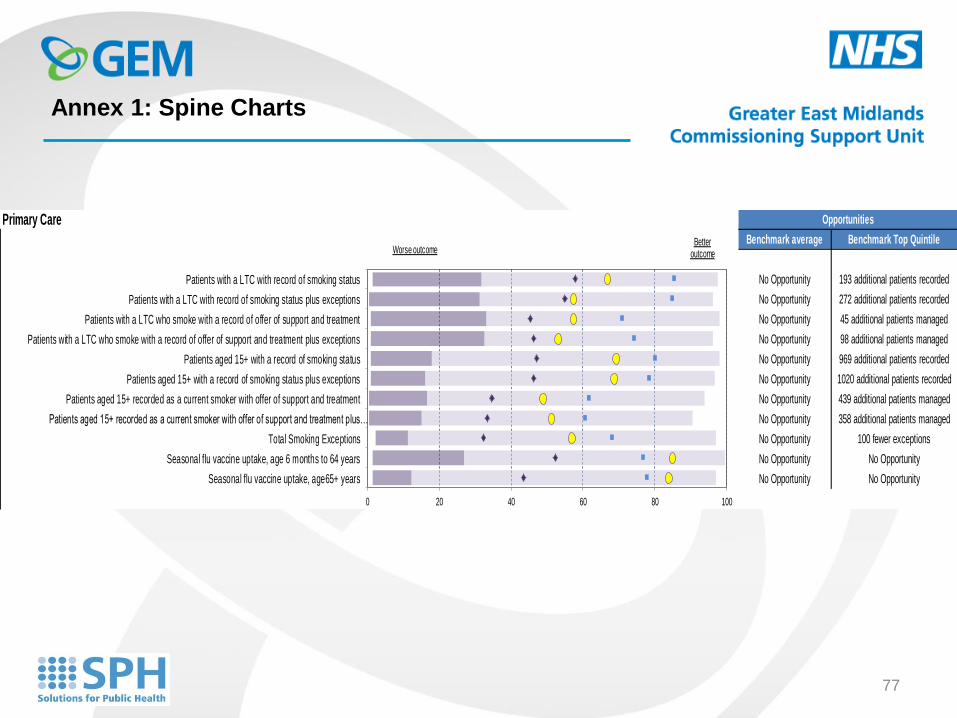
Annex 1: Spine Charts
Primary Care
Benchmark average Benchmark Top Quintile
No Opportunity 193 additional patients recorded
No Opportunity 272 additional patients recorded
No Opportunity 45 additional patients managed
No Opportunity 98 additional patients managed
No Opportunity 969 additional patients recorded
No Opportunity 1020 additional patients recorded
No Opportunity 439 additional patients managed
No Opportunity 358 additional patients managed
No Opportunity 100 fewer exceptions
No Opportunity No Opportunity
No Opportunity No Opportunity
Opportunities
Better outcome
0 20 40 60 80 100
Patients with a LTC with record of smoking status
Patients with a LTC with record of smoking status plus exceptions
Patients with a LTC who smoke with a record of offer of support and treatment
Patients with a LTC who smoke with a record of offer of support and treatment plus exceptions
Patients aged 15+ with a record of smoking status
Patients aged 15+ with a record of smoking status plus exceptions
Patients aged 15+ recorded as a current smoker with offer of support and treatment
Patients aged 15+ recorded as a current smoker with offer of support and treatment plus…
Total Smoking Exceptions
Seasonal flu vaccine uptake, age 6 months to 64 years
Seasonal flu vaccine uptake, age65+ years
Worse outcome
77
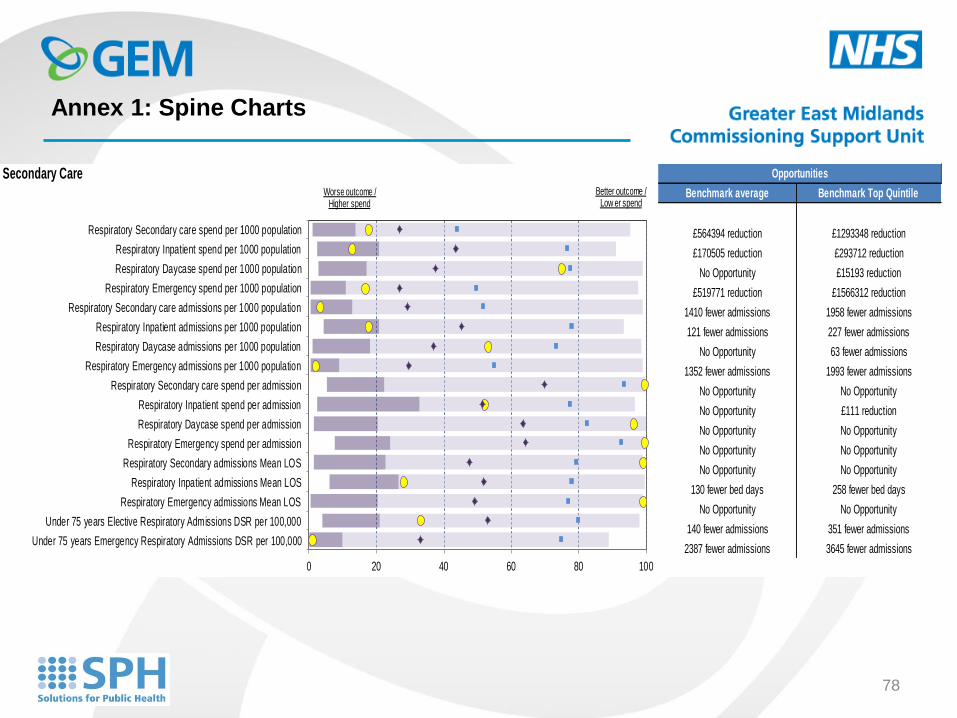
Annex 1: Spine Charts
Secondary Care
Benchmark average Benchmark Top Quintile
£564394 reduction £1293348 reduction
£170505 reduction £293712 reduction
No Opportunity £15193 reduction
£519771 reduction £1566312 reduction
1410 fewer admissions 1958 fewer admissions
121 fewer admissions 227 fewer admissions
No Opportunity 63 fewer admissions
1352 fewer admissions 1993 fewer admissions
No Opportunity No Opportunity
No Opportunity £111 reduction
No Opportunity No Opportunity
No Opportunity No Opportunity
No Opportunity No Opportunity
130 fewer bed days 258 fewer bed days
No Opportunity No Opportunity
140 fewer admissions 351 fewer admissions
2387 fewer admissions 3645 fewer admissions
Opportunities
0 20 40 60 80 100
Respiratory Secondary care spend per 1000 population
Respiratory Inpatient spend per 1000 population
Respiratory Daycase spend per 1000 population
Respiratory Emergency spend per 1000 population
Respiratory Secondary care admissions per 1000 population
Respiratory Inpatient admissions per 1000 population
Respiratory Daycase admissions per 1000 population
Respiratory Emergency admissions per 1000 population
Respiratory Secondary care spend per admission
Respiratory Inpatient spend per admission
Respiratory Daycase spend per admission
Respiratory Emergency spend per admission
Respiratory Secondary admissions Mean LOS
Respiratory Inpatient admissions Mean LOS
Respiratory Emergency admissions Mean LOS
Under 75 years Elective Respiratory Admissions DSR per 100,000
Under 75 years Emergency Respiratory Admissions DSR per 100,000
Worse outcome / Higher spend
Better outcome / Low er spend
78
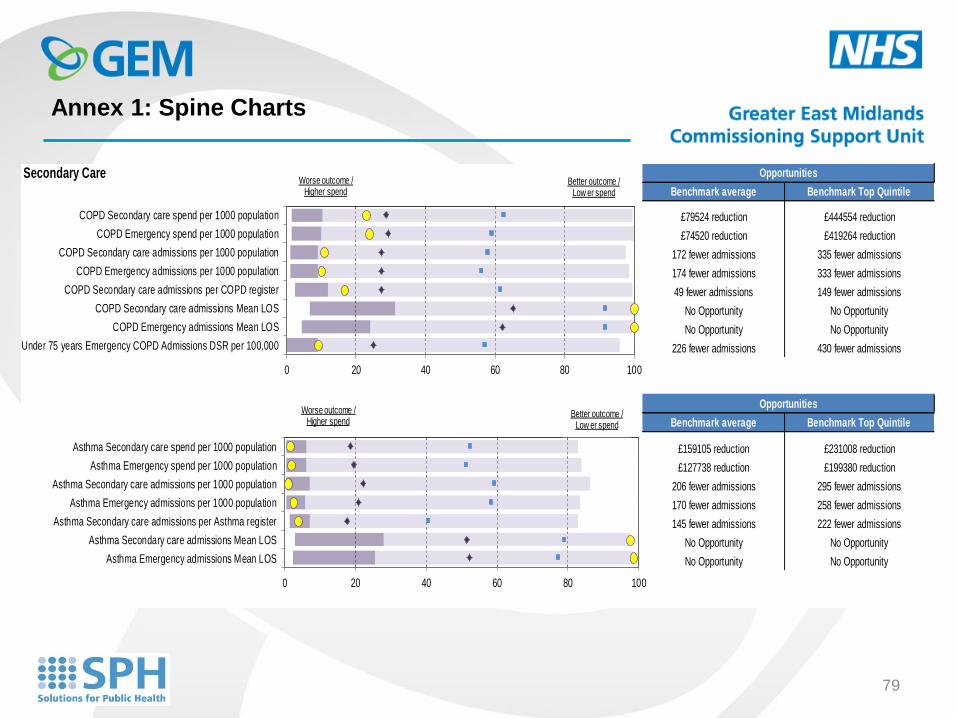
Annex 1: Spine Charts
Secondary Care
Benchmark average Benchmark Top Quintile
£79524 reduction £444554 reduction
£74520 reduction £419264 reduction
172 fewer admissions 335 fewer admissions
174 fewer admissions 333 fewer admissions
49 fewer admissions 149 fewer admissions
No Opportunity No Opportunity
No Opportunity No Opportunity
226 fewer admissions 430 fewer admissions
Benchmark average Benchmark Top Quintile
£159105 reduction £231008 reduction
£127738 reduction £199380 reduction
206 fewer admissions 295 fewer admissions
170 fewer admissions 258 fewer admissions
145 fewer admissions 222 fewer admissions
No Opportunity No Opportunity
No Opportunity No Opportunity
Opportunities
Opportunities
0 20 40 60 80 100
COPD Secondary care spend per 1000 population
COPD Emergency spend per 1000 population
COPD Secondary care admissions per 1000 population
COPD Emergency admissions per 1000 population
COPD Secondary care admissions per COPD register
COPD Secondary care admissions Mean LOS
COPD Emergency admissions Mean LOS
Under 75 years Emergency COPD Admissions DSR per 100,000
Better outcome / Low er spend
Worse outcome / Higher spend
0 20 40 60 80 100
Asthma Secondary care spend per 1000 population
Asthma Emergency spend per 1000 population
Asthma Secondary care admissions per 1000 population
Asthma Emergency admissions per 1000 population
Asthma Secondary care admissions per Asthma register
Asthma Secondary care admissions Mean LOS
Asthma Emergency admissions Mean LOS
Worse outcome / Higher spend
Better outcome / Low er spend
79
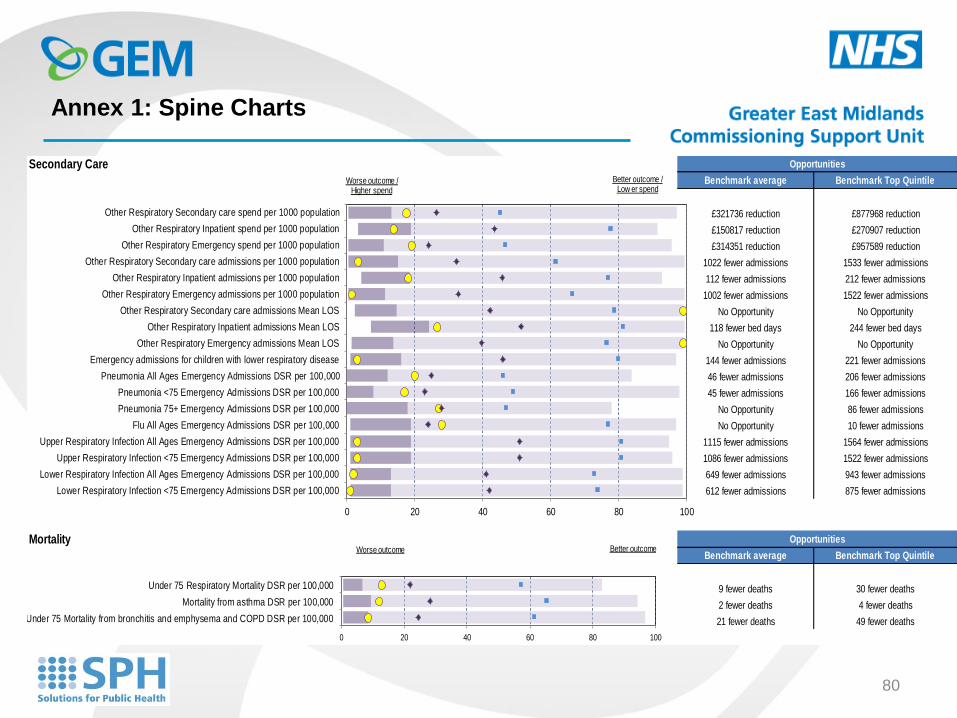
Annex 1: Spine Charts
Secondary Care
Benchmark average Benchmark Top Quintile
£321736 reduction £877968 reduction
£150817 reduction £270907 reduction
£314351 reduction £957589 reduction
1022 fewer admissions 1533 fewer admissions
112 fewer admissions 212 fewer admissions
1002 fewer admissions 1522 fewer admissions
No Opportunity No Opportunity
118 fewer bed days 244 fewer bed days
No Opportunity No Opportunity
144 fewer admissions 221 fewer admissions
46 fewer admissions 206 fewer admissions
45 fewer admissions 166 fewer admissions
No Opportunity 86 fewer admissions
No Opportunity 10 fewer admissions
1115 fewer admissions 1564 fewer admissions
1086 fewer admissions 1522 fewer admissions
649 fewer admissions 943 fewer admissions
612 fewer admissions 875 fewer admissions
Mortality
Benchmark average Benchmark Top Quintile
9 fewer deaths 30 fewer deaths
2 fewer deaths 4 fewer deaths
21 fewer deaths 49 fewer deaths
Opportunities
Opportunities
0 20 40 60 80 100
Under 75 Respiratory Mortality DSR per 100,000
Mortality from asthma DSR per 100,000
Under 75 Mortality from bronchitis and emphysema and COPD DSR per 100,000
Worse outcome Better outcome
0 20 40 60 80 100
Other Respiratory Secondary care spend per 1000 population
Other Respiratory Inpatient spend per 1000 population
Other Respiratory Emergency spend per 1000 population
Other Respiratory Secondary care admissions per 1000 population
Other Respiratory Inpatient admissions per 1000 population
Other Respiratory Emergency admissions per 1000 population
Other Respiratory Secondary care admissions Mean LOS
Other Respiratory Inpatient admissions Mean LOS
Other Respiratory Emergency admissions Mean LOS
Emergency admissions for children with lower respiratory disease
Pneumonia All Ages Emergency Admissions DSR per 100,000
Pneumonia <75 Emergency Admissions DSR per 100,000
Pneumonia 75+ Emergency Admissions DSR per 100,000
Flu All Ages Emergency Admissions DSR per 100,000
Upper Respiratory Infection All Ages Emergency Admissions DSR per 100,000
Upper Respiratory Infection <75 Emergency Admissions DSR per 100,000
Lower Respiratory Infection All Ages Emergency Admissions DSR per 100,000
Lower Respiratory Infection <75 Emergency Admissions DSR per 100,000
Better outcome / Low er spend
Worse outcome / Higher spend
80
Annex 2: CCG cluster classification
Cluster Classification Group
0-19
years
20-39
years
40-59
years
60-79
years
80+
years
Population
from Black
ethnic
groups
Population
from Asian
ethnic
groups
Population
density
(persons
per hectare)
Average
IMD
2010
score
Purple An older population living in rural areas
and low deprivation levels 22.3% 22.0% 27.8% 21.9% 6.0% 0.5% 1.9% 1.9 16.85
Blue
A very young population with a high
proprtion of the population from Black and
Asian ethnic groups and high levels of
deprivation.
26.4% 41.1% 21.3% 9.0% 2.1% 16.2% 31.6% 80.4 40.78
Green
A younger population with a high
proportion of the population from Black
and Asian ethnic groups and moderate
levels of deprivation.
21.6% 42.0% 23.5% 10.4% 2.5% 16.7% 10.3% 100.1 28.81
Yellow
A younger population with a higher than
average proportion of the population from
Black and Asian ethnic groups and
moderate levels of deprivation.
26.0% 31.6% 24.5% 14.1% 3.7% 6.7% 17.7% 26.2 29.00
Orange
A population with an average age
structure, average deprivation levels and
a low population density. 24.2% 25.3% 27.9% 18.2% 4.5% 1.5% 4.6% 5.1 20.38
The CCG Cluster groups are taken from YHPHO methodology, which groups together CCGs with similar populations. It is
based on statistical cluster analysis (K-means analysis) including variables of age structure of the population, the population
from Black and Asian ethnic groups, population density and deprivation.
81
Annex 2: CCG cluster classification
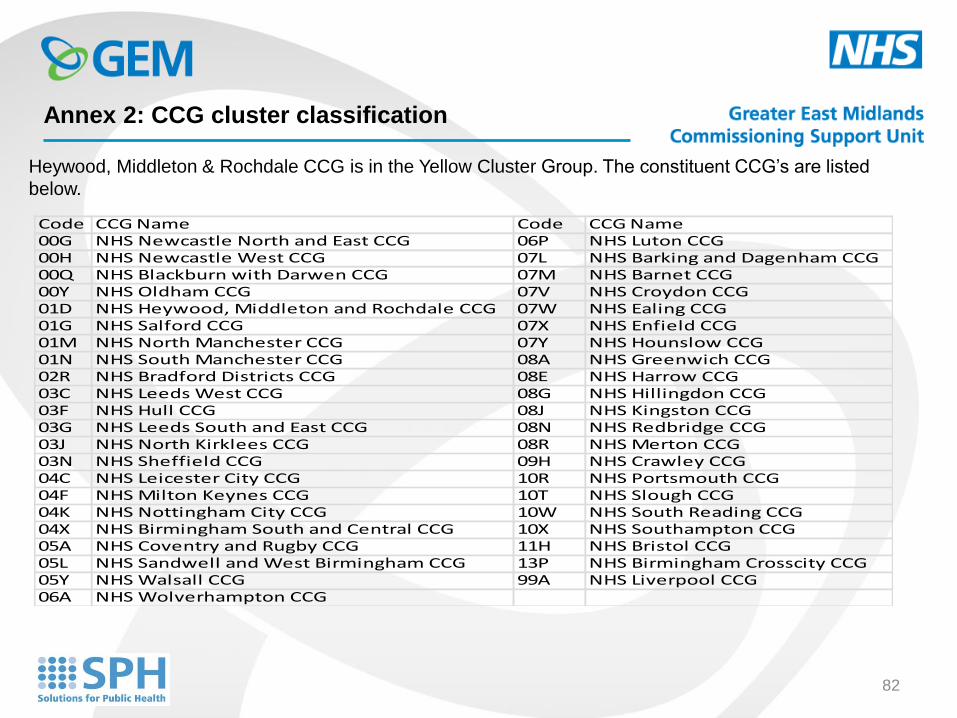
Heywood, Middleton & Rochdale CCG is in the Yellow Cluster Group. The constituent CCG’s are listed
below.
Code CCG Name Code CCG Name00G NHS Newcastle North and East CCG 06P NHS Luton CCG00H NHS Newcastle West CCG 07L NHS Barking and Dagenham CCG00Q NHS Blackburn with Darwen CCG 07M NHS Barnet CCG00Y NHS Oldham CCG 07V NHS Croydon CCG01D NHS Heywood, Middleton and Rochdale CCG 07W NHS Ealing CCG01G NHS Salford CCG 07X NHS Enfield CCG01M NHS North Manchester CCG 07Y NHS Hounslow CCG01N NHS South Manchester CCG 08A NHS Greenwich CCG02R NHS Bradford Districts CCG 08E NHS Harrow CCG03C NHS Leeds West CCG 08G NHS Hillingdon CCG03F NHS Hull CCG 08J NHS Kingston CCG03G NHS Leeds South and East CCG 08N NHS Redbridge CCG03J NHS North Kirklees CCG 08R NHS Merton CCG03N NHS Sheffield CCG 09H NHS Crawley CCG04C NHS Leicester City CCG 10R NHS Portsmouth CCG04F NHS Milton Keynes CCG 10T NHS Slough CCG04K NHS Nottingham City CCG 10W NHS South Reading CCG04X NHS Birmingham South and Central CCG 10X NHS Southampton CCG05A NHS Coventry and Rugby CCG 11H NHS Bristol CCG05L NHS Sandwell and West Birmingham CCG 13P NHS Birmingham Crosscity CCG05Y NHS Walsall CCG 99A NHS Liverpool CCG06A NHS Wolverhampton CCG
82
Annex 3: Practice cluster classification
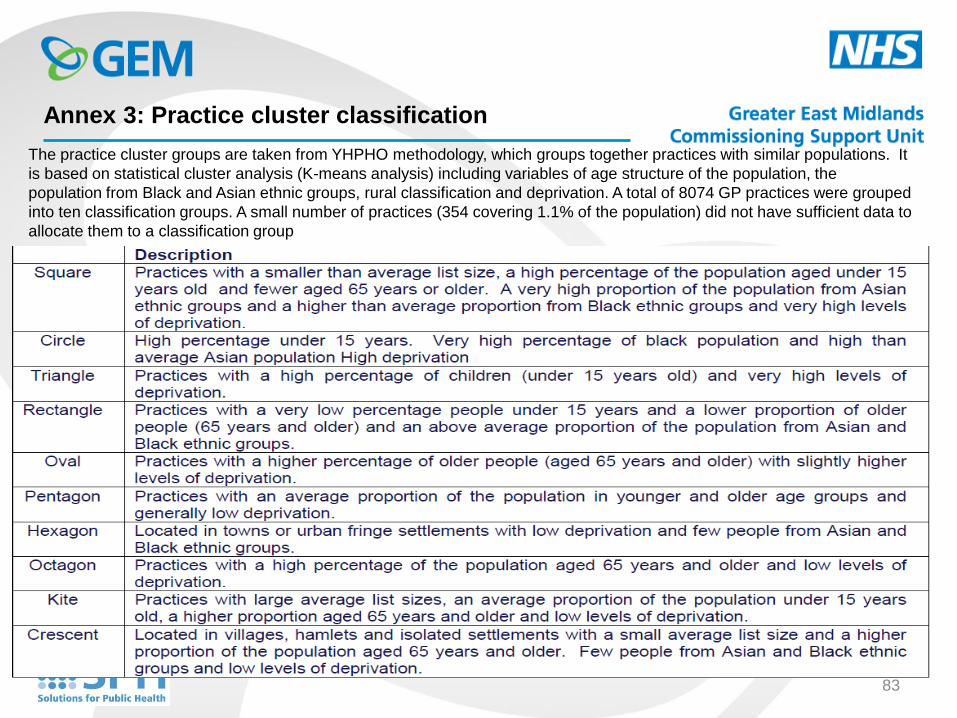
The practice cluster groups are taken from YHPHO methodology, which groups together practices with similar populations. It
is based on statistical cluster analysis (K-means analysis) including variables of age structure of the population, the
population from Black and Asian ethnic groups, rural classification and deprivation. A total of 8074 GP practices were grouped
into ten classification groups. A small number of practices (354 covering 1.1% of the population) did not have sufficient data to
allocate them to a classification group
83
Annex 3: Practice cluster classification
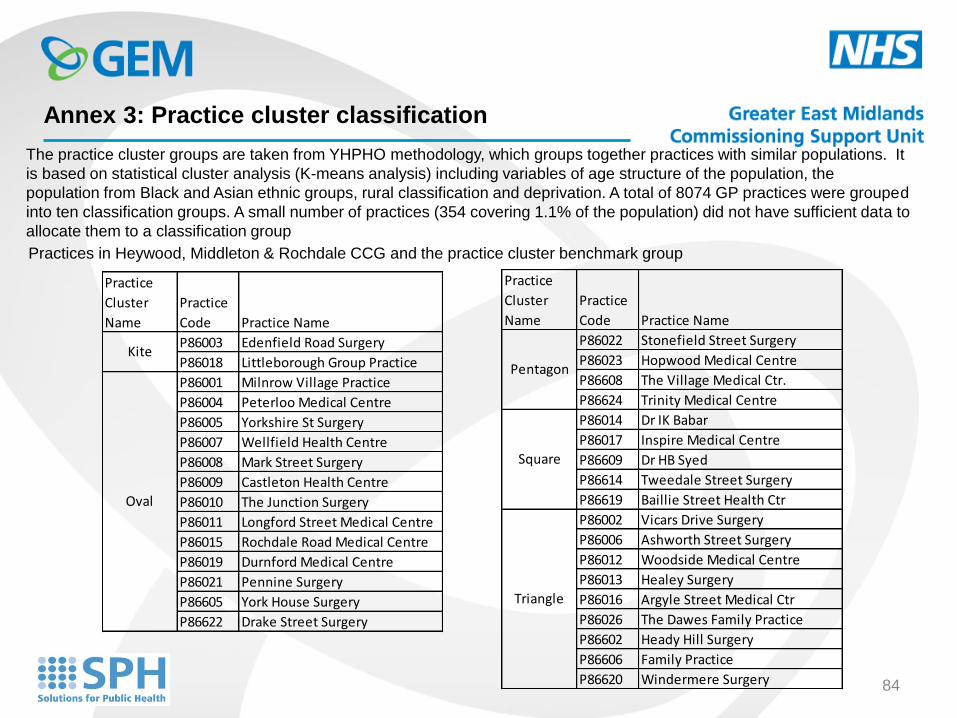
The practice cluster groups are taken from YHPHO methodology, which groups together practices with similar populations. It
is based on statistical cluster analysis (K-means analysis) including variables of age structure of the population, the
population from Black and Asian ethnic groups, rural classification and deprivation. A total of 8074 GP practices were grouped
into ten classification groups. A small number of practices (354 covering 1.1% of the population) did not have sufficient data to
allocate them to a classification group
Practices in Heywood, Middleton & Rochdale CCG and the practice cluster benchmark group
Practice
Cluster
Name
Practice
Code Practice Name
P86003 Edenfield Road Surgery
P86018 Littleborough Group Practice
P86001 Milnrow Village Practice
P86004 Peterloo Medical Centre
P86005 Yorkshire St Surgery
P86007 Wellfield Health Centre
P86008 Mark Street Surgery
P86009 Castleton Health Centre
P86010 The Junction Surgery
P86011 Longford Street Medical Centre
P86015 Rochdale Road Medical Centre
P86019 Durnford Medical Centre
P86021 Pennine Surgery
P86605 York House Surgery
P86622 Drake Street Surgery
Kite
Oval
Practice
Cluster
Name
Practice
Code Practice Name
P86022 Stonefield Street Surgery
P86023 Hopwood Medical Centre
P86608 The Village Medical Ctr.
P86624 Trinity Medical Centre
P86014 Dr IK Babar
P86017 Inspire Medical Centre
P86609 Dr HB Syed
P86614 Tweedale Street Surgery
P86619 Baillie Street Health Ctr
P86002 Vicars Drive Surgery
P86006 Ashworth Street Surgery
P86012 Woodside Medical Centre
P86013 Healey Surgery
P86016 Argyle Street Medical Ctr
P86026 The Dawes Family Practice
P86602 Heady Hill Surgery
P86606 Family Practice
P86620 Windermere Surgery
Pentagon
Square
Triangle
84
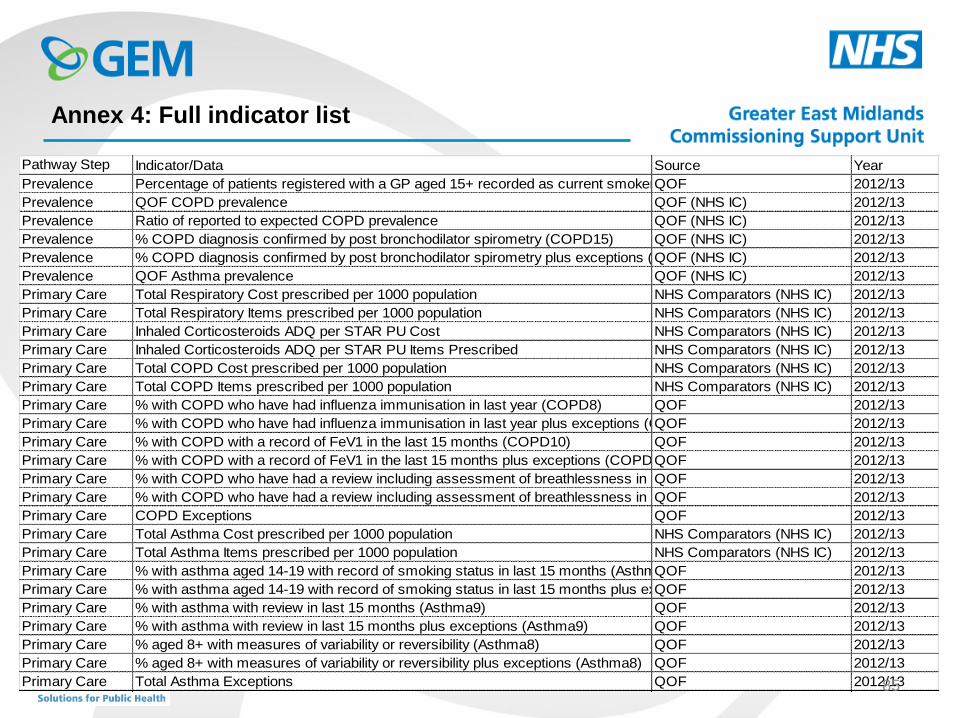
Annex 4: Full indicator list
Pathway Step Indicator/Data Source Year
Prevalence Percentage of patients registered with a GP aged 15+ recorded as current smokerQOF 2012/13
Prevalence QOF COPD prevalence QOF (NHS IC) 2012/13
Prevalence Ratio of reported to expected COPD prevalence QOF (NHS IC) 2012/13
Prevalence % COPD diagnosis confirmed by post bronchodilator spirometry (COPD15) QOF (NHS IC) 2012/13
Prevalence % COPD diagnosis confirmed by post bronchodilator spirometry plus exceptions (COPD15)QOF (NHS IC) 2012/13
Prevalence QOF Asthma prevalence QOF (NHS IC) 2012/13
Primary Care Total Respiratory Cost prescribed per 1000 population NHS Comparators (NHS IC) 2012/13
Primary Care Total Respiratory Items prescribed per 1000 population NHS Comparators (NHS IC) 2012/13
Primary Care Inhaled Corticosteroids ADQ per STAR PU Cost NHS Comparators (NHS IC) 2012/13
Primary Care Inhaled Corticosteroids ADQ per STAR PU Items Prescribed NHS Comparators (NHS IC) 2012/13
Primary Care Total COPD Cost prescribed per 1000 population NHS Comparators (NHS IC) 2012/13
Primary Care Total COPD Items prescribed per 1000 population NHS Comparators (NHS IC) 2012/13
Primary Care % with COPD who have had influenza immunisation in last year (COPD8) QOF 2012/13
Primary Care % with COPD who have had influenza immunisation in last year plus exceptions (COPD8)QOF 2012/13
Primary Care % with COPD with a record of FeV1 in the last 15 months (COPD10) QOF 2012/13
Primary Care % with COPD with a record of FeV1 in the last 15 months plus exceptions (COPD10)QOF 2012/13
Primary Care % with COPD who have had a review including assessment of breathlessness in last 15 months (COPD13)QOF 2012/13
Primary Care % with COPD who have had a review including assessment of breathlessness in last 15 months plus exceptions (COPD13)QOF 2012/13
Primary Care COPD Exceptions QOF 2012/13
Primary Care Total Asthma Cost prescribed per 1000 population NHS Comparators (NHS IC) 2012/13
Primary Care Total Asthma Items prescribed per 1000 population NHS Comparators (NHS IC) 2012/13
Primary Care % with asthma aged 14-19 with record of smoking status in last 15 months (Asthma10)QOF 2012/13
Primary Care % with asthma aged 14-19 with record of smoking status in last 15 months plus exceptions (Asthma10)QOF 2012/13
Primary Care % with asthma with review in last 15 months (Asthma9) QOF 2012/13
Primary Care % with asthma with review in last 15 months plus exceptions (Asthma9) QOF 2012/13
Primary Care % aged 8+ with measures of variability or reversibility (Asthma8) QOF 2012/13
Primary Care % aged 8+ with measures of variability or reversibility plus exceptions (Asthma8) QOF 2012/13
Primary Care Total Asthma Exceptions QOF 2012/1385
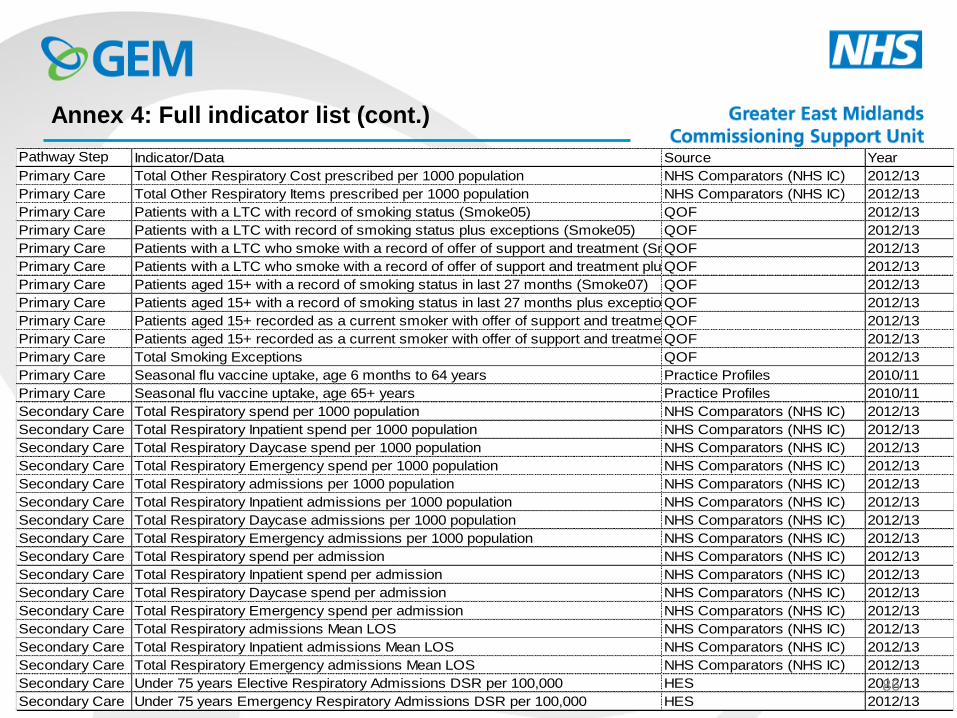
Annex 4: Full indicator list (cont.)
Pathway Step Indicator/Data Source Year
Primary Care Total Other Respiratory Cost prescribed per 1000 population NHS Comparators (NHS IC) 2012/13
Primary Care Total Other Respiratory Items prescribed per 1000 population NHS Comparators (NHS IC) 2012/13
Primary Care Patients with a LTC with record of smoking status (Smoke05) QOF 2012/13
Primary Care Patients with a LTC with record of smoking status plus exceptions (Smoke05) QOF 2012/13
Primary Care Patients with a LTC who smoke with a record of offer of support and treatment (Smoke06)QOF 2012/13
Primary Care Patients with a LTC who smoke with a record of offer of support and treatment plus exceptions (Smoke06)QOF 2012/13
Primary Care Patients aged 15+ with a record of smoking status in last 27 months (Smoke07) QOF 2012/13
Primary Care Patients aged 15+ with a record of smoking status in last 27 months plus exceptions (Smoke07)QOF 2012/13
Primary Care Patients aged 15+ recorded as a current smoker with offer of support and treatment in last 27 months (Smoke08)QOF 2012/13
Primary Care Patients aged 15+ recorded as a current smoker with offer of support and treatment in last 27 months plus exceptions (Smoke08)QOF 2012/13
Primary Care Total Smoking Exceptions QOF 2012/13
Primary Care Seasonal flu vaccine uptake, age 6 months to 64 years Practice Profiles 2010/11
Primary Care Seasonal flu vaccine uptake, age 65+ years Practice Profiles 2010/11
Secondary Care Total Respiratory spend per 1000 population NHS Comparators (NHS IC) 2012/13
Secondary Care Total Respiratory Inpatient spend per 1000 population NHS Comparators (NHS IC) 2012/13
Secondary Care Total Respiratory Daycase spend per 1000 population NHS Comparators (NHS IC) 2012/13
Secondary Care Total Respiratory Emergency spend per 1000 population NHS Comparators (NHS IC) 2012/13
Secondary Care Total Respiratory admissions per 1000 population NHS Comparators (NHS IC) 2012/13
Secondary Care Total Respiratory Inpatient admissions per 1000 population NHS Comparators (NHS IC) 2012/13
Secondary Care Total Respiratory Daycase admissions per 1000 population NHS Comparators (NHS IC) 2012/13
Secondary Care Total Respiratory Emergency admissions per 1000 population NHS Comparators (NHS IC) 2012/13
Secondary Care Total Respiratory spend per admission NHS Comparators (NHS IC) 2012/13
Secondary Care Total Respiratory Inpatient spend per admission NHS Comparators (NHS IC) 2012/13
Secondary Care Total Respiratory Daycase spend per admission NHS Comparators (NHS IC) 2012/13
Secondary Care Total Respiratory Emergency spend per admission NHS Comparators (NHS IC) 2012/13
Secondary Care Total Respiratory admissions Mean LOS NHS Comparators (NHS IC) 2012/13
Secondary Care Total Respiratory Inpatient admissions Mean LOS NHS Comparators (NHS IC) 2012/13
Secondary Care Total Respiratory Emergency admissions Mean LOS NHS Comparators (NHS IC) 2012/13
Secondary Care Under 75 years Elective Respiratory Admissions DSR per 100,000 HES 2012/13
Secondary Care Under 75 years Emergency Respiratory Admissions DSR per 100,000 HES 2012/1386
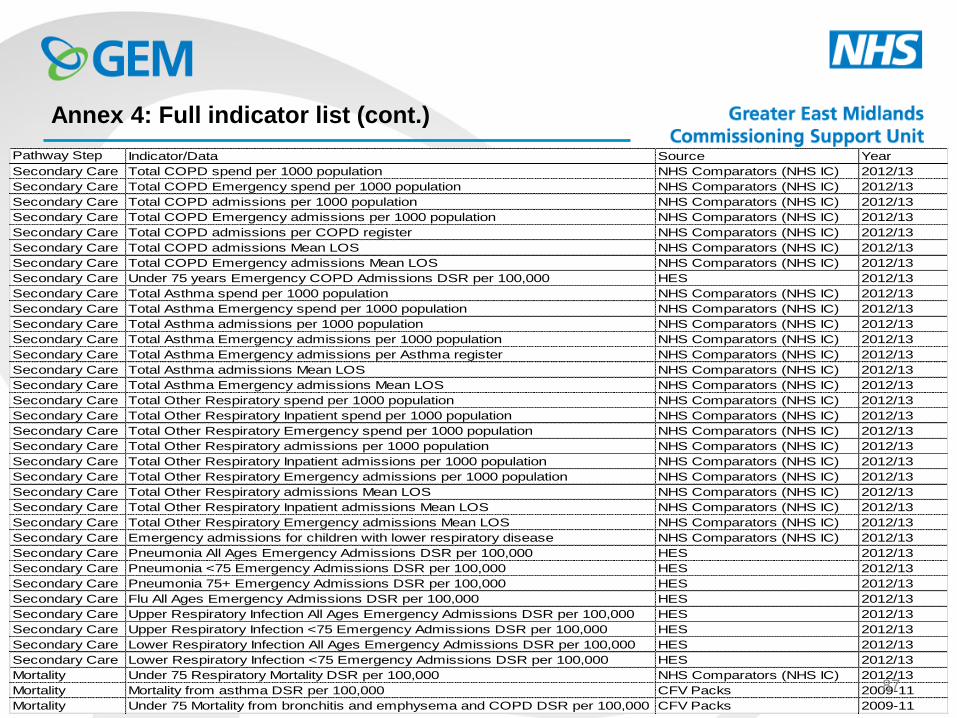
Annex 4: Full indicator list (cont.)
Pathway Step Indicator/Data Source Year
Secondary Care Total COPD spend per 1000 population NHS Comparators (NHS IC) 2012/13
Secondary Care Total COPD Emergency spend per 1000 population NHS Comparators (NHS IC) 2012/13
Secondary Care Total COPD admissions per 1000 population NHS Comparators (NHS IC) 2012/13
Secondary Care Total COPD Emergency admissions per 1000 population NHS Comparators (NHS IC) 2012/13
Secondary Care Total COPD admissions per COPD register NHS Comparators (NHS IC) 2012/13
Secondary Care Total COPD admissions Mean LOS NHS Comparators (NHS IC) 2012/13
Secondary Care Total COPD Emergency admissions Mean LOS NHS Comparators (NHS IC) 2012/13
Secondary Care Under 75 years Emergency COPD Admissions DSR per 100,000 HES 2012/13
Secondary Care Total Asthma spend per 1000 population NHS Comparators (NHS IC) 2012/13
Secondary Care Total Asthma Emergency spend per 1000 population NHS Comparators (NHS IC) 2012/13
Secondary Care Total Asthma admissions per 1000 population NHS Comparators (NHS IC) 2012/13
Secondary Care Total Asthma Emergency admissions per 1000 population NHS Comparators (NHS IC) 2012/13
Secondary Care Total Asthma Emergency admissions per Asthma register NHS Comparators (NHS IC) 2012/13
Secondary Care Total Asthma admissions Mean LOS NHS Comparators (NHS IC) 2012/13
Secondary Care Total Asthma Emergency admissions Mean LOS NHS Comparators (NHS IC) 2012/13
Secondary Care Total Other Respiratory spend per 1000 population NHS Comparators (NHS IC) 2012/13
Secondary Care Total Other Respiratory Inpatient spend per 1000 population NHS Comparators (NHS IC) 2012/13
Secondary Care Total Other Respiratory Emergency spend per 1000 population NHS Comparators (NHS IC) 2012/13
Secondary Care Total Other Respiratory admissions per 1000 population NHS Comparators (NHS IC) 2012/13
Secondary Care Total Other Respiratory Inpatient admissions per 1000 population NHS Comparators (NHS IC) 2012/13
Secondary Care Total Other Respiratory Emergency admissions per 1000 population NHS Comparators (NHS IC) 2012/13
Secondary Care Total Other Respiratory admissions Mean LOS NHS Comparators (NHS IC) 2012/13
Secondary Care Total Other Respiratory Inpatient admissions Mean LOS NHS Comparators (NHS IC) 2012/13
Secondary Care Total Other Respiratory Emergency admissions Mean LOS NHS Comparators (NHS IC) 2012/13
Secondary Care Emergency admissions for children with lower respiratory disease NHS Comparators (NHS IC) 2012/13
Secondary Care Pneumonia All Ages Emergency Admissions DSR per 100,000 HES 2012/13
Secondary Care Pneumonia <75 Emergency Admissions DSR per 100,000 HES 2012/13
Secondary Care Pneumonia 75+ Emergency Admissions DSR per 100,000 HES 2012/13
Secondary Care Flu All Ages Emergency Admissions DSR per 100,000 HES 2012/13
Secondary Care Upper Respiratory Infection All Ages Emergency Admissions DSR per 100,000 HES 2012/13
Secondary Care Upper Respiratory Infection <75 Emergency Admissions DSR per 100,000 HES 2012/13
Secondary Care Lower Respiratory Infection All Ages Emergency Admissions DSR per 100,000 HES 2012/13
Secondary Care Lower Respiratory Infection <75 Emergency Admissions DSR per 100,000 HES 2012/13
Mortality Under 75 Respiratory Mortality DSR per 100,000 NHS Comparators (NHS IC) 2012/13
Mortality Mortality from asthma DSR per 100,000 CFV Packs 2009-11
Mortality Under 75 Mortality from bronchitis and emphysema and COPD DSR per 100,000 CFV Packs 2009-11
87
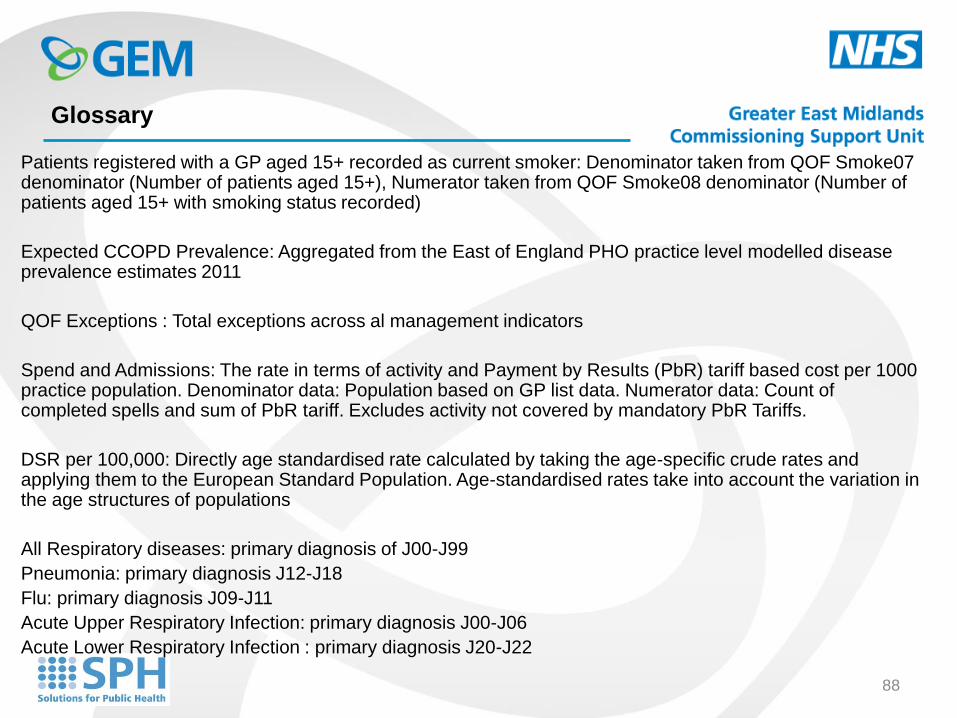
Glossary
Patients registered with a GP aged 15+ recorded as current smoker: Denominator taken from QOF Smoke07 denominator (Number of patients aged 15+), Numerator taken from QOF Smoke08 denominator (Number of patients aged 15+ with smoking status recorded)
Expected CCOPD Prevalence: Aggregated from the East of England PHO practice level modelled disease prevalence estimates 2011
QOF Exceptions : Total exceptions across al management indicators
Spend and Admissions: The rate in terms of activity and Payment by Results (PbR) tariff based cost per 1000 practice population. Denominator data: Population based on GP list data. Numerator data: Count of completed spells and sum of PbR tariff. Excludes activity not covered by mandatory PbR Tariffs.
DSR per 100,000: Directly age standardised rate calculated by taking the age-specific crude rates and applying them to the European Standard Population. Age-standardised rates take into account the variation in the age structures of populations
All Respiratory diseases: primary diagnosis of J00-J99
Pneumonia: primary diagnosis J12-J18
Flu: primary diagnosis J09-J11
Acute Upper Respiratory Infection: primary diagnosis J00-J06
Acute Lower Respiratory Infection : primary diagnosis J20-J22
88