commissioning an engineering scale coal gasifier · commissioning an engineering scale coal ......
TRANSCRIPT
PNNL-19636
Prepared for the U.S. Department of Energy under Contract DE-AC05-76RL01830
Commissioning an Engineering Scale Coal Gasifier D Reid JE Cabe MD Bearden July 2010
1.0
PNNL-19636
Commissioning an Engineering Scale Coal Gasifier D Reid JE Cabe MD Bearden July 2010 Prepared for the U.S. Department of Energy under Contract DE-AC05-76RL01830 Pacific Northwest National Laboratory Richland, Washington 99352

iii
Abstract
This report explains the development, commissioning, and testing of an engineering scale slagging coal gasifier at PNNL. The initial objective of this project was to commission the gasifier with zero safety incidents. The commissioning work was primarily an empirical study that required an engineering design approach. After bringing the gasifier on-line, tests were conducted to assess the impact of various operating parameters on the synthesis gas (syngas) product composition. The long-term intent of this project is to produce syngas product for use by internal Pacific Northwest National Laboratory (PNNL) researchers in catalyst, materials, and instrumentation development.
Future work on the project will focus on improving the reliability and performance of the gasifier, with a goal of continuous operation for greater than 4 hours using coal feedstock. In addition, alternate designs that allow for increased flexibility regarding the fuel sources that can be used for syngas production is desired. Continued modifications to the fuel feed system will be pursued to address these goals. Alternative feed mechanisms such as a coal/methanol slurry are being considered.

v
Acknowledgments
The authors gratefully acknowledge the financial assistance of a Laboratory Directed Research and Development (LDRD) project from Pacific Northwest National Laboratory1
James Cabe was the project manager and a source of great knowledge and guidance. Stanley L. Owsley Jr., Mark D. Bearden, Robert J. Robertus, Mike Dodson, and Michael L. Elliott were instrumental in the initial design and construction effort.
(PNNL). All research herein was performed at the Integrated Environmental Technologies (InEnTec) facility in Richland, WA.
1 Proudly Operated for the U.S. Department of Energy (DOE) by Battelle Memorial Institute

vii
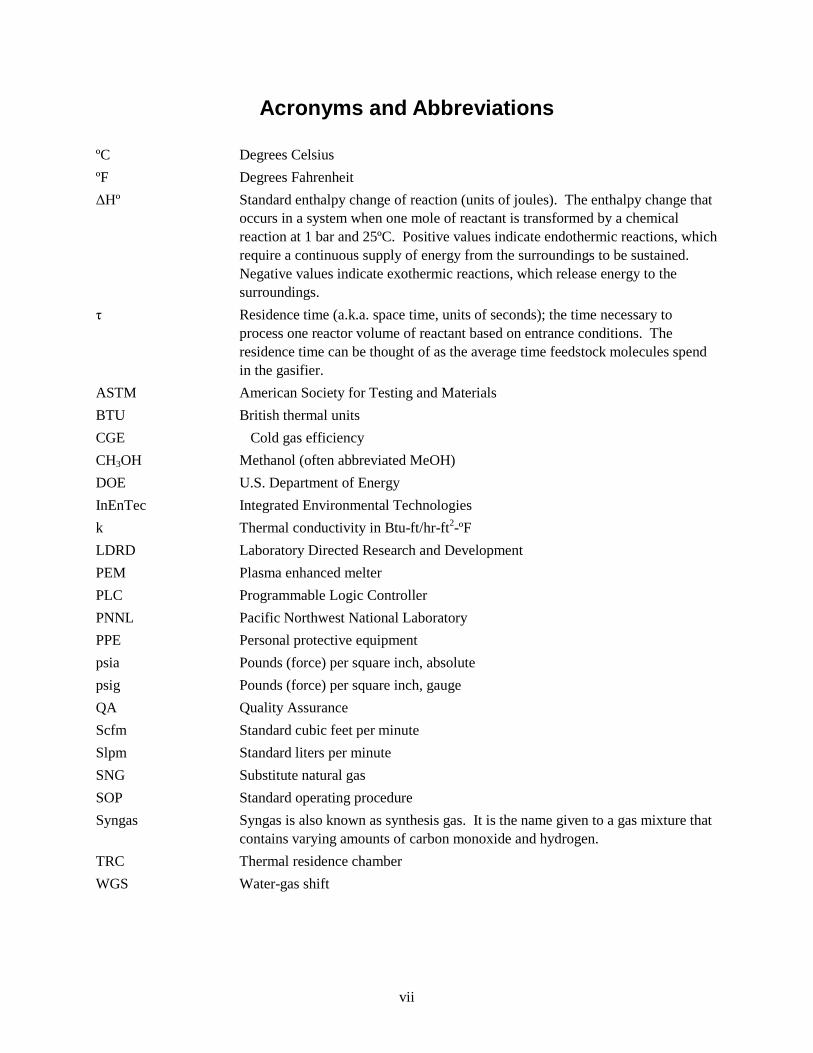
Acronyms and Abbreviations
ºC Degrees Celsius ºF Degrees Fahrenheit ΔHº Standard enthalpy change of reaction (units of joules). The enthalpy change that
occurs in a system when one mole of reactant is transformed by a chemical reaction at 1 bar and 25ºC. Positive values indicate endothermic reactions, which require a continuous supply of energy from the surroundings to be sustained. Negative values indicate exothermic reactions, which release energy to the surroundings.
τ Residence time (a.k.a. space time, units of seconds); the time necessary to process one reactor volume of reactant based on entrance conditions. The residence time can be thought of as the average time feedstock molecules spend in the gasifier.
ASTM American Society for Testing and Materials BTU British thermal units CGE Cold gas efficiency CH3OH Methanol (often abbreviated MeOH) DOE U.S. Department of Energy InEnTec Integrated Environmental Technologies k Thermal conductivity in Btu-ft/hr-ft2-ºF LDRD Laboratory Directed Research and Development PEM Plasma enhanced melter PLC Programmable Logic Controller PNNL Pacific Northwest National Laboratory PPE Personal protective equipment psia Pounds (force) per square inch, absolute psig Pounds (force) per square inch, gauge QA Quality Assurance Scfm Standard cubic feet per minute Slpm Standard liters per minute SNG Substitute natural gas SOP Standard operating procedure Syngas Syngas is also known as synthesis gas. It is the name given to a gas mixture that
contains varying amounts of carbon monoxide and hydrogen. TRC Thermal residence chamber WGS Water-gas shift

ix
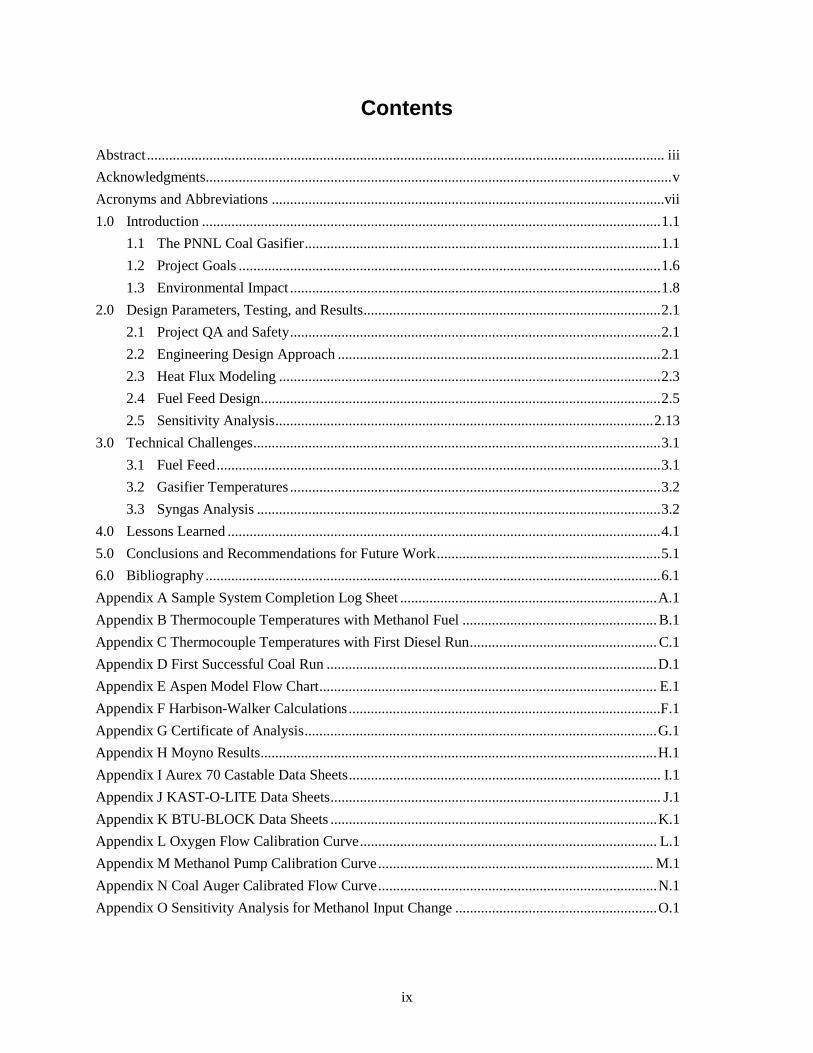
Contents
Abstract ............................................................................................................................................. iii Acknowledgments ............................................................................................................................... v Acronyms and Abbreviations ...........................................................................................................vii 1.0 Introduction ............................................................................................................................. 1.1
1.1 The PNNL Coal Gasifier ................................................................................................. 1.1 1.2 Project Goals ................................................................................................................... 1.6 1.3 Environmental Impact ..................................................................................................... 1.8
2.0 Design Parameters, Testing, and Results ................................................................................. 2.1 2.1 Project QA and Safety ..................................................................................................... 2.1 2.2 Engineering Design Approach ........................................................................................ 2.1 2.3 Heat Flux Modeling ........................................................................................................ 2.3 2.4 Fuel Feed Design ............................................................................................................. 2.5 2.5 Sensitivity Analysis ....................................................................................................... 2.13
3.0 Technical Challenges ............................................................................................................... 3.1 3.1 Fuel Feed ......................................................................................................................... 3.1 3.2 Gasifier Temperatures ..................................................................................................... 3.2 3.3 Syngas Analysis .............................................................................................................. 3.2
4.0 Lessons Learned ...................................................................................................................... 4.1 5.0 Conclusions and Recommendations for Future Work ............................................................. 5.1 6.0 Bibliography ............................................................................................................................ 6.1 Appendix A Sample System Completion Log Sheet ...................................................................... A.1 Appendix B Thermocouple Temperatures with Methanol Fuel ..................................................... B.1 Appendix C Thermocouple Temperatures with First Diesel Run ................................................... C.1 Appendix D First Successful Coal Run .......................................................................................... D.1 Appendix E Aspen Model Flow Chart ............................................................................................ E.1 Appendix F Harbison-Walker Calculations .....................................................................................F.1 Appendix G Certificate of Analysis ................................................................................................ G.1 Appendix H Moyno Results ............................................................................................................ H.1 Appendix I Aurex 70 Castable Data Sheets ..................................................................................... I.1 Appendix J KAST-O-LITE Data Sheets .......................................................................................... J.1 Appendix K BTU-BLOCK Data Sheets ......................................................................................... K.1 Appendix L Oxygen Flow Calibration Curve ................................................................................. L.1 Appendix M Methanol Pump Calibration Curve ........................................................................... M.1 Appendix N Coal Auger Calibrated Flow Curve ............................................................................ N.1 Appendix O Sensitivity Analysis for Methanol Input Change ....................................................... O.1
x
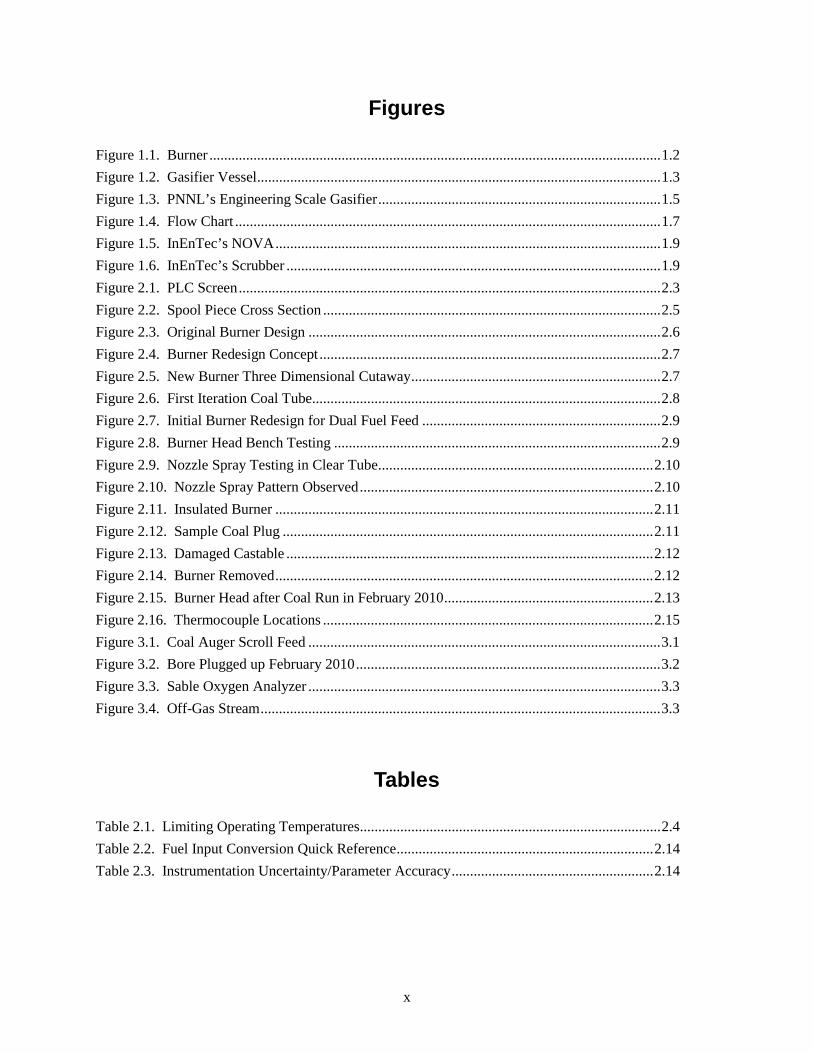
Figures
Figure 1.1. Burner ........................................................................................................................... 1.2 Figure 1.2. Gasifier Vessel .............................................................................................................. 1.3 Figure 1.3. PNNL ’s Engineering Scale Gasifier ............................................................................. 1.5Figure 1.4. Flow Chart .................................................................................................................... 1.7 Figure 1.5. InEnTec’s NOVA ......................................................................................................... 1.9 Figure 1.6. InEnTec’s Scrubber ...................................................................................................... 1.9 Figure 2.1. PLC Screen ................................................................................................................... 2.3 Figure 2.2. Spool Piece Cross Section ............................................................................................ 2.5 Figure 2.3. Original Burner Design ................................................................................................ 2.6 Figure 2.4. Burner Redesign Concept ............................................................................................. 2.7 Figure 2.5. New Burner Three Dimensional Cutaway .................................................................... 2.7 Figure 2.6. First Iteration Coal Tube ............................................................................................... 2.8 Figure 2.7. Initial Burner Redesign for Dual Fuel Feed ................................................................. 2.9 Figure 2.8. Burner Head Bench Testing ......................................................................................... 2.9 Figure 2.9. Nozzle Spray Testing in Clear Tube ........................................................................... 2.10 Figure 2.10. Nozzle Spray Pattern Observed ................................................................................ 2.10 Figure 2.11. Insulated Burner ....................................................................................................... 2.11 Figure 2.12. Sample Coal Plug ..................................................................................................... 2.11 Figure 2.13. Damaged Castable .................................................................................................... 2.12 Figure 2.14. Burner Removed ....................................................................................................... 2.12 Figure 2.15. Burner Head after Coal Run in February 2010 ......................................................... 2.13 Figure 2.16. Thermocouple Locations .......................................................................................... 2.15 Figure 3.1. Coal Auger Scroll Feed ................................................................................................ 3.1 Figure 3.2. Bore Plugged up February 2010 ................................................................................... 3.2 Figure 3.3. Sable Oxygen Analyzer ................................................................................................ 3.3 Figure 3.4. Off-Gas Stream ............................................................................................................. 3.3
Tables
Table 2.1. Limiting Operating Temperatures .................................................................................. 2.4 Table 2.2. Fuel Input Conversion Quick Reference ...................................................................... 2.14 Table 2.3. Instrumentation Uncertainty/Parameter Accuracy ....................................................... 2.14
1.1
1.0 Introduction
1.1 The PNNL Coal Gasifier
The theory of coal gasification is not described in this document. A separate PNNL issued document addresses these issues [17].
PNNL’s gasifier at Integrated Environmental Technologies (InEnTec) is a small entrained flow slagging gasifier of nominally 10 lb/hr of pulverized coal feed. Oxygen vapor from liquid dewars is used as the oxidant. The primary purposes of this gasifier are to 1) produce an internal slag layer to determine if its thickness could be determined by millimeter wave technology and 2) to produce syngas from coal for catalyst and materials testing. Thus the gasifier is not designed for fundamental studies of coal gasification.
The gasification vessel and associated equipment is designed for operation to 250 psig. However, limitations of the coal feed system, oxygen supply, syngas processing capability and safety concerns have limited operation to near atmospheric pressure.
In an entrained flow gasifier, finely ground coal feedstock particles undergo thermal decomposition, partial combustion, and reaction with steam and other gas components as they are dragged along with the self generated gas stream in co-current flow.
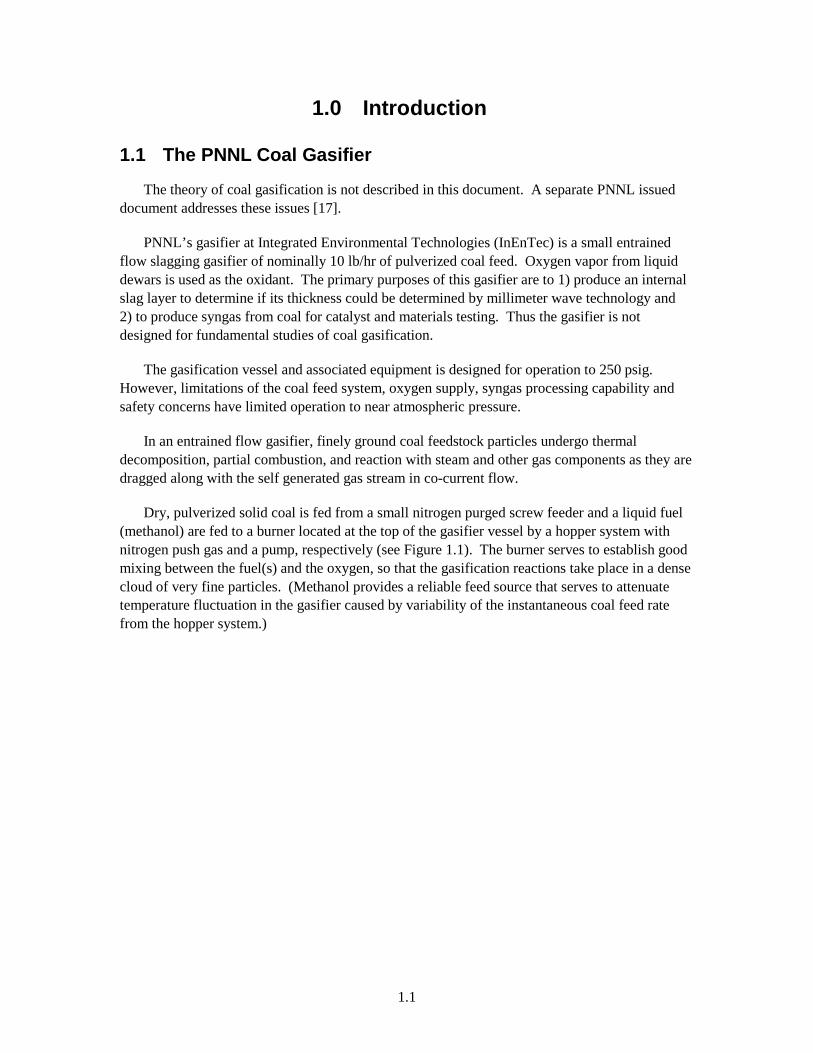
Dry, pulverized solid coal is fed from a small nitrogen purged screw feeder and a liquid fuel (methanol) are fed to a burner located at the top of the gasifier vessel by a hopper system with nitrogen push gas and a pump, respectively (see Figure 1.1). The burner serves to establish good mixing between the fuel(s) and the oxygen, so that the gasification reactions take place in a dense cloud of very fine particles. (Methanol provides a reliable feed source that serves to attenuate temperature fluctuation in the gasifier caused by variability of the instantaneous coal feed rate from the hopper system.)
1.2
Figure 1.1. Burner
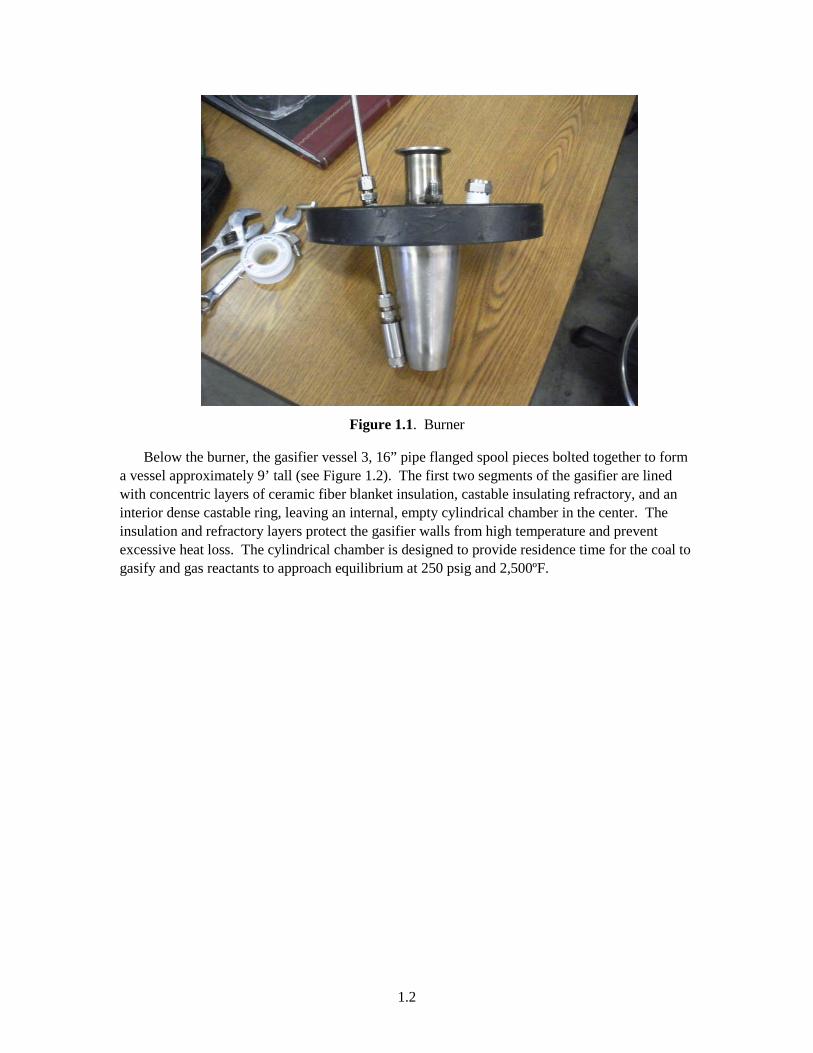
Below the burner, the gasifier vessel 3, 16” pipe flanged spool pieces bolted together to form a vessel approximately 9’ tall (see Figure 1.2). The first two segments of the gasifier are lined with concentric layers of ceramic fiber blanket insulation, castable insulating refractory, and an interior dense castable ring, leaving an internal, empty cylindrical chamber in the center. The insulation and refractory layers protect the gasifier walls from high temperature and prevent excessive heat loss. The cylindrical chamber is designed to provide residence time for the coal to gasify and gas reactants to approach equilibrium at 250 psig and 2,500ºF.
1.3
Figure 1.2. Gasifier Vessel
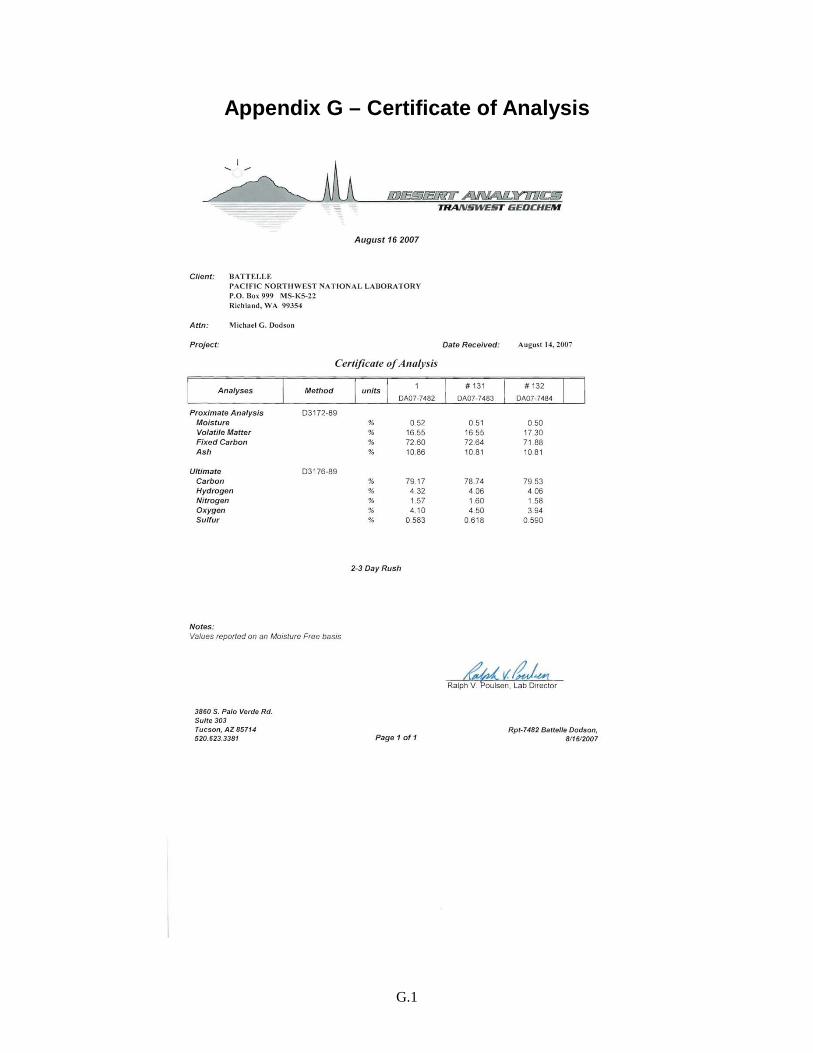
The gasifier is designed to react the coal feed at 2,500°F which is above the melting point of the coal ash. The molten ash, composed primarily of silica and alumina minerals (slag) form a highly viscous layer on the inner wall of the gasifier, with liquid slag being solidified and then removed at the bottom of the gasifier. The ash fluid temperature estimated for the Pocahontas coal used in the PNNL gasifier is 2,201°F [6]. The Pocahontas coal used is a low sulfur seam coal from West Virginia. The coal was ground extremely fine for greater reactivity and conversion. For a certificate of analysis of the coal fed to the PNNL gasifier refer to Appendix A.
In the third section, water is sprayed through nozzles into the gas stream to rapidly lower its temperature and stop reaction.

1.5
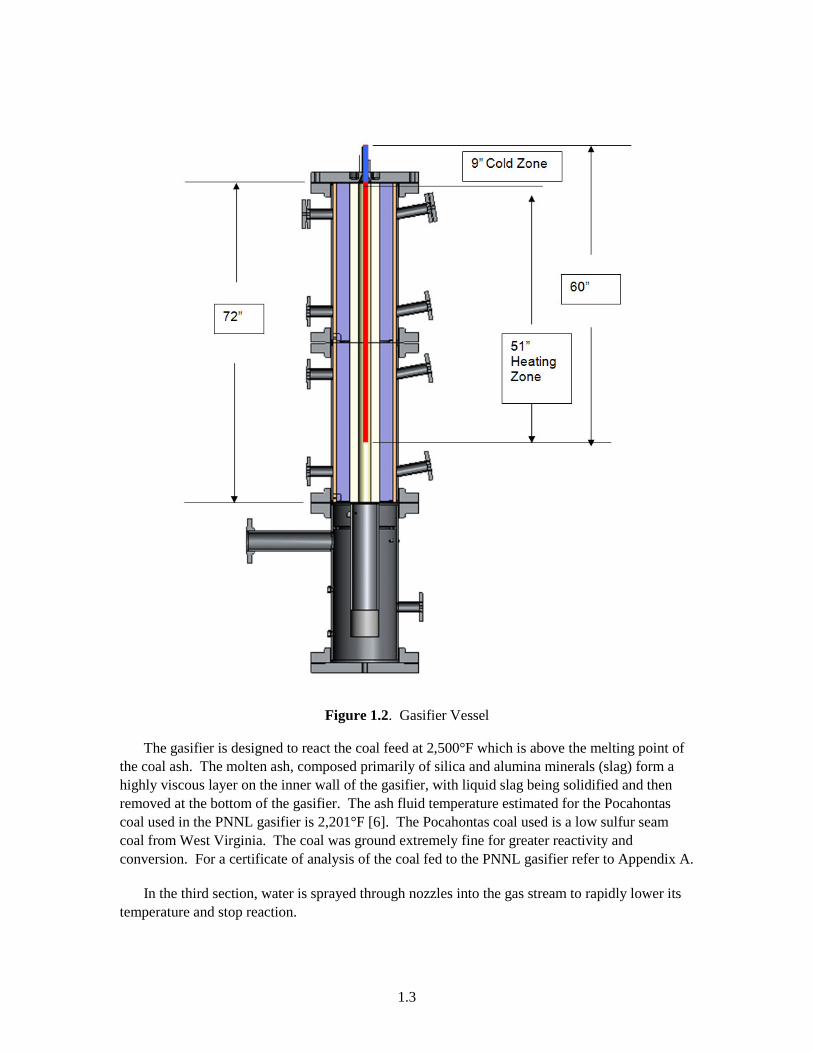
Figure 1.3. PNNL’s Engineering Scale Gasifier
1.6
1.2 Project Goals
The primary goals of this gasification project were to safely commission the gasifier and to provide internal PNNL customers with syngas. This project was not funded to significantly advance the science of commercial gasification, but rather to serve as a research and development effort aimed at enhancing PNNL’s internal capabilities with respect to operating a small-scale gasifier. Success was defined by completion of the following milestones:
• Develop and maintain a standard operating procedure (SOP) [18] and safe operating practices
• Start up the gasifier on methanol (CH3OH)
• Transition to a higher energy density fuel (diesel)
• Transition to coal feed
• Develop sustainable run procedures and capability
• Align future efforts with research objectives/projects at PNNL
• Produce syngas for internal PNNL customers.
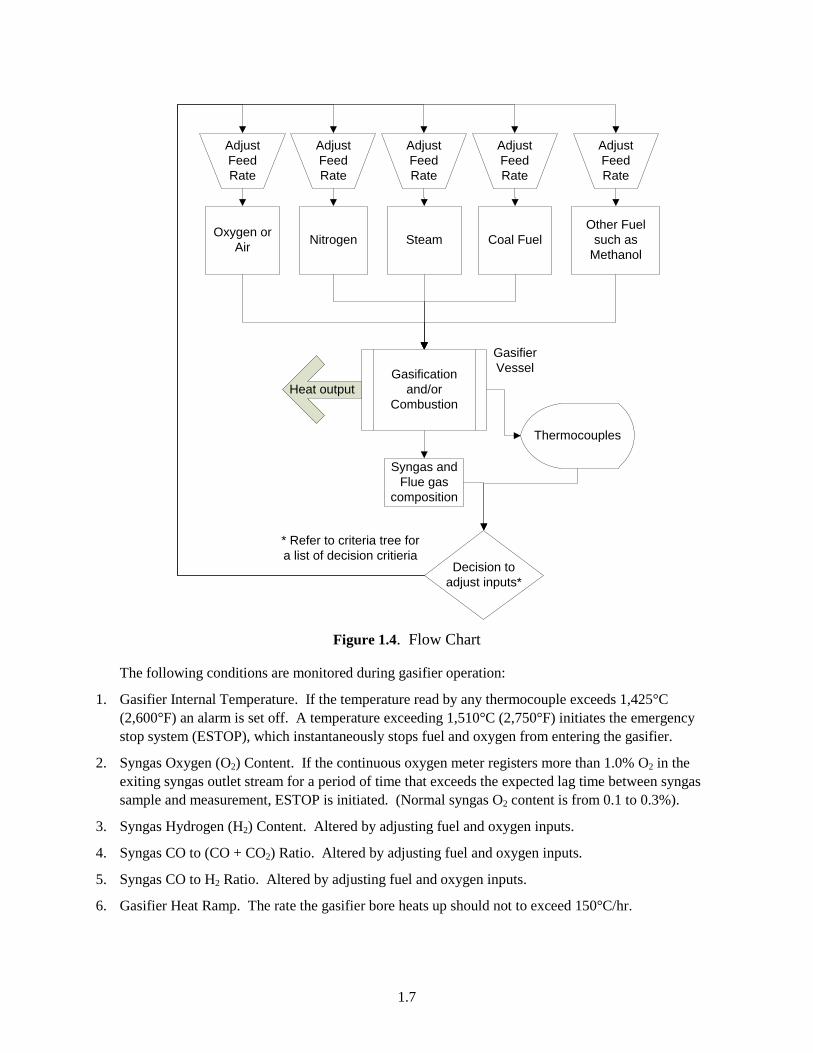
The technical goals of this project include maximizing the conversion of carbon from the solid to gas phase, running the gasifier continuously for a length of four hours or more, and being able to fine-tune the inputs/operating conditions of the gasifier to achieve a desired syngas composition. Figure 1.4 is the process flow chart showing the inputs and outputs of the gasifier.
1.7
Figure 1.4. Flow Chart
The following conditions are monitored during gasifier operation:
1. Gasifier Internal Temperature. If the temperature read by any thermocouple exceeds 1,425°C (2,600°F) an alarm is set off. A temperature exceeding 1,510°C (2,750°F) initiates the emergency stop system (ESTOP), which instantaneously stops fuel and oxygen from entering the gasifier.
2. Syngas Oxygen (O2) Content. If the continuous oxygen meter registers more than 1.0% O2 in the exiting syngas outlet stream for a period of time that exceeds the expected lag time between syngas sample and measurement, ESTOP is initiated. (Normal syngas O2 content is from 0.1 to 0.3%).
3. Syngas Hydrogen (H2) Content. Altered by adjusting fuel and oxygen inputs.
4. Syngas CO to (CO + CO2) Ratio. Altered by adjusting fuel and oxygen inputs.
5. Syngas CO to H2 Ratio. Altered by adjusting fuel and oxygen inputs.
6. Gasifier Heat Ramp. The rate the gasifier bore heats up should not to exceed 150°C/hr.
Oxygen or Air Nitrogen Steam Coal Fuel
Other Fuel such as
Methanol
Gasification and/or
Combustion
Syngas and Flue gas
composition
Heat output
GasifierVessel
Thermocouples
Decision to adjust inputs*
Adjust Feed Rate
Adjust Feed Rate
Adjust Feed Rate
Adjust Feed Rate
Adjust Feed Rate
* Refer to criteria tree for a list of decision critieria
1.8
7. Gasifier Pressure and Delta Pressure. ESTOP is initiated if pressure in the gasifier exceeds 5 psig. Normal gasifier operation requires the pressure to be below the high-high set point of 2 psig. The gasifier’s delta pressure (inlet to outlet) is not to exceed 1.5 psig. (A 1 psig pressure is maintained at the coal fuel hopper.)
8. Fuel to O2 Ratio. Sub-stoichiometric for gasification.
9. For additional conditions, refer to the alarm response section of the SOP[18].
PNNL leases space at Integrated Environmental Technologies (InEnTec). Figure 1.2 shows the gasifier located in the InEnTec facility in Richland, WA. Facility information can be found on the InEnTec website [10].
1.3 Environmental Impact
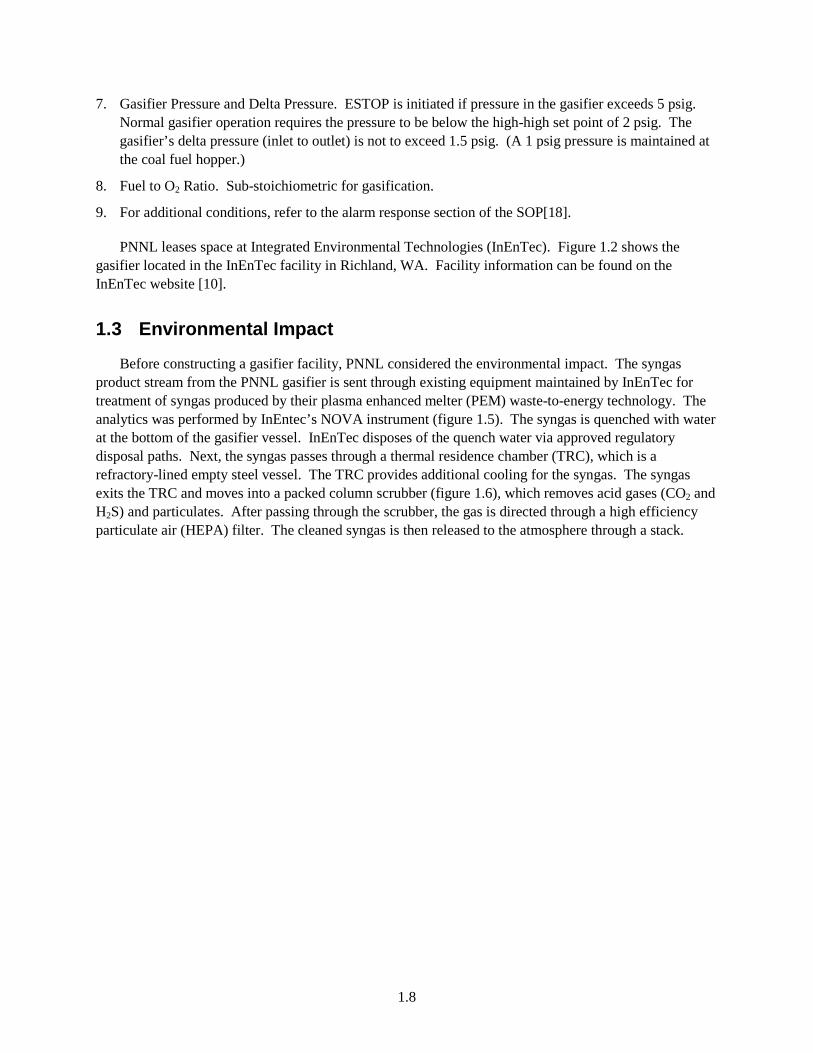
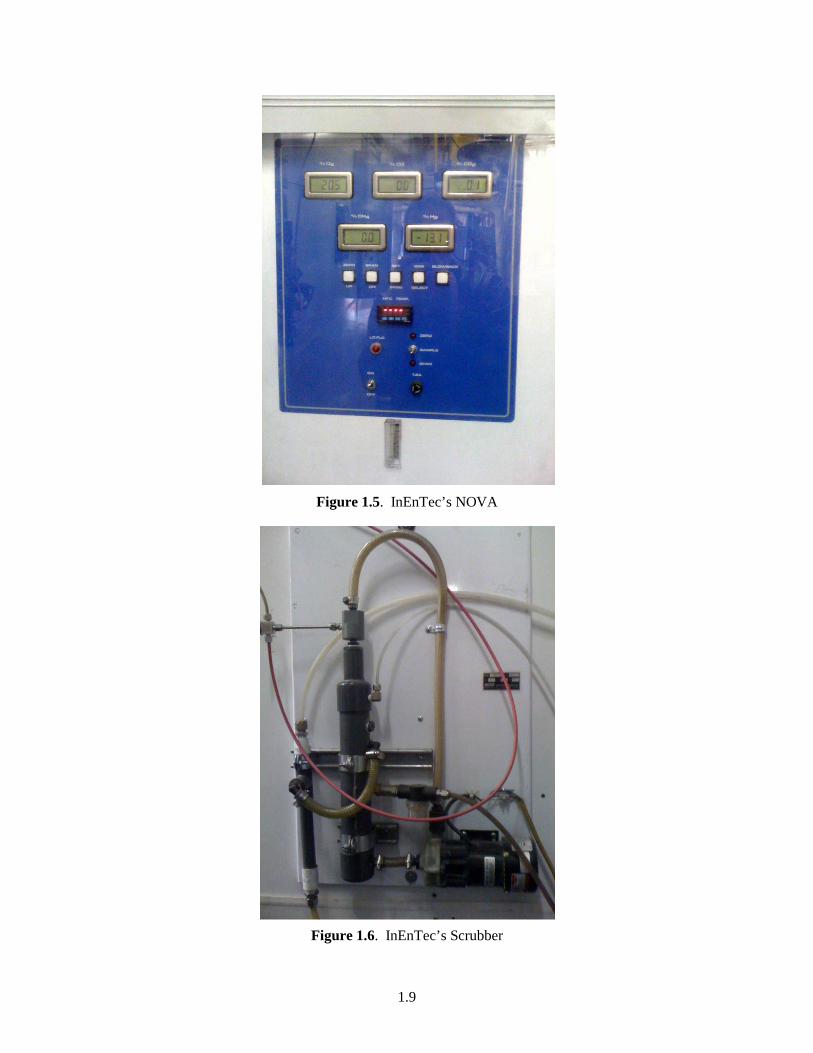
Before constructing a gasifier facility, PNNL considered the environmental impact. The syngas product stream from the PNNL gasifier is sent through existing equipment maintained by InEnTec for treatment of syngas produced by their plasma enhanced melter (PEM) waste-to-energy technology. The analytics was performed by InEntec’s NOVA instrument (figure 1.5). The syngas is quenched with water at the bottom of the gasifier vessel. InEnTec disposes of the quench water via approved regulatory disposal paths. Next, the syngas passes through a thermal residence chamber (TRC), which is a refractory-lined empty steel vessel. The TRC provides additional cooling for the syngas. The syngas exits the TRC and moves into a packed column scrubber (figure 1.6), which removes acid gases (CO2 and H2S) and particulates. After passing through the scrubber, the gas is directed through a high efficiency particulate air (HEPA) filter. The cleaned syngas is then released to the atmosphere through a stack.
1.9
Figure 1.5. InEnTec’s NOVA
Figure 1.6. InEnTec’s Scrubber

2.1
2.0 Design Parameters, Testing, and Results
An entrained flow slagging gasifier was developed, commissioned, and tested. This chapter addresses the system design, the engineering design approach, testing, and results.
2.1 Project QA and Safety
A standard quality assurance process was implemented and followed during the gasifier commissioning. First, a hazard assessment was conducted to assess physical and chemical hazards to which lab employees may be exposed. Based on the hazard assessment the required personal protective equipment (PPE) was determined and a standard operating procedure was developed, maintained, and followed. Appropriate PPE includes such items as safety goggles, Nomex or Tyvek suits, appropriate gloves, and dust masks when working with the pulverized coal.
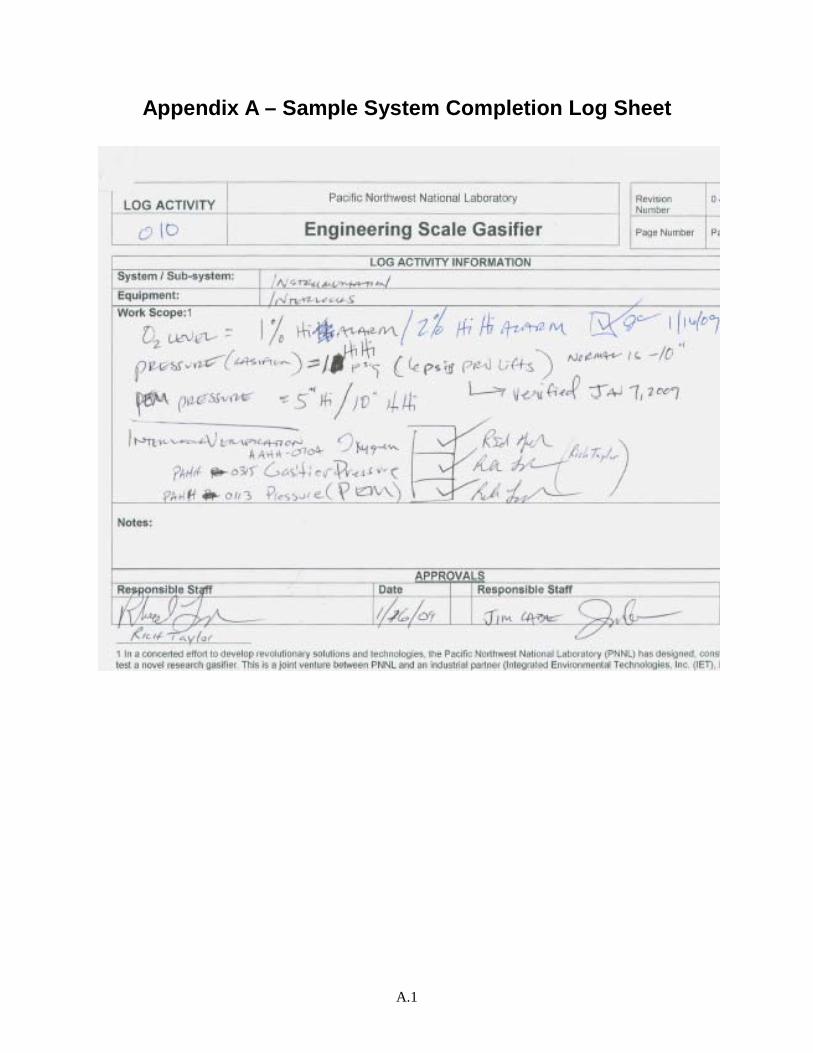
Implementation of system changes were documented on system logs; a sample system log is provided in Appendix A. When non-conformance issues were discovered, immediate corrective action was taken to mitigate potential hazards. Lessons learned were documented and discussed with the project team to prevent future occurrences. An example of this was the observance of audible deflagrations during one of the runs. This led to the design of alternative feed systems including a slurry feed system discussed in Chapter 5.
2.2 Engineering Design Approach
An engineering design approach was applied to commissioning the gasifier. This approach focused on the coordination of all the individual tasks, activities, and technical disciplines to develop a total system. This methodology involves the understanding of the problem statement, identification of objectives and requirements, concept selection, system creation, system operation, and life cycle management.
Before any experimentation could be performed, the incomplete engineering scale coal gasifier required system completion. To achieve mechanical and electrical system completion, the project team created and completed system check-out and mechanical logs. These logs helped track the process of equipment modification, addition, elimination, and testing. The team followed engineering best practices including peer review and quality assurance measures. When appropriate, certain subsystems were independently developed and bench tested prior to connecting them together in a cohesive system. This approach allowed parallel development and thorough pre-testing of each subsystem as well as simultaneous procurement of parts. All components were organized into a system/subsystem list as follows:
• Purge system
– Gas supply (provided by InEnTec facility)
– Nitrogen to head
– Nitrogen to coal hopper
– Manual stop valve
2.2
• Oxygen system
– Gas supply (provided by InEnTec facility)
– Manual stop valve
– Inlet/outlet pressure
– Dwyer meter
– Block valve
– Injection tubing and/or nozzles
• Water systems
– Cold water supply to head
– Filter for head water
– Flow valve
– Cold water supply to basin
– Filter for basin water
– Spray nozzles for basin
• Structure/Frame
– Cages
– Safety structure
• Gasifier
– Steel vessel
– Flanges and sealing surfaces
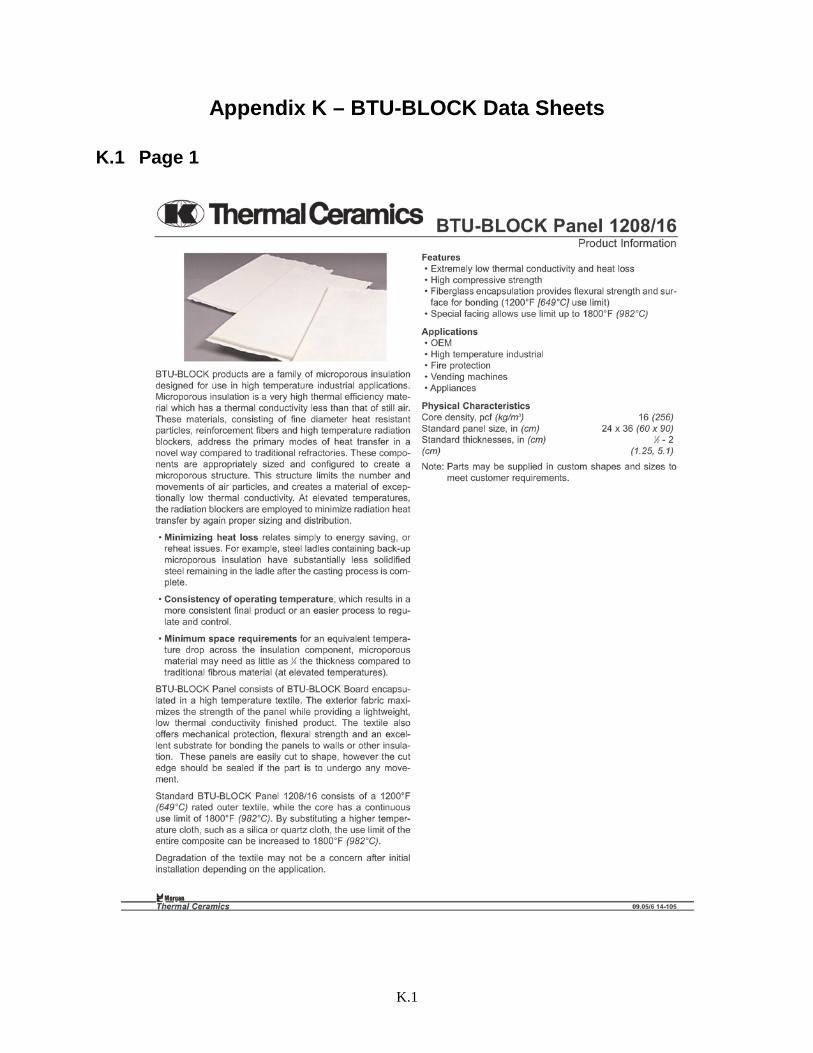
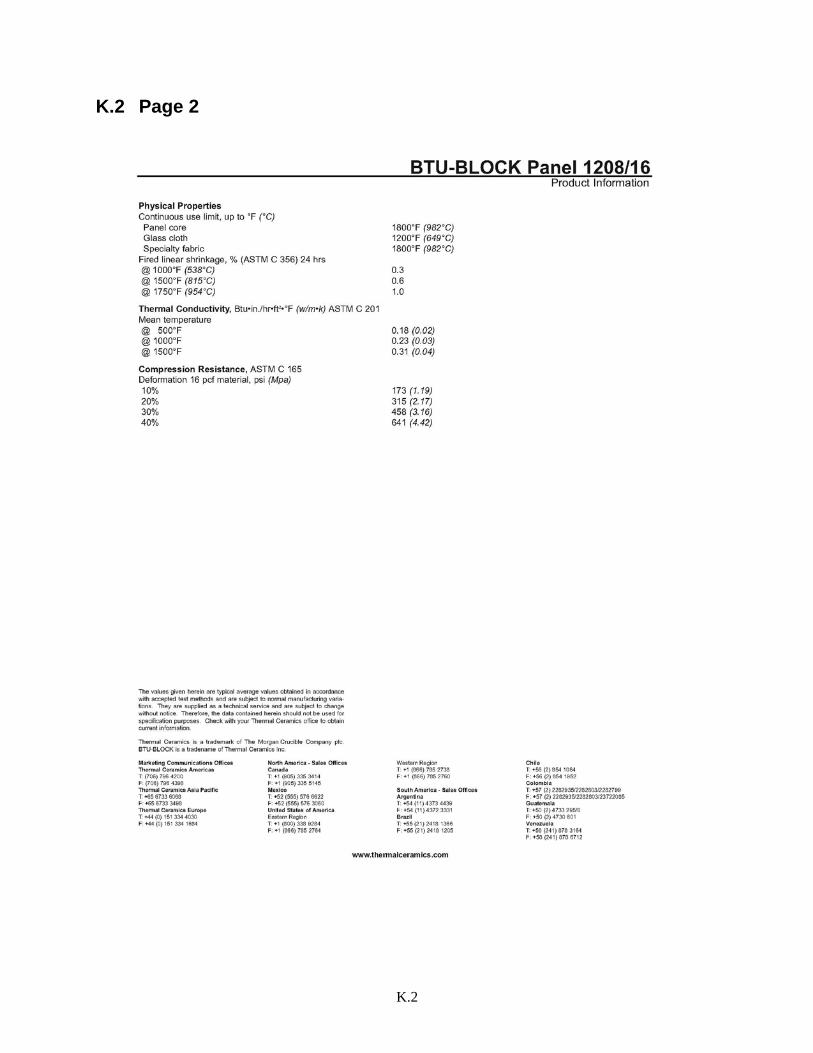
– Refractories and BTU-BLOCK
– Bolting
– Insulation
• Feed systems
– Containers
– Filters
– Drawdown tube
– Pumps
– Valving (isolation and check)
– Nozzles
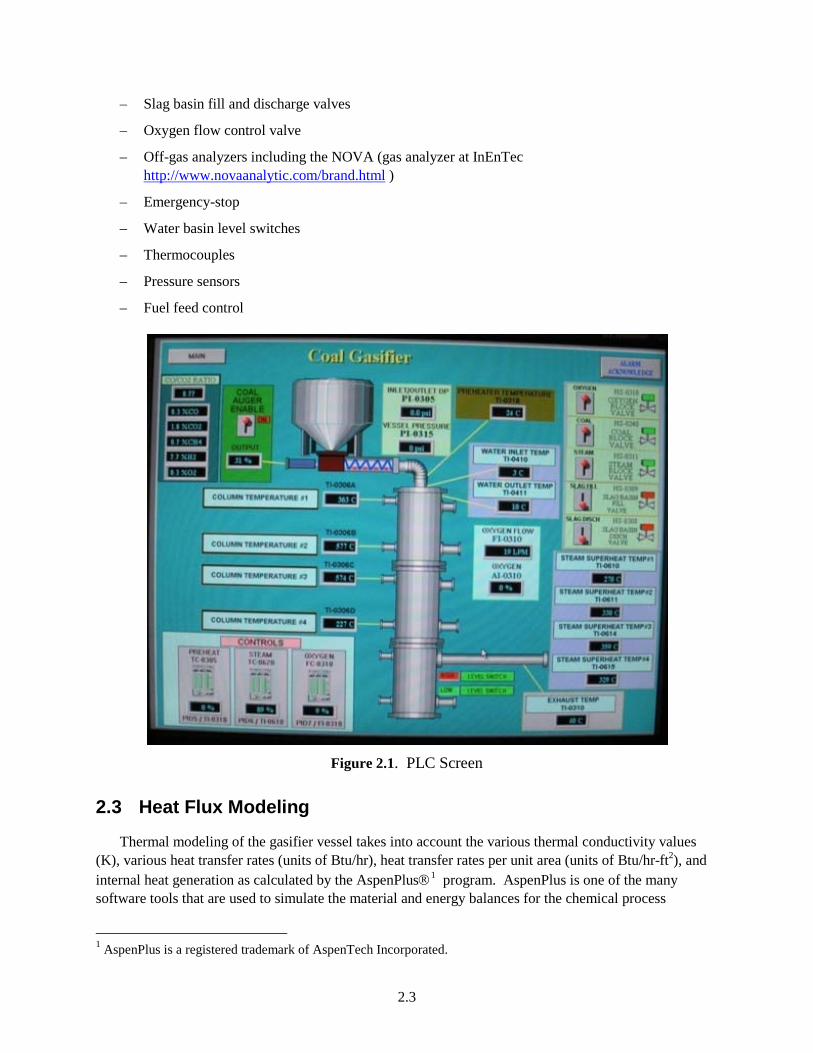
• Instrumentation (run via programmable logic controller (PLC) see Figure 2.1)
– Steam, oxygen, and coal block valves
2.3
– Slag basin fill and discharge valves
– Oxygen flow control valve
– Off-gas analyzers including the NOVA (gas analyzer at InEnTec http://www.novaanalytic.com/brand.html )
– Emergency-stop
– Water basin level switches
– Thermocouples
– Pressure sensors
– Fuel feed control
Figure 2.1. PLC Screen
2.3 Heat Flux Modeling
Thermal modeling of the gasifier vessel takes into account the various thermal conductivity values (K), various heat transfer rates (units of Btu/hr), heat transfer rates per unit area (units of Btu/hr-ft2), and internal heat generation as calculated by the AspenPlus1
1 AspenPlus is a registered trademark of AspenTech Incorporated.
program. AspenPlus is one of the many software tools that are used to simulate the material and energy balances for the chemical process
2.4
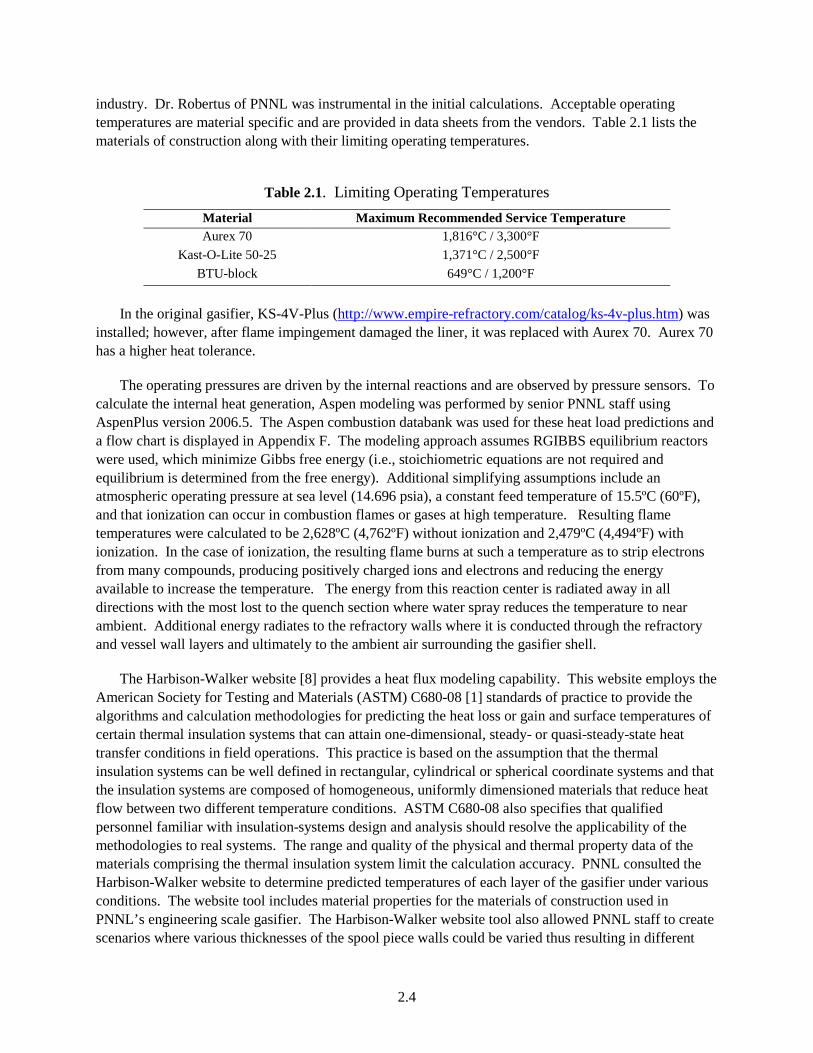
industry. Dr. Robertus of PNNL was instrumental in the initial calculations. Acceptable operating temperatures are material specific and are provided in data sheets from the vendors. Table 2.1 lists the materials of construction along with their limiting operating temperatures.
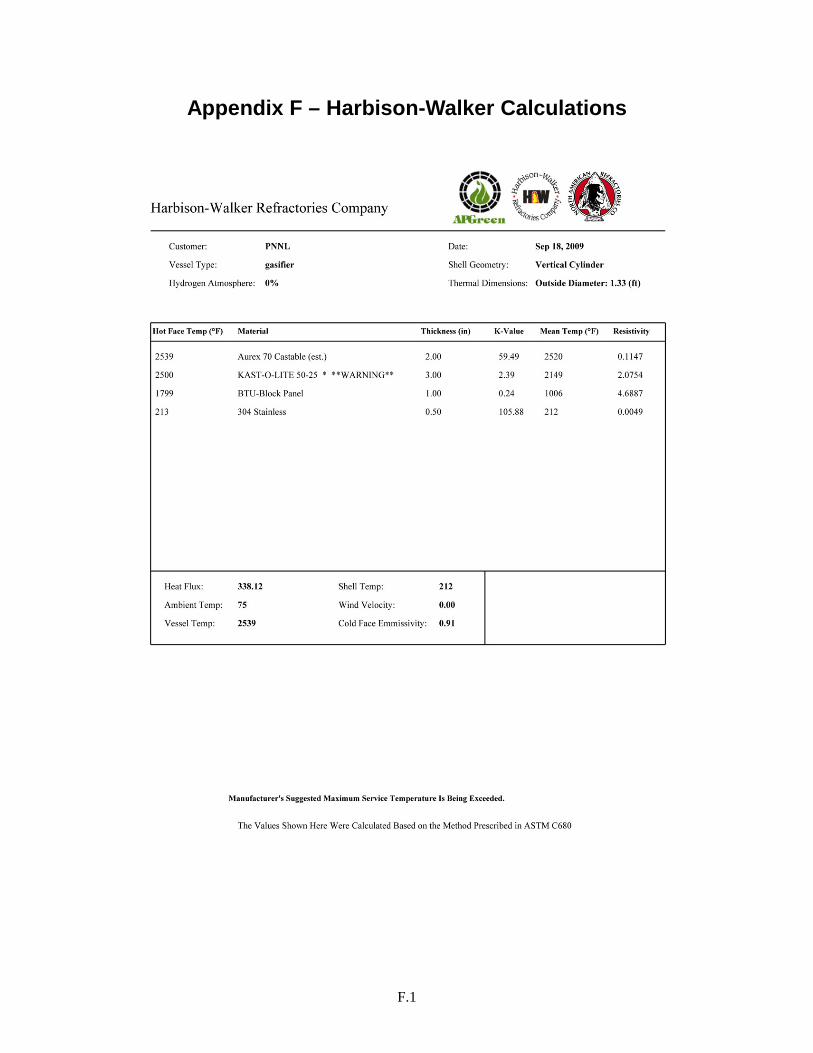
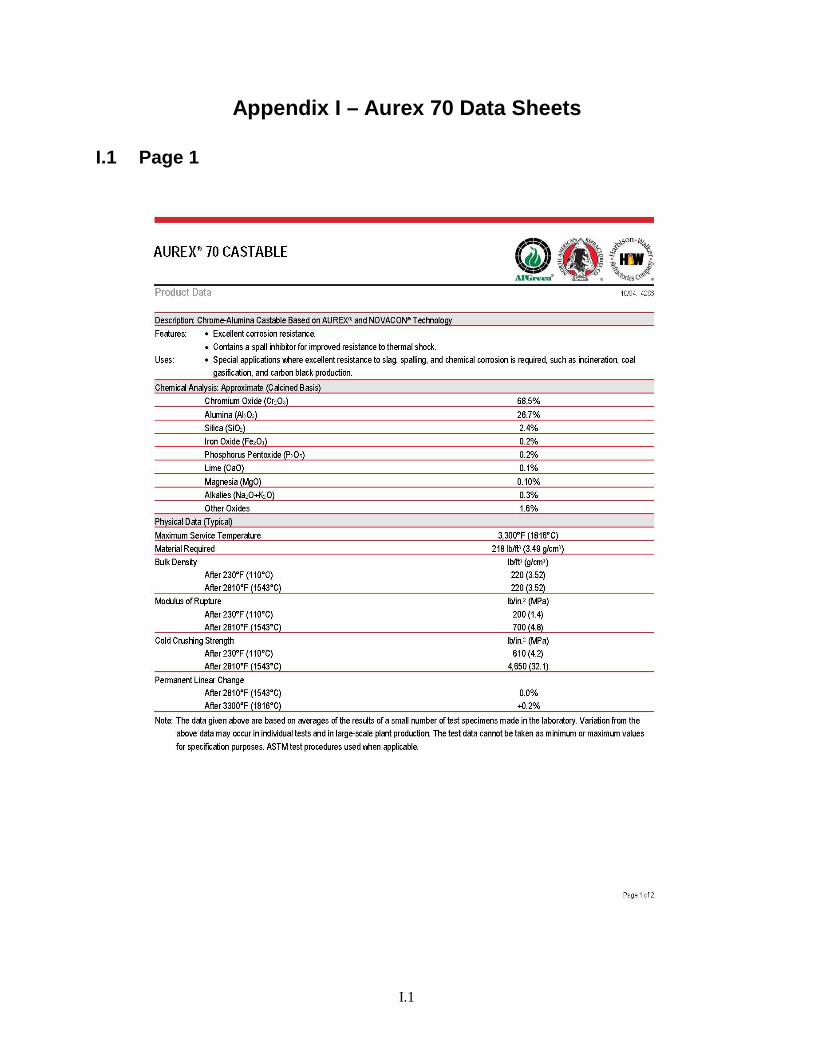
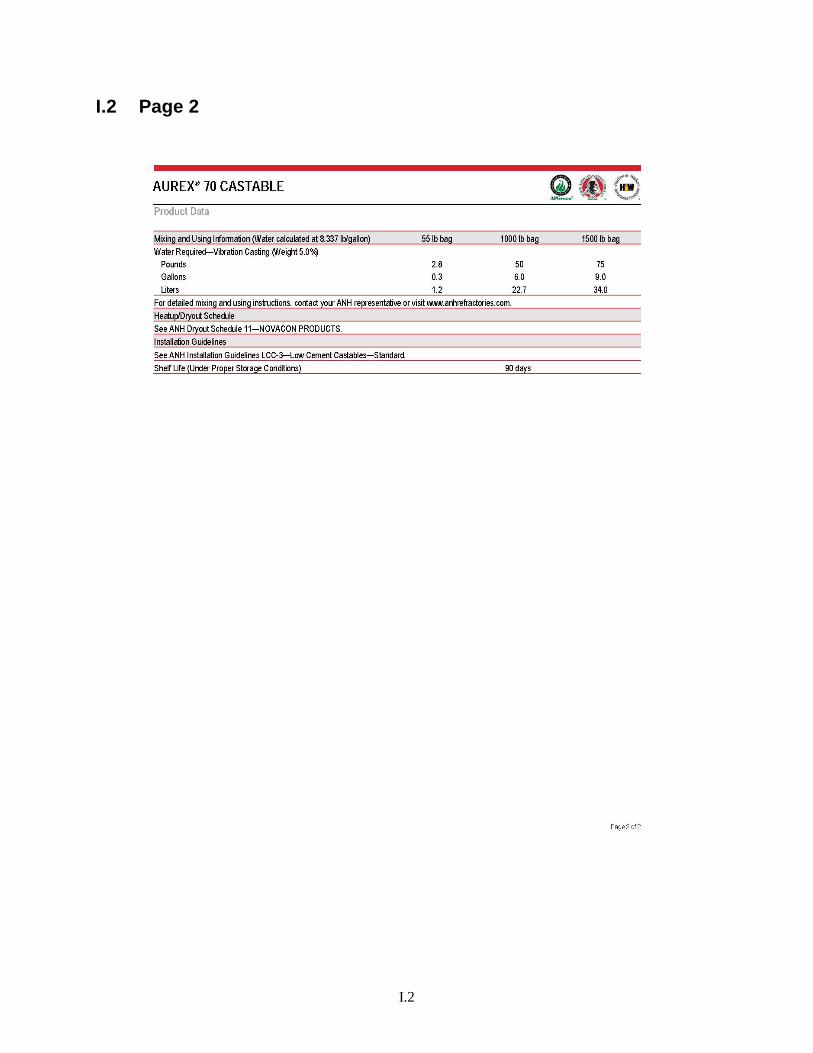
Table 2.1. Limiting Operating Temperatures Material Maximum Recommended Service Temperature Aurex 70 1,816°C / 3,300°F
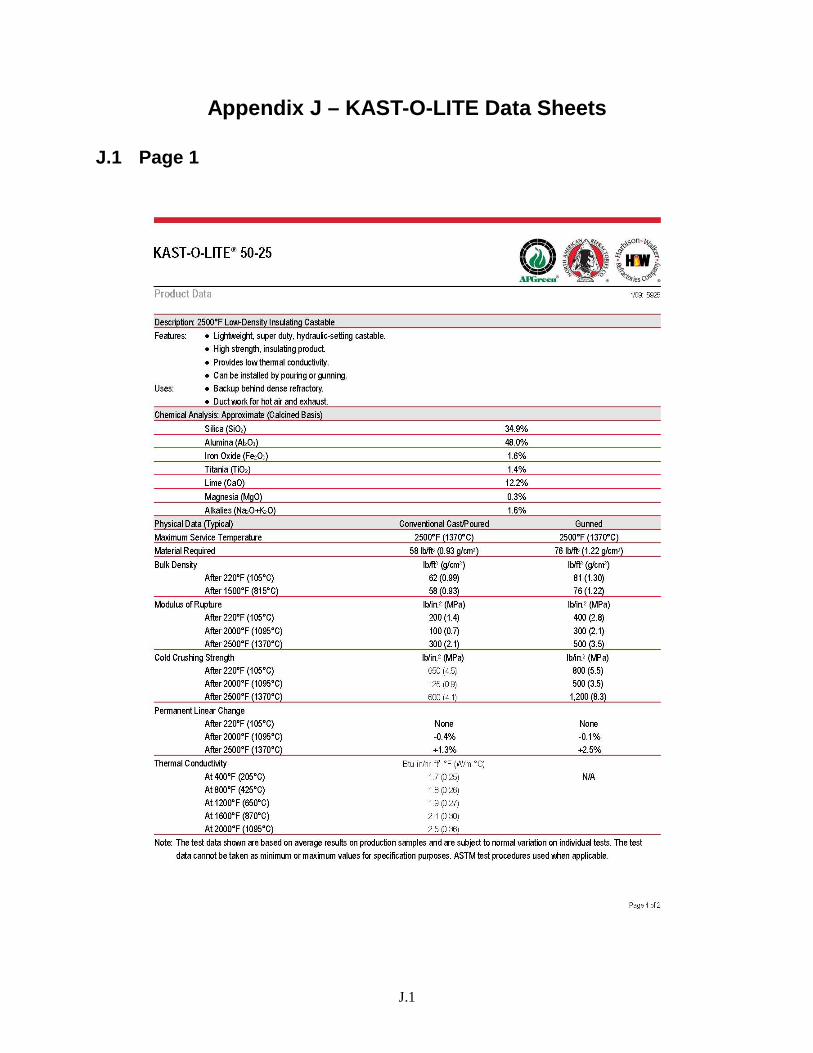
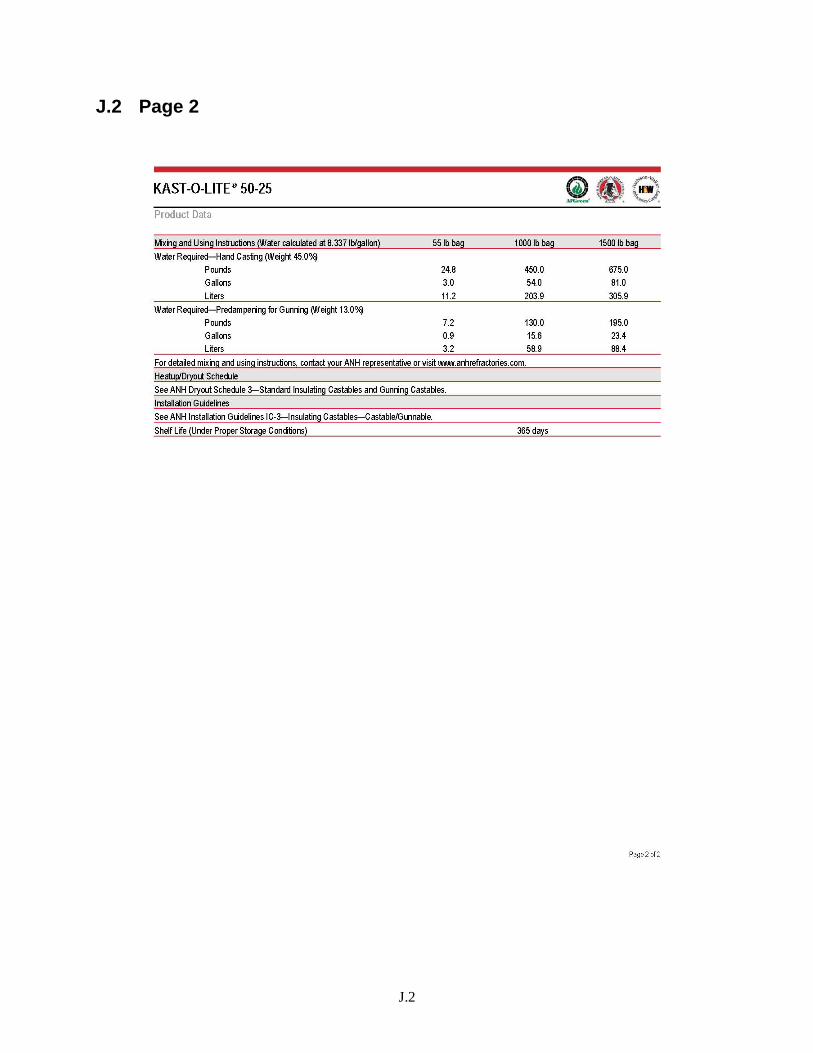
Kast-O-Lite 50-25 1,371°C / 2,500°F BTU-block 649°C / 1,200°F
In the original gasifier, KS-4V-Plus (http://www.empire-refractory.com/catalog/ks-4v-plus.htm) was
installed; however, after flame impingement damaged the liner, it was replaced with Aurex 70. Aurex 70 has a higher heat tolerance.
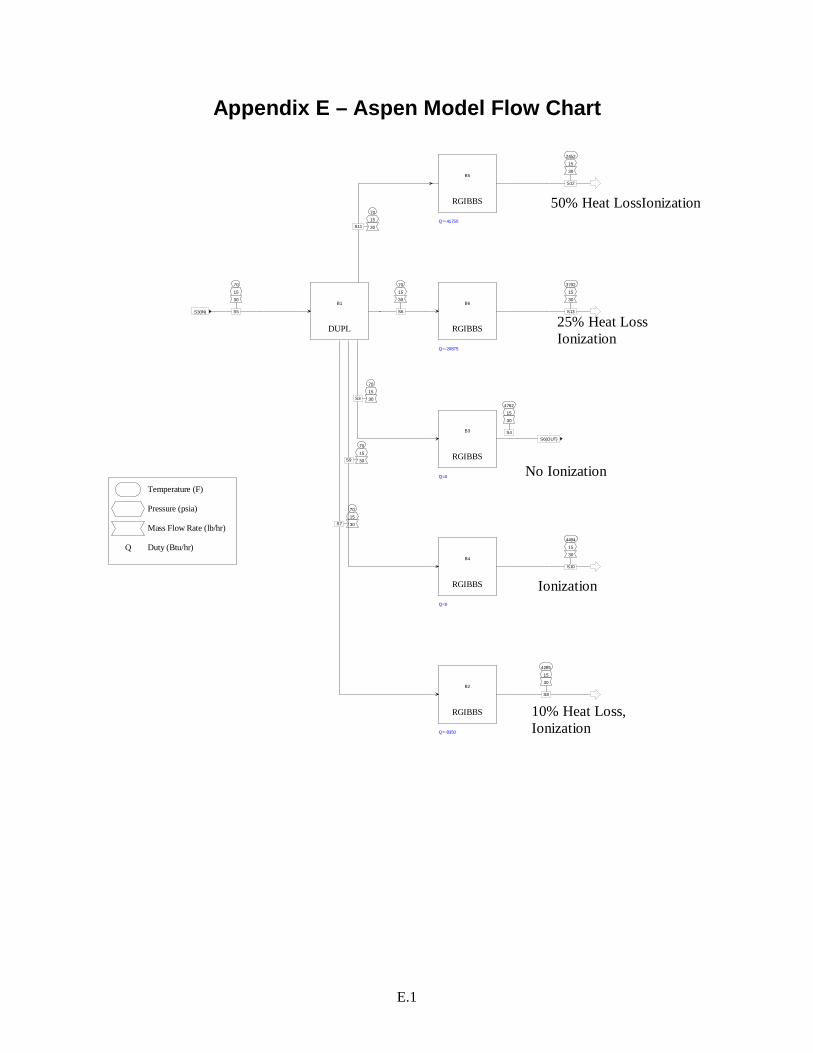
The operating pressures are driven by the internal reactions and are observed by pressure sensors. To calculate the internal heat generation, Aspen modeling was performed by senior PNNL staff using AspenPlus version 2006.5. The Aspen combustion databank was used for these heat load predictions and a flow chart is displayed in Appendix F. The modeling approach assumes RGIBBS equilibrium reactors were used, which minimize Gibbs free energy (i.e., stoichiometric equations are not required and equilibrium is determined from the free energy). Additional simplifying assumptions include an atmospheric operating pressure at sea level (14.696 psia), a constant feed temperature of 15.5ºC (60ºF), and that ionization can occur in combustion flames or gases at high temperature. Resulting flame temperatures were calculated to be 2,628ºC (4,762ºF) without ionization and 2,479ºC (4,494ºF) with ionization. In the case of ionization, the resulting flame burns at such a temperature as to strip electrons from many compounds, producing positively charged ions and electrons and reducing the energy available to increase the temperature. The energy from this reaction center is radiated away in all directions with the most lost to the quench section where water spray reduces the temperature to near ambient. Additional energy radiates to the refractory walls where it is conducted through the refractory and vessel wall layers and ultimately to the ambient air surrounding the gasifier shell.
The Harbison-Walker website [8] provides a heat flux modeling capability. This website employs the American Society for Testing and Materials (ASTM) C680-08 [1] standards of practice to provide the algorithms and calculation methodologies for predicting the heat loss or gain and surface temperatures of certain thermal insulation systems that can attain one-dimensional, steady- or quasi-steady-state heat transfer conditions in field operations. This practice is based on the assumption that the thermal insulation systems can be well defined in rectangular, cylindrical or spherical coordinate systems and that the insulation systems are composed of homogeneous, uniformly dimensioned materials that reduce heat flow between two different temperature conditions. ASTM C680-08 also specifies that qualified personnel familiar with insulation-systems design and analysis should resolve the applicability of the methodologies to real systems. The range and quality of the physical and thermal property data of the materials comprising the thermal insulation system limit the calculation accuracy. PNNL consulted the Harbison-Walker website to determine predicted temperatures of each layer of the gasifier under various conditions. The website tool includes material properties for the materials of construction used in PNNL’s engineering scale gasifier. The Harbison-Walker website tool also allowed PNNL staff to create scenarios where various thicknesses of the spool piece walls could be varied thus resulting in different
2.5
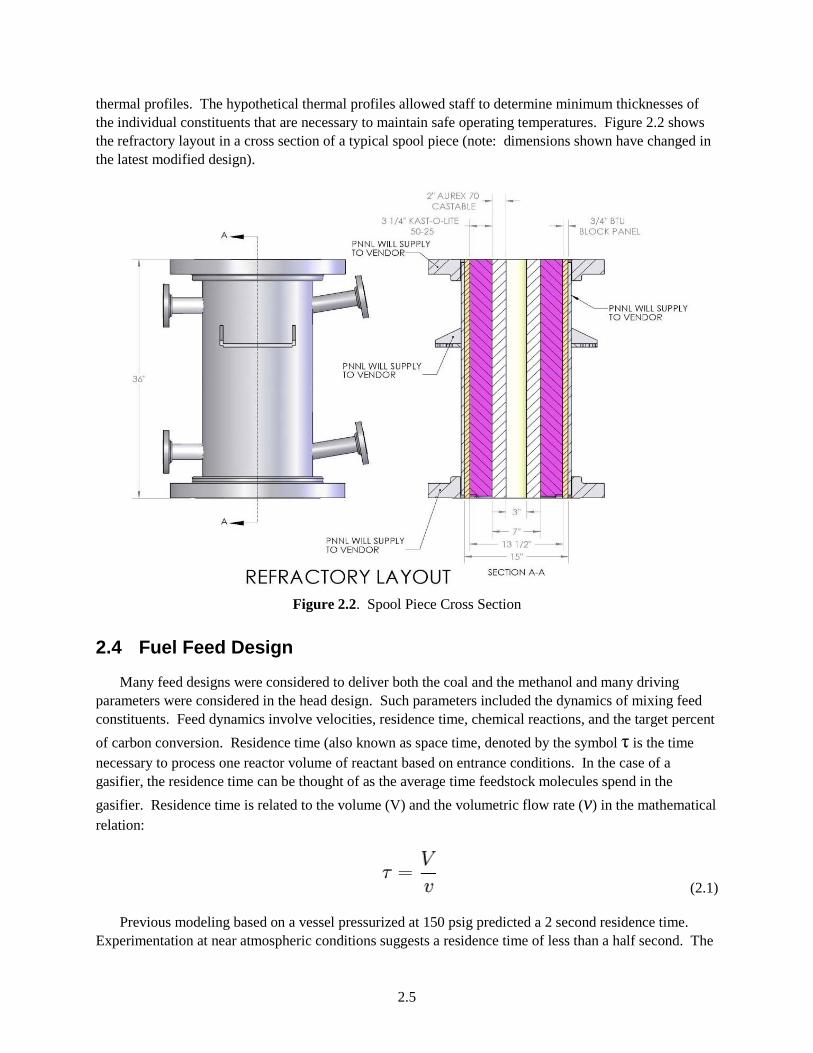
thermal profiles. The hypothetical thermal profiles allowed staff to determine minimum thicknesses of the individual constituents that are necessary to maintain safe operating temperatures. Figure 2.2 shows the refractory layout in a cross section of a typical spool piece (note: dimensions shown have changed in the latest modified design).
Figure 2.2. Spool Piece Cross Section
2.4 Fuel Feed Design
Many feed designs were considered to deliver both the coal and the methanol and many driving parameters were considered in the head design. Such parameters included the dynamics of mixing feed constituents. Feed dynamics involve velocities, residence time, chemical reactions, and the target percent of carbon conversion. Residence time (also known as space time, denoted by the symbol τ is the time necessary to process one reactor volume of reactant based on entrance conditions. In the case of a gasifier, the residence time can be thought of as the average time feedstock molecules spend in the gasifier. Residence time is related to the volume (V) and the volumetric flow rate (v) in the mathematical relation:
(2.1)
Previous modeling based on a vessel pressurized at 150 psig predicted a 2 second residence time. Experimentation at near atmospheric conditions suggests a residence time of less than a half second. The
2.6
feed design will largely affect the residence time as well as the internal heat production and distribution. Modeling suggests certain temperatures or distributions, but experimental data ultimately recalibrated the understanding of how the system behaves.
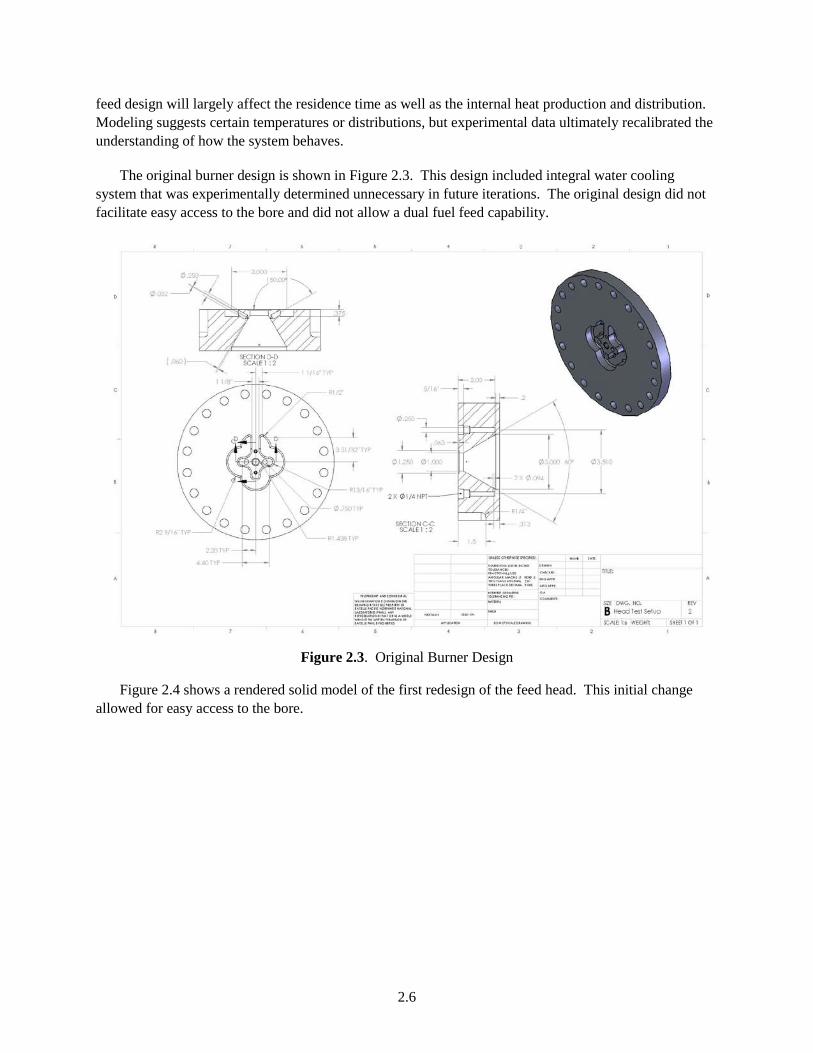
The original burner design is shown in Figure 2.3. This design included integral water cooling system that was experimentally determined unnecessary in future iterations. The original design did not facilitate easy access to the bore and did not allow a dual fuel feed capability.
Figure 2.3. Original Burner Design
Figure 2.4 shows a rendered solid model of the first redesign of the feed head. This initial change allowed for easy access to the bore.
2.7
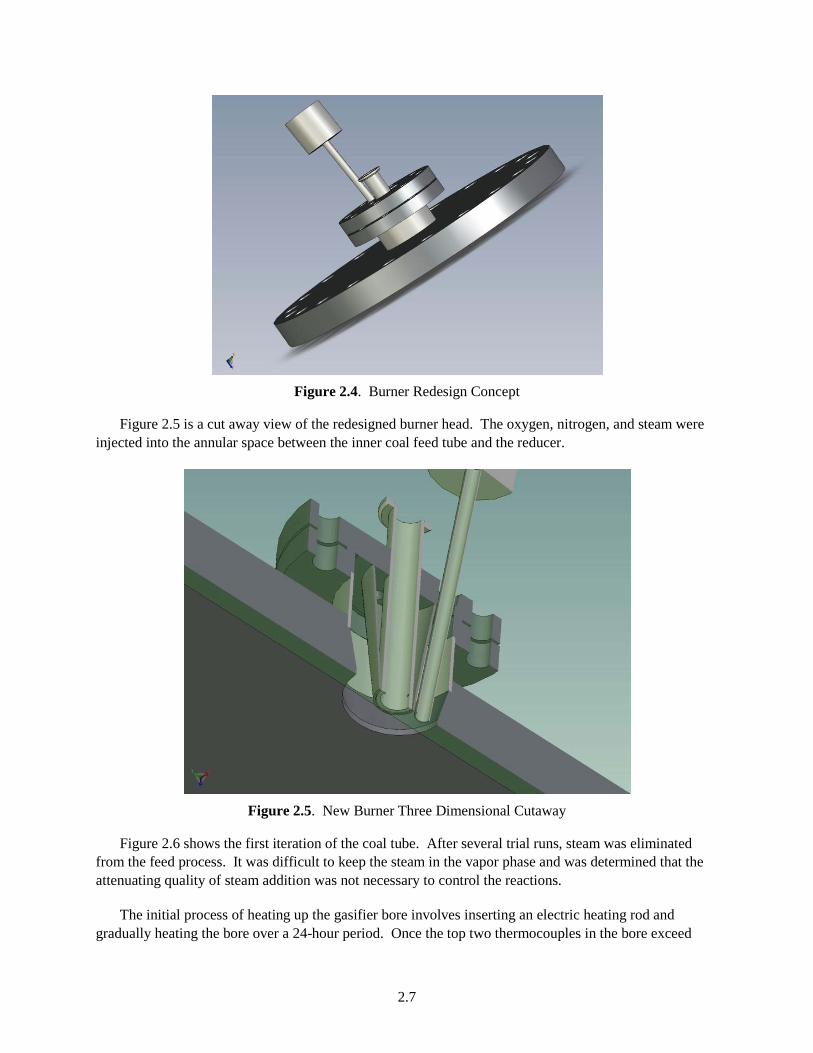
Figure 2.4. Burner Redesign Concept
Figure 2.5 is a cut away view of the redesigned burner head. The oxygen, nitrogen, and steam were injected into the annular space between the inner coal feed tube and the reducer.
Figure 2.5. New Burner Three Dimensional Cutaway
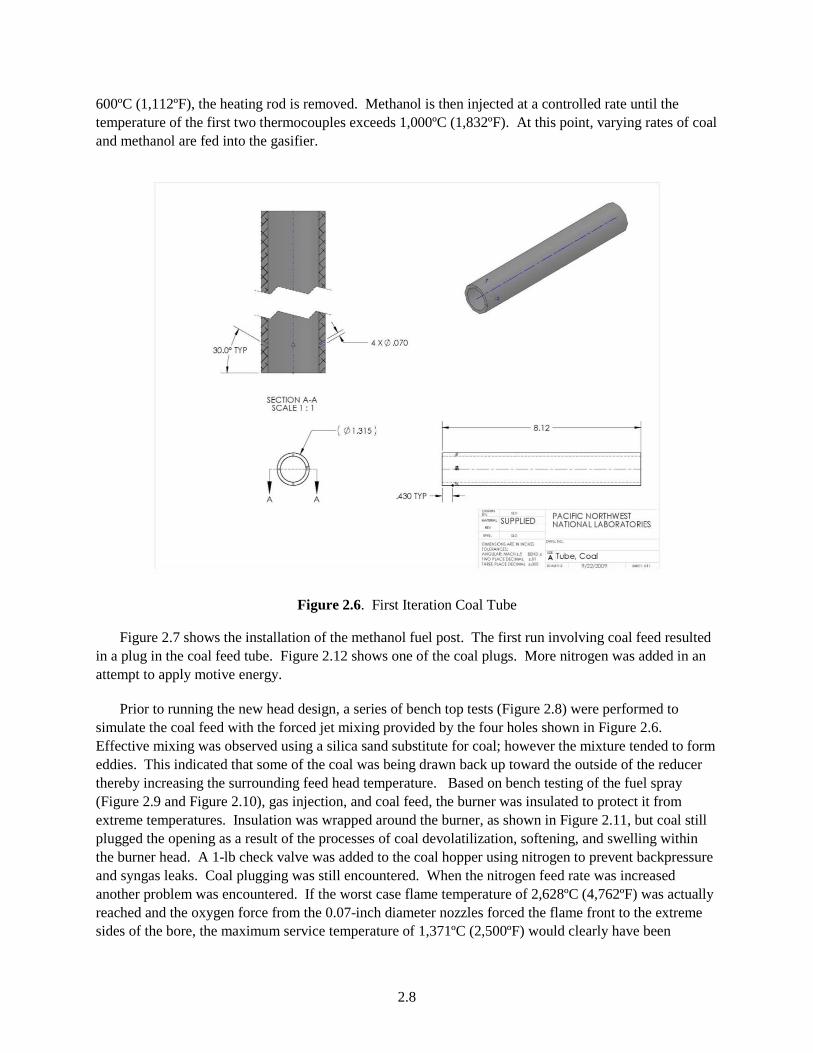
Figure 2.6 shows the first iteration of the coal tube. After several trial runs, steam was eliminated from the feed process. It was difficult to keep the steam in the vapor phase and was determined that the attenuating quality of steam addition was not necessary to control the reactions.
The initial process of heating up the gasifier bore involves inserting an electric heating rod and gradually heating the bore over a 24-hour period. Once the top two thermocouples in the bore exceed
2.8
600ºC (1,112ºF), the heating rod is removed. Methanol is then injected at a controlled rate until the temperature of the first two thermocouples exceeds 1,000ºC (1,832ºF). At this point, varying rates of coal and methanol are fed into the gasifier.
Figure 2.6. First Iteration Coal Tube
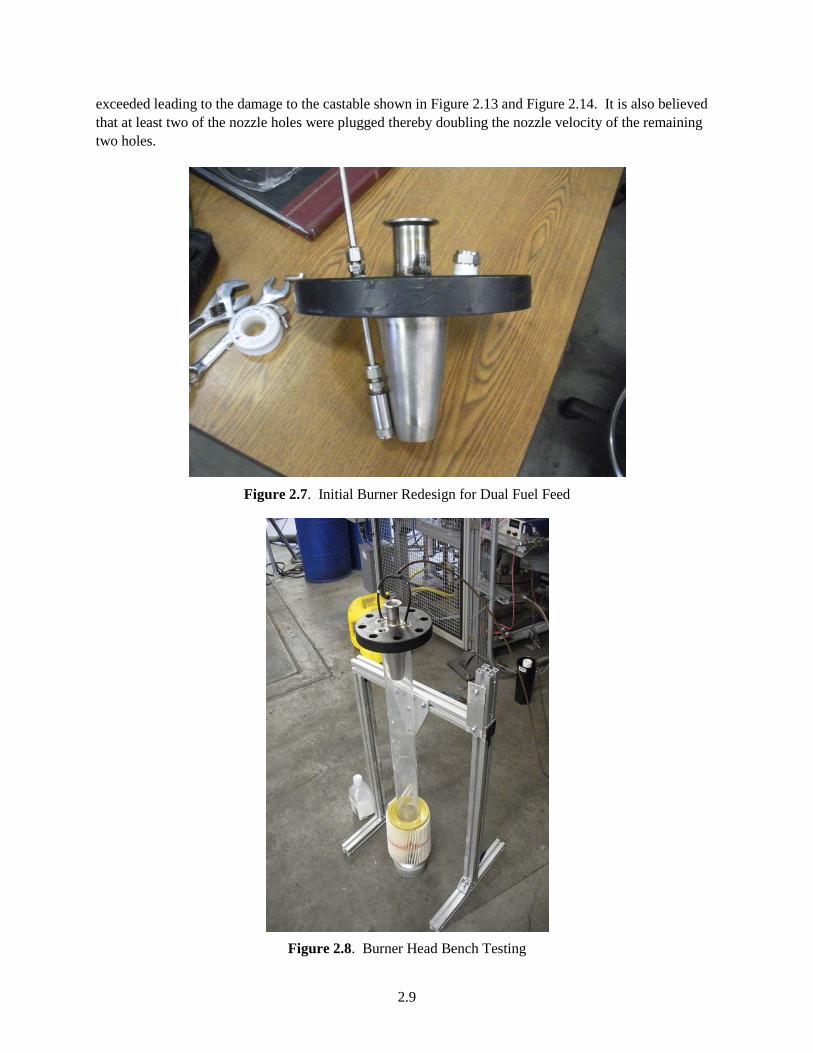
Figure 2.7 shows the installation of the methanol fuel post. The first run involving coal feed resulted in a plug in the coal feed tube. Figure 2.12 shows one of the coal plugs. More nitrogen was added in an attempt to apply motive energy.
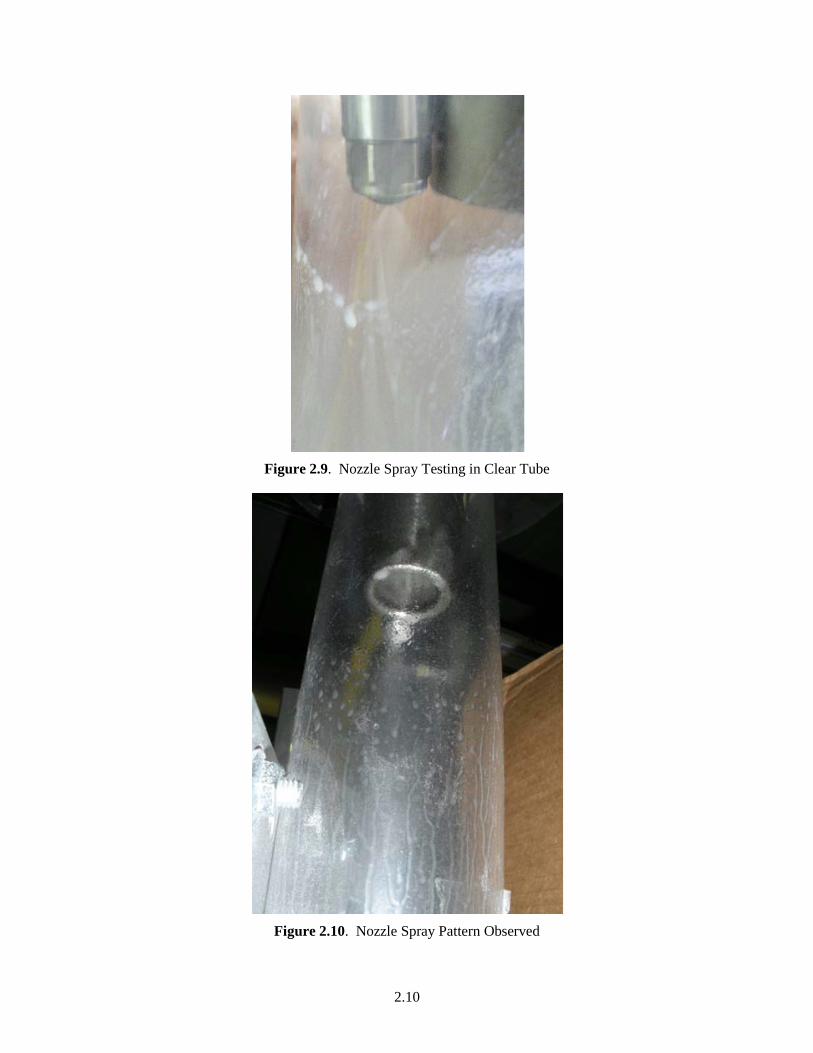
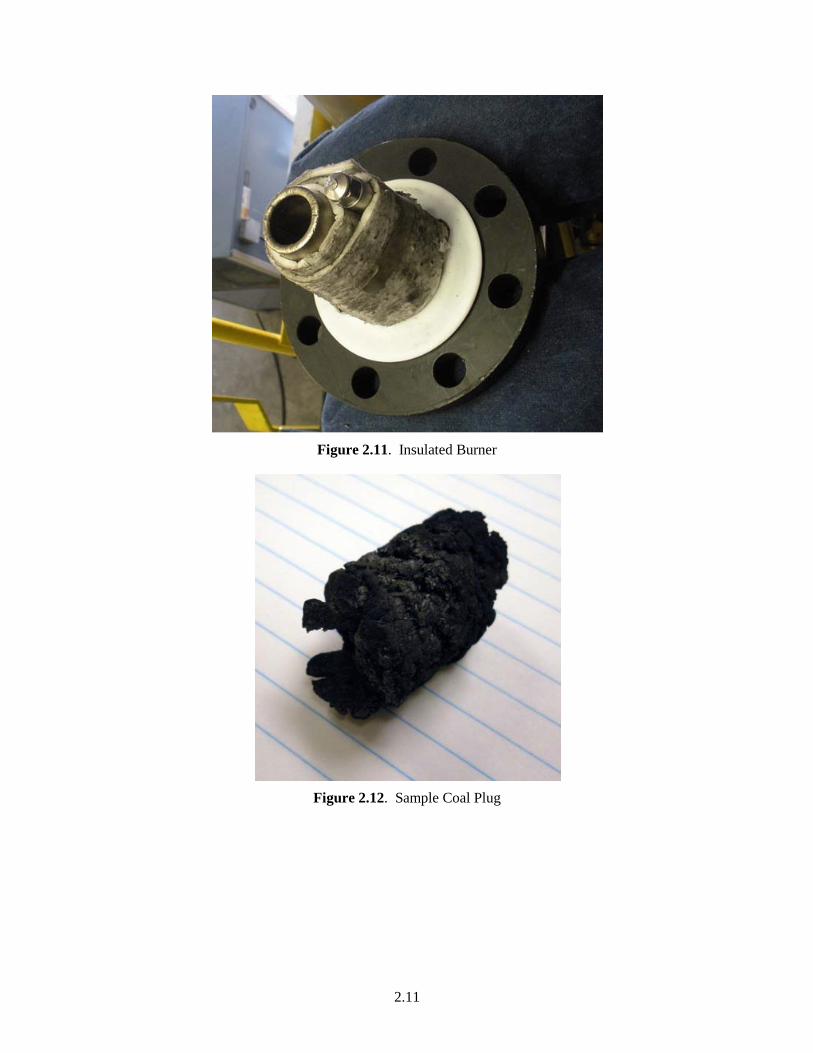
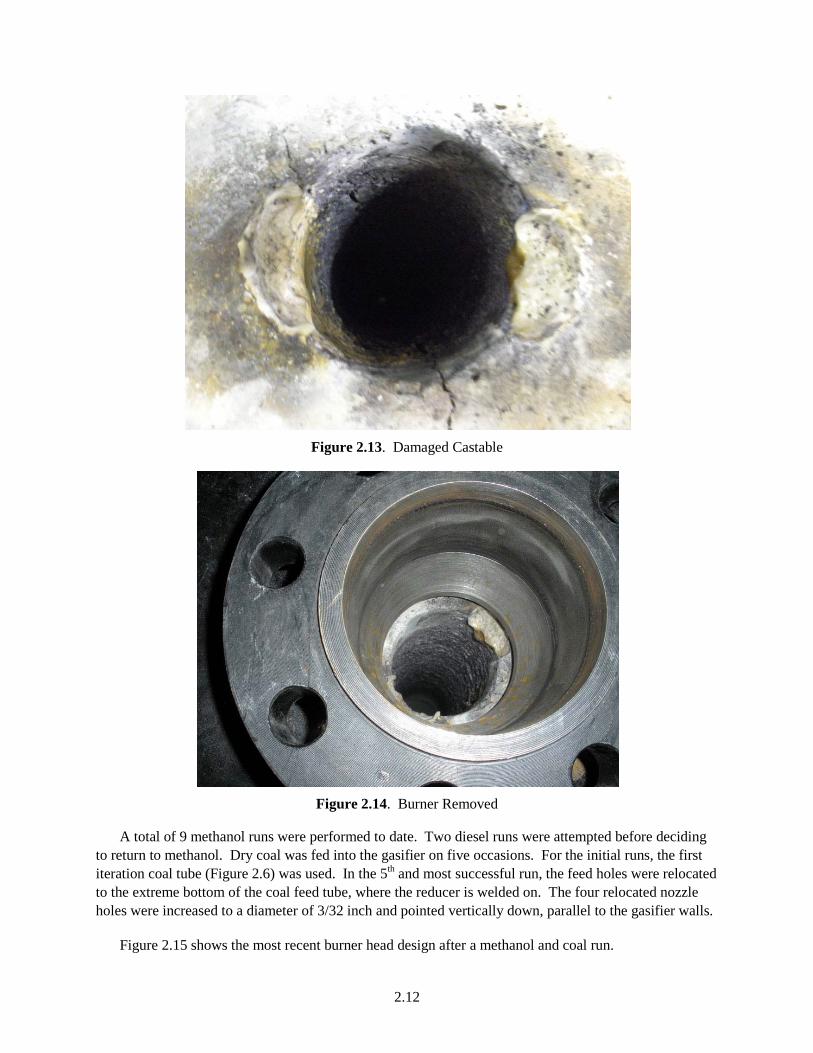
Prior to running the new head design, a series of bench top tests (Figure 2.8) were performed to simulate the coal feed with the forced jet mixing provided by the four holes shown in Figure 2.6. Effective mixing was observed using a silica sand substitute for coal; however the mixture tended to form eddies. This indicated that some of the coal was being drawn back up toward the outside of the reducer thereby increasing the surrounding feed head temperature. Based on bench testing of the fuel spray (Figure 2.9 and Figure 2.10), gas injection, and coal feed, the burner was insulated to protect it from extreme temperatures. Insulation was wrapped around the burner, as shown in Figure 2.11, but coal still plugged the opening as a result of the processes of coal devolatilization, softening, and swelling within the burner head. A 1-lb check valve was added to the coal hopper using nitrogen to prevent backpressure and syngas leaks. Coal plugging was still encountered. When the nitrogen feed rate was increased another problem was encountered. If the worst case flame temperature of 2,628ºC (4,762ºF) was actually reached and the oxygen force from the 0.07-inch diameter nozzles forced the flame front to the extreme sides of the bore, the maximum service temperature of 1,371ºC (2,500ºF) would clearly have been
2.9
exceeded leading to the damage to the castable shown in Figure 2.13 and Figure 2.14. It is also believed that at least two of the nozzle holes were plugged thereby doubling the nozzle velocity of the remaining two holes.
Figure 2.7. Initial Burner Redesign for Dual Fuel Feed
Figure 2.8. Burner Head Bench Testing
2.10
Figure 2.9. Nozzle Spray Testing in Clear Tube
Figure 2.10. Nozzle Spray Pattern Observed
2.11
Figure 2.11. Insulated Burner
Figure 2.12. Sample Coal Plug
2.12
Figure 2.13. Damaged Castable
Figure 2.14. Burner Removed
A total of 9 methanol runs were performed to date. Two diesel runs were attempted before deciding to return to methanol. Dry coal was fed into the gasifier on five occasions. For the initial runs, the first iteration coal tube (Figure 2.6) was used. In the 5th and most successful run, the feed holes were relocated to the extreme bottom of the coal feed tube, where the reducer is welded on. The four relocated nozzle holes were increased to a diameter of 3/32 inch and pointed vertically down, parallel to the gasifier walls.
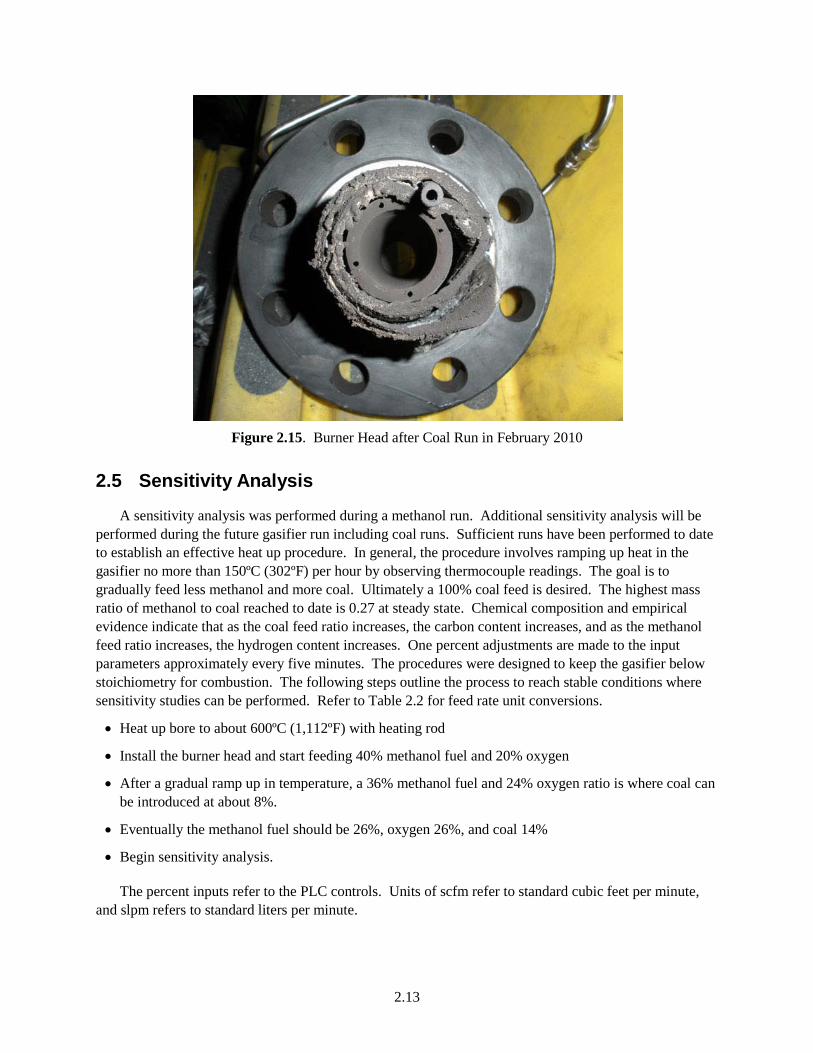
Figure 2.15 shows the most recent burner head design after a methanol and coal run.
2.13
Figure 2.15. Burner Head after Coal Run in February 2010
2.5 Sensitivity Analysis
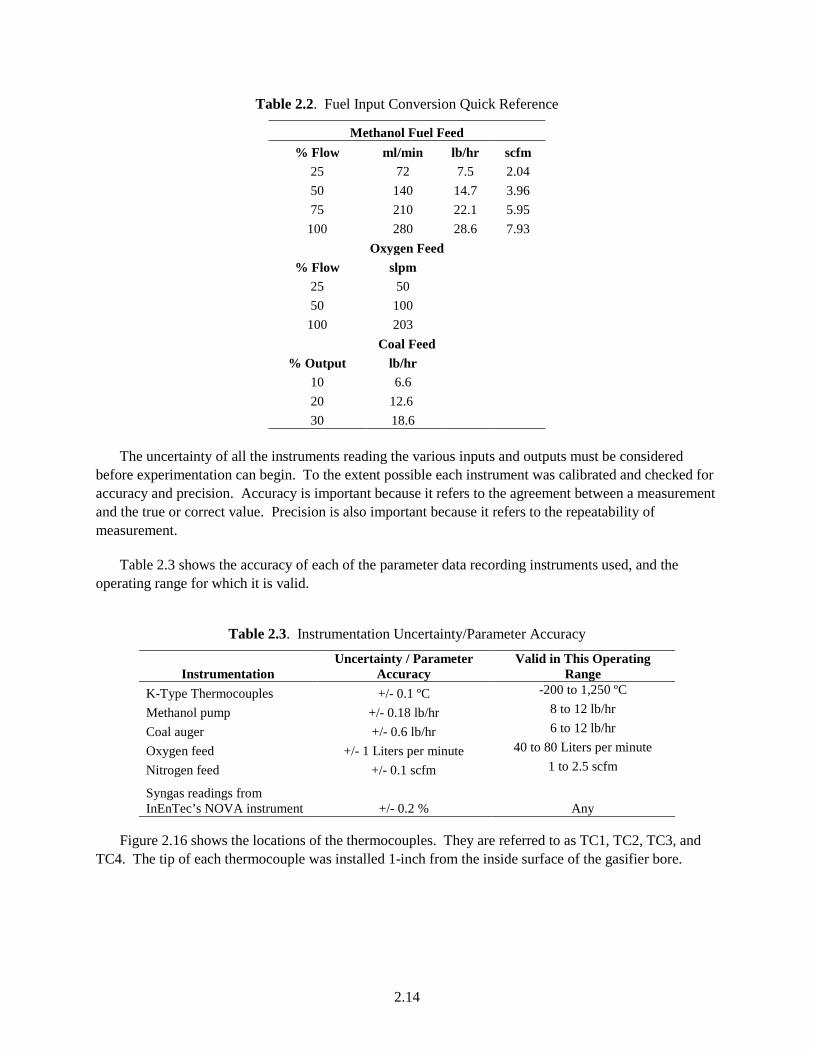
A sensitivity analysis was performed during a methanol run. Additional sensitivity analysis will be performed during the future gasifier run including coal runs. Sufficient runs have been performed to date to establish an effective heat up procedure. In general, the procedure involves ramping up heat in the gasifier no more than 150ºC (302ºF) per hour by observing thermocouple readings. The goal is to gradually feed less methanol and more coal. Ultimately a 100% coal feed is desired. The highest mass ratio of methanol to coal reached to date is 0.27 at steady state. Chemical composition and empirical evidence indicate that as the coal feed ratio increases, the carbon content increases, and as the methanol feed ratio increases, the hydrogen content increases. One percent adjustments are made to the input parameters approximately every five minutes. The procedures were designed to keep the gasifier below stoichiometry for combustion. The following steps outline the process to reach stable conditions where sensitivity studies can be performed. Refer to Table 2.2 for feed rate unit conversions.
• Heat up bore to about 600ºC (1,112ºF) with heating rod
• Install the burner head and start feeding 40% methanol fuel and 20% oxygen
• After a gradual ramp up in temperature, a 36% methanol fuel and 24% oxygen ratio is where coal can be introduced at about 8%.
• Eventually the methanol fuel should be 26%, oxygen 26%, and coal 14%
• Begin sensitivity analysis.
The percent inputs refer to the PLC controls. Units of scfm refer to standard cubic feet per minute, and slpm refers to standard liters per minute.
2.14
Table 2.2. Fuel Input Conversion Quick Reference
Methanol Fuel Feed % Flow ml/min lb/hr scfm
25 72 7.5 2.04 50 140 14.7 3.96 75 210 22.1 5.95
100 280 28.6 7.93 Oxygen Feed
% Flow slpm 25 50 50 100
100 203 Coal Feed
% Output lb/hr 10 6.6 20 12.6 30 18.6
The uncertainty of all the instruments reading the various inputs and outputs must be considered
before experimentation can begin. To the extent possible each instrument was calibrated and checked for accuracy and precision. Accuracy is important because it refers to the agreement between a measurement and the true or correct value. Precision is also important because it refers to the repeatability of measurement.
Table 2.3 shows the accuracy of each of the parameter data recording instruments used, and the operating range for which it is valid.
Table 2.3. Instrumentation Uncertainty/Parameter Accuracy
Instrumentation Uncertainty / Parameter
Accuracy Valid in This Operating
Range K-Type Thermocouples +/- 0.1 ºC -200 to 1,250 ºC
Methanol pump +/- 0.18 lb/hr 8 to 12 lb/hr
Coal auger +/- 0.6 lb/hr 6 to 12 lb/hr
Oxygen feed +/- 1 Liters per minute 40 to 80 Liters per minute
Nitrogen feed +/- 0.1 scfm 1 to 2.5 scfm
Syngas readings from InEnTec’s NOVA instrument +/- 0.2 % Any
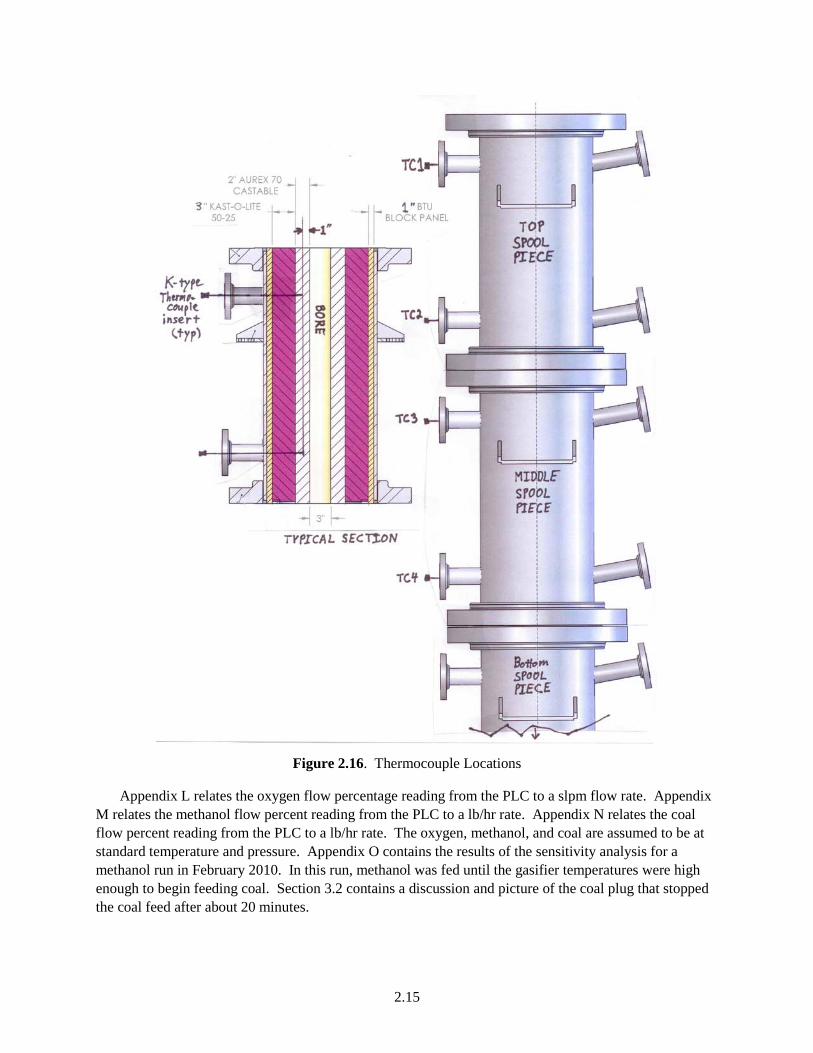
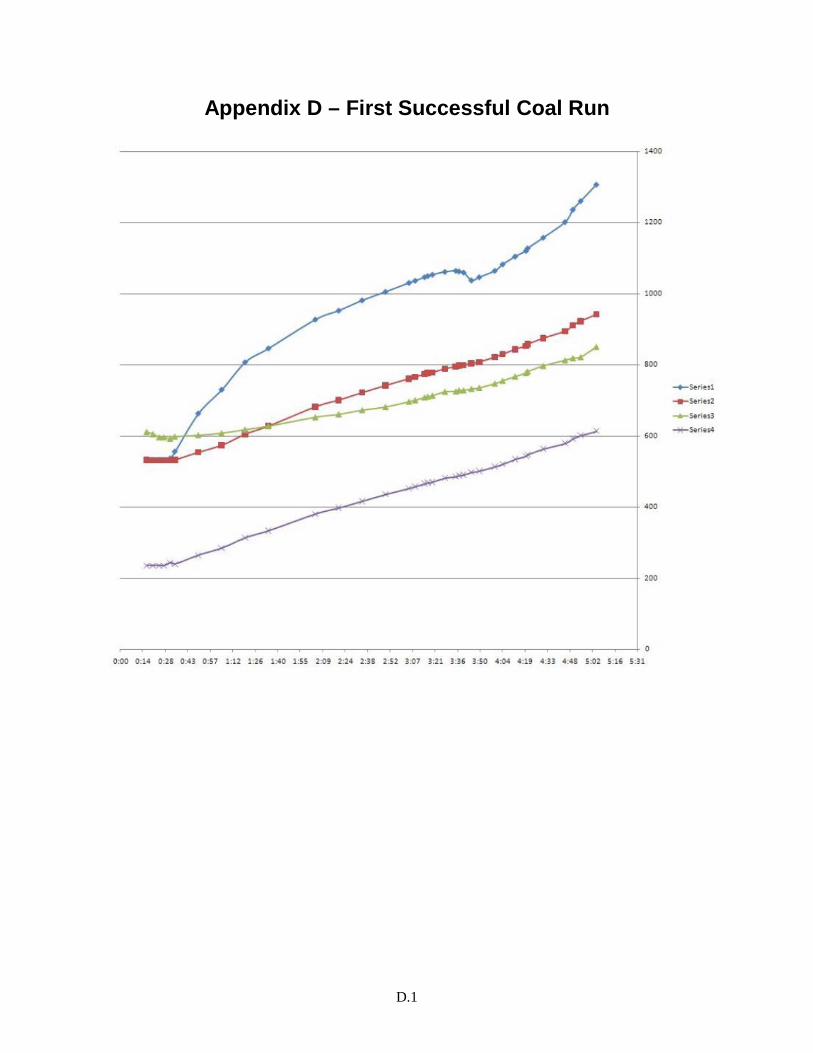
Figure 2.16 shows the locations of the thermocouples. They are referred to as TC1, TC2, TC3, and TC4. The tip of each thermocouple was installed 1-inch from the inside surface of the gasifier bore.
2.15
Figure 2.16. Thermocouple Locations
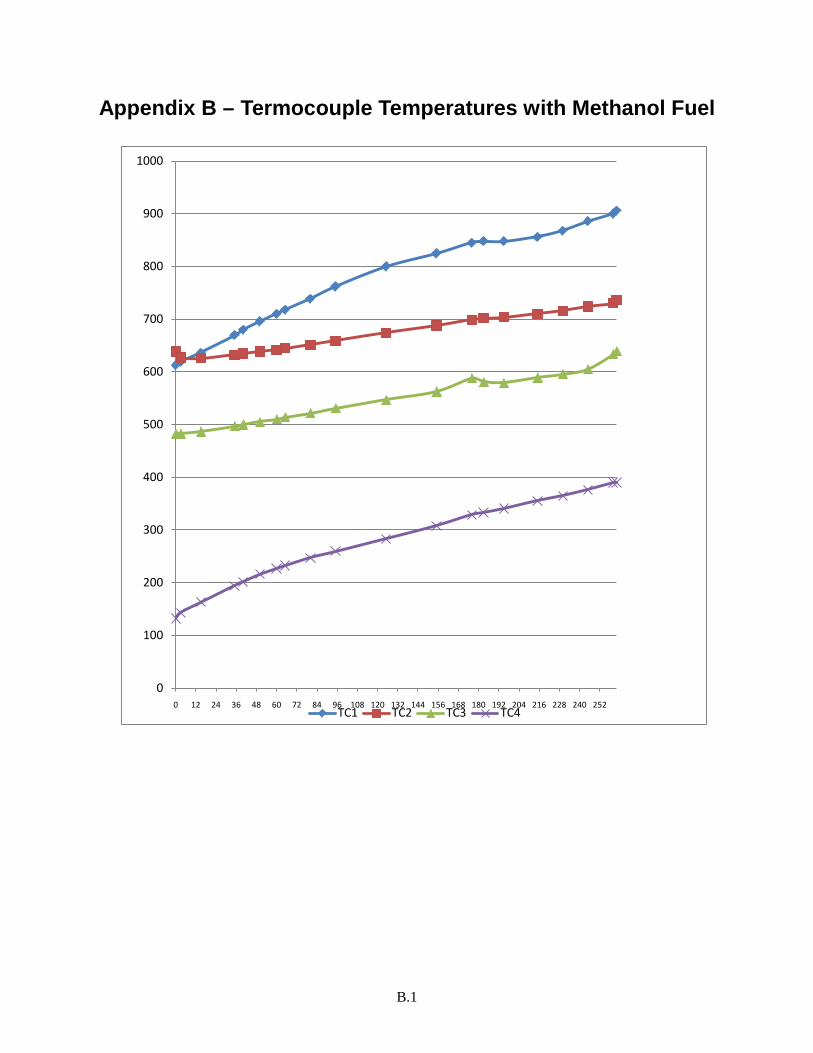
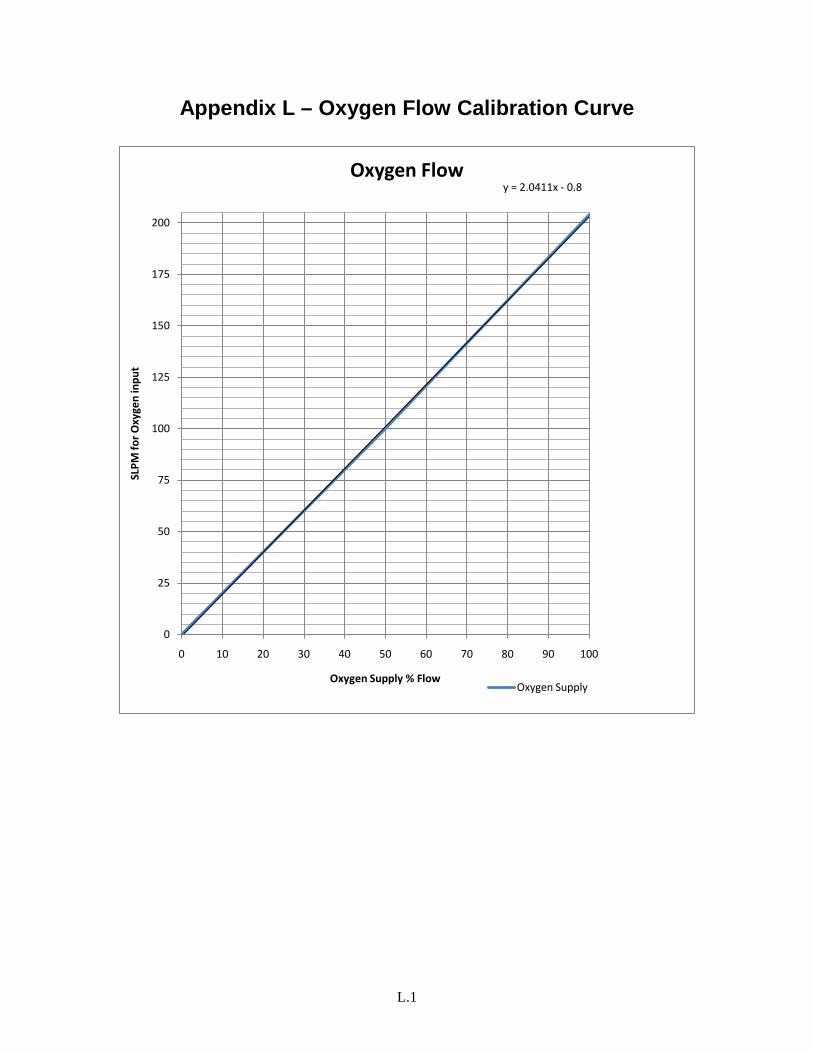
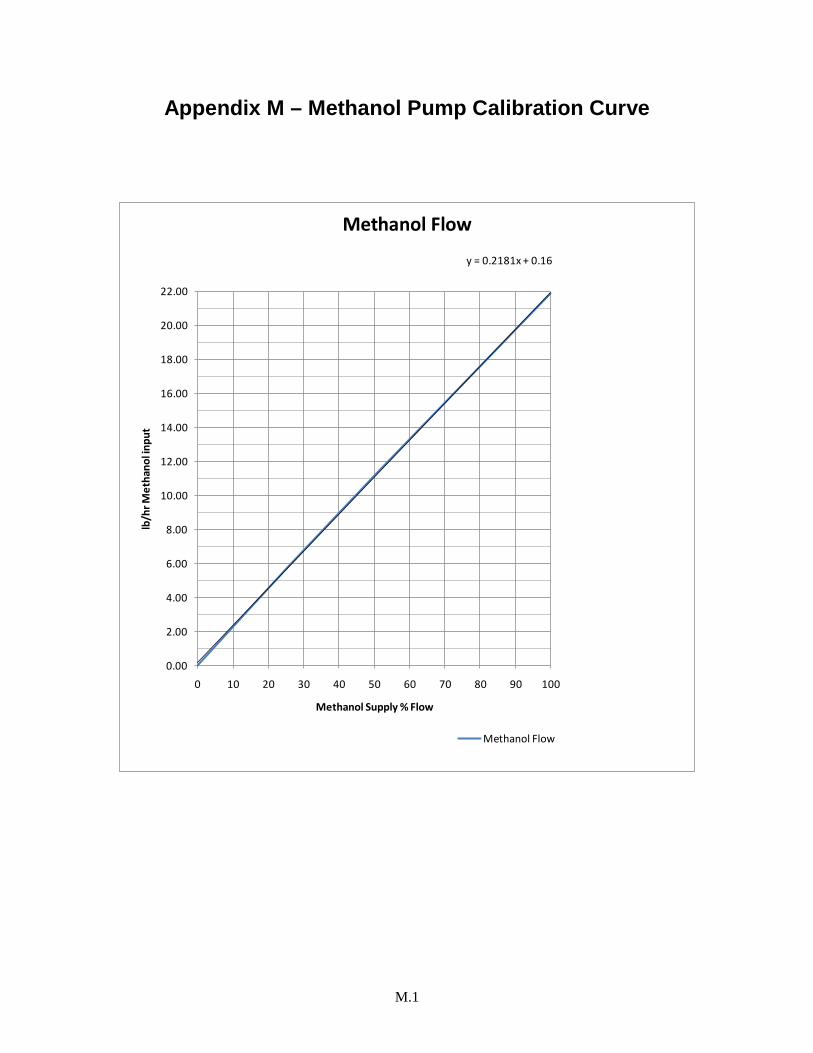
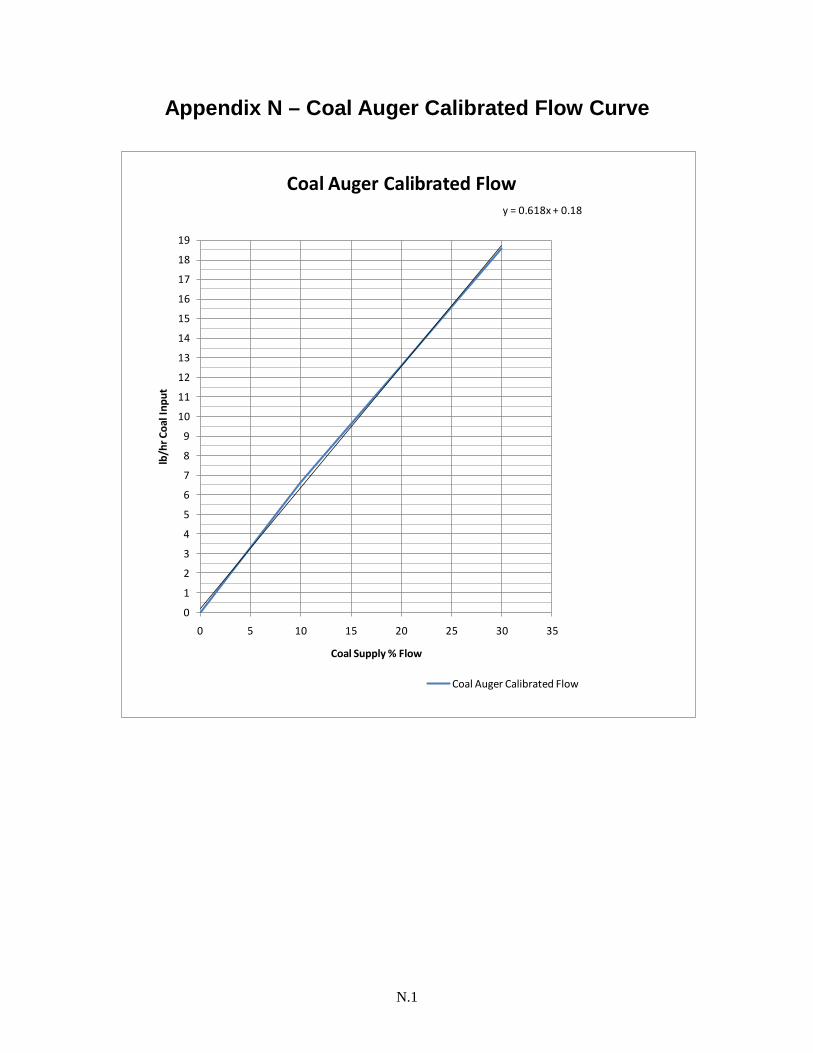
Appendix L relates the oxygen flow percentage reading from the PLC to a slpm flow rate. Appendix M relates the methanol flow percent reading from the PLC to a lb/hr rate. Appendix N relates the coal flow percent reading from the PLC to a lb/hr rate. The oxygen, methanol, and coal are assumed to be at standard temperature and pressure. Appendix O contains the results of the sensitivity analysis for a methanol run in February 2010. In this run, methanol was fed until the gasifier temperatures were high enough to begin feeding coal. Section 3.2 contains a discussion and picture of the coal plug that stopped the coal feed after about 20 minutes.
2.16
The output syngas readings are measured and displayed by the NOVA instrument on a percent volume basis. The NOVA instrument is maintained and calibrated by the InEnTec facility. Moisture is removed by a wet scrubber before it goes to the NOVA. Previous to, and including this last sensitivity run, the flow meter on the NOVA was not functional. Although the flow meter has been repaired, the percentage of gas measured by NOVA is vented separately and not measured as part of gas going through flow meter. Currently there is no capability to measure the caloric value of the syngas. With the specific setup and instrumentation available at this gasifier an elemental mass balance is not possible. There are many factors that prevent an exact measure of the carbon conversion and syngas production. In the future, PNNL will develop the capability to quantify the carbon content captured in the water bath. An accurate measure of the calorific content of the syngas is also needed. In the future PNNL plans to bottle the syngas for internal customers. When gas bottling occurs it will be feasible to send a sample to be tested for its caloric value.
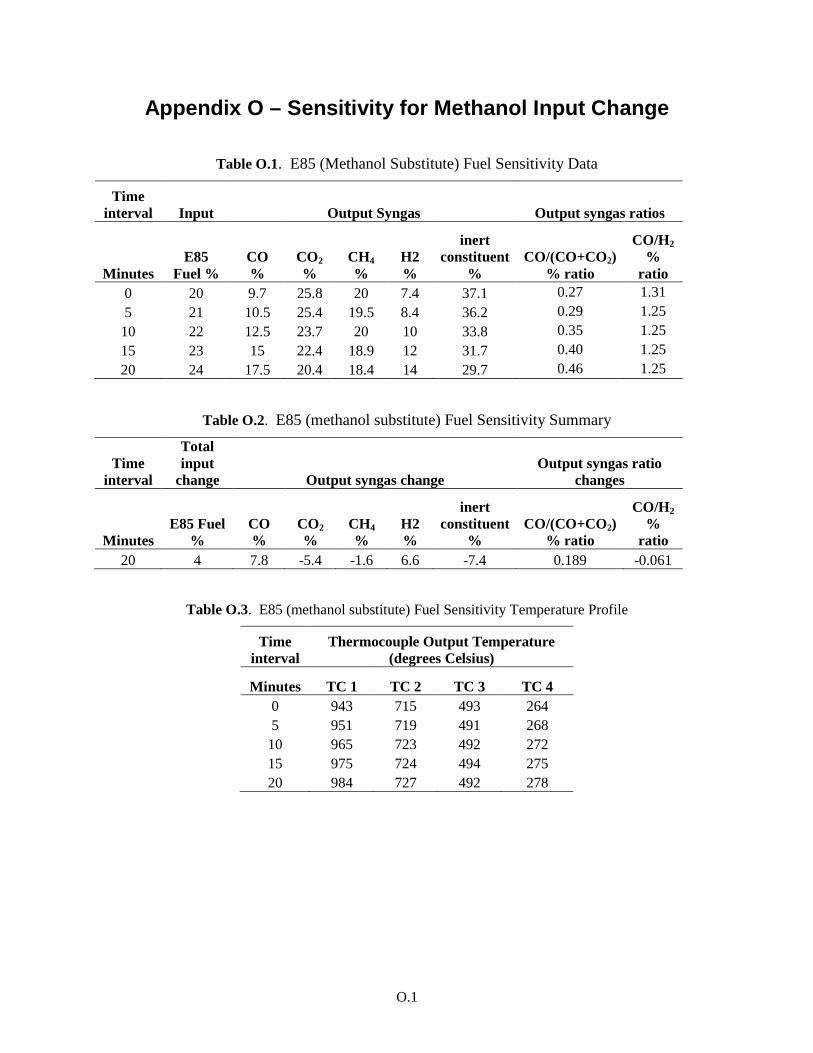
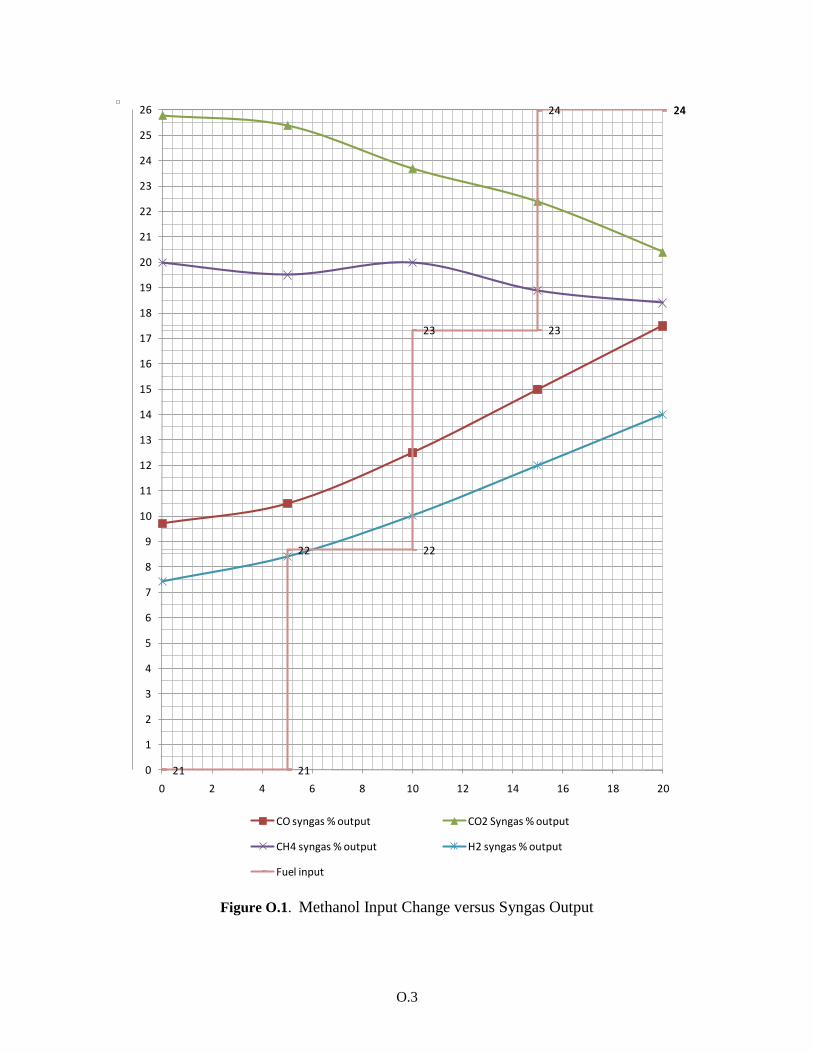
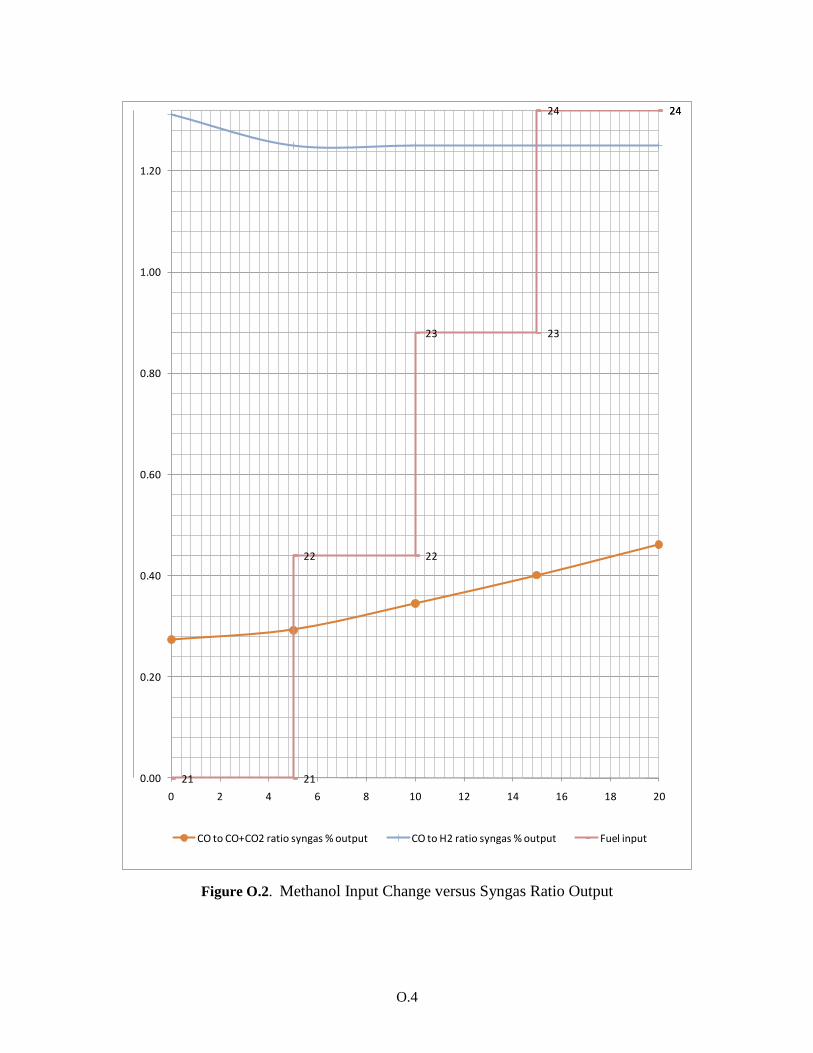
Table O-1A reports the fuel sensitivity data for 1-% incremental increases in methanol fuel. All other inputs remained constant. The nitrogen feed was held at 1.2 scfm, and the oxygen was constant at 18%. Table O-1B shows the net change in each of the syngas constituents over the entire 20 minute test. Table O-1C shows the gasifier temperature profile for which this test is valid. Figure O-1 plots the output syngas data from Table N-1A with time in minutes on the x-axis and volume % on the y-axis. Figure O-2 plots the output syngas ratio data from Table O-1A with time in minutes on the x-axis, and volume % on the y-axis. In both Figure O-1 and O-2, a step function showing the methanol % input is overlaid to show the discrete points in time where adjustments were made to the methanol input. The actual methanol percent values are printed next to each change in the step function for clarity.
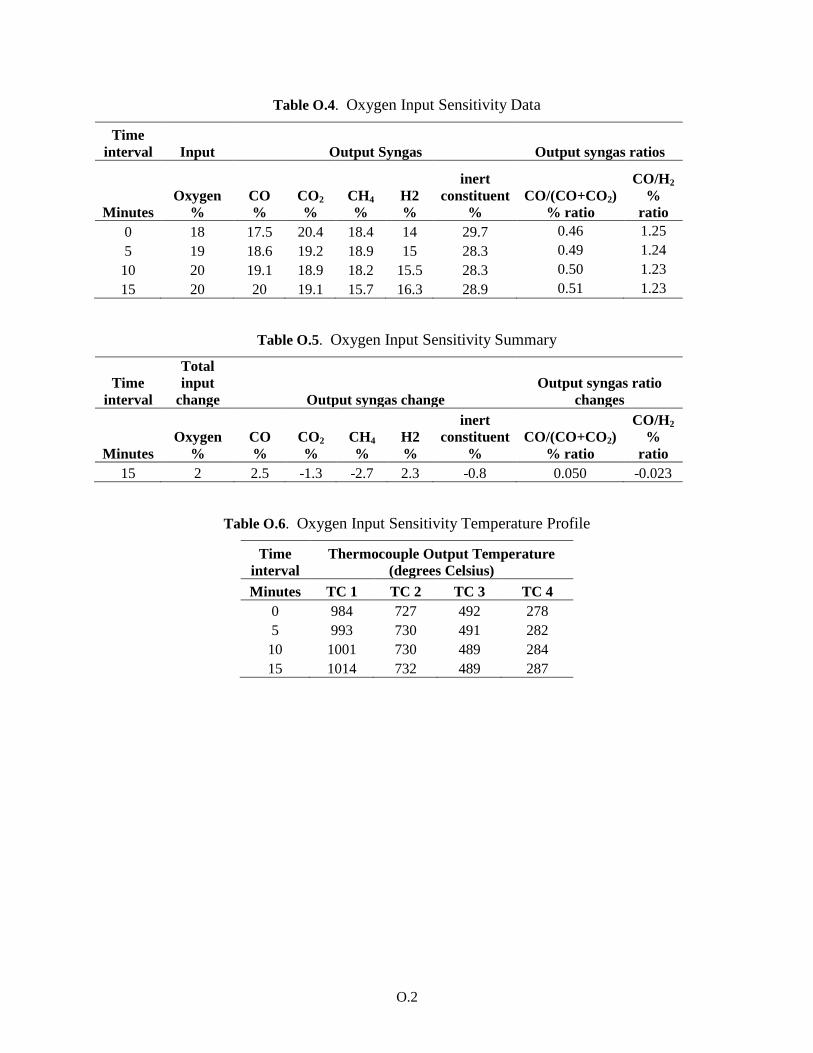
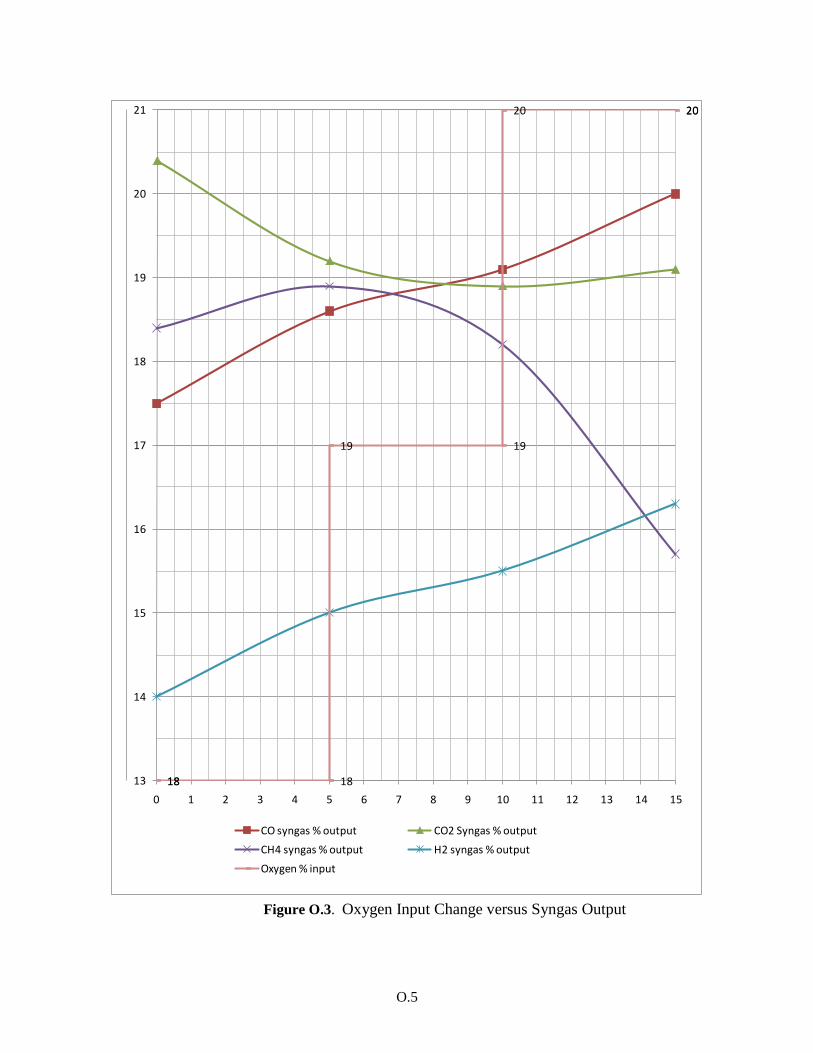
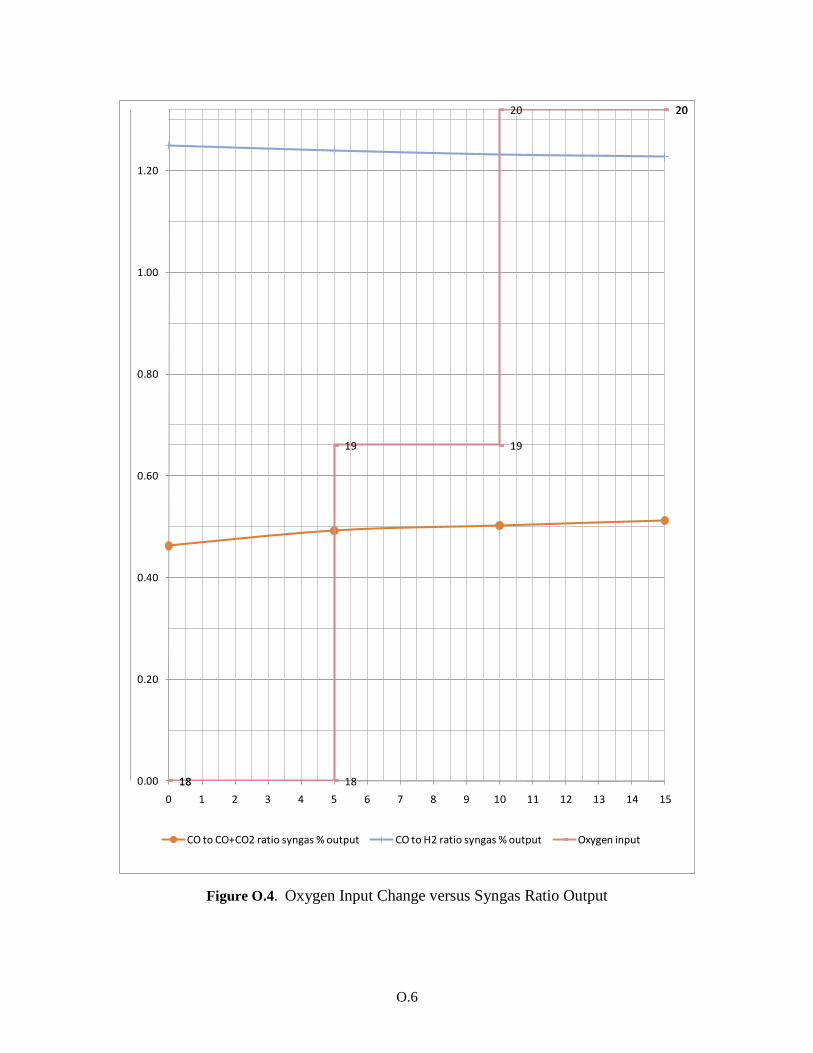
Table O-2A reports the fuel sensitivity data for 1-% incremental increases in oxygen flow. All other inputs remained constant. The nitrogen feed was held at 1.2 scfm, and the methanol was constant at 24%. Table O-2B shows the net change in each of the syngas constituents over the entire 15 minute test. Table O-2C shows the gasifier temperature profile for which this test is valid. Figure O-3 plots the output syngas data from Table O-2A with time in minutes on the x-axis, and volume % on the y-axis. Figure O-4 plots the output syngas ratio data from table O-2A with time in minutes on the x-axis and volume % on the y-axis. In both Figure O-3 and O-4, a step function showing the oxygen % input is overlaid to show the discrete points in time where adjustments were made to the methanol input. The actual oxygen percent values are printed next to each change in the step function for clarity.
Several conclusions can be drawn from the sensitivity analysis data in Appendix O
A given percentage change in methanol has more of an impact on the output syngas composition than the same percentage change in oxygen. When the methanol is increased the fuel to oxygen mixture becomes fuel rich, and the CO to (CO+CO2) ratio increases, thus indicating more incomplete combustion in the gasifier. A higher CO to (CO+CO2) ratio is desirable when the intended output is a syngas with high combustible content. The CO to H2 ratio is an indication of the formation of free radicals and cannot be used directly to predict quantitatively the calorific value of the syngas generated.

3.1
3.0 Technical Challenges
3.1 Fuel Feed
The current pulverized coal auger feed design does not deliver a consistent feed rate because the coal powder has a tendency to clump. Additionally at low speed corresponding to low flow rates, the feeder is observed to jump. Bucket and stop watch calibration have shown that on average the feeder is reasonably reliable. Figure 3.1 shows the top of the gasifier including a close-up of the coal auger scroll feed. An alternative slurry feed system under consideration has been designed to replace the current dry coal delivery system. Modifications to dry feed are currently being pursued before consideration of slurry feed.
Figure 3.1. Coal Auger Scroll Feed
Diesel fuel was evaluated as an alternative to methanol because of its higher energy content. Gasifying with diesel fuel presented many problems. During testing, sufficient oxygen was not supplied resulting in incomplete combustion of the diesel. The water basin became contaminated with diesel and created a dirty cleanup and disposal scenario. Additionally, diesel has much higher viscosity than methanol, thus making it a less attractive candidate for slurry feed. The syngas composition is significantly more affected by feeding diesel than to methanol. Thus methanol is preferred for start up and normal operation of the gasifier.
3.2
3.2 Gasifier Temperatures
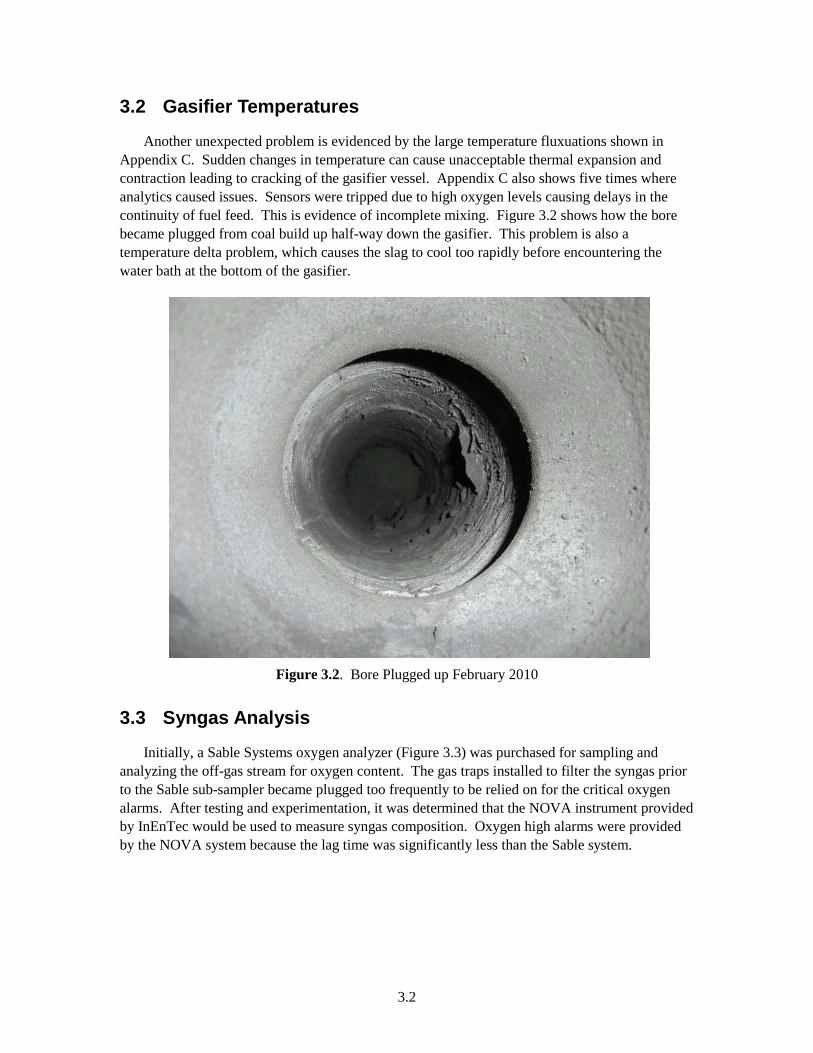
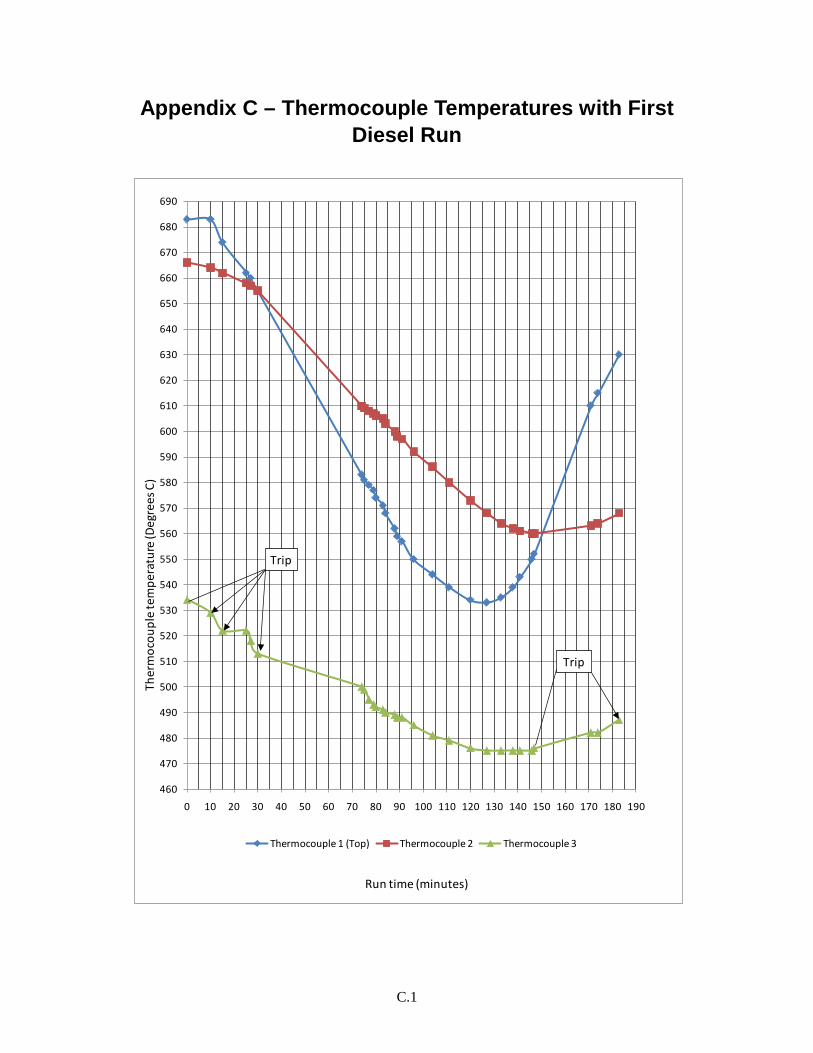
Another unexpected problem is evidenced by the large temperature fluxuations shown in Appendix C. Sudden changes in temperature can cause unacceptable thermal expansion and contraction leading to cracking of the gasifier vessel. Appendix C also shows five times where analytics caused issues. Sensors were tripped due to high oxygen levels causing delays in the continuity of fuel feed. This is evidence of incomplete mixing. Figure 3.2 shows how the bore became plugged from coal build up half-way down the gasifier. This problem is also a temperature delta problem, which causes the slag to cool too rapidly before encountering the water bath at the bottom of the gasifier.
Figure 3.2. Bore Plugged up February 2010
3.3 Syngas Analysis
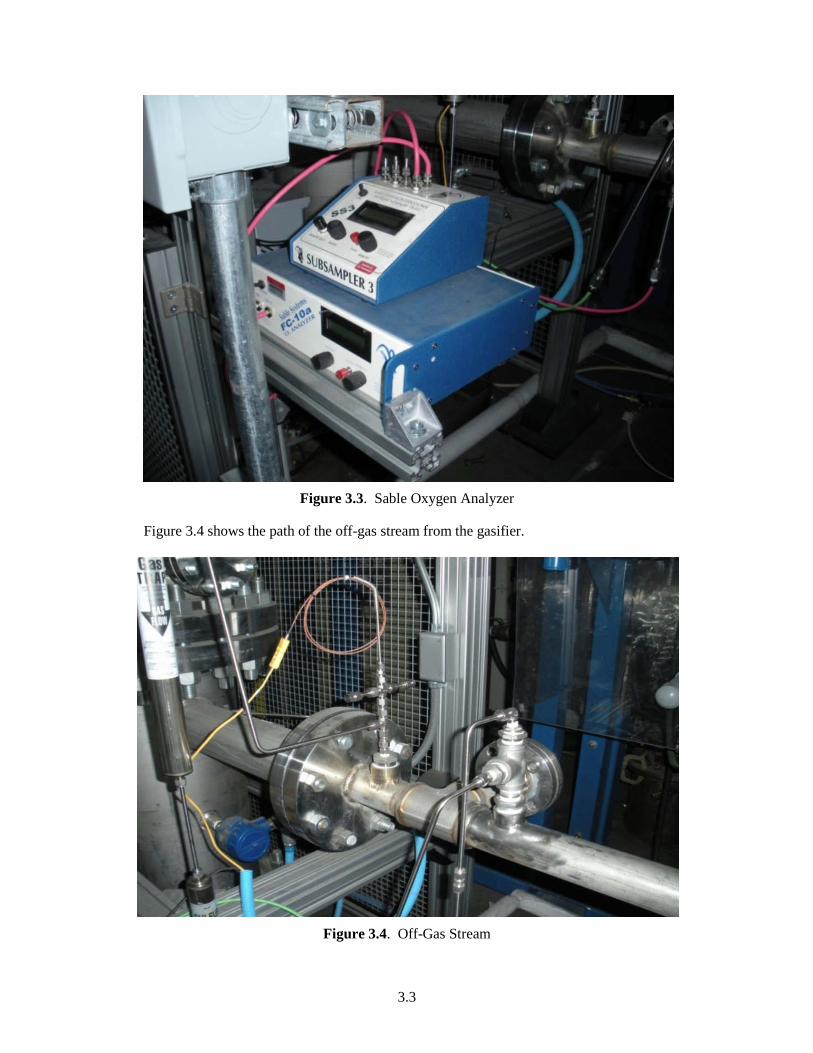
Initially, a Sable Systems oxygen analyzer (Figure 3.3) was purchased for sampling and analyzing the off-gas stream for oxygen content. The gas traps installed to filter the syngas prior to the Sable sub-sampler became plugged too frequently to be relied on for the critical oxygen alarms. After testing and experimentation, it was determined that the NOVA instrument provided by InEnTec would be used to measure syngas composition. Oxygen high alarms were provided by the NOVA system because the lag time was significantly less than the Sable system.
3.3
Figure 3.3. Sable Oxygen Analyzer
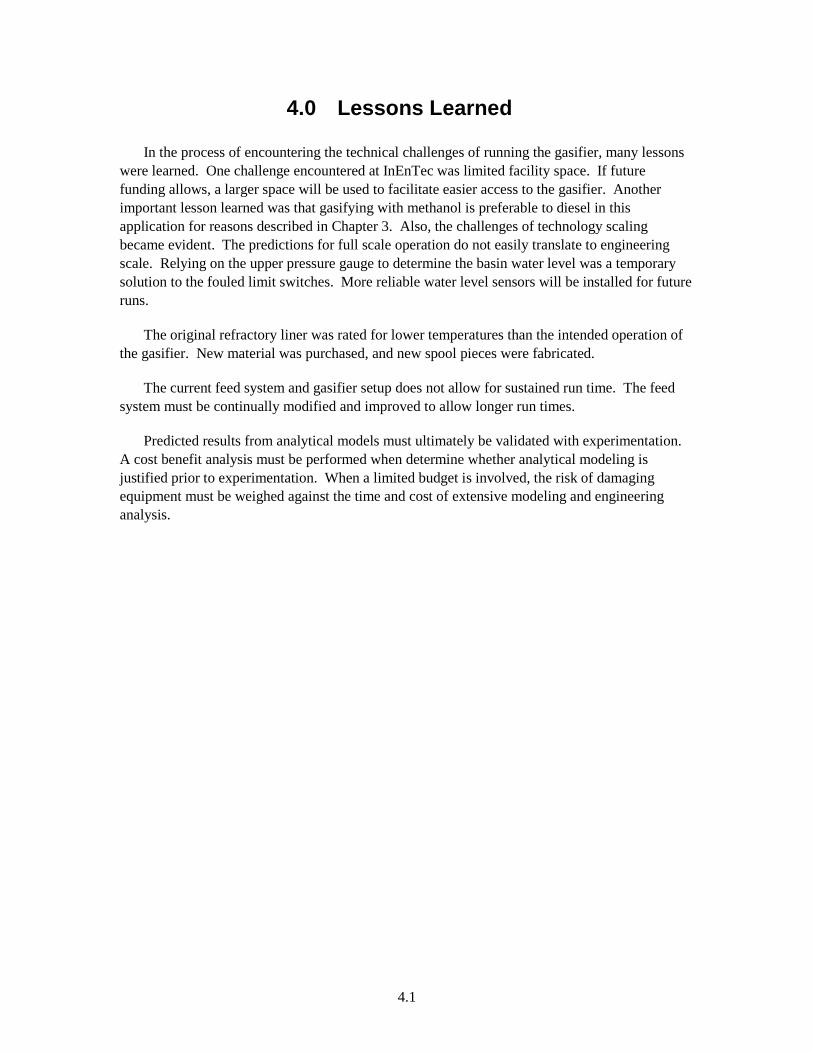
Figure 3.4 shows the path of the off-gas stream from the gasifier.
Figure 3.4. Off-Gas Stream

4.1
4.0 Lessons Learned
In the process of encountering the technical challenges of running the gasifier, many lessons were learned. One challenge encountered at InEnTec was limited facility space. If future funding allows, a larger space will be used to facilitate easier access to the gasifier. Another important lesson learned was that gasifying with methanol is preferable to diesel in this application for reasons described in Chapter 3. Also, the challenges of technology scaling became evident. The predictions for full scale operation do not easily translate to engineering scale. Relying on the upper pressure gauge to determine the basin water level was a temporary solution to the fouled limit switches. More reliable water level sensors will be installed for future runs.
The original refractory liner was rated for lower temperatures than the intended operation of the gasifier. New material was purchased, and new spool pieces were fabricated.
The current feed system and gasifier setup does not allow for sustained run time. The feed system must be continually modified and improved to allow longer run times.
Predicted results from analytical models must ultimately be validated with experimentation. A cost benefit analysis must be performed when determine whether analytical modeling is justified prior to experimentation. When a limited budget is involved, the risk of damaging equipment must be weighed against the time and cost of extensive modeling and engineering analysis.

5.1
5.0 Conclusions and Recommendations for Future Work
At the conclusion of commissioning, proof of principle was achieved for a modified burner that delivers coal and methanol to the gasifier (see Figure 1.1). Bench testing for fuel constituent mixing was completed, followed by successful demonstration in the gasifier vessel itself. As the project progresses, future gasifier runs will be prioritized and aligned with PNNL research objectives. These primary future objectives include providing syngas to researchers by pressurizing and bottling samples and by ensuring syngas composition is appropriate for customer needs.
Increased residence time for the fuel is needed. By observing the amount of particulate in the water we know there is still a lot of fixed carbon in the quench solids. A material balance suggests only about 30% of the carbon that is fed into the gasifier is accounted for in the syngas. This calculation is inexact due to current feed rate and syngas measurements. The possibility of increasing the bore size on the upper two spool pieces has been considered. Increasing the feed path length by way of swirling may be achieved by a fuel feed design modification. The possibility of installing a fire eye has been left open pending sufficient need and budget. To facilitate a reliable and consistent feed rate, a slurry feed capability was also considered.
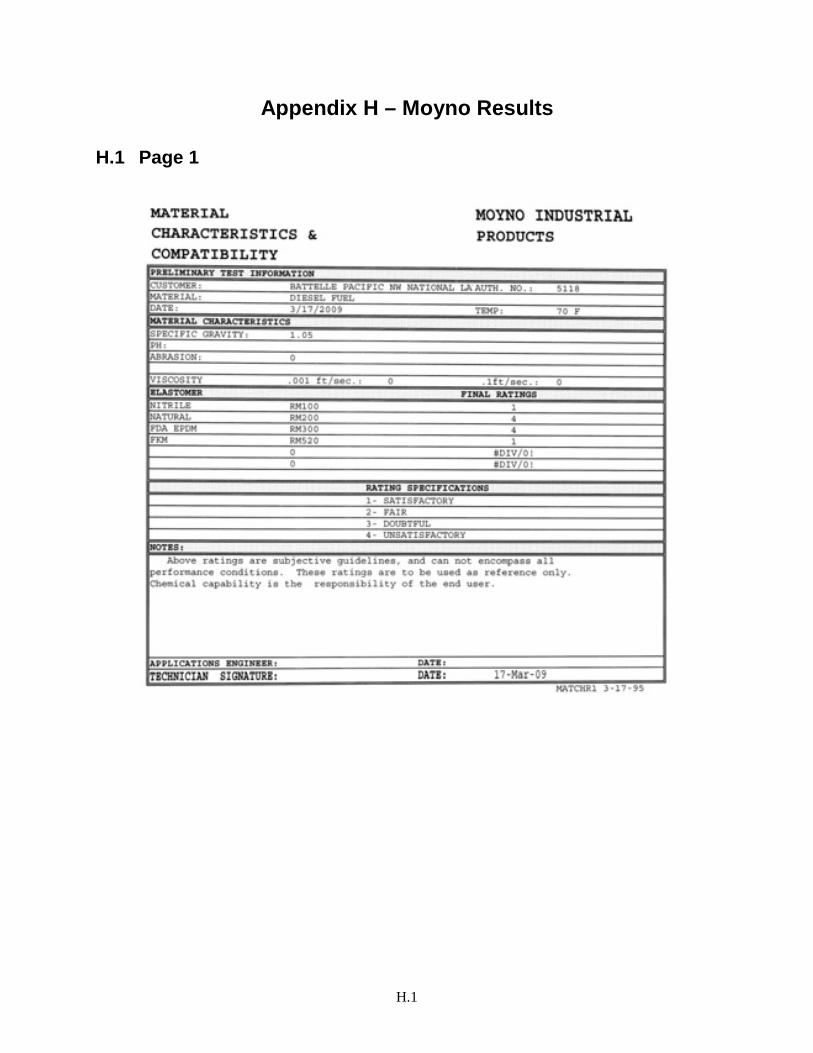
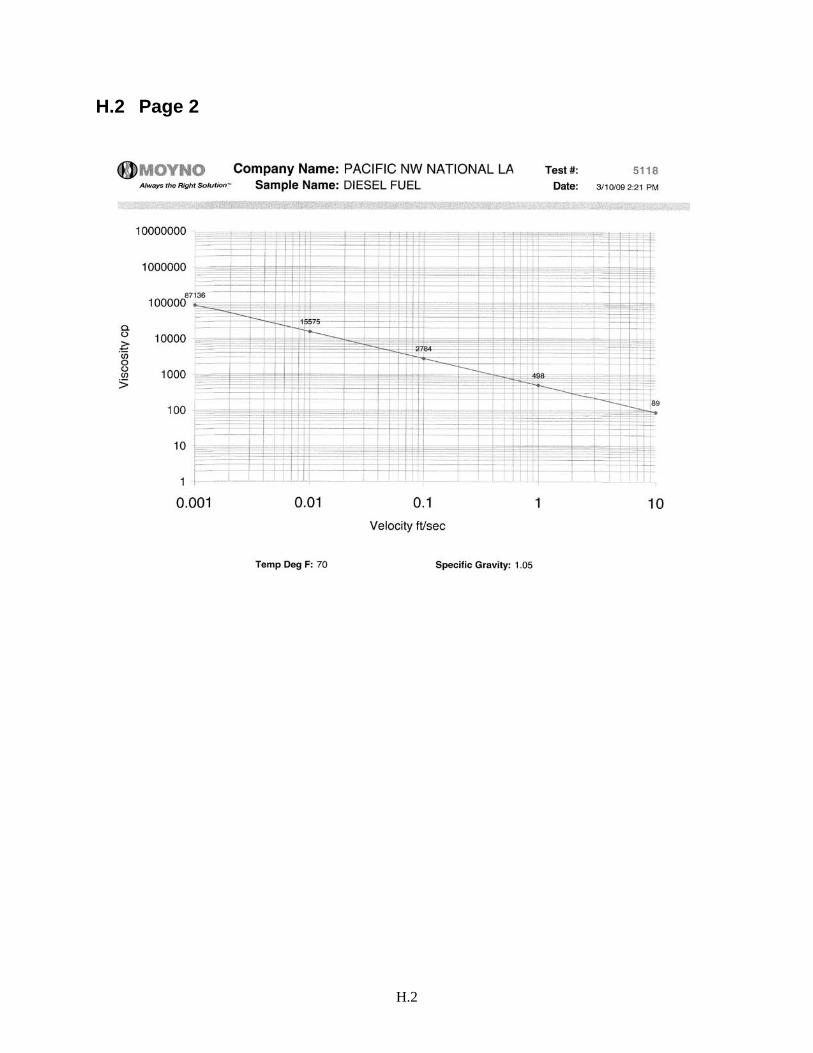
In the current configuration, the engineering scale gasifier does not support highly pressurized operation. Future testing of a bench top setup will evaluate delivery of coal methanol slurry into an atmospheric gasifier. When diesel was under consideration as a fuel source, a slurry sample was sent to Moyno Industrial for analysis [15]; Appendix H shows the test results. When methanol was ultimately chosen for the slurry feed, the results from Appendix H were consulted to size a pump. Methanol’s specific gravity is less than diesel, and there was no time to wait for another analysis before a pump was ordered. Appendix I shows viscosity in centipoise on the y-axis and velocity in ft/sec on the x-axis. Basic velocity calculations were performed for the new head design resulting in a maximum anticipated feed rate of 12 pounds an hour. The resultant velocity of the slurry through the 0.25-inch feed line and the 0.03-inch diameter fuel post is 0.0011 ft/sec and 10.9 ft/sec, respectively. These values lie on the extreme ends of the Moyno viscosity curve, shown in Appendix H. The pump ordered has nitrile o-rings and is chemically compatible with methanol, as defined in [13].
Appendix D depicts the thermal profile of the four thermocouples versus time in hours and minutes. One of the ongoing design goals is to move the flame front further down in the vessel. When this is achieved, the temperature profile of thermocouple 1 and 2 will more closely match. Future burner designs aim to move the thermal energy further down the gasifier.
Additional sensitivity runs need to be performed to better understand the affects that a given change in the input has on the output syngas composition. Sensitivity data similar to appendix O must be gathered for changes in all input parameters, and preferably during longer duration tests.

6.1
6.0 Bibliography
1. ASTM- American Society for Testing and Materials – 2008. “Standard Practice for Estimate of the Heat Gain or Loss and the Surface Temperatures of Insulated Flat, Cylindrical, and Spherical Systems by Use of Computer Programs.” C 680-08. 2008, West Conshohocken, Pennsylvania. DOI: 10.1520/C0680-08, www.astm.org
2. Baxter, Larry. “Ash Fusion Temperatures.” Energy Laboratory Web Site. Brigham Young University, 2001. Web. Jan. 2009. http://www.et.byu.edu/~larryb/Ash%20Fusion%20Temperatures_1.html
3. Chen, Lei, Nolan, Rane, and Shakeel Avadhany. “Thermodynamic Analysis of Coal-to-SNG process”. Massachusetts Institute of Technology, May 14, 2009. Web. Jan. 2010. www.mit.edu/people/leichen/Thermodynamic_Analysis_of_the_coal_to_SNG_process.pdf
4. “Chemical Compatibility Chart For Disposable Gloves.” Cole-Parmer Technical Library, 2009. Web. Jan. 2009. www.coleparmer.com/techinfo/techinfo.asp?htmlfile=ChartDisposGloves.htm&ID=56
5. “Coal Gasification.” EcoGeneration Solutions, LLC, 2002. Web. Jan. 2009. http://www.cogeneration.net/Coal-Gasification.htm
6. “Coal and Power Systems: Gasification.” National Energy Technology Laboratory (NETL), n.d. Web. Jan. 2009. http://www.netl.doe.gov/technologies/coalpower/gasification/
7. “Gasification.” Wikipedia, the free encyclopedia, n.d. Web. Jan. 2009. http://en.wikipedia.org/wiki/Gasification
8. Harbison-Walker Thermal Modeling Web Tool. ANH Refractories Company, 2005. Web. 18 Sep 2009. http://www.hwr.com/
9. Higman, Christopher, and Maarten van der Burgt. Gasification. 2nd ed. Burlington, MA: Elsevier, Inc., 2008. Print.
10. InEnTec Website. InEnTec LLC, 2009. Web. Jan. 2009. http://www.inentec.com/
11. Krause, Theodore. “Water-Gas Shift Catalysis.” DOE Hydrogen Program: FY 2005 Progress Report, 2005. Web. 24 Jan. 2010. http://www.hydrogen.energy.gov/pdfs/progress05/vii_f_1_krause.pdf
12. Lindeburg, Michael R. Mechanical Engineering Reference Manual for the PE Exam. 11th ed. Belmont, CA: Professional Publications, Inc., 2001. Print.
13. “Material Safety Data Sheet: Methyl Alcohol.” Chemistry Material Safety Data Sheets, Iowa State University, 14 March 2001. Web. April. 2009. http://avogadro.chem.iastate.edu/MSDS/methanol.htm
6.2
14. “Material Safety Data Sheet: No. 2 Diesel Fuel.” PetroCard, Inc., 2007. Web. April. 2009. http://www.petrocard.com/Products/MSDS-ULS.pdf
15. Moyno Industrial Products Website. Moyno, Inc., 2008. Web. March 2009. http://www.moyno.com/
16. “Occupational Safety and Health Guideline for Coal Dust (Greater than or Equal to 5% SiO2).” Occupational Safety & Health Administration, n.d. Web. Jan. 2009. http://www.osha.gov/SLTC/healthguidelines/coaldust-greater5percentsio2/recognition.html
17. Reid DJ, JE Cabe, and MD Bearden. 2010. PNNL Coal Gasification Research. PNNL-19606, Pacific Northwest National Laboratory, Richland, Washington.
18. Pacific Northwest National Laboratory. PNNL Gasification Project: Commissioning SOP (Methanol + Coal). Document Number: ECI-Me:Coal 1. Rev. A. Richland, WA: Pacific Northwest National Laboratory, 2009. Print.
19. “Recovery Act – Integrated Energy System with Beneficial CO2 Use.” United States Department of Energy, Office of Fossil Energy Project Fact Sheet, 2009. Web. 24 Jan. 2010. http://fossil.energy.gov/fred/feprograms.jsp?prog=all&state=AZ
20. Rezaiyan, John, and Nicholas P. Cheremisinoff. Gasification Technologies: A Primer for Engineers and Scientists. Boca Raton, FL: CRC Press, 2005. Print.
21. Sierra Instruments. Sierra Instruments, Inc., 2010. Web. Jan. 2009. http://www.sierrainstruments.com/
22. Speight, James G. The Chemistry and Technology of Coal. 2nd ed. Laramie, WY: CD&W Inc., 1994. Print.

Appendix A
Sample System Completion Log Sheet

A.1
Appendix A – Sample System Completion Log Sheet

Appendix B
Thermocouple Temperatures with Methanol Fuel

B.1
Appendix B – Termocouple Temperatures with Methanol Fuel
0
100
200
300
400
500
600
700
800
900
1000
0 12 24 36 48 60 72 84 96 108 120 132 144 156 168 180 192 204 216 228 240 252TC1 TC2 TC3 TC4

C.1
Appendix C
Thermocouple Temperatures with First Diesel Run

C.1
Appendix C – Thermocouple Temperatures with First Diesel Run
460
470
480
490
500
510
520
530
540
550
560
570
580
590
600
610
620
630
640
650
660
670
680
690
0 10 20 30 40 50 60 70 80 90 100 110 120 130 140 150 160 170 180 190
Ther
moc
oupl
e te
mpe
ratu
re (D
egre
es C
)
Run time (minutes)
Thermocouple 1 (Top) Thermocouple 2 Thermocouple 3
Trip
Trip

Appendix D
First Successful Coal Run

D.1
Appendix D – First Successful Coal Run


Appendix E
Aspen Model Flow Chart

E.1
Appendix E – Aspen Model Flow Chart
70
15
30S34762
15
30
S4S6(OUT)
RGIBBS
B3
Q=0
Temperature (F)
Pressure (psia)
Mass Flow Rate (lb/hr)
Q Duty (Btu/hr)
DUPL
B1
70
15
30
S5S3(IN)
70
15
30
S6
70
15
30S7
RGIBBS
B2
Q=-8350
4285
15
30
S8
RGIBBS
B4
Q=0
70
15
30S9
4494
15
30
S10
10% Heat Loss, Ionization
RGIBBS
B5
Q=-41750
70
15
30S11
2452
15
30
S12
RGIBBS
B6
Q=-20875
3792
15
30
S13
50% Heat LossIonization
25% Heat LossIonization
Ionization
No Ionization


Appendix F
Harbison-Walker Calculations

F.1
Appendix F – Harbison-Walker Calculations

Appendix G
Certificate of Analysis

G.1
Appendix G – Certificate of Analysis


Appendix H
Moyno Results

H.1
Appendix H – Moyno Results
H.1 Page 1
H.2
H.2 Page 2
Appendix I
Aurex 70 Castable Data Sheets

I.1
Appendix I – Aurex 70 Data Sheets
I.1 Page 1
I.2
I.2 Page 2
Appendix J
KAST-O-LITE Data Sheets

J.1
Appendix J – KAST-O-LITE Data Sheets
J.1 Page 1
J.2
J.2 Page 2
Appendix K
BTU-BLOCK Data Sheets

K.1
Appendix K – BTU-BLOCK Data Sheets
K.1 Page 1
K.2
K.2 Page 2
Appendix L
Oxygen Flow Calibration Curve

L.1
Appendix L – Oxygen Flow Calibration Curve
y = 2.0411x - 0.8
0
25
50
75
100
125
150
175
200
0 10 20 30 40 50 60 70 80 90 100
SLPM
for O
xyge
n in
put
Oxygen Supply % Flow
Oxygen Flow
Oxygen Supply

Appendix M
Methanol Pump Calibration Curve

M.1
Appendix M – Methanol Pump Calibration Curve
y = 0.2181x + 0.16
0.00
2.00
4.00
6.00
8.00
10.00
12.00
14.00
16.00
18.00
20.00
22.00
0 10 20 30 40 50 60 70 80 90 100
lb/h
r Met
hano
l inp
ut
Methanol Supply % Flow
Methanol Flow
Methanol Flow

Appendix N
Coal Auger Calibrated Flow Curve

N.1
Appendix N – Coal Auger Calibrated Flow Curve
y = 0.618x + 0.18
0
1
2
3
4
5
6
7
8
9
10
11
12
13
14
15
16
17
18
19
0 5 10 15 20 25 30 35
lb/h
r Coa
l Inp
ut
Coal Supply % Flow
Coal Auger Calibrated Flow
Coal Auger Calibrated Flow


Appendix O
Sensitivity Analysis for Methanol Input Change

O.1
Appendix O – Sensitivity for Methanol Input Change
Table O.1. E85 (Methanol Substitute) Fuel Sensitivity Data
Time interval Input Output Syngas Output syngas ratios
Minutes E85
Fuel % CO %
CO2 %
CH4 %
H2 %
inert constituent
% CO/(CO+CO2)
% ratio
CO/H2 %
ratio 0 20 9.7 25.8 20 7.4 37.1 0.27 1.31 5 21 10.5 25.4 19.5 8.4 36.2 0.29 1.25
10 22 12.5 23.7 20 10 33.8 0.35 1.25 15 23 15 22.4 18.9 12 31.7 0.40 1.25 20 24 17.5 20.4 18.4 14 29.7 0.46 1.25
Table O.2. E85 (methanol substitute) Fuel Sensitivity Summary
Time interval
Total input
change Output syngas change Output syngas ratio
changes
Minutes E85 Fuel
% CO %
CO2 %
CH4 %
H2 %
inert constituent
% CO/(CO+CO2)
% ratio
CO/H2 %
ratio 20 4 7.8 -5.4 -1.6 6.6 -7.4 0.189 -0.061
Table O.3. E85 (methanol substitute) Fuel Sensitivity Temperature Profile
Time interval
Thermocouple Output Temperature (degrees Celsius)
Minutes TC 1 TC 2 TC 3 TC 4 0 943 715 493 264 5 951 719 491 268 10 965 723 492 272 15 975 724 494 275 20 984 727 492 278
O.2
Table O.4. Oxygen Input Sensitivity Data
Time interval Input Output Syngas Output syngas ratios
Minutes Oxygen
% CO %
CO2 %
CH4 %
H2 %
inert constituent
% CO/(CO+CO2)
% ratio
CO/H2 %
ratio 0 18 17.5 20.4 18.4 14 29.7 0.46 1.25 5 19 18.6 19.2 18.9 15 28.3 0.49 1.24
10 20 19.1 18.9 18.2 15.5 28.3 0.50 1.23 15 20 20 19.1 15.7 16.3 28.9 0.51 1.23
Table O.5. Oxygen Input Sensitivity Summary
Time interval
Total input
change Output syngas change Output syngas ratio
changes
Minutes Oxygen
% CO %
CO2 %
CH4 %
H2 %
inert constituent
% CO/(CO+CO2)
% ratio
CO/H2 %
ratio 15 2 2.5 -1.3 -2.7 2.3 -0.8 0.050 -0.023
Table O.6. Oxygen Input Sensitivity Temperature Profile
Time interval
Thermocouple Output Temperature (degrees Celsius)
Minutes TC 1 TC 2 TC 3 TC 4 0 984 727 492 278 5 993 730 491 282 10 1001 730 489 284 15 1014 732 489 287
O.3
Figure O.1. Methanol Input Change versus Syngas Output
21 21
22 22
23 23
24 2424
0
1
2
3
4
5
6
7
8
9
10
11
12
13
14
15
16
17
18
19
20
21
22
23
24
25
26
0 2 4 6 8 10 12 14 16 18 20
CO syngas % output CO2 Syngas % output
CH4 syngas % output H2 syngas % output
Fuel input
O.4
Figure O.2. Methanol Input Change versus Syngas Ratio Output
21 21
22 22
23 23
24 2424
0.00
0.20
0.40
0.60
0.80
1.00
1.20
0 2 4 6 8 10 12 14 16 18 20
CO to CO+CO2 ratio syngas % output CO to H2 ratio syngas % output Fuel input
O.5
Figure O.3. Oxygen Input Change versus Syngas Output
1818 18
19 19
20 2020
13
14
15
16
17
18
19
20
21
0 1 2 3 4 5 6 7 8 9 10 11 12 13 14 15
CO syngas % output CO2 Syngas % output
CH4 syngas % output H2 syngas % output
Oxygen % input
O.6
Figure O.4. Oxygen Input Change versus Syngas Ratio Output
1818 18
19 19
20 2020
0.00
0.20
0.40
0.60
0.80
1.00
1.20
0 1 2 3 4 5 6 7 8 9 10 11 12 13 14 15
CO to CO+CO2 ratio syngas % output CO to H2 ratio syngas % output Oxygen input
PNNL-19636
Distribution
No. of Copies
Distr.1
1 Local Distribution Pacific Northwest National Laboratory
D Reid PDF MD Bearden PDF JE Cabe PDF TJ Samuel PDF RJ Robertus PDF ML Elliot PDF