comets and meteor showers
TRANSCRIPT

CHAPTER 15: OUTER SPACE
Agcaoili, Mikaela F.
IV-31 BSE General Science
A. Measuring The Distance Of The Stars
B. Stellar Parallax Determinations
C. Spectroscopy And The Stuff Of The Stars
D. The Hertzprung-Russel Diagram
E. The Color Magnitude Relationship And Distance To
Stars
F. The Cepheid Distance Scale
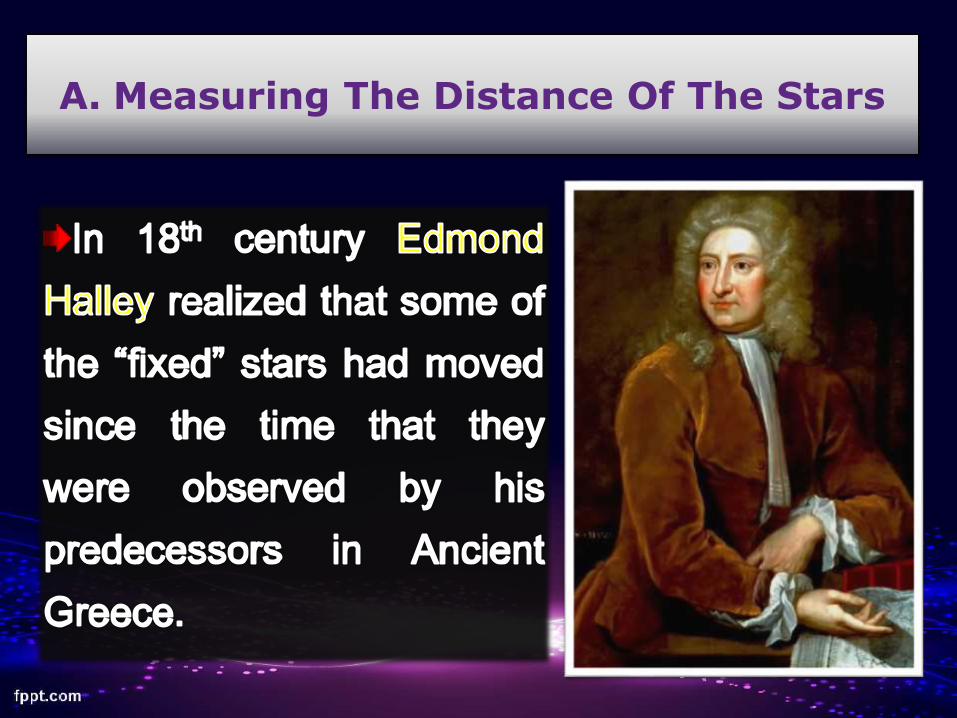
A. Measuring The Distance Of The Stars


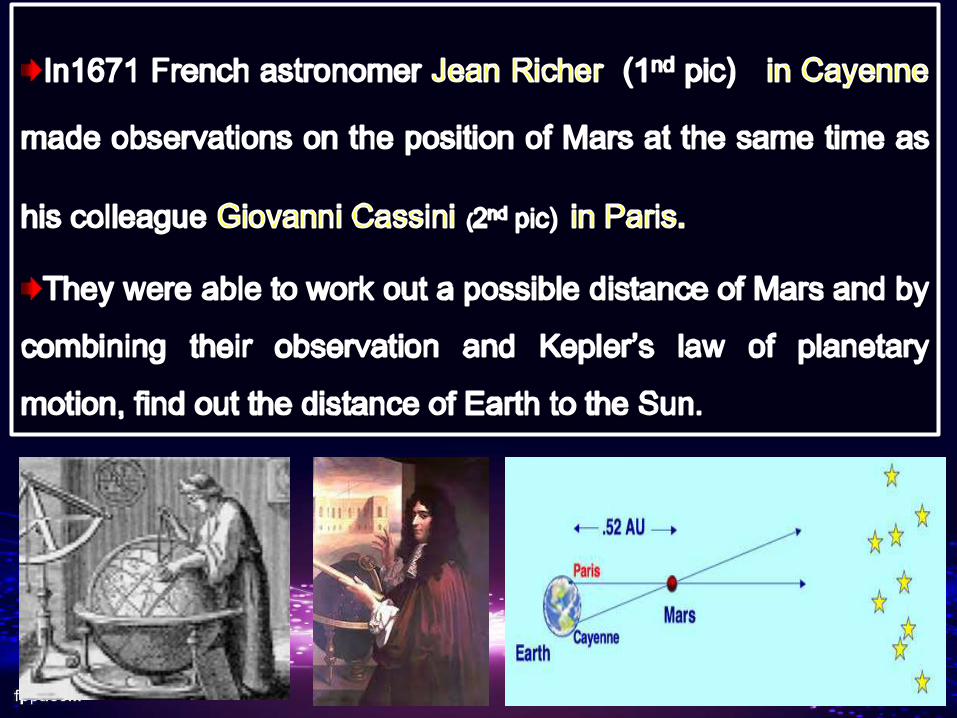
Astronomers used the basic
technique of TRIANGULATION
to measure the star distances.
By measuring the angular
distance between a star and the
distant background stars and
repeating the process 6months
later when the Earth is on the
opposite side of the sum. If you
know the length of the baseline
(the Earth's orbit) and the angle
then you know the distance to
the star.

Halley also made similar studies of this using the
planet Venus and improved the estimation of
Earth-Sun distance that we now know as
Astronomical Unit or AU (153 Million Km)

At the end of 18th Century, astronomers had a
good idea of the actual scale of the solar system

Parallax is a displacement or difference in the
apparent position of an object viewed along two
different lines of sight, and is measured by the angle
or semi-angle of inclination between those two lines.
B. Stellar Parallax Determinations

He made a series of smaller
holes in a screen facing the
sun, until he estimated the
light was of the same intensity
as that of the star Sirius.
(Incorrect Calculations)

He came with the calculated distance of Sirius to
an equivalent of 83,199 AU.

The Actual Distance of Sirius is 550,000
AU. They all got it wrong


It was only in 1830’s that measurement
of distances of the stars become more
accurate along with the empowering of
technology

1. Friedrich William Bessel (1838)
o used 61 Cygni
o Measured a distance of 0.3136 sec of arc
o Distance 10.3 light years away from us
Other studies using parallax method:

2. Scot Thomas Henderson
o Was in South Africa when he studies Alpha Centauri
o 1 parallax of 1 sec of arc
o Distance of 1.3 par sec; 4.3 light years away
Other studies using parallax method:
2. Scot Thomas Henderson
o Was in South Africa when he studies Alpha Centauri
o 1 parallax of 1 sec of arc
o Distance of 1.3 par sec; 4.3 light years away
2. Scot Thomas Henderson
o Was in South Africa when he studies Alpha Centauri
o 1 parallax of 1 sec of arc
o Distance of 1.3 par sec; 4.3 light years away
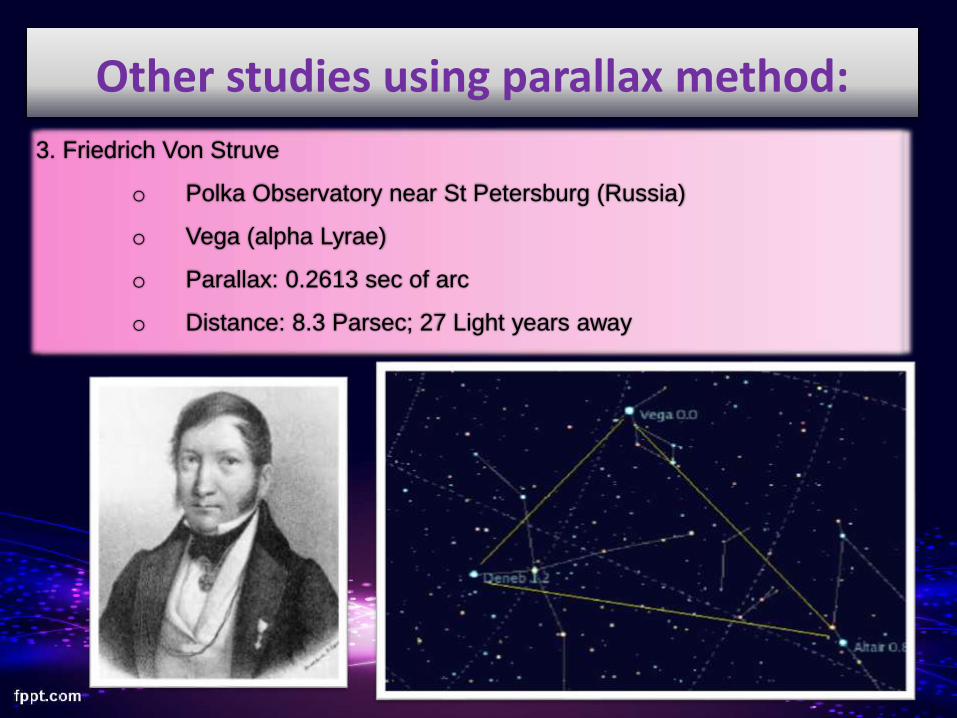
Other studies using parallax method:
3. Friedrich Von Struve
o Polka Observatory near St Petersburg (Russia)
o Vega (alpha Lyrae)
o Parallax: 0.2613 sec of arc
o Distance: 8.3 Parsec; 27 Light years away

The important thing to takeaway from all
these numbers is that all these stars are
considered our neighbours on a cosmic
level and yet they are so far away!

Old measurements were usually done using the ey
making it hard to have accurate measurement but at
the end of the 20th century the satellite HIPPARCOS
revealed parallaxes of 120,000 stars.
Hipparcos, a satellite with the
Hipparcos Catalogue and
other star datasets, was a
scientific mission of the
European Space Agency,
launched in 1989 and
operated until 1993.

Spectroscopy
C. Spectroscopy And The Stuff Of The Stars


The Hertzsprung–Russell diagram is a
scatter graph of stars showing the
relationship between the stars' absolute
magnitudes or luminosities versus their
spectral types or classifications and effective
temperatures.
D. The Hertzsprung-Russel Diagram

Hertzsprung–Russell diagrams are not maps of
the locations of the stars. Rather, they plot each
star on a graph measuring the star's absolute
magnitude (brightness) against its temperature
(color).
Hertzsprung–Russell diagrams are also referred
to by the abbreviation H–R diagram
The diagram was created circa 1910 by Ejnar
Hertzsprung and Henry Norris Russell and
represents a major step towards an
understanding the "the lives of stars".

Ejnar Hertzsprung
From Denmark
Trained in chemical engineering
and later studied photo chemistry
Work at the University of
Copenhagen to be an
observational astronomer and
applied photography to his
observations.
From New York
Studied at Princeton and
University of Cambridge
Had the same observation
as Hertzsprung and
published his work.

• Star Size: The bigger a star is the
hotter it will be.
• The stronger an object's gravity is,
the more power it has to pull its
mass inward. This causes the
core to be very compact and
creates a lot of extra
pressure. This extra pressure
builds up, raising the temperature
of the core. The hotter the core
gets, the more of its hydrogen fuel
it will burn.
• Star Life: The smaller a star is, the
longer it will live.
E. The Color Magnitude Relationship And Distance To Stars
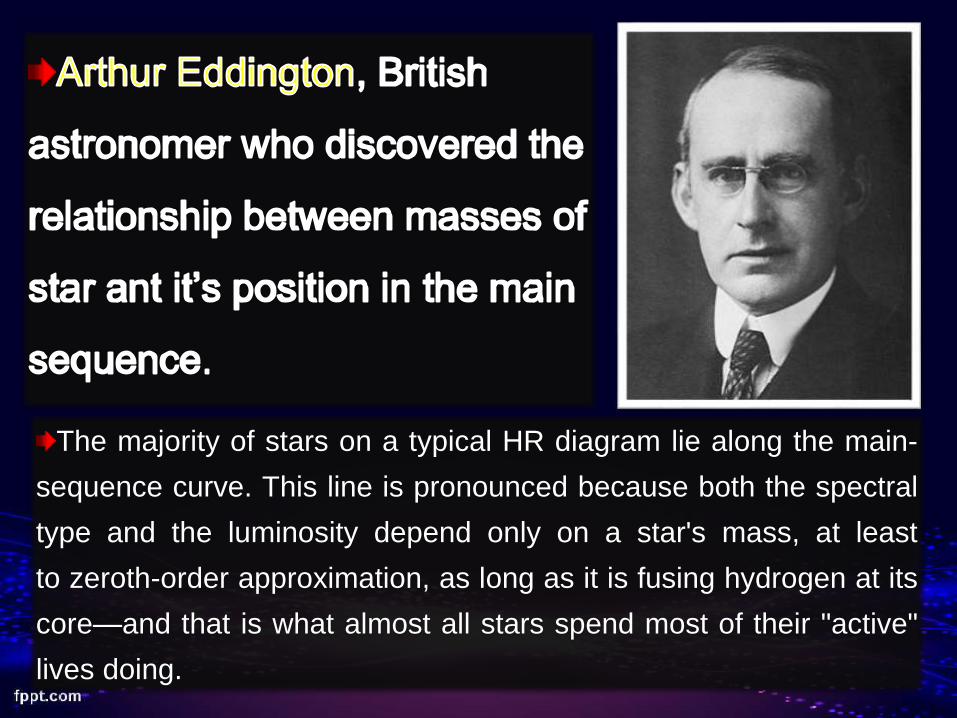
The majority of stars on a typical HR diagram lie along the main-
sequence curve. This line is pronounced because both the spectral
type and the luminosity depend only on a star's mass, at least
to zeroth-order approximation, as long as it is fusing hydrogen at its
core—and that is what almost all stars spend most of their "active"
lives doing.

• After the WW1, Eddington
travelled to the island
of Príncipe near Africa to watch
the solar eclipse of 29 May
1919. During the eclipse, he
took pictures of the stars in the
region around the Sun.
• One of Erdington's
photographs of the total solar
eclipse of 29 May 1919,
presented in his 1920 paper
announcing its success,
confirming Einstein's theory
that light "bends"

The H-R diagram can also be used by scientists to roughly measure
how far away a star cluster is from Earth. This can be done by
comparing the apparent magnitudes of the stars in the cluster to the
absolute magnitudes of stars with known distances. The observed group
is then shifted in the vertical direction, until the two main sequences
overlap. The difference in magnitude that was bridged in order to match
the two groups is called the distance modulus and is a direct measure
for the distance. This technique is known as main-sequence
fitting or spectroscopic parallax.

F. The Cepheid Distance Scale
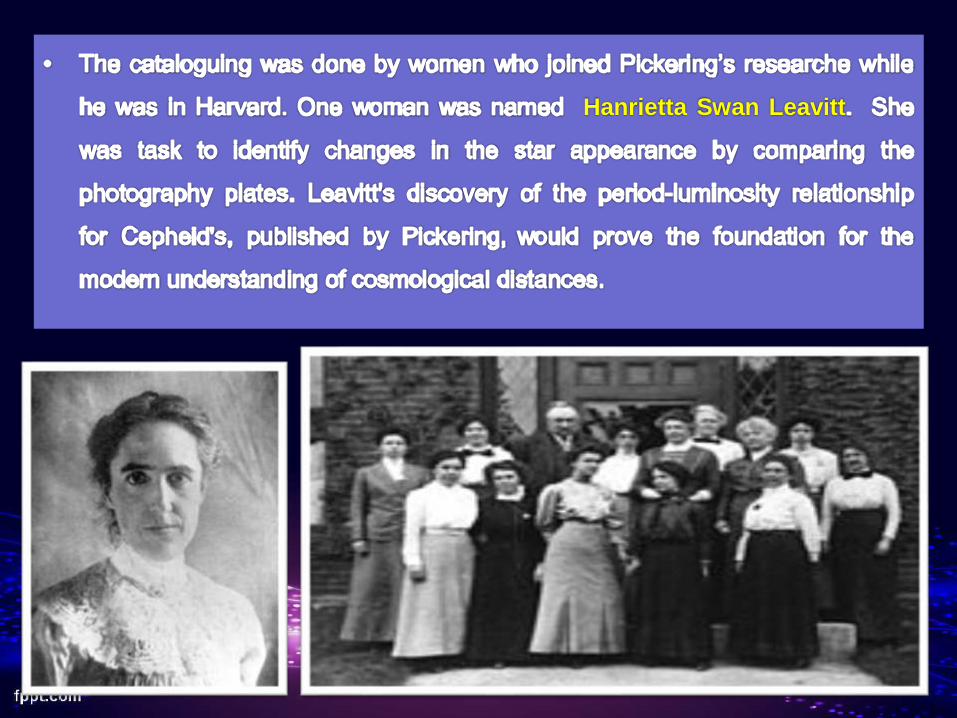
Hanrietta Swan Leavitt

Cepheid

• Hanrietta Leavitt compiled a list of 1,777
periodic variables. Eventually she classified
47 of these in the two clouds as Cepheid
variables and noticed that those with longer
periods were brighter than the shorter-period
ones.
• She plotted her observation and her plot
showed what is now known as the period-
luminosity relationship; cepheids with longer
periods are intrinsically more luminous than
those with shorter periods.

• Ejnar Hertzsprung
realized the importance
of her discovery. By
measuring the period of
a Cepheid from its light
curve, the distance to
that Cepheid could be
determined. He used his
data on nearby
Cepheids to calculate
the distance to the
Cepheids in the SMC as
37,000 light years away.

Some clusters of stars are grouped together with different masses,
colour and temperature, if there is one Cepheid in that cluster it is
possible to measure the distance of all the stars is known.
It was probing beyond the Milky way that Cepheid's altered our view of
our place in the Universe.