combined thermal and zero-valent iron in situ soil mixing remediation technology
TRANSCRIPT
REMEDIATION Spring 2010
Combined Thermal and Zero-Valent IronIn Situ Soil Mixing RemediationTechnology
Phillip La Mori
Elgin Kirkland
Harlan Faircloth
Robert Bogert
Mark Kershner
Thermal remediation of contaminated soils and groundwater by injection of hot air and steam using
large-diameter auger in situ soil mixing effectively remediates volatile and semivolatile organic
compounds. This technology removes large amounts of contamination during the early treatment
stages, but extended treatment times are needed to achieve high removal percentages. Combining
thermal treatment with another technology that can be injected and mixed into the soil, and
that continues to operate after removal of the drilling equipment, improves removal efficiency,
and reduces cost. Using field-determined pseudo first-order removal rates, the cost of the combined
remediation of chlorinated volatile organic compounds (CVOCs) by thermal treatment followed by
reductive dechlorination by iron powder has been estimated as 57 percent of the cost of thermal
treatment alone. This analysis was applied to a case-study remediation of 48,455 cubic yards, which
confirmed the cost estimate of the combined approach and showed over 99.8 percent removal of
trichloroethene and other chlorinated VOCs. Oc 2010 Wiley Periodicals, Inc.
INTRODUCTION
Thermal remediation of contaminated soils and groundwater by injection of hot air andsteam using large-diameter auger (LDA) in situ soil mixing is an effective way to removesource-zone volatile organic compounds (VOCs), semivolatile organic compounds(SVOCs), and petroleum hydrocarbon (PHC) contamination. Like other in situ and ex situthermal methods, this technology relies primarily on the volatilization of the compoundstreated (HLA, 1989; U.S. Environmental Protection Agency [US EPA], 1991).
The in situ soil mixing technology operates one treatment cell at a time by advancing asingle 7- to 10-foot-diameter auger, or dual 5- to 8-foot-diameter augers, to depths ofover 70 feet. During active mixing, the permeability increases, permitting the soil andgroundwater to be treated evenly by the injected high-pressure hot air and steam. Steamand hot air injected from ports on the auger heats the contaminated soil and groundwaterto a temperature of approximately 75 to 95◦C, thermally desorbing the VOCs andvolatilizing the nonadsorbed VOCs, while the air conveys the volatilized off-gascontamination to the ground surface for capture and treatment. Typically, the in situthermal technology using steam and hot air has removal efficiencies of 90 to 99 percent forVOCs and 50 to 90 percent for SVOCs. The removal efficiency for any chemical generallydecreases as its boiling point temperature increases.
c© 2010 Wiley Periodicals, Inc.Published online in Wiley Interscience (www.interscience.wiley.com). DOI: 10.1002/rem.20237 9
Combined Thermal and Zero-Valent Iron In Situ Soil Mixing Remediation Technology
Features common to previous implementations of this technology include:
� The treatment agents are well mixed into the contaminated soil and groundwater.� The technology is applicable to both the vadose and saturated soil zones.� Real-time monitoring of off-gas contamination permits field decisions for focused
treatment at all depth levels to predetermined contaminant concentrations.� Monitoring provides real-time control of all important treatment parameters, in-
creasing efficiency and lowering cost.� Monitoring of off-gas contamination quantifies the amount removed and provides
tangible proof of remediation.� Additional treatment agents can be applied sequentially or simultaneously for addi-
tional remediation.� The surface and subsurface must be free of structures and obstructions.
The thermal removal of contaminants appears to follow pseudo first-order kinetics.Thus, it is very effective in removing a large percentage of nonaqueous-phase liquid(NAPL) and dissolved contamination during the early treatment stages, but extendedtreatment times are needed to achieve high removal percentages of the adsorbed material(i.e., there is a diminishing return for thermal treatment over time versus cost).Combining the thermal treatment with another technology that can be injected and mixedinto the soil, and that continues to operate after removal of the drilling equipment, hasbeen found to be an effective way to improve removal efficiency and reduce cost whencompared to thermal treatment alone. The second technology is applied during orimmediately after the thermal treatment and mixed into the soil by the augers. Anexample of this approach is the mixing and injection of iron powder (i.e., zero-valentiron, or ZVI) into the soil and groundwater for continued chlorinated VOC and SVOCremoval (Moos, 1998).
Combining the thermaltreatment with anothertechnology that can beinjected and mixed intothe soil, and that continuesto operate after removalof the drilling equipment,has been found to be aneffective way to improveremoval efficiency andreduce cost when com-pared to thermal treatmentalone.
The implementation and demonstration of the combined LDA thermal and ZVI forremediation of chlorinated dense nonaqueous-phase liquid (DNAPL) source zones hasbeen a major improvement to the thermal soil mixing technology over the last five years.This approach takes advantage of the strengths of both thermal treatment and reductivedechlorination. For thermal treatment, the effective removal of large amounts ofcontamination occurs quickly, and the ZVI, combined with the mixing, distribution, anddissolution of the DNAPL, promotes continued degradation of residual mass withoutcontinued equipment expenses. The dual-treatment approach can achieve removalefficiencies of over 99.5 percent for chlorinated VOCs, and can result in significant costsavings when compared to thermal treatment alone.
REMOVAL RATES
Implementing site remediation using the combined thermal and ZVI technology requiresknowledge of (1) the effectiveness of the thermal remediation for the specificcontamination and (2) the amount of the ZVI required. The first determines the cost ofthe drilling equipment (thermal treatment time) and the second the cost of the ironpowder (material). Combining this information will assist in optimizing the treatmentplan and reducing cost.
10 Remediation DOI: 10.1002.rem c© 2010 Wiley Periodicals, Inc.
REMEDIATION Spring 2010
At NAPL sites, the contamination exists as pure phase, vapor, dissolved, andadsorbed material forms. Each material form will have a different removal rate responseto the heat input as measured by its concentration in the produced vapor. The rotatingauger(s) may encounter any form or all forms simultaneously, as it rotates and travelsvertically through the contaminated volume. The pure phase, vapor, and dissolvedmaterial will be volatilized relatively quickly, while the adsorbed material will beremoved more slowly. It is probable that at the low temperatures applied with thistechnology (e.g., less than 100◦C), not all the adsorbed material will be removed. Thus,the concentration of the contamination in the off-gas vapor versus time will be initiallyhigh, quickly drop to low numbers, and eventually become asymptotic. It is possible thatthese several combined removal rates might be observed as pseudo first-order.
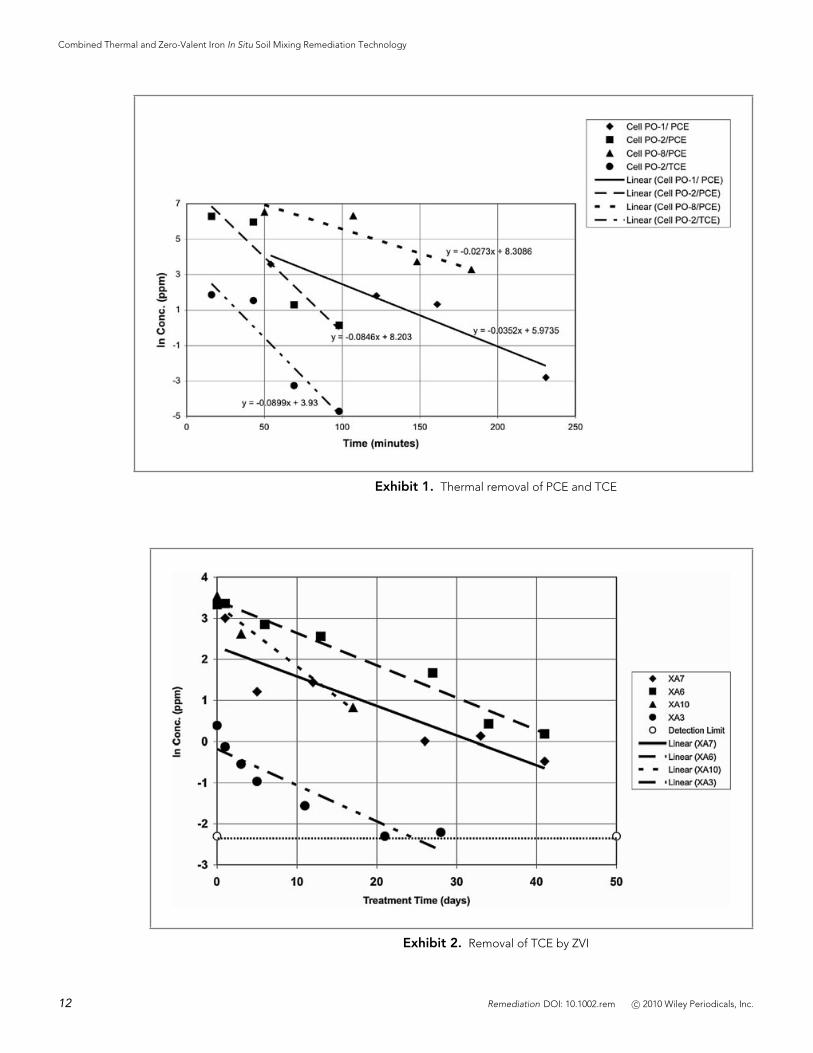
There is a limited amount of data available to determine contaminant removal rates ofthermal treatment. The reason for this is that obtaining the data requires stopping thetreatment several times to obtain time-based samples for chemical analysis. The cost andlogistics of stopping the treatment and moving the drilling rig off the treatment cell andthen bringing in a direct-push technology (DPT) sampling rig to sample a location withhot and unconsolidated soil are considerable. The limited sampling that has occurred useda special smaller remediation drilling rig (2-foot-diameter auger) designed for pilottesting, and was performed in the 1990s (Novaterra, Inc., 1993; O’Shea Parsons andAssociates, 1994). Chemical analyses versus time from five separate sites tested with thisequipment indicated that the observed thermal removal can be expressed by the followingfirst-order equation, ln C = ln C o − kt, where C is the concentration at time t and C o isthe initial concentration, t is time in consistent units, and k is the rate constant; k has theunits of 1/time.
The cost and logistics ofstopping the treatment andmoving the drilling rig offthe treatment cell and thenbringing in a direct-pushtechnology sampling rig tosample a location with hotand unconsolidated soil areconsiderable.
Exhibit 1 is an example plot of field test results showing the concentration oftetrachloroethene (PCE) and trichloroethene (TCE) versus time for three locations at oneof the five sites (O’Shea Parsons and Associates, 1994). It is typical of all the thermalremoval rate data in that a straight line is an adequate representation of the data on a logconcentration versus time plot. Thus, the PCE thermal removal data for three locationsappears to be pseudo first-order with an average k value of 0.049/min. This k value meansthat it takes about 14 minutes to reduce the PCE concentration by 50 percent and that itwould take about 99 minutes to remove 99 percent of the contamination. Exhibit 1 alsoshows that the removal rate of TCE appears as pseudo first-order.
A limited amount of data is also available for the removal of TCE by ZVI powder aftercompletion of thermal treatment. These data come from a proof of concept field projectcompleted at Argonne National Laboratory (ANL) in 1997 using dual 5-foot diameteraugers to compare the ability of three methods to remove TCE from heavy clay soils. Onemethod was the use of ZVI combined with thermal removal (Moos, 1998). Ten tests wererun at ANL to evaluate the combined remediation concept. The tests indicated that thecombined technology was successful but did not determine the removal rate of TCE. Theresults of the four key tests of the use of the combined technology have been re-evaluatedhere to determine if the removal of TCE by ZVI is pseudo first-order. Exhibit 2 showsthat pseudo first-order removal of TCE by ZVI powder is a fair representation of the dataup to about 40 days.
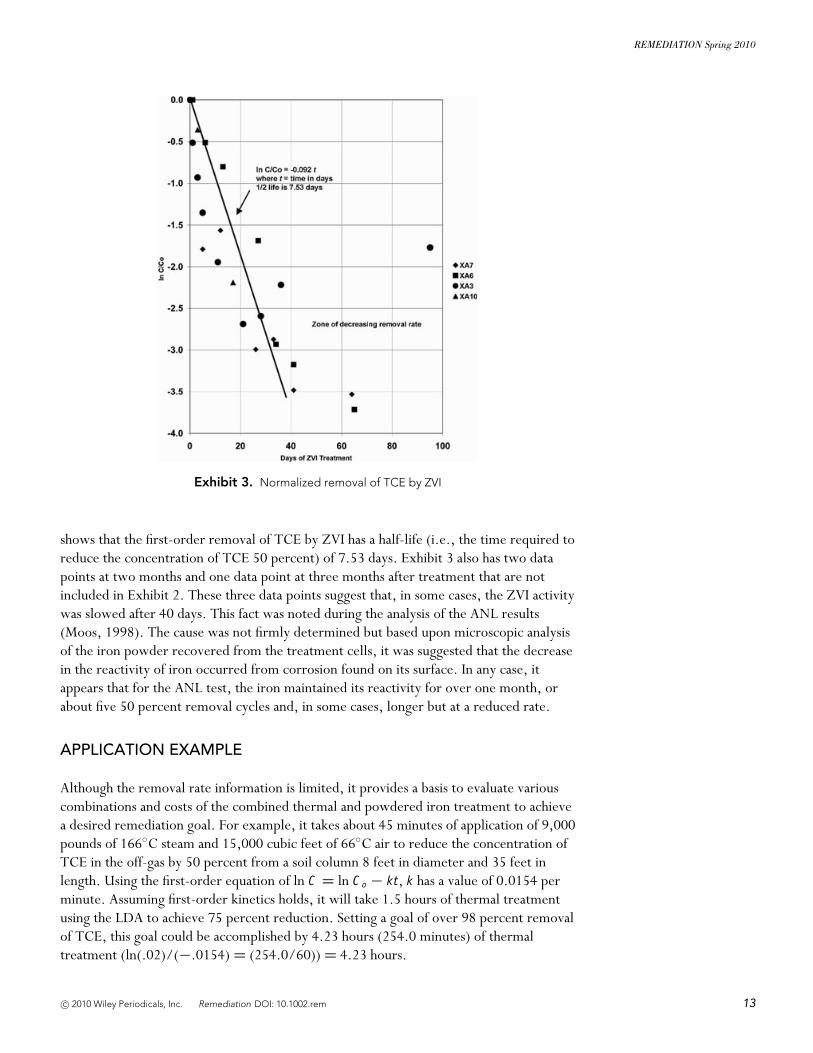
Since the data were taken using the same iron and soil under very closely controlledconditions, it was postulated that if the data were normalized for the initial concentrationof TCE all the data would fit on a single curve. This plot is shown in Exhibit 3. Exhibit 3
c© 2010 Wiley Periodicals, Inc. Remediation DOI: 10.1002.rem 11
Combined Thermal and Zero-Valent Iron In Situ Soil Mixing Remediation Technology
Exhibit 1. Thermal removal of PCE and TCE
Exhibit 2. Removal of TCE by ZVI
12 Remediation DOI: 10.1002.rem c© 2010 Wiley Periodicals, Inc.
REMEDIATION Spring 2010
Exhibit 3. Normalized removal of TCE by ZVI
shows that the first-order removal of TCE by ZVI has a half-life (i.e., the time required toreduce the concentration of TCE 50 percent) of 7.53 days. Exhibit 3 also has two datapoints at two months and one data point at three months after treatment that are notincluded in Exhibit 2. These three data points suggest that, in some cases, the ZVI activitywas slowed after 40 days. This fact was noted during the analysis of the ANL results(Moos, 1998). The cause was not firmly determined but based upon microscopic analysisof the iron powder recovered from the treatment cells, it was suggested that the decreasein the reactivity of iron occurred from corrosion found on its surface. In any case, itappears that for the ANL test, the iron maintained its reactivity for over one month, orabout five 50 percent removal cycles and, in some cases, longer but at a reduced rate.
APPLICATION EXAMPLE
Although the removal rate information is limited, it provides a basis to evaluate variouscombinations and costs of the combined thermal and powdered iron treatment to achievea desired remediation goal. For example, it takes about 45 minutes of application of 9,000pounds of 166◦C steam and 15,000 cubic feet of 66◦C air to reduce the concentration ofTCE in the off-gas by 50 percent from a soil column 8 feet in diameter and 35 feet inlength. Using the first-order equation of ln C = ln C o − kt, k has a value of 0.0154 perminute. Assuming first-order kinetics holds, it will take 1.5 hours of thermal treatmentusing the LDA to achieve 75 percent reduction. Setting a goal of over 98 percent removalof TCE, this goal could be accomplished by 4.23 hours (254.0 minutes) of thermaltreatment (ln(.02)/(−.0154) = (254.0/60)) = 4.23 hours.
c© 2010 Wiley Periodicals, Inc. Remediation DOI: 10.1002.rem 13

Combined Thermal and Zero-Valent Iron In Situ Soil Mixing Remediation Technology
This 98 percent removal might also be achieved by combining 1.5 hours of thermaltreatment achieving 75 percent removal, followed by one month of remediation by ZVIpowder, where the iron has a TCE removal rate of 50 percent in 7.5 days.
The cost comparison of us-ing the two approachescan be determined basedupon the volume treated,the cost of the equipment,and the cost of the iron.
The cost comparison of using the two approaches can be determined based upon thevolume treated, the cost of the equipment, and the cost of the iron. The volume of soiltreated is about 65.2 cubic yards (yd3) per treatment cell, which amounts to about195,500 pounds, where the soil weighs 3,000 pounds per yd3. Because the auger creates atreatment circle, a 17 percent area overlap is required to achieve 100 percent arealcoverage; this reduces the effective treatment volume to 54.1 yd3 per cell.
A typical LDA thermal treatment operation might cost $35 (+/−$5) per minute.Thus, the cost to thermally remove 98 percent of the contamination is estimated to be4.23 hr × 60 min/hr × $35/min = $8,890. This calculates to about $164.30 pereffective cubic yard treated. The injection and mixing in of 1 percent by weight(1,950 lbs) of iron powder that costs $0.50/pound will take about 30 minutes at aninjection cost of about $30/min. Thus, the cost of 1.5 hours of thermal treatment plusiron will be 90 min × $35/min + $0.50/lb × 1,950 lb + $30/min × 30 min = $5,018.The estimated cost of the combined approach is $92.90 per effective cubic yard treated.
Thus, the savings for a combined approach of thermal plus iron compared to thermalalone to remediate to over 98 percent removal is estimated at about $71.40 per cubicyard. This results in an estimated savings of $3,862 per treatment cell, approximately43 percent of the estimated cost of thermal treatment. In addition, if the powdered ironremains reactive for more than one month, the removal of additional chlorinated VOCswill occur. When this happens, removal efficiencies of 99.8 percent or greater can occur,as was found in the case-study test results described in the next section.
FULL-SCALE REMEDIATION CASE STUDY
Project Description
The remediation summarized in this case study details part of the Corrective MeasuresImplementation (CMI) for Space Launch Complex 15 (SLC-15), Solid WasteManagement Unit C030 located at Cape Canaveral Air Force Station in Cape Canaveral,Florida (BEM Systems, Inc., 2006). SLC-15 was constructed in 1957 for the United StatesAir Force Titan I Missile Program but was utilized as a waste storage and disposal areafrom 1958 until approximately 1989. The storage and disposal of wastes adverselyimpacted soil and groundwater quality at SLC-15. Several Interim Measure (IM) activitieswere performed to address issues with vadose-zone soils, sediment, and surface water. ACorrective Measure Study (CMS) and a Corrective Measure Design (CMD) weredeveloped specifically to address groundwater and saturated soil impacted withchlorinated VOCs. Chlorinated VOCs, including TCE, cis-1,2-dichloroethene, vinylchloride, PCE, trans-1,2-dichloroethene (cis-1,2-DCE), 1,1-dichloroethene (1,1-DCE),and 1,1,2-trichloro-1,2,2-trifluorethane (Freon 113), were present in dissolved, sorbed,and DNAPL forms in the surfical aquifer. Freon 113 was the most abundant contaminant,even though it was not a chemical of concern (COC).
The saturated subsurface groundwater (water table at about 6 feet below groundsurface) that had TCE concentrations at or above 10 mg/L (i.e., approximately 1 percentof the solubility) was considered as the source contamination zone, requiring remediation
14 Remediation DOI: 10.1002.rem c© 2010 Wiley Periodicals, Inc.
REMEDIATION Spring 2010
because it is considered as a potential indication of DNAPL. TCE was present in thegroundwater up to 500 mg/L and in the soil up to 1,800 mg/kg (see pretreatment data inExhibits 5 through 8). Two source areas (Launch Stand [LS] and Deluge Basin [LB]) wereidentified as having greater than 10 mg/L of TCE from depths of 20 to 55 feet belowground surface, containing approximately 48,500 cubic yards of contaminated soil andgroundwater.
The CMS recommended combined in situ thermal treatment and ZVI of soil andgroundwater by the application of LDA soil mixing technology. The mixing equipmentwas designed to deliver injected fluids (i.e., steam, hot air, and iron slurry) to thesubsurface contaminants to facilitate treatment and removal. Hot air and steam used tovolatilize the COCs were emplaced using a 10-foot-diameter auger in a batch process thattreated one column at a time. ZVI slurry was also co-injected with air into every columnto continue the remediation after cessation of the thermal treatment. During active steamand air treatment, a vacuum was applied to a 14-foot-diameter shroud at the groundsurface to collect vaporized contaminants that were subsequently treated in a gasconditioning system, and then destroyed in a flameless thermal oxidizer. The vaporizedcontaminants were continuously sampled, and the concentration of contaminationremoved during treatment was measured by a flame ionization detector (FID) in theoff-gas stream. The gas composition was measured by an in-line gas chromatograph (GC).These measurements, when combined with contaminated off-gas flows and temperatures,permitted the calculation of the estimated amount of each COC and Freon 113 removedduring thermal treatment.
Project Goal
The goal of the remedial implementation was to reduce the identified source area TCEmass by at least 80 percent or more, so that natural attenuation of the remainingcontamination would meet the objective of reaching the Florida Groundwater CleanupTarget Level (GCTL) for TCE in less than 68 years. This goal was based onfate-and-transport modeling. Because the source-area TCE mass could not be accuratelyand credibly defined due to the presence of DNAPL, the amount of material to reach80 percent removal could not be determined. Thus, the objective of the project was toachieve as much removal as possible, greater then 80 percent, as determined frompretreatment and posttreatment soil and groundwater chemical samples.
The goal of the reme-dial implementation wasto reduce the identifiedsource area TCE mass byat least 80 percent ormore, so that natural at-tenuation of the remainingcontamination would meetthe objective of reachingthe Florida GroundwaterCleanup Target Level forTCE in less than 68 years.
RESULTS
Sampling and Chemical Analysis
Pretreatment and posttreatment DPT soil and groundwater samples for chemical analysiswere collected on 40-foot orthogonal grids at 22 LS locations and at 21 DB locations,specifically for the purpose of performance evaluation. Post-treatment sampling occurredthree to six months after treatment. Since the sampling grids extended slightly beyond thecontaminated areas, the pretreatment evaluation samples also served the purpose ofconfirming and refining the conceptual site model. Thermal treatment and iron powderinjection occurred between 20 and 55 feet below the ground surface. Both soil andgroundwater samples were taken for chemical analysis nominally at seven depths (10, 20,
c© 2010 Wiley Periodicals, Inc. Remediation DOI: 10.1002.rem 15
Combined Thermal and Zero-Valent Iron In Situ Soil Mixing Remediation Technology
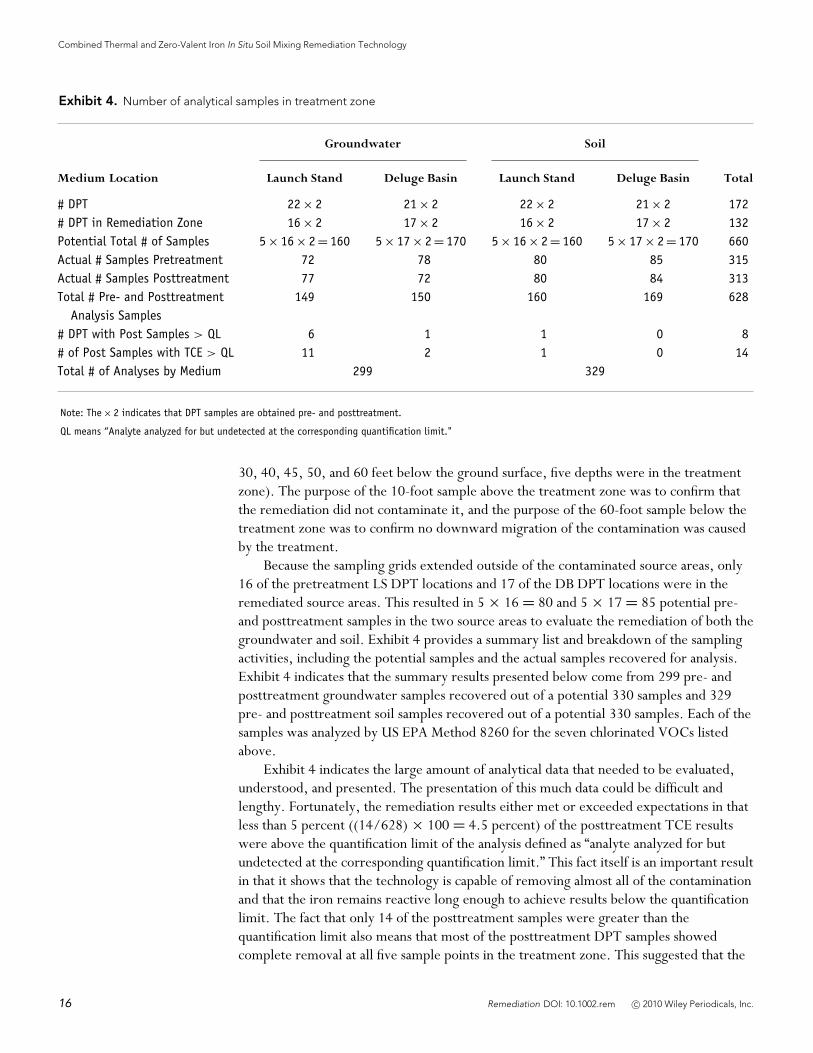
Exhibit 4. Number of analytical samples in treatment zone
Groundwater Soil
Medium Location Launch Stand Deluge Basin Launch Stand Deluge Basin Total
# DPT 22 × 2 21 × 2 22 × 2 21 × 2 172# DPT in Remediation Zone 16 × 2 17 × 2 16 × 2 17 × 2 132Potential Total # of Samples 5 × 16 × 2 = 160 5 × 17 × 2 = 170 5 × 16 × 2 = 160 5 × 17 × 2 = 170 660Actual # Samples Pretreatment 72 78 80 85 315Actual # Samples Posttreatment 77 72 80 84 313Total # Pre- and Posttreatment 149 150 160 169 628
Analysis Samples# DPT with Post Samples > QL 6 1 1 0 8# of Post Samples with TCE > QL 11 2 1 0 14Total # of Analyses by Medium 299 329
Note: The × 2 indicates that DPT samples are obtained pre- and posttreatment.
QL means “Analyte analyzed for but undetected at the corresponding quantification limit."
30, 40, 45, 50, and 60 feet below the ground surface, five depths were in the treatmentzone). The purpose of the 10-foot sample above the treatment zone was to confirm thatthe remediation did not contaminate it, and the purpose of the 60-foot sample below thetreatment zone was to confirm no downward migration of the contamination was causedby the treatment.
Because the sampling grids extended outside of the contaminated source areas, only16 of the pretreatment LS DPT locations and 17 of the DB DPT locations were in theremediated source areas. This resulted in 5 × 16 = 80 and 5 × 17 = 85 potential pre-and posttreatment samples in the two source areas to evaluate the remediation of both thegroundwater and soil. Exhibit 4 provides a summary list and breakdown of the samplingactivities, including the potential samples and the actual samples recovered for analysis.Exhibit 4 indicates that the summary results presented below come from 299 pre- andposttreatment groundwater samples recovered out of a potential 330 samples and 329pre- and posttreatment soil samples recovered out of a potential 330 samples. Each of thesamples was analyzed by US EPA Method 8260 for the seven chlorinated VOCs listedabove.
Exhibit 4 indicates the large amount of analytical data that needed to be evaluated,understood, and presented. The presentation of this much data could be difficult andlengthy. Fortunately, the remediation results either met or exceeded expectations in thatless than 5 percent ((14/628) × 100 = 4.5 percent) of the posttreatment TCE resultswere above the quantification limit of the analysis defined as “analyte analyzed for butundetected at the corresponding quantification limit.” This fact itself is an important resultin that it shows that the technology is capable of removing almost all of the contaminationand that the iron remains reactive long enough to achieve results below the quantificationlimit. The fact that only 14 of the posttreatment samples were greater than thequantification limit also means that most of the posttreatment DPT samples showedcomplete removal at all five sample points in the treatment zone. This suggested that the
16 Remediation DOI: 10.1002.rem c© 2010 Wiley Periodicals, Inc.
REMEDIATION Spring 2010
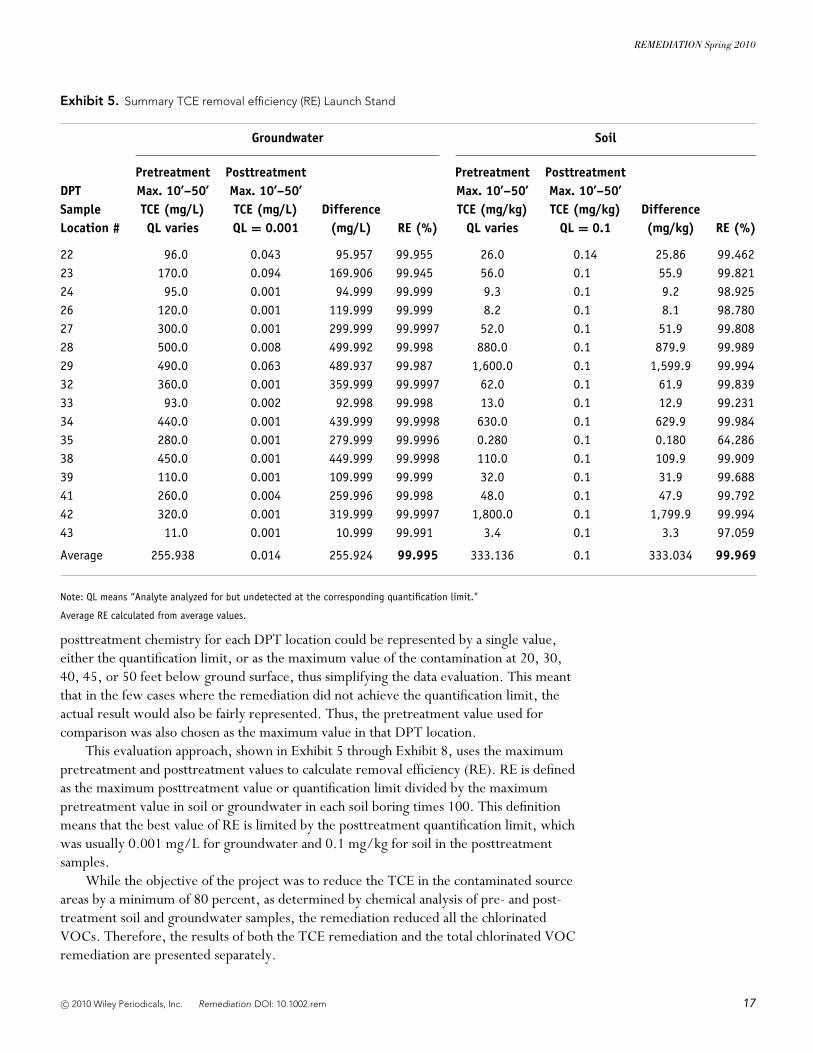
Exhibit 5. Summary TCE removal efficiency (RE) Launch Stand
Groundwater Soil
Pretreatment Posttreatment Pretreatment PosttreatmentDPT Max. 10’–50’ Max. 10’–50’ Max. 10’–50’ Max. 10’–50’Sample TCE (mg/L) TCE (mg/L) Difference TCE (mg/kg) TCE (mg/kg) DifferenceLocation # QL varies QL = 0.001 (mg/L) RE (%) QL varies QL = 0.1 (mg/kg) RE (%)
22 96.0 0.043 95.957 99.955 26.0 0.14 25.86 99.46223 170.0 0.094 169.906 99.945 56.0 0.1 55.9 99.82124 95.0 0.001 94.999 99.999 9.3 0.1 9.2 98.92526 120.0 0.001 119.999 99.999 8.2 0.1 8.1 98.78027 300.0 0.001 299.999 99.9997 52.0 0.1 51.9 99.80828 500.0 0.008 499.992 99.998 880.0 0.1 879.9 99.98929 490.0 0.063 489.937 99.987 1,600.0 0.1 1,599.9 99.99432 360.0 0.001 359.999 99.9997 62.0 0.1 61.9 99.83933 93.0 0.002 92.998 99.998 13.0 0.1 12.9 99.23134 440.0 0.001 439.999 99.9998 630.0 0.1 629.9 99.98435 280.0 0.001 279.999 99.9996 0.280 0.1 0.180 64.28638 450.0 0.001 449.999 99.9998 110.0 0.1 109.9 99.90939 110.0 0.001 109.999 99.999 32.0 0.1 31.9 99.68841 260.0 0.004 259.996 99.998 48.0 0.1 47.9 99.79242 320.0 0.001 319.999 99.9997 1,800.0 0.1 1,799.9 99.99443 11.0 0.001 10.999 99.991 3.4 0.1 3.3 97.059
Average 255.938 0.014 255.924 99.995 333.136 0.1 333.034 99.969
Note: QL means “Analyte analyzed for but undetected at the corresponding quantification limit."
Average RE calculated from average values.
posttreatment chemistry for each DPT location could be represented by a single value,either the quantification limit, or as the maximum value of the contamination at 20, 30,40, 45, or 50 feet below ground surface, thus simplifying the data evaluation. This meantthat in the few cases where the remediation did not achieve the quantification limit, theactual result would also be fairly represented. Thus, the pretreatment value used forcomparison was also chosen as the maximum value in that DPT location.
This evaluation approach, shown in Exhibit 5 through Exhibit 8, uses the maximumpretreatment and posttreatment values to calculate removal efficiency (RE). RE is definedas the maximum posttreatment value or quantification limit divided by the maximumpretreatment value in soil or groundwater in each soil boring times 100. This definitionmeans that the best value of RE is limited by the posttreatment quantification limit, whichwas usually 0.001 mg/L for groundwater and 0.1 mg/kg for soil in the posttreatmentsamples.
While the objective of the project was to reduce the TCE in the contaminated sourceareas by a minimum of 80 percent, as determined by chemical analysis of pre- and post-treatment soil and groundwater samples, the remediation reduced all the chlorinatedVOCs. Therefore, the results of both the TCE remediation and the total chlorinated VOCremediation are presented separately.
c© 2010 Wiley Periodicals, Inc. Remediation DOI: 10.1002.rem 17
Combined Thermal and Zero-Valent Iron In Situ Soil Mixing Remediation Technology
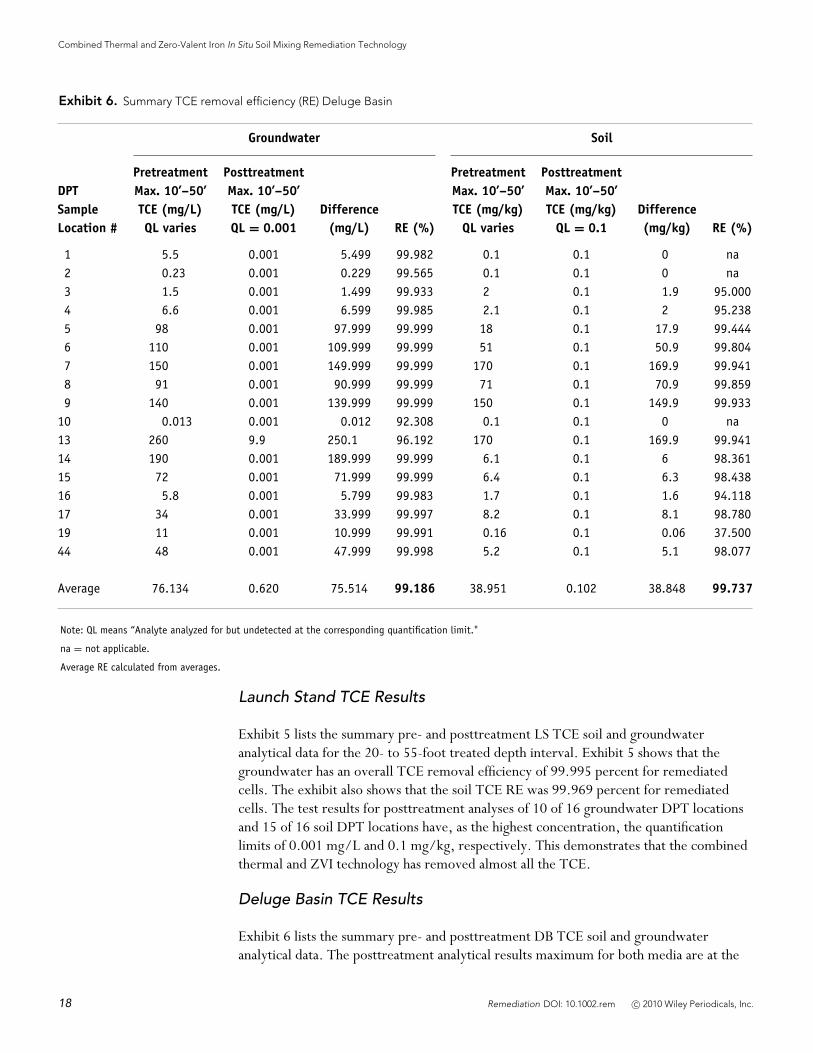
Exhibit 6. Summary TCE removal efficiency (RE) Deluge Basin
Groundwater Soil
Pretreatment Posttreatment Pretreatment PosttreatmentDPT Max. 10’–50’ Max. 10’–50’ Max. 10’–50’ Max. 10’–50’Sample TCE (mg/L) TCE (mg/L) Difference TCE (mg/kg) TCE (mg/kg) DifferenceLocation # QL varies QL = 0.001 (mg/L) RE (%) QL varies QL = 0.1 (mg/kg) RE (%)
1 5.5 0.001 5.499 99.982 0.1 0.1 0 na2 0.23 0.001 0.229 99.565 0.1 0.1 0 na3 1.5 0.001 1.499 99.933 2 0.1 1.9 95.0004 6.6 0.001 6.599 99.985 2.1 0.1 2 95.2385 98 0.001 97.999 99.999 18 0.1 17.9 99.4446 110 0.001 109.999 99.999 51 0.1 50.9 99.8047 150 0.001 149.999 99.999 170 0.1 169.9 99.9418 91 0.001 90.999 99.999 71 0.1 70.9 99.8599 140 0.001 139.999 99.999 150 0.1 149.9 99.933
10 0.013 0.001 0.012 92.308 0.1 0.1 0 na13 260 9.9 250.1 96.192 170 0.1 169.9 99.94114 190 0.001 189.999 99.999 6.1 0.1 6 98.36115 72 0.001 71.999 99.999 6.4 0.1 6.3 98.43816 5.8 0.001 5.799 99.983 1.7 0.1 1.6 94.11817 34 0.001 33.999 99.997 8.2 0.1 8.1 98.78019 11 0.001 10.999 99.991 0.16 0.1 0.06 37.50044 48 0.001 47.999 99.998 5.2 0.1 5.1 98.077
Average 76.134 0.620 75.514 99.186 38.951 0.102 38.848 99.737
Note: QL means “Analyte analyzed for but undetected at the corresponding quantification limit."
na = not applicable.
Average RE calculated from averages.
Launch Stand TCE Results
Exhibit 5 lists the summary pre- and posttreatment LS TCE soil and groundwateranalytical data for the 20- to 55-foot treated depth interval. Exhibit 5 shows that thegroundwater has an overall TCE removal efficiency of 99.995 percent for remediatedcells. The exhibit also shows that the soil TCE RE was 99.969 percent for remediatedcells. The test results for posttreatment analyses of 10 of 16 groundwater DPT locationsand 15 of 16 soil DPT locations have, as the highest concentration, the quantificationlimits of 0.001 mg/L and 0.1 mg/kg, respectively. This demonstrates that the combinedthermal and ZVI technology has removed almost all the TCE.
Deluge Basin TCE Results
Exhibit 6 lists the summary pre- and posttreatment DB TCE soil and groundwateranalytical data. The posttreatment analytical results maximum for both media are at the
18 Remediation DOI: 10.1002.rem c© 2010 Wiley Periodicals, Inc.
REMEDIATION Spring 2010
quantification limit, except for DPT sample location 13 groundwater, which has a TCEconcentration of 9.9 mg/L in the sample taken from a depth of 30 feet, and 0.410 mg/Lin the sample taken at a depth of 40 feet. These are the only results in 299 posttreatmentTCE groundwater analyses (LS and DB) that are not less than 0.094 mg/L. A review of allthe 299 posttreatment TCE groundwater results indicates that only 13 analyses aregreater than the quantification limit of 0.001 mg/L. A careful review of the specificanalysis with the chemical analyst did not reveal any problems or potential errors with thelocation 13 sample. The possibility exists that the result was caused because the ZVI wasnot mixed in well enough, or that there was a problem with the ZVI slurry injection forthis cell. A review of the recorded operational data of ZVI slurry flow did not reveal anyproblems but that is not conclusive. At this point, the most likely reason for this 9.9 mg/Lresult and even the 40-foot 0.410 mg/L result appears to be in the injection and/ormixing processes. Unfortunately, neither the 45-foot nor the 50-foot groundwatersamples were recovered from this DPT location, so they cannot be used to assist in theevaluation. The soil samples, which come from a separate DPT, provide no informationexcept that the analysis is below the quantification limit. Including DPT 13, Exhibit 6shows an overall RE of 99.186 percent for TCE from the DB groundwater.
A review of all the 299 post-treatment TCE groundwa-ter results indicates thatonly 13 analyses are greaterthan the quantification limitof 0.001 mg/L.
Launch Stand Total Chlorinated VOC Results
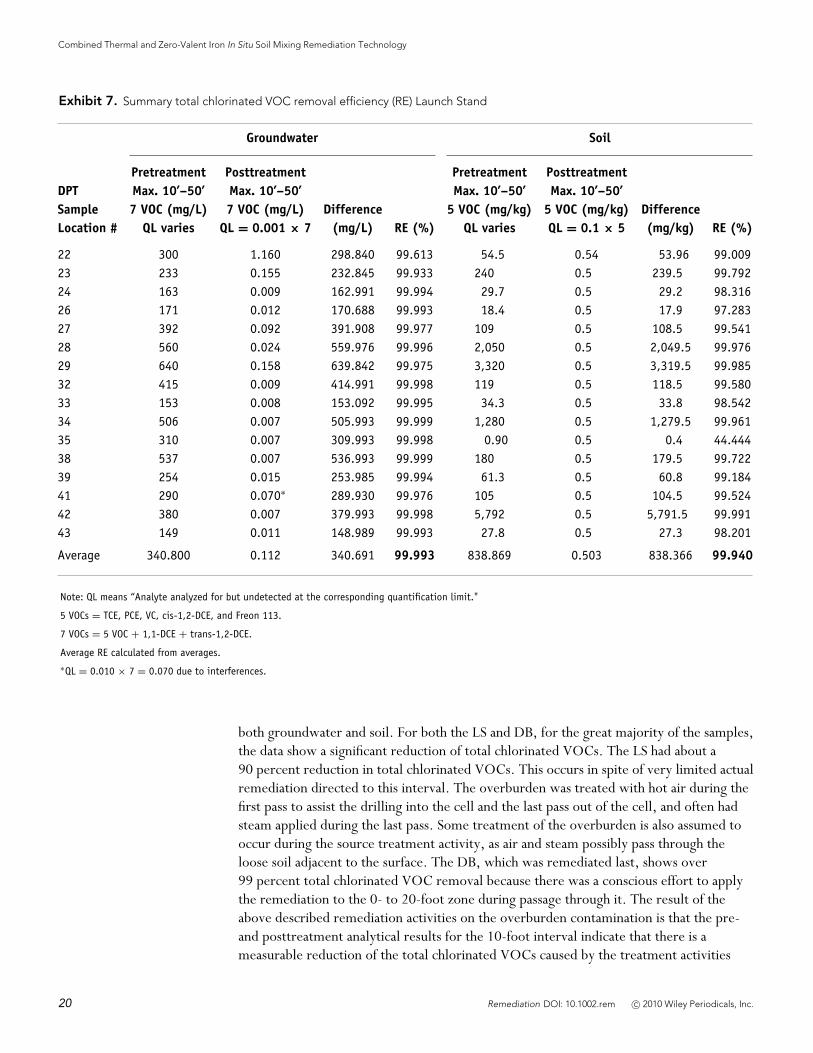
Exhibit 7 lists the summary pre- and posttreatment LS total chlorinated VOC analyticaldata for soil and groundwater. The overview of the test results is similar to that foundwith TCE alone, in that the posttreatment data are almost always nondetect for the 20- to50-foot treated depth interval. This exhibit shows that the groundwater has an overalltotal chlorinated VOC removal efficiency of 99.993 percent. The exhibit also shows thatthe soil total chlorinated VOC RE was 99.940 percent.
Deluge Basin Total Chlorinated VOC Results
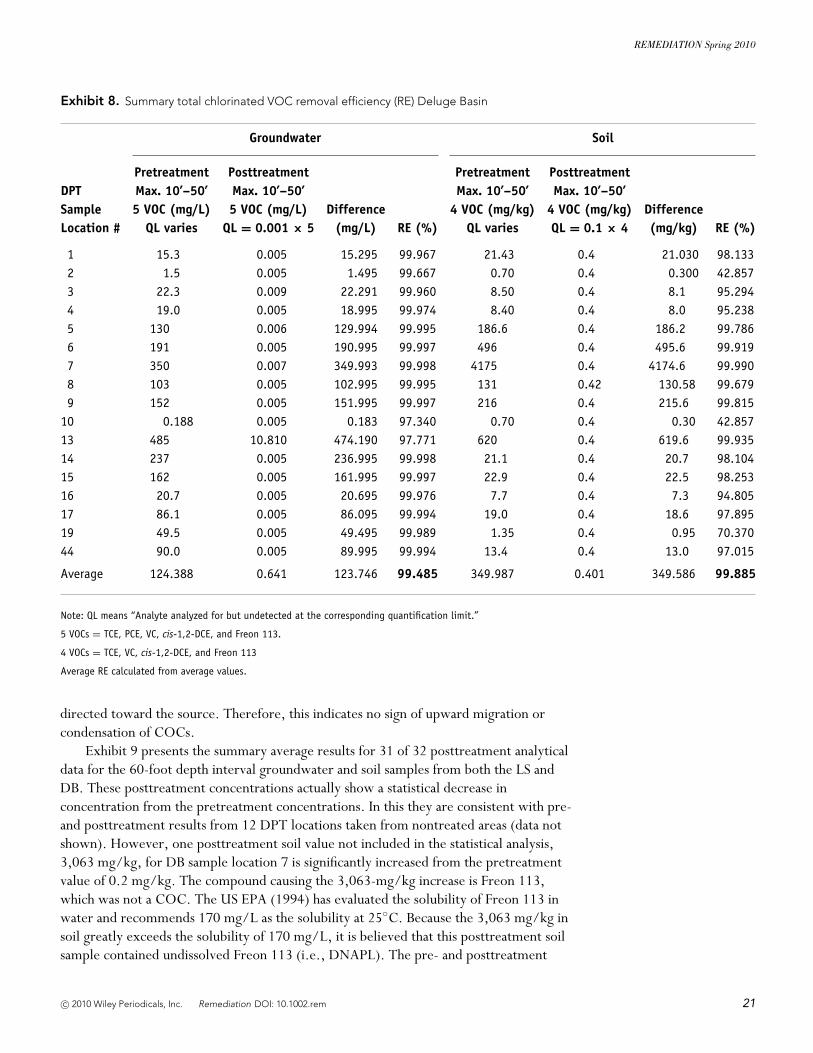
Exhibit 8 lists the summary pre- and posttreatment DB total chlorinated VOC analyticaldata for soil and groundwater. The overview of the results is similar to that found withTCE, in that the posttreatment chemistry analyses values are almost always at thequantification limit for the 20- to 50-foot treated depth interval (i.e., in 11 DPT locations,all samples were nondetects for groundwater, and in 16 DPT locations, all samples werenondetect for soil). Exhibit 8 shows chlorinated VOC removal efficiencies of99.485 percent for groundwater (not including DPT 13) and 99.885 percent for soil,close to the maximum possible, using the detection limit as the default value.
Sampling Results Above and Below the Treatment Zone
The 0 to 20 feet of overburden above the target treatment interval were not included inthe treatment plan because this interval did not show TCE concentrations greater than10 mg/kg. Pretreatment sampling indicated the presence of lower concentrations of TCEas well as lower concentrations of the other COCs and Freon 113. It was expected thatactions relating to treating the targeted treatment interval would result in the treatment ofthe COCs and Freon 113 from this interval. Exhibit 9 lists the summary average pre- andposttreatment analytical data for the 10-foot depth interval for total chlorinated VOC for
c© 2010 Wiley Periodicals, Inc. Remediation DOI: 10.1002.rem 19
Combined Thermal and Zero-Valent Iron In Situ Soil Mixing Remediation Technology
Exhibit 7. Summary total chlorinated VOC removal efficiency (RE) Launch Stand
Groundwater Soil
Pretreatment Posttreatment Pretreatment PosttreatmentDPT Max. 10’–50’ Max. 10’–50’ Max. 10’–50’ Max. 10’–50’Sample 7 VOC (mg/L) 7 VOC (mg/L) Difference 5 VOC (mg/kg) 5 VOC (mg/kg) DifferenceLocation # QL varies QL = 0.001 × 7 (mg/L) RE (%) QL varies QL = 0.1 × 5 (mg/kg) RE (%)
22 300 1.160 298.840 99.613 54.5 0.54 53.96 99.00923 233 0.155 232.845 99.933 240 0.5 239.5 99.79224 163 0.009 162.991 99.994 29.7 0.5 29.2 98.31626 171 0.012 170.688 99.993 18.4 0.5 17.9 97.28327 392 0.092 391.908 99.977 109 0.5 108.5 99.54128 560 0.024 559.976 99.996 2,050 0.5 2,049.5 99.97629 640 0.158 639.842 99.975 3,320 0.5 3,319.5 99.98532 415 0.009 414.991 99.998 119 0.5 118.5 99.58033 153 0.008 153.092 99.995 34.3 0.5 33.8 98.54234 506 0.007 505.993 99.999 1,280 0.5 1,279.5 99.96135 310 0.007 309.993 99.998 0.90 0.5 0.4 44.44438 537 0.007 536.993 99.999 180 0.5 179.5 99.72239 254 0.015 253.985 99.994 61.3 0.5 60.8 99.18441 290 0.070∗ 289.930 99.976 105 0.5 104.5 99.52442 380 0.007 379.993 99.998 5,792 0.5 5,791.5 99.99143 149 0.011 148.989 99.993 27.8 0.5 27.3 98.201
Average 340.800 0.112 340.691 99.993 838.869 0.503 838.366 99.940
Note: QL means “Analyte analyzed for but undetected at the corresponding quantification limit."
5 VOCs = TCE, PCE, VC, cis-1,2-DCE, and Freon 113.
7 VOCs = 5 VOC + 1,1-DCE + trans-1,2-DCE.
Average RE calculated from averages.∗QL = 0.010 × 7 = 0.070 due to interferences.
both groundwater and soil. For both the LS and DB, for the great majority of the samples,the data show a significant reduction of total chlorinated VOCs. The LS had about a90 percent reduction in total chlorinated VOCs. This occurs in spite of very limited actualremediation directed to this interval. The overburden was treated with hot air during thefirst pass to assist the drilling into the cell and the last pass out of the cell, and often hadsteam applied during the last pass. Some treatment of the overburden is also assumed tooccur during the source treatment activity, as air and steam possibly pass through theloose soil adjacent to the surface. The DB, which was remediated last, shows over99 percent total chlorinated VOC removal because there was a conscious effort to applythe remediation to the 0- to 20-foot zone during passage through it. The result of theabove described remediation activities on the overburden contamination is that the pre-and posttreatment analytical results for the 10-foot interval indicate that there is ameasurable reduction of the total chlorinated VOCs caused by the treatment activities
20 Remediation DOI: 10.1002.rem c© 2010 Wiley Periodicals, Inc.
REMEDIATION Spring 2010
Exhibit 8. Summary total chlorinated VOC removal efficiency (RE) Deluge Basin
Groundwater Soil
Pretreatment Posttreatment Pretreatment PosttreatmentDPT Max. 10’–50’ Max. 10’–50’ Max. 10’–50’ Max. 10’–50’Sample 5 VOC (mg/L) 5 VOC (mg/L) Difference 4 VOC (mg/kg) 4 VOC (mg/kg) DifferenceLocation # QL varies QL = 0.001 × 5 (mg/L) RE (%) QL varies QL = 0.1 × 4 (mg/kg) RE (%)
1 15.3 0.005 15.295 99.967 21.43 0.4 21.030 98.1332 1.5 0.005 1.495 99.667 0.70 0.4 0.300 42.8573 22.3 0.009 22.291 99.960 8.50 0.4 8.1 95.2944 19.0 0.005 18.995 99.974 8.40 0.4 8.0 95.2385 130 0.006 129.994 99.995 186.6 0.4 186.2 99.7866 191 0.005 190.995 99.997 496 0.4 495.6 99.9197 350 0.007 349.993 99.998 4175 0.4 4174.6 99.9908 103 0.005 102.995 99.995 131 0.42 130.58 99.6799 152 0.005 151.995 99.997 216 0.4 215.6 99.815
10 0.188 0.005 0.183 97.340 0.70 0.4 0.30 42.85713 485 10.810 474.190 97.771 620 0.4 619.6 99.93514 237 0.005 236.995 99.998 21.1 0.4 20.7 98.10415 162 0.005 161.995 99.997 22.9 0.4 22.5 98.25316 20.7 0.005 20.695 99.976 7.7 0.4 7.3 94.80517 86.1 0.005 86.095 99.994 19.0 0.4 18.6 97.89519 49.5 0.005 49.495 99.989 1.35 0.4 0.95 70.37044 90.0 0.005 89.995 99.994 13.4 0.4 13.0 97.015
Average 124.388 0.641 123.746 99.485 349.987 0.401 349.586 99.885
Note: QL means “Analyte analyzed for but undetected at the corresponding quantification limit.”
5 VOCs = TCE, PCE, VC, cis-1,2-DCE, and Freon 113.
4 VOCs = TCE, VC, cis-1,2-DCE, and Freon 113
Average RE calculated from average values.
directed toward the source. Therefore, this indicates no sign of upward migration orcondensation of COCs.
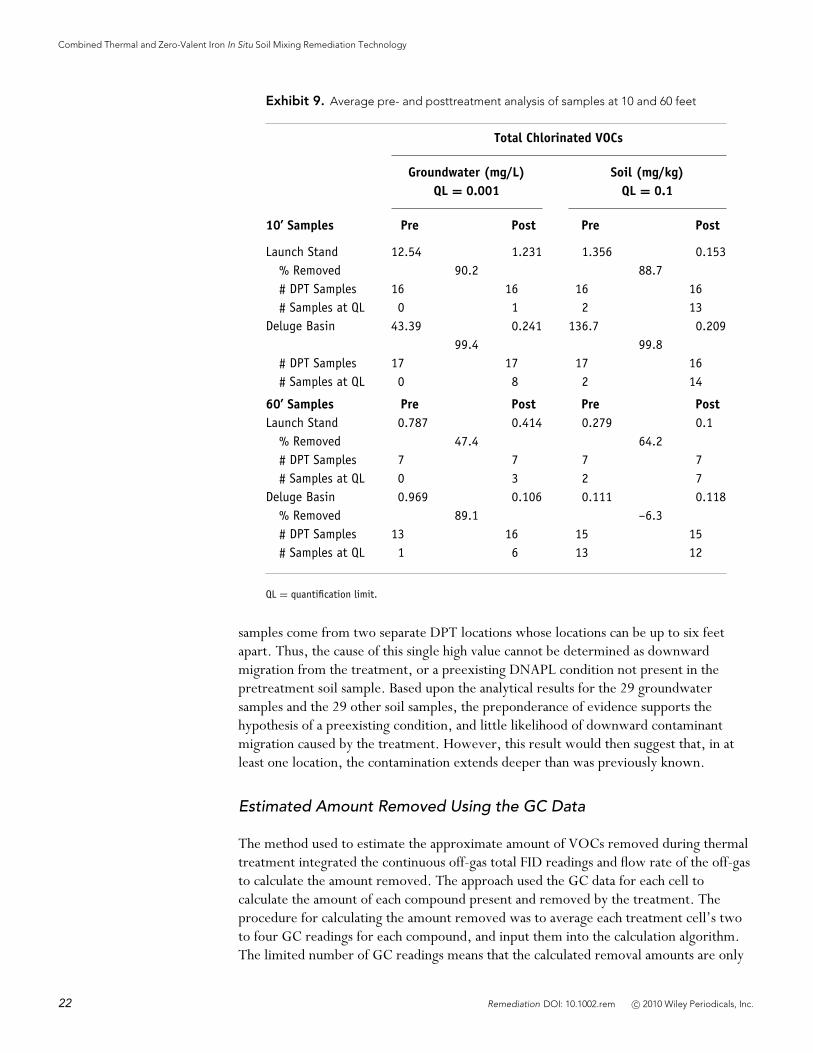
Exhibit 9 presents the summary average results for 31 of 32 posttreatment analyticaldata for the 60-foot depth interval groundwater and soil samples from both the LS andDB. These posttreatment concentrations actually show a statistical decrease inconcentration from the pretreatment concentrations. In this they are consistent with pre-and posttreatment results from 12 DPT locations taken from nontreated areas (data notshown). However, one posttreatment soil value not included in the statistical analysis,3,063 mg/kg, for DB sample location 7 is significantly increased from the pretreatmentvalue of 0.2 mg/kg. The compound causing the 3,063-mg/kg increase is Freon 113,which was not a COC. The US EPA (1994) has evaluated the solubility of Freon 113 inwater and recommends 170 mg/L as the solubility at 25◦C. Because the 3,063 mg/kg insoil greatly exceeds the solubility of 170 mg/L, it is believed that this posttreatment soilsample contained undissolved Freon 113 (i.e., DNAPL). The pre- and posttreatment
c© 2010 Wiley Periodicals, Inc. Remediation DOI: 10.1002.rem 21
Combined Thermal and Zero-Valent Iron In Situ Soil Mixing Remediation Technology
Exhibit 9. Average pre- and posttreatment analysis of samples at 10 and 60 feet
Total Chlorinated VOCs
Groundwater (mg/L) Soil (mg/kg)QL = 0.001 QL = 0.1
10’ Samples Pre Post Pre Post
Launch Stand 12.54 1.231 1.356 0.153% Removed 90.2 88.7# DPT Samples 16 16 16 16# Samples at QL 0 1 2 13
Deluge Basin 43.39 0.241 136.7 0.20999.4 99.8
# DPT Samples 17 17 17 16# Samples at QL 0 8 2 14
60’ Samples Pre Post Pre PostLaunch Stand 0.787 0.414 0.279 0.1
% Removed 47.4 64.2# DPT Samples 7 7 7 7# Samples at QL 0 3 2 7
Deluge Basin 0.969 0.106 0.111 0.118% Removed 89.1 –6.3# DPT Samples 13 16 15 15# Samples at QL 1 6 13 12
QL = quantification limit.
samples come from two separate DPT locations whose locations can be up to six feetapart. Thus, the cause of this single high value cannot be determined as downwardmigration from the treatment, or a preexisting DNAPL condition not present in thepretreatment soil sample. Based upon the analytical results for the 29 groundwatersamples and the 29 other soil samples, the preponderance of evidence supports thehypothesis of a preexisting condition, and little likelihood of downward contaminantmigration caused by the treatment. However, this result would then suggest that, in atleast one location, the contamination extends deeper than was previously known.
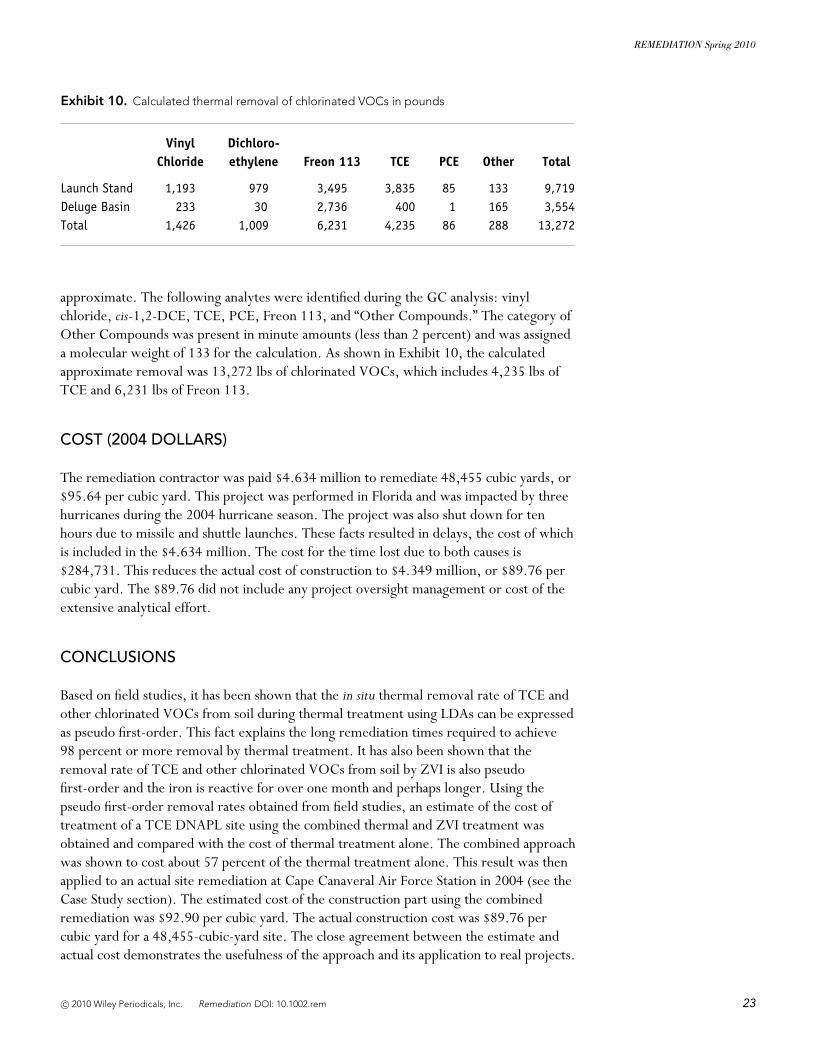
Estimated Amount Removed Using the GC Data
The method used to estimate the approximate amount of VOCs removed during thermaltreatment integrated the continuous off-gas total FID readings and flow rate of the off-gasto calculate the amount removed. The approach used the GC data for each cell tocalculate the amount of each compound present and removed by the treatment. Theprocedure for calculating the amount removed was to average each treatment cell’s twoto four GC readings for each compound, and input them into the calculation algorithm.The limited number of GC readings means that the calculated removal amounts are only
22 Remediation DOI: 10.1002.rem c© 2010 Wiley Periodicals, Inc.
REMEDIATION Spring 2010
Exhibit 10. Calculated thermal removal of chlorinated VOCs in pounds
Vinyl Dichloro-Chloride ethylene Freon 113 TCE PCE Other Total
Launch Stand 1,193 979 3,495 3,835 85 133 9,719Deluge Basin 233 30 2,736 400 1 165 3,554Total 1,426 1,009 6,231 4,235 86 288 13,272
approximate. The following analytes were identified during the GC analysis: vinylchloride, cis-1,2-DCE, TCE, PCE, Freon 113, and “Other Compounds.” The category ofOther Compounds was present in minute amounts (less than 2 percent) and was assigneda molecular weight of 133 for the calculation. As shown in Exhibit 10, the calculatedapproximate removal was 13,272 lbs of chlorinated VOCs, which includes 4,235 lbs ofTCE and 6,231 lbs of Freon 113.
COST (2004 DOLLARS)
The remediation contractor was paid $4.634 million to remediate 48,455 cubic yards, or$95.64 per cubic yard. This project was performed in Florida and was impacted by threehurricanes during the 2004 hurricane season. The project was also shut down for tenhours due to missile and shuttle launches. These facts resulted in delays, the cost of whichis included in the $4.634 million. The cost for the time lost due to both causes is$284,731. This reduces the actual cost of construction to $4.349 million, or $89.76 percubic yard. The $89.76 did not include any project oversight management or cost of theextensive analytical effort.
CONCLUSIONS
Based on field studies, it has been shown that the in situ thermal removal rate of TCE andother chlorinated VOCs from soil during thermal treatment using LDAs can be expressedas pseudo first-order. This fact explains the long remediation times required to achieve98 percent or more removal by thermal treatment. It has also been shown that theremoval rate of TCE and other chlorinated VOCs from soil by ZVI is also pseudofirst-order and the iron is reactive for over one month and perhaps longer. Using thepseudo first-order removal rates obtained from field studies, an estimate of the cost oftreatment of a TCE DNAPL site using the combined thermal and ZVI treatment wasobtained and compared with the cost of thermal treatment alone. The combined approachwas shown to cost about 57 percent of the thermal treatment alone. This result was thenapplied to an actual site remediation at Cape Canaveral Air Force Station in 2004 (see theCase Study section). The estimated cost of the construction part using the combinedremediation was $92.90 per cubic yard. The actual construction cost was $89.76 percubic yard for a 48,455-cubic-yard site. The close agreement between the estimate andactual cost demonstrates the usefulness of the approach and its application to real projects.
c© 2010 Wiley Periodicals, Inc. Remediation DOI: 10.1002.rem 23
Combined Thermal and Zero-Valent Iron In Situ Soil Mixing Remediation Technology
For the depths that were treated, the LDA soil mixing using hot air and steamfollowed by ZVI had an average removal efficiency of 99.8 percent of the TCE andchlorinated VOCs from both the soil and groundwater at SLC-15 at the Cape CanaveralAir Force Station, using the quantification limit as the best value. In most cases, theposttreatment analyses were nondetect at the method quantification limit of 0.1 mg/kgfor soil and 0.001 mg/L for water, suggesting close to complete removal. Over95 percent of the results met the Florida groundwater target cleanup levels (GTCLs) andsoil target cleanup levels (STCLs) for all COCs. The remediation appears to confirm theapproach of using combined thermal and ZVI technology to significantly improve theresults and reduce the cost of remediation of chlorinated DNAPL source zones. The99.74 percent average RE in groundwater (DPT 13 location excluded) and 99.92 percentRE in soil for TCE in the treated areas demonstrates that the remedy met the 80 percentremoval criterion required to achieve soil cleanup target levels and a groundwater cleanuptarget level of 0.005 mg/L for TCE within 68 years as stated in the CMS.
REFERENCES
BEM Systems, Inc. (2006). Remediation by In-Situ Steam and Iron Enhanced Soil Mixing Space Launch
Complex 15, Solid Waste Management Unit C030 Cape Canaveral Air Force Station, Florida. Corrective
Measures Implementation Report.
HLA. (1989, March 8). Volume I—Baseline Calibration and Testing Annex Terminal Site San Pedro, California.
HLA Job No. 4273,020.11, Joseph R. Morabito and Donald W. Quigley.
Moos, L. P. (1998, October). Optimization of soil mixing technology through metallic iron addition. Presented
at the Tenth National Technology Information Exchange (TIE) Workshop, Willowbrook, Illinois.
Novaterra, Inc. (1993). Final report to FMC, P. O. Number CA026119.
O’Shea Parsons and Associates. (1994, November 28). Field pilot demonstration of the applicability of hot
air/steam stripping for in-situ soil treatment of voc contaminated soils, Methode Plant, Harwood
Heights, Illinois. Final Report, Novaterra Inc.
U.S. Environmental Protection Agency (US EPA). (1991). Toxic treatments, in situ steam/hot-air stripping
technology. Applications Analysis Report U.S. Environmental Protection Agency, EPA/540/A5-90/008.
U.S. Environmental Protection Agency (US EPA). (1994). Chemical summary for Freon 113. Retrieved
November 2, 2009, from http://www.epa.gov/chemfact/s freon.txt
Phillip La Mori, PhD, is a senior scientist with FECC Corporation of Orlando, Florida, where he provided
technical leadership for the combined LDA thermal and ZVI remediation project at SLC-15, Cape Canaveral
AFS. He has spent the last 23 years working on the development of the LDA thermal remediation technology.
Dr. La Mori has a BS in chemistry and an MA in geology from UCLA, and a PhD in materials science from
Northwestern University. He has an MBA from Pepperdine University.
Elgin Kirkland is a project engineer with FECC Corporation of Orlando, Florida, where he was responsible
for the design, implementation, and operational procedures for the combined LDA thermal and ZVI remediation
project at SLC-15, Cape Canaveral AFS. Kirkland has a BS in electrical engineering from the Georgia Institute of
Technology.
24 Remediation DOI: 10.1002.rem c© 2010 Wiley Periodicals, Inc.
REMEDIATION Spring 2010
Harlan Faircloth is the vice president of CORE Engineering & Construction, Inc. of Winter Park, Florida. His
focus area associated with environmental remediation has been associated with chlorinated solvents, specifically
DNAPL, for the last 15 years. He is currently working on several projects funded by the U.S. Air Force. Faircloth
received his BS in civil engineering from Florida State University.
Robert Bogert is a principal engineer with HydroGeologic, Inc. in Orlando, Florida. Bogert’s focus is in the
area of groundwater remediation, with emphasis on chlorinated hydrocarbons. Bogert received his BS and MS
in environmental engineering from the University of Central Florida.
Mark Kershner is a project manager for the USAF at Cape Canaveral Air Force Station. His main objective is
to restore facilities at the installation where ground water and soil contamination has occurred through past
operational practices. Kershner received his BS and MS in biological sciences from the University of Central
Florida.
c© 2010 Wiley Periodicals, Inc. Remediation DOI: 10.1002.rem 25