combined column and cell flotation process for the treatment of pah contaminated hazardous wastes...
TRANSCRIPT
Cc
AI
a
ARRAA
KHPFSC
1
cadrrafamPPlawet
0d
Journal of Hazardous Materials 165 (2009) 394–407
Contents lists available at ScienceDirect
Journal of Hazardous Materials
journa l homepage: www.e lsev ier .com/ locate / jhazmat
ombined column and cell flotation process for the treatment of PAHontaminated hazardous wastes produced by an aluminium production plant
urélie Dhenain, Guy Mercier, Jean-Francois Blais ∗, Myriam Chartiernstitut national de la recherche scientifique (INRS-Eau Terre et Environnement), Université du Québec, 490 rue de la Couronne, Québec, Qc, Canada G1K 9A9
r t i c l e i n f o
rticle history:eceived 2 May 2008eceived in revised form 18 August 2008ccepted 6 October 2008vailable online 15 October 2008
eywords:azardous aluminium wasteAH
a b s t r a c t
The aluminium electrolytic plants generate PAH and fluoride contaminated wastes which are usuallyclassified as hazardous material. These residues are generally disposed in secure landfill sites. A flotationcell process was previously developed to remove PAH from these aluminium industry wastes. The testswere done on composite samples made of particle size fractions under 50 mm. The efficiency of theflotation cell process was demonstrated but the high quantity of concentrate produced (14.0%) during theair injection period, because of the solid entrainment, raised the treatment cost.
The aim of this study was to reduce the entrainment of fine particles in order to obtain an efficient andeconomic technology. The process initially developed was modified: the smallest particle size fraction
lotationurfactantocamidopropylhydroxysultaine (CAS)
(<0.5 mm) of the composite sample was treated in a flotation column, whereas the other particle sizefractions (0.5–50 mm) were treated in a flotation cell. The separated treatment allowed to reduce theentrainment during the air injection period of the flotation cell step from 14.0% to 10.1%. The optimum totalsolids of the pulp and cocamidopropylhydroxysultaine (CAS) concentration were 3.33% and 0.50% (w w−1)for the flotation column, and 15% and 0.25% (w w−1) for the flotation cell. This combined flotation processminimized the total entrainment which allowed a 23.6% abatement of the concentrate quantity initially
e PAH
dias
weetafiaewc
produced, and reduced th
. Introduction
The aluminium electrolytic plant wastes are classified into threeategories: atmospheric emissions, liquid effluents and solids. Thetmospheric pollutants are particles, sulphur dioxide (SO2), carbonioxide (CO2), polycyclic aromatic hydrocarbons (PAH) and fluo-inated compounds such as fluorinated hydrogen (HF), which areeleased during the anodes production, the electrolysis [1,2] and theluminium casting. The liquid wastes concern process water, usedor cooling during the metal casting and the anodes production,nd draining water. These effluents are contaminated in organicatter, aluminium, fluoride, total suspended solids, oil, grease and
AH. The solids residues are red mud with high-metal oxides [3],AH contaminated black sludge [4], spent pot linings with high-eachable toxic elements, alumina-contaminated foams, domestic
nd hazardous wastes [5]. The majority of the aluminium plantastes are treated before recycling or burring. For example, the gasmissions are treated with gas purifier, the liquid wastes are sento a wastewater plant, the spent pot linings [6] and the foams are
∗ Corresponding author. Tel.: +1 418 654 2541; fax: +1 418 654 2600.E-mail address: [email protected] (J.-F. Blais).
t
Temcwlt
304-3894/$ – see front matter © 2008 Elsevier B.V. All rights reserved.oi:10.1016/j.jhazmat.2008.10.031
concentrations of the wastes under the authorized limit of 1000 mg kg−1.© 2008 Elsevier B.V. All rights reserved.
econtaminated and recycled. The hazardous wastes are disposedn secure landfills in the United States. The management of the haz-rdous wastes remains an issue and has to be revaluated due to thecarcity of secure landfills.
A Söderberg aluminium smelter produces several hazardousastes with different sizes during the anodes production, the
lectrolysis step and the aluminium casting. These residues arequipments of primary aluminium production (crucibles, elec-rolytic cells residues, horizontal and vertical Söderberg studs,nodic pastes, sheets), starting materials (carbon, alumina, pitch),nished products (aluminium) and cleaning wastes (ventilatornd scavenger cleaning residues). PAH are ones of the pollutantsncountered in such residues due to the Söderberg technology [7,8]hich is characterized by the baking anodes inside the electrolytic
ell. The amount of PAH measured can be strongly reduced withhe prebake technology.
PAH are the results of incomplete organic matter combustion [9].hey may contain two or more fused aromatic rings without het-roatoms [10]. The USEPA has classified 16 PAH as probable human
utagens and carcinogens [11–13]. The regulatory limit for theseompounds is fixed at 1000 mg kg−1 except for the fluorantheneitch is at 10,000 mg kg−1 in the province of Quebec (Canada). The
imit for the benzo(b)fluoranthene, the benzo(j)fluoranthene andhe benzo(k)fluoranthene, is either 1000 mg kg−1 for each if they
A. Dhenain et al. / Journal of Hazardous
Nomenclature
BJK benzo(b + j + k)fluorantheneBTA waste before treatmentCAS cocamidopropylhydroxysultaineC1A concentrate of the flotation columnC1B concentrate of the flotation cellCMC critical micelle concentrationEc new composite sampleEci initial composite samplePAH polycyclic aromatic hydrocarbonsPCB polychloride biphenylR1A refuse of the flotation columnR1B refuse of the flotation cell
cc
for
wsalttfcsmEso
dcms
tactatc
tiIts
cawebb
tfisstc
ttTtfmTbte
2
2
arearrc
ts8
2
dwr
2.3. Flotation column
The flotation column used measures 135 cm high with a 5 cminside diameter. The column bottom was conical and containedan air sparger. A stirrer with five blades connected to a Caframo
Table 1Cocamidopropylhydroxysultaine (CAS) properties.
Physical and chemical properties
FormulaMW (g mol−1) 436pH 6.5–8.0
TS total solidsUSEPA United States Environmental Protection Agency
an be analysed separately or 1000 mg kg−1 for the sum of theseompounds.
In the aluminium industry, PAH are produced during the trans-ormation of alumina in aluminium in the electrolytic horizontalr vertical Söderberg stud cells [14]. More precisely, PAH are theesults of anodes burnings made of coal tar pitch and coke.
In order to characterize and study the hazardous aluminiumastes, Bongo et al. [5] crushed and screened each kind of wastes
ampled in six particle size fractions: <0.5, 0.5–1, 1–2, 2–8, 8–50,nd >50 mm. PAH are concentrated in the particle size fractionsower than 50 mm. The highest concentrations were measured inhe ventilator (2100 mg kg−1 for BJK in the 0.5–1 mm size frac-ion) and scavenger (2500 mg kg−1 for BJK in the 2–8 mm sizeraction) cleaning residues [5]. The >50 mm size fraction was notontaminated by PAH so Bongo et al. [15] worked on a compositeample made of the five lowest size fractions to develop a treat-ent process in order to eliminate the PAH. This composite, named
c, had a total PAH concentration of 2848 ± 1059 mg kg−1, a chry-ene concentration of 565 ± 200 mg kg−1 and a BJK concentrationf 1130 ± 405 mg kg−1 [5].
The treatments of the PAH contaminated soil are based onegradation or removal methods. The degradation can be biologi-al [16–18], physical [19,20], chemical [21–24] or physicochemicalethods [25]. The removal is done by leaching or flotation with
urfactant [4,5,15,26–29].Surfactants have both a hydrophilic head and a hydrophobic
ail [30,31]. They are classified as anionic, cationic, non-ionic andmphoteric. CAS is an amphoteric surfactant as it has a positiveharge on the quaternary amine group and a negative charge onhe SO3
− group. Surfactants can assemble in the bulk solution intoggregates known as micelles [29,32]. The concentration at whichhe surfactants begin to form micelles is named critical micelleoncentration (CMC) [33].
The flotation is a hydrometallurgical technique used for thereatment of inorganic (metals) or hydrophobic organic contam-nated (PAH, PCB and hydrocarbons) soils and sediments [4,34,35].t is based on the natural or activated surface properties of the par-icles and consists on air injection in order to transport out of theystem the hydrophobic and unwanted particles [36].
A flotation process using 0.25% (w w−1) of CAS was operated on aomposite sample made of several hazardous residues by Bongo et
l. [5]. This treatment allowed a yield of 66% of BJK removal, whichas sufficient to reach the regulatory limit of 1000 mg kg−1. How-ver, the implementation of this technology method is unflavoredy the high quantity of concentrate produced (14%) which shoulde managed as a hazardous waste. In order to reduce the cost of
DSFAS
Materials 165 (2009) 394–407 395
he technology and increase its acceptability, the entrainment ofne particles has to be minimized. This phenomenon allowed themallest particles to reach the concentrate during the air injectiontep of the flotation. The flotation columns are known to reducehe entrainment due to their geometry and their hydrodynamicharacteristics [37].
The purpose of this study was to determine the feasibility andhe efficiency of a separated treatment for fine particles in flota-ion column while the coarse particles are treated in flotation cell.he particle size fractions, the conditioning, the TS of the pulp andhe surfactant concentration were the parameters experimentedor the tests in the flotation column. The efficiency of the treat-
ent was based on the PAH removal and the entrainment rates.he parameters were selected in order to maximize the collisionetween the particles and the air bubbles, to avoid the sedimenta-ion, to obtain a high quality of the foam and to minimize the solidsntrainment.
. Materials and methods
.1. Aluminium hazardous wastes
The aluminium hazardous wastes were sampled in a Söderbergluminium production plant located in Québec (Canada). They wereandomly selected with a shovel on a 1 m2 surface inside differ-nt tubs outside the plant. The wastes collected were cruciblesnd electrolytic cells residues, ventilator and scavenger cleaningesidues and floor sweepings. All the wastes were preserved atoom temperature (22 ± 2 ◦C) and lightproof 20 L polypropyleneontainers.
Aluminium hazardous wastes were first characterized accordingo the procedure described by Bongo et al. [5]. The crushing andcreening had done six particle size fractions: <0.5, 0.5–1, 1–2, 2–8,–50, and >50 mm.
.2. Surfactant
The surfactant used in this study was the cocamidopropylhy-roxysultaine, usually named CAS. It’s a zwitterionic surfactanthich properties are shown in Table 1. The surfactant CAS (Chem-
on, USA) was used as received.
ensity 1.106olids (%, w w−1) 49.0–51.0ree amine (%, w w−1) 1.0 (max)mine HCl (%, w w−1) 1.0 (max)odium chloride (%, w w−1) 6.5 (max)
396 A. Dhenain et al. / Journal of Hazardou
Table 2Flotation parameters.
Parameters flotation Parameters controlled
Cell Column
Flotation apparatus geometry – –Waste particle size fraction × ×Pulp total solids × ×Mixing period
Agitation © ©Time © ©
Conditioning periodAgitation © ©Time © ©Surfactant
Nature × –Concentration × ×
Flotation periodNumber × –Air flow – –
(
maoac
2
cao
2
(nw(c(flapta0ibt
2p
tsbtapp
TP
P
H
A
P
M
C
F
BE
Agitation © ×Time × –
–) Not tested; (×) directly tested; (©) indirectly tested.
otor was used to maintain agitation. The column was feed withCole-Parmer peristaltic pump. The concentrate was recovered byverflow at the top and the refuse was bleed with a peristaltic pumpt the bottom. A washing water system was installed above theolumn.
.4. Flotation cell
Flotation was also performed in a Wemco mechanically agitatedell with a 2 L spitzkasten tank. A mixer and a diffuser mechanismllowed the air introduction and provide a 3000 rpm mixing actionn the pulp.
admrw
able 3arameters and values tests for the flotation.
arameters Bongo et al. [15] Bongo et al. [15]
azardous wasteNature Composite CompositeParticle size <8 mm <8 mm
pparatus 2 L beaker Wemco cell flotation
ulpTS (%, p p−1) 10 7/10/15/20
ixingTime (min) – –Agitation (rpm) – –
onditioningSurfactant
Nature Tw80/TrX100/CAS/BW CASConc. (%, p p−1) 0.5 0/0.1/0.2/0.25/0.5
Time (min) 60 60Agitation (rpm) – 1800
lotationNumber – 3Air flow (L min−1) – 1Time (min) – 7, 5, 2Agitation (rpm) – 1800
JK removal (%) 35 57–68ntrainment (%) – 10
s Materials 165 (2009) 394–407
.5. Column and cell flotation parameters selection
A flotation process is controlled by different parametersTable 2). In this study, some of them were voluntarilyeglected (flotation apparatus geometry, air flow rate), othersere selected on the Bongo et al. [5,15] experiences results
surfactant nature) and some were directly (surfactant con-entration, pulp TS, particle size fraction) or indirectly testedstirring intensity, residence time) (Table 3). The geometry of theotation apparatus was not evaluated because only one kind of cellnd column were available. The air flow rate during the flotationeriod could not be controlled in the cell due to the air mode injec-ion by subaeration. The air flow rate in the column was calculatedccording to the air surface flow recommended [37] fixed between.015 and 0.02 m s−1. The stirring intensity and the residence time
n the cell flotation were reduced and adjusted on the foam qualityasis visually evaluated. The selection parameters order is illus-rated by Fig. 1.
.6. Effect of the particle size fraction on the flotation columnrocess
The effect of the particle size fraction of the waste on the flota-ion process was studied using 50 g of <0.25 and <0.5 mm particleize fractions, which were mixed with 2 L of tap water in Pyrexeakers during 10 min and under a 800 rpm agitation speed. Afterhis period, 0.25% (w w−1) (50 mg) of CAS was added to the pulpnd a conditioning period of 20 min (800 rpm) was observed. Theulp was then transferred in the flotation column with a peristalticump. The stirring was maintained for 10 min under an 800 rpm
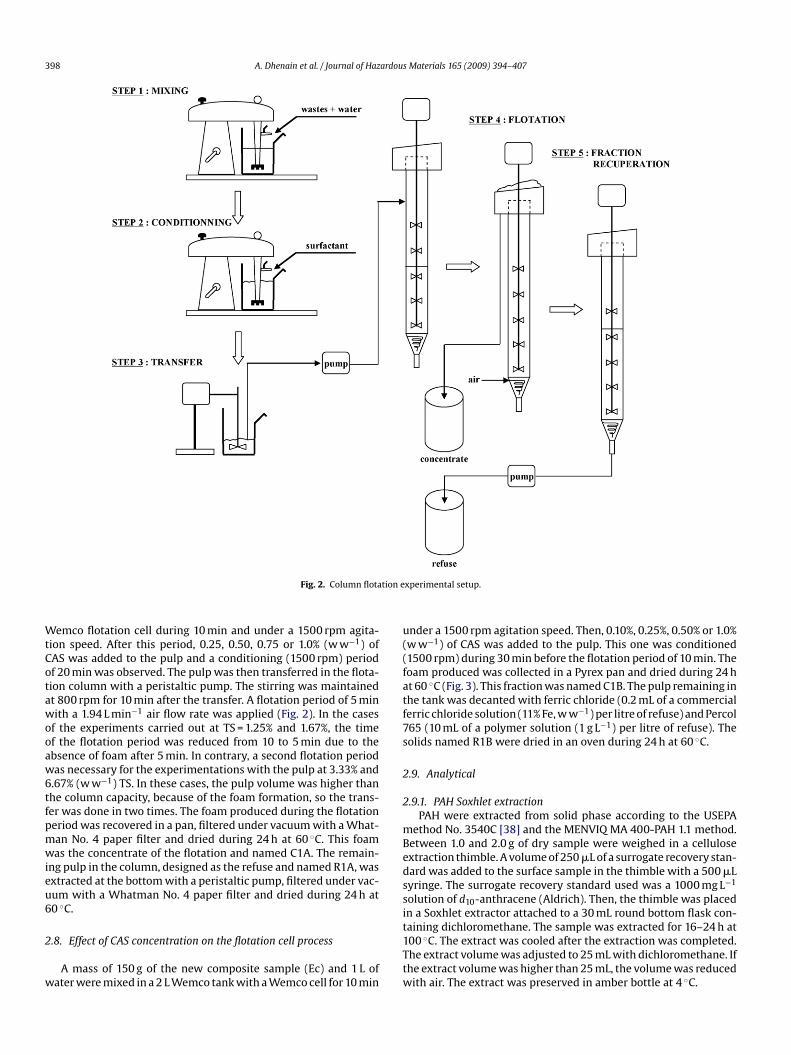
gitation speed. The conditioning period in the column allowed theegassing of the pulp and, consequently, minimized the entrain-ent. A flotation period of 10 min with a 1.94 L min−1 air flowate was operated. The foam produced during the flotation periodas recovered in a pan, filtered under vacuum with a Whatman
Bongo et al. [5] Current Current
Composite Composite Composite<50 mm <250/<500 �m 500 �m to 50 mmDenver cell flotation Column flotation Wemco cell flotation
15 1.25/1.67/3.33/6.67 15
10 10 101800 800 1500
CAS CAS CAS0.25 0.25/0.50/0.75/1.0 0.10/0.25/0.50/1.0
2 × 30 30 301800 800 1500
2 1 11 1.94 17, 5 10 101800 800 1500
47–839–18
A. Dhenain et al. / Journal of Hazardous Materials 165 (2009) 394–407 397
iment
qitdw4
2
Fig. 1. Exper
ualitative No. 4 (pore size = 20–25 �m) paper filter and dried dur-
ng 24 h at 60 ◦C in an oven. This foam was the concentrate ofhe flotation and named C1A. The remaining pulp in the column,esigned as the refuse and named R1A, was extracted at the bottomith a peristaltic pump, filtered under vacuum with a Whatman No.paper filter and dried during 24 h at 60 ◦C.p
2m
s summary.
.7. Effect of TS and CAS concentration on the flotation column
rocessThe study of the effect of TS concentration was carried out using5, 50 and 100 g of a <0.5 mm particle size fraction, which wereixed with tap water (1.5 or 2.0 L) in a 4 L Denver tank with a
398 A. Dhenain et al. / Journal of Hazardous Materials 165 (2009) 394–407
tion e
WtCotawooaw6tfpmwieu6
2
w
u((fatf7s
2
2
mBedssi
Fig. 2. Column flota
emco flotation cell during 10 min and under a 1500 rpm agita-ion speed. After this period, 0.25, 0.50, 0.75 or 1.0% (w w−1) ofAS was added to the pulp and a conditioning (1500 rpm) periodf 20 min was observed. The pulp was then transferred in the flota-ion column with a peristaltic pump. The stirring was maintainedt 800 rpm for 10 min after the transfer. A flotation period of 5 minith a 1.94 L min−1 air flow rate was applied (Fig. 2). In the cases
f the experiments carried out at TS = 1.25% and 1.67%, the timef the flotation period was reduced from 10 to 5 min due to thebsence of foam after 5 min. In contrary, a second flotation periodas necessary for the experimentations with the pulp at 3.33% and.67% (w w−1) TS. In these cases, the pulp volume was higher thanhe column capacity, because of the foam formation, so the trans-er was done in two times. The foam produced during the flotationeriod was recovered in a pan, filtered under vacuum with a What-an No. 4 paper filter and dried during 24 h at 60 ◦C. This foamas the concentrate of the flotation and named C1A. The remain-
ng pulp in the column, designed as the refuse and named R1A, wasxtracted at the bottom with a peristaltic pump, filtered under vac-um with a Whatman No. 4 paper filter and dried during 24 h at0 ◦C.
.8. Effect of CAS concentration on the flotation cell process
A mass of 150 g of the new composite sample (Ec) and 1 L ofater were mixed in a 2 L Wemco tank with a Wemco cell for 10 min
t1Ttw
xperimental setup.
nder a 1500 rpm agitation speed. Then, 0.10%, 0.25%, 0.50% or 1.0%w w−1) of CAS was added to the pulp. This one was conditioned1500 rpm) during 30 min before the flotation period of 10 min. Theoam produced was collected in a Pyrex pan and dried during 24 ht 60 ◦C (Fig. 3). This fraction was named C1B. The pulp remaining inhe tank was decanted with ferric chloride (0.2 mL of a commercialerric chloride solution (11% Fe, w w−1) per litre of refuse) and Percol65 (10 mL of a polymer solution (1 g L−1) per litre of refuse). Theolids named R1B were dried in an oven during 24 h at 60 ◦C.
.9. Analytical
.9.1. PAH Soxhlet extractionPAH were extracted from solid phase according to the USEPA
ethod No. 3540C [38] and the MENVIQ MA 400-PAH 1.1 method.etween 1.0 and 2.0 g of dry sample were weighed in a cellulosextraction thimble. A volume of 250 �L of a surrogate recovery stan-ard was added to the surface sample in the thimble with a 500 �Lyringe. The surrogate recovery standard used was a 1000 mg L−1
olution of d10-anthracene (Aldrich). Then, the thimble was placedn a Soxhlet extractor attached to a 30 mL round bottom flask con-
aining dichloromethane. The sample was extracted for 16–24 h at00 ◦C. The extract was cooled after the extraction was completed.he extract volume was adjusted to 25 mL with dichloromethane. Ifhe extract volume was higher than 25 mL, the volume was reducedith air. The extract was preserved in amber bottle at 4 ◦C.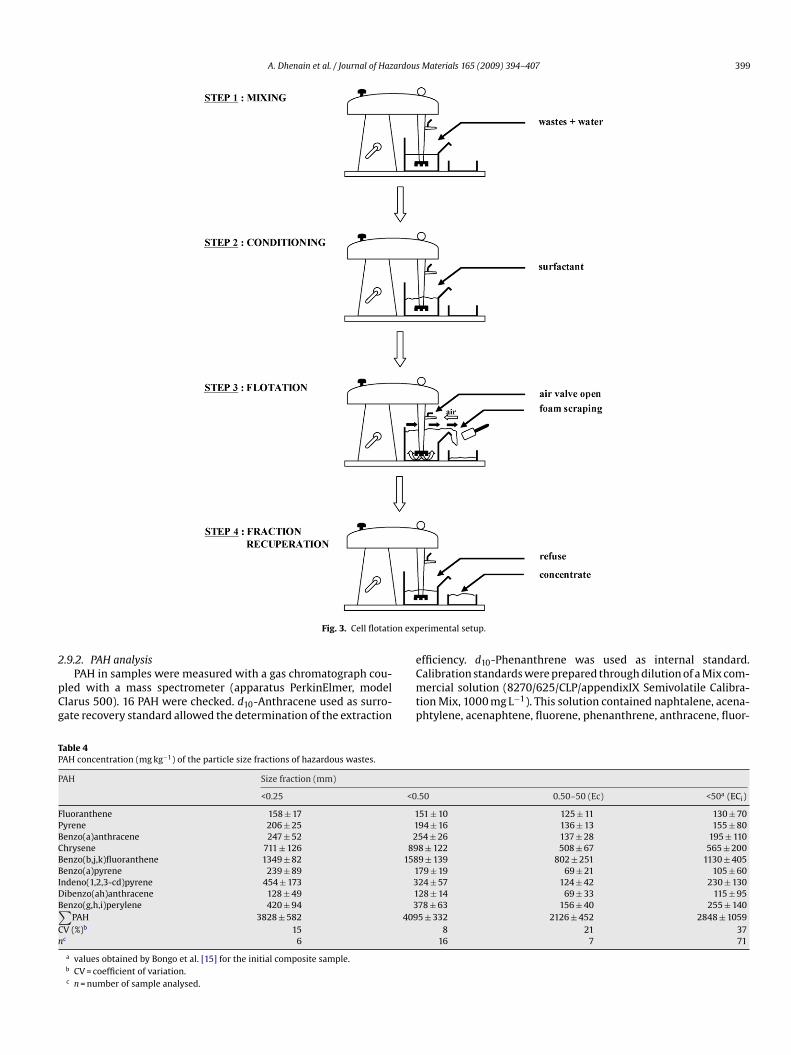
A. Dhenain et al. / Journal of Hazardous Materials 165 (2009) 394–407 399
on exp
2
pCg
TP
P
FPBCBBIDB∑
Cn
Fig. 3. Cell flotati
.9.2. PAH analysisPAH in samples were measured with a gas chromatograph cou-
led with a mass spectrometer (apparatus PerkinElmer, modellarus 500). 16 PAH were checked. d10-Anthracene used as surro-ate recovery standard allowed the determination of the extraction
eCmtp
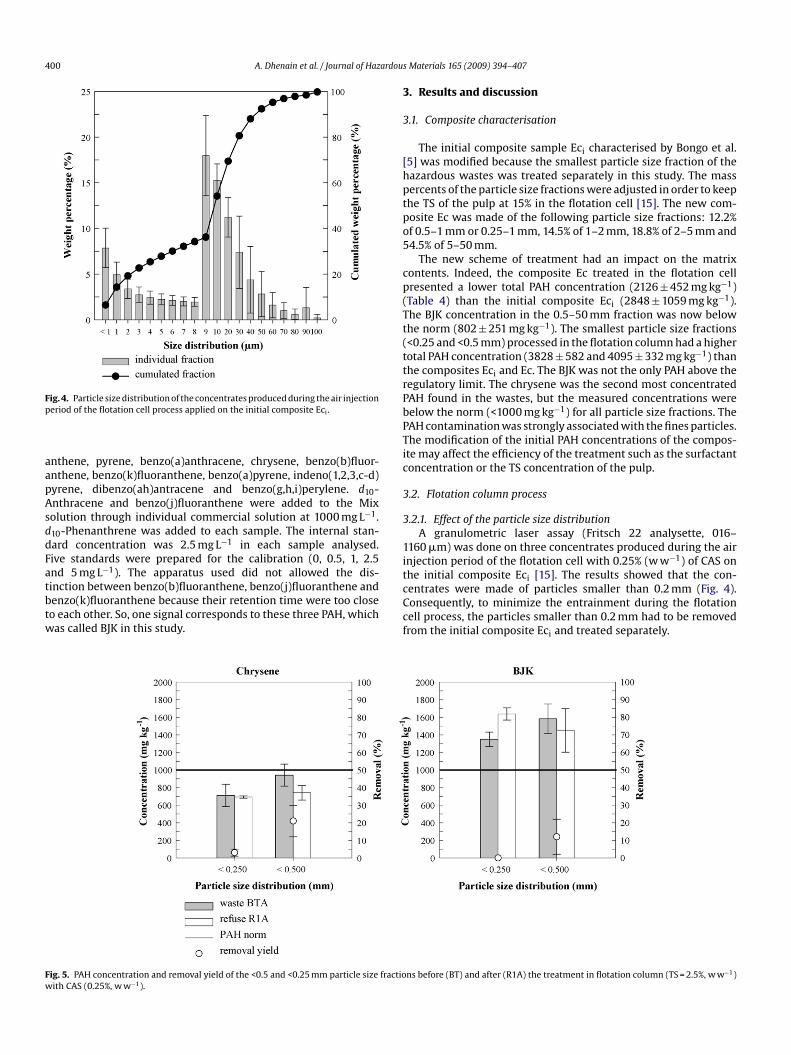
able 4AH concentration (mg kg−1) of the particle size fractions of hazardous wastes.
AH Size fraction (mm)
<0.25 <0
luoranthene 158 ± 17 1yrene 206 ± 25 1enzo(a)anthracene 247 ± 52 2hrysene 711 ± 126 89enzo(b,j,k)fluoranthene 1349 ± 82 158enzo(a)pyrene 239 ± 89 1
ndeno(1,2,3-cd)pyrene 454 ± 173 3ibenzo(ah)anthracene 128 ± 49 1enzo(g,h,i)perylene 420 ± 94 3
PAH 3828 ± 582 409V (%)b 15c 6
a values obtained by Bongo et al. [15] for the initial composite sample.b CV = coefficient of variation.c n = number of sample analysed.
erimental setup.
fficiency. d10-Phenanthrene was used as internal standard.alibration standards were prepared through dilution of a Mix com-ercial solution (8270/625/CLP/appendixIX Semivolatile Calibra-
ion Mix, 1000 mg L−1). This solution contained naphtalene, acena-htylene, acenaphtene, fluorene, phenanthrene, anthracene, fluor-
.50 0.50–50 (Ec) <50a (ECi)
51 ± 10 125 ± 11 130 ± 7094 ± 16 136 ± 13 155 ± 8054 ± 26 137 ± 28 195 ± 1108 ± 122 508 ± 67 565 ± 2009 ± 139 802 ± 251 1130 ± 40579 ± 19 69 ± 21 105 ± 6024 ± 57 124 ± 42 230 ± 13028 ± 14 69 ± 33 115 ± 9578 ± 63 156 ± 40 255 ± 1405 ± 332 2126 ± 452 2848 ± 1059
8 21 3716 7 71
400 A. Dhenain et al. / Journal of Hazardou
Fp
aapAsddFatbtw
3
3
[hptpo5
cp(Tt(ttrPbPTic
3
3
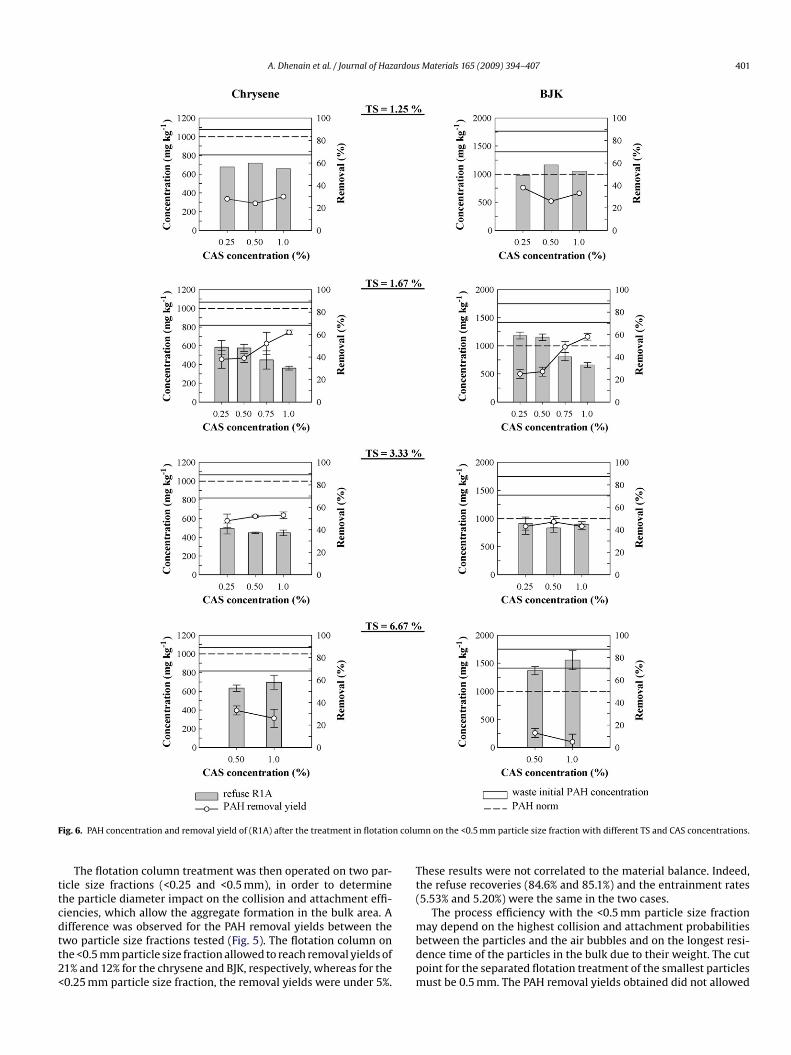
1ithe initial composite Eci [15]. The results showed that the con-centrates were made of particles smaller than 0.2 mm (Fig. 4).
Fw
ig. 4. Particle size distribution of the concentrates produced during the air injectioneriod of the flotation cell process applied on the initial composite Eci.
nthene, pyrene, benzo(a)anthracene, chrysene, benzo(b)fluor-nthene, benzo(k)fluoranthene, benzo(a)pyrene, indeno(1,2,3,c-d)yrene, dibenzo(ah)antracene and benzo(g,h,i)perylene. d10-nthracene and benzo(j)fluoranthene were added to the Mixolution through individual commercial solution at 1000 mg L−1.10-Phenanthrene was added to each sample. The internal stan-ard concentration was 2.5 mg L−1 in each sample analysed.ive standards were prepared for the calibration (0, 0.5, 1, 2.5nd 5 mg L−1). The apparatus used did not allowed the dis-inction between benzo(b)fluoranthene, benzo(j)fluoranthene and
enzo(k)fluoranthene because their retention time were too closeo each other. So, one signal corresponds to these three PAH, whichas called BJK in this study.Ccf
ig. 5. PAH concentration and removal yield of the <0.5 and <0.25 mm particle size fractioith CAS (0.25%, w w−1).
s Materials 165 (2009) 394–407
. Results and discussion
.1. Composite characterisation
The initial composite sample Eci characterised by Bongo et al.5] was modified because the smallest particle size fraction of theazardous wastes was treated separately in this study. The massercents of the particle size fractions were adjusted in order to keephe TS of the pulp at 15% in the flotation cell [15]. The new com-osite Ec was made of the following particle size fractions: 12.2%f 0.5–1 mm or 0.25–1 mm, 14.5% of 1–2 mm, 18.8% of 2–5 mm and4.5% of 5–50 mm.
The new scheme of treatment had an impact on the matrixontents. Indeed, the composite Ec treated in the flotation cellresented a lower total PAH concentration (2126 ± 452 mg kg−1)Table 4) than the initial composite Eci (2848 ± 1059 mg kg−1).he BJK concentration in the 0.5–50 mm fraction was now belowhe norm (802 ± 251 mg kg−1). The smallest particle size fractions<0.25 and <0.5 mm) processed in the flotation column had a higherotal PAH concentration (3828 ± 582 and 4095 ± 332 mg kg−1) thanhe composites Eci and Ec. The BJK was not the only PAH above theegulatory limit. The chrysene was the second most concentratedAH found in the wastes, but the measured concentrations wereelow the norm (<1000 mg kg−1) for all particle size fractions. TheAH contamination was strongly associated with the fines particles.he modification of the initial PAH concentrations of the compos-te may affect the efficiency of the treatment such as the surfactantoncentration or the TS concentration of the pulp.
.2. Flotation column process
.2.1. Effect of the particle size distributionA granulometric laser assay (Fritsch 22 analysette, 016–
160 �m) was done on three concentrates produced during the airnjection period of the flotation cell with 0.25% (w w−1) of CAS on
onsequently, to minimize the entrainment during the flotationell process, the particles smaller than 0.2 mm had to be removedrom the initial composite Eci and treated separately.
ns before (BT) and after (R1A) the treatment in flotation column (TS = 2.5%, w w−1)
A. Dhenain et al. / Journal of Hazardous Materials 165 (2009) 394–407 401
F n colu
ttcdtt2<
Tt(
ig. 6. PAH concentration and removal yield of (R1A) after the treatment in flotatio
The flotation column treatment was then operated on two par-icle size fractions (<0.25 and <0.5 mm), in order to determinehe particle diameter impact on the collision and attachment effi-iencies, which allow the aggregate formation in the bulk area. A
ifference was observed for the PAH removal yields between thewo particle size fractions tested (Fig. 5). The flotation column onhe <0.5 mm particle size fraction allowed to reach removal yields of1% and 12% for the chrysene and BJK, respectively, whereas for the0.25 mm particle size fraction, the removal yields were under 5%.mbdpm
mn on the <0.5 mm particle size fraction with different TS and CAS concentrations.
hese results were not correlated to the material balance. Indeed,he refuse recoveries (84.6% and 85.1%) and the entrainment rates5.53% and 5.20%) were the same in the two cases.
The process efficiency with the <0.5 mm particle size fraction
ay depend on the highest collision and attachment probabilitiesetween the particles and the air bubbles and on the longest resi-ence time of the particles in the bulk due to their weight. The cutoint for the separated flotation treatment of the smallest particlesust be 0.5 mm. The PAH removal yields obtained did not allowed
4 ardou
tmaptcitc
3
csTca(Bce(tTi
n
0w(rcaCTa
tletbprrsftb
02 A. Dhenain et al. / Journal of Haz
o reach the limited value of 1000 mg BJK kg−1. The conditioningethod, the TS of the pulp, the surfactant concentration and the
eration rate may have an effect on the process efficiency. Thesearameters may be optimized in order to check the feasibility ofhe treatment of the smallest particle size fraction in a flotationolumn. The mixing and conditioning of the pulp were modifiedn order to obtain good froth (foam) production. These parame-ers were adjusted for the tests on the TS of the pulp and the CASoncentration.
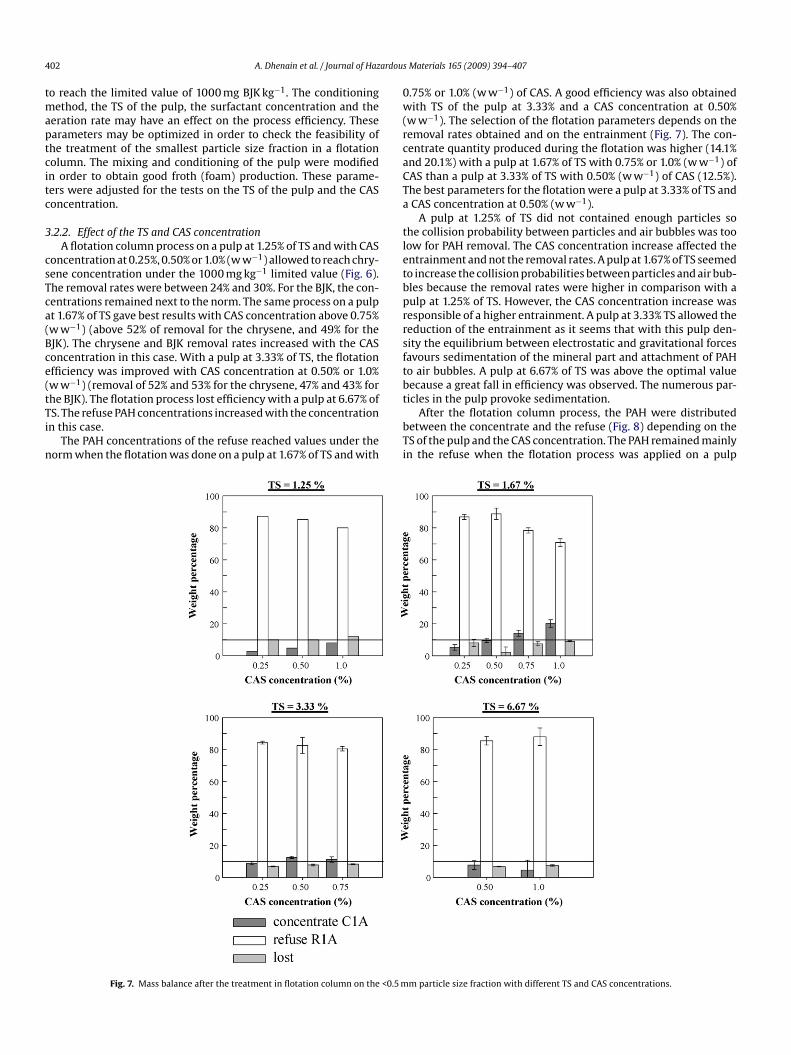
.2.2. Effect of the TS and CAS concentrationA flotation column process on a pulp at 1.25% of TS and with CAS
oncentration at 0.25%, 0.50% or 1.0% (w w−1) allowed to reach chry-ene concentration under the 1000 mg kg−1 limited value (Fig. 6).he removal rates were between 24% and 30%. For the BJK, the con-entrations remained next to the norm. The same process on a pulpt 1.67% of TS gave best results with CAS concentration above 0.75%w w−1) (above 52% of removal for the chrysene, and 49% for theJK). The chrysene and BJK removal rates increased with the CASoncentration in this case. With a pulp at 3.33% of TS, the flotationfficiency was improved with CAS concentration at 0.50% or 1.0%w w−1) (removal of 52% and 53% for the chrysene, 47% and 43% for
he BJK). The flotation process lost efficiency with a pulp at 6.67% ofS. The refuse PAH concentrations increased with the concentrationn this case.The PAH concentrations of the refuse reached values under theorm when the flotation was done on a pulp at 1.67% of TS and with
t
bTi
Fig. 7. Mass balance after the treatment in flotation column on the <0.5 m
s Materials 165 (2009) 394–407
.75% or 1.0% (w w−1) of CAS. A good efficiency was also obtainedith TS of the pulp at 3.33% and a CAS concentration at 0.50%
w w−1). The selection of the flotation parameters depends on theemoval rates obtained and on the entrainment (Fig. 7). The con-entrate quantity produced during the flotation was higher (14.1%nd 20.1%) with a pulp at 1.67% of TS with 0.75% or 1.0% (w w−1) ofAS than a pulp at 3.33% of TS with 0.50% (w w−1) of CAS (12.5%).he best parameters for the flotation were a pulp at 3.33% of TS andCAS concentration at 0.50% (w w−1).
A pulp at 1.25% of TS did not contained enough particles sohe collision probability between particles and air bubbles was tooow for PAH removal. The CAS concentration increase affected thentrainment and not the removal rates. A pulp at 1.67% of TS seemedo increase the collision probabilities between particles and air bub-les because the removal rates were higher in comparison with aulp at 1.25% of TS. However, the CAS concentration increase wasesponsible of a higher entrainment. A pulp at 3.33% TS allowed theeduction of the entrainment as it seems that with this pulp den-ity the equilibrium between electrostatic and gravitational forcesavours sedimentation of the mineral part and attachment of PAHo air bubbles. A pulp at 6.67% of TS was above the optimal valueecause a great fall in efficiency was observed. The numerous par-
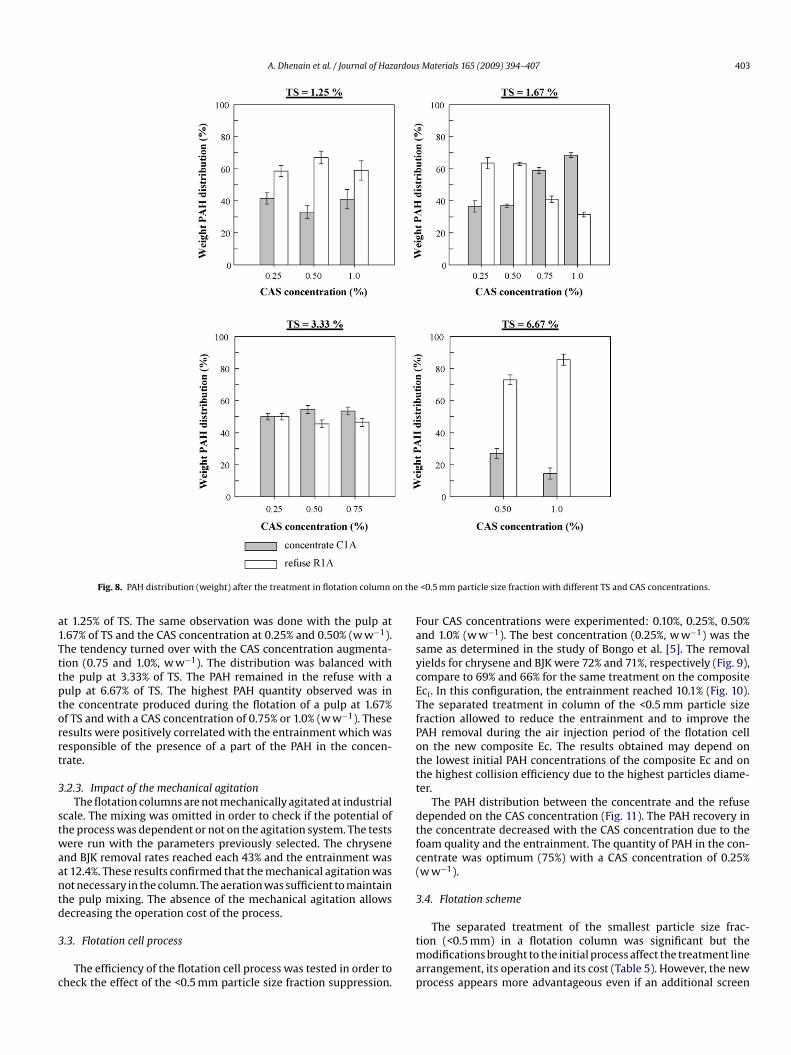
icles in the pulp provoke sedimentation.After the flotation column process, the PAH were distributedetween the concentrate and the refuse (Fig. 8) depending on theS of the pulp and the CAS concentration. The PAH remained mainlyn the refuse when the flotation process was applied on a pulp
m particle size fraction with different TS and CAS concentrations.
A. Dhenain et al. / Journal of Hazardous Materials 165 (2009) 394–407 403
n the
a1Tttptorrt
3
stwaantd
3
c
FasycETfPottt
dtfc(
3
Fig. 8. PAH distribution (weight) after the treatment in flotation column o
t 1.25% of TS. The same observation was done with the pulp at.67% of TS and the CAS concentration at 0.25% and 0.50% (w w−1).he tendency turned over with the CAS concentration augmenta-ion (0.75 and 1.0%, w w−1). The distribution was balanced withhe pulp at 3.33% of TS. The PAH remained in the refuse with aulp at 6.67% of TS. The highest PAH quantity observed was inhe concentrate produced during the flotation of a pulp at 1.67%f TS and with a CAS concentration of 0.75% or 1.0% (w w−1). Theseesults were positively correlated with the entrainment which wasesponsible of the presence of a part of the PAH in the concen-rate.
.2.3. Impact of the mechanical agitationThe flotation columns are not mechanically agitated at industrial
cale. The mixing was omitted in order to check if the potential ofhe process was dependent or not on the agitation system. The testsere run with the parameters previously selected. The chrysene
nd BJK removal rates reached each 43% and the entrainment wast 12.4%. These results confirmed that the mechanical agitation wasot necessary in the column. The aeration was sufficient to maintainhe pulp mixing. The absence of the mechanical agitation allowsecreasing the operation cost of the process.
.3. Flotation cell process
The efficiency of the flotation cell process was tested in order toheck the effect of the <0.5 mm particle size fraction suppression.
tmap
<0.5 mm particle size fraction with different TS and CAS concentrations.
our CAS concentrations were experimented: 0.10%, 0.25%, 0.50%nd 1.0% (w w−1). The best concentration (0.25%, w w−1) was theame as determined in the study of Bongo et al. [5]. The removalields for chrysene and BJK were 72% and 71%, respectively (Fig. 9),ompare to 69% and 66% for the same treatment on the compositeci. In this configuration, the entrainment reached 10.1% (Fig. 10).he separated treatment in column of the <0.5 mm particle sizeraction allowed to reduce the entrainment and to improve theAH removal during the air injection period of the flotation celln the new composite Ec. The results obtained may depend onhe lowest initial PAH concentrations of the composite Ec and onhe highest collision efficiency due to the highest particles diame-er.
The PAH distribution between the concentrate and the refuseepended on the CAS concentration (Fig. 11). The PAH recovery inhe concentrate decreased with the CAS concentration due to theoam quality and the entrainment. The quantity of PAH in the con-entrate was optimum (75%) with a CAS concentration of 0.25%w w−1).
.4. Flotation scheme
The separated treatment of the smallest particle size frac-ion (<0.5 mm) in a flotation column was significant but the
odifications brought to the initial process affect the treatment linerrangement, its operation and its cost (Table 5). However, the newrocess appears more advantageous even if an additional screen
404 A. Dhenain et al. / Journal of Hazardous Materials 165 (2009) 394–407
Table 5Advantages and disadvantages of the initial and improved processes.
Parameters Bongo process Improved process Advantage Disadvantage
1 1 2 1 + 2
Wastes preparationCrushing – – – –Screening 50 mm 50 mm 500 �m – �
Wastes treatmentApparatus Cell Cell Column – �
PulpWastes quantity (g) 150 150 50 200 �Process water (L) 1 1 1.5 2.5 �TS (%) 15 15 3.33 –
SurfactantConcentration (%) 0.25 0.25 0.50 0.31 �
MixingTime – 10 10 – �Agitation – 1500 1500 – �
ConditioningTime 60 30 20 + 10 – �Agitation 1800 1500 1500 + 800 – �
FlotationNumber 2 1 1 – �Air flow rate (L min−1) 1 1 1.94 –Time 7 and 5 10 10 – �Agitation 1800 1500 – – �
E
awsamochco(bi
cp(aacts
Fc
fficiencyBJK removal (%) 66 71Entrainment (%) 14.0 10.1
nd a flotation column are required. Indeed, several flotation cellsere initially included in the treatment line so one of them could be
ubstituted by a flotation column. Furthermore, this configurationllows a higher wastes treatment quantity per batch. The improve-ent of the flotation step was especially observed by the reduction
f the concentrate quantities produced. The combination of theolumn and the cell generated 107 kg of concentrate per tonne ofazardous wastes treated, which represented a decrease of 23.6%ompared to the 140 kg per tonne produced by the process devel-
ped by Bongo et al. [5]. The PAH removal yields were not improved46% versus 69% for the chrysene and 53% versus 66% for the BJK),ut the PAH concentrations in the refuse remained under the lim-ted value of 1000 mg kg−1 (260 mg kg−1 versus 175 mg kg−1 for the
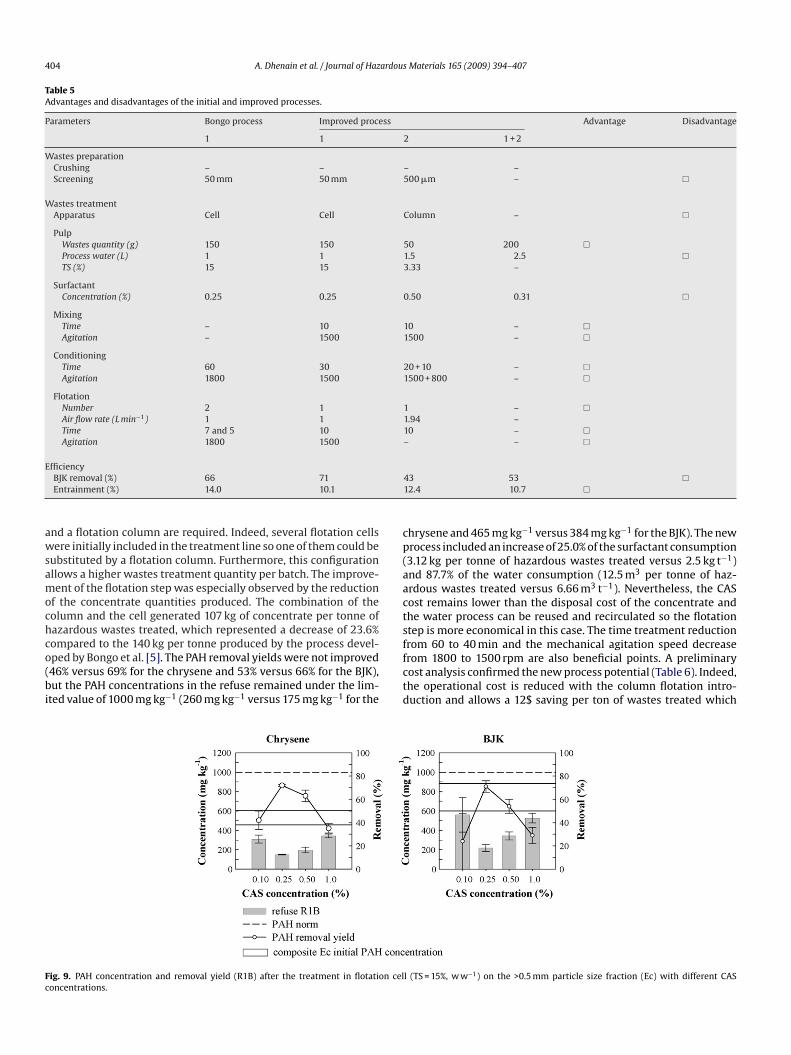
ffctd
ig. 9. PAH concentration and removal yield (R1B) after the treatment in flotation celoncentrations.
43 53 �12.4 10.7 �
hrysene and 465 mg kg−1 versus 384 mg kg−1 for the BJK). The newrocess included an increase of 25.0% of the surfactant consumption3.12 kg per tonne of hazardous wastes treated versus 2.5 kg t−1)nd 87.7% of the water consumption (12.5 m3 per tonne of haz-rdous wastes treated versus 6.66 m3 t−1). Nevertheless, the CASost remains lower than the disposal cost of the concentrate andhe water process can be reused and recirculated so the flotationtep is more economical in this case. The time treatment reduction
rom 60 to 40 min and the mechanical agitation speed decreaserom 1800 to 1500 rpm are also beneficial points. A preliminaryost analysis confirmed the new process potential (Table 6). Indeed,he operational cost is reduced with the column flotation intro-uction and allows a 12$ saving per ton of wastes treated whichl (TS = 15%, w w−1) on the >0.5 mm particle size fraction (Ec) with different CAS
A. Dhenain et al. / Journal of Hazardous Materials 165 (2009) 394–407 405
Fig. 10. Mass balance after the treatment in flotation cell (TS = 15%, w w−1) on the>0.5 mm particle size fraction (Ec) with different CAS concentrations
Fw
Fig. 12. Industrial pr
ig. 11. PAH distribution (weight) after the treatment in flotation cell (TS = 15%,w−1) on the >0.5 mm particle size fraction (Ec) with different CAS concentrations.
ocess scheme.
406 A. Dhenain et al. / Journal of Hazardou
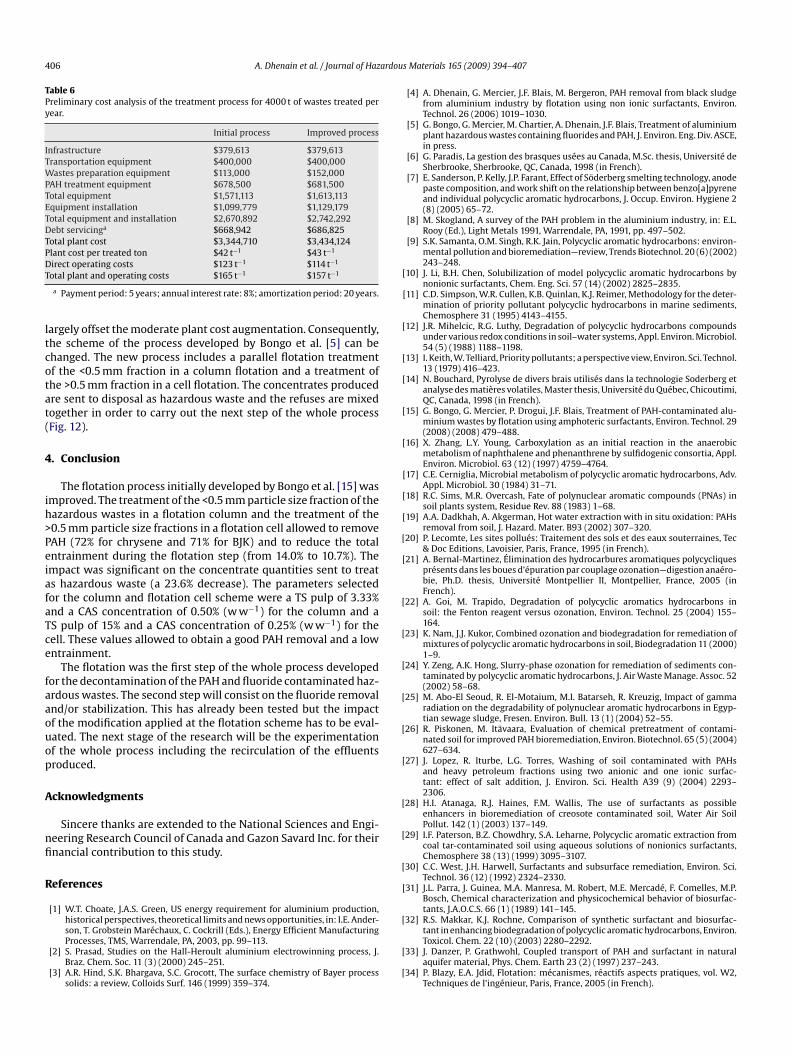
Table 6Preliminary cost analysis of the treatment process for 4000 t of wastes treated peryear.
Initial process Improved process
Infrastructure $379,613 $379,613Transportation equipment $400,000 $400,000Wastes preparation equipment $113,000 $152,000PAH treatment equipment $678,500 $681,500Total equipment $1,571,113 $1,613,113Equipment installation $1,099,779 $1,129,179Total equipment and installation $2,670,892 $2,742,292Debt servicinga $668,942 $686,825Total plant cost $3,344,710 $3,434,124Plant cost per treated ton $42 t−1 $43 t−1
DT
ltcotat(
4
ih>PeiafaTce
faaouop
A
nfi
R
[
[
[
[
[
[
[
[
[
[
[
[
[
[
[
[
[
[
[
[
[
[
[
irect operating costs $123 t−1 $114 t−1
otal plant and operating costs $165 t−1 $157 t−1
a Payment period: 5 years; annual interest rate: 8%; amortization period: 20 years.
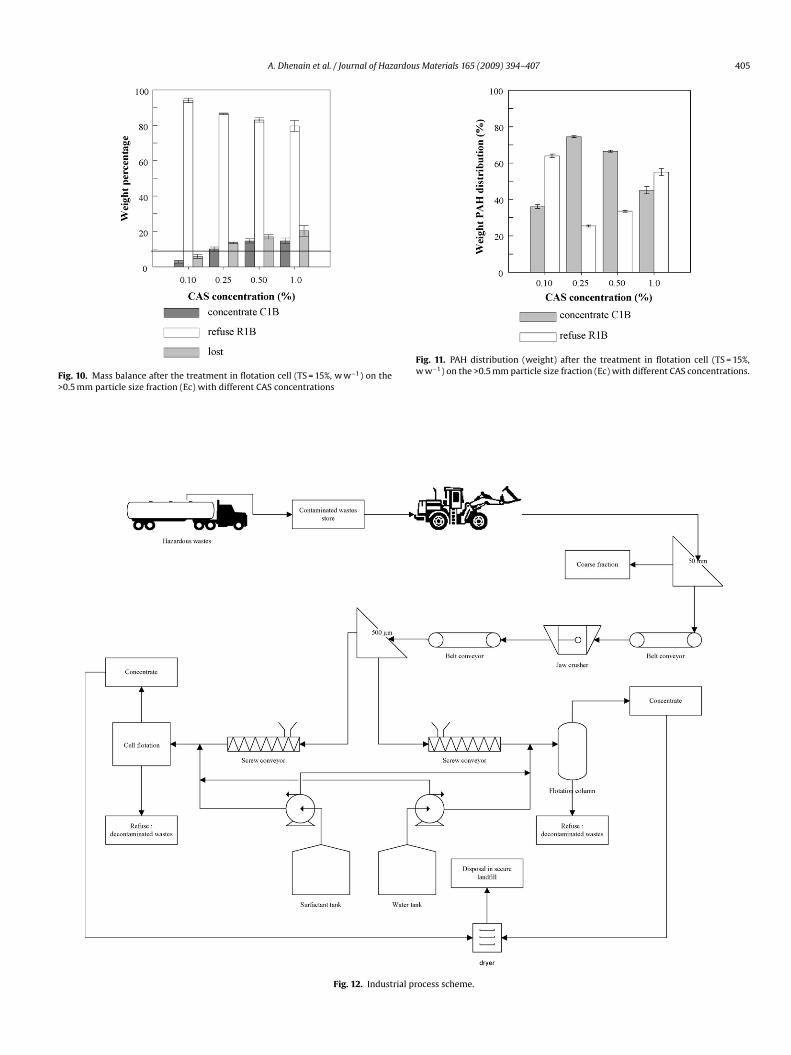
argely offset the moderate plant cost augmentation. Consequently,he scheme of the process developed by Bongo et al. [5] can behanged. The new process includes a parallel flotation treatmentf the <0.5 mm fraction in a column flotation and a treatment ofhe >0.5 mm fraction in a cell flotation. The concentrates producedre sent to disposal as hazardous waste and the refuses are mixedogether in order to carry out the next step of the whole processFig. 12).
. Conclusion
The flotation process initially developed by Bongo et al. [15] wasmproved. The treatment of the <0.5 mm particle size fraction of theazardous wastes in a flotation column and the treatment of the0.5 mm particle size fractions in a flotation cell allowed to removeAH (72% for chrysene and 71% for BJK) and to reduce the totalntrainment during the flotation step (from 14.0% to 10.7%). Thempact was significant on the concentrate quantities sent to treats hazardous waste (a 23.6% decrease). The parameters selectedor the column and flotation cell scheme were a TS pulp of 3.33%nd a CAS concentration of 0.50% (w w−1) for the column and aS pulp of 15% and a CAS concentration of 0.25% (w w−1) for theell. These values allowed to obtain a good PAH removal and a lowntrainment.
The flotation was the first step of the whole process developedor the decontamination of the PAH and fluoride contaminated haz-rdous wastes. The second step will consist on the fluoride removalnd/or stabilization. This has already been tested but the impactf the modification applied at the flotation scheme has to be eval-ated. The next stage of the research will be the experimentationf the whole process including the recirculation of the effluentsroduced.
cknowledgments
Sincere thanks are extended to the National Sciences and Engi-eering Research Council of Canada and Gazon Savard Inc. for theirnancial contribution to this study.
eferences
[1] W.T. Choate, J.A.S. Green, US energy requirement for aluminium production,historical perspectives, theoretical limits and news opportunities, in: I.E. Ander-
son, T. Grobstein Maréchaux, C. Cockrill (Eds.), Energy Efficient ManufacturingProcesses, TMS, Warrendale, PA, 2003, pp. 99–113.[2] S. Prasad, Studies on the Hall-Heroult aluminium electrowinning process, J.Braz. Chem. Soc. 11 (3) (2000) 245–251.
[3] A.R. Hind, S.K. Bhargava, S.C. Grocott, The surface chemistry of Bayer processsolids: a review, Colloids Surf. 146 (1999) 359–374.
[
[
s Materials 165 (2009) 394–407
[4] A. Dhenain, G. Mercier, J.F. Blais, M. Bergeron, PAH removal from black sludgefrom aluminium industry by flotation using non ionic surfactants, Environ.Technol. 26 (2006) 1019–1030.
[5] G. Bongo, G. Mercier, M. Chartier, A. Dhenain, J.F. Blais, Treatment of aluminiumplant hazardous wastes containing fluorides and PAH, J. Environ. Eng. Div. ASCE,in press.
[6] G. Paradis, La gestion des brasques usées au Canada, M.Sc. thesis, Université deSherbrooke, Sherbrooke, QC, Canada, 1998 (in French).
[7] E. Sanderson, P. Kelly, J.P. Farant, Effect of Söderberg smelting technology, anodepaste composition, and work shift on the relationship between benzo[a]pyreneand individual polycyclic aromatic hydrocarbons, J. Occup. Environ. Hygiene 2(8) (2005) 65–72.
[8] M. Skogland, A survey of the PAH problem in the aluminium industry, in: E.L.Rooy (Ed.), Light Metals 1991, Warrendale, PA, 1991, pp. 497–502.
[9] S.K. Samanta, O.M. Singh, R.K. Jain, Polycyclic aromatic hydrocarbons: environ-mental pollution and bioremediation—review, Trends Biotechnol. 20 (6) (2002)243–248.
10] J. Li, B.H. Chen, Solubilization of model polycyclic aromatic hydrocarbons bynonionic surfactants, Chem. Eng. Sci. 57 (14) (2002) 2825–2835.
11] C.D. Simpson, W.R. Cullen, K.B. Quinlan, K.J. Reimer, Methodology for the deter-mination of priority pollutant polycyclic hydrocarbons in marine sediments,Chemosphere 31 (1995) 4143–4155.
12] J.R. Mihelcic, R.G. Luthy, Degradation of polycyclic hydrocarbons compoundsunder various redox conditions in soil–water systems, Appl. Environ. Microbiol.54 (5) (1988) 1188–1198.
13] I. Keith, W. Telliard, Priority pollutants; a perspective view, Environ. Sci. Technol.13 (1979) 416–423.
14] N. Bouchard, Pyrolyse de divers brais utilisés dans la technologie Soderberg etanalyse des matières volatiles, Master thesis, Université du Québec, Chicoutimi,QC, Canada, 1998 (in French).
15] G. Bongo, G. Mercier, P. Drogui, J.F. Blais, Treatment of PAH-contaminated alu-minium wastes by flotation using amphoteric surfactants, Environ. Technol. 29(2008) (2008) 479–488.
16] X. Zhang, L.Y. Young, Carboxylation as an initial reaction in the anaerobicmetabolism of naphthalene and phenanthrene by sulfidogenic consortia, Appl.Environ. Microbiol. 63 (12) (1997) 4759–4764.
17] C.E. Cerniglia, Microbial metabolism of polycyclic aromatic hydrocarbons, Adv.Appl. Microbiol. 30 (1984) 31–71.
18] R.C. Sims, M.R. Overcash, Fate of polynuclear aromatic compounds (PNAs) insoil plants system, Residue Rev. 88 (1983) 1–68.
19] A.A. Dadkhah, A. Akgerman, Hot water extraction with in situ oxidation: PAHsremoval from soil, J. Hazard. Mater. B93 (2002) 307–320.
20] P. Lecomte, Les sites pollués: Traitement des sols et des eaux souterraines, Tec& Doc Editions, Lavoisier, Paris, France, 1995 (in French).
21] A. Bernal-Martinez, Élimination des hydrocarbures aromatiques polycycliquesprésents dans les boues d’épuration par couplage ozonation—digestion anaéro-bie, Ph.D. thesis, Université Montpellier II, Montpellier, France, 2005 (inFrench).
22] A. Goi, M. Trapido, Degradation of polycyclic aromatics hydrocarbons insoil: the Fenton reagent versus ozonation, Environ. Technol. 25 (2004) 155–164.
23] K. Nam, J.J. Kukor, Combined ozonation and biodegradation for remediation ofmixtures of polycyclic aromatic hydrocarbons in soil, Biodegradation 11 (2000)1–9.
24] Y. Zeng, A.K. Hong, Slurry-phase ozonation for remediation of sediments con-taminated by polycyclic aromatic hydrocarbons, J. Air Waste Manage. Assoc. 52(2002) 58–68.
25] M. Abo-El Seoud, R. El-Motaium, M.I. Batarseh, R. Kreuzig, Impact of gammaradiation on the degradability of polynuclear aromatic hydrocarbons in Egyp-tian sewage sludge, Fresen. Environ. Bull. 13 (1) (2004) 52–55.
26] R. Piskonen, M. Itävaara, Evaluation of chemical pretreatment of contami-nated soil for improved PAH bioremediation, Environ. Biotechnol. 65 (5) (2004)627–634.
27] J. Lopez, R. Iturbe, L.G. Torres, Washing of soil contaminated with PAHsand heavy petroleum fractions using two anionic and one ionic surfac-tant: effect of salt addition, J. Environ. Sci. Health A39 (9) (2004) 2293–2306.
28] H.I. Atanaga, R.J. Haines, F.M. Wallis, The use of surfactants as possibleenhancers in bioremediation of creosote contaminated soil, Water Air SoilPollut. 142 (1) (2003) 137–149.
29] I.F. Paterson, B.Z. Chowdhry, S.A. Leharne, Polycyclic aromatic extraction fromcoal tar-contaminated soil using aqueous solutions of nonionics surfactants,Chemosphere 38 (13) (1999) 3095–3107.
30] C.C. West, J.H. Harwell, Surfactants and subsurface remediation, Environ. Sci.Technol. 36 (12) (1992) 2324–2330.
31] J.L. Parra, J. Guinea, M.A. Manresa, M. Robert, M.E. Mercadé, F. Comelles, M.P.Bosch, Chemical characterization and physicochemical behavior of biosurfac-tants, J.A.O.C.S. 66 (1) (1989) 141–145.
32] R.S. Makkar, K.J. Rochne, Comparison of synthetic surfactant and biosurfac-
tant in enhancing biodegradation of polycyclic aromatic hydrocarbons, Environ.Toxicol. Chem. 22 (10) (2003) 2280–2292.33] J. Danzer, P. Grathwohl, Coupled transport of PAH and surfactant in naturalaquifer material, Phys. Chem. Earth 23 (2) (1997) 237–243.
34] P. Blazy, E.A. Jdid, Flotation: mécanismes, réactifs aspects pratiques, vol. W2,Techniques de l’ingénieur, Paris, France, 2005 (in French).

ardous
[
[
A. Dhenain et al. / Journal of Haz
35] M. Koné, Développement et optimisation d’un procédé ex-situ de récupérationdes hydrocarbures dans des sédiments fins et contaminés, Ph.D. thesis, INRS-Eau, Terre et Environnement, Université du Québec, Québec, QC, Canada, 2003(in French).
36] J. Rubio, M.L. Souza, R.W. Smith, Overview of flotation as a wastewater treat-ment technique, Miner. Eng. 15 (2002) 139–155.
[
[
Materials 165 (2009) 394–407 407
37] S. Bouchard, Traitement du minerai, flotation, Méthodes physiques, Le Griffond’argile, Québec, QC, Canada, 2001, 373 pp. (in French).
38] USEPA, Method 3540C: Soxhlet Extraction, in: Test Methods for Evaluating SolidWaste: Physical Methods (SW-846), 3rd ed., Update IV, Office of Solid Wasteand Emergency Response, Washington, D.C., 1996.