colombia’s efforts at achieving inclusive and sustainable ... file1 we have received very useful...
TRANSCRIPT
Final version June 23, 2008
Colombia’s Efforts at Achieving Inclusive and Sustainable Growth: The Road Traveled and the Challenges Ahead1
Roberto Steiner Irene Clavijo
Natalia Salazar
Fedesarrollo Bogotá, Colombia
June 2008
1 We have received very useful comments from Liliana Rojas-Suárez, Nora Lustig, Ernesto Stein, Felipe Botero, Mauricio Cárdenas, Mauricio Santamaria and from participants at a September, 2007 workshop held at the Center for Global Development in Washington DC.
2
Introduction At the end of the 1980s Colombia confronted a situation of low growth and an unsettled domestic security situation. In order to address these issues, a comprehensive reform effort was undertaken starting in 1990. The reform agenda comprised market-driven reforms aimed at enhancing competition and the role of the private sector as well as a vast array of institutional reforms aimed at strengthening macro stability, promoting equality of opportunities in the political and judicial arena, and broad sharing the benefits of growth across regions and individuals. In this paper we show that this ambitious reform drive proved to be very challenging, with reforms aimed at strengthening some foundations for growth actually weakening others. Restrictions from the local environment and issues of design did not allow many of the reforms to fully deliver on their promise. In particular, the benefits of having broadened opportunities through fiscal decentralization, the enhancement of social expenditure and the expansion of access to the judicial system, must be contrasted with the fiscal deterioration and the rise of macro vulnerability that ensued. Starting in 1999 three governments tackled some of the salient problems. While this effort, coupled with a supportive external environment and improved security have delivered a favorable economic outcome, challenges remain in order to further strengthen the foundations for growth. This paper will provide proposals to that effect, with emphasis on the need to remove some of the limitations imposed by the local environment, particularly those arising from a very active judicial system. 1. The road to a comprehensive reform effort During the late 1960s and 1970s, Colombia’s economic performance was strong. Between 1965 and 1979 GDP growth averaged 5.6% and inflation, though seldom in the single digits, never experienced the sharp rises typical of other Latin American countries. Prudent macro policies rather than a particularly stable external environment were behind these developments2. Growth in output per worker during 1965-79 was led by increases in total factor productivity –the former growing at an annual rate of 1.8%, the latter by 1.1% (Cárdenas, 2007). The 1960s and 1970s were also a period of political tranquility and of progress in social indicators. A 1958 power-sharing agreement between the two historical parties had brought an end to political violence, while peace and economic prosperity facilitated a decline in poverty and an improvement in income distribution3
.
Although Colombia, together with Chile, was the only other large regional economy not to be devastated by the debt crisis, performance during the 1980s was, at best, mediocre. Average growth declined to 3.4% --led by a dismal evolution of TFP, which contracted at
2 An IDB (1995) study characterized Colombia’s economic policy as the most stable among 22 regional economies. Except during a short period in the early 1980s, the fiscal deficit was always low. Until 1993, public debt had never surpassed 20% of GDP. 3 Income distribution evolved in a favorable manner during the 1960s and 1970s (Londoño 1995). Recent estimations –not strictly comparable-- suggest that it improved slightly during the 1980s.
3
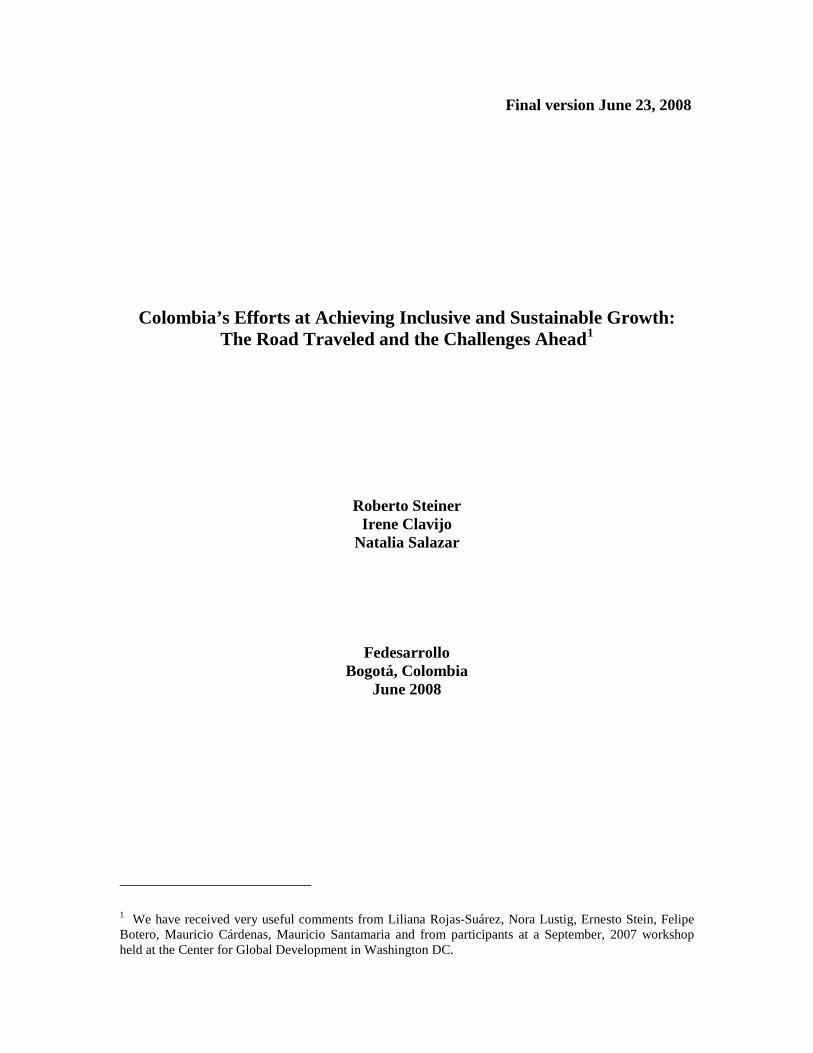
an annual rate of 1% during the decade.4 Most social indicators continued to improve, albeit at a slower pace. The salient feature of the 1980s was the deterioration in security5
.
Figure 1. Summary of Economic and Social Indicators (1970=100)
-50.0
0.0
50.0
100.0
150.0
200.0
250.0
300.0
350.0
400.0
1970-1974 1975-1979 1980-1984 1985-1889 1990-1994 1995-1999 2000-2004 2005-2007-100.0
0.0
100.0
200.0
300.0
400.0
500.0
600.0
700.0
800.0
Growth/1 Government Spending /3 Criminality/4
Inequality /5 Poverty /6 Fiscal Deficit /2
All variables except the fiscal deficit are on the left axis 1/ For 1970-1974 annual per capìta real GDP growth averaged 4.1%. Source: DANE and BR. 2/ For 1970-1974 the Central Government deficit averaged 1.2% of GDP. Source: Ministry of Finance. 3/ For 1970-1974 Central Government spending averaged 9.8% of GDP. Source: Ministry of Finance. 4/ For 1970-1974 the homicide rate/100.000 was 20.5. Source: Cárdenas (2007) and Defensoría del Pueblo. 5/ 1971=100. For 1970-1974 the Gini coefficient averaged 0.53. Source: Londoño (1995), MERP (2006). 6/ 1973=100. For 1970-1974 poverty measured with the UBN index averaged 70.2%. Source: DNP. Figure 1 looks at four dimensions of economic and social issues --growth; public spending and fiscal deficit; poverty and inequality; and criminality -- during a stretch of time that comprises the pre-reform period, the decade following the first round of reforms, and the recent period after a second round of reforms. In a nutshell, growth
4 As part of the policy package to confront the decline in net foreign transfers that followed the Mexican crisis, throughout the 1980s the Colombian economy became increasingly distorted and closed to foreign competition. While in 1980 around 1/3 of imports were prohibited or subject to approval, by 1984 it had escalated to 99.6%. Labor market regulation was inflexible and obsolete. Restrictions and distortions were also prevalent in the financial sector. A vast array of exchange controls supported a crawling peg exchange regime, whereas FDI legislation appeared to be aimed at severing ties with the world economy. As to the tax system, it included double-taxation of distributed earnings and a broad range of exemptions. 5 Drug money emboldened the cartels and Marxist guerrilla movements. The mafia declared war when in 1982 the government began to extradite drug traffickers to the U.S. The guerrillas, who had been somewhat active in remote regions in the 1970s, became important actors during the 1980s. It was during the early 1980s that the head of the main business association coined the phrase “even though the economy is doing well, the country is doing poorly”. Towards the end of the decade this decoupling seemed untenable.
4
slows down in the 1980s while security –i.e. the homicide rate-- deteriorates markedly in the context of a slow but continuous decline in poverty. Following the first wave of reforms in the early 1990s, the fiscal situation deteriorates markedly as a result of the hike in public expenditure mandated in the 1991 Constitution. While growth does not recover, poverty continues to decline and criminality remains high. Recently, and following a second wave of reforms starting in 1999, the fiscal deficit declined sharply. This, coupled with a remarkable improvement in security and a supportive external environment, has delivered much higher economic growth. In a short period during 1990-1992 Colombia --a regional beacon of economic and political stability during the 1960s and 1970s and a country where policy continuity had been the norm-- underwent major economic, political and institutional changes (Edwards and Steiner, 2008). The comprehensive reform process was the consequence of two forces. On the economic front, the slowdown in growth and the fact that it was associated with a contraction in productivity paved the way for the introduction of pro-market reforms –including in trade, finance and labor during the second half of 1990. On the political/institutional front, in late 1990 a popularly elected Constitutional Assembly (ANC) was entrusted with re-writing a 100-year old Constitution, with the expectation that the new Constitution (CP) would enhance governance and facilitate the containment of the drug cartels and a peace agreement with guerrilla movements. Importantly, the CP significantly expanded expenditure in health and education and broadened access to the judicial system and to the political process. These measures were aimed at broadening the beneficiaries of the growth process, in order to make it more sustainable. Several analyses of the CP support the following general overview:
• It commits to a welfare state, in contrast to the market-oriented reforms being introduced at the same time. It mandates that the central government (CG) must transfer a large and growing portion of tax revenue to territorial entities (TE) in order to finance a meaningful expansion of expenditure in health and education.
• It empowered citizens, particularly by establishing the acción de tutela, an expeditious mechanism granting immediate access to the judicial system.
• The policymaking process moved from a system characterized by a powerful president to one in which sub-national governments, the Constitutional Court (CC) and the central bank key actors as well. On areas that were “hard-wired” in the CP –i.e. transfers to TEs to fund health and education-- the executive saw its discretion significantly reduced.
In terms of the CGD framework, the early 1990s reform drive attempted to affect four foundations: fostering economic and political competition, promoting equality of opportunities, sharing more broadly the benefits of growth, and protecting macroeconomic stability –particularly by granting independence to the central bank and introducing fully-funded private pension funds--, while securing property rights might have been a by-product of the pension reform. The prominence given to competition was in line with having identified lagging productivity as the factor driving the slowdown in growth during the 1980s. Likewise, promoting competition and equality of opportunities
5
in the economic, political and judicial front was a means to deal with a much deteriorated political and security situation by broadening the pool of beneficiaries from growth. During the decade that followed the launching of the reforms, the economy under-performed. The fiscal position weakened; the economy became vulnerable and volatile; poverty reduction slowed down6; income distribution worsened. While several exogenous factors play a role in explaining this turn of events,7
elements associated with the reform program aided in producing these unsatisfactory economic outcomes. When the Asian crisis hit Latin America, Colombia was in a particularly weak position which paved the way for an unprecedented output contraction which impacted the poor in a particularly strong manner. Higher rates of growth and a new positive trend in poverty reduction were achieved only recently, once fiscal imbalances began to be addressed and the security situation started to improve, in the context of a favorable external environment.
Some stylized facts with regard to the evolution of the Colombian economy since the launch of the 1990 reforms include the following:
• Performance went from exemplary in the 1970s, to mediocre in the 1980s, to very bad until recently. In 1999 Colombia saw its first economic contraction in 70 years. After 2002 growth has gone up, averaging 5.5% during 2003-2007. Estimates by Cárdenas (2007) show that during the second half of the 1990s, and contrary to what was expected following the pro-market reforms undertaken at the beginning of the decade, TFP growth was a dismal -2.7% per year. The recovery in growth that began following the second round of reforms and in the context of enhanced security and a benign international environment has been accompanied by an improvement in factor productivity, with TFP increasing at annual rate of 0.8% between 2001 and 2005 –and by significantly more in 2006-2007 according to a preliminary update of Cárdenas (2007) undertaken by Fedesarrollo.8
• Colombia is the only country among LACs largest in which during the decade following the launching of reforms growth was historically low, the fiscal balance bad and public expenditure particularly high (Sahay and Goyal 2006)
9
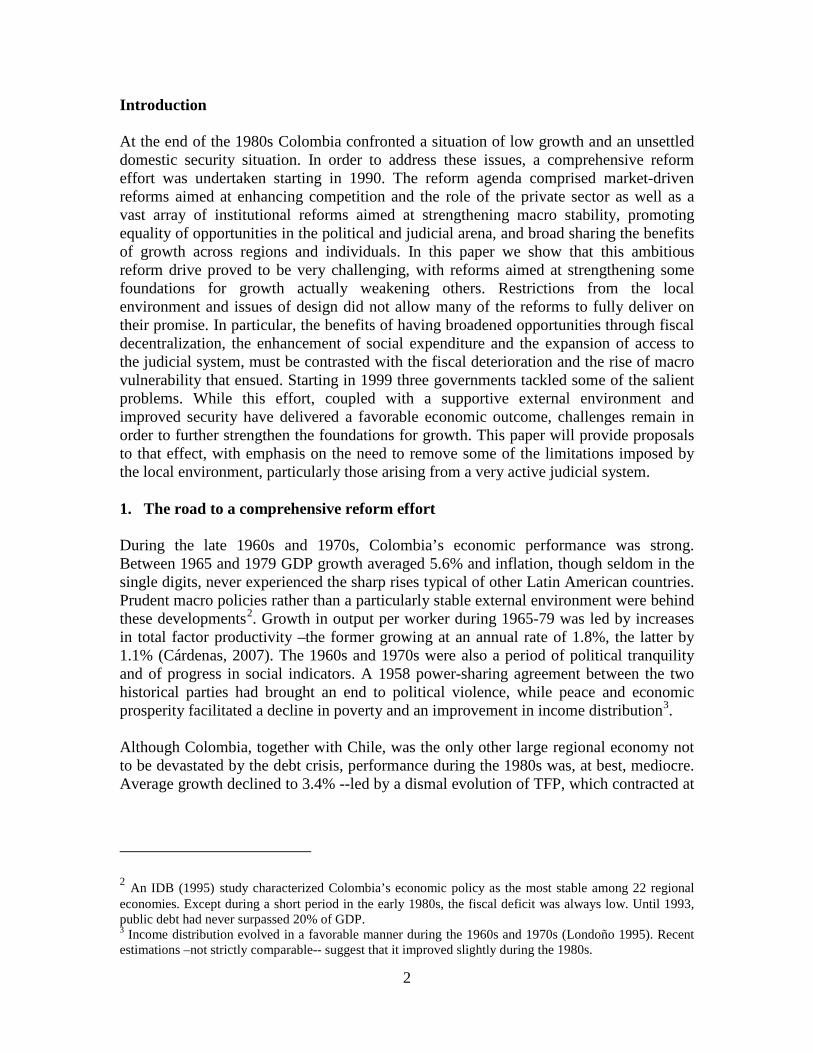
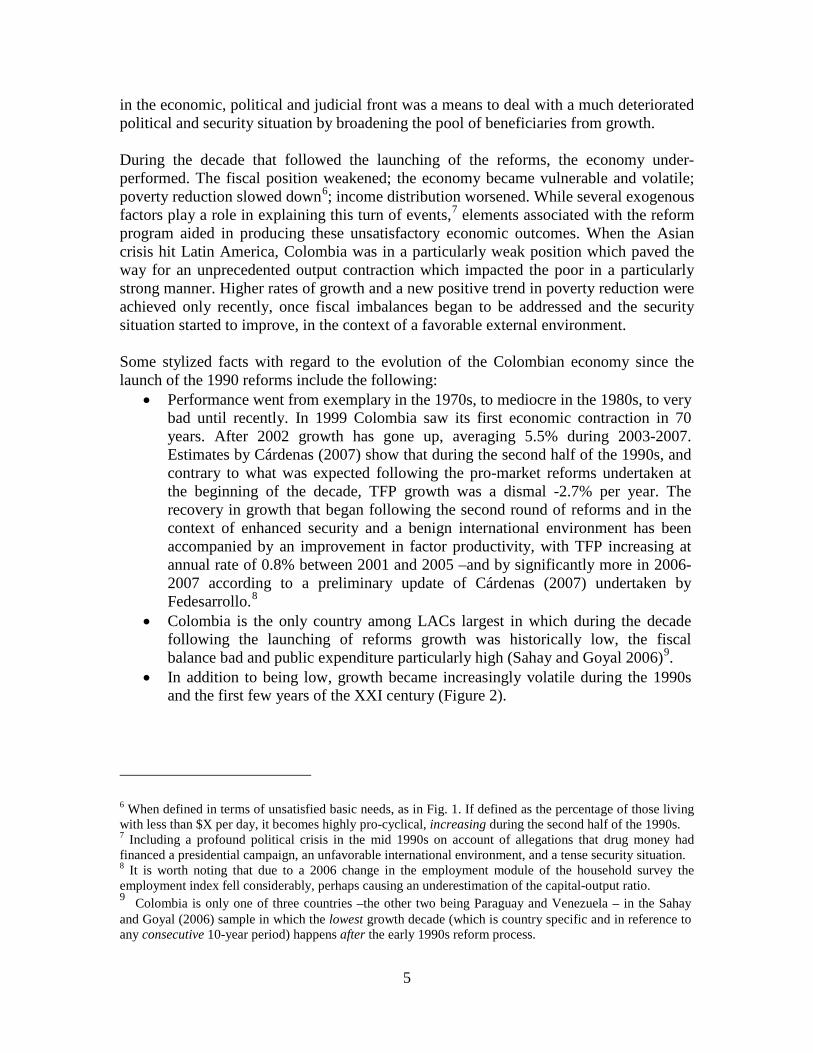
• In addition to being low, growth became increasingly volatile during the 1990s and the first few years of the XXI century (Figure 2).
.
6 When defined in terms of unsatisfied basic needs, as in Fig. 1. If defined as the percentage of those living with less than $X per day, it becomes highly pro-cyclical, increasing during the second half of the 1990s. 7 Including a profound political crisis in the mid 1990s on account of allegations that drug money had financed a presidential campaign, an unfavorable international environment, and a tense security situation. 8 It is worth noting that due to a 2006 change in the employment module of the household survey the employment index fell considerably, perhaps causing an underestimation of the capital-output ratio. 9 Colombia is only one of three countries –the other two being Paraguay and Venezuela – in the Sahay and Goyal (2006) sample in which the lowest growth decade (which is country specific and in reference to any consecutive 10-year period) happens after the early 1990s reform process.
6
Figure 2. Growth and Volatility 1/
0
1
2
3
4
5
6
7
8
1955
1958
1961
1964
1967
1970
1973
1976
1979
1982
1985
1988
1991
1994
1997
2000
2003
2006
Growth Volatility
1/ For each year, it is the average growth and average standard deviation of growth over the past five years.
• Inflation declined consistently, and now hovers at around 4-6%. • Colombia lost its tradition of a sound fiscal stance. Although the deterioration
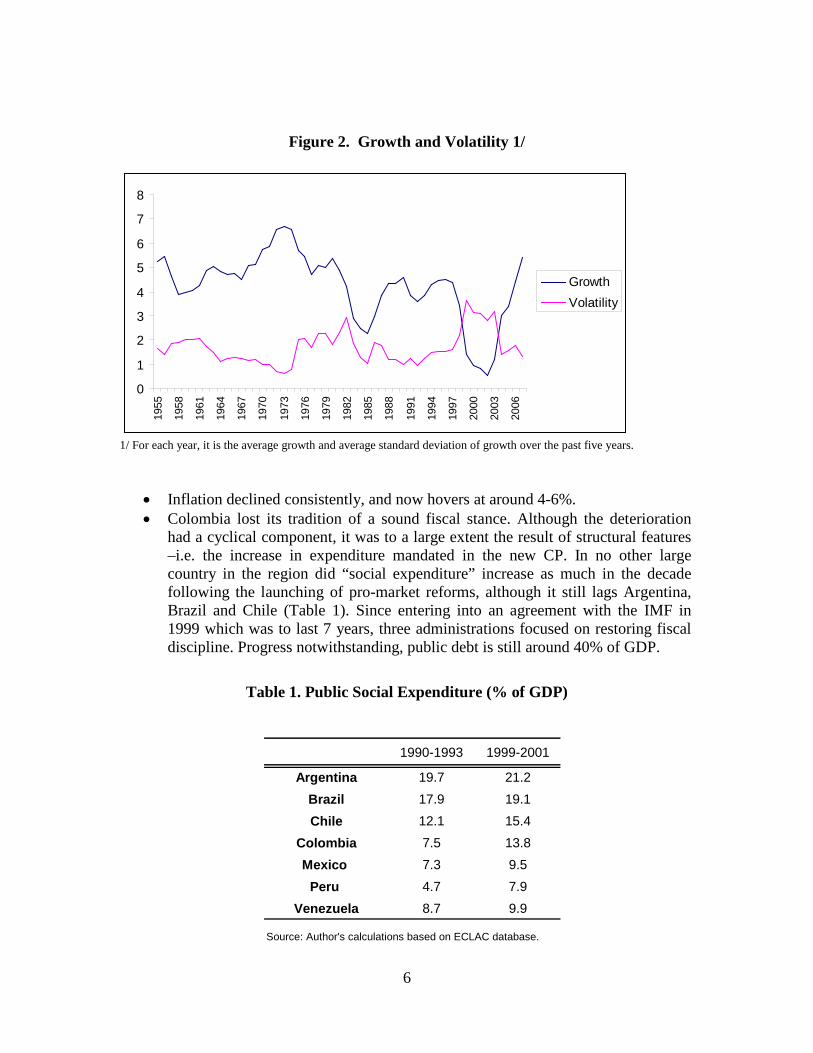
had a cyclical component, it was to a large extent the result of structural features –i.e. the increase in expenditure mandated in the new CP. In no other large country in the region did “social expenditure” increase as much in the decade following the launching of pro-market reforms, although it still lags Argentina, Brazil and Chile (Table 1). Since entering into an agreement with the IMF in 1999 which was to last 7 years, three administrations focused on restoring fiscal discipline. Progress notwithstanding, public debt is still around 40% of GDP.
Table 1. Public Social Expenditure (% of GDP)
1990-1993 1999-2001
Argentina 19.7 21.2Brazil 17.9 19.1Chile 12.1 15.4
Colombia 7.5 13.8Mexico 7.3 9.5
Peru 4.7 7.9Venezuela 8.7 9.9
Source: Author's calculations based on ECLAC database.
7
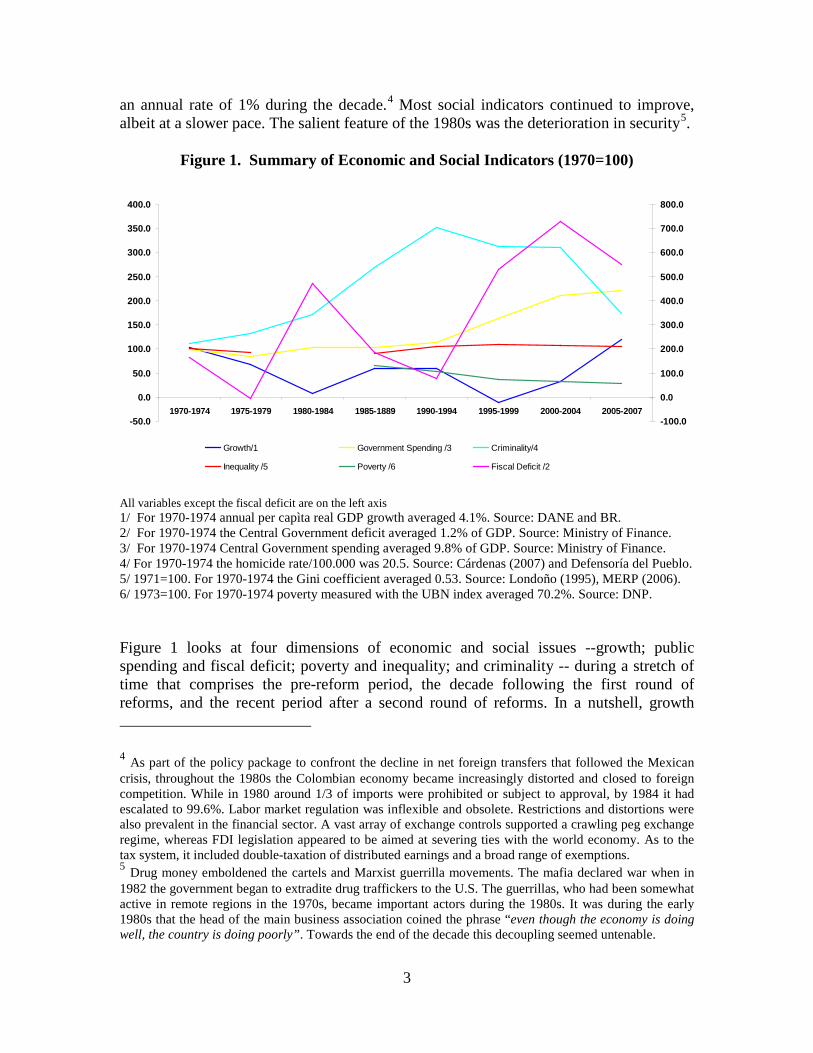
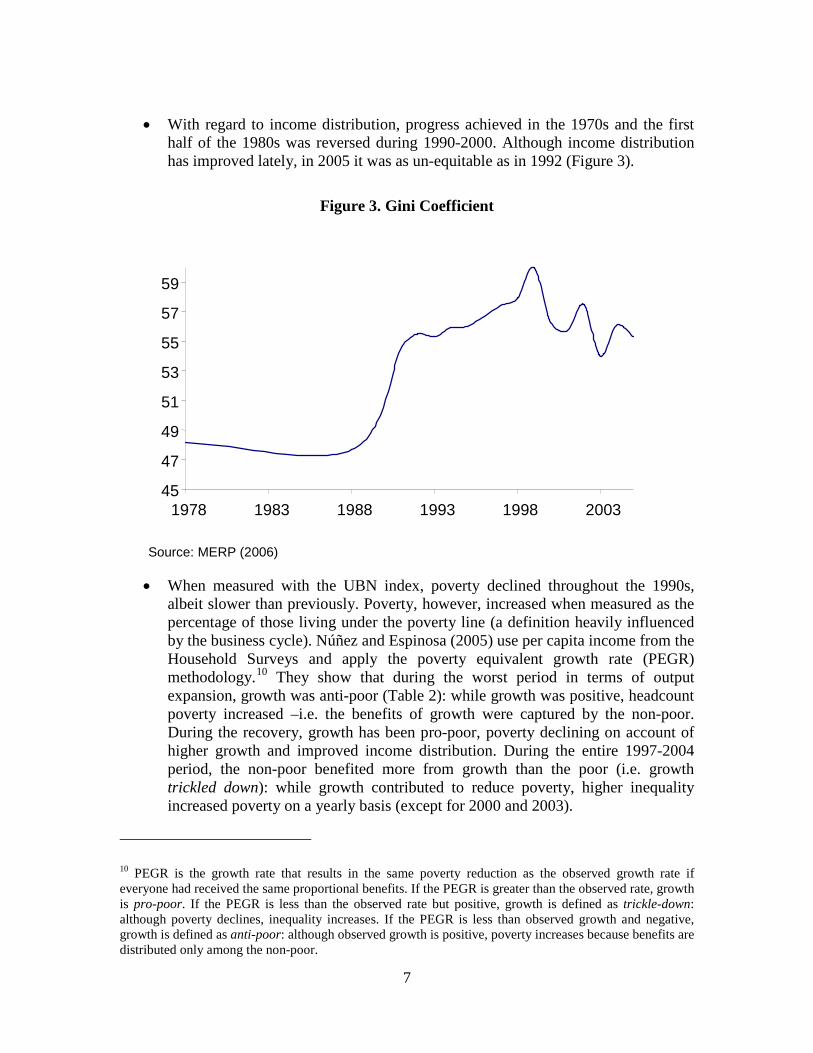
• With regard to income distribution, progress achieved in the 1970s and the first
half of the 1980s was reversed during 1990-2000. Although income distribution has improved lately, in 2005 it was as un-equitable as in 1992 (Figure 3).
Figure 3. Gini Coefficient
• When measured with the UBN index, poverty declined throughout the 1990s,
albeit slower than previously. Poverty, however, increased when measured as the percentage of those living under the poverty line (a definition heavily influenced by the business cycle). Núñez and Espinosa (2005) use per capita income from the Household Surveys and apply the poverty equivalent growth rate (PEGR) methodology.10
10 PEGR is the growth rate that results in the same poverty reduction as the observed growth rate if everyone had received the same proportional benefits. If the PEGR is greater than the observed rate, growth is pro-poor. If the PEGR is less than the observed rate but positive, growth is defined as trickle-down: although poverty declines, inequality increases. If the PEGR is less than observed growth and negative, growth is defined as anti-poor: although observed growth is positive, poverty increases because benefits are distributed only among the non-poor.
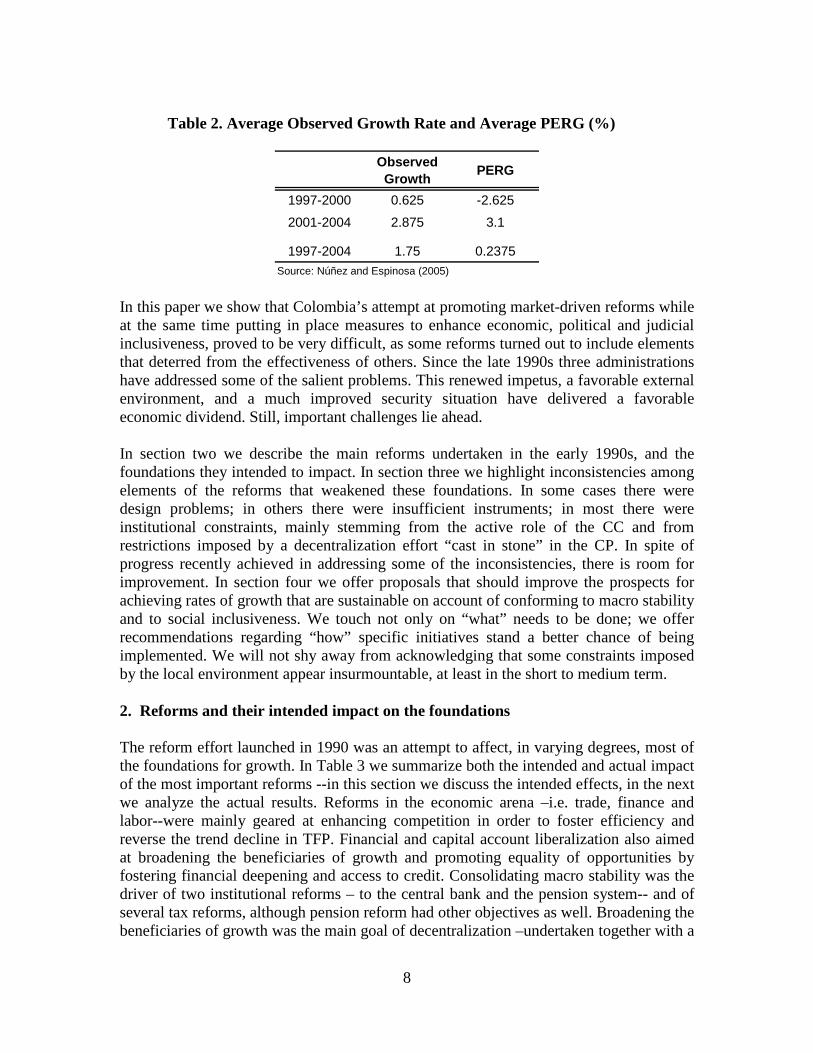
They show that during the worst period in terms of output expansion, growth was anti-poor (Table 2): while growth was positive, headcount poverty increased –i.e. the benefits of growth were captured by the non-poor. During the recovery, growth has been pro-poor, poverty declining on account of higher growth and improved income distribution. During the entire 1997-2004 period, the non-poor benefited more from growth than the poor (i.e. growth trickled down): while growth contributed to reduce poverty, higher inequality increased poverty on a yearly basis (except for 2000 and 2003).
Source: MERP (2006)
45
47
49
51
53
55
57
59
1978 1983 1988 1993 1998 2003
8
Table 2. Average Observed Growth Rate and Average PERG (%)
Observed Growth PERG
1997-2000 0.625 -2.625
2001-2004 2.875 3.1
1997-2004 1.75 0.2375Source: Núñez and Espinosa (2005)
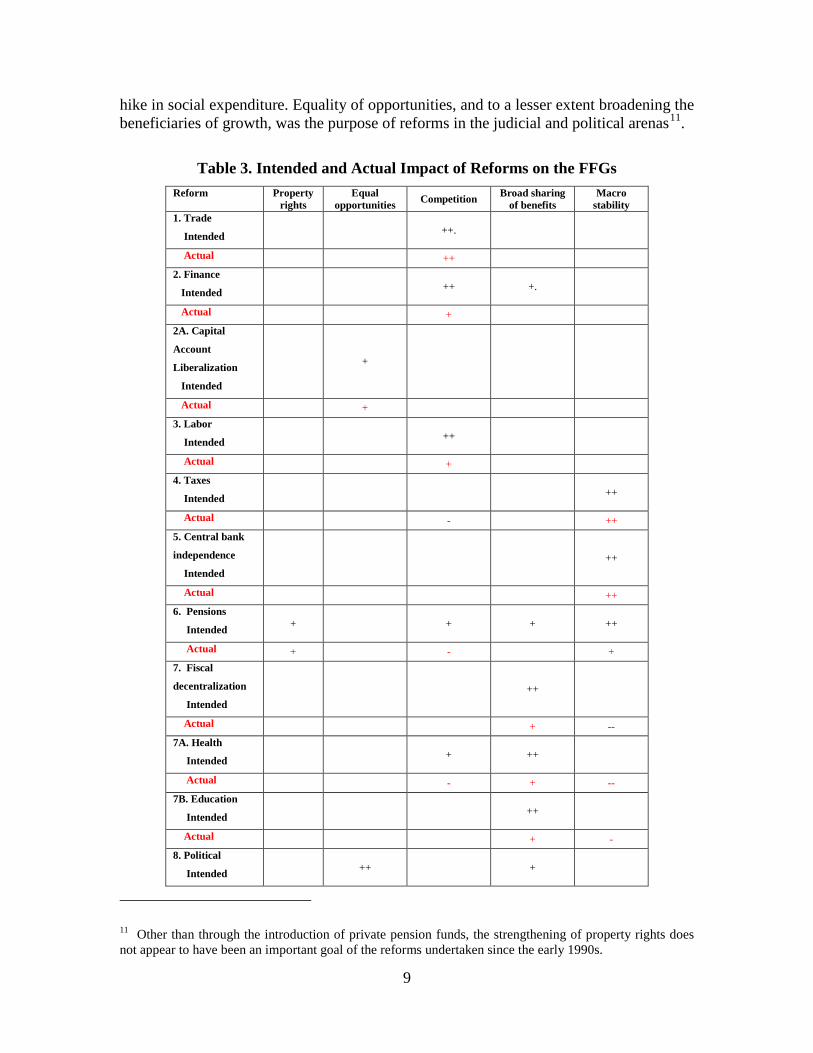
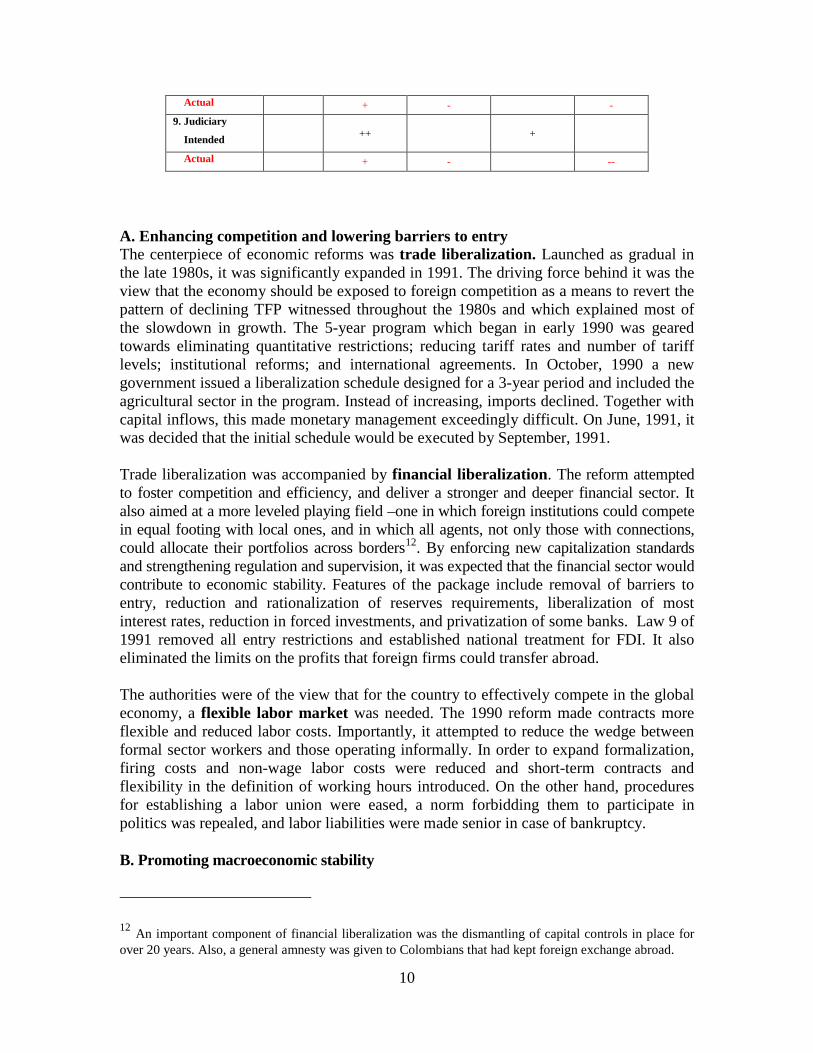
In this paper we show that Colombia’s attempt at promoting market-driven reforms while at the same time putting in place measures to enhance economic, political and judicial inclusiveness, proved to be very difficult, as some reforms turned out to include elements that deterred from the effectiveness of others. Since the late 1990s three administrations have addressed some of the salient problems. This renewed impetus, a favorable external environment, and a much improved security situation have delivered a favorable economic dividend. Still, important challenges lie ahead. In section two we describe the main reforms undertaken in the early 1990s, and the foundations they intended to impact. In section three we highlight inconsistencies among elements of the reforms that weakened these foundations. In some cases there were design problems; in others there were insufficient instruments; in most there were institutional constraints, mainly stemming from the active role of the CC and from restrictions imposed by a decentralization effort “cast in stone” in the CP. In spite of progress recently achieved in addressing some of the inconsistencies, there is room for improvement. In section four we offer proposals that should improve the prospects for achieving rates of growth that are sustainable on account of conforming to macro stability and to social inclusiveness. We touch not only on “what” needs to be done; we offer recommendations regarding “how” specific initiatives stand a better chance of being implemented. We will not shy away from acknowledging that some constraints imposed by the local environment appear insurmountable, at least in the short to medium term. 2. Reforms and their intended impact on the foundations The reform effort launched in 1990 was an attempt to affect, in varying degrees, most of the foundations for growth. In Table 3 we summarize both the intended and actual impact of the most important reforms --in this section we discuss the intended effects, in the next we analyze the actual results. Reforms in the economic arena –i.e. trade, finance and labor--were mainly geared at enhancing competition in order to foster efficiency and reverse the trend decline in TFP. Financial and capital account liberalization also aimed at broadening the beneficiaries of growth and promoting equality of opportunities by fostering financial deepening and access to credit. Consolidating macro stability was the driver of two institutional reforms – to the central bank and the pension system-- and of several tax reforms, although pension reform had other objectives as well. Broadening the beneficiaries of growth was the main goal of decentralization –undertaken together with a
9
hike in social expenditure. Equality of opportunities, and to a lesser extent broadening the beneficiaries of growth, was the purpose of reforms in the judicial and political arenas11
.
Table 3. Intended and Actual Impact of Reforms on the FFGs Reform Property
rights Equal
opportunities Competition Broad sharing of benefits
Macro stability
1. Trade
Intended ++.
Actual ++ 2. Finance
Intended ++ +.
Actual + 2A. Capital
Account
Liberalization
Intended
+
Actual + 3. Labor
Intended ++
Actual + 4. Taxes
Intended ++
Actual - ++ 5. Central bank
independence
Intended ++
Actual ++ 6. Pensions
Intended + + + ++
Actual + - + 7. Fiscal
decentralization
Intended ++
Actual + -- 7A. Health
Intended + ++
Actual - + -- 7B. Education
Intended ++
Actual + - 8. Political
Intended ++ +
11 Other than through the introduction of private pension funds, the strengthening of property rights does not appear to have been an important goal of the reforms undertaken since the early 1990s.
10
Actual + - - 9. Judiciary
Intended ++ +
Actual + - --
A. Enhancing competition and lowering barriers to entry The centerpiece of economic reforms was trade liberalization. Launched as gradual in the late 1980s, it was significantly expanded in 1991. The driving force behind it was the view that the economy should be exposed to foreign competition as a means to revert the pattern of declining TFP witnessed throughout the 1980s and which explained most of the slowdown in growth. The 5-year program which began in early 1990 was geared towards eliminating quantitative restrictions; reducing tariff rates and number of tariff levels; institutional reforms; and international agreements. In October, 1990 a new government issued a liberalization schedule designed for a 3-year period and included the agricultural sector in the program. Instead of increasing, imports declined. Together with capital inflows, this made monetary management exceedingly difficult. On June, 1991, it was decided that the initial schedule would be executed by September, 1991. Trade liberalization was accompanied by financial liberalization. The reform attempted to foster competition and efficiency, and deliver a stronger and deeper financial sector. It also aimed at a more leveled playing field –one in which foreign institutions could compete in equal footing with local ones, and in which all agents, not only those with connections, could allocate their portfolios across borders12
. By enforcing new capitalization standards and strengthening regulation and supervision, it was expected that the financial sector would contribute to economic stability. Features of the package include removal of barriers to entry, reduction and rationalization of reserves requirements, liberalization of most interest rates, reduction in forced investments, and privatization of some banks. Law 9 of 1991 removed all entry restrictions and established national treatment for FDI. It also eliminated the limits on the profits that foreign firms could transfer abroad.
The authorities were of the view that for the country to effectively compete in the global economy, a flexible labor market was needed. The 1990 reform made contracts more flexible and reduced labor costs. Importantly, it attempted to reduce the wedge between formal sector workers and those operating informally. In order to expand formalization, firing costs and non-wage labor costs were reduced and short-term contracts and flexibility in the definition of working hours introduced. On the other hand, procedures for establishing a labor union were eased, a norm forbidding them to participate in politics was repealed, and labor liabilities were made senior in case of bankruptcy. B. Promoting macroeconomic stability
12 An important component of financial liberalization was the dismantling of capital controls in place for over 20 years. Also, a general amnesty was given to Colombians that had kept foreign exchange abroad.
11
In order to enhance macro stability, the 1991 CP granted independence to the central bank. Its board of directors is the authority in charge of monetary, exchange rate and credit policy. It is composed of 7 members: 5 are appointed by the government for concurrent 4-year terms, but every 4 years only 2 of 5 can be replaced13
; the Minister of Finance is a member of the board, and he, together with the 5 appointed members, elect the governor for renewable 4-year terms. The bank cannot extend credit or offer guarantees to the private non-financial sector and can only extend direct credit to the government if there is a unanimous vote by its board. It must strive for a low and stable rate of inflation, in coordination with overall economic policy. In the event that other goals conflict with achieving a low and stable inflation, the bank must give priority to the latter.
Also mainly with the purpose of promoting macro stability, in 1993 the pension system underwent a major transformation. The system then in place exhibited all the limitations of a public PAYG scheme: contributions and benefits differed throughout sub-systems; huge transfers in favor of the first retirees; weak links between contributions and benefits; low coverage; inefficient administration; lack of reserves and growing fiscal transfers. The reform established a general scheme composed of two sub-systems: a public PAYG regime and an individual savings scheme with cross subsidies in private funds (AFPs). Although exclusive from one another, transfers were allowed. The system became mandatory for employees in the private and public sectors. Until it was reformed again in 2003, it was optional for the self-employed and dependents. Albeit with a long transition period, the reform increased retirement age, hiked contribution rates and times and rationalized benefits. Apart from placing the system in a more sustainable position, other objectives of the reform included introducing competition to the public fund, promoting the development of the capital market and, in the case of the 2003 reform, better targeting of subsidies. A by-product of the reform was to better secure pension rights of formal sector workers –i.e. rights are more clearly defined in individual capitalization accounts. Since the early 1990s Colombia has undergone several tax reforms. Contrary to the reform of 1986, which brought about a major improvement in the quality of the tax code, reforms undertaken since 1990 have aimed at increasing tax revenue in order to finance the increase in public expenditure which, for the most part, was mandated in the 1991 CP. C. Broad sharing of the benefits of growth and promoting equality of opportunities During the second half of the 1980s there was growing recognition that decentralization should play a major role in rebuilding trust in institutions, in the context of a critical security situation. Self-government was thought to be a means to consolidate democracy, while improving the efficiency of government intervention. The 1991 CP established the popular election of governors14
13 The tenure of a Colombian President is 4 years, and until 2005 there was no possibility for re-election.
and the ability of removing them and mayors through popular vote. With regard to fiscal issues, it increased the amount of resources transferred from the CG to territorial entities TEs –and, implicitly, from wealthier to poorer regions-- in order to ensure broad access to health and education. The CP went into surreal detail regarding the distribution of resources among government levels and expenditure categories; widened the
14 Mayors began to be elected, rather than appointed by the CG, in 1986.
12
base for calculating transfers and increased them significantly; gave local authorities the right to establish taxes; and established that income from monopolies that are the property of regions cannot be appropriated by the CG. The 1993 reform of the healthcare system was mainly geared towards broadening the beneficiaries from growth by promoting universal coverage, incorporating elements of solidarity and fairness. It also aimed at fostering competition between private and public providers, in order to enhance quality and efficiency. By changing how public hospitals are financed –through the sale of services rather than through the budget--, decentralizing their administration, and forcing them to compete with private hospitals, efficient ones should thrive, others should close. The system is based on vouchers subsidizing demand, with costs distributed between employers and employees when the insured has the ability to pay or the responsibility of the government when he does not. Solidarity stems from cross subsidies among those able to contribute, and between them and those unable to15
.
In addition to introducing the election of governors, the 1991 CP included a major political reform focused on enhancing representation, weakening the two-party system, empowering voters and shifting power away from the executive.16 The reform aimed at improving equality of opportunities, potentially aiding in the goal of broadening the beneficiaries of growth. It established that the senate would be elected in a national district on the premise that minority groups, while all but unelectable in small districts, would likely pull together the scattered votes they had in different regions17. Also, a national district should render inefficient small movements confined to a specific region that had become prevalent during the Frente Nacional period (Botero, 2000).18
15 The system operates on the basis of an insurance premium (UPC, calibrated to reflect gender, age and regional differences) and offers a standard package to the worker and his dependants. For the self employed and formal sector workers there is a contributive regime (RC), funded with a contribution from wages. Health promotion firms (EPSs) affiliate individuals and receive contributions. Contributors can choose their own EPS as well as the service provider. EPSs transfer contributions collected in excess of entitled capitation payments to a public fund (FOSYGA), or is compensated by it when contributions fall short of entitled capitation payments. To enroll in the subsidized regime (RS), individuals must come from a household in levels 1 or 2 of Sisben (a proxy means test index stratifying households into 6 levels). One-twelfth of contributions are transferred to the RS and those eligible for coverage that remain un-insured (vinculados) receive services from public hospitals or from private ones entering into contracts with TEs.
The CP lowered barriers to entry; empowered citizens to organize political parties and made it easier for voters to directly submit legislation to congress and remove elected officials. The CP assigned to congress additional legislative and control functions. Importantly, it is now much more complicated for the executive to use extraordinary powers to legislate (Ungar, 2003), and congress can now override a presidential veto with a simple majority.
16 Cárdenas et al (2006) provide a good description of how the 1991 CP redistributed power away from the executive and towards the legislative, sub-national governments, the judiciary, and the central bank. 17 Two of the 102 Senate seats were reserved to those elected in a district reserved for indigenous groups. 18 The Frente Nacional (FN) was a 1958 compromise to end civil unrest among the two historical parties. Although formally ending in 1974, many of its provisions lasted longer. During the FN, 50% of seats in congress were reserved for each party, excluding all others. Elections thus became a personal contest within parties rather than an ideological contest between them. When it FN formally ended in 1974, provisions allowing parties to present multiple lists in an election were preserved.
13
The 1991 CP promoted equality of opportunities with regard to access to the justice system. All citizens can now better claim their constitutional rights, also promoting a broadening of the pool of beneficiaries from growth. The CP enshrined the concept of an Estado Social de Derecho geared towards ensuring not only those rights labeled as “first generation” –i.e. civil liberties which are complied with by having the government act in a restrained manner— but also “second generation rights” –i.e. access to certain services, which call for positive actions by the state. While the CP defines as fundamental those rights referred to as “first generation” and as “social and economic” those of the “second”19, it established a mechanism (tutela) according to which any citizen who feels his or her rights have not been upheld can go before any judge and, if the judge rules in his or her favor, restitution is of immediate compulsory compliance20
. The highest court, the CC, has developed the principle of connectivity (principio de conexidad), according to which many rights not deemed as “fundamental” in the CP, should be treated as such –i.e. the connection established between access to healthcare and the right to life.
3. Strengthening some foundations at the expense of weakening others Table 3 shows that many of the expected effects of reforms on the foundations of growth were indeed achieved. However, in several instances --particularly in the case of decentralization of expenditure in health and education and with regard to political and judicial reform—there were also unintended consequences. Inconsistencies that became evident in the late 1990s include (i) policies that were fiscally unsustainable, notably the major expansion of expenditure in social sectors by TEs; (ii) other social policies that, financed through taxes on labor, fostered informality; (iii) reforms in the political arena geared at broadening representation, at the expense of fostering party fragmentation and increasing political transaction costs; (iv) reforms that while facilitating access to the justice system, empowered judges and made the CC a veto player in economic policy. This section highlights some problems that characterized the reform effort undertaken in the early 1990s and report on corrective measures undertaken since. Reference will be made to limitations stemming from the local environment, issues of design, and inconsistencies among elements of different reforms. The picture that emerges is one of tension between policies aimed at enhancing competition and at promoting macro stability, and institutional arrangements geared towards fostering equality of opportunities and promoting a broad sharing of the benefits from growth. A. Judicial system: strengthening broad-sharing while compromising macro stability and competition While the growing number of tutelas suggests that the mechanism has broadened access to the legal system, it is also suggestive of abuse and inefficiencies in other instances for
19 Chapter 1 of Title II is “On Fundamental Rights” –i.e. right to life (Art. 11), to religious freedom (19), to free speech (20) and to due process (29). Chapter 2 is “On Social, Economic and Cultural Rights”, which include social security (48), health (49), dignified housing (51) and property (58-61). 20 The activation of the procedure, which need not be in writing, can be interposed with any judge, who has to rule within 10 days. Appeals to a higher instance have to be decided within 20 days. All decisions are sent to the CC, which chooses those it wants to review.
14
legal recourse21. An activist judicial system, based on a rather simplistic interpretation of the concepts of equality and dignity, has had profound influence over economic reforms, and has prevented some of them from delivering on their promise. The CC has gone beyond legislating in the negative; it often modifies legislation in order to ensure that, in its opinion, it complies with the CP. It has extended its decisions to connected norms which, in many instances, nobody has challenged. In so doing, it has imposed peremptory deadlines on congress to legislate in accordance to its rulings.22
Some of the most important CC interventions in economic matters include: • Wages. The task of establishing the monthly minimum wage (SML) is undertaken
by a commission conformed by government, labor and business. If no agreement is reached, the government establishes it. Until 1998 it was standard practice to increase the SML in line with expected inflation plus some allowance for productivity growth. In 1999 the CC determined that this procedure violated worker’s right to a minimum 'vital and mobile' remuneration and determined that "the adjustment must never be lower than previous year inflation.” In 2000 it extended this rationale to most public sector wages and determined that “any savings achieved from limiting wage hikes has to go to social investment”, although the CP establishes that in times of peace only elected bodies can mandate public expenditure.
• Pensions. It struck down a provision in the 2003 pension reform shortening the transition period. The CC opined that the reform affected not just an expectation, but also acquired rights. Based on the notion of equality, it upheld a tutela by teachers claiming their right to a 14th monthly pension payment. This payment had been established in 1993 to compensate some retirees whose pensions had not been fully adjusted by inflation. Based on equity considerations, the CC extended the benefit to all pensioners, at a cost of around 12.5% of GDP (Cadena, 2006).
• Taxes. Based on the view that it did not deem as sufficient the graduating of the VAT, it turned down a provision in a tax reform that extended VAT to previously excluded items –albeit at a very low rate.
• Health. While the healthcare law defined the way in which citizens can exercise their healthcare rights, judges and the CC have allowed citizens to claim rights in much broader terms, at public expense, as a means to protect the “right to life”.
Interventions by the CC in the financial sector have been by far the most controversial. On account of a crisis affecting mortgage banks, in 1998 the government declared an economic emergency and issued decrees with the (temporary) weight of a law. Their review opened the door for the CC to play a very active role in diverse financial matters.
21 Between 1999 and April 2007 there were 1.6 million tutelas, 1/3 in reference to healthcare. The judiciary upheld 87% of them (El Tiempo, August 31, 2007). 22 Activism produces uncertainty and encourages the use of lawsuits to produce changes that politically disadvantaged groups are unable to accomplish through the legislative process and may deter many from participating in the political process (Kalmanovitz, 2003 and Uprimny, 2001). Politicians might find it rational to defer on the CC on topical issues, transferring to it the political costs involved.
15
• In introducing a financial transaction tax (FTT), the government exempted inter-bank operations. The CC turned this down as it violated the notion of equality. Until a much lower tariff was introduced, the inter-bank market, including for F/X operations, dried up.
• A government proposal, upheld by the CC, forced banks to accept, during a 12 month period, properties returned by debtors in exchange for the complete write-off of their mortgage. The government intended to target this provision to low-income owners. Based on the notion of equality, the CC extended it to all debtors.
• The administrative court ruled that the central bank could not continue linking corrección monetaria (CM) to interest rates, while the CC ordered that it be fully linked to inflation.23 It opined that if indexed debts increased faster than inflation, citizen’s right to housing would be affected. As a result, a 1999 law established that the real rate of interest –i.e. the premium over CM24
-- would be capped and kept constant, and that interest payments could no longer be capitalized. The CC then determined that all existing mortgages should be re-priced with the new unit of account, and ordered banks to refund debtors that had paid “in excess”.
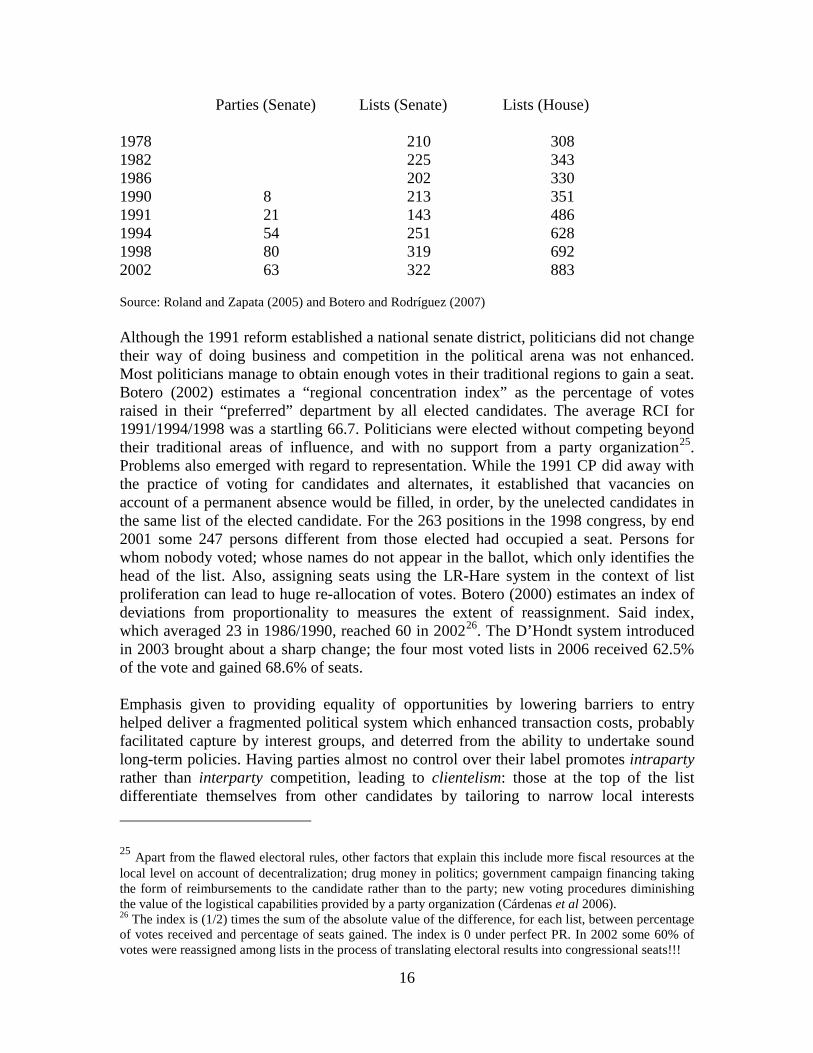
B. A political system privileging quantity over quality of political parties With the purpose of facilitating the emergence of new parties, the 1991 CP determined that “the law cannot establish conditions for the organization of parties and movements, nor make affiliation in one of them a condition for participating in elections.” Lowering barriers to entry and introducing a national senate district ended the monopoly by the two traditional parties –i.e. their combined senate representation went down from close to 100 to around 75%. Promoting entry, however, came at a price: an explosion in the number of parties and movements and a sharp increase in registered lists during elections (Table 4). While the abundance of lists pre-dates 1991, its proliferation shot up during the 1990s. In the 2002 senate 51 parties, movements, or coalitions were represented (Ungar, 2003). While in the 1991 senate the two dominant lists together held 1/3 of the 102 seats, in each of the next three elections the top three lists each elected only 2 senators. In 2002 the three most voted lists each received slightly less than 2% of the total vote.
Table 4. Proliferation of Parties and Lists
23 Mortgages were defined in terms of a unit of account (UPAC), originally intended to remain constant in terms of the CPI. The periodic adjustment of the unit was known as corrección monetaria. All assets and liabilities in mortgage banks (CAVs) were indexed to UPAC. At the insistence of CAVs, the CM began to incorporate interest rates in addition to inflation. Eventually, UPAC became fully indexed to interest rates. 24 This premium has to be lower than the lowest real rate of interest prevalent in the market (sic), and even lower for low-income housing. The central bank, entrusted in 2000 with periodically setting them, is forced to negate the principle according to which interest rates reflect expected risks.
16
Parties (Senate) Lists (Senate) Lists (House) 1978 210 308 1982 225 343 1986 202 330 1990 8 213 351 1991 21 143 486 1994 54 251 628 1998 80 319 692 2002 63 322 883 Source: Roland and Zapata (2005) and Botero and Rodríguez (2007) Although the 1991 reform established a national senate district, politicians did not change their way of doing business and competition in the political arena was not enhanced. Most politicians manage to obtain enough votes in their traditional regions to gain a seat. Botero (2002) estimates a “regional concentration index” as the percentage of votes raised in their “preferred” department by all elected candidates. The average RCI for 1991/1994/1998 was a startling 66.7. Politicians were elected without competing beyond their traditional areas of influence, and with no support from a party organization25. Problems also emerged with regard to representation. While the 1991 CP did away with the practice of voting for candidates and alternates, it established that vacancies on account of a permanent absence would be filled, in order, by the unelected candidates in the same list of the elected candidate. For the 263 positions in the 1998 congress, by end 2001 some 247 persons different from those elected had occupied a seat. Persons for whom nobody voted; whose names do not appear in the ballot, which only identifies the head of the list. Also, assigning seats using the LR-Hare system in the context of list proliferation can lead to huge re-allocation of votes. Botero (2000) estimates an index of deviations from proportionality to measures the extent of reassignment. Said index, which averaged 23 in 1986/1990, reached 60 in 200226
. The D’Hondt system introduced in 2003 brought about a sharp change; the four most voted lists in 2006 received 62.5% of the vote and gained 68.6% of seats.
Emphasis given to providing equality of opportunities by lowering barriers to entry helped deliver a fragmented political system which enhanced transaction costs, probably facilitated capture by interest groups, and deterred from the ability to undertake sound long-term policies. Having parties almost no control over their label promotes intraparty rather than interparty competition, leading to clientelism: those at the top of the list differentiate themselves from other candidates by tailoring to narrow local interests
25 Apart from the flawed electoral rules, other factors that explain this include more fiscal resources at the local level on account of decentralization; drug money in politics; government campaign financing taking the form of reimbursements to the candidate rather than to the party; new voting procedures diminishing the value of the logistical capabilities provided by a party organization (Cárdenas et al 2006). 26 The index is (1/2) times the sum of the absolute value of the difference, for each list, between percentage of votes received and percentage of seats gained. The index is 0 under perfect PR. In 2002 some 60% of votes were reassigned among lists in the process of translating electoral results into congressional seats!!!
17
(Roland and Zapata, 2005). The rules of the game for allocating seats in congress in place until 2003 appear to have had a deleterious effect on the quality of legislative work. The average number of bills initiated each year went from 142 during 1982-91 to 215 during 1992-2003. Around 80% of them were introduced by legislators, with a clear regional orientation. Legislative inflation suggests party weakness; there is no quality control and projects submitted by legislators lack financial and judicial rigor. Unsurprisingly, the approval rate for legislation submitted by the executive is much higher. After several failed attempts, a new reform was approved by congress in 2003. The electoral rules maintained a system of proportional representation, but shifted to a D’Hondt rule with minimum thresholds -- a 2% threshold in the senate and of 50% of the quota in the house in the case of departments electing more than two representatives, or of 30% in the few that elect only two. Parties may present only one list for each chamber, there can be no more candidates in the list than seats to be filled, and voters may not register in more than one party. As a compromise, each party decides if voters may choose the order of candidates within the list. In 2005 congress passed a Ley de Bancadas which established that members of congress elected from the same list must constitute a group; delegated in parties the responsibility of issuing statutes to ensure that groups act in conformity with the law; and established procedures to enhance efficiency of legislative proceedings. The 2003 reform was put to test at the congressional level in 2006. The introduction of a threshold induced consolidation. In 2006 only 20 lists contested for the senate, down from 322 in 2002;27
10 surpassed the threshold. Although progress was achieved in bringing order into what some labeled a chaotic situation, the fate of the 2006 tax reform, maybe the most important economic issue that congress has dealt with since, suggests that cohesion observed during the elections has yet to translate into a more structured legislature, one less prone to capture and better able to deliver sound public policies.
C. Labor and tax regimes unsupportive of the enhancement of competition While trade liberalization has proceeded almost uninterruptedly, at least two areas that should have aided in Colombia’s integration into the global economy have been lacking. First, the labor reform failed to deliver on its promise of making the labor market more flexible. And second, in order to finance a much higher of public expenditure, the tax burden has been increased quite markedly, in such a manner that the tax code is deemed to be at odds with the need to make the private sector more competitive. On the other hand, and because of a host of reasons, the process of financial liberalization has proven to be more complex and protracted than originally envisioned. Labor market flexibility, inconsistent with making the pension system sustainable and curtailed by actions from the CC The main goal of the 1990 reform was to support trade liberalization by enhancing labor flexibility and formalization. The observed reduction in non-wage labor costs would soon
27 More precisely, in the 2002 elections 63 parties/movements presented 322 lists, while four years later 20 parties or movements presented 20 lists.
18
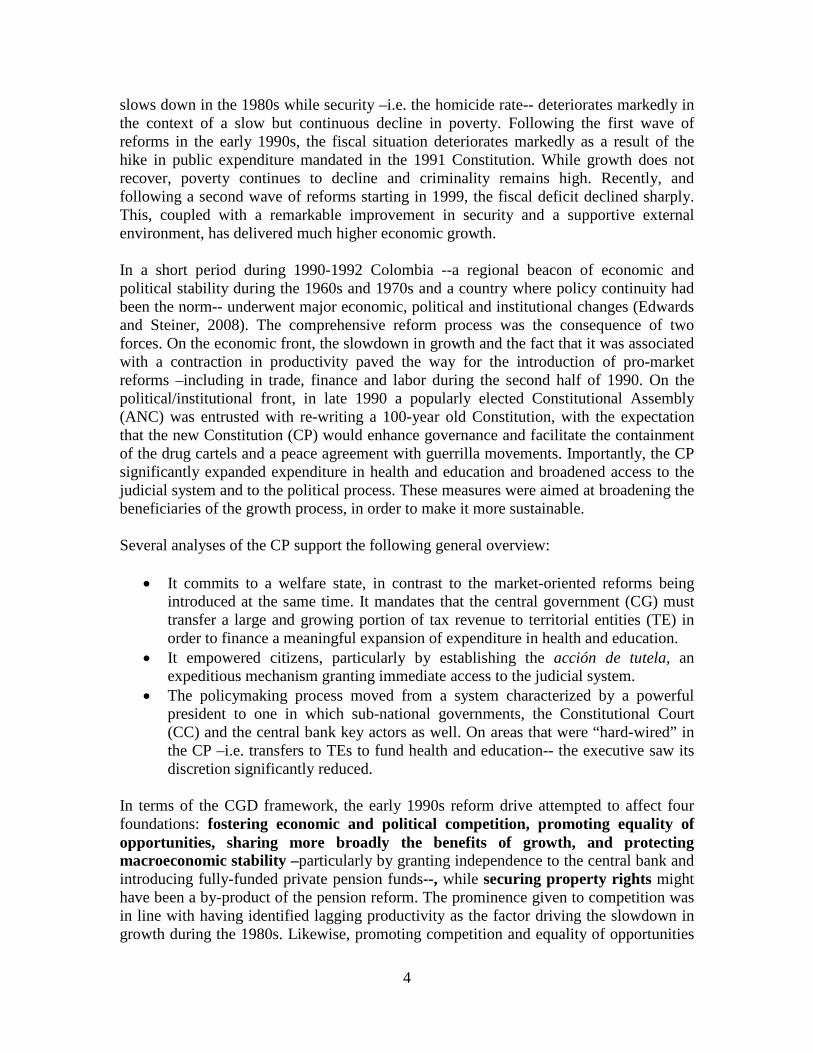
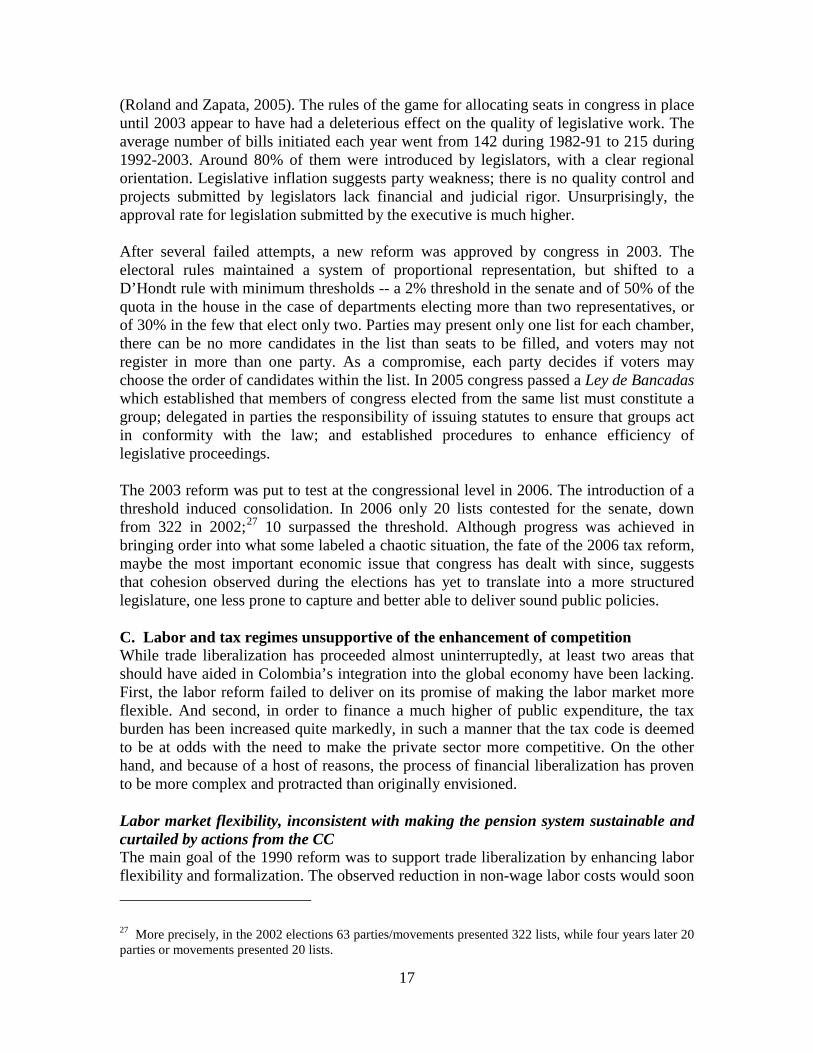
be over-taken by the rise in social security contributions stemming from the 1993 social security reform and the rigidity of wages. The reduction in non-wage costs from the labor reform was obliterated by the increase in contributions from the 1993 health and pension reforms, undertaken with the purpose of promoting macro stability by placing pensions on a sounder financial footing (Figure 4). Non-wage costs increased from around 47% of the payroll in the 1980s to 60% in 2004 (World Bank, 2005)28
. By 1999, Colombia had the second highest non-wage labor costs in the region. Work by the World Bank (2005) shows that the rise in non-wage costs has constrained labor demand and fostered supply. Informality, at 58%, was higher in 2004, when the economy was already in a recovery, than in 1992 (54%).
Figure 4. Non-Wage Labor Costs (% of salary)
Source: Cárdenas and Mercer-Black (2006); Bernal and Cárdenas (2003)
* Total non-wage labor costs include: (i) Parafiscal payroll taxes (contributions to ICBF, SENA and CCFs); (ii) Contributions tosocial security (Health, Pensions, Severance payments, and Professional Risks); (iii) Paid vacations and Mandatory Bonuses.
0
10
20
30
40
50
60
1977
1978
1979
1980
1981
1982
1983
1984
1985
1986
1987
1988
1989
1990
1991
1992
1993
1994
1995
1996
1997
1998
1999
2000
2001
2002
2003
2004
2005
Total* Health Pensions Severance Payments Parafiscal Payroll Taxes
Actions with regard to wages have also stood in the way of enhancing labor flexibility and formalization. Provisions in the law and interpretations by the CC have determined that the minimum wage (SML) and wages affecting most civil servants must be indexed
28 Non-wage costs are composed of: (i) Parafiscal contributions adding to 9% of the payroll: 2% for SENA (the vocational training program); 4% for ICBF (the family welfare program); 3% for private CCFs (Family Compensation Funds) involved in a host of activities including cash subsidies, recreation and culture and unemployment insurance. (ii) Contributions to severance funds and paid vacations. (iii) Health contributions, up from 7 to 12% in 1993 and to 12.5% in 2007. (iv) Contributions to pensions, up from 6.5 to 13.5% in 1993 and to 15.5% in 2002, with an additional 1 percentage point contribution for high salaries.
19
to inflation. When, after 1999, the central bank’s inflation targeting framework started to deliver a consistently lower inflation, backward indexation resulted in a continuous rise in the SML in real terms, an increase in the ratio of the SML to the average wage, and a rise in the proportion of self-employed workers earning less than the SML. Between 1996 and 2002 real wages of the self-employed declined –i.e. this sector better able to adapt to the business cycle than the formal sector, where wages increased even as the economy entered a severe recession. World Bank (2005) estimates of Okun equations show that cyclical variations in output affect unemployment more strongly after 1998 –i.e. the labor market increasingly adjusts through quantities rather than wages, a far cry from the purpose of making it more flexible and supportive of an open trade regime. A new reform was passed in 2002. Its provisions fall in two categories: formalization of employment and social protection and enhancement of opportunities for hard-to-hire groups. It reduced overtime pay and made the workday/workweek more flexible; amended apprenticeship contracts, which no longer involve parafiscal contributions or severance payments and can be remunerated below the SML; further reduced firing costs; and introduced an unemployment insurance scheme (UI). Gaviria (2004) estimates that the reduction in firing costs and over-time pay barely compensates for the increase in pension contributions enacted at the same time. He also reports positive effects on the hiring of apprentices and on the reduction of under-employment, minor effects over employment generation and formalization, and no impact from UI. The 2002 reform seems to have marginally enhanced flexibility. However, by not addressing the two critical issues –high non-wage labor costs and inflexible wages—it has done very little to significantly promote labor market formalization. Taxes, high and generally not supportive of competition and efficiency At 15% of GDP, Colombia’s tax burden is not high, given the country’s level of income and the well-established fact that the tax burden increases with income. Having said that (i) the tax burden has risen faster in Colombia than in any other country in the region, increasing by a factor of 2 since 1990; (ii) it is a source of uncertainty, with no less than 10 national tax reforms in the last 17 years and ample discretion by municipal authorities; (iii) it is extremely inefficient, combining shallow bases –less than 2% of the active labor force paid income taxes in 2004 according to Cárdenas and Mercer (2006)-- with high marginal tax rates, both with regard to income (38.5% until 2007, 35% since) and the VAT; (iv) it is complicated to administer and likely to foster elusion/evasion, on account of the existence of many rates (8 in the case of the VAT, ranging from 2 to 45%) and an ever-increasing list of exemptions; (v) it is complemented by the second-highest tax rate on the wage bill in the region, the highest FTT, a technically flawed local tax on business turnover and a distortionary tax on net wealth. Successive tax reforms, aimed at supporting fiscal and macro stability in the context of an ever-rising level of public expenditure, have had a negative effect on competition and efficiency. Colombia’s business-unfriendly tax regime has its root cause in the fact that the tax burden has had to be raised frequently, in order simply to keep pace with the expansion of public expenditure –throughout the 1990s to comply with mandates in the 1991 CP, more recently to fund the costs of enhanced security. While congress has generally
20
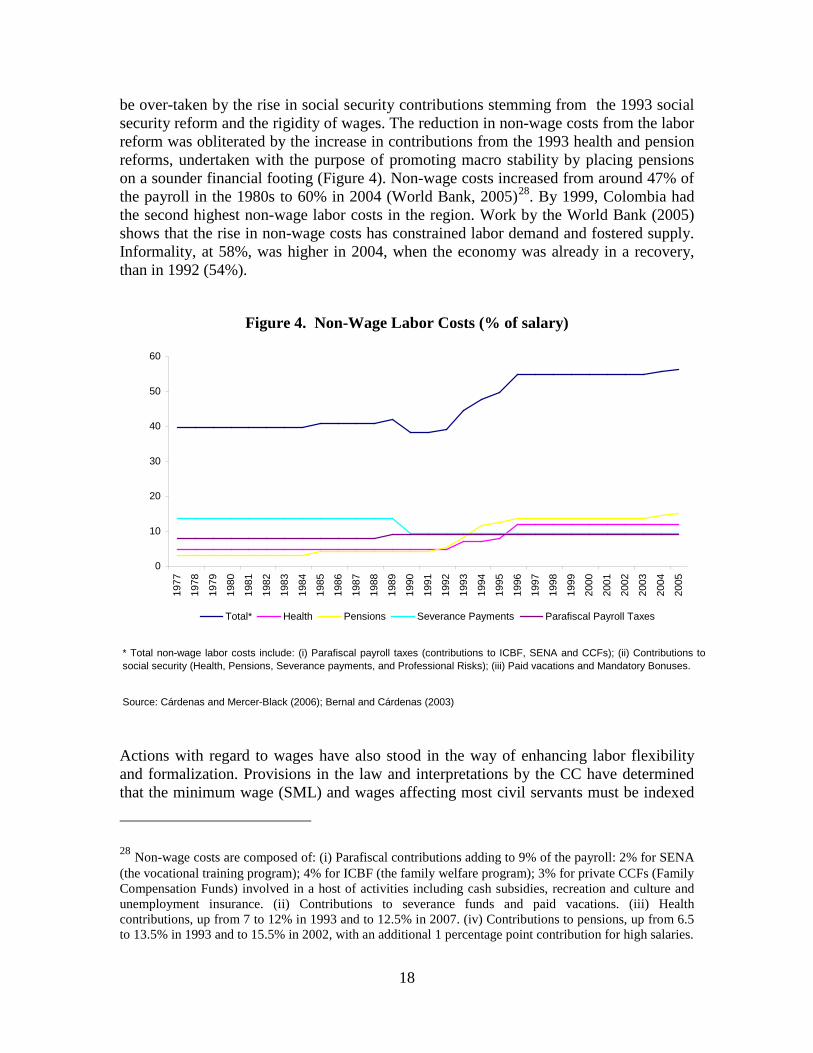
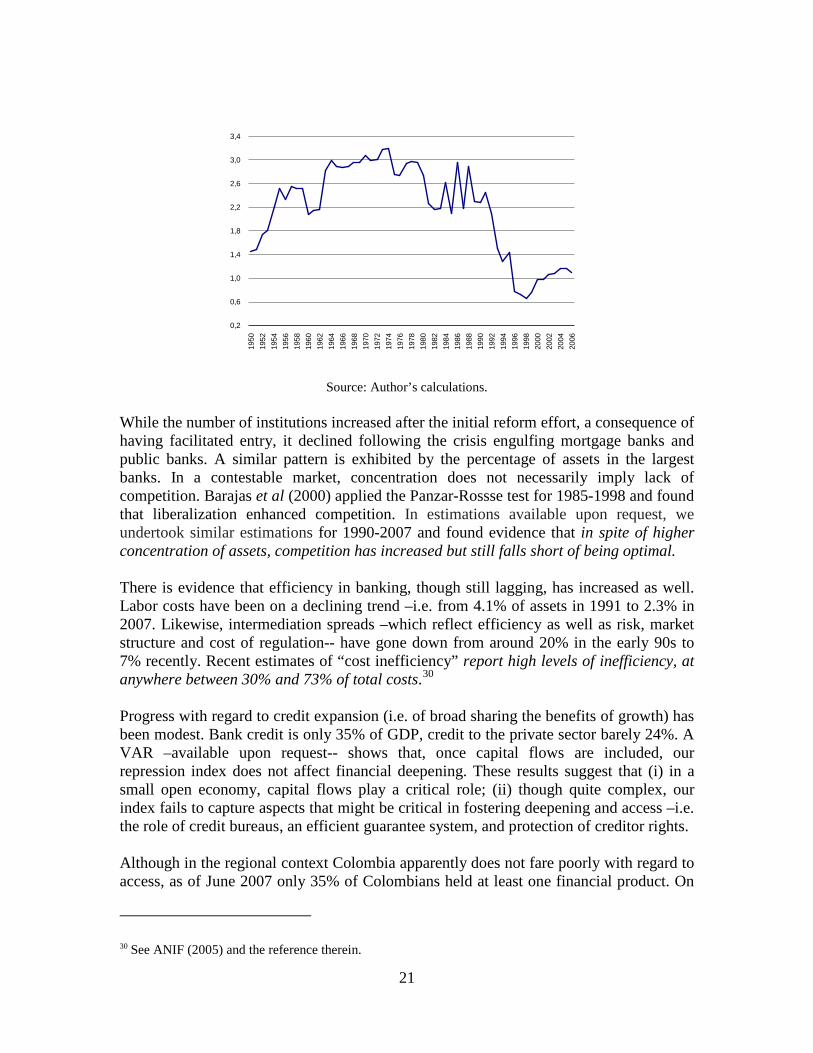
accommodated the government’s need of additional resources, the executive has always found itself at the mercy of the legislature, and therefore of interest groups, regarding the quality of the tax changes. A good example of this has been the fate of the highly distortionary FTT, introduced as temporary at a rate of 0.2% in 1999. Every time the government has submitted a tax reform since, it has requested the phasing-out of this tax and its replacement with less distortionary taxes. The results of these efforts have been dismal: the FTT is now permanent, at a rate of 0.4%. Even when congress has come on board in support of attempts at improving the tax code –as in 2002, when it agreed to impose a VAT, at a low rate, to all foodstuffs—the CC has opined that such a move ran counter to any concept of fairness. Not to mention the government itself when, like in the failed 2006 reform, did not shy away from making explicit its intention of maintaining certain exemptions in order to promote private sector investment. This posture soon led to numerous suggestions for additional exemptions and differential tariff rates; a point was reached when the government decided to retrieve its reform proposal altogether. D. Finance: modest progress in competition, efficiency, deepening and access We present several approaches to assess progress in the financial sector following the reform process to date. A repression index, a model gauging the evolution of competition, and the literature on efficiency, all suggest there is room for improvement. An update of Salazar’s (2005) repression index suggests a period of continuous liberalization that began in the late 1980s and was interrupted during late 1990s crisis affecting mortgage and public banks –when an FTT and forced investments were introduced and foreign ownership fell (Figure 5).29
Figure 5. Financial Repression Index
29 We applied principal components to a set of financial repression indicators. A single indicator is estimated, the weights of the components equal to their participation in the variance of the information set. Seven indicators were considered: (i) mandatory investments; (ii) reserve requirements; (iii) interest rate controls; (iv) difference between the usury and the average loan rate; (v) revenue from the FTT; (vi) and (vii) assets of public and of foreign banks as % of total assets. We took the first component as indicator of repression, as it explains 70% of the variance of the information set. Variables most highly correlated with the first component are the importance of public banks, foreign participation and mandatory investments.
21
0,2
0,6
1,0
1,4
1,8
2,2
2,6
3,0
3,4
1950
1952
1954
1956
1958
1960
1962
1964
1966
1968
1970
1972
1974
1976
1978
1980
1982
1984
1986
1988
1990
1992
1994
1996
1998
2000
2002
2004
2006
Source: Author’s calculations.
While the number of institutions increased after the initial reform effort, a consequence of having facilitated entry, it declined following the crisis engulfing mortgage banks and public banks. A similar pattern is exhibited by the percentage of assets in the largest banks. In a contestable market, concentration does not necessarily imply lack of competition. Barajas et al (2000) applied the Panzar-Rossse test for 1985-1998 and found that liberalization enhanced competition. In estimations available upon request, we undertook similar estimations for 1990-2007 and found evidence that in spite of higher concentration of assets, competition has increased but still falls short of being optimal. There is evidence that efficiency in banking, though still lagging, has increased as well. Labor costs have been on a declining trend –i.e. from 4.1% of assets in 1991 to 2.3% in 2007. Likewise, intermediation spreads –which reflect efficiency as well as risk, market structure and cost of regulation-- have gone down from around 20% in the early 90s to 7% recently. Recent estimates of “cost inefficiency” report high levels of inefficiency, at anywhere between 30% and 73% of total costs.30
Progress with regard to credit expansion (i.e. of broad sharing the benefits of growth) has been modest. Bank credit is only 35% of GDP, credit to the private sector barely 24%. A VAR –available upon request-- shows that, once capital flows are included, our repression index does not affect financial deepening. These results suggest that (i) in a small open economy, capital flows play a critical role; (ii) though quite complex, our index fails to capture aspects that might be critical in fostering deepening and access –i.e. the role of credit bureaus, an efficient guarantee system, and protection of creditor rights. Although in the regional context Colombia apparently does not fare poorly with regard to access, as of June 2007 only 35% of Colombians held at least one financial product. On
30 See ANIF (2005) and the reference therein.
22
the other hand, credit to SMEs has evolved favorably, but starting from a low base. Banking the poor is costly for financial institutions, and it is also taxing on the poor. Information requirements can overburden potential customers, particularly if they work in the informal sector. In 2006 the government launched a program aimed at enhancing access by the poor (Banca de las Oportunidades). At the margin, it has lessened some of the severe constraints to access to financial services31
.
Just as macro stability was compromised by constitutional mandates geared towards broadening the pool of beneficiaries for growth, the concern for macro stability in the context of insufficient instruments hampered financial liberalization and might have deterred the financial reform from meaningfully affecting the foundations as in Table 3. First, in response to a sharp rise in capital inflows, the central bank has established reserve requirements on foreign borrowing and increased overall reserve requirements. Doing so curtailed competition and efficiency and increased financing costs. Second, limited instruments played a role in the decision to finance public intervention in the crisis engulfing mortgage and public banks with a FTT, a tax that retards financial deepening and access by the poor to financial services. Third, unable to resort to the budget to promote specific sectors, in 1999 the government re-introduced some forced investments, this time in favor of low income housing. The expansion of bank credit has also been hampered by a much engrained bias favoring debtors over creditors, a bias that is evident in the minds of those who write the laws and of those in charge of upholding them –arguably, a populist interpretation of property rights by the legislative and judicial branches. We have already mentioned decisions by the CC with regard to forcing mortgage banks to bail-out debtors. In addition, Law 550 of 1999 attempted to provide lenders and borrowers with incentives and mechanisms to negotiate restructuring programs allowing businesses under stress to normalize activities. The bias against financial creditors became evident and only a few deals were finalized. A major hurdle faced by financial institutions in their attempts at recovering collateral has been the need to undertake a judicial process loaded with procedures. In addition, the legal system does not allow for an expeditious constitution of guarantees and guarantee registries are technologically obsolete. A 2006 law improves matters, but does not fully solve the main problems. The expansion of credit in general, and to smaller agents in particular, is constrained by the existence of caps on interest rates. Reference was made above to decisions by the CC that forced banks to decouple interest rates on mortgages from any assessment of risk. In addition, credit operations are subjected to limits imposed by the usury rate of interest, which of late might have become binding for certain operations. Interpretations by the supervisor have determined that limits shall apply throughout the loan’s lifespan –i.e. if market conditions change and the usury rate falls, the contract has to be re-defined. In
31 In addition to allowing the creation of non-banking correspondents, it established differential rates per sector for the usury rate, increased allowable commissions on micro-credit, and expanded FTT extensions for withdrawals from savings accounts.
23
addition to producing uncertainty, it inhibits the securitizations market.32
In the case of micro-credit, banks can charge fixed commissions on top of the usury rate. In practice, this flexibility is not significant. The system in place does not foster the expansion of micro-enterprises and does not allow banks to cover the operational costs and risks associated with small operations with agents in the informal sector.
Credit bureaus are underdeveloped, and this also helps explain the low level of access to the financial sector. It was only recently that a Habeas Data law was approved, establishing a 4 year permanence for all negative information. It is now under review by the CC. In the absence of a law, the CC has ruled favorably on numerous demands from citizens arguing that their rights (to privacy and a good name) have been violated by credit bureaus, again a judiciary intervention that impedes the development of the financial sector The negative view that many have regarding the financial sector and the lack of knowledge of how information systems work allowed the notion that “the less information, the higher the access to credit” to flourish. E. Promoting macroeconomic stability in the context of a deteriorated fiscal position During the decade following the launching of the reform program, Colombia lost its tradition of prudent fiscal policy and relative macro stability. While having granted independence to the central bank would eventually prove to be a wise move, Colombia now enjoying historically low rates of inflation, it is evident that not having had a supportive fiscal policy stance during the 1990s determined that, when international financial conditions tightened after 1997, the central bank had to put in place an extremely tight policy stance in order to pursue its mandate of delivering low inflation. In order to support the currency, during 1998 and 1999 the central bank hiked interest rates to unprecedented levels. This proved to be very costly for economic activity in general, and for the mortgage industry in particular. The fiscal deterioration that engulfed Colombia in the second half of the 1990s was the result of a confluence of factors. We want to highlight two: an over-estimation of the fiscal benefits of the 1993 pension reform and the rise in expenditure, particularly in the social sectors at the sub-national level, mandated in the CP. In both cases, the CC placed a critical role in making a difficult situation even worse. In late 1999, and for the first time ever, Colombia entered into an arrangement with the IMF in the context of which important reforms were undertaken, mostly geared towards restoring macroeconomic stability. Pensions: expensive, with subsidies unfairly targeted until recently Although the 1993 reform adjusted parameters in order to make the system sustainable and more in accordance with demographic trends, it implied a long transition period, not affecting those retiring prior to 201433
32 The authorities have attempted to introduce some flexibility to this restrictive regime. Recently, the government decided to certify the usury rate by type of credit and at a higher time frequency.
. Members of the armed forces and the police, of the teacher’s union pension fund, and of the state-owned oil company were exempted
33 The reform implied a 20 year transition in order to increase retirement ages by 2 years, while life expectancy had increased from 61 at the beginning of the 1970s to 70 at the end of the 1990s and the conditional life expectancy of a 60 year old had surpassed 80 (Cadena, 2006).
24
from the general system. It soon became evident that the reform had not achieved the goal of placing public pension liabilities on a sustainable path. After some failed attempts, important changes were introduced in 2003-05 with the purpose of addressing this issue, while also improving equity and enhancing fairness.
• Subsidies now benefit only those unable to save enough to constitute a minimum pension. Guaranteed minimum pensions in AFPs are now fully funded.
• Contributions were raised, benefits were capped and some progressiveness was introduced in the determination of the replacement rate.
• The 14th monthly payment –an extra benefit to a few public employees which, on grounds of equality, the CC had extended to all-- was eliminated for those earning more than 3 times the SML and for everybody retiring after 2011; all privileged regimes (except for the military) were eliminated starting in 2010; and collective agreements can no longer establish more favorable conditions than in the SGP.
• The transition was brought forward to 2010, except for those very close to retirement. Congress approved bringing it forward to 2008, but the provision was watered down by the CC on grounds that those that would be affected not only had an “expectation” of receiving certain benefits; they had an “acquired right”.
The 2003-05 reforms reduced unfunded liabilities of the PAYG regime from over 200 to 140% of GDP in NPV terms. Still, pension payments will continue to be a drag on the budget. Transfers from the CG are peaking in 2007-2008 at slightly less than 5% of GDP and are expected to remain close to 4% of GDP until 2015 (Ministerio de Hacienda, 2005). The pension regime is not only expensive; it has also implied inequitable use of taxpayer money. The system has involved huge subsidies, ranging from those who never contributed but were entitled to a modest pension, to those whose contributions were not enough to cover their pension, to egregious cases where no contributions were made but where pensions were huge34
. Before the 2003 reform, the government subsidized 2/3 of the benefits of those receiving a minimum pension of 1 SML, and around ½ of all others (Montenegro and Rivas, 2005). Since coverage is low and biased in favor of the better-off, the distribution of subsidies was appalling, the lowest quintile receiving no subsidy and the highest capturing 80% of the total (Lasso, 2006). Notwithstanding a prolonged transition period, the 2003-05 reforms had a major impact on equity by doing away with most of the privileged regimes, the main source of inequality. Solidarity, in addition, was enhanced. At the margin, pension subsidies are now well targeted.
Fiscal decentralization: many benefits, at a substantial fiscal cost Following the 1991 CP there has been a significant transfer of resources from rich regions to poor areas, and the bulk of the resources transferred from the CG to TEs have been used to fund expenditures in health and education, thereby broadening the pool of beneficiaries of growth. Transfers went up from around 5% of GDP in 1990 to over 12% recently. In its initial stages, however, TEs began running deficits and accumulating debt, compromising
34 For example, prior to the 2003 reform, public teachers did not contribute to their pension fund, could retire much earlier, and received significantly higher benefits. Borjas and Acosta (2000) estimated that in 2000 this program, benefiting 303 thousand active teaches, had generated a liability to the government equivalent to 30% of GDP. This was similar to the pension liability generated by 2.3 million non-teachers.
25
macro stability. Notwithstanding the rise in transfers, expenditure increased faster.35 The scheme put in place did not provide enough incentives for local tax effort and allowed for full discretion with regard to indebtedness36. Although there are differing views as to whether there has been fiscal apathy, tax collections were more dynamic at the national level37
. On account of being linked to CG current revenue, transfers became highly pro-cyclical making macro policy less flexible while tying expenditure on health and education to taxes sensitive to the business cycle. Distribution formulas were complicated, and few TEs could reasonably predict their income flows. On account of their rigidity, formulas fostered over-provision of certain services in some areas and under-provision in others.
A second round of reforms was driven by the need to make the scheme sustainable, while introducing flexibility to the distribution of transfers so as to produce a better match between the supply of fiscal resources and the effective demand for them. In 1997 borrowing by TEs was made contingent on meeting certain solvency and liquidity criteria. A 2000 law classified TEs in categories and established differential limits on operational expenses, to a given percentage of revenue (excluding transfers). Legislative Act 01 of 2000 created the Sistema General de Participaciones –placing into one the three transfer mechanisms in existence. SGP will grow with inflation plus a “mark-up”, which has recently been raised.38
Law 715 in 2000 made the allocation of transfers more flexible –without a regional dimension and taking into account potential users as well as standardized costs-- and introduced incentives for local taxation. A 2003 fiscal responsibility law affecting all levels of government establishes that the primary surplus must be at least equal to debt service. Even if deficits at the TE level have been averted, the CG still faces imbalances on account of decentralization. Overlapping functions, confusing distribution of responsibilities and weak links between expenditure and financing decisions abound. Expenditure assignment by levels of government has never been made entirely clear. While the 1991 CP called for congress to pass a territorial organization law (LOT) distributing assignments, a LOT has never been issued and the CG continues to pay for many devolved responsibilities.
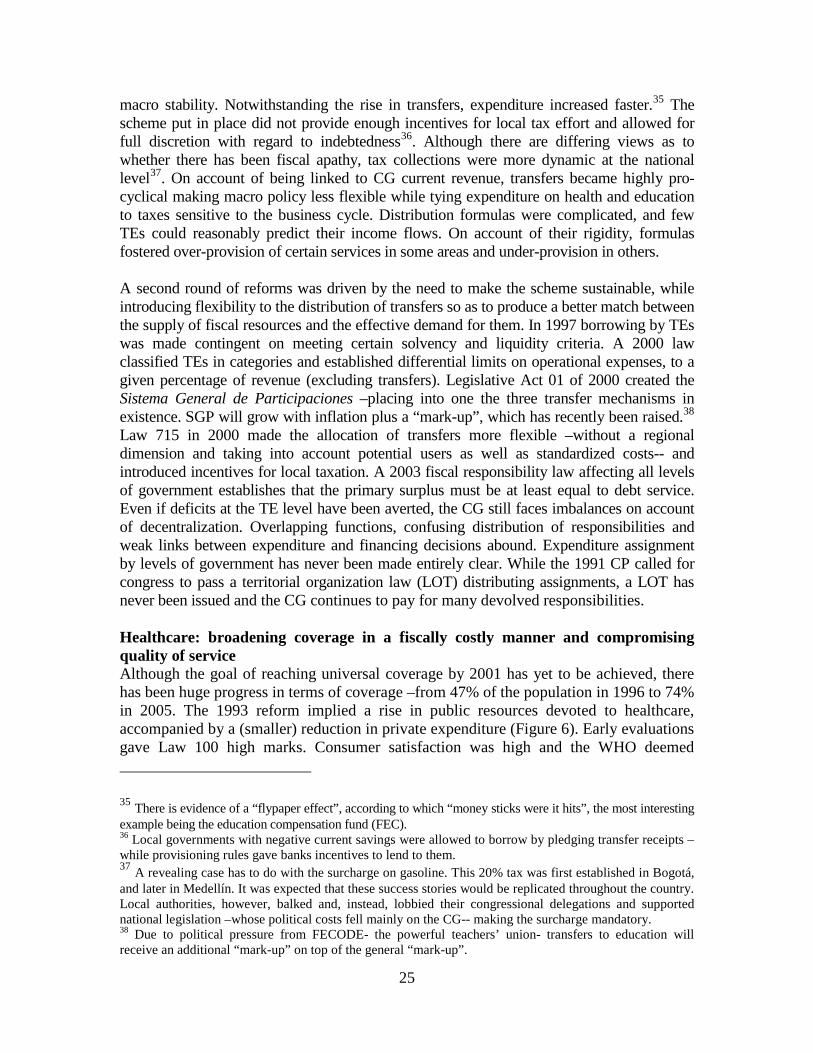
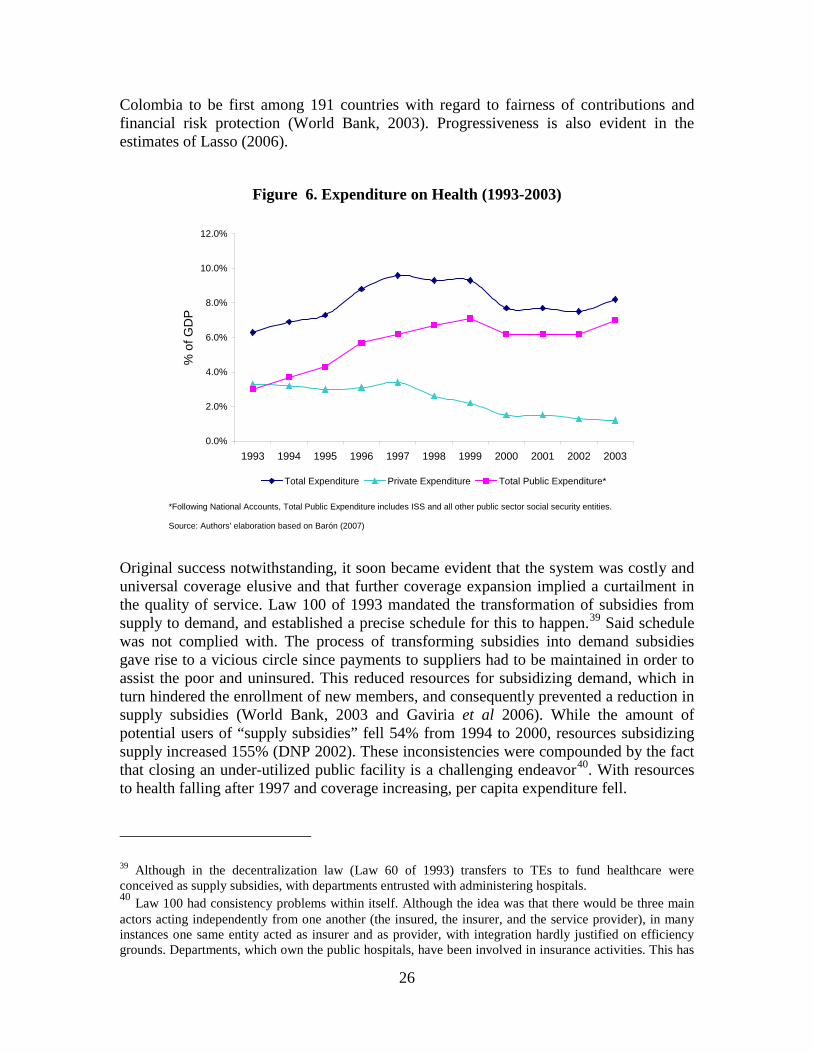
Healthcare: broadening coverage in a fiscally costly manner and compromising quality of service Although the goal of reaching universal coverage by 2001 has yet to be achieved, there has been huge progress in terms of coverage –from 47% of the population in 1996 to 74% in 2005. The 1993 reform implied a rise in public resources devoted to healthcare, accompanied by a (smaller) reduction in private expenditure (Figure 6). Early evaluations gave Law 100 high marks. Consumer satisfaction was high and the WHO deemed
35 There is evidence of a “flypaper effect”, according to which “money sticks were it hits”, the most interesting example being the education compensation fund (FEC). 36 Local governments with negative current savings were allowed to borrow by pledging transfer receipts – while provisioning rules gave banks incentives to lend to them. 37 A revealing case has to do with the surcharge on gasoline. This 20% tax was first established in Bogotá, and later in Medellín. It was expected that these success stories would be replicated throughout the country. Local authorities, however, balked and, instead, lobbied their congressional delegations and supported national legislation –whose political costs fell mainly on the CG-- making the surcharge mandatory. 38 Due to political pressure from FECODE- the powerful teachers’ union- transfers to education will receive an additional “mark-up” on top of the general “mark-up”.
26
Colombia to be first among 191 countries with regard to fairness of contributions and financial risk protection (World Bank, 2003). Progressiveness is also evident in the estimates of Lasso (2006).
Figure 6. Expenditure on Health (1993-2003)
*Following National Accounts, Total Public Expenditure includes ISS and all other public sector social security entities.
Source: Authors' elaboration based on Barón (2007)
0.0%
2.0%
4.0%
6.0%
8.0%
10.0%
12.0%
1993 1994 1995 1996 1997 1998 1999 2000 2001 2002 2003
% o
f GD
P
Total Expenditure Private Expenditure Total Public Expenditure*
Original success notwithstanding, it soon became evident that the system was costly and universal coverage elusive and that further coverage expansion implied a curtailment in the quality of service. Law 100 of 1993 mandated the transformation of subsidies from supply to demand, and established a precise schedule for this to happen.39 Said schedule was not complied with. The process of transforming subsidies into demand subsidies gave rise to a vicious circle since payments to suppliers had to be maintained in order to assist the poor and uninsured. This reduced resources for subsidizing demand, which in turn hindered the enrollment of new members, and consequently prevented a reduction in supply subsidies (World Bank, 2003 and Gaviria et al 2006). While the amount of potential users of “supply subsidies” fell 54% from 1994 to 2000, resources subsidizing supply increased 155% (DNP 2002). These inconsistencies were compounded by the fact that closing an under-utilized public facility is a challenging endeavor40
39 Although in the decentralization law (Law 60 of 1993) transfers to TEs to fund healthcare were conceived as supply subsidies, with departments entrusted with administering hospitals.
. With resources to health falling after 1997 and coverage increasing, per capita expenditure fell.
40 Law 100 had consistency problems within itself. Although the idea was that there would be three main actors acting independently from one another (the insured, the insurer, and the service provider), in many instances one same entity acted as insurer and as provider, with integration hardly justified on efficiency grounds. Departments, which own the public hospitals, have been involved in insurance activities. This has
27
To address some of these issues, in 2001 congress approved Law 715, more clearly defining responsibilities and rationalizing the distribution of transfers. Resources for insurance coverage are now distributed across regions taking into account the number of beneficiaries and the estimated cost of providing the service. Resources for hospitals are estimated based on each department’s number of un-insured. Departments are in charge of executing national policies, of running the hospitals, and of inspection and control of insurance; municipalities are entrusted with running the contributive and subsidized regimes, including selecting the beneficiaries of the latter41
.
To compound the problems stemming from design problems, there is ample evidence that the system has been abused. Being poor is not the only reason for being classified as Sisben 1 or 2 and eligible to participate in the RS. Individuals classified in levels 4 to 6 have also joined42
, and political patronage seems to have played a role (Gaviria et al 2006). Sisben fails to expeditiously capture changes in a household’s true conditions. A 2000 review found that Type I errors (when someone poor is failed to be classified as such) happened 15% of the time whereas Type II errors (when someone is erroneously classified as poor) occurred in 25% of the cases. Unfortunately, changes introduced went in the wrong direction: while the exclusion error was reduced, the error of inclusion was magnified (Peña and Glassman, 2004). The new methodology increased the percentage of people classified as Sisben 1-2 from 21 to 56; potential beneficiaries of the RS –and other social programs— went up by 15.3 million!! This is fiscally costly, resources will have to be shared among a larger pool of beneficiaries at the expense of the neediest, and perverse incentives to joining the formal sector might have been introduced.
In addition, and whereas the healthcare law defined in a precise manner how citizens can exercise their right to healthcare, judges have allowed for citizens to claim that right in broader terms and the CC has upheld most of these interventions. The interested reader should consult Sotelo (2002) for a long list of astonishing services that health providers have been forced to make available to patients43
. In some cases the legal ruling explicitly states that the provider should be reimbursed by the government; in others the provider is left in the dark as to who bears the costs of these expensive services.
Education: expenditure has increased significantly and coverage somewhat less, while quality has stalled Colombia now spends more money in public education than any other large country in the region (Table 5). Public expenditure went from 2.4% to 4.5% of GDP between 1990
given rise to conflict of interest, deterred from competition, impaired accountability and generated demand for providers that otherwise would have been redundant and should, therefore, have been shut down. 41 In fact, only “certified municipalities” –i.e. those with 100.000 or more inhabitants and smaller ones with a proven track record— play this role. 42 Gaviria et al (2006) estimate that in 2003 more than half of individuals classified as Sisben 1 or 2 were not affiliated to the RS, whereas some 20% of those classified as Sisben 3 and 4 were. 43 A judge ordered a provider to perform a kidney transplant within 48 hours. There are instances of judges expanding the contents of POS, even mandating pay for experimental treatments abroad. Recently, a provider was ordered to pay for dental care, a service not covered in the standard healthcare program.
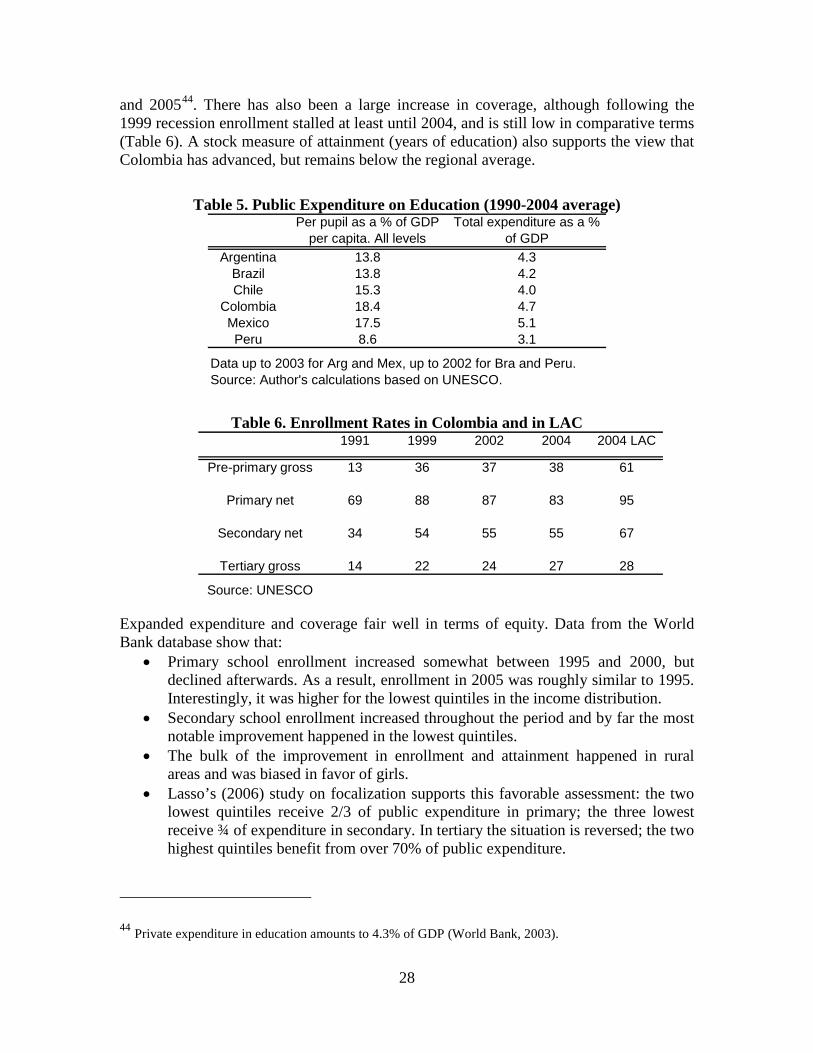
28
and 200544
. There has also been a large increase in coverage, although following the 1999 recession enrollment stalled at least until 2004, and is still low in comparative terms (Table 6). A stock measure of attainment (years of education) also supports the view that Colombia has advanced, but remains below the regional average.
Table 5. Public Expenditure on Education (1990-2004 average)
Argentina 13.8 4.3Brazil 13.8 4.2Chile 15.3 4.0
Colombia 18.4 4.7Mexico 17.5 5.1Peru 8.6 3.1
Data up to 2003 for Arg and Mex, up to 2002 for Bra and Peru.Source: Author's calculations based on UNESCO.
Per pupil as a % of GDP per capita. All levels
Total expenditure as a % of GDP
Table 6. Enrollment Rates in Colombia and in LAC
1991 1999 2002 2004 2004 LAC
Pre-primary gross 13 36 37 38 61
Primary net 69 88 87 83 95
Secondary net 34 54 55 55 67
Tertiary gross 14 22 24 27 28
Source: UNESCO
Expanded expenditure and coverage fair well in terms of equity. Data from the World Bank database show that:
• Primary school enrollment increased somewhat between 1995 and 2000, but declined afterwards. As a result, enrollment in 2005 was roughly similar to 1995. Interestingly, it was higher for the lowest quintiles in the income distribution.
• Secondary school enrollment increased throughout the period and by far the most notable improvement happened in the lowest quintiles.
• The bulk of the improvement in enrollment and attainment happened in rural areas and was biased in favor of girls.
• Lasso’s (2006) study on focalization supports this favorable assessment: the two lowest quintiles receive 2/3 of public expenditure in primary; the three lowest receive ¾ of expenditure in secondary. In tertiary the situation is reversed; the two highest quintiles benefit from over 70% of public expenditure.
44 Private expenditure in education amounts to 4.3% of GDP (World Bank, 2003).
29
Progress towards a broad sharing of the benefits of the reform must be recognized in terms of enhanced coverage. Still, the increase in the number of students attending public schools has not kept pace with resources spent. In constant terms, public expenditure increased by 72% between 1996 and 2005, while the number of students enrolled went up by 43%45. Furthermore, the quality of education is low, particularly in public schools. Schools reporting average ICFES results—a standardized test for seniors-- deemed “low” went from 40% in 1986 to over 60% in 1999 (Fundación Corona, 2003), while the 2005 SABER test portrays a worrisome picture in language and math, nationally and across regions, for 5th and 9th graders.46 Students have not fared well in international tests either47
. In 2003 97% of students from quintile 1 enrolled in primary school attended public institutions, while only 38% of children in the highest quintile did so, and there is evidence suggesting that the quality of public education is lower than the one offered by private schools, after controlling for socioeconomic differences (Núñez et al 2002).
Public teachers are part of the problem. The bulk of the rise in expenditure in education following the 1991 boost to decentralization has gone to paying wages48. Although there are three types of teachers --municipal, departmental and national49
-- wages are centrally determined and, given that most resources come from transfers by the CG, there is decoupling between the level of government administering the teacher roster and the level that negotiates wages and pays for them. Law 60 determined that transfers should be based on the number of students and teachers as of 1993. This perpetuated inefficiencies and whatever inequalities may have existed then. In 2001 Law 715 brought a major change, transfers now a function of the number of students –with actual costs taken into consideration. Still, with wages being set through centralized bargaining and with transfers paying for most of the wage bill, the incentives for a governor to transfer teachers to places where they are required the most does not seem particularly strong.
Until 2002, teaching activities were ruled by a 1979 statute which created a ranking of categories in which time-in-grade and skill upgrading were the main determinants of promotions, together with other incentives prone to abuse. Although the 1994 General Education Law established a system that should develop procedures to evaluate teachers, it was only in 2002 that a new statute, applicable to those joining after 2002, was enacted. It introduced evaluations, both for entering the system and for remaining and being
45 These rates of increase in expenditure are almost twice as large if we take the year prior to the 1991 CP as the base for comparisons. Unfortunately, we do not have access to reliable data on the number of students attending public institutions prior to 1996. 46 Scatter plots available upon request with data for all 31 departments and special districts suggest no discernible association between the 2005 SABER test results and GDP. 47 In the 1995 math and science TIMSS exam, 8th and 9th graders ranked next-to-last among 41 countries assessed. Colombian students ranked 29th out of 35 countries participating in the 2001 PIRLS reading literacy test. On a positive note, students now routinely participate in international evaluations, including the 2005 PISA exam performed by the OECD and in the 2006-07 versions of TIMSS. 48 Current expenditure (mainly wages) represented 92% of total expenditure on education in 1990-94 and 97% in 2000-05. Public teachers not only enjoyed a privileged pension regime; they also received some of the most generous wage adjustments. 49 In 2000 some 80% of public sector teachers were employed by the CG.
30
promoted. Some 274 thousand teachers out of a total of around 426 thousand—295 thousand of them in public schools--were evaluated in 2005. Regional and national authorities have embarked on efforts with the private sector to enhance enrollment and increase the quality of public education. Due to supply limitations in the public sector, using public resources to take advantage of private sector installed capacity has been a wise move. Recent initiatives include the PACES program at the national level (1991 to 1997) in which poor children were randomly given vouchers to attend private schools; ongoing concession schools in Bogotá and other major cities; the Escuela Nueva program in rural areas. They have all received positive evaluations.50
4. Some proposals for further strengthening the foundations for growth We have seen throughout the paper that although several reforms undertaken since 1990 strengthened some of the foundations for growth, other reforms had unintended consequences (Table 3). To mention the most salient examples, fiscal decentralization –particularly of expenditures on health and education—had adverse effects on macro stability, even if it helped in broad sharing the benefits of growth. A similar judgment can be made with regard to judicial reform, where the welcome expansion of access to the justice system came with a high fiscal price tag. Likewise, several reforms –to healthcare and pensions-- as well as restrictions from the local environment –emanating from the polity and the justice system—have been conducive to high and distortionary taxes on business and labor, and have therefore had a negative impact on competition. The past eight years have been devoted to making many of the reforms consistent with the goal of restoring fiscal sustainability, which is now widely understood to be a pre-requisite for growth to be sustainable, and to avoid the spikes in poverty associated with sharp economic contractions. The fine-tuning of the reforms in order to make them fiscally sustainable has included elements geared towards correcting design flaws that might have prevented them from fully delivering on their objectives. Still, much remains to be done. In what follows we provide several recommendations for enhancing the quality of certain reforms, giving particular attention to identifying the political and institutional constrains that have to be dealt with to make the suggested changes feasible. A. Removing constrains from the local environment The justice system No other reform seems as important as a fundamental review of aspects related to the acción de tutela and the way the CC operates. While upholding citizen’s rights to access the justice system, it is of paramount importance to curtail the justice system’s ability to tamper with economic policy matters in general and with macro stability in particular. At the same time, it is difficult to envision a more complicated task. After all, these are two enormously popular institutions; importantly, the CC is the final arbiter of any proposed
50 Angrist et al (2006) evaluate PACES; Barrera (2006) the Bogotá concession schools.
31
change. The challenge is to creatively provide incentives for the highest court to entertain some of these proposals.
• Appointments to the CC. Given how the CC is organized and the way in which they are chosen, magistrates face much the same incentives as politicians. There are 9 magistrates, elected by the senate for individual periods of 8 years, without the possibility of reelection. The senate chooses from triples of candidates proposed by the Executive, the Supreme Court and the Consejo de Estado51
. Upon retiring from the court, magistrates face almost no restrictions for involving in politics. There have been several who have catapulted themselves into politics. Some have proposed that justices should have life tenure and be nominated by the executive and confirmed by the Senate (Kugler and Rosenthal, 2005). We believe a less ambitious proposal would stand a better chance: there should be significantly long “cool-off” periods (say, 5 years) before a justice can run for elected office, in exchange for extending their tenure in the CC (to, say, 12 years).
• Tutela and “fundamental rights”. The dispute in which economists argue in favor of justices upholding the CP rather than re-writing it while lawyers believe justices can proclaim any right as being “fundamental” has delivered no common ground. An avenue worth exploring is the one put forward by former associate justice Uprimny (2001) who believes Colombia’s level of development should inform CC rulings. In his view, some rights cannot be of immediate application; they should be progressively attained. He proposes a consensual definition by all powers of what should constitute an adequate healthcare plan, so that judges should not uphold tutelas demanding services beyond what the plan includes. The content of such a program should be enhanced as the country becomes wealthier.
• Prior constitutional review. There is evidence that the executive and legislative
routinely produce low quality legislation. Breaches of procedure often occur, which are grounds for the CC to overturn a law. The CC should review laws as soon as they are approved, so that if they are to be over-turned on procedural grounds, this happens before they become operational.
The polity Additional work is needed to ensure that the goal of political inclusion is made compatible with a legislature better able to deliver high quality public policies in such a manner that the strengthening of one foundation for growth is not achieved at the expense of others. While 20 parties is a much more reasonable number than 322, it is still too big. To be sure, the biggest challenge is to translate into effective cohesion within the congress the decline in electoral fragmentation.
• Foster additional electoral consolidation. An obvious choice is to gradually increase thresholds needed to obtain representation –from 2% maybe up to 5%.
51 Although terms are not concurrent, in 2001 seven out nine justices were replaced at the same time.
32
• Promote stronger political parties. Campaign finance reform should identify
ways to strengthen links between a member of congress and his party. Public and private funds should go to the party rather than to the candidate. Also, a Ley de Bancadas with more teeth should be enacted, particularly to determine in the law, rather than in party statutes, sanctions for free-riding members of congress.
• Enhance legislative efficiency and transparency. Kugler and Rosenthal (2005)
argue in favor of granting fast-track authority allowing the president to submit to congress non-amendable propositions for urgent economic matters. This might be a good mechanism to avoid the watering down of legislation, a recurrent problem in the case of laws related to taxes. The proposal’s feasibility would be enhanced by a “sunset clause” allowing congress not to renew the authority if it so wishes after a set number of years. Transparency would be enhanced if voting is made nominal and public, except perhaps on issues related to objections of conscience.
B. Strengthening competition and broad-sharing benefits of growth by enhancing labor flexibility, promoting formalization and increasing pension coverage52
Colombia must persist in the elusive goal of enhancing labor market formalization in order to enhance competitiveness and ensure that all workers, and not just those currently in the formal sector, benefit from the benefits of growth. Two constrains seem insurmountable, at least in the short term: high contributions to fund health and pensions and a fully indexed SML. It is therefore essential to reduce non-wage labor costs other than social security contributions –i.e. contributions to ICBF, SENA and CCFs. This is no easy task; together, these programs administer resources that amount to 1% of GDP. In all three unionization is prevalent; they are backed by powerful political actors and provide employment to some 25.000 people (Echeverry and Santamaria 2004). At first glance, the solution seems simple: finance ICBF and SENA through user fees or the budget and end public funding to CCFs. In fact, this was one of the recommendations by a recent task force on public spending. The government’s response was ‘no’ as it caved in to pressure from interest groups according to whom if ICBF/SENA were to be paid out of general taxation, their existence would be a matter of debate during each budget cycle. Therefore, second-best options have to be considered.
• Earmark to ICBF/SENA revenue from general taxation, preferably the VAT,
rather than imposing surcharges on formal sector wages. While revenue earmarking is questionable along several dimensions, when unavoidable it should at least be in reference to the less distortionary taxes.
• CCFs should be financed through user fees, particularly given that informal
workers do not benefit from them. The move away from a tax on labor would be gradually phased-in. Reducing public financing should start by removing from
52 For 2002 Bustamante (2006) estimated that 21% of the labor force was affiliated to the pension system. Affiliation ranged from 73.7% in the formal sector to 13.9% in the informal sector, with 89% of affiliates coming from the urban areas, and a similar percentage from the three top deciles of the income distribution.
33
CCFs public policy tasks such as running the UI program, which should be in the hands of the government if it is indeed maintained53
.
C. Broadening the pool of beneficiaries of growth by promoting financial sector deepening and access and further developing the capital market
• Adopt a more liberal policy with regard to the usury rate and a less
restrictive definition of micro-credit. While it is politically impractical to eliminate the usury rate, the executive has ample room to make it less restrictive.
• Strike a better balance between creditor and debtor rights. To that effect, the
legal system should facilitate the structuring of guarantees by removing restrictions on the assets that can serve as such, and propend for the unification and updating of registries. Expeditious legal and paralegal procedures facilitating execution of a guarantee should be put in place.
• Provide incentives so that data bases become “populated”, once the CC
upholds the habeas data law. Utility companies should be allowed to report to credit bureaus the (generally favorable) information of their subscribers.
• AFPs investment possibilities. Regulations have skewed investments towards
public debt, causing a ‘flock-effect’. As proposed by Laserna (2007), AFPs could be required a minimum degree of diversification. Given the long-term nature of their assets, they should be matched to a more fitting demand, i.e. investment in infrastructure (Anif, 2007). A plausible way forward is a scheme in which each AFPs defines a reference portfolio upon which its performance is assessed.
D. A more business friendly tax code supporting competitiveness There is no other topic in which there seems to be more consensus as to what needs to be done than with regard to taxes, and this is not the place to repeat once again the specifics of how a “good” tax system should look like. The problem is not with the “what”, but rather with the “how”. To be sure, a less fragmented congress should be of much help, the executive negotiating the reform with a few strong parties rather than individually with each member of congress. Also, the government has to negotiate from a position of strength. In our view, a structural tax reform should only be submitted in the context of a buoyant fiscal juncture, one in which the executive can propose to congress improving the tax code while at the same time reducing the overall tax burden. E. A clear definition of responsibilities among levels of government in order to improve broad-sharing of opportunities without sacrificing macro stability Putting in place a decentralized system in a country with a long tradition of political and fiscal centralization is a challenge and any effort in that direction is bound to confront risks
53 The World Bank (2005) raised concerns with regard to conflict of interest with CCFs administering the UI program and questions the merit of focusing UI on workers previously employed in the formal sector.
34
and costs. Changes introduced in 1997-2003 have addressed many problems that ensued with the 1991-93 reforms. One key issue, however, remains unresolved: the delegation of responsibilities. Given the lack of a well-developed framework on territorial organization –congress has never issued a territorial organization law, LOT-- efforts to devolve responsibilities has been casuistic.54 Behind the label “public expenditure” stands all the intricacies of the business of providing public goods –particularly health and education. There are many actors, teachers the most visible, who benefit from duplicated expenditures and from ill-defined responsibilities55.56
Without such a framework, full devolution will take a long time and many benefits from decentralization will be delayed. Inasmuch as an important part of local goods are provided by the CG creates a situation in which TEs do not face a hard budget constrain and in which, to instill discipline, the CG has an important say in how expenditure is undertaken. Local governments are more accountable to the CG than to their constituents, while voters hold the CG accountable for problems with the provision of public goods, and react by demanding more resources from it.
Attempts at correcting the health system’s structural flaws should address three issues: generate adequate incentives at the sub-national level, improve targeting, and limit individual’s healthcare rights (as discussed above in reference to the CC).
• Increasing accountability at the local level is a must. With the CG providing most of the resources, incentives are weak for local authorities to enhance efficiency of their health institutions. Instead of being driven out of the market, inefficient providers are kept in operation, becoming a fiscal burden. In the end, it boils down to enforcing responsibilities acquired by governors. Public hospitals must be placed under close supervision to pinpoint and correct inefficiency problems and to avoid elite capture through corruption.
• Improving targeting systems is key for the sustainability and effectiveness of
the RS. Aside from creating a fiscal burden, flawed targeting is detrimental to the quality of the assistance provided. Although costly and technically demanding, an upgrade to the Sisben targeting system with a dynamic dimension- i.e. detecting and removing from the system households who have overcome poverty- should
54 The lack of a well-defined framework for devolution of resources and responsibilities has also made it all but impossible to entertain the possibility of sharing tax bases among levels of government –establishing a constrain to the purpose of allowing TEs to have an important say on tax issues. 55 An influential Senator recently argued that “…a Congress with regional and national representation is in no position to approve a substantive law that affects regional interest with regard to territory, financial resources and responsibilities“ (Pérez, 2006, pg. 76, our translation). 56 Soon after Congress approved Law 715 in 2001, the Secretary General of FECODE wrote an interesting piece, objecting to the new framework for decentralization (Arroyave, 2002). What comes clearly from this document is the opposition of teachers to the decentralization of education. The document complains that “the CG will no longer administer nor provide educational services”; that “headmasters will be made responsible for the quality of education”; that “the regional reallocation of teachers is now at the discretion of each TE”. The conclusion that we reach is that FECODE opposes decentralization because the union stands to obtain better working conditions under a centralized decision-making process.
35
be a priority. The long run cost of doing so is by far less than subsidizing the non-poor throughout their lifespan.
• Strengthen incentives to improve the quality of public education. Recent
notable efforts to this effect –including with regard to the evaluation, training and promotion of teachers, a better formula for distributing transfers, and the involvement of private schools in the provision of public education— can be constrained by the fact that most teachers are paid at the national level, limiting the extent of devolution and enhancement of responsibilities and accountability at the local level.
5. Concluding remarks In 1990 Colombia embarked on a comprehensive reform program that should have positively impacted on the foundations for growth, thereby making economic growth both fiscally as well as politically sustainable. In this paper we have showed that the initial reform drive failed to deliver on many of its expected promises, as a number of reforms actually weakened some of the foundations, particularly Colombia’s long held adherence to macro stability. The 1990s were, therefore, a decade of unfulfilled promises. Starting in 1999 the reform agenda was re-invigorated, and many of the design problems of the initial reform drive have been addressed. This process, coupled with a benign external environment and a much improved security situation, has of late produced enormous benefits in terms of economic growth and of a renewed decline in poverty. The job is, however, far from complete, and in many areas additional reforms are in need of being undertaken in order to make growth sustainable and even more inclusive. Here we have provided policy recommendations along many dimensions, taking good care of acknowledging that what is technically advisable is not always politically or institutionally feasible.
36
REFERENCES Angrist, J,E. Bettinger and M. Kremer (2006). “Long-Term Educational Consequences of Secondary School Voucher”, American Economic Review, June. ANIF (2005). “Mergers and Acquisitions in the Colombian Financial Sector: Impact on Efficiency (1990-2005)”. Research supported by the Ministry of Finance and US-AID. ANIF (2007). “Los fondos de pensiones y la financiación de la infraestructura”, Carta Financiera, No. 137, p.7-12. Arroyave, R. (2002). “La Ley 715 de 2001: “Hacia la privatización total de la educación”, mimeo. Barajas, A., R. Steiner and N. Salazar (2000). “The Impact of Liberalization and Foreign Investment in Colombia’s Financial Sector”, Journal of Development Economics, 63(1). Barón, G. (2007). "Cuentas de salud de Colombia 1993-2002: El gasto nacional en salud y su financiamiento", mimeo, Ministerio de la Protección Social. Barrera, F. (2006). “The Impact of Private Provision of Public Education: Empirical Evidence from Bogotá’s Concession Schools”, World Bank Policy Research WP 4121. Bernal, R. and M. Cárdenas (2003). “Determinants of Labor Demand in Colombia: 1976-1996”, NBER WP no. 10077. BID (2002). “Evaluación de la Política Económica en Colombia: Una Aproximación desde el Análisis de las Políticas Públicas”, June. Borjas, J. and O.L. Acosta (2000) “Educational Reform in Colombia”, in A. Alesina (ed.) Institutional Reforms: The Case of Colombia, MIT Press. Botero, F. (2000). “Circunscripción nacional y practicas electorales”, in E. Bonilla (comp.) Formación de Investigadores II, Ediciones Uniandes-Colciencias-Tercer Mundo. Botero, F. and J. C. Rodríguez (2007). “Escepticismo optimista. La reforma electoral colombiana de 2003”, in C.U. Santander and N. Penteado (eds.) Os processos eleitorias na América Latina. Brasilia Editorial LGE. Bustamante, J.P. (2006). “Factores que inciden en la cobertura del sistema pensional en Colombia”, Departamento Nacional de Planeación, Archivos de Economía, no. 312. Cadena, X. (2006). “The Next Step for the Colombian Pension System”, mimeo, Princeton University.
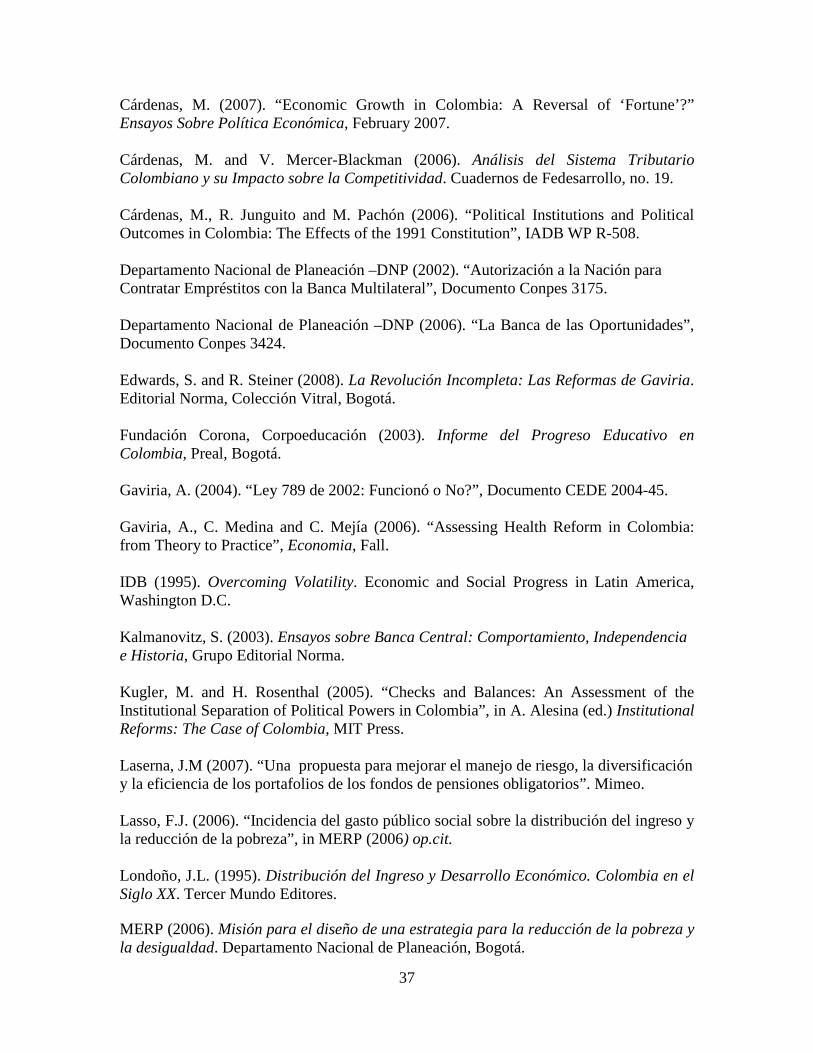
37
Cárdenas, M. (2007). “Economic Growth in Colombia: A Reversal of ‘Fortune’?” Ensayos Sobre Política Económica, February 2007. Cárdenas, M. and V. Mercer-Blackman (2006). Análisis del Sistema Tributario Colombiano y su Impacto sobre la Competitividad. Cuadernos de Fedesarrollo, no. 19. Cárdenas, M., R. Junguito and M. Pachón (2006). “Political Institutions and Political Outcomes in Colombia: The Effects of the 1991 Constitution”, IADB WP R-508. Departamento Nacional de Planeación –DNP (2002). “Autorización a la Nación para Contratar Empréstitos con la Banca Multilateral”, Documento Conpes 3175. Departamento Nacional de Planeación –DNP (2006). “La Banca de las Oportunidades”, Documento Conpes 3424. Edwards, S. and R. Steiner (2008). La Revolución Incompleta: Las Reformas de Gaviria. Editorial Norma, Colección Vitral, Bogotá. Fundación Corona, Corpoeducación (2003). Informe del Progreso Educativo en Colombia, Preal, Bogotá. Gaviria, A. (2004). “Ley 789 de 2002: Funcionó o No?”, Documento CEDE 2004-45. Gaviria, A., C. Medina and C. Mejía (2006). “Assessing Health Reform in Colombia: from Theory to Practice”, Economia, Fall. IDB (1995). Overcoming Volatility. Economic and Social Progress in Latin America, Washington D.C. Kalmanovitz, S. (2003). Ensayos sobre Banca Central: Comportamiento, Independencia e Historia, Grupo Editorial Norma. Kugler, M. and H. Rosenthal (2005). “Checks and Balances: An Assessment of the Institutional Separation of Political Powers in Colombia”, in A. Alesina (ed.) Institutional Reforms: The Case of Colombia, MIT Press. Laserna, J.M (2007). “Una propuesta para mejorar el manejo de riesgo, la diversificación y la eficiencia de los portafolios de los fondos de pensiones obligatorios”. Mimeo. Lasso, F.J. (2006). “Incidencia del gasto público social sobre la distribución del ingreso y la reducción de la pobreza”, in MERP (2006) op.cit. Londoño, J.L. (1995). Distribución del Ingreso y Desarrollo Económico. Colombia en el Siglo XX. Tercer Mundo Editores. MERP (2006). Misión para el diseño de una estrategia para la reducción de la pobreza y la desigualdad. Departamento Nacional de Planeación, Bogotá.
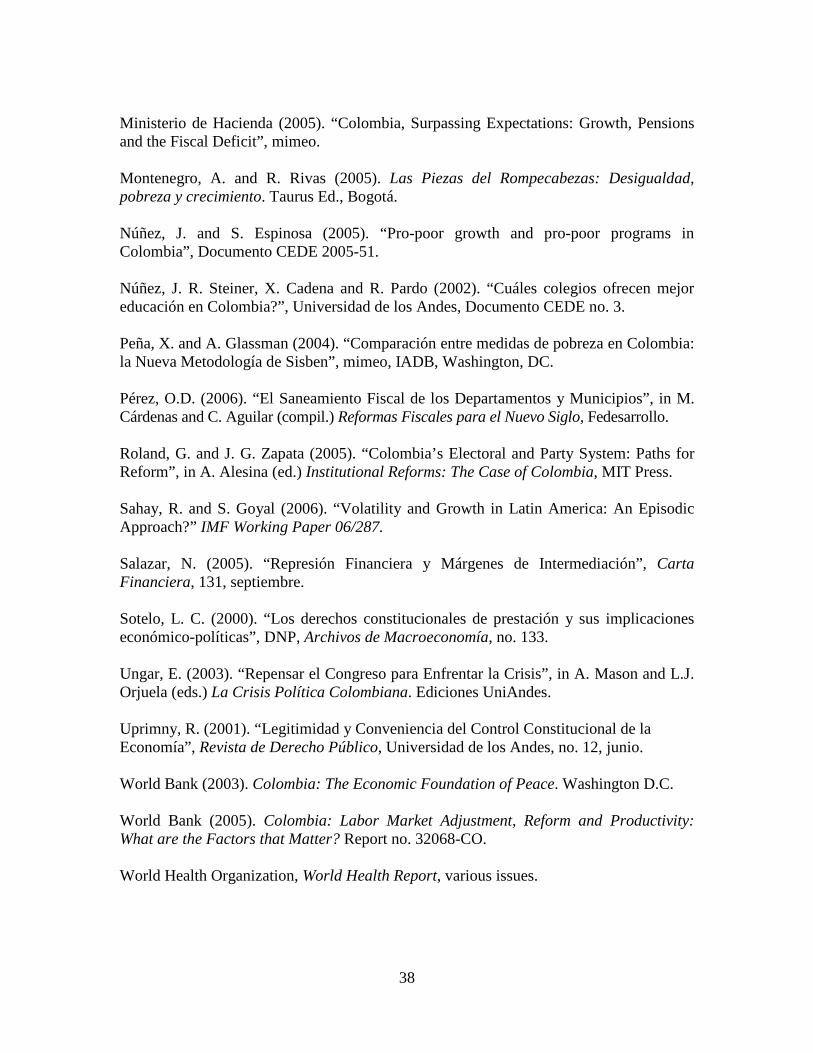
38
Ministerio de Hacienda (2005). “Colombia, Surpassing Expectations: Growth, Pensions and the Fiscal Deficit”, mimeo. Montenegro, A. and R. Rivas (2005). Las Piezas del Rompecabezas: Desigualdad, pobreza y crecimiento. Taurus Ed., Bogotá. Núñez, J. and S. Espinosa (2005). “Pro-poor growth and pro-poor programs in Colombia”, Documento CEDE 2005-51. Núñez, J. R. Steiner, X. Cadena and R. Pardo (2002). “Cuáles colegios ofrecen mejor educación en Colombia?”, Universidad de los Andes, Documento CEDE no. 3. Peña, X. and A. Glassman (2004). “Comparación entre medidas de pobreza en Colombia: la Nueva Metodología de Sisben”, mimeo, IADB, Washington, DC. Pérez, O.D. (2006). “El Saneamiento Fiscal de los Departamentos y Municipios”, in M. Cárdenas and C. Aguilar (compil.) Reformas Fiscales para el Nuevo Siglo, Fedesarrollo. Roland, G. and J. G. Zapata (2005). “Colombia’s Electoral and Party System: Paths for Reform”, in A. Alesina (ed.) Institutional Reforms: The Case of Colombia, MIT Press. Sahay, R. and S. Goyal (2006). “Volatility and Growth in Latin America: An Episodic Approach?” IMF Working Paper 06/287. Salazar, N. (2005). “Represión Financiera y Márgenes de Intermediación”, Carta Financiera, 131, septiembre. Sotelo, L. C. (2000). “Los derechos constitucionales de prestación y sus implicaciones económico-políticas”, DNP, Archivos de Macroeconomía, no. 133. Ungar, E. (2003). “Repensar el Congreso para Enfrentar la Crisis”, in A. Mason and L.J. Orjuela (eds.) La Crisis Política Colombiana. Ediciones UniAndes. Uprimny, R. (2001). “Legitimidad y Conveniencia del Control Constitucional de la Economía”, Revista de Derecho Público, Universidad de los Andes, no. 12, junio. World Bank (2003). Colombia: The Economic Foundation of Peace. Washington D.C. World Bank (2005). Colombia: Labor Market Adjustment, Reform and Productivity: What are the Factors that Matter? Report no. 32068-CO. World Health Organization, World Health Report, various issues.