collwe iowa university · iowa department of transportation and the highway research advisory board...
TRANSCRIPT
R. E. Abendroth, E W. Klaiber, M. W. Shafer
Lateral Load Resistance of Diaphragms in Prestressed Concrete Girder Bridges
December 1991
Sponsored by the Highway Division of the
Iowa Department of Transportation and the Highway Research Advisory Board
Iowa DOT Project HR-319 ISU-ERI-Ames-92076
Iowa Department of Transportation I
Collwe of Engineering
Iowa State University

R. E. Abendroth, E W. Klaiber, M. W. Shafer
Lateral Load Resistance of Diaphragms in Prestressed Concrete Girder Bridges
Sponsored by the Highway Division of the
Iowa Department of Transportation and the Highway Research Advisory Board.
Iowa DOT Project HR-319 ISU-ERI-Ames-92076
iowa state university
TABLE OF CONTENTS
k!.aE
LISTOFF'IGURES ........................................................ vii
LISTOFTABLES ......................................................... xv
ABSTRACT ............................................................... 1
1 . INTRODUCTION ...................................................... 3
................................................. 1.1. GeneralBackground 3
1.2. Objective and Scope ................................................. 7
1.3. Research Program .................................................. 7
.................................................... 1.4. Literature Review 9
........................................... 1.5. Review of Current Practice 11
.................................... 2 . DESCRIPTION OF TEST SPECIMENS 17 .
............................................ 2.2. Intermediate Diaphragms 22
...................... 2.2.1. Diaphragm Types. Locations. and Designations 22
...................... 2.2.2. Reinforced Concrete Intermediate Diaphragms 22 ........................... 2.2.3. Steel Channel Intermediate Diaphragms 28
................................ 2.2.3.1. Deep Channel Diaphragm 28 ............................... 2.2.3.2. Shallow Channel Diaphragm 28
............................ 2.2.4. Steel X-Brace Intermediate Diaphragms 30 .................................... 2.2.4.1. With Horizontal Strut 30
................................. 2.2.4.2. Without Horizontal Strut 35 2.2.5. No Diaphragms .............................................. 35
....................................... 3 . TESTS AND TEST PROCEDURES 37
..................................................... 3.1. Instrumentation 37
3.2.1. Vertical Loading .............................................. 44 ............................................ 3.2.2. Horizontal Loading 47

3.3.1. Vertical Loading .............................................. 53 3.3.2. Horizontal Loading ........................................... 54
................................. 3.3.3. Horizontal Plus Vertical Loading 55
......................................... 4 . ANALYSIS AND TEST RESULTS 57
4.1. Finite-Element Investigation .......................................... 57
4.1.1. Finite-Element Model ........................................ 57 4.1.2. Effect of the End Fixity ....................................... 65 4.1.3. Load Distribution' Analysis ..................................... 68
4.2. Experimental Investigations ........................................... 74
Deck Cracking Effects on Bridge Response ........................ 74 Reinforced Concrete Diaphragm Connection Effects on Bridge Response .................................................. 79 Steel Channel Diaphragm Connection Effects on
............................................ BridgeResponse 81 Steel X-Brace Diaphragm Connection Effects on
............................................ BridgeResponse 89 Load Versus Deflection Behavior ................................ 89
...................................... Load Distribution Study 100
...................................... Beam and Deck Strains 106 .......................................... Diaphragm Strains 113
4.3. Comparison of Analytical and Experimental Results ........................ 115
4.3.1. Displacement Distribution Along the Bridge Span .................. 115 4.3.2. Horizontal Load Versus Horizontal Deflection Behavior ............. 124
.......................... 4.3.2.1. No Intermediate Diaphragms 124 .3.2. 2. Midspan Intermediate Diaphragms ...................... 127
................... 4.3.2.3. Third-Point Intermediate Diaphragms 143 4.3.3. Vertical Load Versus Vertical Deflection Behavior .................. 155
.......................... 4.3.3.1. No Intermediate Diaphragms 155 4.3.3.2. Midspan Intermediate Diaphragms ...................... 155
................... 4.3.3.3. Third-Point Intermediate Diaphragms 161
........................................ 5 . SUMMARY AND CONCLUSIONS 163
5.1. Summary ........................................................ 163
...................................................... 5.2. Conclusions 165

6 . RECOMMENDED CONTINUED STUDIES . . . . . . . . . . . . . . . . . . . . . . . . . . . . . . . . 169'
7 . REFERENCES ........................................................ 171
................................................. 8 . ACKNOWLEDGMENTS 173
APPENDIX A: Design Agency Questionnaire Results ............................. 17.5
APPENDIX B: Bridge Details ............................................... 187
LIST OF F i ~ ~
BE
Fig . 1.1. Typical diaphragms used in PIC bridges .............................. 13
Fig . 2.1. Photographs of bridge model ...................................... 18
Fig . 2.2. Modelbridge .................................................. 20
Fig . 2.3.
Fig . 2.4.
Fig . 2.5.
Fig . 2.6.
Fig . 2.7.
Fig . 3.1.
Fig . 3.2.
Fig . 3.3.
Fig . 3.4.
Fig . 3.5.
Fig . 3.6.
Fig . 3.7.
Fig . 4.1.
Fig . 4.2.
Fig . 4.3.
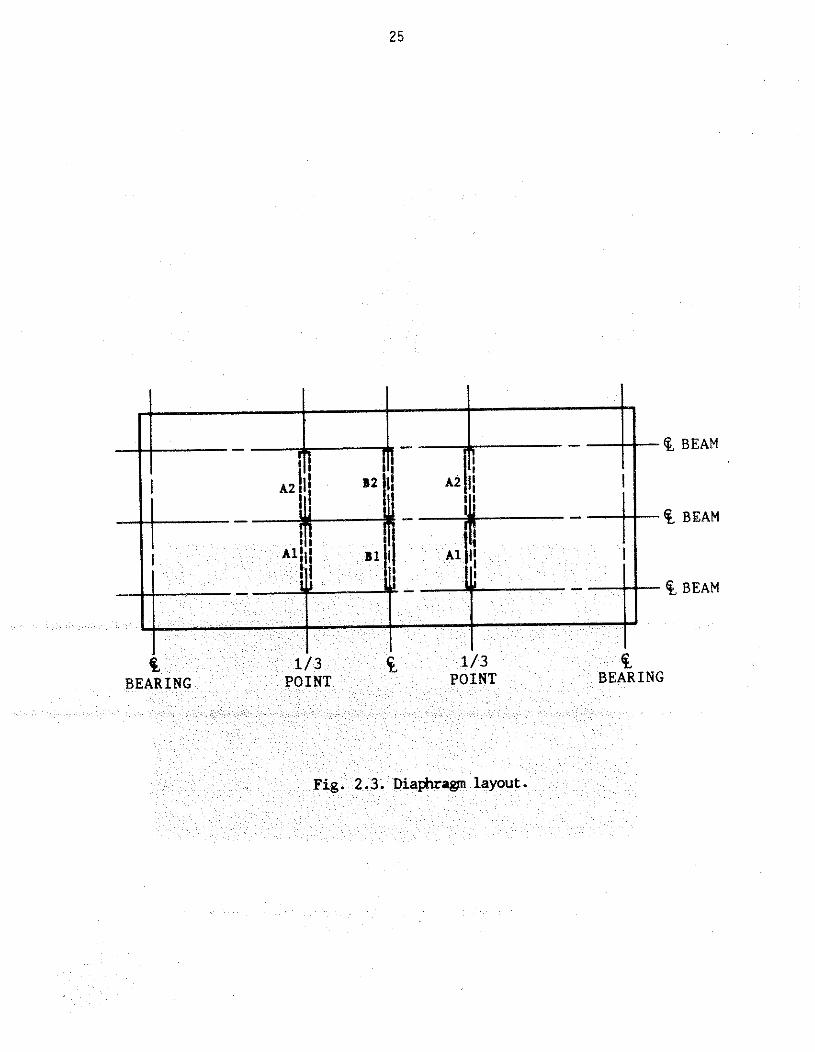
Diaphragm layout ............................................... 25
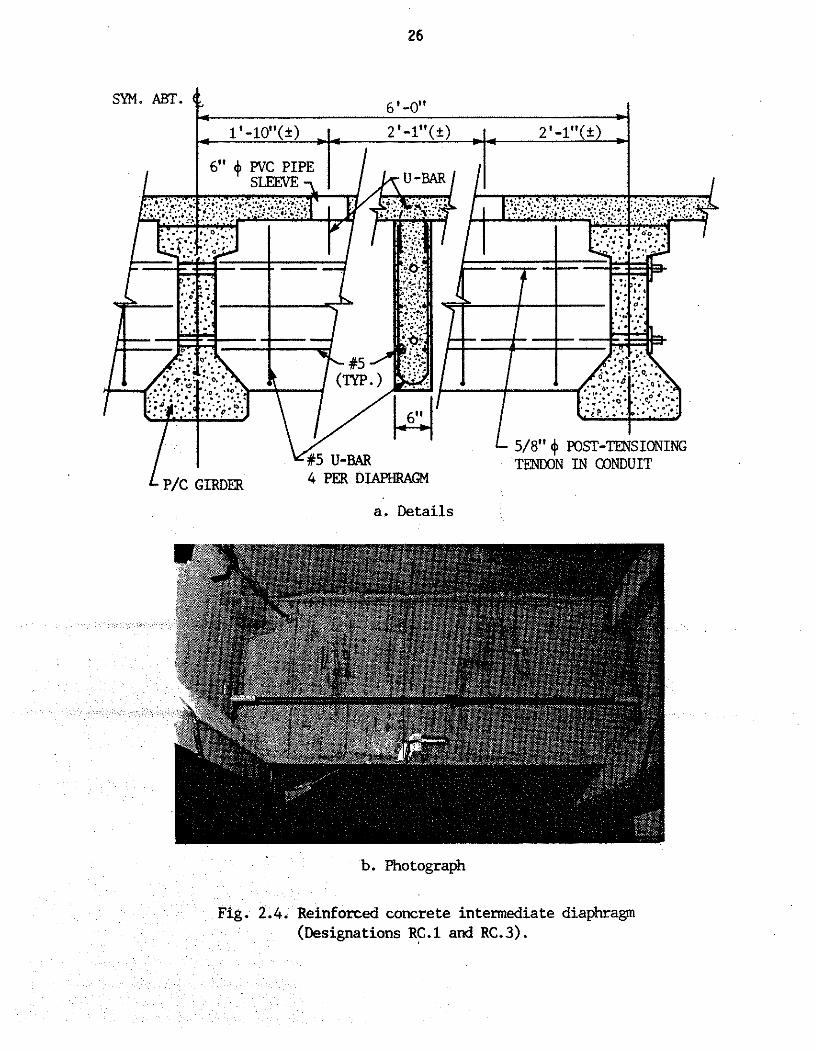
Reinforced concrete intermediate diaphragm (Designations RC.1 andRC.3) ..................................................... 26
Deep steel channel intermediate diaphragm (Designations C2.1 andC2.3) ..................................................... 29
Shallow steel channel intermediate diaphragm (Designations C1.l andC1.3) ..................................................... 31
Steel X-brace intermediate diaphragm (With horizontal strut. Designation X1.1 and without horizontal strut. Designation X2.1) .......... 33
Location of strain gages on PIC girders ............................... 39
Location of strain gages on deck. ................................... 40
Location of strain gages on diaphragms ............................... 41
Location of deflection instrumentation ................................ 43
hadpoints ................................................... 45
.......................................... Vertical loading scheme 46
........................................ Horizontal loading scheme 48
Finite element idealization of bridge and diaphragms .................... 59
Effect of end restraint and type of centerline diaphragm on vertical load-deflection curves: load at point 4. deflection
..................................................... at point 4 66
Effect of end restraint and type of centerline diaphragm on horizontal load-deflection curves: load at point 4. deflection
..................................................... atpoint4 67
m OF FIGURES
Fig . 4.4.
Fig . 4.5.
Fig . 4.6.
Fig . 4.7.
Fig . 4.8.
Fig . 4.9.
Fig . 4.10.
Fig . 4.1 1 . Fig . 4.12.
Fig . 4.13.
Fig . 4.14.
Fig . 4.15.
Fig . 4.16.
Fig . 4.17.
Fig . 4.18.
Fig . 4.19.
Fig . 4.20.
Fig . 4.21.
Fig . 4.22.
Theoretical distribution factors: vertical load at point 4 .................. 69
Theoretical distribution factors: vertical load at point 5 .................. 70
Theoretical distribution factors: horizontal load at point 4 ................ 72
Theoretical distribution factors: horizontal Ioad at point 5 ................ 73
Major longitudinal deck cracks ..................................... 75
Horizontal load versus deflection at point 4 for C1.l diaphragms ........... 83
Horizontal load versus deflection at point 5 for C1.l diaphragms ........... 83
Horizontal load versus deflection'at point 6 for C1.l diaphragms ........... 84
Horizontal toad versus deflection at point 4 for C2.1 diaphragms ........... 86
Horizontal load versus deflection at point 5 for (2.1 diaphragms ........... 86 .
Horizontal load versus deflection at point 6 for (2.1 diaphragms ........... 87
Horizontal load versus deflection at point 7 for (2.1 diaphragms ........... 87
Horizontal load versus deflection at point 4 for two positions of C1.1diaphragms ................................................ 88
Vertical loaddeflection curves: diaphragm at centerline. deflection at point 4 load at point 4 ................................. 91
Vertical loaddeflection curves: diaphragms at third points. deflection at point 4. load at point 4 ................................. 92
at point 5. load at point 4 ......................................... 93
Vertical loaddeflection curves: diaphragms at third points. deflection at point 5. load at point 4 ......................................... 94
Horizontal loaddeflection curves: diaphragm at centerline. deflection andloadatpoint4 .............................................. 95
Horizontal load-deflection curves: diaphragms at third points. deflection .............................................. a n d l o a d a t p i n t 4 96
LIST OF FKGURES
Fig. 4.23.
Fig. 4.24.
Fig. 4.25.
Fig. 4.26.
Fig. 4.27.
Fig. 4.28.
Fig. 4.29.
Fig. 4.30.
Fig. 4.31.
Horizontal load-deflection curves: diaphragms at centerline, deflection at point 5, load at point 4 . . . . . . . . . . . . . . . . . . . . . . . . . . . . . . . . . . . . . . . . . 98
Horizontal load-deflection c u m : diaphragms at third points, deflection at point 5, load at point 4 . . . . . . . . . . . . . . . . . . . . . . . . . . . . . . . . . . . . . . . . . 98
Horizontal load-deflection curves: diaphragms at third points: load and deflection at point 4; diaphragms at center line: load and deflection a tpoint7 ..................................................... 99
Horizontal loaddeflection curves: diaphragms at third points: load and deflection at point 5; diaphragms at center line: load and deflection at point 8 . . . . . . . . . . . . . . . . . . . . . . . . . . . . . . . . . . . . . . . . . . . . . 99
Vertical deflection at points 4, 5, and 6, for a 20 kip upwards vertical forceatpoint4 ................................................ 101
Vertical deflection at points 4,5, and 6, for a 20 kip upwards vertical force at point 5 . . . . . . . . . . . . . . . . . . . . . . . . . . . . . . . . . . . . . . . . . . . . . . . . 101
Vertical deflection at points 4, 5, and 6, for a 20 kip upwards vertical force at point 6 . . . . . . . . . . . . . . . . . . . . . . . . . . . . . . . . . . . . . . . . . . . . . . . . 102
Horizontal deflection at points 4,5, and 6, for a 40 kip horizontal force at point 4 . . . . . . . . . . . . . . . . . . . . . . . . . . . . . . . . . . . . . . . . . . . . . . . . 104
Horizontal deflection at points 4,5, and 6, for a 40 kip horizontal force at point 5 . . . . . . . . . . . . . . . . . . . . . . . . . . . . . . . . . . . . . . . . . . . . . . . . 104
Fig. 4.32. Horizontal deflection at points 4 5, and 6, for a 40 kip horizontal force at point 6. . . . . . . . . . . . . . . . . . . . . . . . . . . . . . . . . . . . . . . . . . . . . . . . 105
Fig. 4.33. Beam horizontal deflections for a 50 kip horizontal force at point 4 andnodiaphragms ............................................. 116
Fig. 4.34. Beam horizontal deflections for a 50 kip horizontal force at point 5 andC1.1diaphragms ........................................... 116
Fig. 4.35. Beam horizontal deflections for a 50 kip horizontal force at point 4 andC1.1diaphragms ........................................... 117
Fig. 4.36. Beam horizontal deflections for a 50 kip horizontal force at point 5 andRC.1diaphragms ........................................... 118
Fig. 4.37. Beam horizontal deflections for a 50 kip horizontal force at point 4 andRCldiaphragms ........................................... 119
Fig. 4.38. Beam horizontal deflections for a 50 kip horizontal force at point 4 and C2.1 diaphragms . . . . . . . . . . . . . . . . . . . . . . . . . . . . . . . . . . . . . . . . . . . 120
Fig. 4.39. Beam horizontal deflections for a 50 kip horizontal force at point 5 and X1.l diaphragms . . . . . . . . . . . . . . . . . . . . . . . . . . . . . . . . . . . . . . . . . . . 121
Fig. 4.40. Beam horizontal deflections for a 50 kip horizontal force at point 4 andX1.1diaphragms ........................................... 121
Fig. 4.41. Beam horizontal deflections for a 50 kip horizontal force at point 4 andX2.1diaphragms ........................................... 122
Fig. 4.42. Horizontal load versus deflection curves: load and deflection at point 5, no intermediate diaphragms . . . . . . . . . . . . . . . . . . . . . . . . . . . . . . . 125
Fig. 4.43. Horizontal load versus deflection curves: load at point 5, deflection at point 6, no intermediate diaphragms . . . . . . . . . . . . . . . . . . . . . . . . . . . . . 125
Fig. 4.44. Horizontal load versus deflection curves: load at point 6, deflection at point 5, no intermediate diaphragms . . . . . . . . . . . . . . . . . . . . . . . . . . . . . 126
Fig. 4.45. Horizontal load versus deflection curves: load and deflection at point 6, no intermediate diaphragms . . . . . . . . . . . . . . . . . . . . . . . . . . . . . . . 126
Fig. 4.46. Horizontal load versus deflection curves: load and deflection at point 4, C1.l diaphragms . . . . . . . . . . . . . . . : . . . . . . . . . . . . . . . . . . . . . . . . 128
Fig. 4.48. Horizontal load versus deflection curves: load at point 4, deflection at point 6, C1.1 diaphragms . . . . . . . . . . . . . . . . . . . . . . . . . . . . . . . . . . . . . . 129
int 4, . .. . . .. . . 131
Fig. 4.50. Horizontal load versus deflection curves: load and deflection at point 5, C2.1 diaphragms ............................................... 131
Fig. 4.51. Horizontal load versus deflection curves: load and deflection at point 6, C2.1 diaphragms ............................................... 132
Fig. 4.52. Horizontal load versus deflection curves: load at point 4, deflection at point 5, (2.1 diaphragms . . . . . . . . . . . . . . . . . . . . . . . . . . . . . . . . . . . . . . . . 133
Fig. 4.53. Horizontal load versus deflection curves: load at point 5, deflection at point 4, CZ.1 diaphragms . . . . . . . . . . . . . . . . . . . . . . . . . . . . . . . . . . . . . . . . 133

Fig. 4.54.
Fig. 4.55.
Fig. 4.56.
Fig. 4.57.
Fig. 4.58.
Fig. 4.59.
Fig. 4.60.
Fig. 4.61.
Fig. 4.62.
Fig. 4.63.
Fig. 4.64.
Fig. 4.65.
Fig. 4.66.
Fig. 4.67.
Fig. 4.68.
Horizontal load versus deflection curves: load at point 4, deflection at point 6, C2.1 diaphragms . . . . . . . . . . . . . . . . . . . . . . . . . . . . . . . . . . . . . . . . 134
Horizontal load versus deflection curves: load at point 6, deflection at point 4, C2.1 diaphragms . . . . . . . . . . . . . . . . . . . . . . . . . . . . . . . . . . . . . . . . 134
Horizontal load versus deflection curves: load at point 5, deflection at point 6, C2.1 diaphragms . . . . . . . . . . . . . . . . . . . . . . . . . . . . . . . . . . . . . . . . 135
Horizontal load versus deflection curves: load at point 6, deflection at point 5, C2.1 diaphragms . . . . . . . . . . . . . . . . . . . . . . . . . . . . . . . . . . . . . . . . 135
Horizontal load versus deflection curves: load and deflection at point 4, RC.1diaphragms .............................................. 137
Horizontal load versus deflection curves: load at point 4, deflection at point 5, RC.1 diaphragms . . . . . . . . . . . . . . . . . . . . . . . . . . . . . . . . . . . . . . . . 137
Horizontal load versus deflection curves: load at point 4, deflection at point 6, RC.l diaphragms . . . . . . . . . . . . . . . . . . . . . . . . . . . . . . . . . . . . . . . . 138
Horizontal load versus deflection curves: load and deflection at point 5, RC.1diaphragms .............................................. 138
Horizontal load versus deflection curves: load at point 5, deflection at point 6, RC.l diaphragms . . . . . . . . . . . . . . . . . . . . . . . . . . . . . . . . . . . . . . . 139
Horizontal load versus deflection curves: load and deflection at point 6, RC.1diaphragms .............................................. 139
Horizontal load versus deflection curves: load and deflection at point 5, X1.1diaphragms ............................................... 140
Horizontal load versus deflection curves: load at point 5, deflection at point 6, X1.1 diaphragms . . . . . . . . . . . . . . . . . . . . . . . . . . . . . . . . . . . . . . . . 140
Horizontal load versus deflection curves: load at point 6, deflection at point 4 X1.1 diaphragms . . . . . . . . . . . . . . . . . . . . . . . . . . . . . . . . . . . . . . . . 141
Horizontal load versus deflection curves: load at point 6, deflection at point 5, X1.1 diaphragms . . . . . . . . . . . . . . . . . . . . . . . . . . . . . . . . . . . . . . . . 141
Horizontal load versus deflection curves: load and deflection at point 6, X1.1diaphragms ............................................... 142
Fig. 4.69. Horizontal load versus deflection curves: load and deflection at point 5, X2.1 diaphragms ............................................... 144
Fig. 4.70. Horizontal load versus deflection curves: load at point 5, deflection at point 6, X2.1 diaphragms . . . . . . . . . . . . . . . . . . . . . . . . . . . . . . . . . . . . . . . . 144
Fig. 4.71. Horizontal load versus deflection curves: load at point 6, deflection at point 4, X2.1 diaphragms . . . . . . . . . . . . . . . . . . . . . . . . . . . . . . . . . . . . . . . . 145
Fig. 4.72. Horizontal load versus deflection curves: load at point 6, deflection at point 5, X2.1 diaphragms . . . . . . . . . . . . . . . . . . . . . . . . . . . . . . . . . . . . . . . . 145
Fig. 4.73. Horizontal load versus deflection cuwes: load and deflection at point 6, X 2 . l d i a p h r a g m s . . . . . . . . . . . . . . . . . . . . . . . . . . . . . . . . . . . . . . . . . . . . . . . 146
Fig. 4.74. Horizontal load versus deflection curves, load at point 5, deflection at point 4, C1.3 diaphragms . . . . . . . . . . . . . . . . . . . . . . . . . . . . . . . . . . . . . . . . 147
Fig. 4.75. Horizontal load versus deflection curves, load and deflection at point 5, C1.3diaphragms ............................................... 147
Fig. 4.76. Horizontal load versus deflection curves, load at point 5, deflection at point 6, C1.3 diaphragms . . . . . . . . . . . . . . . . . . . . . . . . . . . . . . . . . . . . . . . . 148
Fig. 4.77. Horizontal load versus deflection curves, load at point 6, deflection at point 4, C2.3 diaphragms . . . . . . . . . . . . . . . . . . . . . . . . . . . . . . . . . . . . . . . . 150
Fig. 4.78. Horizontal load versus deflection curves, load at point 6, deflection at point 5, C2.3 diaphragms . . . . . . . . . . . . . . . . . . . . . . . . . . . . . . . . . . . . . . . . 150
Fig. 4.79. Horizontal load versus deflection curves, load and deflection at point 6, C2.3 diaphragms . . . . . . . . . . . . . . . . . . . . . . . . . . . . . . . . . . . . . . . . . . . . . . . 151
deflection curves, load and deflection at point 4, RC.3 diaphragms . . . . . . . . . . . . . . . . . . . . . . . . . . . . . . . . . . . . . . . . . . . . . . 152
Fig. 4.81. Horizontal load versus deflection curves, load at point 4, deflection at point 5, RC.3 diaphragms . . . . . . . . . . . . . . . . . . . . . . . . . . . . . . . . . . . . . . . . 152
Fig. 4.82. Horizontal load versus deflection curves, load at point 4, deflection at point 6, RC.3 diaphragms . . . . . . . . . . . . . . . . . . . . . . . . . . . . . . . . . . . . . . . . 153
Fig. 4.83. Horizontal load versus deflection curves, load and deflection at point 5, RC.3 diaphragms . . . . . . . . . . . . . . . . . . . . . . . . . . . . . . . . . . . . . . . . . . . . . . 153
Fig . 4.84.
Fig . 4.85.
Fig . 4.86.
Fig . 4.87.
Fig . 4.88.
Fig . 4.89.
Fig . 4.90.
Fig . 4.91.
Fig . 4.92.
Fig . 4.93.
Fig . 4.94.
Fig . 4.95.
Fig . B.1.
Fig . B.2.
Fig . B.3.
Fig . B.4.
Fig . B.5.
Fig . B.6.
LIST OF FIGURES &gQ
Horizontal load versus deflection curves. load at point 5. deflection at point 6. RC.3 diaphragms ........................................ 154
Horizontal load versus deflection curves. load and deflection at ........................................ point 6. RC.3 diaphragms 154
Vertical load versus deflection curves. load at point 6. deflection at ............................... point 5. no intermediate diaphragms 156
Vertical load versus deflection curves. load and deflection at point 6. ...................................... no intermediate diaphragms 156
Vertical load versus deflection curves. load at point 6. deflection at ........................................ point 5. C1.1 diaphragms 157
Vertical load versus deflection curves. load and deflection at point 6. C1.1diaphragms ............................................... 157
Vertical load versus deflection curves. load and deflection at point 4. .............................................. RC.l diaphragms 159
Vertical load versus deflection curves. load and deflection at point 5. RC-ldiaphragms .............................................. 159
Vertical load versus deflection curves. load and deflection at point 6. .............................................. RC.1 diaphragms 160
Vertical load versus deflection curves. load at point 6. deflection at ........................................ point 5. RC.1 diaphragms 160
Vertical load versus deflection curves. load at point 6. deflection at ........................................ point 5. RC.3 diaphragms 162
Vertical load versus deflection curves. load and deflection at point 6. RC.3diaphragms .............................................. 162
.............................................. PIC girder inserts 189
........................................ PIC girder support details 190
......................... Abutment and end diaphragm reinforcement 191
........................... Longitudinal reinforcement in top of deck 192
........................ Longitudinal reinforcement in bottom of deck 193
Transverse deck reinforcement ................ : ................... 194
LIST OF TABLES
Table 2.1.
Table 2.2.
Table 3.1.
Table 4.1.
Table 4.2.
Table 4.3.
Table 4.4.
Table A1 .
......................... Concrete strengths
Intermediate diaphragm designations ...........
Loadtests ................................ ..................... Impact forces on bridge
...... Maximum strains due to horizontal loading
......... Maximum strains due to vertical loading
..................... Girder stresses 4. ...... ........ Impact occurrence and resulting damage
ABSTRACT
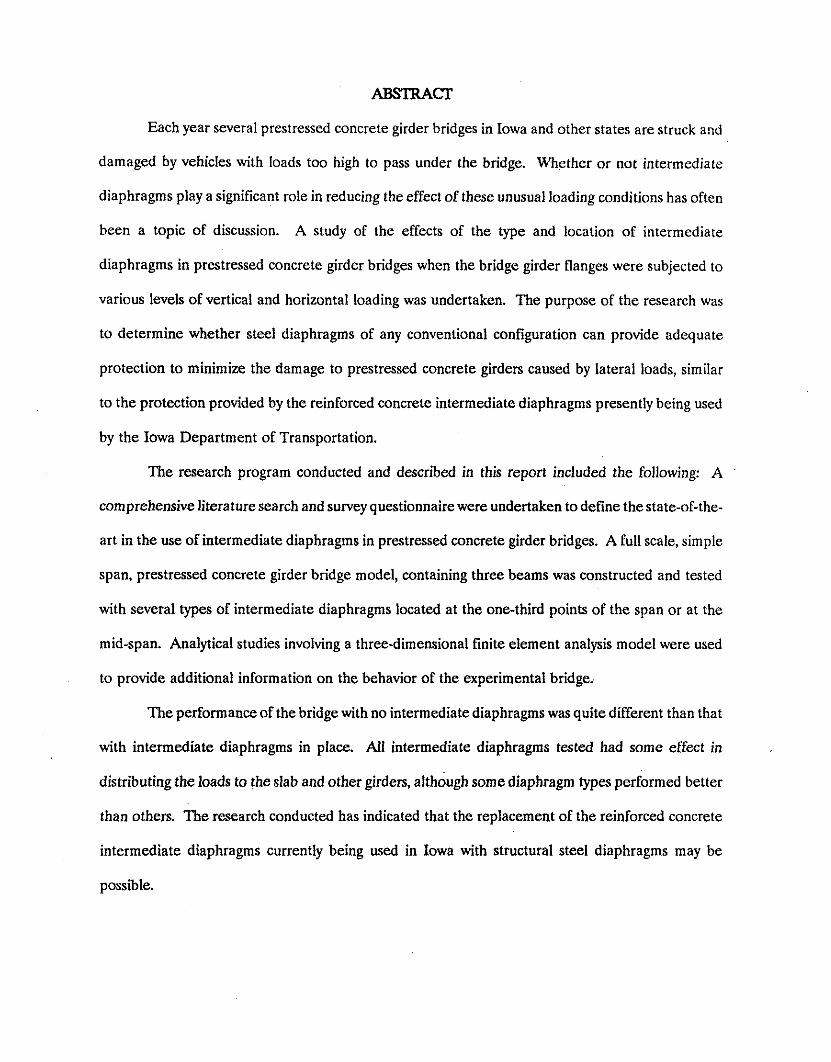
Each year several prestressed concrete girder bridges in Iowa and other states are struck and
damaged by vehicles with loads too high to pass under the bridge. Whether or not intermediate
diaphragms play a significant role in reducing the effect of these unusual loading conditions has often
been a topic of discussion. A study of the effects of the type and location of intermediate
diaphragms in prestressed concrete girder bridges when the bridge girder flanges were subjected to
various levels of vertical and horizontal loading was undertaken. The purpose of the research was
to determine whether steel diaphragms of any conventional configuration can provide adequate
protection to minimize the damage to prestressed concrete girders caused by lateral loads, similar
to the protection provided by the reinforced concrete intermediate diaphragms presently being used
by the Iowa Department of Transportation.
The research program conducted and described in this report included the following: A
comprehensive literature search and survey questionnaire were undertaken to define the state-of-the-
art in the use of intermediate diaphragms in prestressed concrete girder bridges. A full scale, simple
span, prestressed concrete girder bridge model, containing three beams was constructed and tested
with several types of intermediate diaphragms located at the one-third points of the span or at the
mid-span. Analytical studies involving a three-dimensional finite element analysis model were used
to provide additional information on the behavior of the experimental bridge.
The performance of the bridge with no intermediate diaphragms was quite different than that
with intermediate diaphragms in place. ,411 intermediate diaphragms tested had some effect in
distributing the loads to theslab and other girders, although some diaphragm types performed better
than others. The research conducted has indicated that the replacement of the reinforced concrete
intermediate diaphragms currently being used in Iowa with structural steel diaphragms may he
possible.
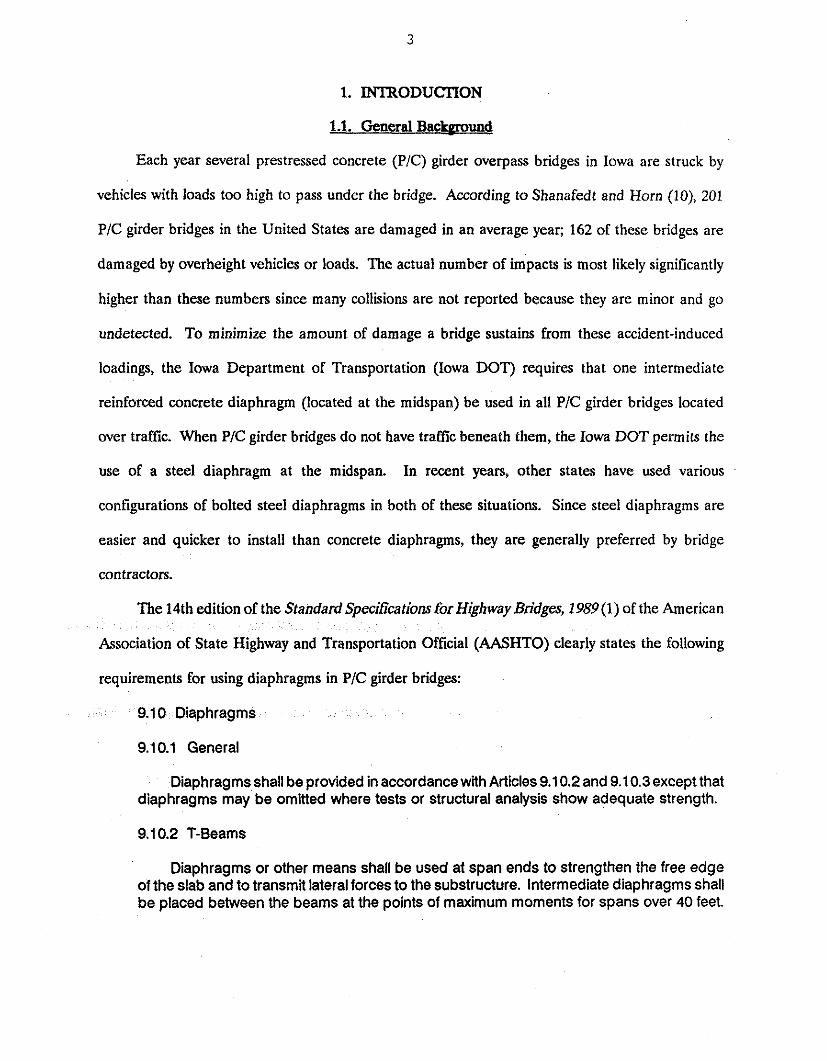
1.1. General Backround
Each year several prestressed concrete (PIC) girder overpass bridges in Iowa are struck by
vehicles with loads too high to pass under the bridge. According to Shanafedt and Horn (lo), 201
PIC girder bridges in the United States are damaged in an average year; 162 of these bridges are
damaged by overheight vehicles or loads. The actual number of impacts is most likely significantly
higher than these numbers since many collisions are not reported because they are minor and go
undetected. To minimize the amount of damage a bridge sustains from these accident-induced
loadings, the Iowa Department of Transportation (Iowa DOT) requires that one intermediate
reinforced concrete diaphragm (located at the midspan) be used in all PIC girder bridges located
over traffic. When PIC girder bridges do not have traftic beneath them, the Iowa DOT permits the
use of a steel diaphragm at the midspan. In recent years, other states have used various
configurations of bolted steel diaphragms in both of these situations. Since steel diaphragms are
easier and quicker to install than concrete diaphragms, they are generally preferred by bridge
contractors.
The 14th edition of the Standard Specifications for Highway Bridges, 1989(1) of the American
Association of State Highway and Transportation Official (AASHTO) clearly states the following
requirements for using diaphragms in PIC girder bridges:
9.1 0 Diaphragms
9.1 0.1 General
Diaphragms shall be provided in accordance with Articles 9.1 0.2 and 9.1 0.3 except that diaphragms may be omitted where tests or structural analysis show adequate strength.
Diaphragms or other means shall be used at span ends to strengthen the free edge of the slab and to transmit lateral forces to the substructure. Intermediate diaphragms shall be placed between the beams at the points of maximum moments for spans over 40 feet.

9.10.3 Box Girders
9.10.3.1 For spread box beams, diaphragms shall b e placed ... No change was made in these requirements in the Interim Specifications--Bridges 1991 (2). Although the phraseology was changed in the proposed LRFD Bridge Design Code (7), the requirements are essentially the same. The LRFD Bridge Design Code diaphragm requirement in PIC girder bridges are as follows:
5.1 3 Specific Members
5.1 3.2.2 Diaphragms
End diaphragms shall be provided to support the deck at all points of discontinuity. End-type diaphragms may also be required between girders over points of support at piers, abutments and hinges to distribute shear forces to the bearings.
Intermediate diaphragms shall be provided to assist in the distribution of live loads among the girders and to resist torsional forces at the locations specified in Article 5.1 4.
Diaphragms should generally be designed as deep beams.
5.1 4 Provisions for Structure Types
Diaphragms shall be used at the ends of girder spans, unless other means are provided to resist lateral forces, to strengthen the free edge of the slab and to maintain section geometry. Diaphragms may b e omitted where tests or structural analysis show adequate strength.
For I-girder and T-girder spans, one intermediate diaphragm shall be placed at the point of maximum positive moment for spans in excess of 40 feet.
For curved box girder bridges having ... Although required by AASHTO specifications, the use of diaphragms in PIC bridges is controversial.
Several states do not use intermediate diaphragms of any type in PIC girder bridges whereas other
states use either diaphragms at the midspan, one-third points or onequarter points depending on
the span length. As this project involved the use of diaphragms in PIC girder bridges, the authors
have chosen to review three of the directly related references in this section.
Sithichaikasem and Gamble (12) and Wong and Gamble (14) reported on the diaphragm
research completed at the University of Illinois. Although the goal of this research was to determine

the effectiveness of intermediate diaphragms in load distribution, these authors did convey the
following: "One of the practical arguments that has been raised in the past is the feeling that
diaphragms help limit damage to an overpass structure which is struck transversely from below by
an oversized load. There appears to be conflicting evidence as to whether the diaphragms are
damage-limiting or damage-spreading members, and the only comment the authors would make at
this time is that the diaphragms currently being used in bridges are probably the wrong shape and
size, and are usually in the wrong locations, if one of their valid functions is the reduction of damage
to the structure due to horizontal impact on the side of the bridge. The analyses reported here are
not relevant to this particular question."
The primary objective of the Illinois investigation was to study the effects of diaphragms on
load distribution characteristics in simple and continuous span PIC girder and slab highway bridges.
In their theoretical analysis, the parameters studied included the number, stiffness, and location of
diaphragms; the relative girder stiffness; the ratio of girder spacing to span; the girder torsional
stiffness, the girder spacing; and the location and type of loading.
For simple span bridges (12) the following conclusions were made:
9 In structures in which the outer line of wheels can fall directly over the edge girders,
diaphragms should not be used as they will increase the controlling moment in the bridge.
9 The influence of a single midspan diaphragm and two diaphragms located near midspan
were determined to be about the same structurally.
9 Location and spacing of diaphragms should not be a function of span length alone. For
example, many short bridges could benefit from having diaphragms while many long span
bridges with diaphragms either receive no benefit or are harmed by them. Only
diaphragms at or very near the section of maximum moment result in measurable changes
in the controlling girder moments.

Diaphragms must be of the correct flexural stiffness to be effective. Diaphragms with
stiffnesses greater than an optimum value may increase the moments in the girders.
For continuous span bridges (14) with various diaphragm stiffnesses and bridge properties, the
following conclusions were made:
Diaphragms improved the load distribution characteristics of some bridges that have a large
beam spacing to span length ratio.
The usefulness of diaphragms is minimal and they are harmful in most cases.
On the basis of cost effectiveness, diaphragms are not recommended for highway bridges.
In 1973, Sengupta and Breen (11) also investigated the role of end and intermediate
diaphragms in typical prestressed concrete girder and slab bridges. They tested four 115.5 scale
microconcrete simple span model bridges to determine the contribution of cast-in-place concrete
diaphragms. Experimental variables included span length, skew angle of the bridge, and number,
location, and stiffness of the diaphragms. The elastic response of the bridge was studied under static,
cyclic, and impact loads--with and without intermediate diaphragms. Overload and ultimate load
behavior was also documented from various static load and impact load tests. Experimental results
were used to veriFy a computer program, which in turn was used to generalize some of the results.
Two of the four bridge models were subjected to lateral impact loading at the midspan on the
bottom flange of the exterior girders. In both bridges, one exterior girder was impacted while the
diaphragms, which were located at the one-third points of the span, were in place; the other exterior
girder was impacted after the diaphragms were removed. With identical impacting forces, both
models showed considerably more damage in the exterior girders when the diaphragms were in
place. After the bridge testing was completed, all four exterior girders were removed and subjected
to midspan vertical loading. The ultimate load capacity of the girders which had intermediate
diaphragms in place during the impact loading had a slightly higher ultimate load capacity than the
exterior girders which had no intermediate diaphragms present. The authors concluded that the
diaphragms made the girders more rigid when subjected to lateral impacts. Therefore, the energy
absorption capacity of the girders was reduced, which made the girders more susceptible to lateral
impact damage.
On the basis of the other load tests and results from the theoretical analysis, Sengupta and
Breen concluded that under no circumstances would significant reductions in design girder moment
be expected because of the presence of intermediate diaphragms. In fact, in certain situations the
presence of intermediate diaphragms might even increase the design moment. These authors also
stated that intermediate diaphragms do not seem necessaly for construction purposes. For these
reasons, the authors recommended that intermediate diaphragms should not be provided in simply
supported PIC girder and composite slab bridges.
1.2 Obi& and Scorn
Very little research has been completed on the effectiveness of diaphragms in distributing
lateral impact forces. Thus, the primary objectives of this project was to investigate the effectiveness
of intermediate reinforced concrete and steel diaphragms when used in PIC girder and slab bridges
subjected to lateral load and to determine whether steel diaphragms of some conventional
configuration are structurally equivalent to cast-in-place reinforced concrete diaphragms presently
being used by the Iowa DOT.
The research team pursued its objectives by undertaking a comprehensive literature review,
tudy of PIC girder-slab
bridges with various types of intermediate diaphragms, and testing a full-scale model PIC girder-slab
bridge. Details of these tasks are outlined in the following section.
13. Research Propram
The research program consisted of the distinct parts outlined above; however, emphasis was
placed on the laboratory testing. Initially, a comprehensive literature review was made. In addition

to using the Geodex System - Structural Information Service, two computerized literature searches
were made.
To obtain information on the use of intermediate diaphragms in PIC girder bridges in other
states, Canadian provinces, and appropriate federal agencies, the researchers developed a survey that
was relatively easy to complete and yet thorough enough to obtain the desired data such as
diaphragms used, type employed, spacing, limitations, etc.
In the experimental portion of the investigation, a full-scale simple span PIC girder bridge
model was designed and constructed in the ISU Structural Engineering Research Laboratory Annex
The model was essentially the same as an existing PIC girder bridge except it only had three girders
(reducing both fabrication costs and space requirements) and had a reduced deck thickness
(requiring more load to be distributed by the diaphragm(s) than the deck). Since the deck was not
one of the variables in the testing program, the deck was reinforced with considerably less
reinforcement (see Sec. 2.1) than an actual bridge deck.
The PIC girders used in the model bridge were fabricated by Iowa Prestressed Concrete (Iowa
Falls, Iowa). Special inserts were cast in the girders so that various configurations of steel
reinforced concrete
d stream crossings,
respectively, several other configurations of steel diaphragms were tested. The bridge model was
tested with the diaphragms at midspan and at the one-third span locations. The PIC girders, various
diagrams, and bridge deck were instrumented withstrain gages. During thevarious load tests, strains
as well as deflections were monitored.
The bridge was subjected to a combination of vertical and horizontal loads, which were applied
at the same location, to simulate an inclined force that could result from an overheight vehicle.
Loading was applied at various locations on the lower flanges of the three girders to reflect the
possibility that an overheight vehicle could strike any girder in a given bridge at essentially any

location along its length. Although the purpose of the investigation was to determine the effects of
lateral loading, additional tests were undertaken to determine the distribution of vertical loading.
In the analytical portion of the investigation, finite-element bridge models were developed by
using the commercial software program ANSYS. Using the program, the researchers could
theoretically determine the effects of various diaphragm arrangements (type, and location) on the
behavior of the bridge. The program was written so that the supports could he analyzed as fxed
ends or pinned ends.
The results from the various parts of the research program are summarized in this report. The
literature review and results of the survey are given in Sections 1.4 and 1.5, respectively. Chapters
2 and 3 describe the bridge model tested as well as the instrumentation and test procedures
employed. The results from the laboratory testing program and the finite-element analysis are
summarized in Chapter 4. The summary and conclusions of the research programs are presented
in Chapter 5.
1.4. Eiterature Review
A literature search was conducted to gather available information on the use of diaphragms
in PIC bridges and on lateral loading of PIC girder bridges constructed with reinforced concrete or
steel intermediate diaphragms. Several methods of searching were used. The Geodex System -
Structural Information Sewice in the ISU Bridge Engineering Center Library as well as computerized
searches using Knowledge Index, available at the university library, and the Highway Research
Information Senice through the Iowa DOT were checked.
The literature review revealed that very little information has been published on the response
of bridges to lateral loading. However, our review of the literature involving bridge diaphragms
revealed that there have been numerous investigations on the lateral distribution of vertical loading
in multi-girder bridges. A report by Cheung, Jategaonkar, and Jaeger (4) attempted to provide some
basis for the inclusion of intermediate diaphragms in beam and slab bridges. They noted that "the
outcome of previous studies is a set of recommendations that are contrary to one another." The
various studies disagree on the effectiveness of intermediate diaphragms in the lateral distribution
of live load. They also noted that these studies disagree on the most effective positioning of
intermediate diaphragms. Some research has concluded that intermediate diaphragms have no effect
on the lateral distribution of vertical loading. Research by Kostem and deCastro (6) Eound that when
all traffic lanes were loaded, the diaphragms were ineffective in distributing the loads laterally.
These studies have pertained only to the lateral distribution of vertical forces in various types of
bridges.
In addition to studying the effectiveness of intermediate diaphragms in PIC girder bridges,
Sengupta and Breen (11) also investigated many aspects of diaphragms among which was a limited
study of lateral loads applied to the bottom flange of prestressed concrete girders. Scale models
were used to document their work experimentally. They suggest that intermediate diaphragms make
the prestressed concrete girders more vulnerable to damage from lateral impacts by stiffening the
girder near the point of impact and also transferring the damage to the next girder. They also state
that the "AASHTO requirements for interior diaphragms are mainly for the purpose of construction
(as a beam spacer) and for girder stability (to prevent bucMing of the girder webs)," and thus they
ndations, however, have
not been universally accepted. As previously documented, current AASHTO Standard SpecitTcation
for H@way Bridges (1,2) still require intermediate diaphragms in PIC girder bridges.
McCathy, White, and Minor (S), estimated that the exclusion of intermediate diaphragms could
reduce the cost of the superstructure by 3%-5% in addition to reducing construction time and deck
scheduling without modifications to the bridge design. As mentioned earlier, researchers at the
University of Illinois (12,14) concluded that using diaphragms in most situations is not beneficial and
in some situations harmful. Thus, bridge engineers, with countless years of experience, cannot agree
on the inclusion or exclusion of intermediate diaphragms in PIC girder bridges!

15. Review of Current Practice
A survey of the fifty U.S. state departments of transportation, the District of Columbia, three
U.S. commonwealths, seven Canadian departments of transportation, and three tollway/port
authorities was conducted to obtain information on intermediate diaphragms used in PIC girder
bridges. The sulvey addressed seven topics: (1) type of diaphragm employed, (2) diaphragm
location and depth, (3) connection details to the PIC girder and slab, (4) limitations on the use of
either steel or reinforced concrete diaphragms, (5) design criteria for lateral impact loading, (6)
approximate occurrence of high-load traffic collisions, and (7) categorization of the type and extent
of bridge damage caused by overheight loads. The questionnaire as well as responses to the
questionnaire are given in Appendix A.
Approximately 86% of the 64 design agencies selected to receive the questionnaire returned
it. All but two state departments of transportation in the U.S. completed the inquiry. Of those
agencies responding, about 93% indicated that in the past they have specified intermediate
diaphragms for PIC girder bridges and about 85% are still currently requiring these diaphragms.
The respondents chose from the following types diaphragms: (1) cast-in-place concrete, (2)
precast concrete, (3) steel channel, (4) steel 1-shape, (5) steel truss, (6) steel cross bracing, and (7)
). Respondents could specify all diaphragms
in the list that were used on P/C girder bridges under their jurisdiction. In the following paragraphs,
es are based on the number of those responding. The selection of the material used
for the diaphragm is influenced by the type of traffic beneath the bridge.
Ninety-six percent of the respondents use cast-in-place concrete diaphragms when the bridge
is located above a highway or navigable waterway, and 23% also speci6 steel channel. When a
bridge spans a railway, cast-in-place concrete is used by 85% of the responding agencies; steel
channel by 17%; and steel cross bracing by 10%. Bridges spanning grade separations that have no
traffic (highway, navigable waterway, or railway) beneath them most often havecast-in-place concrete
diaphragms, although 25% of the agencies allow steel channel. Cross bracing and I-shape steel are
allowed by about 10% agencies. A few agencies indicated that precast concrete intermediate
diaphragms have been used in all cases.
Diaphragm location along the span varies with span length as well as with bridge type. Bridges
built according to the various editions of the AASHTO Standard Specifications for Highway Bridges
have diaphragms placed at different positions along the span. Approximately 50% of the
respondents indicated that they specified intermediate diaphragm locations that met AASHTO
spacing requirements. Half of the agencies place diaphragms at the mid-span according to current
AASHTO requirements. Thirty percent of the design agencies require that diaphragms be
positioned at the one-third points along the span, while 10% locate diaphragms at the one-quarter
points of the span.
Of those respondents that use cast-in-place intermediate diaphragms, most use those that are
nearly the full girder depth, from the underside of the slab to the top of the girder bottom flange.
About 20% of the design agenciesspecify that the cast-in-place diaphragms have depths equal to the
depth of only the girder webs.
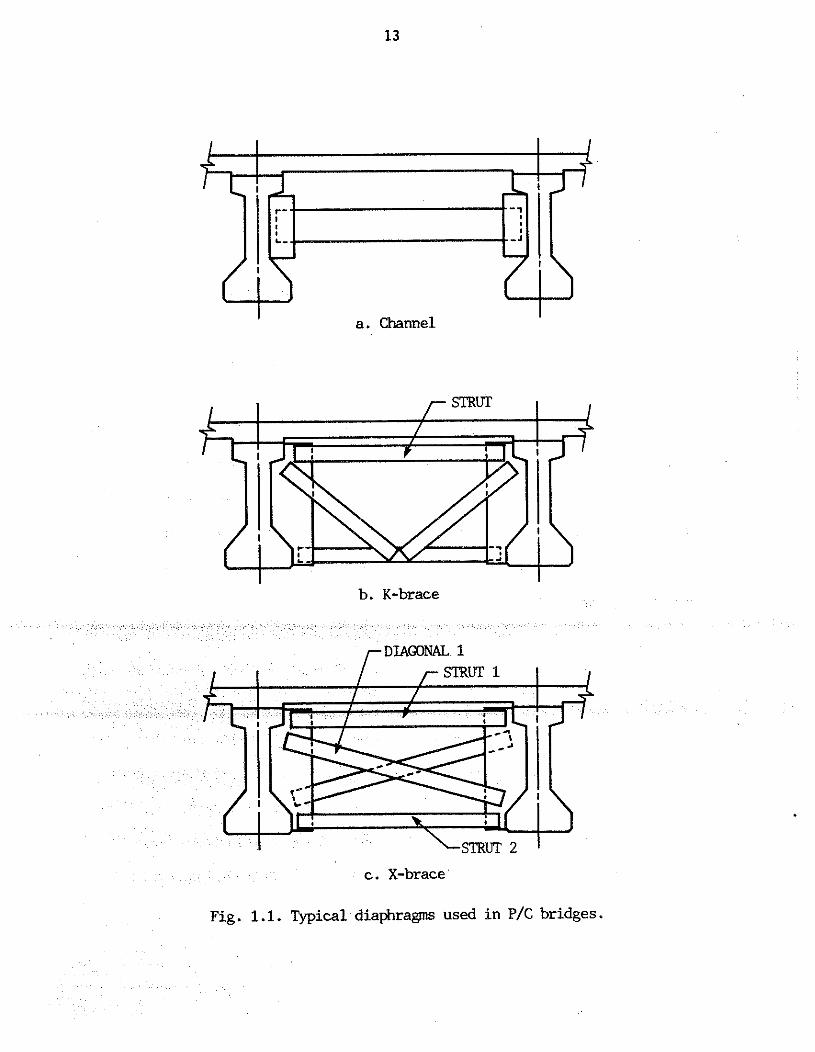
Of the approximately 40% who specify steel channel intermediate diaphragms (see Fig. l.la),
ncies commented that the size of channel is determined on a case by case basis. When bent
tes are used, they are usually about 318-in. thick with 3 1R in. flanges. The few a
use steel I-shape diaphragms specify W12X26 sections or W-sections that have a depth equal to the
girder web depth.
Approximately 30% of the respondents have specified truss intermediate diaphragms (see Fig.
l.lb and c). The truss usually consists of diagonal members and one or two chords. Most often, the
chord is a WT6X15, WT12X26, or L5X3X112 shapes. The diagonal member is usually a L3X3X5116
or a L3 lRX3 1RXlR. Fiteen percent of the respondents specify diagonal brace or cross brace
a. Channel
1 r STRUT I
c. X-brace
Fig. 1 .l. Typical diaphragms used in P/C bridges.
diaphragms, which are similar to truss diaphragms except that there are no struts. Diagonal brace
diaphragms are simply cross brace diaphragms with only one diagonal member (i.e. Fig. I.lc with
strut 1 and diagonal I removed). The most used steel shape for these types of diaphragms are:
LSX3X112, L4X4X318, L3X3X5116, L3 112x3 1/2X1/2, and WT6X1S.
Less than 50% of those who responded said that intermediate diaphragms are used for the
purpose of temporarily supporting the girders during construction. And less than 20% of the
respondents claimed that they use intermediate diaphragms to minimize the damage to bridge girders
caused by impact forces from overheight traffic beneath the bridge.
Cast-in-place concrete diaphragms that are in contact with the underside of the deck are
usually connected to the deck by reinforcing bars that extend from the top of the diaphragm and are
later cast into the deck. The connection with the girders usually consists of coil ties or other
threaded inserts used with coil rods or bolts. Another type of girderdiaphragm connection noted .
by respondents is accomplished by passing normal reinforcing bars from the diaphragms through
holes cast in the girder web that are later grouted. Steel diaphragms are usually connected to the
webs of the girders with bolts that pass through the girder web and a steel bracket or angle@) to
which the diaphragm is attached.
diaphragms and connections are established by a "rule of thumb" approach. The few who apply
intermediate diaphragms are ned according to accepted steel design methods.
Many agencies were un rovide accurate data regarding the number of prestressed
concrete girder bridges in their jurisdiction. Only 60% of all respondents reported the number of
PIC girder bridges they had. According to data from the National Bridge Inventory, there are
approximately 27,000 P/C girder bridges in the United States; this number is approximately 5.5% of
the bridge population.
When a bridge is struck by an overheight vehicle, one or more girders can be damaged.
Multiple girder impacts are common and are probably caused by vehicles that are just over the
height of the bridge opening. Therefore, these vehicles are able to continue under the bridge once
the first impact has occurred and strike an additional girder@). It is not uncommon to find that the
first girder is damaged while the adjacent girder is not damaged. This occurrence is most likely
caused by the deflection of the impacting portion of the vehicle as the vehicle continues to move
under the bridge. One or more of the remaining girders can be damaged as the impacting portion
of the vehicle rebounds after the initial impact. Damage to three or more girders is not uncommon.
Of the reported incidences of impact from overheight vehicles, there was no damage to the
girders in 40% of the cases. In 24% of the accidents, there was only minor damage that did not
require repair. Damage to the bridge girder(s) that requires minor repair occurs in about 10% of
the accidents. Moderate girder damage is caused in approximately 13% of the incidences; one out
of every twenty impacts causes major damage that requires girder replacement(s).
On the basis of the total number of repairs to prestressed concrete girder bridges, about 50%
of those responding to the questionnaire reported that 75% of the repairs are related to overheight
vehicle impacts. Each agency was asked to include copies of their standard details and specifications
for all types of intermediate diaphragms used in their jurisdiction. The plans received were renewed
to determine the various diaphragms used by other agencies and to assist in the determination of the
types of diaphragms to be used in the experimental portion of the investigation. Several different
diaphragms were considered, but due to time and budget constraints and limitations imposed by the
girder depth, only those diaphragms most likely to be used as possible replacements for the cast-in-
place concrete diaphragms used by the Iowa DOT were tested.
2 DESCRIPTION OF TEST S P E W S
This chapter outlines the details of the model bridge used in this investigation. The
instrumentation, procedures employed, and the actual tests performed are presented in Chapter 3.
Discussion and analysis of the measured responses and descriptions of the behavioral characteristics
that were noted during the testing are presented in Chapter 4.
21. Bridpe Model
A large bridge model, shown in Fig. 2.1, was constructed and tested to establish characteristic
behavioral responses to lateral and vertical load combinations applied to the bottom flange of the
prestressed concrete (PIC) bridge girders. Shown in Fig. 2.la are the PIC bridge girders in place as
well as the PIC load girder that was used as a reactive member for the horizontal loadings. A.
photograph of the completed bridge model is shown in Fig. 2.lb. Strains and displacements at
selected locations (discussed in Chapter 3) on the superstructure were monitored during load
applications to establish how these parameters were influenced by changes in the intermediate
diaphragm construction, configurations, and locations. The bridge model was not built to represent
a complete full-scale replica of an actual bridge. To keep the size of the experimental model within
the space constraints of the structural engineering laboratory and to obtain measurable deformations
and strains induced by lateral loads, the researchers minimized the width of the model by using only
-girder bridge model was not considered to be appropriate because an
not be represented. The thickness of the reinforced concrete bridge
4 in. (approximately one-half the thickness of a conventional bridge deck) in
e stiffness of the model. The reduced deck thickness increased the
cture to horizontal loading and increased the sensitivity of the structure for
the diaphragms used. Therefore, less load was transferred by the deck and more load was
transferred by the diaphragms.
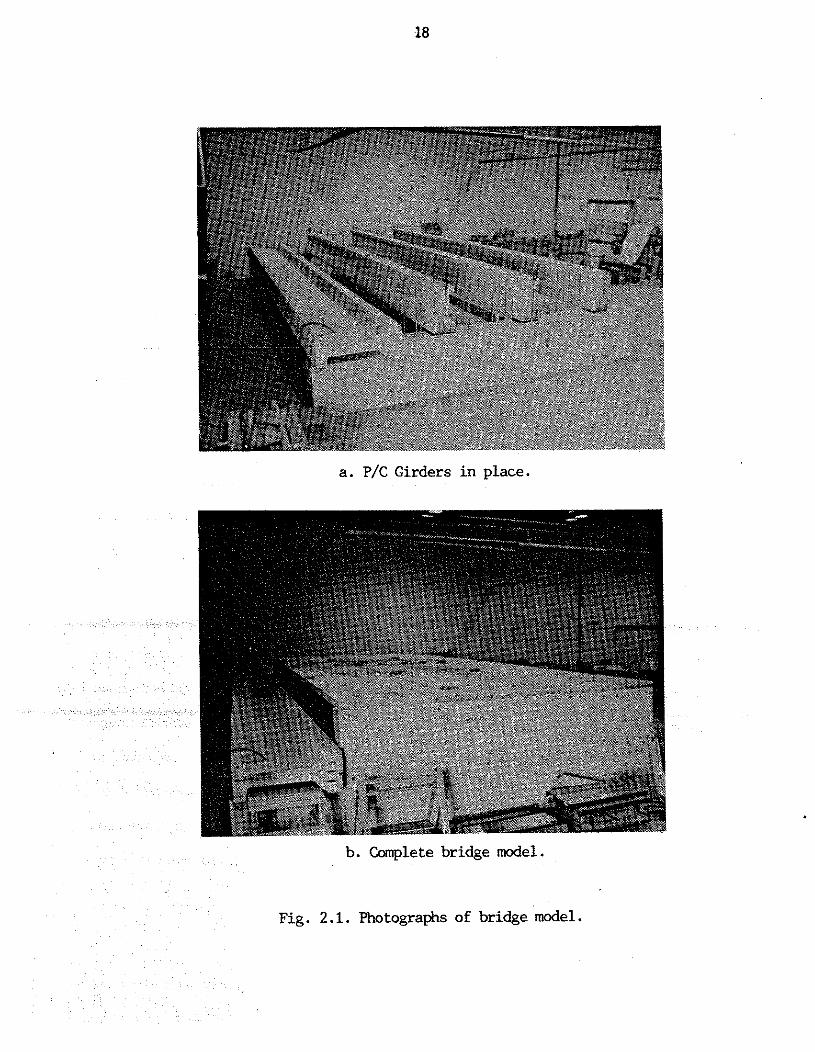
a. P/C Girders in place.
b. Complete bridge model.
Fig. 2.1. Photographs of bridge model.
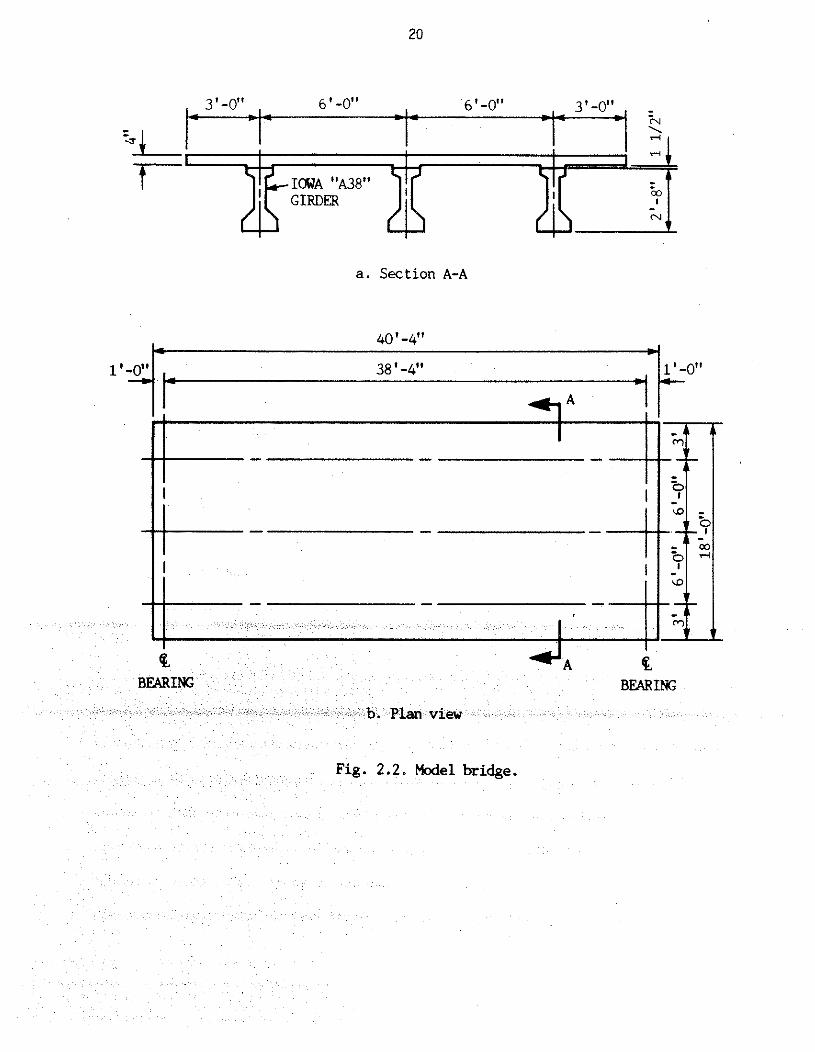
Figure 2.2 shows the single span bridge model that was 40 ft-4 in. long and 18 ft wide. The
PIC girders were spaced at 6 ft on center, which produced a 3-ft slab overhang along both edges of
the deck. The three bridge girders, which were the standard Iowa DOT A38 Beams, had additional
coil tie inserts and pipe sleeves to accommodate intermediate diaphragm attachments. Figure B.l
(Appendix B) shows the PIC bridge girder cross-sectional dimensions, the locations of the
prestressing strands, and the accessory inserts. The A38 bridge beams were supported at their ends
on 42-in.-high by 18-in.-wide reinforced concrete abutments. A 17-in.-wide by 12-in.-long by 1-in.-
thick elastomeric bridge bearing pad was positioned between the underside of each end of a girder
and the concrete abutment as shown in Fig. B.2. The ends of the PIC girders made complete contact
over the entire pad surface. Since the bearing pads were the same as those used in bridge
construction, the girder support conditions in the bridge model were similar to those present in an
actual bridge. The distance between the center lines of the girder supports was 38 ft.-4 in.
As shown in Figs. B.2 and B.3, a full-depth reinforced concrete (RE) end diaphragm was cast
to encase the ends OF each PIC concrete girder by 8 in. The full-height No. 5 reinforcing bars, which
projected above the concrete abutments and were embedded along each face. of the end diaphragms,
gms and the abutments. horizontal shear
p surfaces of the ab ts to be roughened,
except at the locations where the P/C girders were supported. Additional reinforcement for the end
iaphragms consisted of horizontal No. 5 reinforcing bars in each face. As shown in Fig. B.2, the
horizontal bars in the outside face of an end diaphragm were continuous and passed by the ends of
the PIC girders. The length of the horizontal reinforcement in the inside face of these diaphragms
was limited by the clear distance between the PIC girders. Figure B.3a shows that the bottom
interior horizontal row of reinforcement was lapped with the 314-in.-diameter coil rods, which were
threaded into the coil tie inserts cast near the ends of the girders. To produce monolithic
construction with the bridge deck (Fig. B.2), No. 5 reinforcing bars were bent and lapped with each
a. Section A-A
Fig. 2.2. Model bridge.
vertical bar in an end diaphragm. The horizontal leg of these bent bars were later cast into the
concrete deck.
A 1 112-in. concrete haunch was formed with the slab over each of the PIC girders in order
to facilitate the bridge deck forms. Since only a 4-in.-thick deck was used, the haunch provided
additional depth for encasement of the looped tie bars that projected above the top of the PIC
girders. The longitudinal slab reinforcement in the bridge deck consisted of two layers of No. 5
reinforcing bars. The spacing for the top longitudinal bars (Fig. B.4) was 9 in. on center near the
PIC girders and 12 in. on center between the girders, and the spacing for the bottom longitudinal
bars (Fig. B.5) was 12 in. on center, except at the girder location. The transverse slab reinforcement,
shown in Fig. B.6, consisted of No. 5 reinforcing bars at 12 in. on center throughout the bridge
length, resulting in an 8 in. edge distance for the bars at the end diaphragms. Since the bridge deck
was 4 in. thick, the transverse reinforcement was positioned essentially at the mid-thickness of the
slab. This location produced minimal flexural resistance to transverse bending moments which were
induced in the slab by both horizontal and vertical loading on the bottom flange of the PIC girders. P
A11 steel bar reinforcement was ASTMA615 Grade 40 steel. Since stiffness and not strength
or durability performance was the behavioral response being investigated, Grade 60 steel and epoxy-
bridge construction, were not used in this
experimental investigation. Tension tests of the steel reinforcement were not conducted since the
deck flexural strength was not of the variables in this research.
The experimental bridge was built to establish the response characteristics of various types
of intermediate diaphragms; therefore, installation and removal of the intermediate diaphragms was
necessary. To produce essentially identical initial conditions for all of the intermediate diaphragms,
the researchers cast the bridge deck prior to the installation of any of the intermediate diaphragms.
In order to facilitate the casting of the R/C intermediate diaphragms, which occurred after
the bridge deck was in place, access holes were provided through the slab by short segments of 6-in.

diameter poly-vinyl-chloride (PVC) plastic pipe. The sleeve inserts were placed between the PIC
bridge girders at the third-point locations and at the midspan of the bridge, as shown in Figs. B.4 and
B.5. These holes remained open during the testing of the bridge, except when the R/C diaphragms
were installed. Reinforcement from the RIC diaphragms was extended into the holes to provide a
positive connection between the diaphragms and the deck.
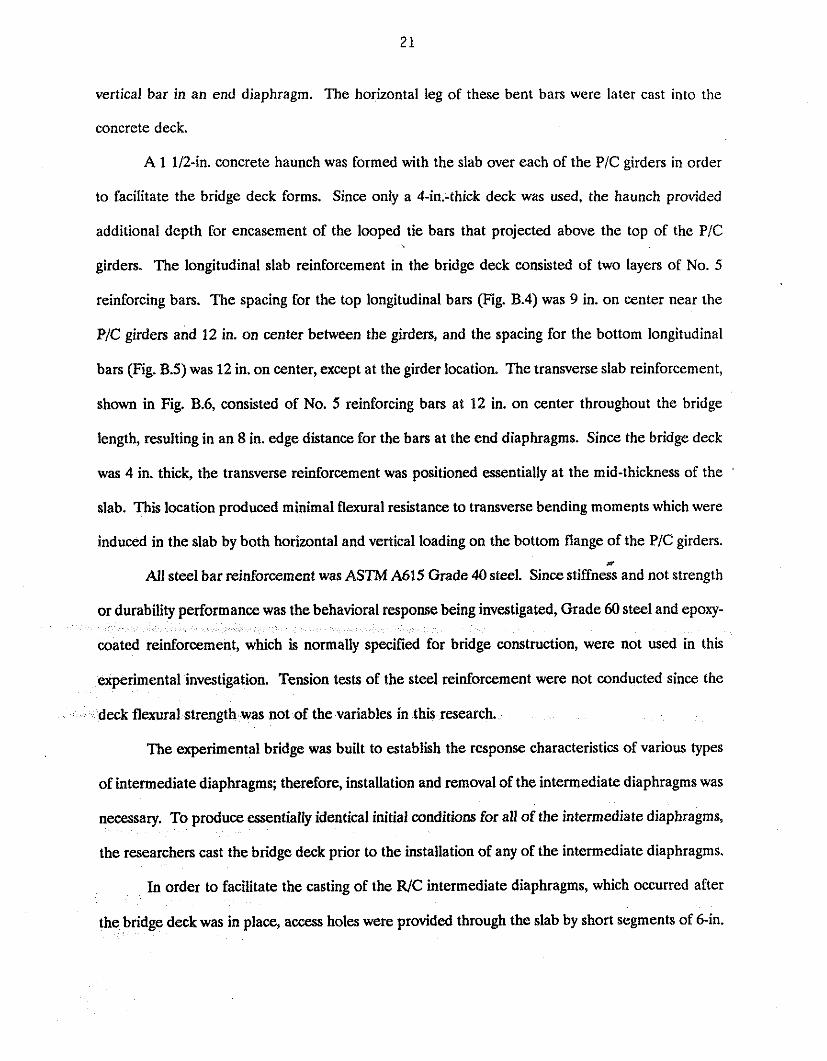
The concrete strength for the abutments, PIC girders, diaphragms, bridge deck, and
intermediate concrete diaphragms are listed in Table 2.1.
2.2.1. Dianhraem Tvaes. Locations. and Desienations
Since the same end diaphragms (shown in Figs. B.2 and B.3) were used throughout the
experimental testing of the various intermediate diaphragm types, the term diaphragms will be used
to refer to intermediate diaphragms throughout this report. The type and location of the diaphragms
affects the response of a bridge superstructure. The types of diaphragms that were incorporated into
the experimental bridge model were reinforced concrete, two sizes of structural steel channels, and
steel cross braces with and without a horizontal strut. Diaphragms at both the midspan and at the
e tested. The diaphragm locations labelled
bridge span and at the midspan, respectively. In addition, the response of the bridge model without
[mediate diaphragms was investigated. To identify each diaphragm arrangement, the
researchers adopted the designations presented in Table 2.2 for this report.
2.2.2. Reinforced Concrete Intermediate Diaphraems
Except for the 6-in. width, the geometric configuration for the R/C intermediate diaphragm,
shown in Fig. 2.4 (detailed in Fig. 2.4a and photographed in Fig. 2.4b), was modeled after the
T reinforced concrete intermediate diaphragm. The spacing and bar size for the
vertical and horizontal reinforcement matched those for the Iowa DOT standard WC intermediate
Table 2.1. Concrete strengths.

Table 2.1. Continued.
Table 2.2. Intermediate diaphragm designations.
C 15~33.9 stmctural steel channel diaphragm at the midspan
MC 8x20.8,steel cross-brace diaphragm at t
Element
North Third- Point
Diaphragm
South Third- Point
Diaphragm
*One cylinder test bForms removed
Age (dap)
7 28
4b 7 28
f', (psi)
3,360 4,720
---- 4,140 4,470 5,680
Notes
Mix No. 4 4,000 psi
112-in. Limestone chips
Air-entrained Superplasticizer
6-in. slump
Mi No. 4 except
4-in. stump
BEAM
BEAM
BEAM
SYM. ABT. $ 61-n" I
4 PER DIAFnRAGM
a. Details
b . Photograph xg . 2.4. Reinforced concrete intermediate diaphragm
(Designations RC. 1 and RC. 3).
diaphragm. Since the slab was already in place when these diaphragms were cast, the connection
between these diaphragms and the deck was modified from the Iowa DOT standard detail.
To provide a reinforcement tie between the slab and each diaphragm called for a hair-pin-
shaped reinforcing bar placed through the access holes in the slab. These bars extended through the
construction joint between the slab and a diaphragm. At the midspan, No. 5 reinforcing bars were
used for the hooped ties; hut at the third-points of the span, No. 3 reinforcing bars were used
because bending a No. 5 reinforcing bar in a tight radius was difficult to accomplish.
Since the concrete for the diaphragms was cast through the PVC pipe sleeves in the deck,
the higher slump concrete mix as noted in Table 2.1 was used to allow the fresh concrete to flow and
fill the forms. For consolidating the concrete within the diaphragms, a concrete vibrator was probed
through the access holes and was held against the sides of the forms.
Figure 2.4a reveals that at a depth of about 8 in. and 20 in. below the 4-in.-thick bridge deck,
314 in. diameter PVC plastic pipes were cast in the center of the diaphragms. These pipe sleeves,
which were in horizontal and vertical alignment with holes cast in the web of the PIC girders, were
provided as access conduits for 518 in. diameter post-tensioning tendons. The high-strength tendons
girder. By tightening the nuts on the tendons, the PIC girders and the diaphragms were structurally
e tendons were tightened with a wrench after the concrete for the diaphragms had
cured for a minimum of 7 days.
After completion of the testing involving the WC midspan intermediate diaphragms, these
diaphragms had to be removed. The tendons were withdrawn from the conduits, and the concrete
was broken at selected locations with an air hammer. The concrete within the access holes in the
slab was sufficiently removed so that the hair-pinned-shaped dowels could be cut. The midspan
diaphragms were removed so that the bridge could be tested with R/C diaphragms at only the third-
points of the span.
2.2.3. Steel Channel Intermediate Diaphraems
2.2.3.1. Deep Channel Diaphragm
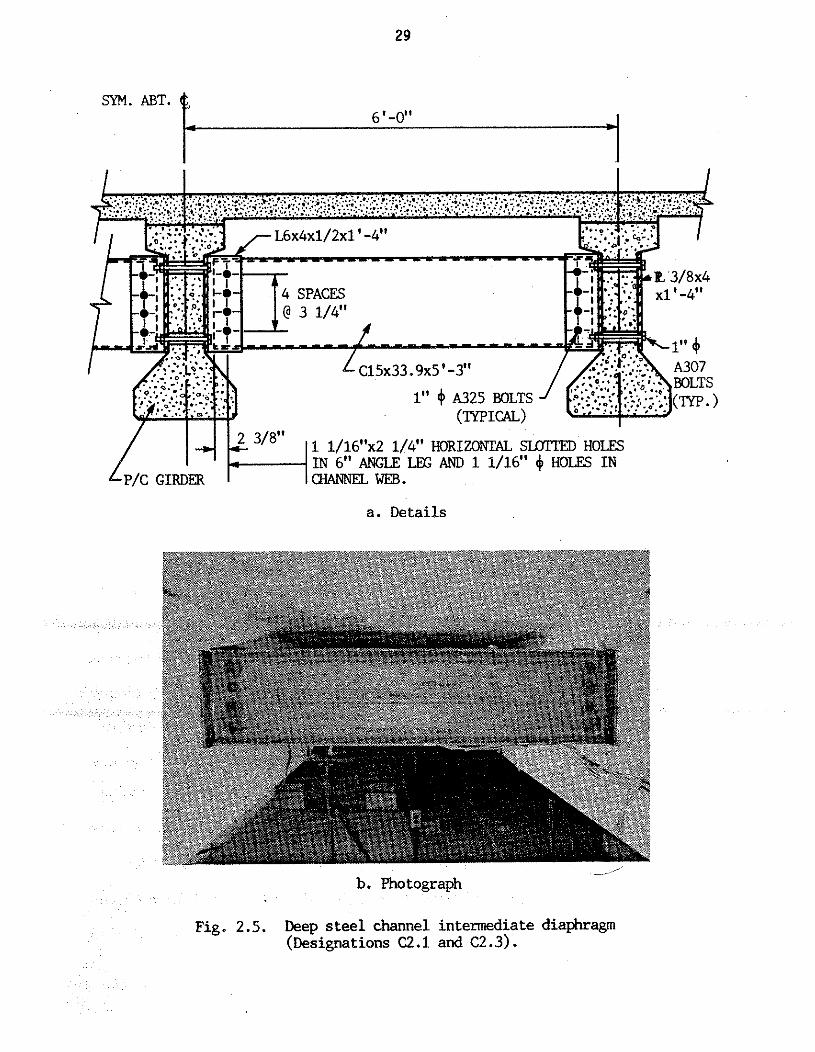
Figure 2.5 (details in Fig. 2.5a and photograph in Fig. 2.5b) shows the standard Iowa DOT
steel channel diaphragm. The C15 x 33.9 structural steel diaphragm had a depth equal to almost
50% of the PIC girder depth and about 94% of the web depth of the girders. After the bridge deck
had cured, the channels were installed by bolting the web of each diaphragm to the outstanding legs
of the angles that had been bolted to the webs of the PIC girders as shown in Fig. 2.5a. To facilitate
two sizes of channel diaphragms and different vertical positions for the smaller channels requires
equal bolt spacing, which is slightly different from the bolt spacing shown in the standard Iowa DOT
diaphragm connection detail; however, the hole size in both the channel web and angle leg matched
the Iowa DOT Standard. The horizontally slotted hole in the outstanding angle leg allowed for
variations in the alignment at the PIC girders as recommended by the Iowa DOT. To increase the
frictional resistance induced by the clamping forces generated by tightening the high tensile strength
at the diaphragm connection, the researchers used 1-in. diameter rather than 718-in. diameter
webs was made using 1-in. diam
the bolt installation.
2.2.3.2. Shallow Channel Diaphragm
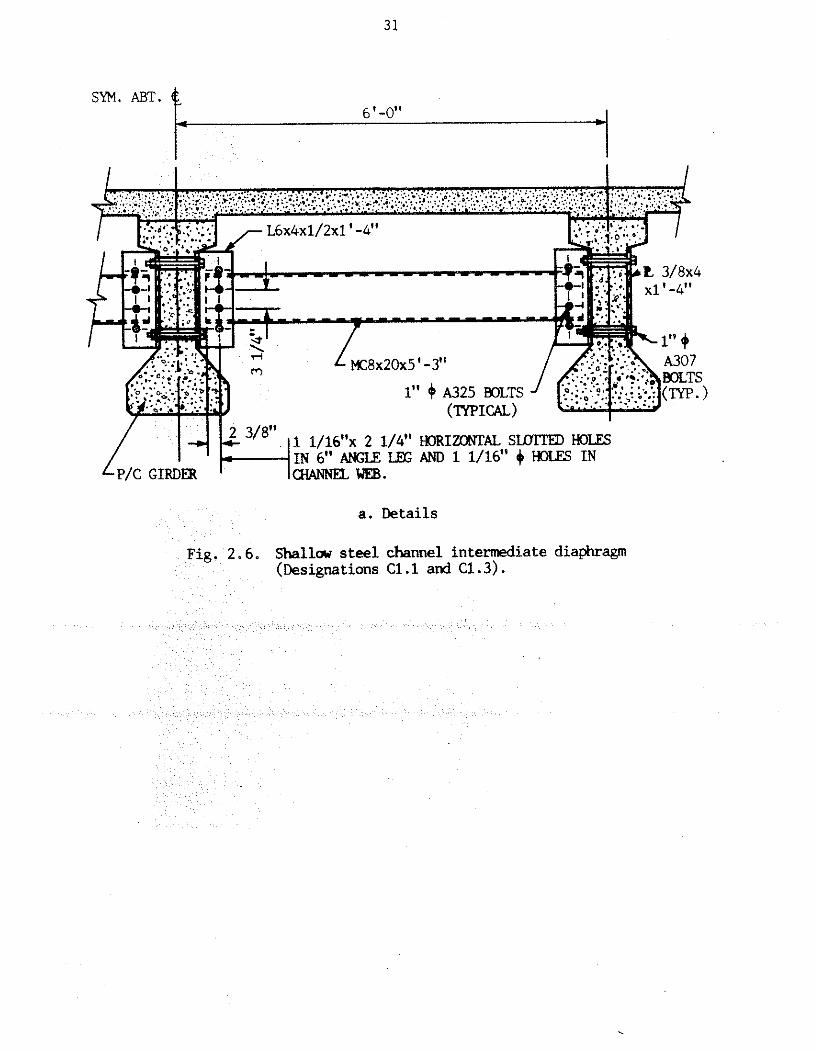
To investigate the effect of the channel size on the load distribution behavior, the researchers
replaced the standard Iowa DOT channel diaphragm (C15 x 33.9) by a shallower channel (MC8 x
20). The depth of the MC8 diaphragms was equal to 25% of the 32-in. depth of the PIC girders and
SYM. ABT. 6'-0" 4
1 1/16"x2 1/4" HORIZOWAL SLDlTD HOLES IN 6" ANGLE LEG AND 1 1/16" 4 HOLES IN CHANNEL WEB.
a. Details
b. Photograph
Fig. 2.5. Deep steel channel intermediate diaphragm (Designations C2.1 and C2.3) .
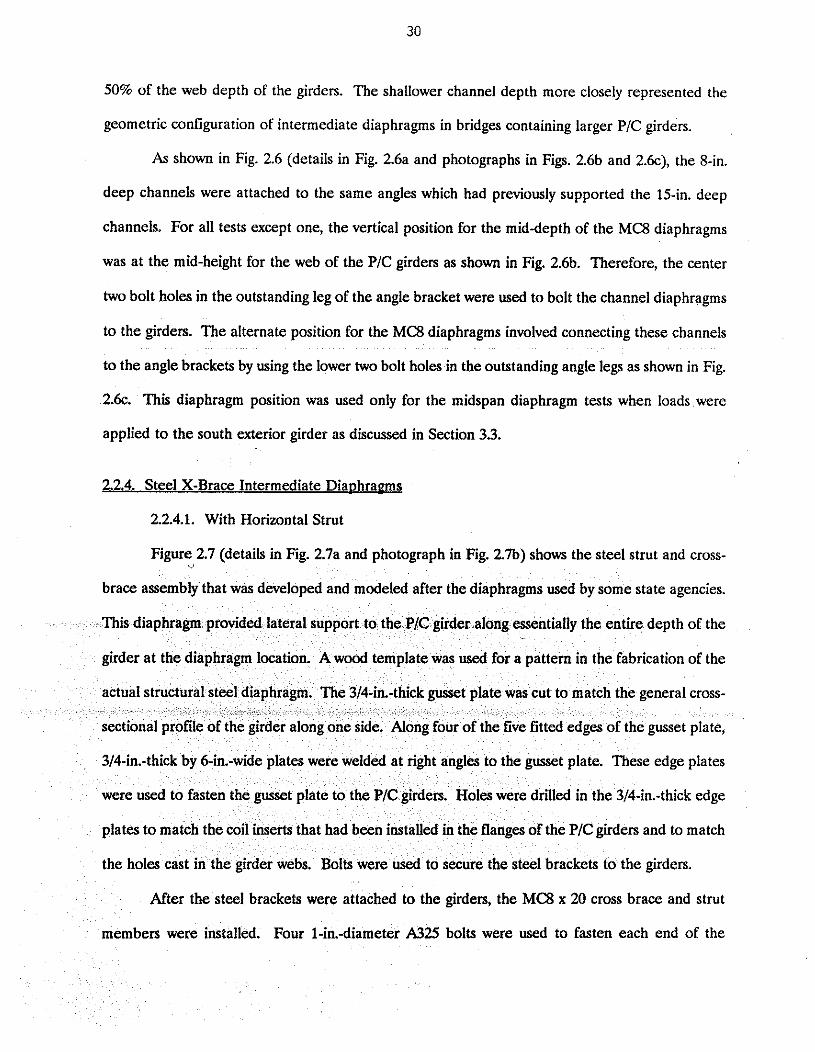
50% of the web depth of the girders. The shallower channel depth more closely represented the
geometric configuration of intermediate diaphragms in bridges containing larger PIC girders.
As shown in Fig. 2.6 (details in Fig. 2.6a and photographs in Figs. 2.6b and 2.6c), the 8-in.
deep channels were attached to the same angles which had previously supported the 15-in. deep
channels. For all tests except one, the vertical position for the mid-depth of the MC8 diaphragms
was at the mid-height for the web of the PIC girders as shown in Fig. 2.6b. Therefore, the center
two bolt holes in the outstanding leg of the angle bracket were used to bolt the channel diaphragms
to the girders. The alternate position for the MC8 diaphragms involved connecting, these channels
to the angle brackets by using the lower two bolt holes in the outstanding angle legs as shown in Fig.
2.6~. This diaphragm position was used only for the midspan diaphragm tests when loads were
applied to the south exterior girder as discussed in Section 3.3.
2.2.4. Steel X-Brace Intermediate Dia~hramns
2.2.4.1. With Horizontal Strut
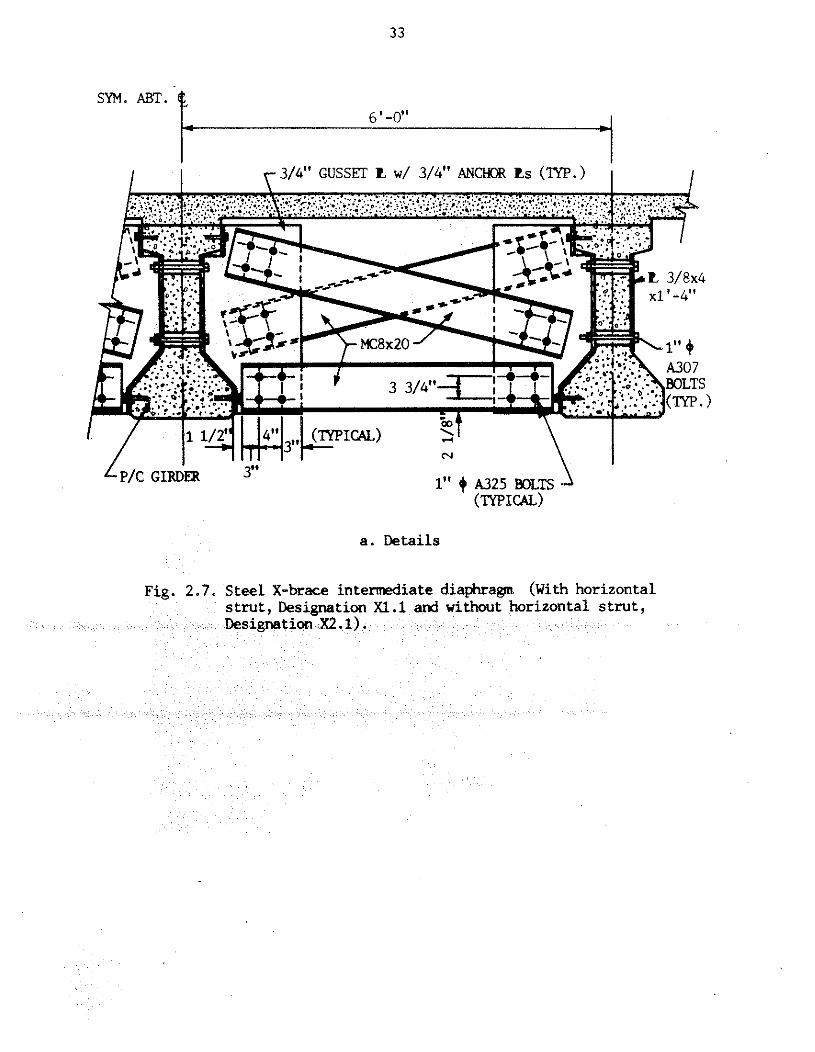
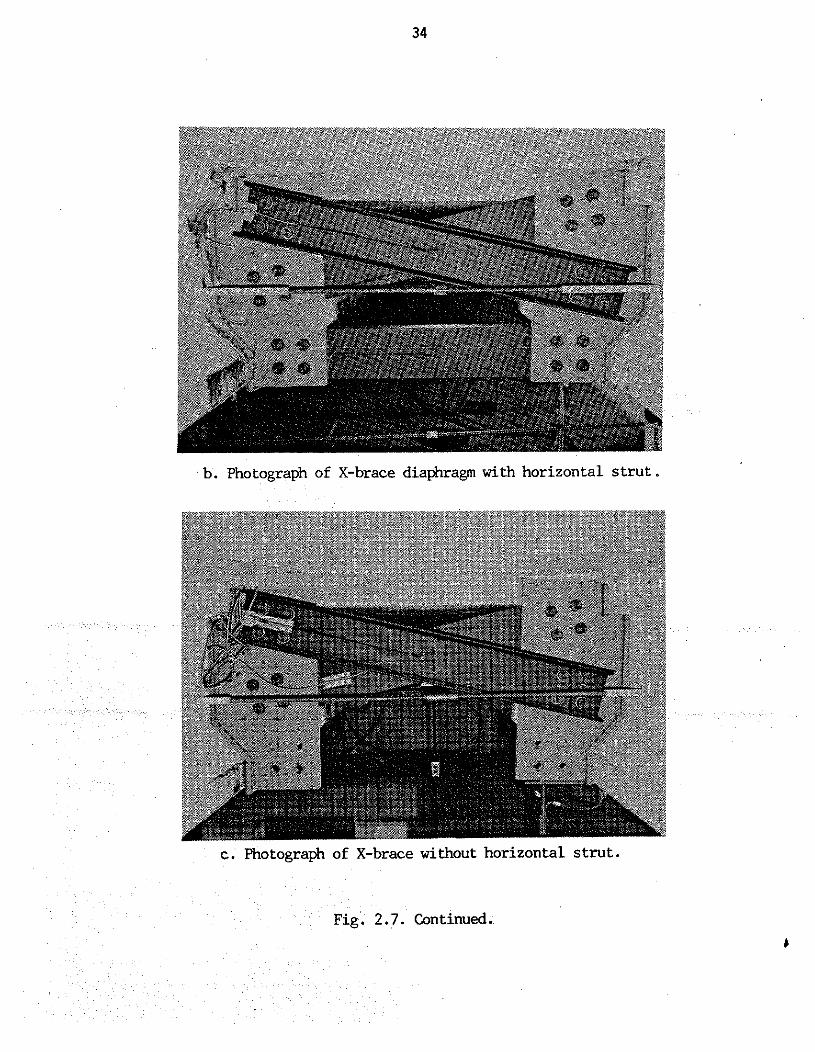
Figure 2.7 (details in Fig. 2.7a and photograph in Fig. 2.7b) shows the steel strut and cross- U
fabrication of the
After the steel brackets were attached to the girders, the MC8 x 20 cross brace and strut
members were installed. Four 1-in.-diameter A325 bolts were used to fasten each end of the
SYM. ABT. 6 ' -0"
a. Details
Fig. 2.6, Shallar steel channel intermediate diaphragm (Designations C1.l and C1.3).
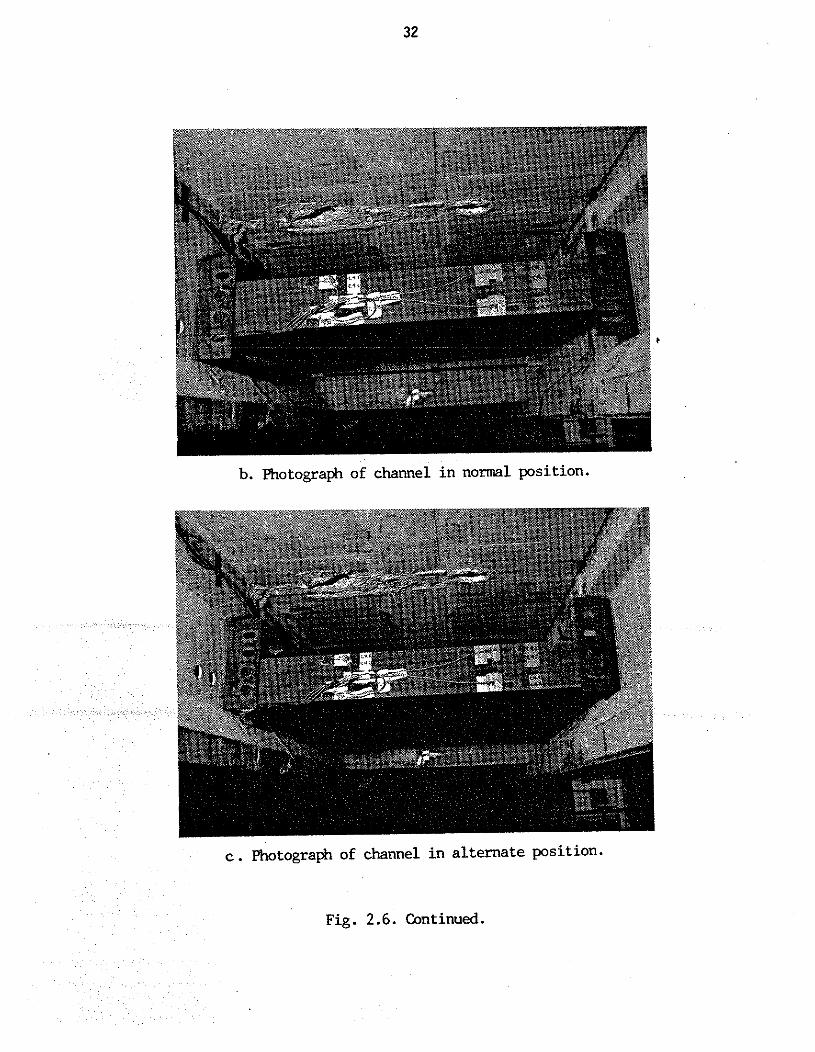
b. Photograph of channel in normal position.
c. Photograph of channel in alternate position.
Fig. 2.6. Continued.
SYM. ABT. 6' -0"
I I T- 3/4" GUSSET C w/ 3/4" ANCHOR Cs (TYP.) i I
a. Details
c. Photograph of X-brace without horizontal strut.
Fig. 2.7. Continued.

channel-shaped members to the gusset plates. The turn-of-the nut method was applied to develop
the minimum bolt tension for proper installation of these fasteners.
2.2.4.2. Without Horizontal Strut
Another configuration for a steel diaphragm was established by removing the horizontal strut
from the intermediate diaphragm described in Section 2.2.4.1. The configuration for the diaphragm
was a single cross brace as shown in Fig. 2.7~. To simplify the construction of the assembly, the
bottom connections for the MC8 cross-bracing members were not lowered towards the girder bottom
flange. The presence of the 314-in.-thick gusset plate, which extended to and was attached to the
girder bottom flange, provided a significant amount of lateral support to this flange. Greater
diaphragm stiffness might have been obtained if the cross braces had been repositioned by lowering
the bottom connections of the cross members.
2.2.5. No D i a ~ h r a m s
The model bridge was also tested without any intermediate diaphragms present. However,
as previously discussed, the end diaphragms were present.
3. TESrS AND TEST PROCEDURES
This chapter outlines the details of the specific tests and events that occurred in conducting
the laboratory tests. The model bridge with the various configuration of diaphragms (located at
either the midspan or at the third points of the span) was subjected to horizontal and vertical
loading. In the following sections, test setups, instrumentation and procedures will be presented;
discussion and analysis of results obtained, as well as the behavior of the various configurations of
diaphragms, will be presented in Chapter 4.
3.1. Instrumentation
The instmmentation for all of the tests consisted of electrical-resistance strain gages (strain
gages), direct current displacement transducers @CDTs) and a limited number of mechanical
deflectometers (dial gages). The strain gages used on the concrete were manufactured by Texas
Measurements, Inc. (College Station, Texas). Polyester PL-90 gages (gage length = 3.54 in., gage
width = .04 in.) and PL-60 gages (gage length = 2.36 in., gage width = .04 in.) were used on the
prestressed concrete beams, and on the deck and the cast-in-place diaphragms, respectively.
Strain gages employed on the various steel components were manufactured by Vishay
Measurements Group (Raleigh, North Carolina). Polyimide encapsulated gages CEA-06-125UN-120
(gage length = .125, gage width = .I0 in.) were used on the post-tensioning tendons of the loading
apparatus and on the various steel diaphragm elements. All strain gages (concrete and steel) were
were attached with recommended surface preparation
and adhesives. Three-wire leads were used to minimize the effect of the long lead wires and
potential temperature changes. All strain gages were water-proofed with a minimum of two layers
of protective coatings. Strain gages and DCDTs on the various elements of the bridge were read
and recorded with a computerized data acquisition system @AS). Dial gage readings were recorded
by hand in aU tests.
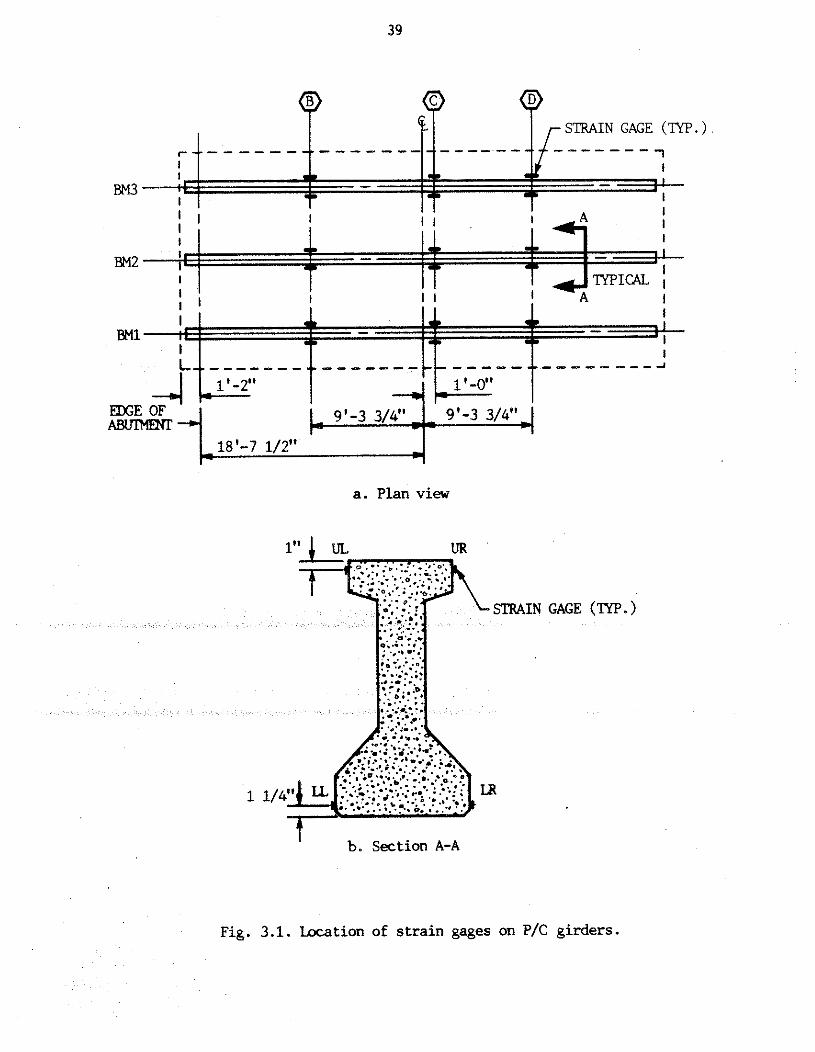
A total of 36 strain gages were mounted on the three PIC beams in the bridge model. Figure
3.1 indicates the location of the strain gages; three sections (114 span, midspan, and 314 span) of each
beam were instrumented. At each section, four strain gages--two on the top flange and two on the
bottom flange--were oriented with their axis parallel to the longitudinal axis of the PIC beams. As
shown in Fig. 3.1, the strain gages at midspan were actually positioned one foot off center to
facilitate installation of the various configurations of diaphragms at that location.
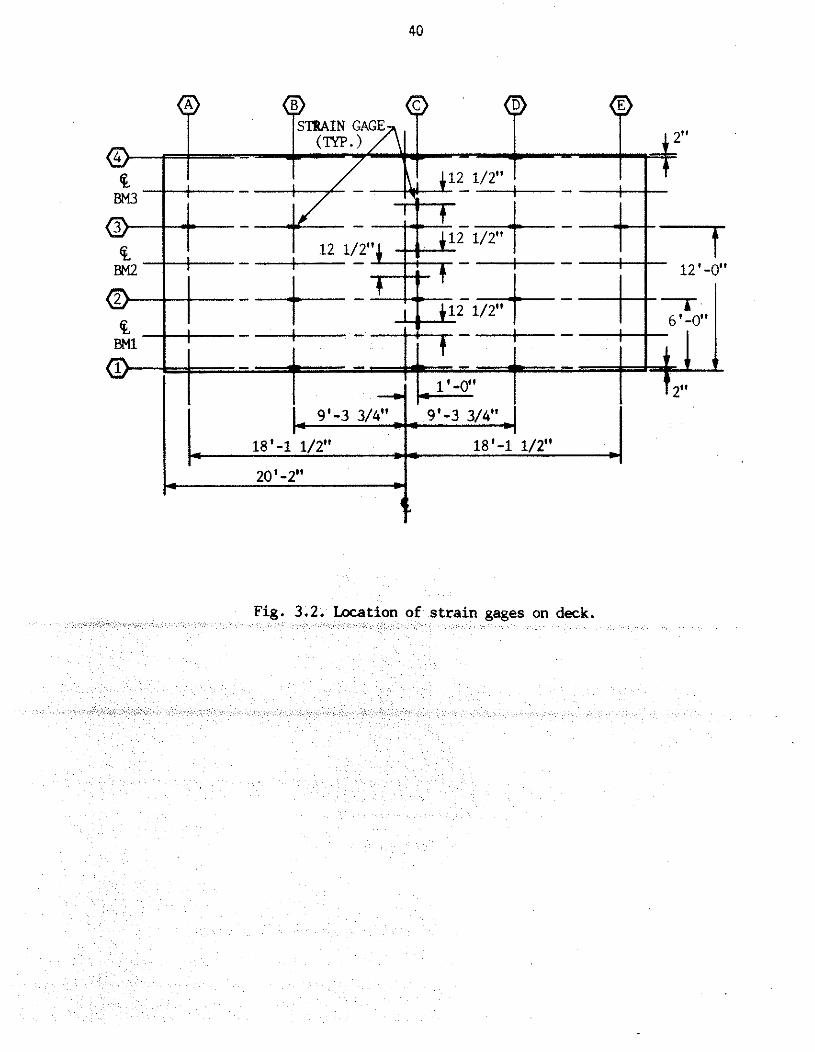
Location of the strain gages on the bridge deck are shown in Fig. 3.2. Note that the
instrumented Sections B, C, and D are the same sections on the PIC beams shown in Fig. 3.1. Thus,
the longitudinal deck gages and beam gages at these sections are in the same plane. At each
location where a longitudinal gage is indicated (gage axis parallel to the PIC beam axis) there is one
gage on the top surface of the deck At locations where transverse gages are indicated (gage axis
perpendicular to the PIC beam axis), there are two strain gages--one on the top and bottom surfaces
of the deck There are a total of 22 strain gages on the bridge deck--14 oriented with their axis
parallel to the PIC beams and 8 oriented with their axis transverse to the beams.
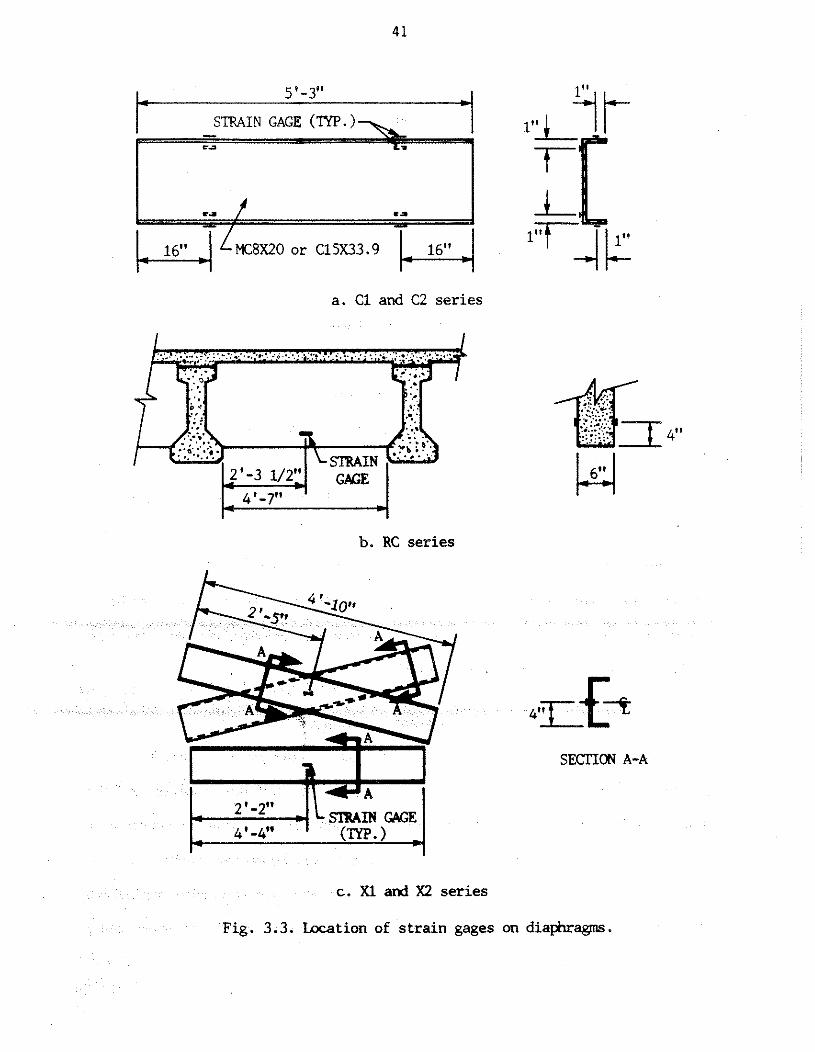
The location of the strain gages employed on the various configurations of diaphragms tested
is shown in Fig. 3.3. Shown in Fig. 3.3a is the position of the strain gages used on the channels
Depending on whether the diaphragms were
oints of the span (C1.3 and C2.3), there were
Illustrated in Fig. 3.3b is the location of the
strain gages used on the concrete diaphragms. As indicated, each concrete diaphragm was
instrumented with two strain gages at the middistance between the girders 4 in. up from the bottom
of the diaphragm with their axis parallel to the diaphragm axis. With diaphragm configuration RC.l
there were four diaphragm strain gages while with RC.3 there were eight diaphragm strain gages.
Figure 3 . 3 ~ illustrates the position of the strain gages on the X-brace plus strut (X1.1) and X-brace
STRAIN GAGE (TYP . ) - - - - - - -
a. Plan view
b. Section A-A
GAGE
Fig. 3.1. Location of strain gages on P/C girders.
a. C1 and C2 series
b. RC series
I
c. XI and X2 series
3-f- SFXrrION A-A
Fig. 3.3. Location of strain gages on diaphragms.
(X2.1). All strain gages, two per channel, are positioned with their axis parallel to the axis of each
channel member. With the horizontal strut in place (X1.1), there were 12 diaphragm strain gages:
while without the struts (X2.1), there were eight diaphragm strain gages.
As the bridge was tested with the various arrangements and conEigurations of diaphragms.
the amount of instrumentation varied. The maximum instrumentation (90 strain gages) occurred
with either Diaphragm C1.2 or C2.3 in place, while the minimum amount of instrumentation (62
strain gages) occurred with Diaphragms RC.1 in place.
In addition to the strain gages on the various elements of the bridge, strain gages were also
mounted on the post-tensioning tendons employed to apply lateral load to the model (see Section
3.2.2). Two strain gages were mounted on each tendon with their axes parallel with the longitudinal
axis of the tendon. The two gages were positioned diametrically opposite each other and thus
detected equal and opposite sense bending strains in addition to axial strains. These gages, correctly
connected to the DAS, measured the axial force in the tendon as bending strains were cancelled.
As shown in Fig. 3.4, 12 DCDTs were used to measure the vertical and horizontal
displacements of the PIC beams. As indicated at the midspan of each beam, both horizontal and
vertical displacements were monitored; at the quarterpoints of the span, only horizontal
es that were
Descriptions of the loading mechanisms used in this investigation are described in the
following sections. Due to insufficient available space in the structures laboratory in Town
Engineering Building, a t the time when this research was initiated, the construction and testing of
the bridge was undertaken in the structures laboratory annex (henceforth simply referred to as the
annex). The absence of an overhead crane and a structural tie-down floor in the annex required that
the loading mechanisms be essentially self-contained. This requirement of self-containment limited
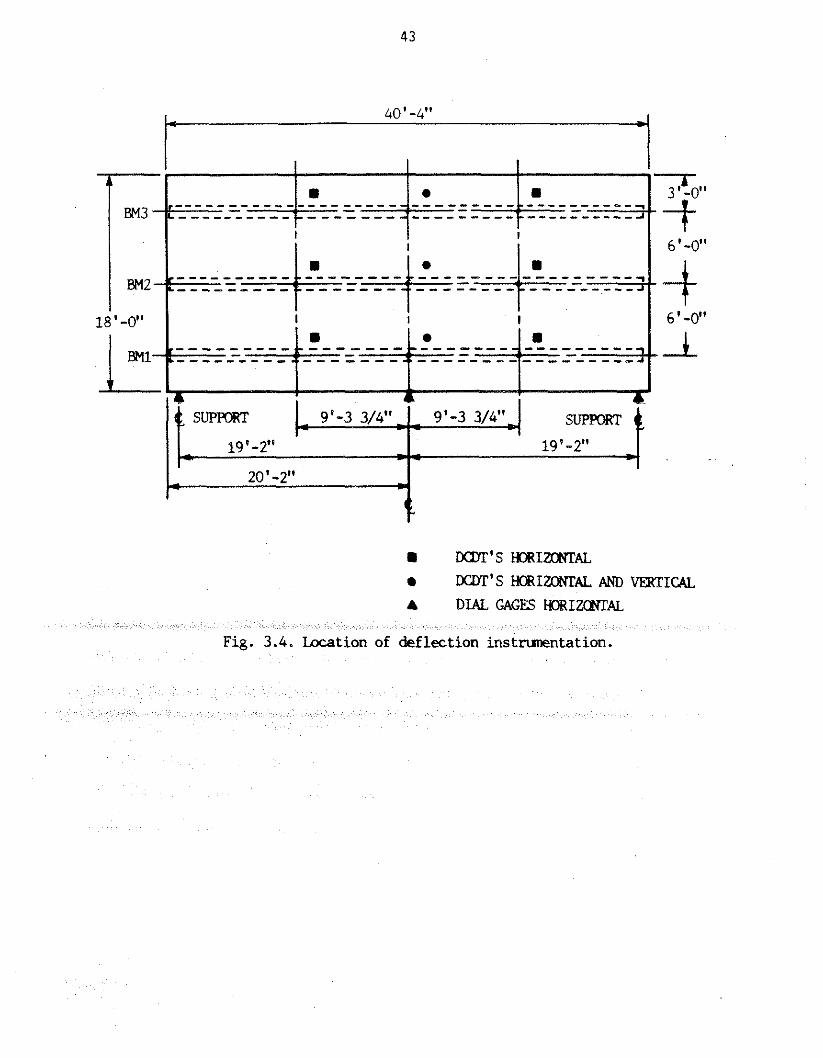
8 DUYr'S H O R I m A L
DCMT'S HORIZONTAL AND VERTICAL
A DIAL GAGES H O R I ~ A L
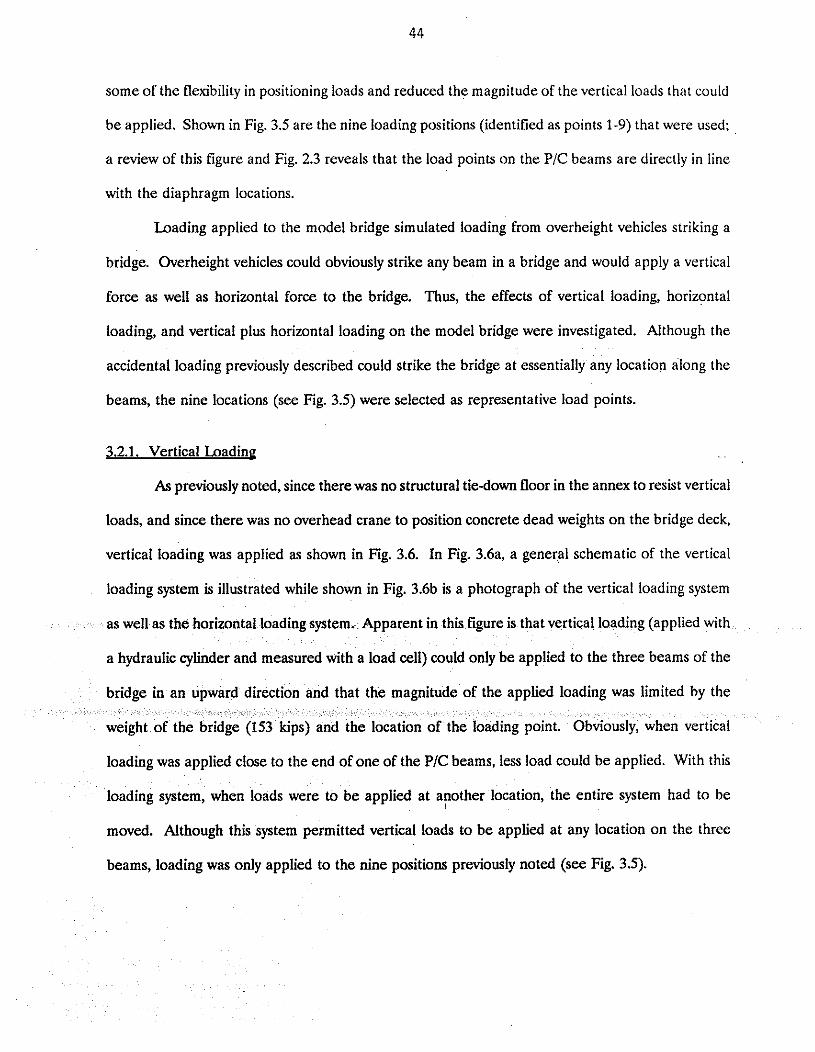
some of the flexibility in positioning loads and reduced the magnitude of the vertical loads that could
be applied. Shown in Fig. 3.5 are the nine loading positions (identified as points 1-9) that were used;
a review of this figure and Fig. 2.3 reveals that the load points on the PIC beams are directly in line
with the diaphragm locations.
Loading applied to the model bridge simulated loading from overheight vehicles striking a
bridge. Overheight vehicles could obviously strike any beam in a bridge and would apply a vertical
force as well as horizontal force to the bridge. Thus, the effects of vertical loading, horizontal
loading, and vertical plus horizontal loading on the model bridge were investigated. Although the
accidental loading previously described could strike the bridge at essentially any location along the
beams, the nine locations (see Fig. 3.5) were selected as representative load points.
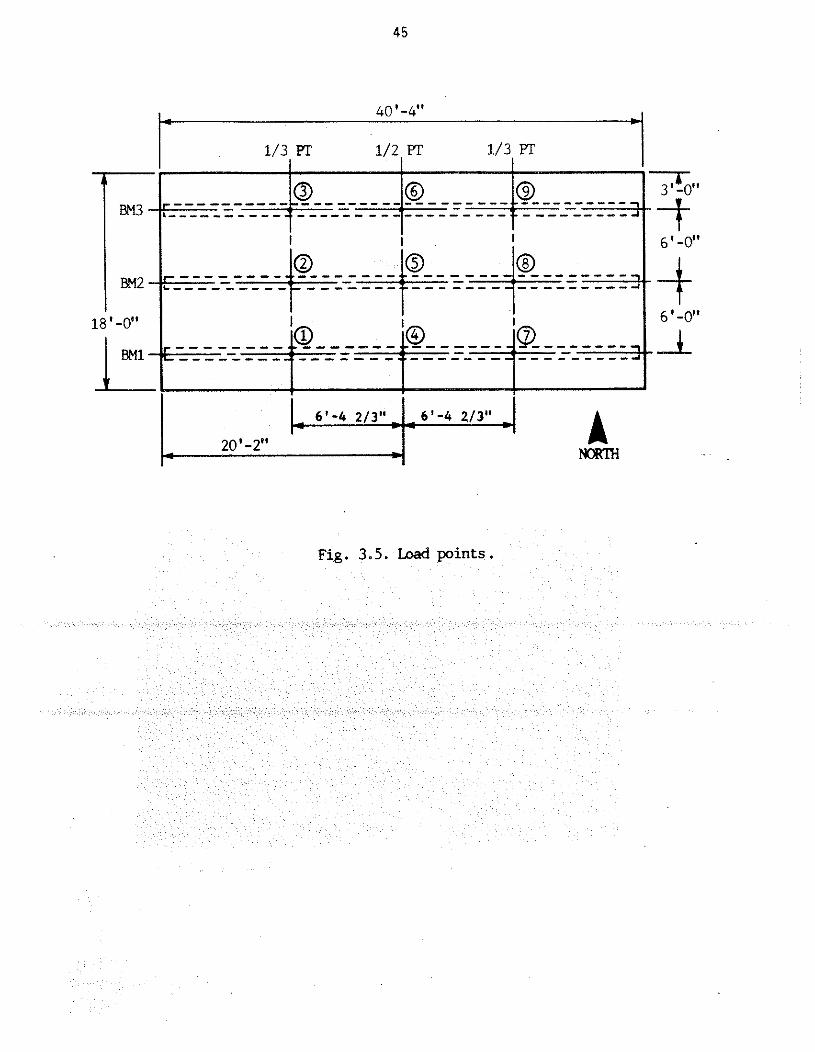
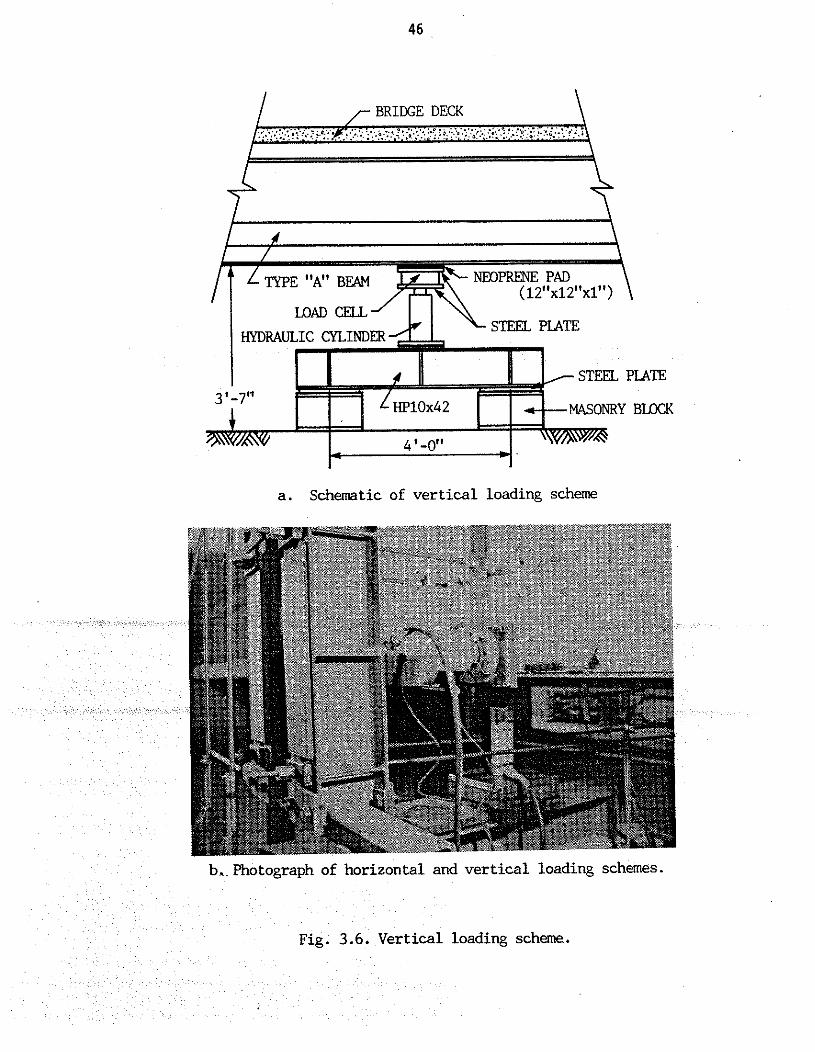
3.2.1. Vertical Loading . .
As previously noted, since there was no structural tiedown floor in the annex to resist vertical
loads, and since there was no overhead crane to position concrete dead weights on the bridge deck,
vertical loading was applied as shown in Fig. 3.6. In Fig. 3.6a, a general schematic of the vertical
loading system is illustrated while shown in Fig. 3.6b is a photograph of the vertical loading system
as well as the horizontal loading system. Apparent in this figure is that vertical loading (applied with
a hydraulic cylinder and measured with a load cell) could only be applied to the three beams of the
bridge in an upward direction and that the magnitude of the applied loading was limited by the
loading was applied close to the end of one of the PIC beams, less load could be applied. With this
loading system, when loads were to be applied at another location, the entire system had to be
moved. Although this system permitted vertical loads to be applied at any location on the three
beams, loading was only applied to the nine positions previously noted (see Fig. 3.5).
I r BRIDGE DECK \
HYDRAULIC C n I N D
MASONRY B J X K
a. Schematic of vertical loading scheme
b. Photograph of horizontal and vertical loading schemes.
Fig. 3.6. Vertical loading scheme.
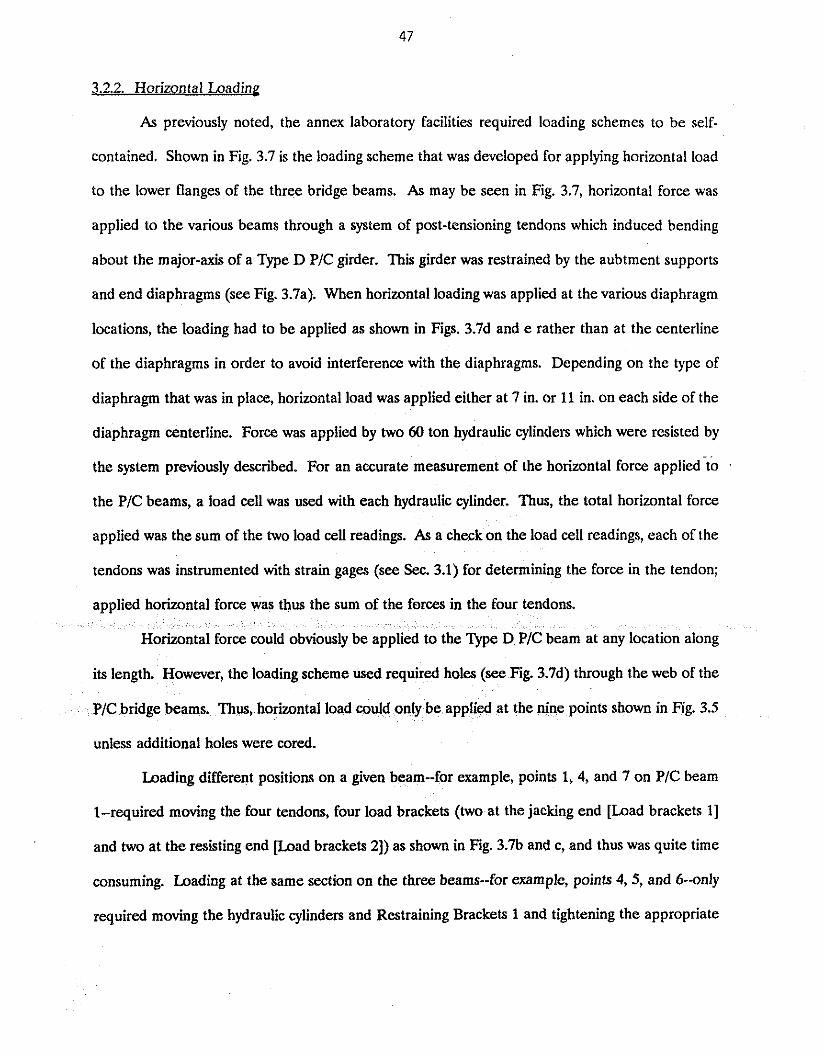
3.2.2. Horizontal Loading
As previously noted, the annex laboratory facilities required loading schemes to be self-
contained. Shown in Fig. 3.7 is the loading scheme that was developed for applying horizontal load
to the lower flanges of the three bridge beams. As may be seen in Fig. 3.7, horizontal force was
applied to the various beams through a system of post-tensioning tendons which induced bending
about the major-ads of a Type D P/C girder. This girder was restrained by the aubtment supports
and end diaphragms (see Fig. 3.7a). When horizontal loading was applied at the various diaphragm
locations, the loading had to be applied as shown in Figs. 3.7d and e rather than at the centerline
oE the diaphragms in order to avoid interference with the diaphragms. Depending on the type of
diaphragm that was in place, horizontal load was applied either at 7 in. or 11 in. on each side of the
diaphragm centerline. Force was applied by two 60 ton hydraulic cylinders which were resisted by
the system prwiously described. For an accurate measurement of the horizontal force appliedto
the PIC beams, a load cell was used with each hydraulic cylinder. Thus, the total horizontal force
applied was the sum of the two load cell readings. As a check on the load cell readings, each of the
tendons was instrumented with strain gages (see See. 3.1) for determining the force in the tendon;
ny location along
its length. However, the loading scheme used required holes (see Fig. 3.7d) through the web of the
PIC bridge beams. Thus, horizontal load could only be applied at the nine points shown in Fig. 3.5
unless additional holes were cored.
Loading different positions on a given beam--for example, points 1,4, and 7 on PIC beam
1--required moving the four tendons, four load brackets (two at the jacking end [Load brackets 11
and two at the resisting end m a d brackets 21) as shown in Fig. 3.7b and c, and thus was quite time
consuming. Loading at the same section on the three beams--for example, points 4, 5, and 6--only
required moving the hydraulic cylinders and Restraining Brackets 1 and tightening the appropriate
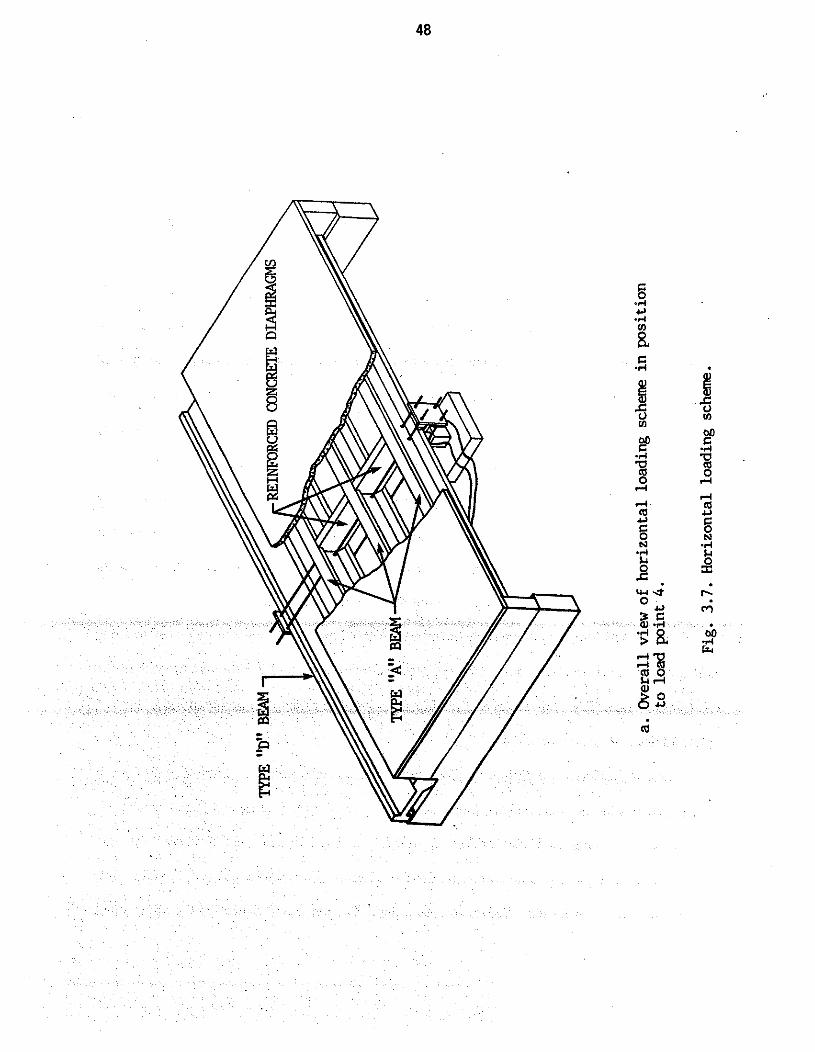
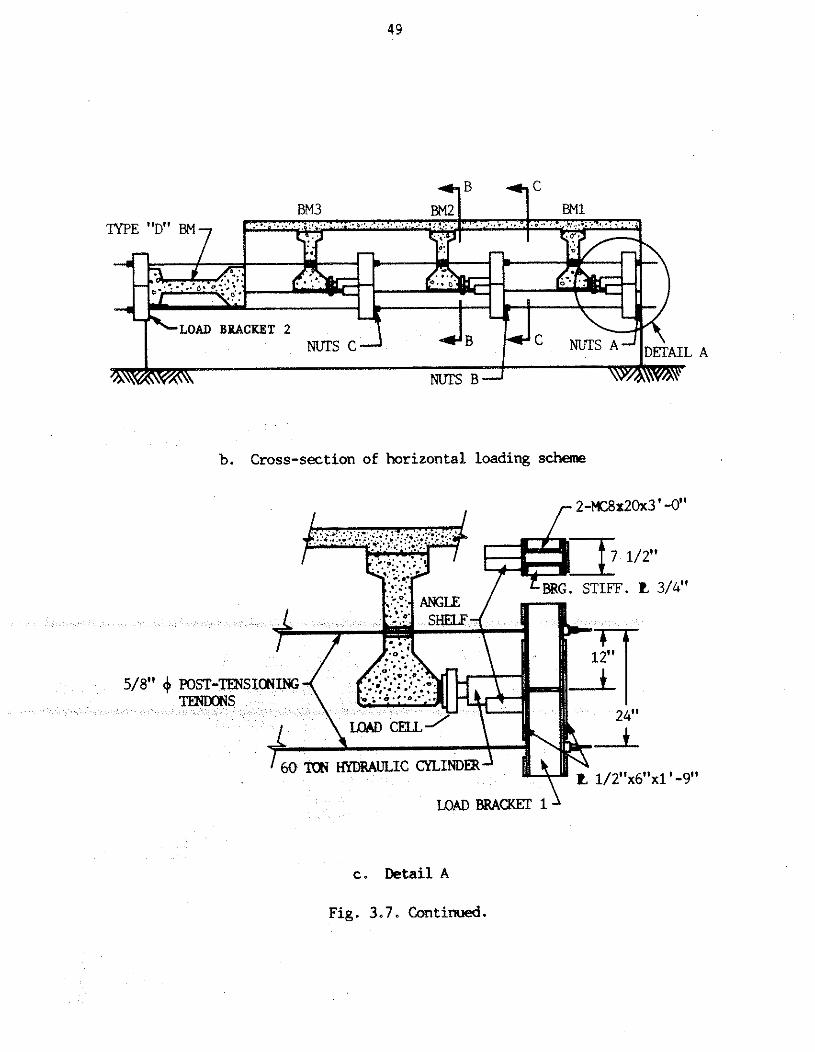
rntal loading sdteme
c. Detail A
Fig. 3.7. Continwd.
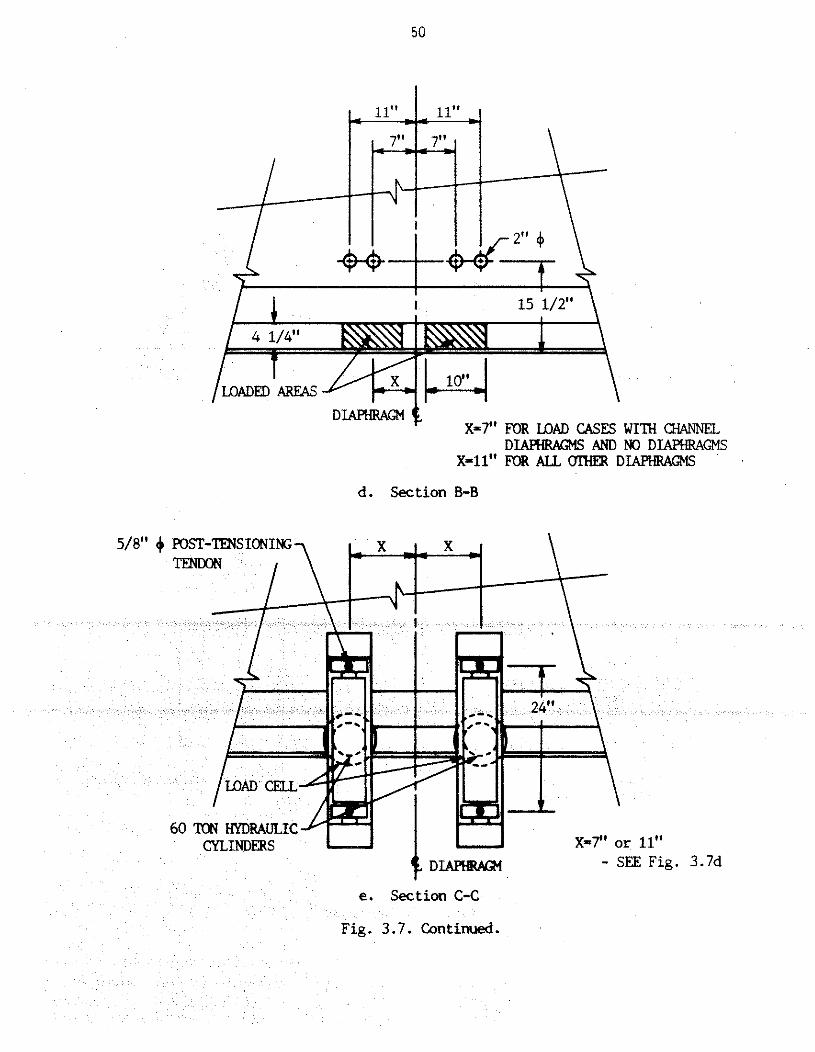
X=7" FOR LOAD CASE WITH CnANIaL DIAHiRAGMS AND NO DIAPHRAGMS
X-11" FOR ALL UlWB DIAFnrzAGNS
d. Section B-B
5/8" 4 POST-TENSIONING
X-7" or 11" - SEE Fig. 3.7d
e. Section C-C
Fig. 3.7. Continued.

nuts. For example, if it was desired to apply horizontal load to beam 2, the hydraulic cylinders and
Load Brackets 1 were appropriately positioned and Nuts B (see Fig. 3.7b) were tightened. In
combination load cases, where vertical and horizontal loading at a given position was applied, a
horizontal force of the desired magnitude was initially applied and held constant. Then, the desired
magnitude of the vertical force was applied by using the system shown in Fig. 3.6. The two loading
systems (vertical and horizontal--shown in Fig. 3.6b) were designed so that there was essentially no
interference between them.
33. Load Testa
For clarity, the testing program will be described in three separate sections: vertical load
tests, horizontal load tests, and vertical plus horizontal load tests. In the various tests, essentially the
same procedures were used; the following steps describe the general test procedure:
Record "zero" strain and "zero" DCDT deflection readings with the DAS. Record "zero"
dial gage deflection readings by hand.
Apply predetermined increment of force at the desired location.
Record strain gage, DCDT, and dial gage readings as in Step 1. Record any behavioral
anges
Repeat Steps 2 and 3 until the desired magnitude of force is obtained.
Repeat Steps 1 and 2 if the loading scheme requires horizontal and vertical loading.
Shown in Table 3.1, is a summary of the 131 tests that were performed on the bridge. As shown,
there were 20 separate series of tests; the series designation indicates the type of diaphragm at a
specific location with a specified loading. The number of tests in a given series varied from 6 to 9;
six was the usual number of tests in a given series, except when a check was made on symmetry--such
2, 3, 11, 12, 13, and 14. Each series is identified with a two-term designation (e.g.
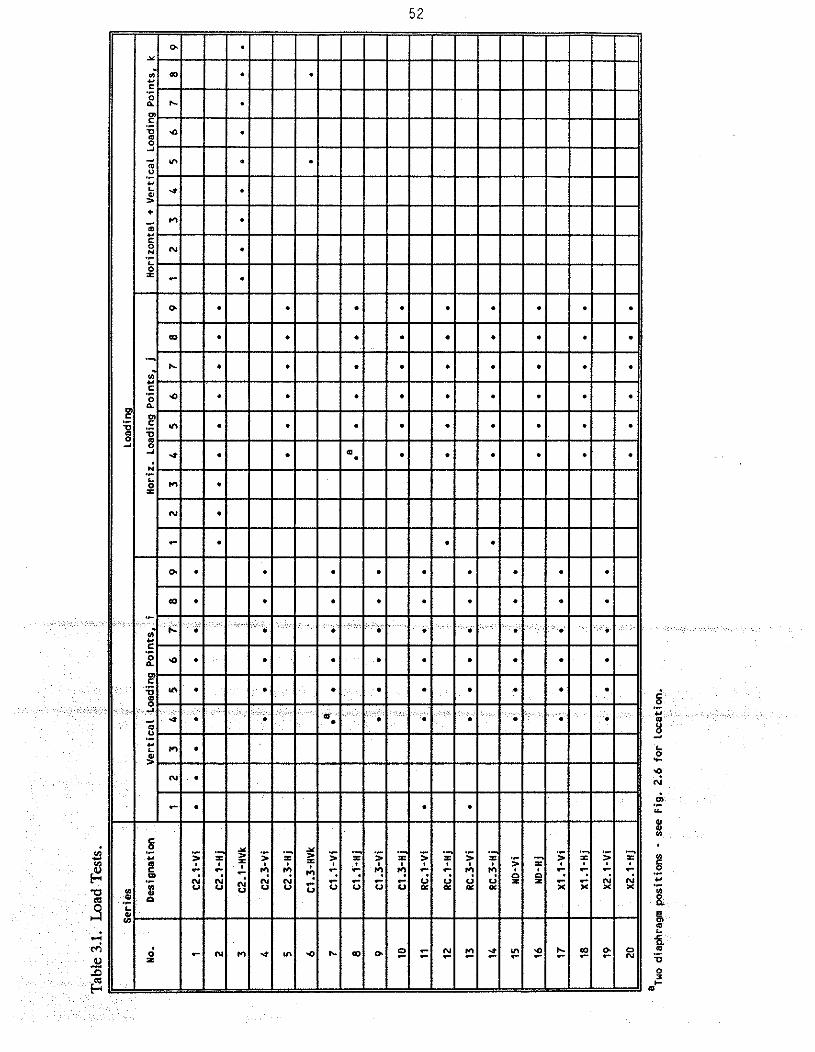
C1.3-Vi for Series 9, X2.1-Hj for Series 20, etc.) The first term of the designation (which was
defined in Section 2.2.1) identifies the type and location of diaphragm(s). The second term of the
designation identifies the direction (V=vertical, H=horizontal, and HV=horizontal plus vertical) and
the location of loading (i, j, or k = 1-9 which are the load points identified in Fig. 3.5). Thus, H7
represents horizontal loading at Point 7, HV3 indicates horizontal plus vertical loading at Point 3,
etc.
3.3.1. Vertical Loading
In Table 3.1, the series of tests involving vertical loading are identified (Series 1, 4, 7, 9, 11,
13,15,17 and 19). In all these series of tests, the bridge and end diaphragms remained constant--
only the type and location of intermediate diaphragms varied. In all the vertical load series of tests,
load was applied at a minimum of 6 points. Obviously, the behavior of the various diaphragm
combinations can be determined by loading points 4, 7, 5, and 8. However, points 6 and 9 were
included to check symmetry. In Series 1 (the first series of tests in the investigation) load points
(Points 1,2, and 3) were also loaded to check symmetry, while in Series 11 and 13, load point 1 was
included as a symmetry check. In Series 7, the bridge was tested with the diaphragm in two locations
Fig. 2.6) when loading was applied at Point 4 to determine if lowering the diaphragm improved
its effectiveness.
the bottom flanges of the three beams at the previously described nine load points (see Fig. 3.5).
To avoid stress concentrations, load was applied to the beams by using a combination of a 12"xl2"x1"
neoprene bearing pad and a 12"x 12" x 1" steel plate (see Fig. 3.6). A review of Fig. 3.5, reveals that
the maximum amount of vertical loading that could be applied varies from point to point. To
simplify the testing program, the maximum applied vertical loading was limited to 25 kips at each
of the nine load points. This magnitude was based on the maximum load that can be applied to load
points 1 and 7 (which obviously have the least resistance of any of the nine load points to vertical
load) with an appropriate factor-of-safety against lifting a portion of the bridge.
In all of the series of tests, the vertical load was increased from zero kips to a maximum of
25 kips in 6-kip increments. Data were taken (as described in Sec. 3.3) at each increment of loading.
After obtaining data with 25 kips being applied, loading was removed. A final "zero" reading was
taken when all vertical loading was removed.
3.3.2. Horizontal Loading
Nine of the series of tests in Table 3.1 involved horizontal loading (Series 2, 5, 8, 10, 12, 14,
16,18 and 20). The only variables in these series of tests were the type and location of intermediate
diaphragms. In all the horizontal load series of tests, the load was applied at a minimum of 6 points.
Horizontal loading was applied in the north direction (see Fig. 3.5) in all tests; thus the 6 points
loaded are required as the diaphragms will be in compression when Points 4 and 7 are loaded and
in tension when Points 6 and 9 are loaded. Symmetrical behavior was checked in Series 2 when
three additional points (Points 1, 2, and 3) were loaded and in Series 12 and 14 when Point 1 was
loaded.
ge was loaded horizontally at Point 4with the diaphragm in two positions
ee Fig. 2.6) to determine the effectiveness of the diaphragm in the lower position.
o avoid interference with the diaphragms.
tests (except Series 16 where there were no intermediate diaphragms), the
horizontal load was limited to a maximum magnitude of 75 kips--large enough to produce
measurable strains and deflections, yet small enough to minimize damage to the bridge deck In
16 (no intermediate diaphragms), the horizontal loading was limited to 60 kips to minimize
The horizontal load in thevarious tests was increased from zero kips to the desired maximum
magnitude in 10-kip increments. At each increment of load, data were recorded as described in Sec.
3.3. After obtaining data for the maximum load applied, the applied load was reduced to 40 kips
(30 kips in Series 16)--where data were recorded. After completely removing the horizontal load,
the'final "zeros" were recorded.
In several of the series (primarily the series involving channels--Series 2,5,8 and 10) slippage
in the bolted diaphragm connections was noted at certain magnitudes of applied load. After each
of the horizontal load tests in these series (e.g., C1.3-H5, C2.1-H7, etc.), the bolts at one end of the
channel diaphragms were loosened to allow the beams to return to their original positions. Before
the bridge was loaded at another location, the bolts were retightened. This procedure was employed
in an attempt to keep the effect of slippage constant in the various tests. This slippage will he
discussed and documented in Chapter 4.
3.3.3. Horizontal Plus Vertical Loading
Two of the series of tests in Table 3.1 (Series 3 and 6) involved a combination loading
(horizontal and vertical loading). As may be seen in the table, these tests were two of the initial
series of tests. Reviewing the data from these series of tests, revealed that superposition was valid.
In other words, the results of Series 1 plus Series 2 were the same as the results from Series 3;
In the 11 combination load tests (9 in Series 3 and 2 in Series 6), 50 kips of horizontal load
was applied at the desired load point. This force was held constant by continually monitoring load
cell outputs and adjusting the force applied by the hydraulic cylinders when necessary. With the
horizontal load in place, vertical load was applied at the same location (using the scheme shown in
Fig. 3.6) in increments of 5 kips until a maximum vertical load of 25 kips was reached. Data were
recorded at each load increment (e.g., H=5O kips, V=5 kips; H=50 kips, V=10 kips; etc.). After

the maximum combined loading (H=50 kips and V=25 kips) was applied and data recorded, loading
was removed, vertical first, and final "zerosn recorded.
4. ANALYSIS AND TEST RESULTS
This chapter presents the analytical and experimental results of this research. For clarity,
the chapter has been divided into three sections: analytical, experimental, and comparison of
analytical and experimental results of the various diaphragms investigated. Diaphragms have been
shown to be more effective in reducing the girder moments when point loads are applied directly
to the girder (3,ll). Th"s, the point loading described in Chapter 3 was used to accentuate the
behavior of the diaphragms employed. In the field, the vertical loading of a bridge actually involves
several point loads (i.e. truck loading), while the lateral loading of the beams due to over-height
vehicles would more than likely involve a single-point load. Also, the function of the diaphragms is
not significantly different under the action of dynamic loads (in the normal expected frequency
range) than under static loads. On average, diaphragms are less effective in terms of load
distribution when dynamic loads occur (I I).
When static loads (horizontal or vertical) are applied at a particular location on the bridge,
the sum of the girder deflections (or moments) at any given transverse section is essentially
independent of the presence or absence of diaphragms. Thus, variations in the girder deflections
results. As previously noted in other portions of this chapter, comparisons between theoretical and
experimental results will be presented.
4.1.1. Finite-Element Model
The bridge was analyzed using the AMY§ (5) finite-element program. Solid elements with
eight nodes and three degrees of freedom at each node were used in the analysis. The use of this
element in analyzing bridge superstructures has been shown to yield satisfactory results (13) in
previous research at ISU. The model consisted of 1,972 nodes and 924 elements (see Fig. 4.la).
The deck was modeled with 420 elements arranged in one layer that contained 15 elements across
the width of the bridge (see Fig. 4.lb). Each beam was modeled by using six elements in the cross
section; the deck and the beams each contained 28 elements along the length of the bridge (see Fig.
4.la). The modulus of elasticity of the elements representing the deck was taken as 3,908 ksi, while
the modulus of elasticity of the girders was taken as 4,903 ksi. These values correspond to concrete
strength of 4,700 psi and 7,400 psi, respectively. Since the end nodes for each girder were prevented
from displacing laterally, the end diaphragms were not included in the finite-element model. Various
types of intermediate diaphragms were considered in the analysis. Small channel diaphragms were
modeled as truss elements that were connected to the concrete beam at their midheight (see Fig.
4.1~). This idealization is consistent with the small bending stiffness of the small channels and the
small rotational stiffness between the channels and the concrete girders. This idealization was not
used for deep - channel diaphragms, however, because of their relatively large bending stiffness. In
addition, the connection between the larger channels and the concrete I-girders was deep enough
to restrain the torsional rotation of the girders, which developed bending moments in the channels
height of the channel did not match the distance between the finite-element nodes. To avoid adding -
hannel web were modified. Th
to be equal to 16 in., which matched the height of the I-girder
webs. The thickness of the web plates was reduced to obtain bending stiffness equal to that of the
channels used. Channel flanges were idealized as beam elements connected to the nodes along the
longitudinal edges of the web plate (see Fig. 4.ld). Concrete diaphragms were idealized as 6-in.-
hick plates (similar to the arrangement shown in Fig. 4.ld). Since the strength of the concrete in
diaphragms was essentially equal to that in the deck, the modulus of elasticity of the concrete
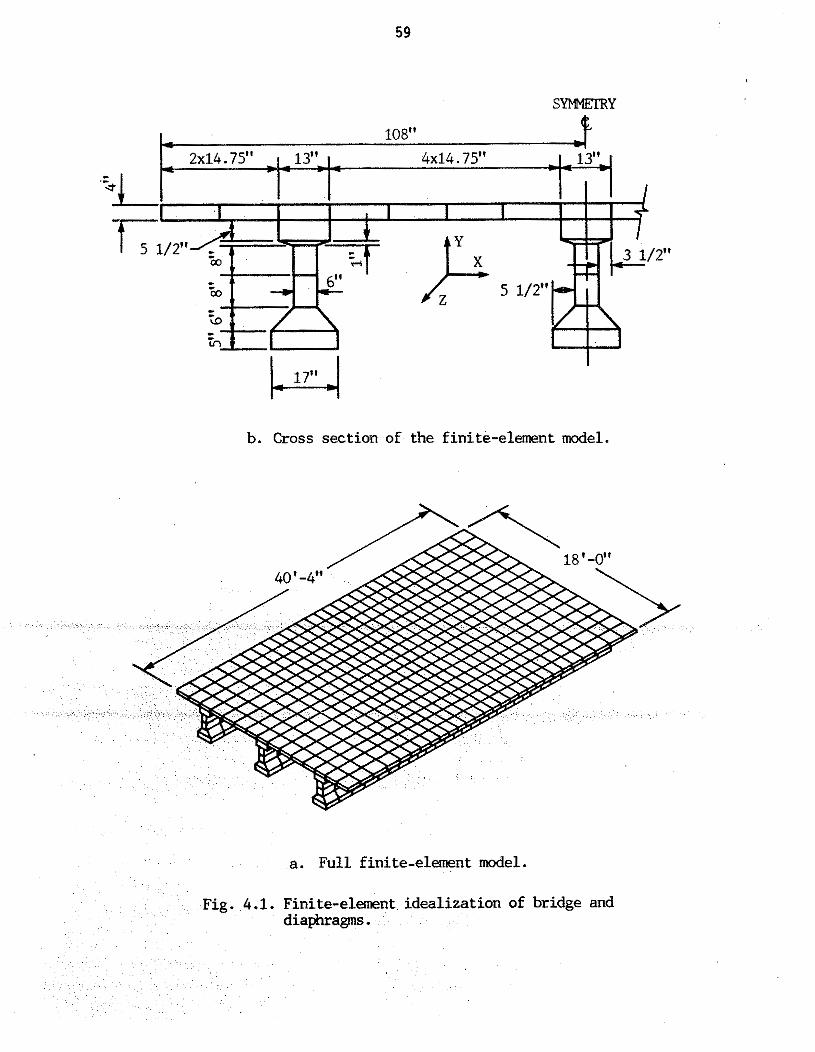
b. Cross section of the finite-element model.
a. Full finite-element model.
Fig. 4.1. Finite-element idealization of bridge and diaphragms.
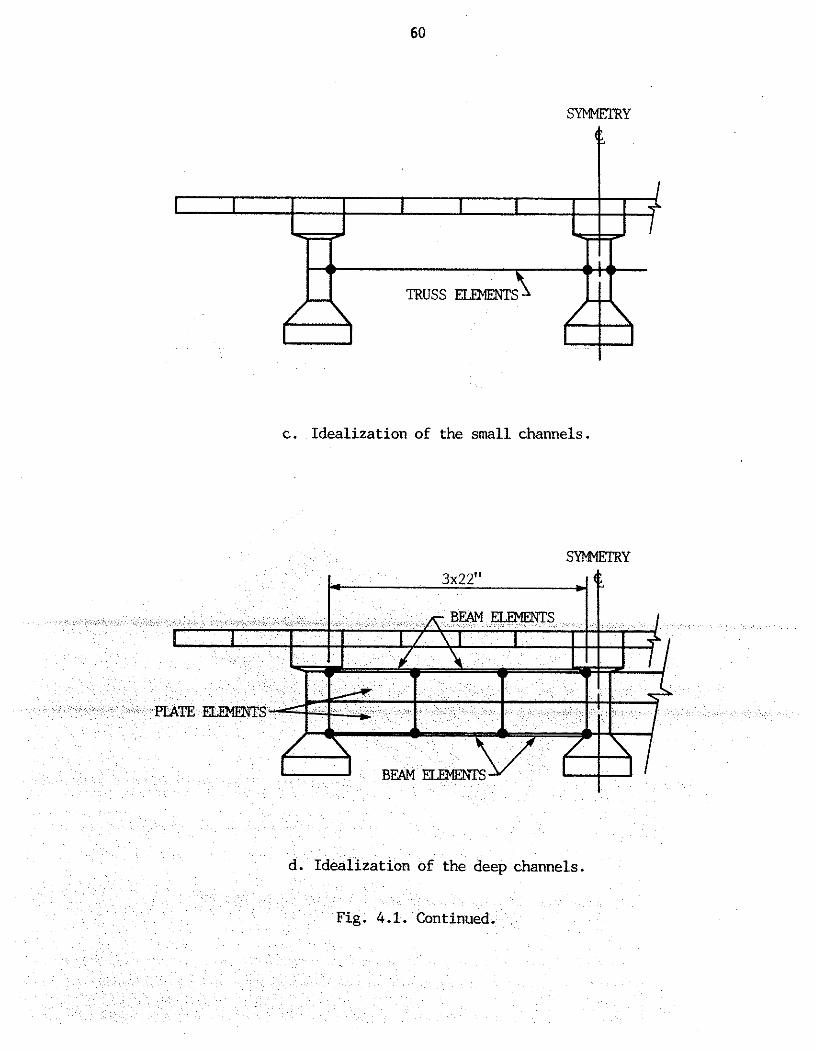
TRUSS ELEMENTS
c. Idealization of the small channels
SYMMETRY
d. Idealization of the deep channels.

TRUSS lcLmfms Y
e. Idealization of X-brace plus strut.
Fig. k.1. Continued.
diaphragm elements was set equal to that of the deck. The X-brace diaphragms were modeled by
using truss elements (see Fig. 4.le). The bridge with these diaphragms in place was analyzed with
and without the horizontal truss element at the bottom (see photographs in Fig. 2.7). For each type
of diaphragm, the bridge was analyzed with diaphragms at the midpoint of the span and diaphragms
at the third points of the span.
Initially, an attempt was made to take advantage of the symmetry of the bridge along its
longitudinal and transverse axes. Models of the full, one-half and one-quarter of the bridge were
analyzed. Although the last two models required shorter computer time per run than the full bridge
model, general cases of loading required the superposition of two runs with different boundary
conditions for the one-half model and four runs for the onequarter model. With the extra load
cases, the total running time was not considerably shorter than that required for the full model, and
in addition, the required post-processing of the data was a lengthy process. Hence, the model of the
full bridge (see Fig. 4.la) was used throughout the analysis. Iowa State University's Vax 111780
computer wasused in the analysis. Each run of the full model required 21 minutes of CPU time to
complete.
Two different end conditions were considered in the analysis. In the first idealization, the
ement model. In the second idealization, the three translational movements at the end nodes were
strained. The analytical model with these end conditions will be referred to as the Fixed-end finite-
element model. These two idealizations bound the actual end conditions in the bridge where a
partial restraint is imposed by the connection between the end diaphragms and the abutments.
The finite-element model was analyzed with both horizontal and vertical loads applied to any
one of the three girders at their midspan. Any combination of vertical and horizontal loads could
be obtained by the superposition of the results of the respective cases of loading. The midspan load
location covered the cases of a load acting at a diaphragm location when applied to the structure
with diaphragms at midspan and at a point between the diaphragms when applied to the structure
with diaphragms at the third points of the span. The analyses only considered live load; therefore,
the strains in the girders due to prestressing and dead load (girder and slab weight) were not
considered in the analysis.
Conducting a dynamic analysis of the bridge was not feasible because of the lack of proper
time-load curves. Knowing the magnitude of the applied force and its duration are essential in
conducting this type of an analysis. The values of these parameters are functions of several variables
such as the mass that collides with the bridge and the velocity of this mass at the time of collision.
In addition, the damping coefficient of the laboratory bridge was not established. By making several
simplifying assumptions, one can calculate a "rough" estimate of the force an overheight vehicle
transmits to a bridge. Shown in Table 4.1 is a summary of such forces. By assuming the various
vehicle weights, reductions in velocities due to impact, and contact times between the vehicle and
m the truck to the bridge. For the assumed values, the impact force varies from 14 to 1,094 kips.
alization of the bridge, the girders were connected to the deck at the common node
points between the deck and girders. This modeling assumes a "complete" connection between the
girders and the deck at the longitudinal edges of the top flange of the girders. In actuality, the tie
between the deck and the girders is through the stirrups that extend from the girders and are cast
into the deck. Since the stirrups are near the midwidth of the girders and are spaced on 16-in.
rs over 80% of beam's length, the connection between the girders and deck is not as
omplete" as assumed in the theoretical model. Therefore, when one of the girders is loaded
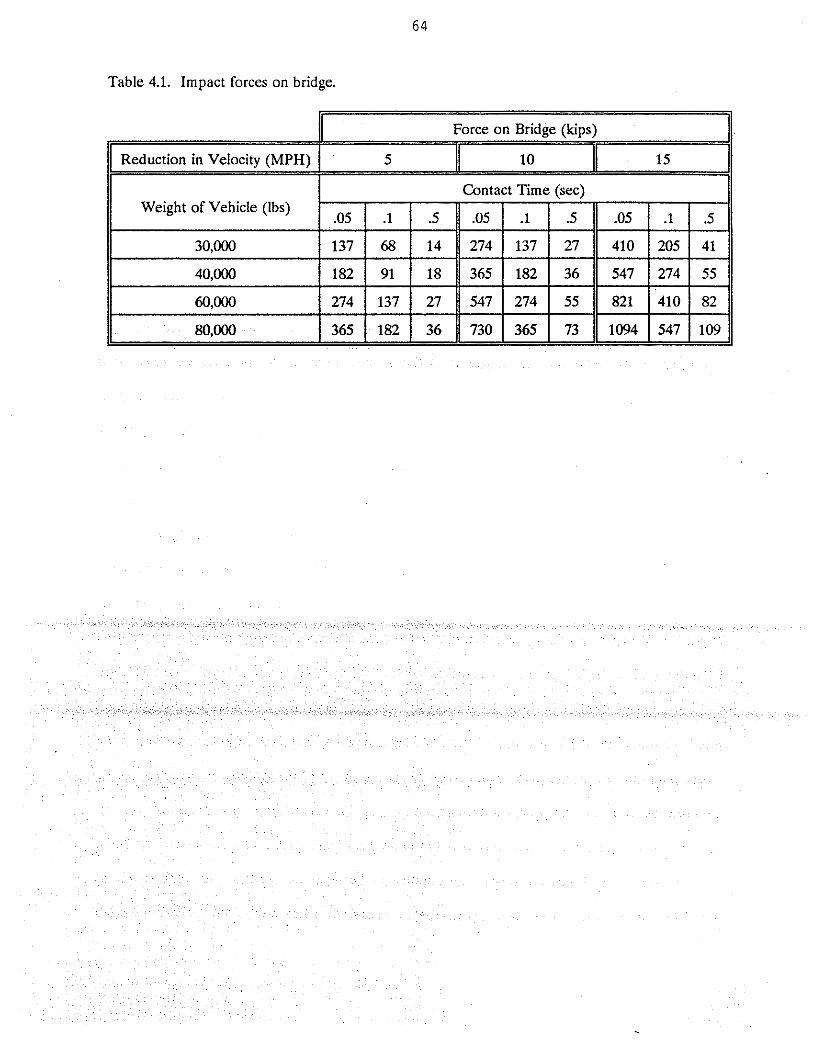
Table 4.1. Impact forces on bridge.
Force on Bridge (kips)
15 Reduction in Velocity (MPH) 10
Weight of Vehicle (Ibs)
30,000
40,000
6c4000
80,000
Contact Time (sec)
.05
137
182
274
365
.5
14
18
.1
68
91
137
182
.05
274
365
27
36
1 547 1 274 1 :i 1 821 1 410 1 82 1 730 365 1094 547 109
.1
137
182 ---
.5
27
36
.05
410
547
.1
205
274
.5
41
55
laterally on the bottom flange, more torsional rotation of the girder is expected to occur than
predicted by the finite-element model.
4.1.2. Effect of the End Fixity
Researchers at ISU, as well as at several other universities, have detected and measured
rotational end restraint while field testing various types of bridges. Since the end restraint is a
function of support and construction details, it varies from bridge to bridge. Although this restraint
can be measured with minimal difficulty, the restraint cannot be quantified accurately without actual
field test data. With this in mind, the finite-element model was developed so that the bridge model
could be analyzed for the two limiting conditions: pinned ends (no rotational restraint) and f ied
ends (infinite rotational restraint). The end details of the PIC girders in the model bridge were
constructed to be representative of those details existing in actual bridges--elastimetric bridge bearing
pad used instead of roller supports, end diaphragm reinforcement bent and cast into deck, end
diaphragms connected to PIC girders by means of coil ties in PIC girders, etc. (see details in
Appendix B). Thus, the girders in the laboratory bridge model had some end restraint. A review
of the construction details in Appendix B, reveals that the degree of girder end restraint is a function
of the type of loading applied to the bridge: horizontal loading or vertical loading.
The effect of girder end restraint on the vertical load-deflection response (vertical load at
4.2. Although there is a significant
dition, varying the type of diaphragm
essentially has no effect. The load versus deflection curves for the various diaphragms are so close
together that in this particular figure they have not been individually identified. The load versus
deflection response of the bridge model (as will be shown later) is between these two limiting
conditions.
Shown in Fig. 4.3 is the theoretical response of the bridge model to horizontal loading
(horizontal loading at point 4 deflection at point 4). In Fig. 4.3a the model is assumed to have
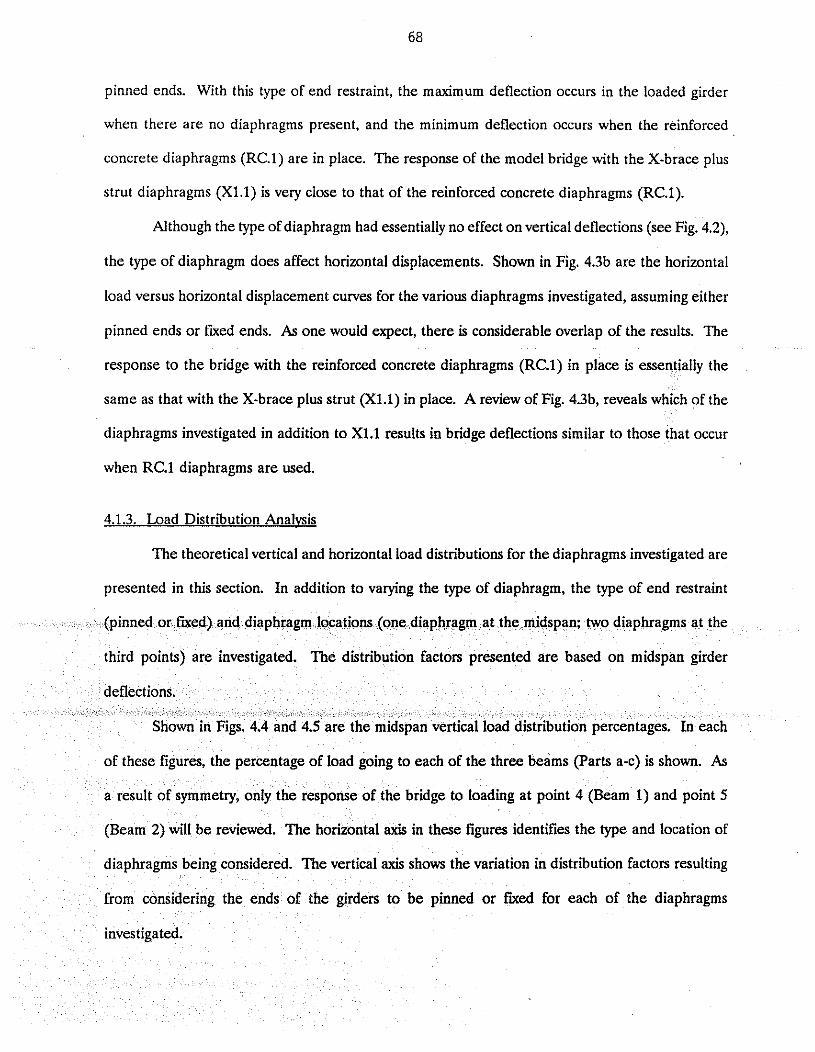
pinned ends. With this type of end restraint, the maximum deflection occurs in the loaded girder
when there are no diaphragms present, and the minimum deflection occurs when the reinforced
concrete diaphragms (RC.1) are in place. The response of the model bridge with the X-brace plus
strut diaphragms (X1.l) is very close to that of the reinforced concrete diaphragms (RC.1).
Although the type of diaphragm had essentially no effect on vertical deflections (see Fig. 4.2),
the type of diaphragm does affect horizontal displacements. Shown in Fig. 4.3b are the horizontal
load versus horizontal displacement curves for the various diaphragms investigated, assuming either
pinned ends or fuced ends. As one would expect, there is considerable overlap of the results. The
response to the bridge with the reinforced concrete diaphragms (RC.l) in place is essentially the
same as that with the X-brace plus strut (X1.1) in place. A review of Fig. 4.3b, reveals which of the
diaphragms investigated in addition to X1.l results in bridge deflections similar to those that occur
when RC.l diaphragms are used.
4.1.3. Load Distribution Analvsis
The theoretical vertical and horizontal load distributions for the diaphragms investigated are
presented in this section. In addition to varying the type of diaphragm, the type of end restraint
ly the response of the bridge to loading at point 4 (Beam 1) and point 5
(Beam 2) will be reviewed. The horizontal axis in these figures identifies the type and location of
diaphragms being considered. The vertical axis shows the variation in distribution factors resulting
from considering the ends of the girders to be pinned or fked for each of the diaphragms
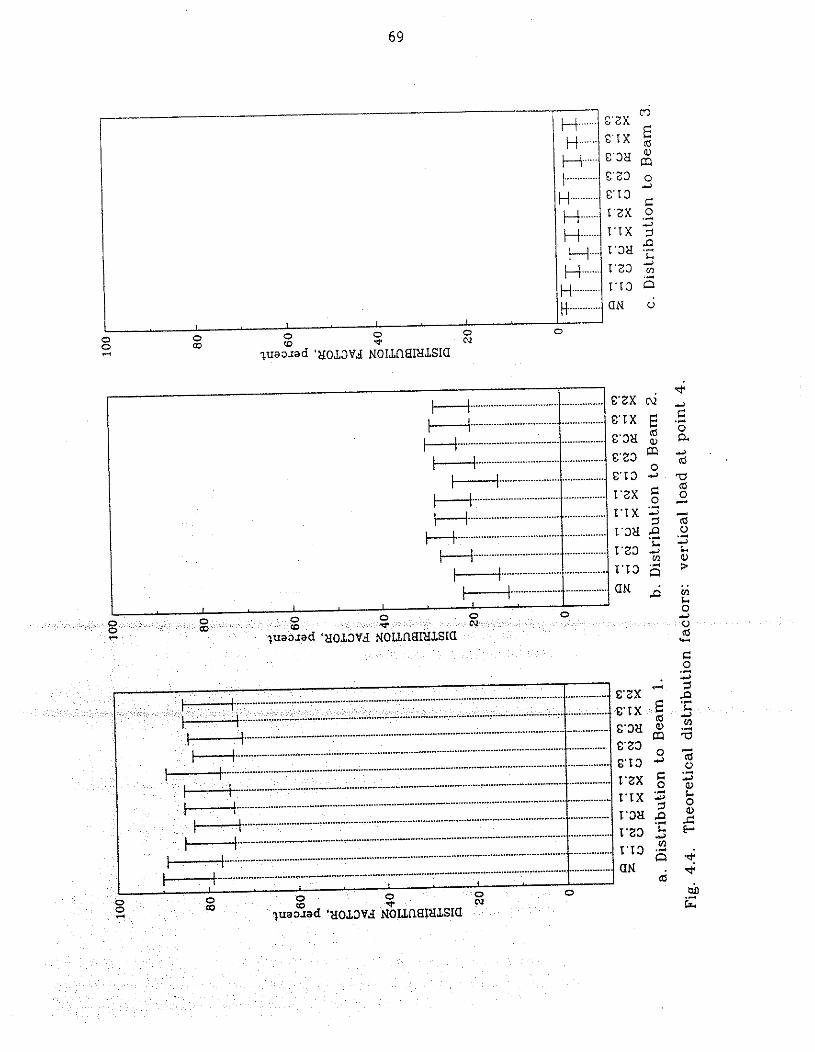
m "2X
E E ' I X as E'3X $ E 'Z3 0
3
E ' 1 3 C
"ZX ,? 3
"'X 5 n "32 .z
1." .$ .- I ' L 3 Q
a N O
, 0 0 0 0
0 0 m w 9. N 2 7uaxad 'tfOL3VA NOWfi812LSIa
H ....... H ....... H .... I ............ H ........... t..+ ....... t..+ ....... H.... t..+ ....... H....,.... ............. H
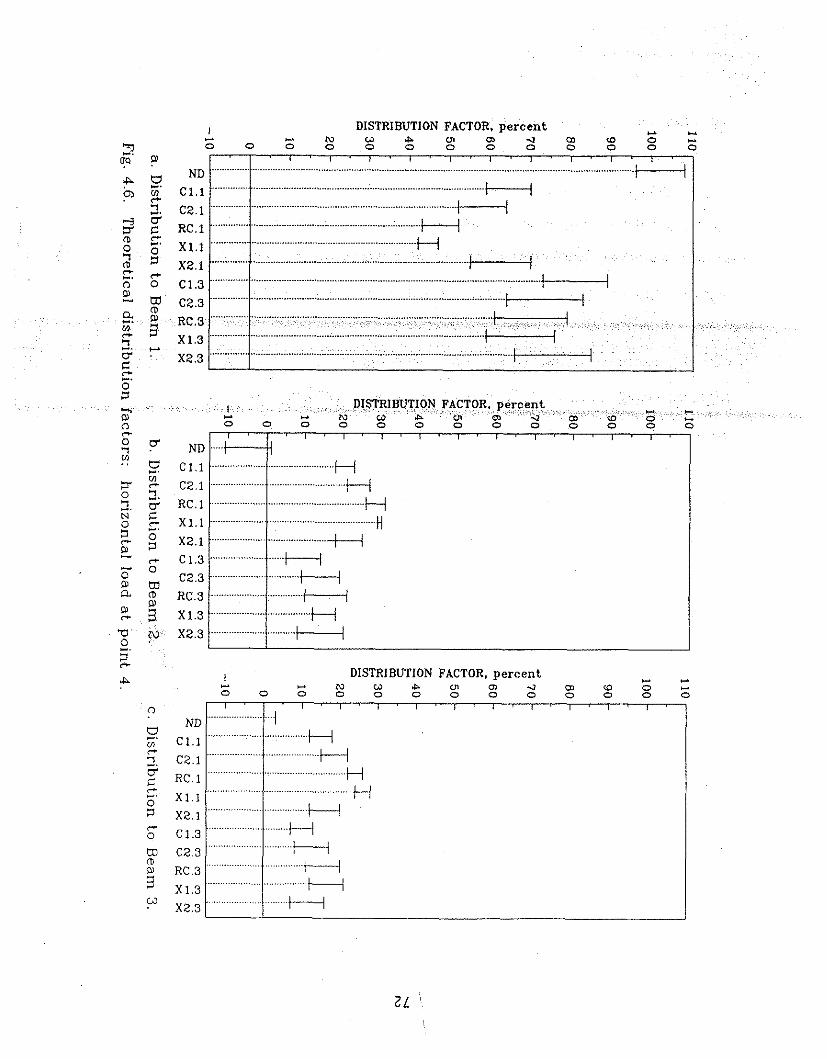
I DISTRIBUTION FACTOR, percent - +. +A
+. N 0 4 Ln 0) 4 m to 0 - "1 0 0 0 0 0 0 0 0 0 0 0 0 0
m pl
"
z Cr
A I h.. +. DlSTRlBUTlON FACTOR, percent
+. - i V w 4 U 1 C n . l m ( 0 0 - 0 0 0 0 0 0 0 0 0 0 0 0 0
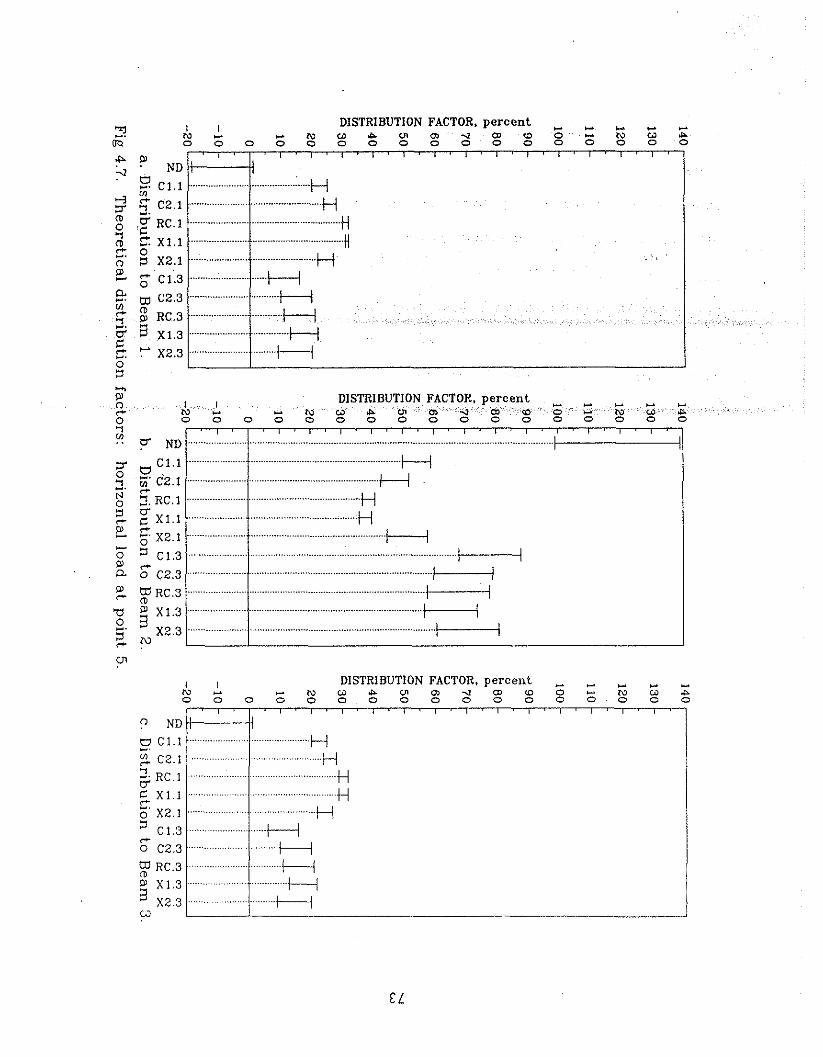
1 I DISTRIBUTION FACTOR, percent , , '? N - r ~ w + a m + m c n ~ - ~ ~ g 09 0 0 0 0 0 0 0 0 0 0 0 0 0 0
C" I I DlSTRIBUTION FACTOR. percent , , , , , N r - ~ w + v m + m u a o r ~ ~ & 0 0 0 0 0 0 0 0 0 0 0 0 0 0 0 0 0
. .. '2 0 I . . / C N r - 0 0 0 0 0 7 " jq, ........... 1 ........... ........... 1 ........... i ......... 1 .........,..l ............: ........... : ........... ! ........... 1 ........... : .......... , ' I ' -1

of the horizontal load to the loaded beam (Beam 1 in Fig. 4.6 and Beam 2 in Fig. 4.7) is greater than
100% and that to the remaining beams is very small or even negative. This effect is caused by the
direction of the rotation (and thus the lateral displacement of the bottom girder flanges) that occurs
in the various beams.
When intermediate diaphragms are installed at the third points and when midspan horizontal
loads are applied, minimal differences occur in the load distributions. When one considers midspan
diaphragms, the X-brace plus strut (X1.l) is the least sensitive to changes in the girder end restraint;
however, the reinforced concrete diaphragm (RC.1) is also essentially independent of the girder end
restraint. For distributing lateral loading, the RC.1 and X1.1 diaphragms are essentially structurally
equivalent.
4.2. ExDerimental Imstipations
4.2.1. Deck Crackine Effects on Bridee Resvonse
The response characteristics of a structure are affected by the magnitude of load, which
causes elastic or inelastic behavior, the existence of cracks within the concrete members, and the
construction details used to connect the various members. The effects of cracks within the concrete
eck of the model bridge on the bridge's response will be discussed in this section; the effects of
the connection details between the various intermediate diaphragms and the PIC beams on the
bridge behat ior will be discussed in Sections 4.2.2-4.2.4.
a result of horizontal and vertical loads applied to the bottom flanges of the PIC girders. The
progression of the formation of these cracks was not documented; however, on the basis of the order
and magnitude of the loads applied, the extent and location of these longitudinal cracks can be
explained. As discussed in Section 2.1, the thickness of the reinforced concrete deck was set equal
to 4 in. With this thickness, the location of the transverse reinforcement (see Fig. B6) was essentially
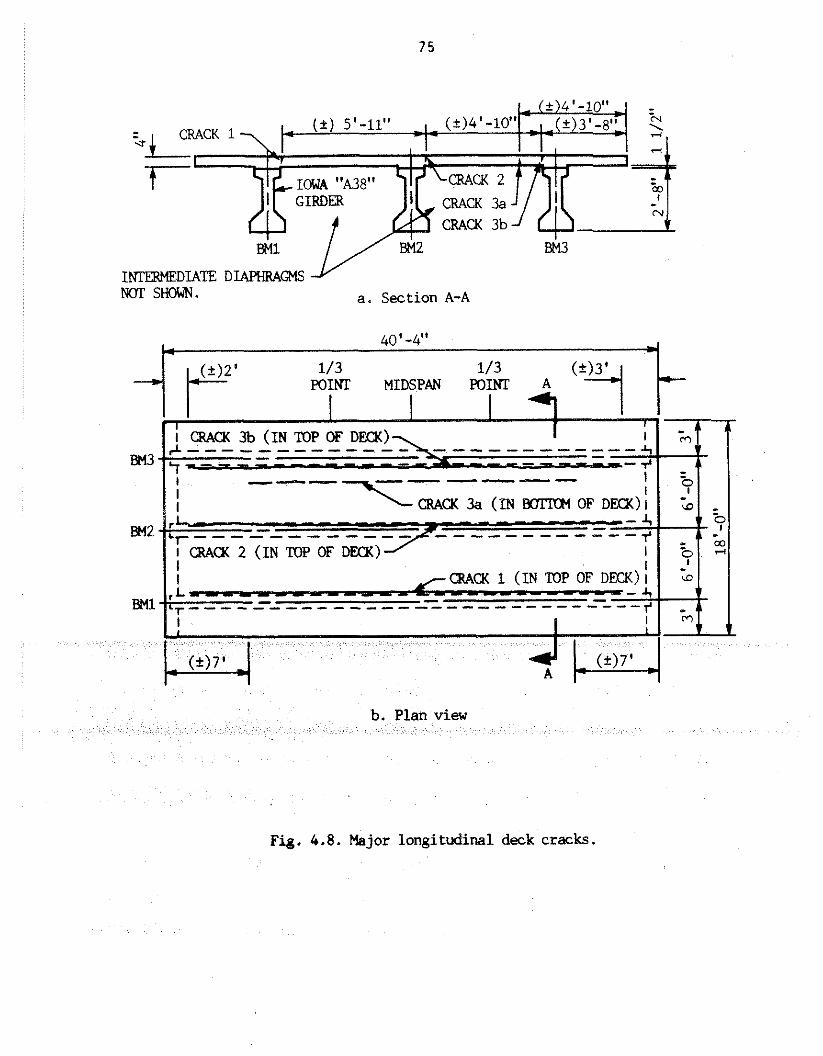
1; 1;- ,L - - - - - - - - - - - - /(hW - - - - - J) - dOL - - NI) - Z - X)W - - : I - - - 4 -': - ZWB I(xrcratK)l-m.LmNI) 'xmm--\ I
---- ------ 'xi
near the midthickness of the deck. Therefore, the flexural strength of the deck in the transverse
direction was very small and was essentially the same for positive or negative bending.
The first loads that were applied to the model bridge were horizontal loads at point 4 (BM1
in Fig. 4.8a; see Fig. 3.5) when the steel channel diaphragms C2.1 (see Table 2.2 and Fig. 2.5) were
in place at the midspan. The loads, which acted towards the right of this figure, caused the girder
to rotate counterclockwise about the longitudinal axis of the composite section. This rotation,
induced a counterclockwise rotation of the deck at the joint between the girder and the deck. Since
the intermediate channel diaphragms were not connected to the underside of the deck, only the
flexural strength of the deck in the transverse direction resisted the rotation of the deck. In addition,
the self-weight of the 3-ft. slab overhang produced transverse tensile stresses in the top of the deck
above the PIC girder (BM1). The largest flexural stresses would have occurred at the cross section
located at the inside face of the top flange of the PIC girder. Crack 1 formed at this location.
After the horizontal load tests at point 4 were completed, horizontal load was applied at
point 5 (BM2 in Fig. 4.8a; see Fig. 3.5). The horizontal loads, which induced a counterclockwise
rotation of this PIC girder and the slab joint at the top of this girder, produced transverse tensile
deck stresses in the top fibers of the slab to the right of BM2 and in the bottom fibers of the slab
deck. The dead load o f t moment--tension in the top transverse
fibers and compression i e deck at the PIC girder labelled BM2
in Fig. 4.8a. The superposition of the flexural stresses induced by the horizontal loads, therefore,
resulted in large transverse tensile stresses at the right face of the top flange of the PIC girder
(BM2). As shown in Fig. 4.8a, Crack 2 occurred at this location.
The last horizontal load tests at the midspan location, those involving the intermediate
diaphragm (2.1, were conducted at point 6 (see Fig. 3.5). These horizontal loads were applied to
the bottom flange of the PIC girder labelled BM3 in Fig. 4.8a. The loads, which were directed
uaarmaq tuaru%as qmp aqt ry e~ pue z qei3 30 amasaid au .pasol:, aAeq plnoqs 1 qsei3 al!qm
pauadoai aAeq plnoqs eE pue z q3ei3 'S ~qod le pagdde aiam speoI les!pa~ piemdn uayM
.uo!snpuos qql qtp paaize sllnsaJ leluam!iadxa au 'mioj IOU p~noqs lapi!% 3/d ialuw aql
ieau qsap a8p~iq aqljo wejins woltoq aqt u! q:,eis ~eu!pnl!%uo~ e 'aiojaiau -a~aa:,uos q:,ap aqti03
le3ltiaA aqt Kq pasnes sassa~ls aqt 03 pappe ale uo!%em[ awes s!qt le WaP Wt 30 saqg moJJoq aql
uo sassails pvol peap astaAsueJ3 an.!ssaidmm aqt uam ?sap aqt jo wejins wo)toq aqt uo Jnmo
[einxau aq] pwnpai z~g pue SJapi!83/d uaarmaq trrauI8as qelsaq! Jo pua paseldqp K11e:,!ua~
aql te I qsei3 30 wuasaid aql an!^ ~8-v '813 u! umoqs z qsei3 asols pue 1 qse~ uadoai ot puai
plnom v lu!od te paydde speo~ les!pa~ piemdn 'a8puq aqljo uedspfm aq8 le (SE '8!& ass) 9-t. slqod
. %uplo~u! uo!t:,as ssoi:, aqt %uuap!sutr;) -uo!tsas ssois ames aql ie paonpuo:, aiam slsai peol ~espia~
(e8-p .%!A aas) iapi!8 3/d Jo!iawa qqa jo a8uev do1 aq130 a3ej aq$ WOJJ .u!
~1 Llatem~oidde y:,ap a%p!iq aqt 30 aej mot~oq aql u! inmo ox (ec qsei3) qseis Ie~&aU e pasne:,
y3ap aKp!iq aqt jo iq%!am-jlas aqt pue speol [etuozuoq aql Kq paanpu! sassails aql30 uo!leu!qwo:,
ayJ. -lapi!% io!aawa s!qt te qels aql 30 saqg dot aql u! sassails apsua* aslaAsueq pue siaqg
qels au -pau!eizsaiun s! mg jo tq%!i aqt ot qsap aqt jo uo!liod ayl se egv '%!s U! (E~\IB) lap118
3/d papeol aqt JO ljal aqt 01 inm 01 aAeq pInom q:,ei:, IelnxaU Kue 'qsap aqt30 uo!~~od snonu!luo:,
aqt Kq pappoid Lluo s! uo!teloi ot qmp aqt 30 wuels!sai IeinxaU aql wu!~ .uo!ge:,ol s!ql te y3ap
a%p!iq ay) puv iapq8 s!qt jo uo!aeloi as~:,ol:,iatuno:, e pa:,npoid 'ain%g aqa u! tq%!i aqt spierno1
PIC girders BM2 and BM3 provides a linkage mechanism for this portion of the bridge deck.
Therefore, additional longitudinal cracking in this deck span should not have occurred with the
upward vertical movement at BM2. An inspection of the deck revealed no additional cracking.
When the deck span between PIC girders BM1 and BM2 is considered, Crack 2 reduced the flexural
stiffness of this span. If one follows the same logic that was discussed for transverse stresses induced
by an upward movement of BM1, additional longitudinal cracks should not form in the left deck span
(as viewed in Fig. 4.8a). The experimental results confirmed this analysis of the behavior.
An upwards vertical load applied at point 6 would have closed Cracks 2 and 3a. The upward
vertical movement of the exterior PIC girder (BM3) induced transverse tensile stresses in the top
fibers of the bridge deck at this girder. When these stresses were superimposed on the top fiber
tensile stresses caused by the self-weight of the 3-Et slab overhang, the total stress exceeded the
modulus of rupture to produce the longitudinal crack labelled Crack 3b at the interior face of the
top flange of this PIC girder, as shown in Fig. 4.8a. The total transverse tensile stresses in the
bottom surface of the bridge deck at the right face (as viewed in Fig. 4.8a) of the top flange of PIC
girder BM2 were smaller than the stresses at the location of Crack 3a prior to its formation, because
of the self-weight of the bridge deck. Once Crack 3b formed, the transverse stresses in this slab span
subsequent load tests, the longitudinal cracks at the four locations shown in Fig. 4.8 propagated along
almost the entire length of the bridge. The presence of these cracks in the bridge deck caused load
versus displacement relationships to digress from the idealized conditions associated with an elastic
and homogenous material. With regards to the bridge's response to horizontally applied loads, the
measured horizontal displacements at the bottom flange of the PIC girders were caused by the bridge - deck flexural and shear deflection, girder rotation, transverse flexural bending of the girder, axial

deformation of any intermediate diaphragms, and potential movements within the diaphragm
connections. When horizontal loads were applied to the bottom flange of the PIC girder labelled
BM1, Crack 1 caused additional rotation of this girder beyond the rotation associated with an
uncracked bridge deck. Similarly, Cracks 2 and 3a caused additional rotation of the PIC girders
labelled BM2 and BM3, respectively. Therefore, the horizontal displacements at the bottom flange
of a loaded girder, which were measured during the experimental testing of the model bridge, were
larger than those movements that would have resulted with an uncracked bridge deck. This behavior
is illustrated in the horizontal load versus displacement relationships shown in Section 4.2.3.
As the longitudinal cracks developed during the initial series of tests and essentially did not
change during the investigation, this effect on the response of the bridge to vertical loads can be
assumed to be "constant." Recall that the slab thickness was intentionally set equal to about one-half
of the thickness of a typical bridge deck and that the transverse slab reinforcement was positioned '
near the mid-depth of the slab (see discussion in Section 2.1). Therefore, the flexural stiffness of the
slab in the direction transverse to the PIC girders was smaller than that found in actual bridges and
thus subjected the intermediate diaphragms to more load.
4.2.2. Reinforced Concrete Diaohraem Connection Effects on Bridee Response
The connection details between the intermediate diaphragms and the PIC girders will affect
the response of a bridge superstructure to applied horizontal loads. Bridge response to vertical loads
in Section 4.1.2. and explained further in Section 4.3.3. Considering horizontal loads applied to the
bottom flange of an exterior PIC girder in the experimental bridge, the direction of the load will
influence the magnitude of the horizontal displacement of the bottom flange of the loaded girder.
The effects of the connection details for the reinforced concrete diaphragms are discussed in this
section, and the effect of the steel channel and steel X-brace diaphragm connections are discussed
in Sections 4.2.3 and 4.24, respectively.

For the intermediate, reinforced concrete diaphragms (RC.1 and RC.3) shown in Fig. 2.4,
horizontal loads applied on the outside face of the bottom flange of the exterior girder (BM1 in Fig.
4.8) will induce a bearing condition between the inside flared portion of the girder bottom flange and
the diaphragm. Since the diaphragms were cast against the girders, any horizontal loads, which were
directed towards the interior girder, produced essentially negligible relative horizontal movement
between the girder and the diaphragm. Even though concrete shrinkage may have produced an
extremely small gap between these two members, direct load transfer should have occurred, since
the connection should have behaved as though the diaphragm were completely connected to the
girder along the interface.
When the horizontal load was applied to the inside surface of the bottom flange of the north
exterior girder (BM3 in Fig. 4.8), the mechanism of load transfer between the PIC girders and the
intermediate diaphragm changes. As discussed in Sec. 2.2.2, the reinforced concrete diaphragms
were connected to the PIC girders with two 518-in.-diameter post-tensioning tendons, which were
placed within conduits. Therefore, with an outward directed horizontal load on the bottom flange
of the exterior PIC girder (BM3), the lower tendon was subjected to a tension force. This tension
at the far end of the tendon and the web
uld occur because of the axial lengthening
he lower tendon. This deformation behavior produced greater horizontal displacements of the
loaded girder than would have been obtained if relative movements between the girder and the
diaphragm were not possible (such as the case in actual construction).
When horizontal loads were applied to the interior PIC girder (BM2 in Fig. 4.8), only the
intermediate reinforced concrete diaphragm on the side of the girder opposite to the load point was
subjected to a direct compressive force at the sloping face of the girder bottom flange. Additional
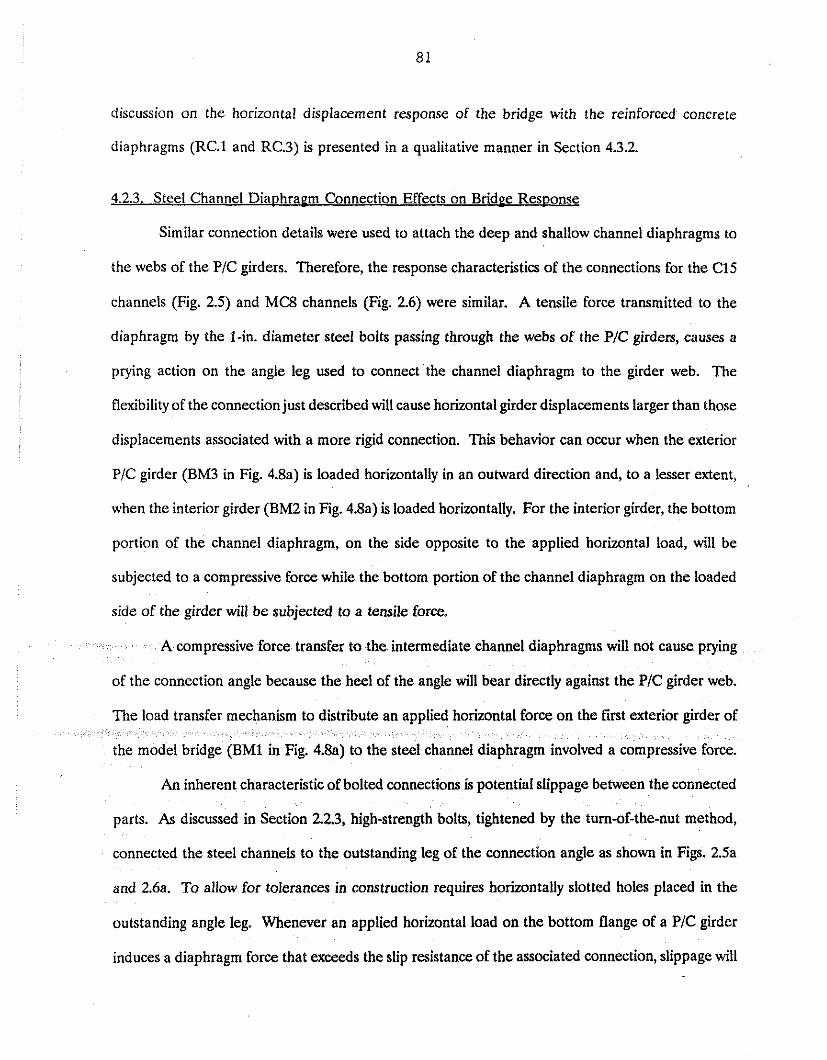
discussion on the horizontal displacement response of the bridge with the reinforced concrete
diaphragms (RC.l and RC.3) is presented in a qualitative manner in Section 4.3.2.
4.2.3. Steel Channel Diaohraem Connection Effects on Bridoe - Resoonse
Similar connection details were used to attach the deep and shallow channel diaphragms to
the webs of the PIC girders. Therefore, the response characteristics of the connections for the C15
channels (Fig. 2.5) and MCs channels (Fig. 2.6) were similar. A tensile force transmitted to the
diaphragm by the I-in. diameter steel bolts passing through the webs of the PIC girders, causes a
prying action on the angle leg used to connect the channel diaphragm to the girder web. The
flexibility of the connection just described will cause horizontal girder displacements larger than those
displacements associated with a more rigid connection. This behavior can occur when the exterior
PIC girder (BM3 in Fig. 4.8a) is loaded horizontally in an outward direction and, to a lesser extent,
when the interior girder (BM2 in Fig. 4.8a) is loaded horizontally. For the interior girder, the bottom
portion of the channel diaphragm, on the side opposite to the applied horizontal load, will be
subjected to a compressive force while the bottom portion of the channel diaphragm on the loaded
side of the girder will be subjected to a tensile force,
A compressive force transfer to the intermediate channel diaphragms will not cause prying
of the connection angle because the heel of the angle will bear directly against the PIC girder web.
An inherent characteristic of bolted connections is potential slippage between the connected
parts. As discussed in Section 2.2.3, high-strength bolts, tightened by the turn-of-the-nut method,
connected the steel channels to the outstanding leg of the connection angle as shown in Figs. 2.5a
and 2.6a. To allow for tolerances in construction requires horizontally slotted holes placed in the
outstanding angle leg. Whenever an applied horizontal load on the bottom flange oE a PIC girder
induces a diaphragm force that exceeds the slip resistance of the associated connection, slippage will
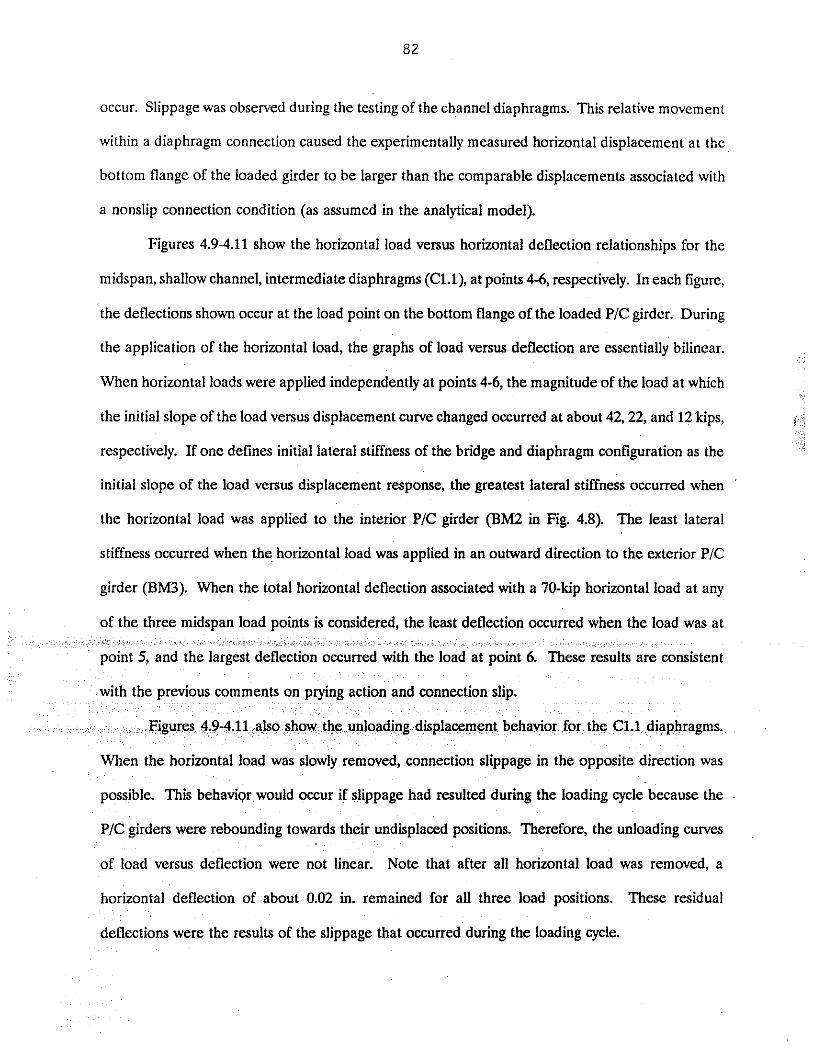
occur. Slippage was observed during the testing of the channel diaphragms. This relative movement
within a diaphragm connection caused the experimentally measured horizontal displacement at the
bottom flange of the loaded girder to be larger than the comparable displacements associated with
a nonslip connection condition (as assumed in the analytical model).
Figures 4.9-4.11 show the horizontal load versus horizontal deflection relationships for the
midspan, shallow channel, intermediate diaphragms (C1.1), at points 4-6, respectively. In each figure,
the deflections shown occur at the load point on the bottom flange of the loaded PIC girder. During
the application of the horizontal load, the graphs of load versus deflection are essentially bilinear.
When horizontal loads were applied independently at points 4-6, the magnitude of the load at which
the initial slope of the load versus displacement curve changed occurred at about 42,22, and 12 kips,
respectively. If one defines initial lateral stiffness of the bridge and diaphragm configuration as the
initial slope of the load versus displacement response, the greatest lateral stiffness occurred when
the horizontal load was applied to the interior PIC girder (BM2 in Fig. 4.8). The least lateral
stiffness occurred when the horizontal load was applied in an outward direction to the exterior PIC
girder (BM3). When the total horizontal deflection associated with a 70-kip horizontal load at any
When the horizontal load was slowly removed, connection slippage in the opposite direction was
possible. This behaviqr would occur if slippage had resulted during the loading cycle because the
PIC girders were rebounding towards their undisplaced positions. Therefore, the unloading curves
of load versus deflection were not linear. Note that after all horizontal load was removed, a
horizontal deflection of about 0.02 in. remained for all three load positions. These residual
deflections were the results of the slippage that occurred during the loading cycle.
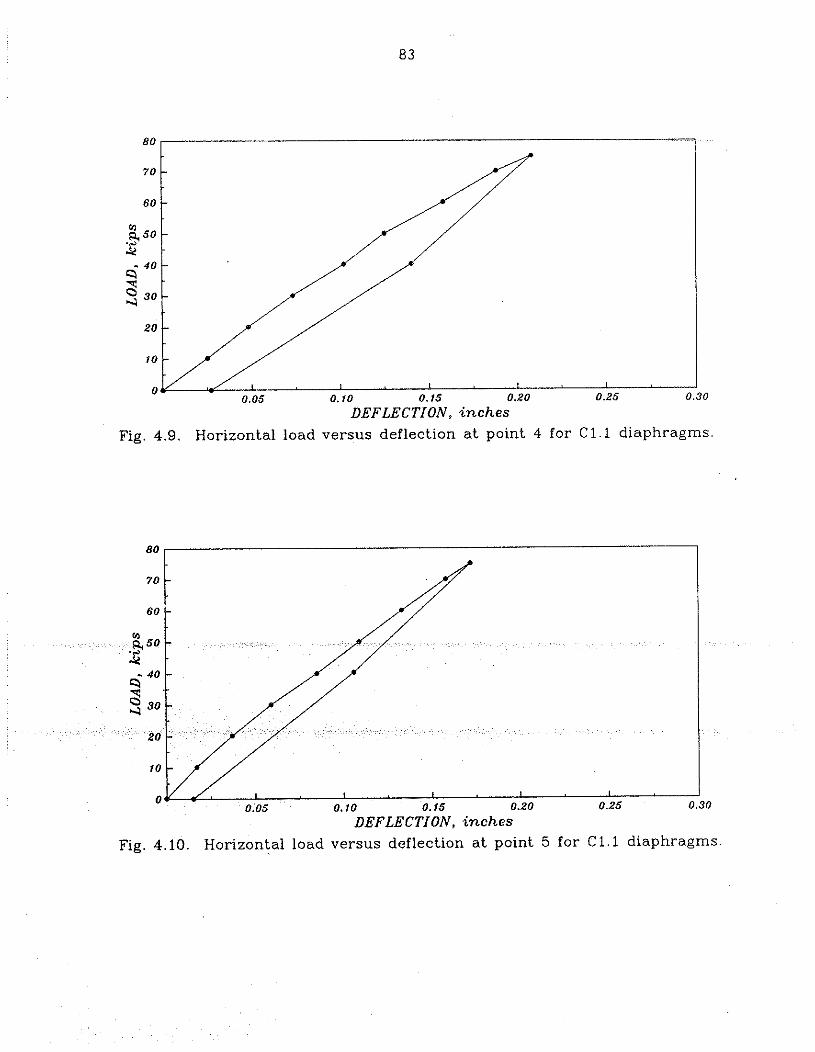
Fig. 4.9. Horizontal load versus deflection a t point 4 for C1.l diaphragms.
Fig. 4.10. Horizontal load versus deflection a t point 5 for C1.l diaphragms
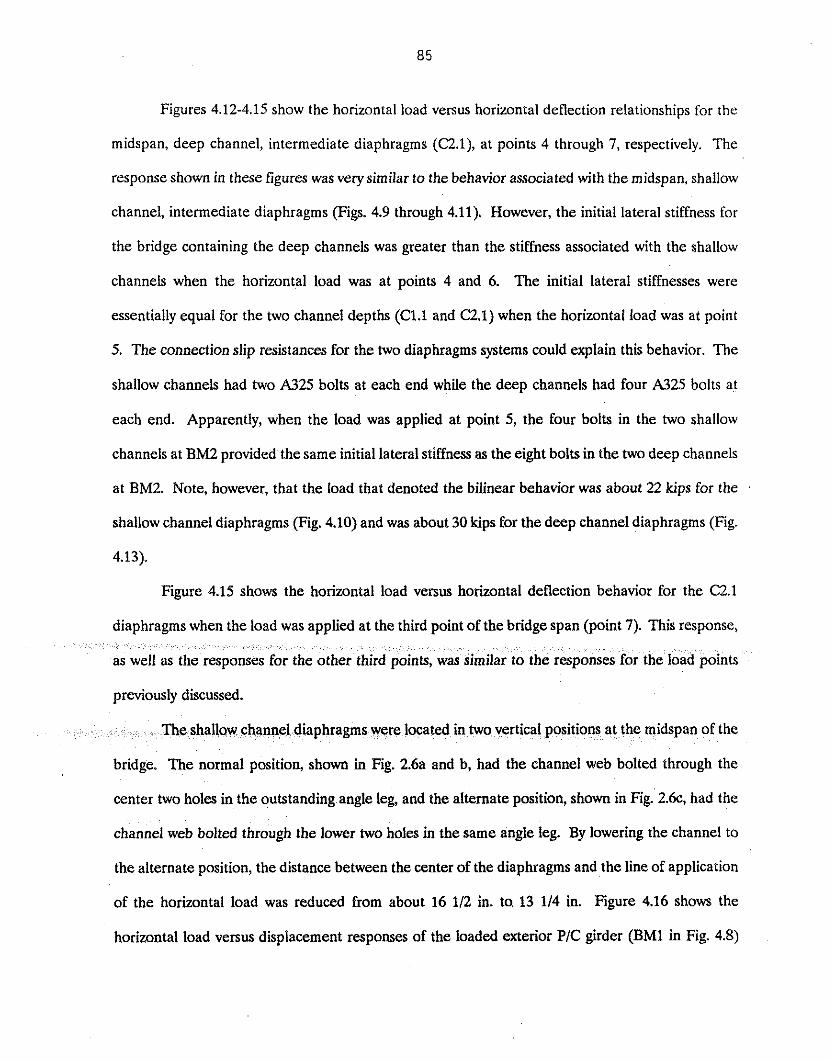
Figures 4.12-4.15 show the horizontal load versus horizontal deflection relationships for the
midspan, deep channel, intermediate diaphragms (C2.1), at points 4 through 7, respectively. The
response shown in these figures was verysimilar to the behavior associated with the midspan, shallow
channel, intermediate diaphragms (Figs. 4.9 through 4.11). However, the initial lateral stiffness for
the bridge containing the deep channels was greater than the stiffness associated with the shallow
channels when the horizontal load was at points 4 and 6. The initial lateral stiffnesses were
essentially equal for the two channel depths (C1.l and '22.1) when the horizontal load was at point
5. The connection slip resistances for the two diaphragms systems could explain this behavior. The
shallow channels had two A325 bolts at each end while the deep channels had four A325 bolts at
each end. Apparently, when the load was applied at point 5, the four bolts in the two shallow
channels at BM2 provided the same initial lateral stiffness as the eight bolts in the two deep channels
at BM2. Note, however, that the load that denoted the bilinear behavior was about 22 kips for the
shallow channel diaphragms (Fig. 4.10) and was about 30 kips for the deep channel diaphragms (Fig.
Figure 4.15 shows the horizontal load versus horizontal deflection behavior for the C2.1
diaphragms when the load was applied at the third point of the bridge span (point 7). This response,
previously discussed.
phragms were located in two vertical positions at the midspan of the
bridge. The normal position, shown in Fig. 2.6a and b, had the channel web bolted through the
center two holes in the outstanding angle leg, and the alternate position, shown in Fig. 2.6c, had the
channel web bolted through the lower two holes in the same angle leg. By lowering the channel to
the alternate position, the distance between the center of the diaphragms and the line of application
of the horizontal load was reduced from about 16 112 in. to 13 114 in. Figure 4.16 shows the
horizontal load versus displacement responses of the loaded exterior PIC girder (BM1 in Fig. 4.8)
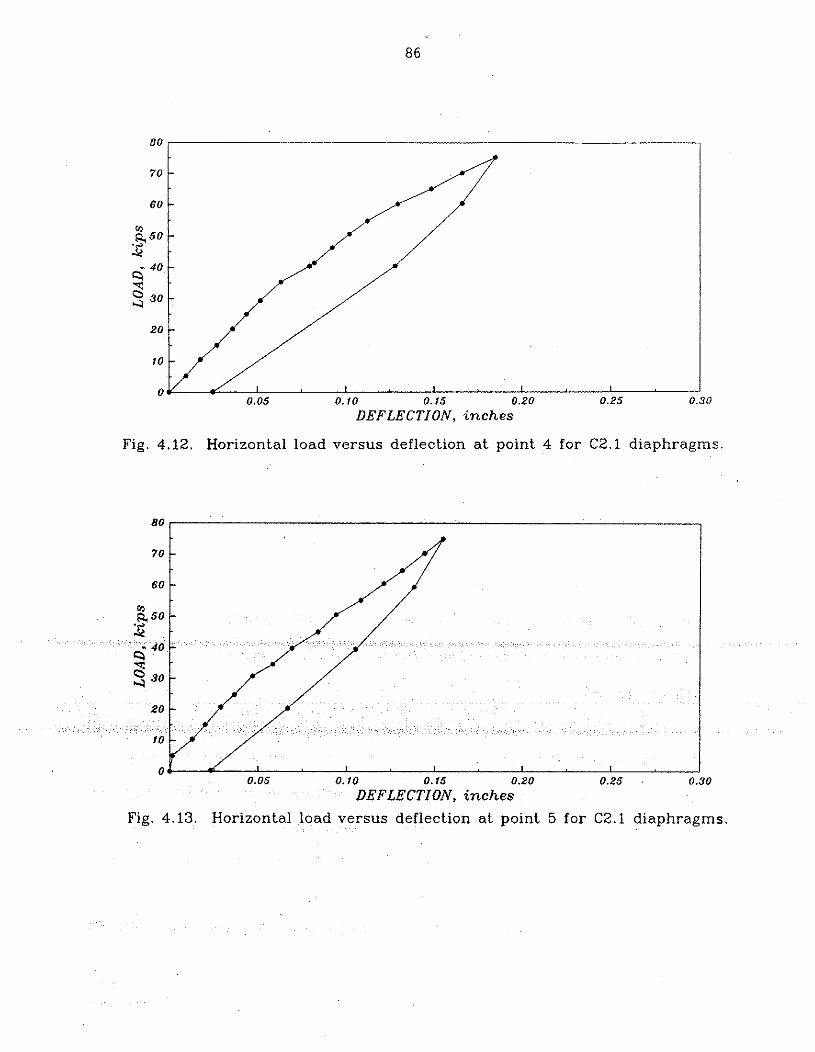
DEFLECTION, i n c h e s
Fig. 4.12. Horizontal load versus deflection a t point 4 for C2.1 diaphragms.
" - 0.05 0.10 0.15 0.20 0.25 0.30
DEFLECTION, i n c h e s
Fig. 4.13. Horizontal load versus deflection at point 5 for CZ.1 diaphragms.
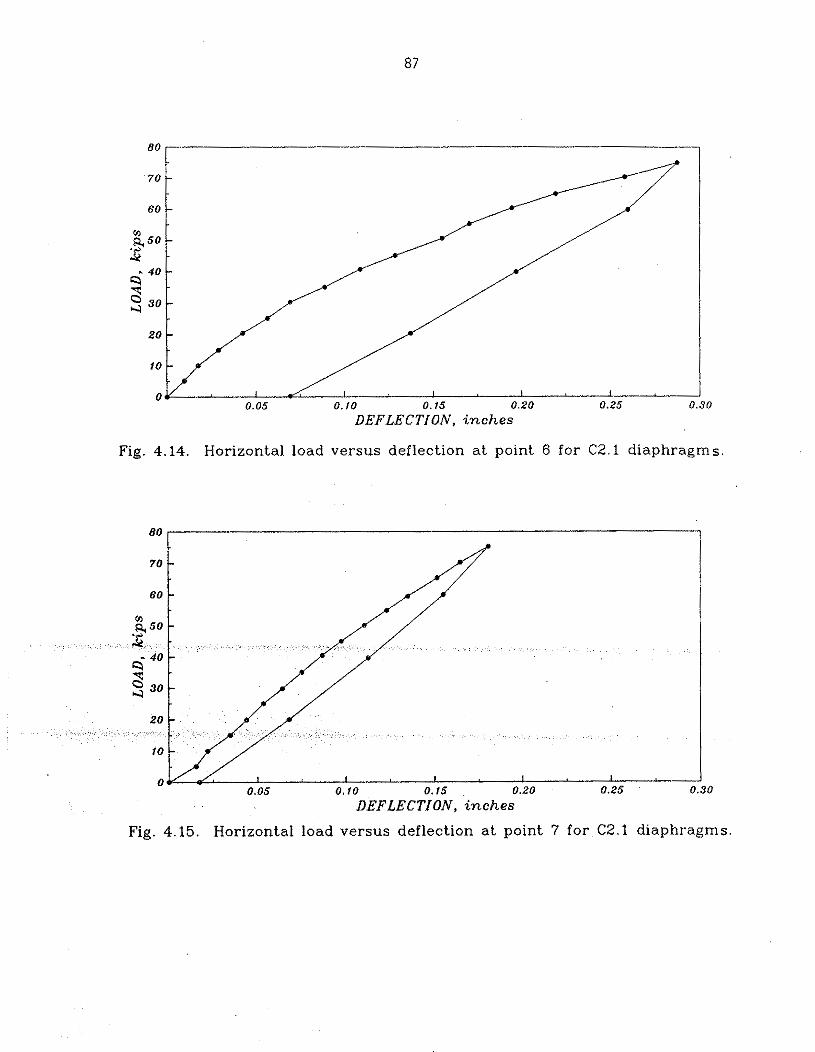
Fig. 4.14. Horizontal load versus deflection a t point 6 for C2 .1 diaphragms.
Fig. 4.15. Horizontal load versus deflection a t point 7 for C2.1 diaphragms.
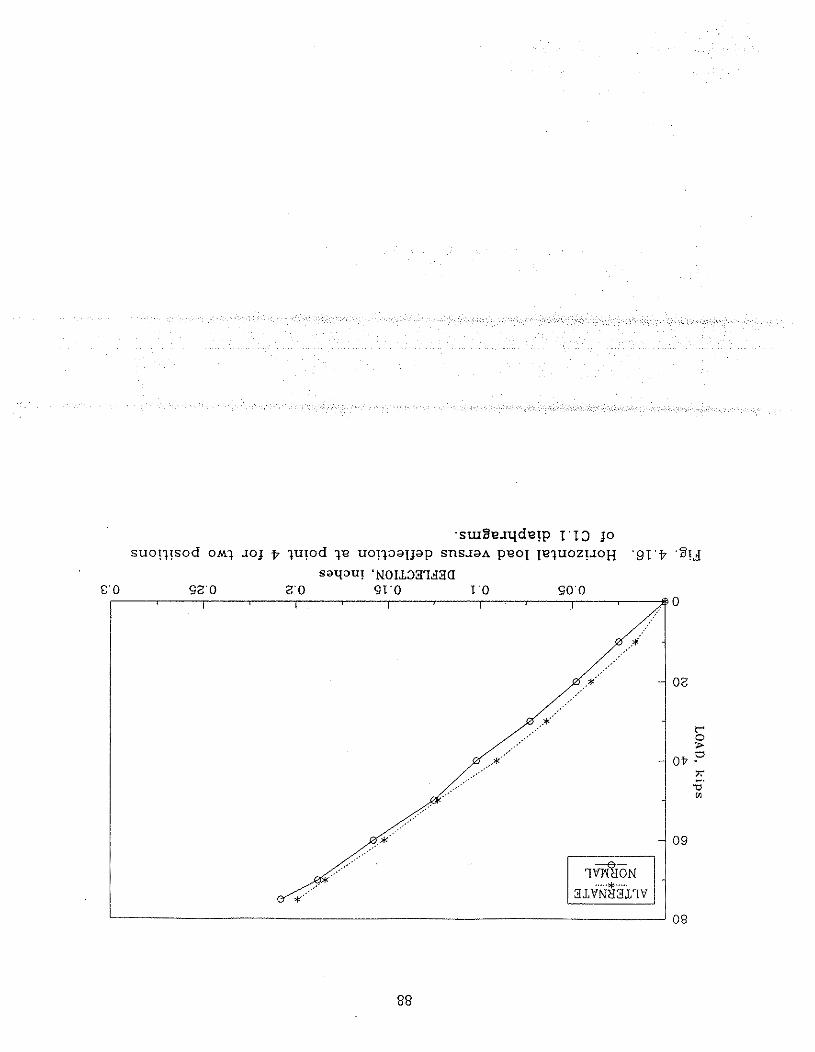
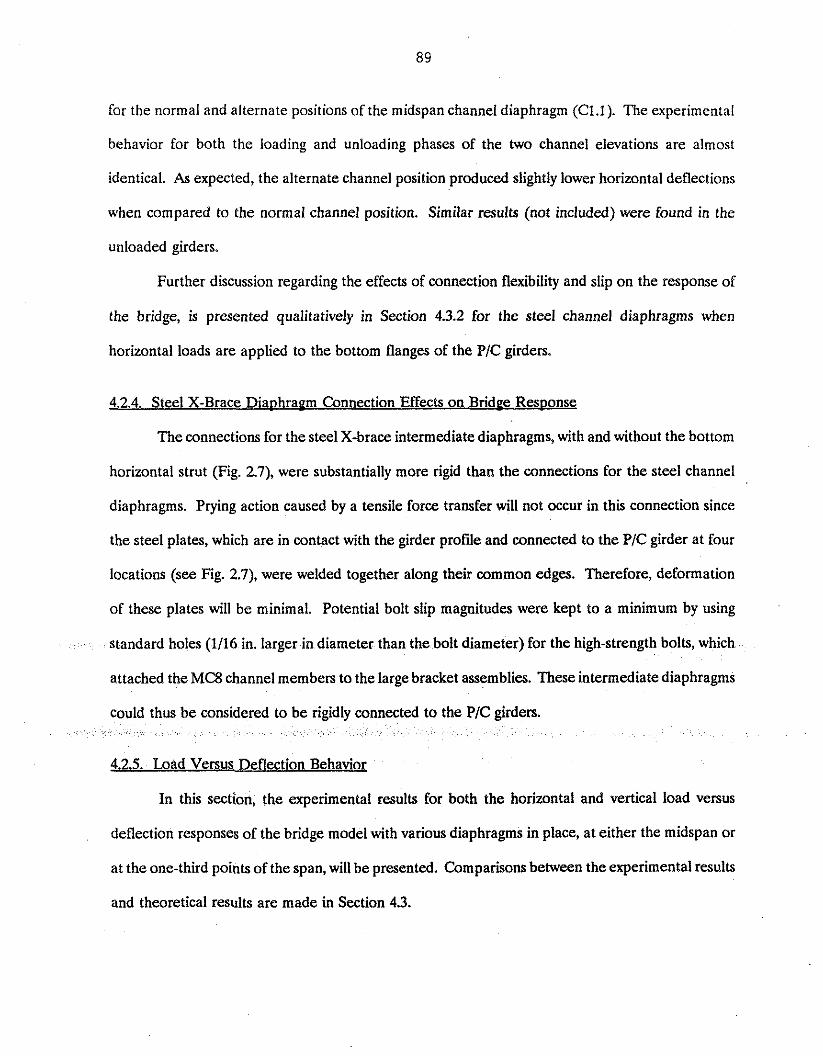
for the normal and alternate positions of the midspan channel diaphragm (C1.l). The experimental
behavior for both the loading and unloading phases of the two channel elevations are almost
identical. As expected, the alternate channel position produced slightly lower horizontal deflections
when compared to the normal channel position. Similar results (not included) were found in the
unloaded girders.
Further discussion regarding the effects of connection flexibility and slip on the response of
the bridge, is presented qualitatively in Section 4.3.2 for the steel channel diaphragms when
horizontal loads are applied to the bottom flanges of the PIC girders.
4.2.4. Steel X-Brace Dia~hraem Connection Effects on Bridee Response
The connections for the steel X-brace intermediate diaphragms, with and without the bottom
horizontal strut (Fig. 2.7), were substantially more rigid than the connections for the steel channel
diaphragms. Prying action caused by a tensile force transfer will not occur in this connection since
the steel plates, which are in contact with the girder profile and connected to the PIC girder at four
locations (see Fig. 2.7), were welded together along their common edges. Therefore, deformation
of these plates will be minimal. Potential bolt slip magnitudes were kept to a minimum by using
standard holes (1116 in. larger in diameter than the bolt diameter) for the high-strength bolts, which
attached the MC8 channel members to the large bracket assemblies. These intermediate diaphragms
4.2.5. Load Versus Deflection Behavior
In this section, the experimental results for both the horizontal and vertical load versus
deflection responses of the bridge model with various diaphragms in place, at either the midspan or
at the one-third points of the span, will be presented. Comparisons between the experimental results
and theoretical results are made in Section 4.3.
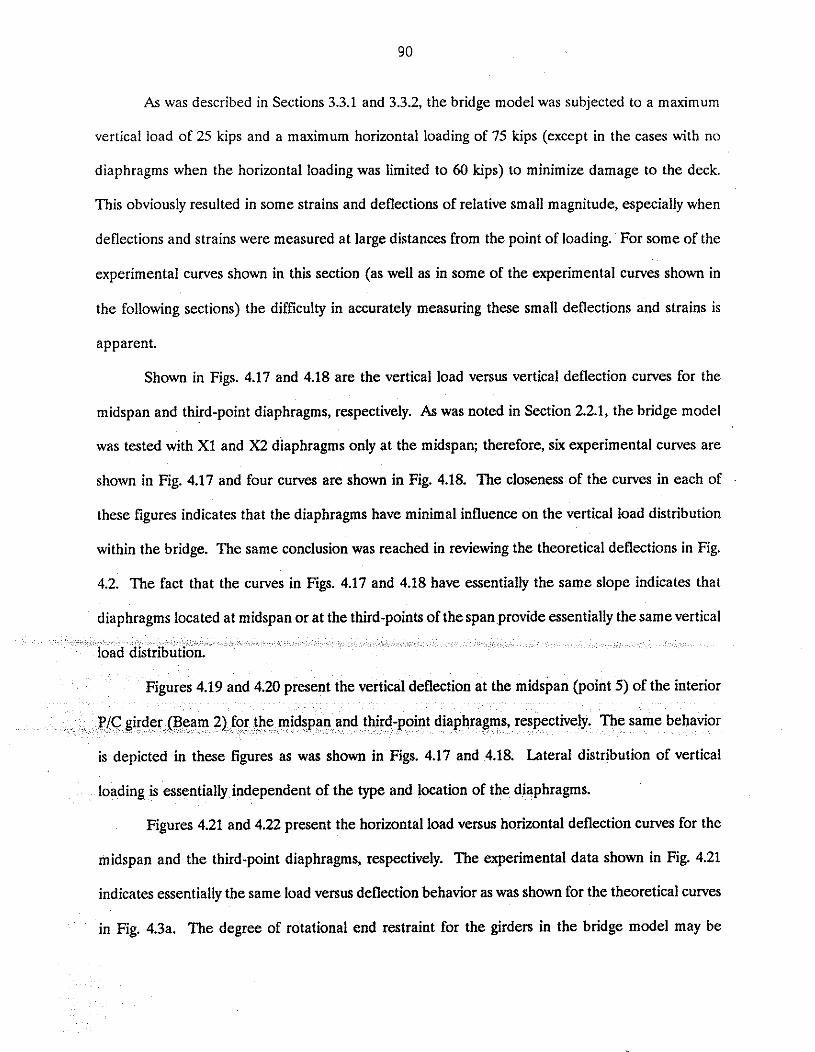
As was described in Sections 3.3.1 and 3.3.2, the bridge model was subjected to a maximum
vertical load of 25 kips and a maximum horizontal loading of 75 kips (except in the cases with no
diaphragms when the horizontal loading was limited to 60 kips) to minimize damage to the deck.
This obviously resulted in some strains and deflections of relative small magnitude, especially when
deflections and strains were measured at large distances From the point of loading. For some of the
experimental curves shown in this section (as well as in some of the experimental curves shown in
the following sections) the difficulty in accurately measuring these small deflections and strains is
apparent.
Shown in Figs. 4.17 and 4.18 are the vertical load versus vertical deflection curves for the
midspan and third-point diaphragms, respectively. As was noted in Section 2.2.1, the bridge model
was tested with X1 and X2 diaphragms only at the midspan; therefore, six experimental curves are
shown in Fig. 4.17 and four curves are shown in Fig. 4.18. The closeness of the curves in each of
these figures indicates that the diaphragms have minimal influence on the vertical load distribution
within the bridge. The same conclusion was reached in renewing the theoretical deflections in Fig.
4.2. The fact that the curves in Figs. 4.17 and 4.18 have essentially the same slope indicates that
diaphragms located at midspan or at the third-points of the span provide essentially the same vertical
Figures 4.19 and 4.20 present the vertical deflection at the midspan (point 5) of the interior
behavior
is depicted in these figures as was shown in Figs. 4.17 and 4.18. Lateral distribution of vertical
loading is essentially independent of the type and location of the diaphragms.
Figures 4.21 and 4.22 present the horizontal load versus horizontal deflection curves for the
midspan and the third-point diaphragms, respectively. The experimental data shown in Fig. 4.21
indicates essentially the same load versus deflection behavior as was shown for the theoretical curves
in Fig. 4.3a. The degree of rotational end restraint for the girders in the bridge model may be
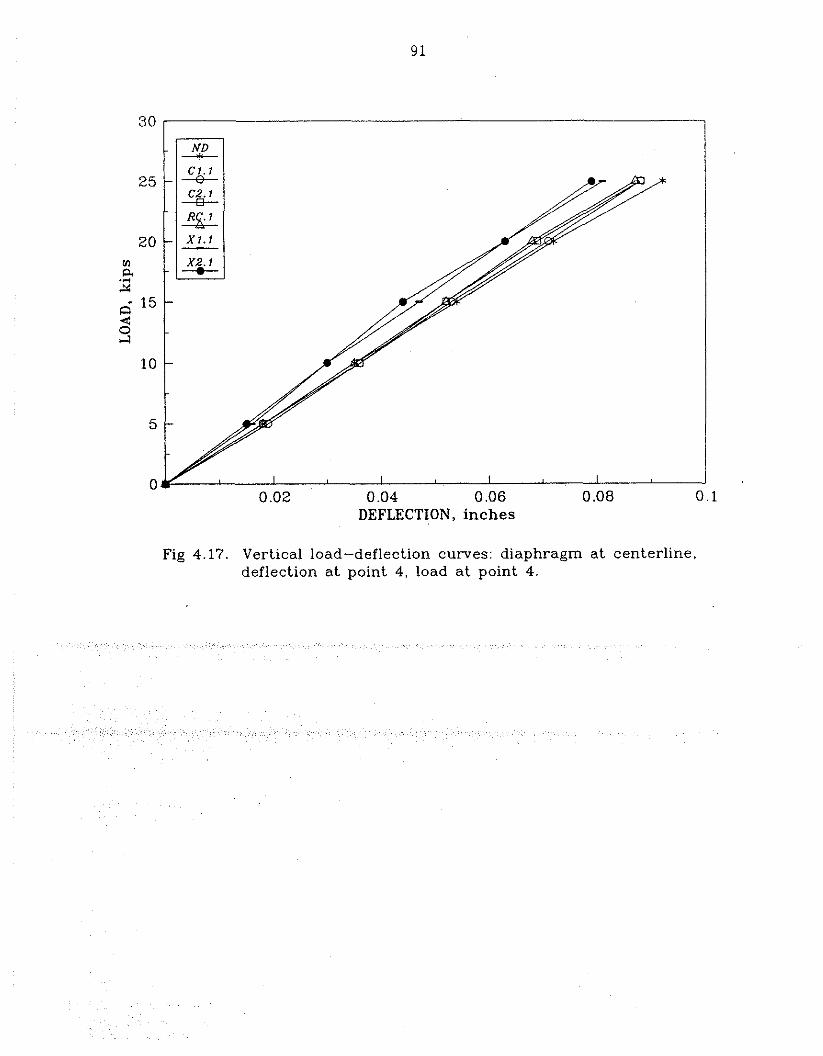
DEFLECTION, inches
Fig 4.17. Vertical load-deflection curves: diaphragm a t centerline, deflection a t point 4, load a t point 4.
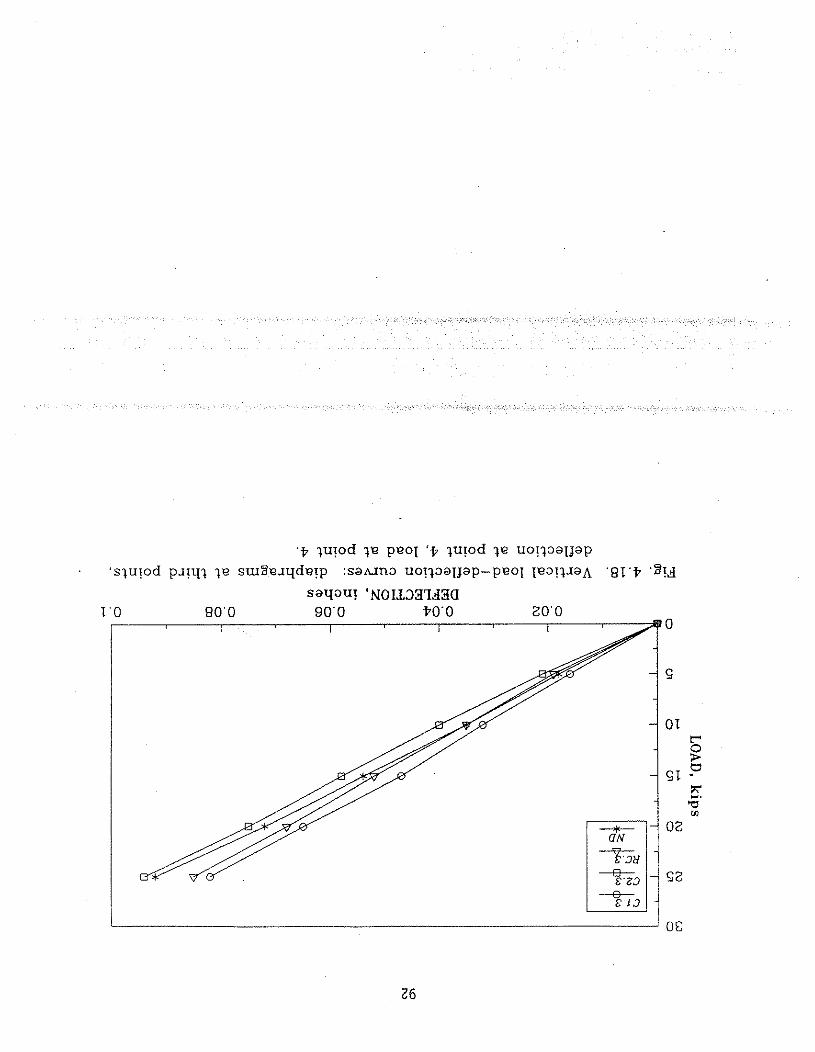
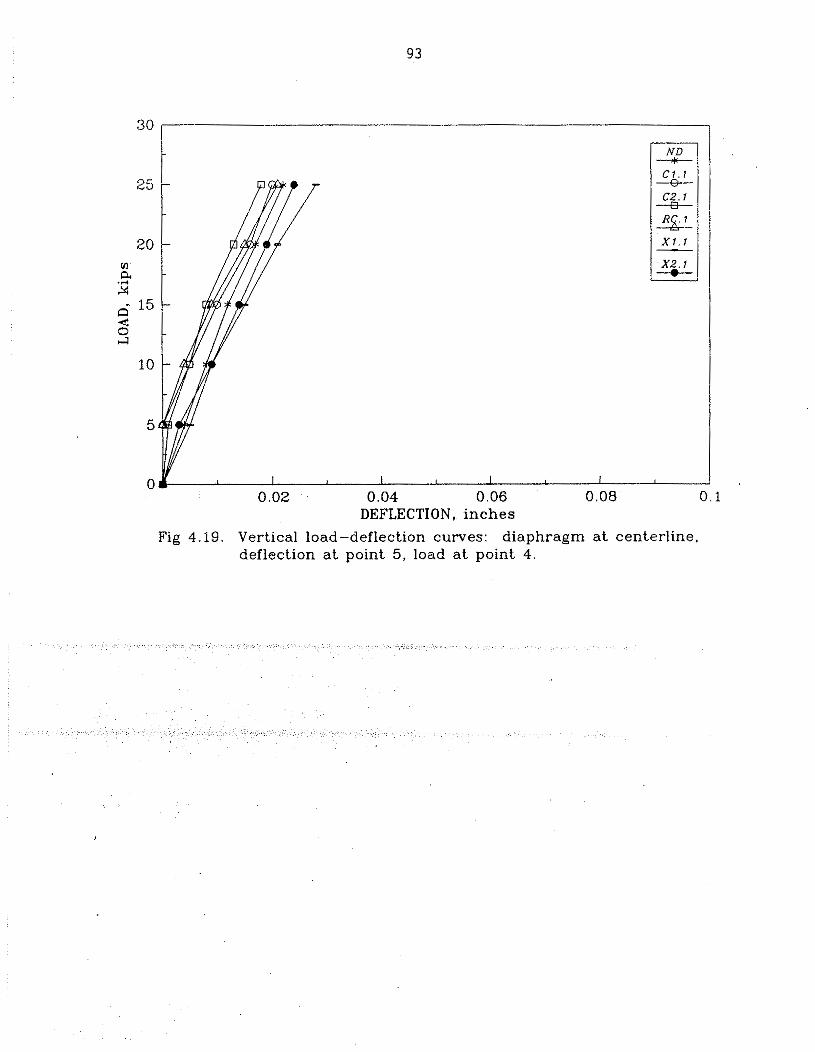
DEFLECTION, inches
Fig 4.19. Vertical load-deflection curves: diaphragm a t centerline. deflection a t point 5, load a t point 4.
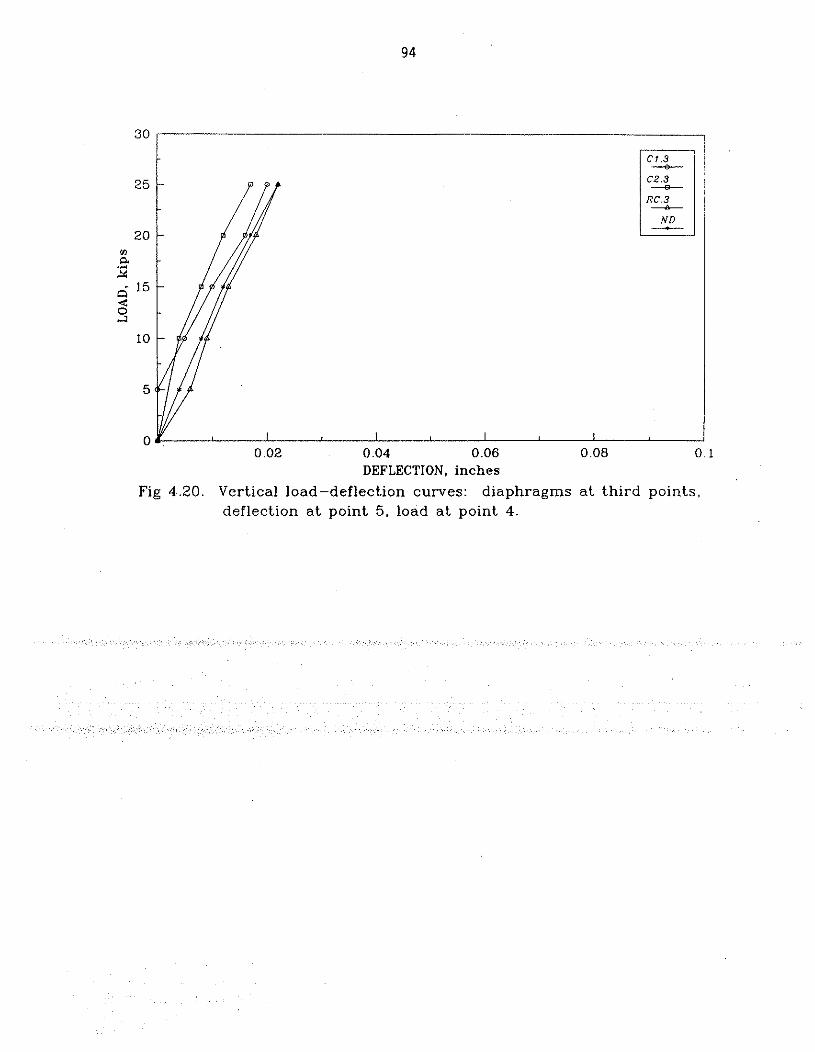
0.02 0.04 0.06 0.08 0.1 DEFLECTION, inches
Fig 4.20. Vertical load-deflection curves: diaphragms a t third points, deflection a t point 5, load a t point 4.
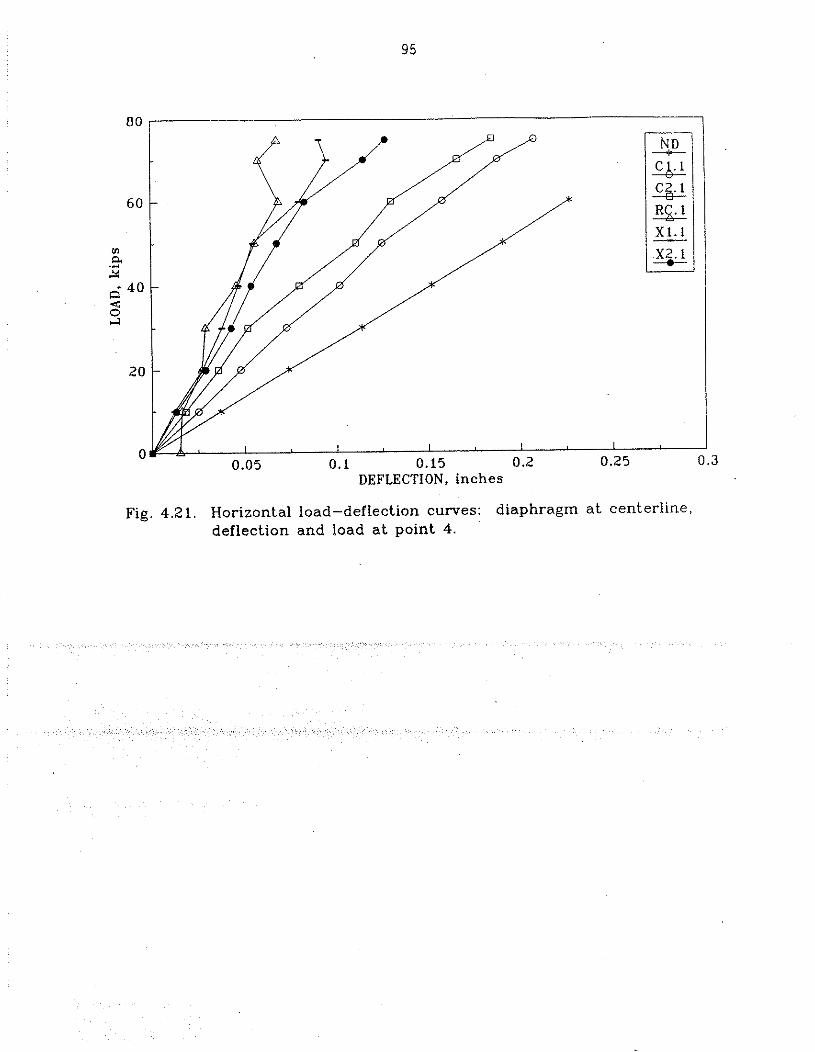
Fig. 4.21. Horizontal load-deflection curves: diaphragm a t centerline, deflection and load a t point 4.
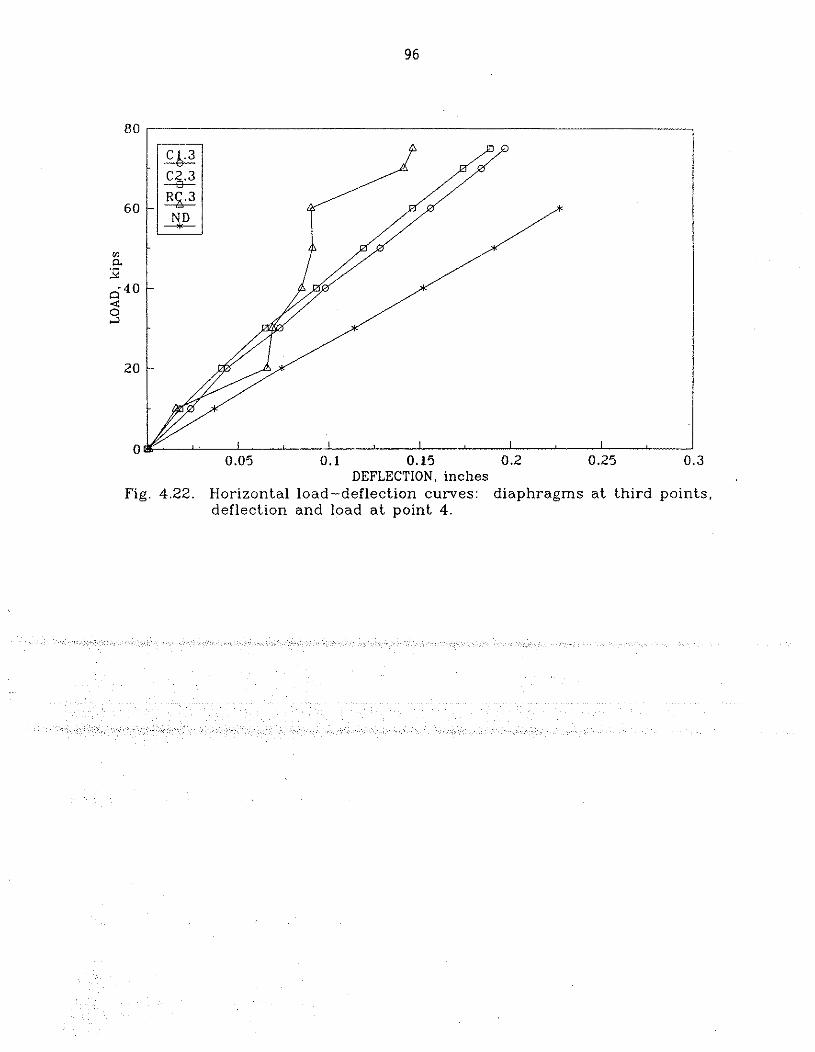
DEFLECTION, inches Fig. 4.22. Horizontal load-deflection curves: diaphragms a t third points,
deflection and load a t point 4.
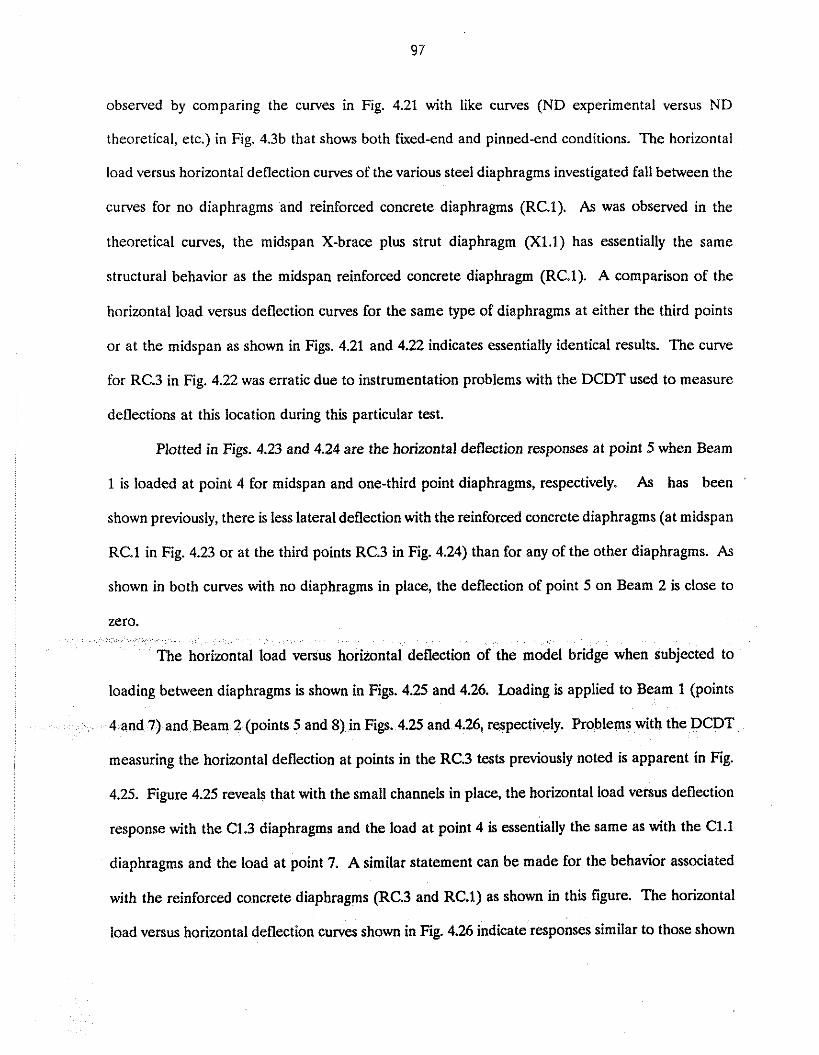
observed by comparing the curves in Fig. 4.21 with like curves (ND experimental versus ND
theoretical, etc.) in Fig. 4.3b that shows both Cured-end and pinned-end conditions. The horizontal
load versus horizontal deflection curves of the various steel diaphragms investigated fall between the
curves for no diaphragms and reinforced concrete diaphragms (RC.1). As was observed in the
theoretical curves, the midspan X-brace plus strut diaphragm (X1.l) has essentially the same
structural behavior as the midspan reinforced concrete diaphragm (RC.1). A comparison of the
horizontal load versus deflection curves for the same type of diaphragms at either the third points
or at the midspan as shown in Figs. 4.21 and 4.22 indicates essentially identical results. The curve
For RC.3 in Fig. 4.22 was erratic due to instrumentation problems with the DCDT used to measure
deflections at this location during this particular test.
Plotted in Figs. 4.23 and 4.24 are the horizontal deflection responses at point 5 when Beam
1 is loaded at point 4 for midspan and one-third point diaphragms, respectively. As has been
shown previously, there is less lateral deflection with the reinforced concrete diaphragms (at midspan
RC.l in Fig. 4.23 or at the third points RC.3 in Fig. 4.24) than for any of the other diaphragms. As
shown in both curves with no diaphragms in place, the deflection of point 5 on Beam 2 is close to
zero.
ntal deflection of the model bridge when subjected to
loading between diaphragms is shown in Figs. 4.25 and 4.26. Loading is applied to Beam 1 (points
4 and 7) and Beam 2 (points 5 and 8) in Figs. 4.25 and 4.26, respectively. Problems with the DCDT
measuring the horizontal deflection at points in the RC.3 tests previously noted is apparent in Fig.
4.25. Figure 4.25 reveals that with the small channels in place, the horizontal load versus deflection
response with the C1.3 diaphragms and the load at point 4 is essentially the same as with the Cl.1
diaphragms and the load at point 7. A similar statement can he made for the behavior associated
with the reinforced concrete diaphragms (RC.3 and RC.l) as shown in this figure. The horizontal
load versus horizontal deflection curves shown in Fig. 4.26 indicate responses similar to those shown
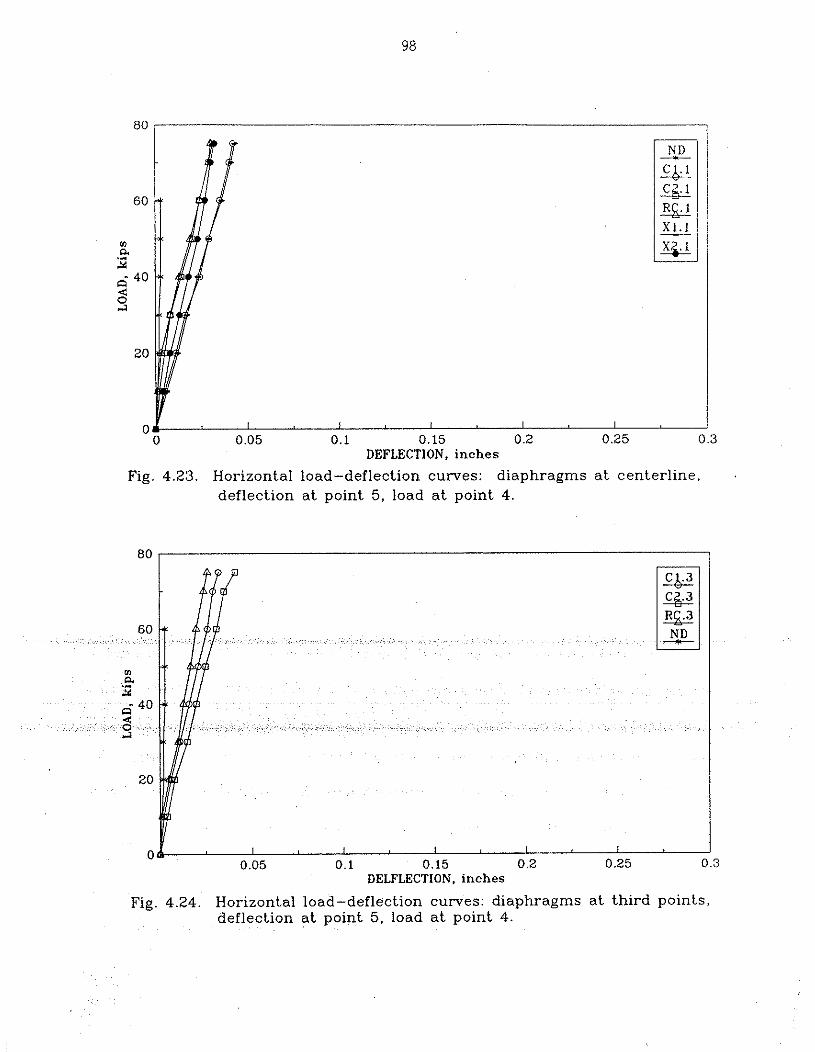
Fig. 4.23. Horizontal load-deflection curves: diaphragms a t centerline. deflection a t point 5, load a t point 4.
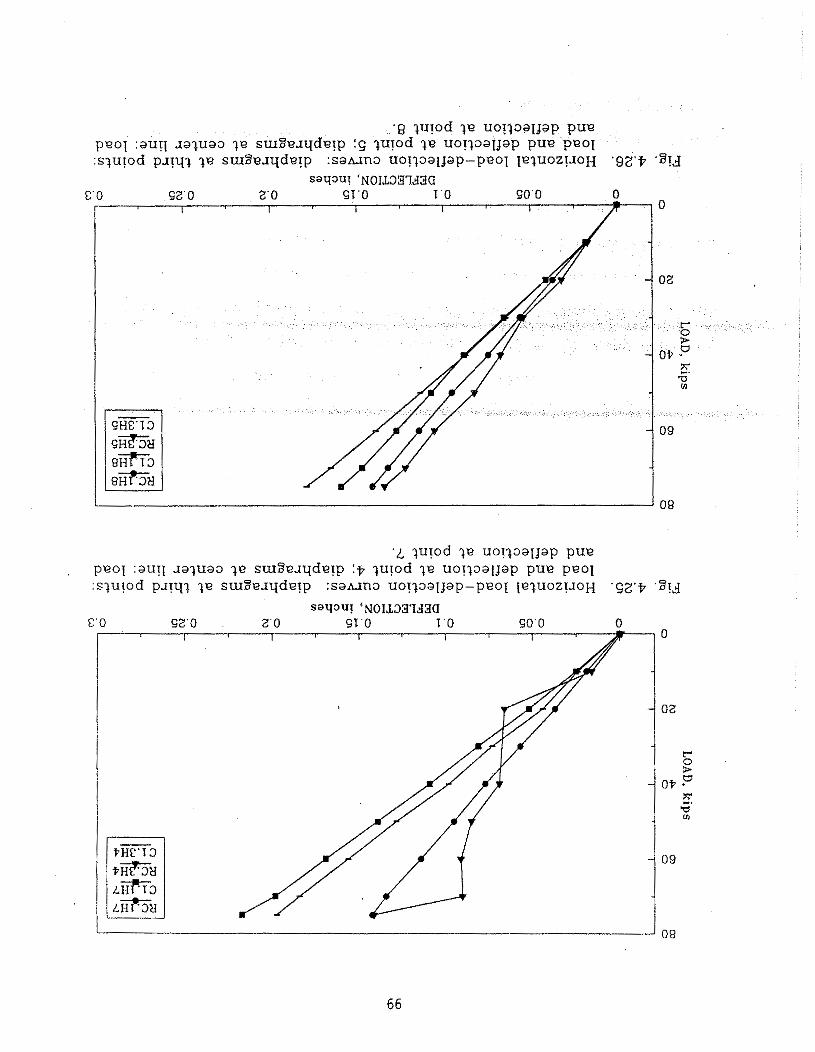
'8 lu!od ?e uo!laaIjap pue peol :auq Jaluaa le su18e~qd.elp :(; lulod '4e uo!laal~ap put? p ~ 0 1 :slu!od p~!ql le sm;Je~qde!p : s a u n a uo!laal~ap-peol ~ e . ( u o z ! ~ o ~ , g ~ . p ' 8 1 ~
sawu! ' N O I L ~ E T A ~ ~ E 0 EZ' 0 Z'O SI'O 1 .O 80'0
I I I I I 0- 0
.L lu!od ?e uo!?aa~jap PUP
paor :au!I ~ a l u a 3 -+e sur8e~qde!p :p ?u!od le uo!'$aafJap pue peol : s ?u~od p31ql 2" sw;Je~qde!p : s a u n a uo!?aa1jap-peol ~ q u o z ~ ~ o ~ .sz,p ,;J!j
in Fig. 4.25. A comparison of the data in these two figures reveals there is less horizontal deflection
with the reinforced concrete diaphragm and when the interior beam (Beam 2) is loaded. These
responses are representative of those that would occur when an overheight vehicle strikes an interior
or exterior PIC girder in a given bridge. The horizontal load response of the bridge to loading at
points 7 and 8with the diaphragms at midspan has been shown to be essentially the same for loading
at points 4 and 5 with the diaphragms at the third points. However, as previously shown, by loading
the beams at the location of the midspan diaphragms (points 4, 5 and 6) the effectiveness of the
various diaphragms is more evident. Thus, the majority of the experimental results are presented
for midspan diaphragms and midspan loading of the three girders. However, the reader should
remember the obvious--overheight vehicles can strike any of the PIC girders of a given bridge at
essentially any point along their length.
4.2.6. Load Distribution Study
The bridge model is a three-dimensional complicated structure which is highly indeterminate.
One means of obtaining a better understanding of the behavior of the bridge is to investigate its
response to the action of a concentrated load moving transverse and parallel to the span. In this
section, influence lines are given for the midspan deflections as a concentrated load is applied at the
midspan of the three girders. Only midspan diaphragms are reviewed.
3, respectively. The three measured deflections have been connected by straight lines for comparison
purposes only. The true deflection curves would obviously be higher-order curves. By normalizing
these curves, the influence lines for the midspan deflections when vertical loading,& applied at the
midspan are obtained. As previous theoretical and experimental data obtained by other researchers
have verified, the distribution of vertical loading in a PIC bridge is essentially independent of the type
of diaphragms used. By comparing Figs. 4.27 and 4.29, the symmetrical behavior of the bridge is
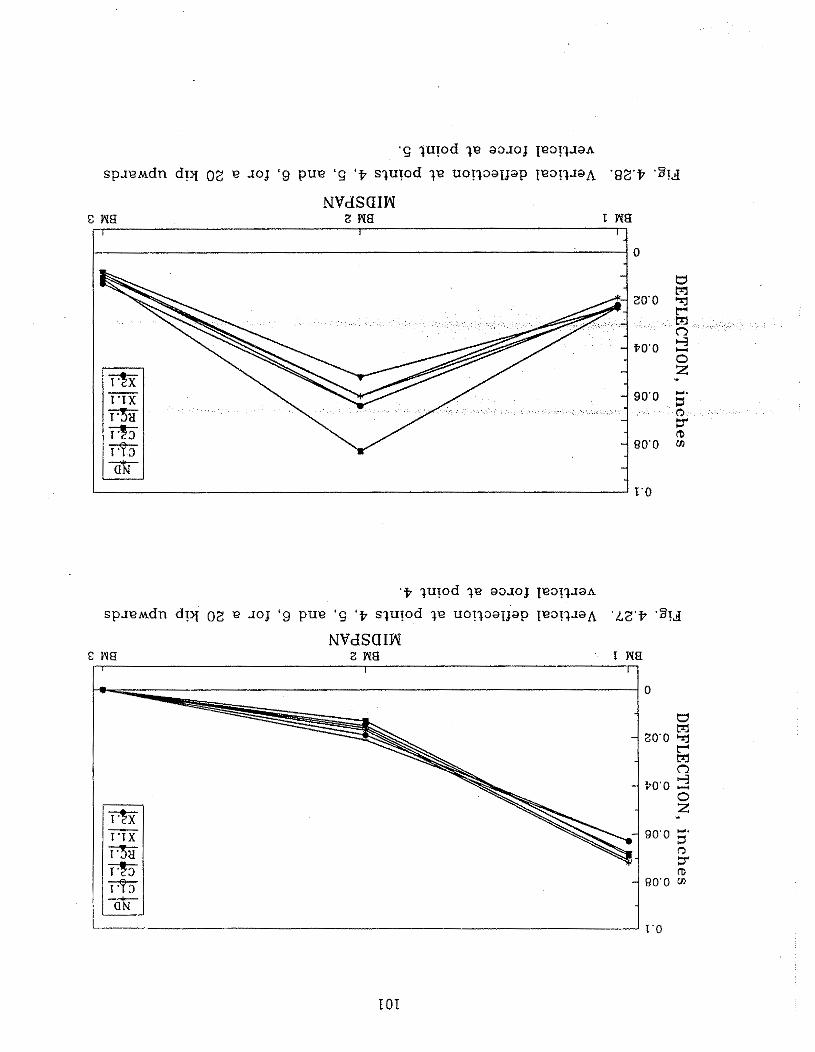
.s lu!od l e aalo$ 1ea!?~a~
s p ~ e ~ d n d ~ y 02 e JOJ 'g pue '(; 'p s?u!od p uo!?aa~$ap 1 e a ! l ~ a ~ '8Z.v 'Z!d
NVdSCIIN C YYE z YYE I YYE r? I I
.p lulod ?e aaloj Iea!?JaA
s p ~ ~ ~ d n d!y 02 e JOJ ' 9 pue ' s 'p s-+u!od ?e uo!laaI$ap ~ea! l~a i \ . k ~ . v .a!j NVdSCI IN
C YYE Z YYE I YY8 r i I I
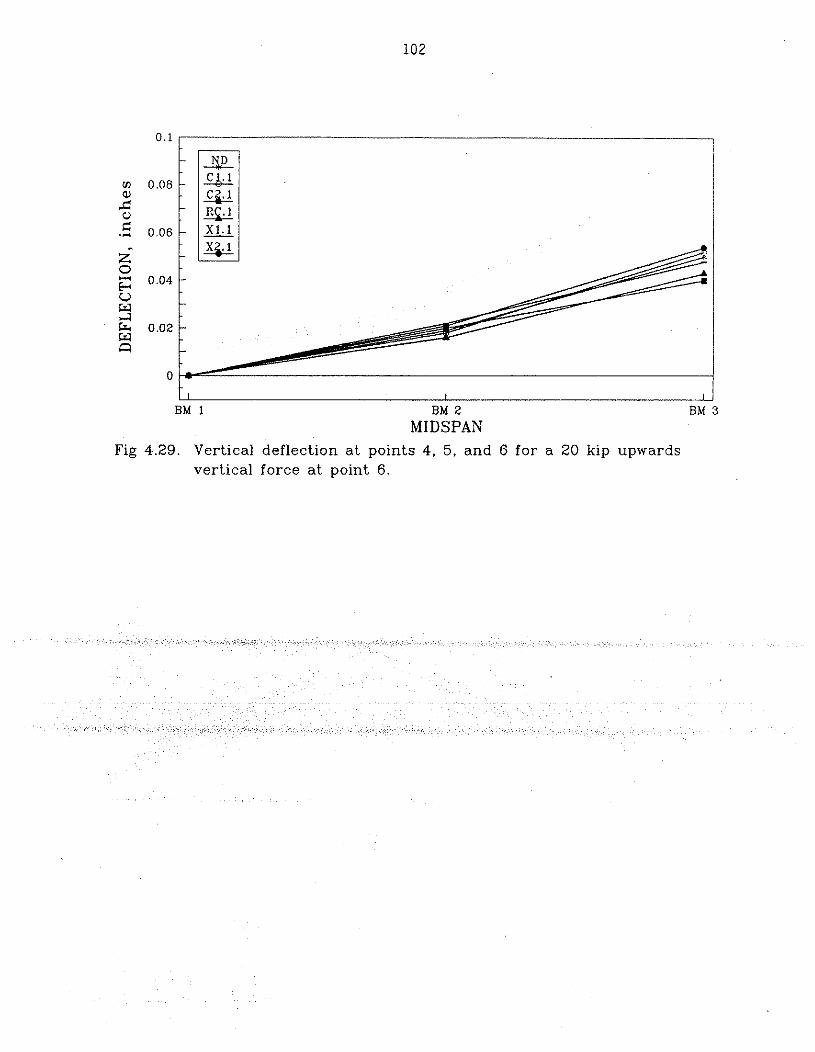
BM 1 BM 2 BM 3 MIDSPAN
Fig 4.29. Vertical deflection at points 4, 5, and 6 for a 20 kip upwards vertical force at point 6.
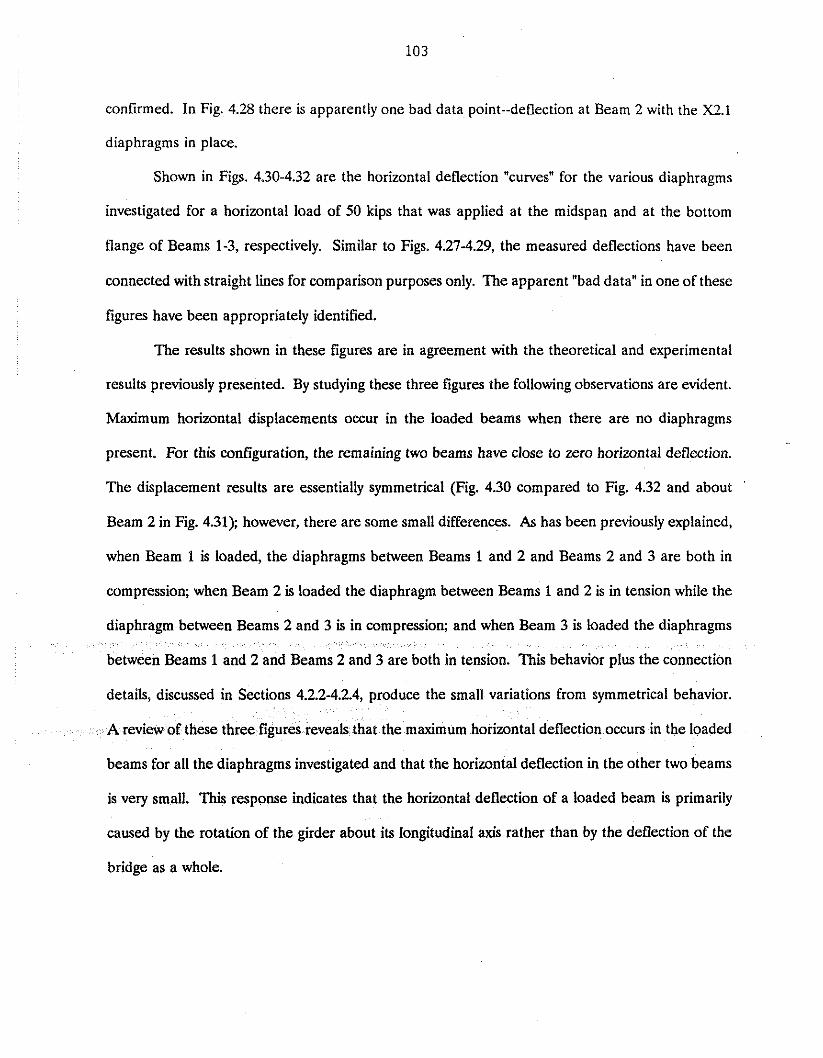
confirmed. In Fig. 4.28 there is apparently one bad data point--deflection at Beam 2 with the X2.1
diaphragms in place.
Shown in Figs. 4.30-4.32 are the horizontal deflection "curves" for the various diaphragms
investigated for a horizontal load of 50 kips that was applied at the midspan and at the bottom
flange of Beams 1-3, respectively. Similar to Figs. 4.27-4.29, the measured deflections have been
connected with straight lines for comparison purposes only. The apparent "bad data" in one of these
figures have been appropriately identified.
The results shown in these figures are in agreement with the theoretical and experimental
results previously presented. By studying these three figures the following observations are evident.
Maximum horizontal displacements occur in the loaded beams when there are no diaphragms
present. For this configuration, the remaining two beams have close to zero horizontal deflection.
The displacement results are essentially symmetrical (Fig. 4.30 compared to Fig. 4.32 and about '
Beam 2 in Fig. 4.31); however, there are some small differences. As has been previously explained,
when Beam 1 is loaded, the diaphragms between Beams 1 and 2 and Beams 2 and 3 are both in
compression; when Beam 2 is loaded the diaphragm between Beams 1 and 2 is in tension while the
diaphragm between Beams 2 and 3 is in compression; and when Beam 3 is loaded the diaphragms
us the connection
details, discussed in Sections 4.2.2-4.2.4, produce the small variations from symmetrical behavior.
eview of these thre eals that the maximum horizontal deflection occurs in the loaded
beams for all the diaphragms investigated and that the horizontal deflection in the other two beams
is very small. This response indicates that the horizontal deflection of a loaded beam is primarily
caused by the rotation of the girder about its longitudinal axis rather than by the deflection of the
bridge as a whole.
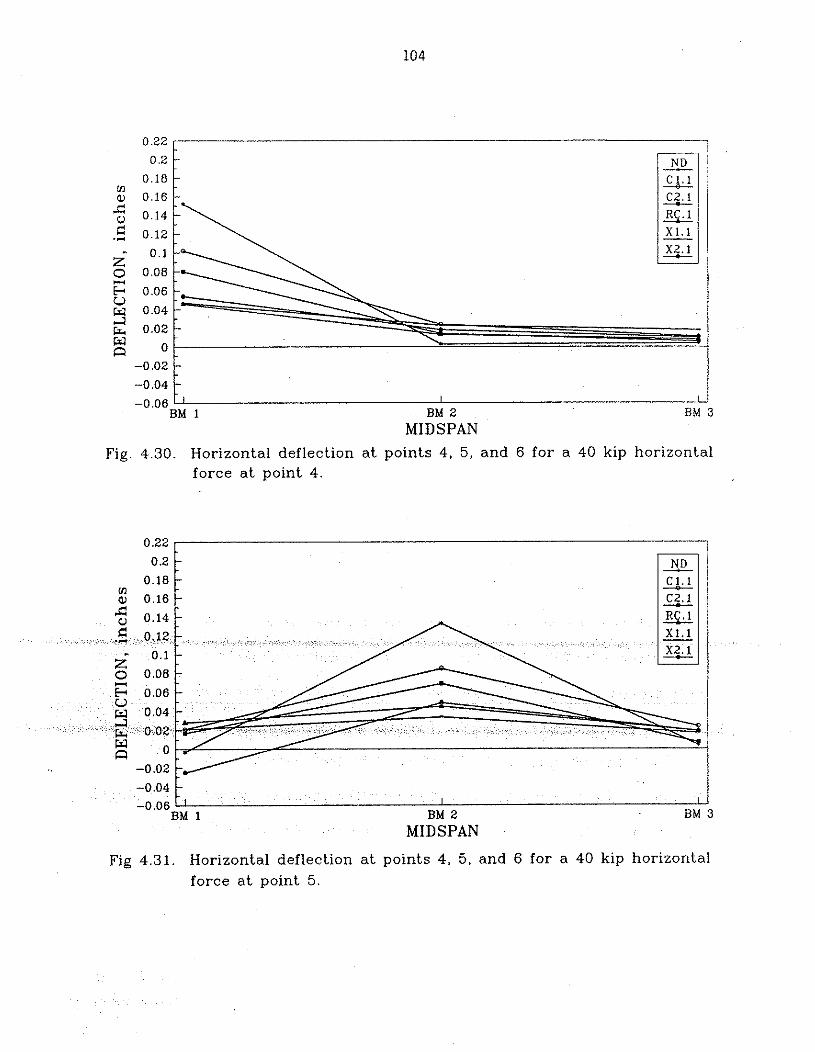
-0.06 I I I I
BM 1 BM 2 BM 3 MIDSPAN
Fig. 4.30. Horizontal deflection a t points 4. 5, and 6 for a 40 kip horizontal force a t point 4.
-0 04 1, I 1 -0 06
BM 1 BM 2 BM 3 MIDSPAN
Fig 4.31. Horizontal deflection a t points 4, 5, and 6 for a 40 kip horizontal force a t point 5.
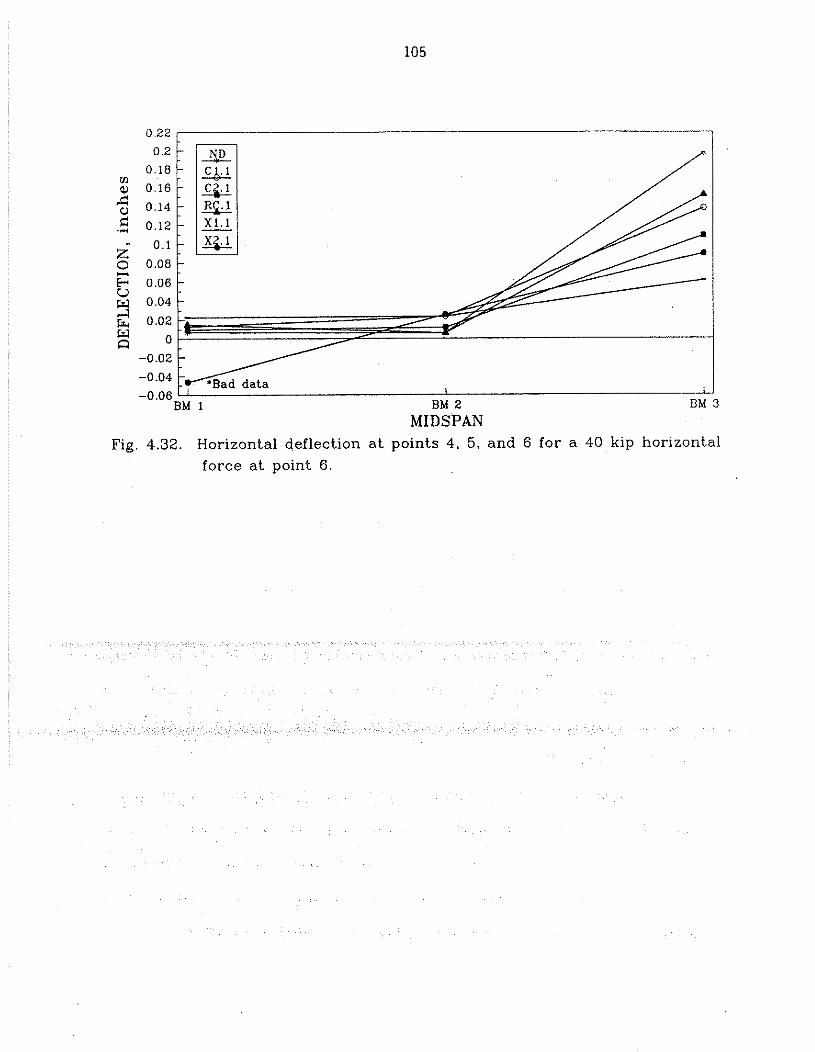
Fig. 4.32. Horizontal deflection at points 4, 5, and 6 for a 40 kip horizontal force a t point 6.
4.2.7. Beam and Deck Strains
As previously noted in Section 3.1, strains were measured in the girders and deck. Figures
3.1 and 3.2 show the locations of the gages on the girders and deck, respectively. A summary of the
maximum strains (girder, deck and diaphragms) are presented in Tables 4.2 and 4.3. The strains
listed in Table 4.2 result from 75 kips of horizontal load, except in the case when no diaphragms
were present and when the horizontal load was limited to 60 kips applied at the various load points
(see Fig. 3.5). The strains presented in Table 4.3 occurred when a 2.5-kip upwards vertical load was
applied at the various load points.
The left column in each of these tables identifies the type of diaphragm installed and the
direction and location of loading. For each diaphragm loading combination, three lines of girder and
deck strains are given. In the order listed, these three lines of strains correspond to the measured
strains at the '114-span, midspan, and 314-span locations (Sections B-D in Figs. 3.1 and 3.2).
Maximum strains in a particular girder occur when that girder is loaded. Thus, the strains presented
are for Beams 1-3 when points 4-6, respectively, were loaded. The girder strains presented were at
the sides (1 114 in. up from the bottom of the girder) of the bottom flange--LL and LR
corresponding to the lower left and lower right sides, respectively. Since the top flange girder strains
o diaphragms positioned at the
g lines 1 and 4 (shown in Fig. 3.2) at
Sections B-D (see Fig. 3.2).
The magnitudes of the measured strains presented are relatively small due to the size of the
bridge model (full-scale) and the magnitude of the forces applied. As previously explained, the
magnitude of force applied to the bridge was controlled to minimize damage to the bridge deck.
Although the structure was relatively stiff, a review of the midspan girder strains with the various
diaphragms in place verifies that the type of diaphragm has an effect on the strains.
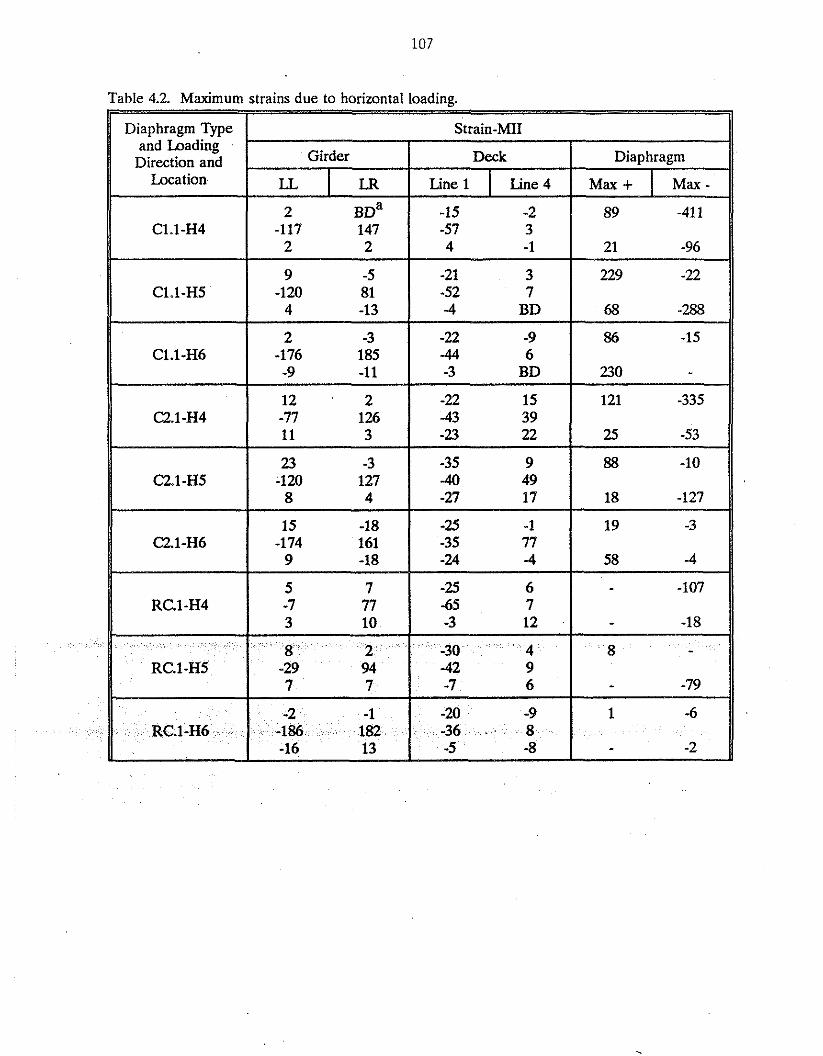
Table 4.2. Maximum strains due to horizontal loading.
Diaphragm Type and Loading
Direction and Location
Strain-MI1
Girder Deck
Line 1 1 Line4 LL
Diaphragm
Max + I Max - LR
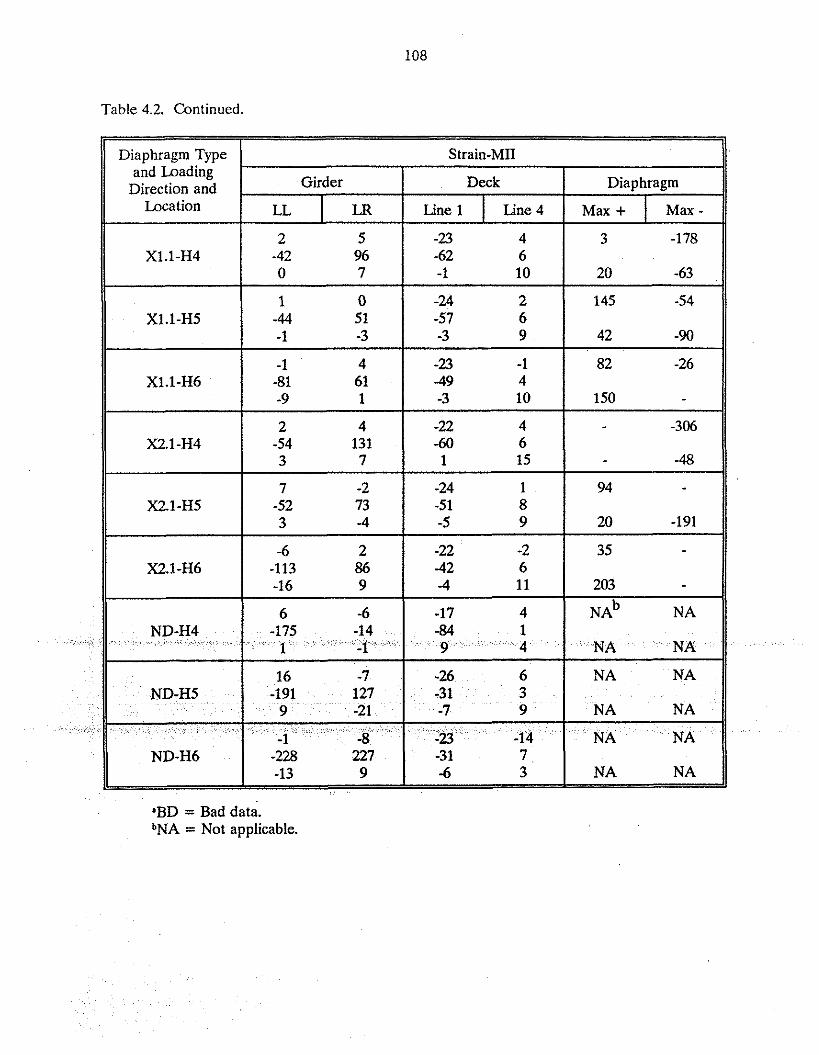
Table 4.2. Continued.
'BD = Bad data. bNA = Not applicable.
~~
Diaphragm Type and Loading
Direction and Location
Xl.1-H4
Xl.1-H5
~ ~ ~
Strain-MII
Girder
LL LR
Deck
2 5 -42 96 0 7
1 0 -44 51 -1 -3
Line 1
Diaphragm
Line 4 Max + -23 4 -62 6 -1 10
-24 2 -57 6 -3 9
Max - 3 -178
20 -63
145 -54
42 -90
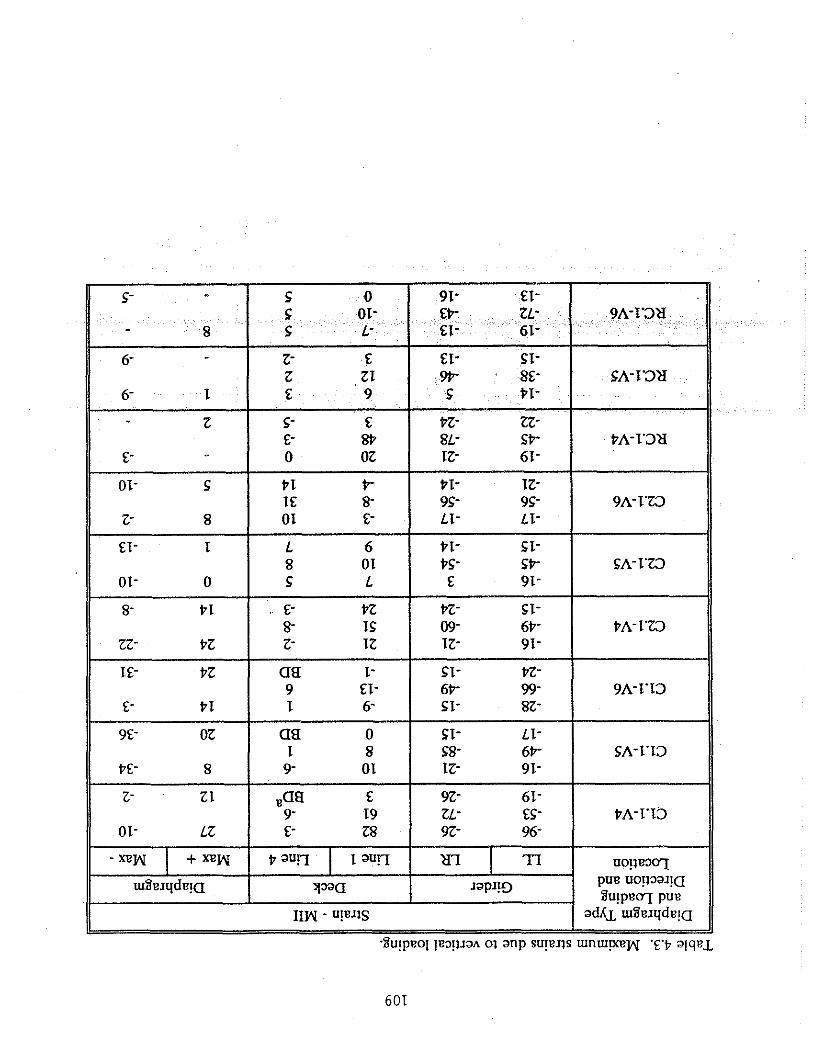
SA- I'D
PA- I'Z3
I- SI- €1- 6V 6- SI-
9 ~ - oz aa o SI- LI- I 8 S8- 6P-
PE- 8 9- 01 IZ- 91-
2- ZI eaa € 9Z- 61- 9- 19 ZL- £5-
01- LZ E- 28 9Z- 96-
UO!IE3W pue uo!mana %u!peq pue
adL~: m%elqde!a I
.%u!peo[ [E3!1JSA 02 anp su!eqs uxnwpteH yt, a[qr
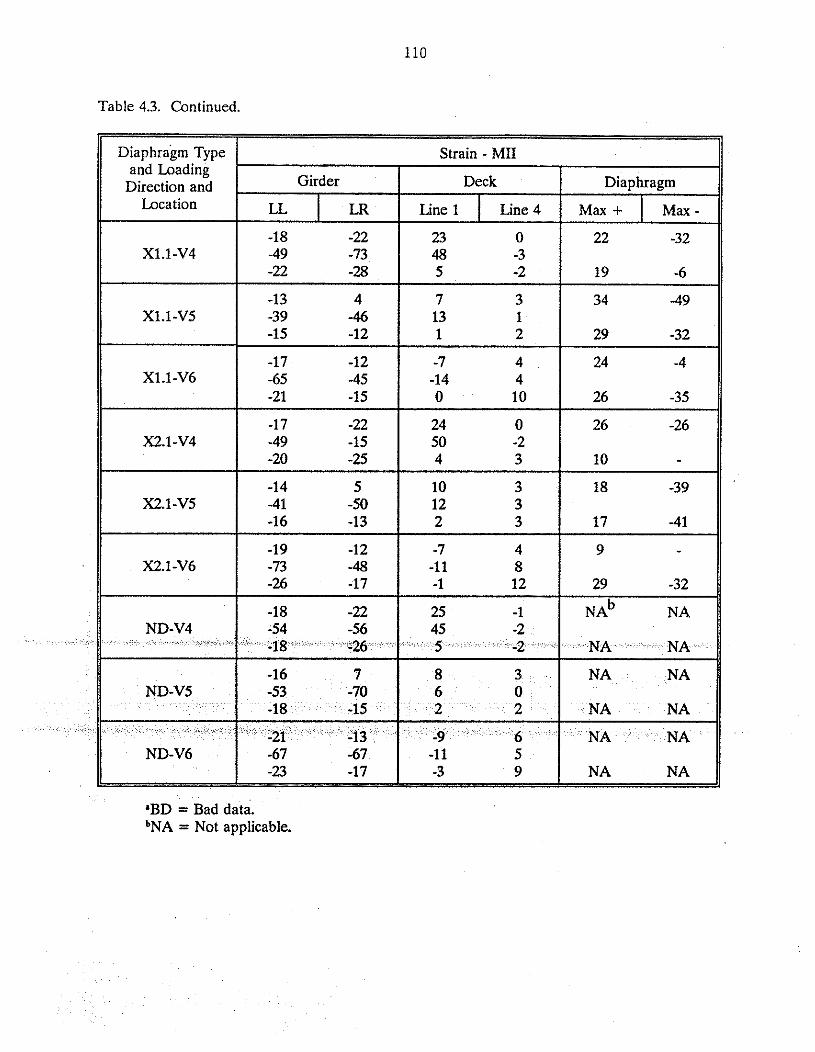
Table 4.3. Continued.
Strain - MI1 11 Diaphragm Type and Loading
Direction and Location
Xl.1-V4
'BD = Bad data. bNA = Not applicable.
-13 4 Xl.1-V5 -39 -46
-15 -12
-17 -12 Xl.1-V6 -65 -45
-21 -15
-17 -22 X2.1-V4 -49 -15
-20 -25
-14 5 X2.1 -V5 -41 -50
-1 6 -13
Girder
LL
Deck
LR Line 1
Diaphragm
-18 -22 -49 -73 -22 -28
Line 4 Max + 23 0 48 -3 5 -2
Max - 22 -32
19 -6
As has previously been documented, cracks in the deck, channel connections, and the
reinforced concrete connections to girders influenced the bridge response, especially when loading
was applied at point 6 on Beam 3. A review of the strains in Tables 4.2 and 4.3 reveals that the
measured strains were considerably larger when Beam 3 (rather than Beams 1 or 2) was loaded.
In order to minimize the secondary effects that were induced by the fabrications details in the model
bridge, only the results obtained when Beams 1 and 2 were loaded will be discussed. In the following
paragraphs, the response of the girders to horizontal and vertical loading will be presented
separately. Obviously, comparisons should not be made between the strains listed in the two tables
because of the differences in the direction and magnitude of the load applied.
When horizontal loading was applied to the bridge, the largest measured strain (191 MI1
which corresponds to a stress of approximately 997 psi) occurred in Beam 2. The smallest girders
strains occurred when the reinforced concrete diaphragms (RC.1) or X-brace plus strut diaphragms
(X1.l) were in place. In order to simplify the comparisons of the effects of the various diaphragm
types on the induced girder stresses, the largest strains (LL or LR) in Table 4.2 have been multiplied
by the concrete modulus oE elasticity. These girder stresses are presented in Table 4.4. As noted
in Section 1.2, one of the primary objectives of this investigation was to establish a steel diaphragm
co ms that
are presently used in Iowa. One way of demonstrating the structural equivalency of the diaphragms
is to compare the strains or stresses that are induced in the bottom flanges of the beams when loads
are applied to the girders with the various diaphragm configurations in place. As may be seen from
Table 4.4, the girder stresses are slightly smaller with diaphragms RC.l, X1.1 or X2.1 in place. As
previously noted, the model bridge construction details for the RC.1 diaphragms affected the results
when horizontal load was applied at point 6. Thus, on the basis of the girder stresses, one can say
the response of the bridge to horizontal loading would be essentially the same with one of these
three configurations in place. The deck strains measured are very small and are obviously influenced

11s ai?ue~ urolloq 30 aaeia~e uo paseq ssaq 'pals
by deck cracking. As a result of the direction of the horizontal loading, strains along line 1 are
compressive while those along line 4 are tensile.
Since the strains presented in Table 4.2 were induced by upward loading on the girders, the
strains measured in the bottom Ranges of the beams were compressive. Also shown in Table 4.4 are
the maximum midspan girder stresses that result from the various combinations of diaphragms and
vertical load. These stresses were obtained by taking an average of the midspan bottom flange
strains listed in Table 4.2 and multiplying them by the modulus of elasticity of concrete. The girder
stresses presented in Table 4.4 that were induced by the vertical load are essentially equal, indicating
that diaphragms have essentially no effect on vertical load distribution. The deck stresses (not
presented) which were caused by the vertical loading are extremely small and are basically
independent of the type of diaphragms in place. When Beam 2 was loaded vertically, the deck
strains along lines 1 and 4 were tensile. When Beam 1 was loaded, the deck strains along line 1
were tensile, while those along line 4 were compressive. Similar deck strains occurred when Beam
3 was loaded--compressive strains along line 1 and tensile strains along line 4.
previously noted, the measured diaphragm strains for the various diaphragm
configurations and loading cases are also presented in Tables 4.2 and 4.3. The diaphragm location
tables present the maximum and minimum strains recorded in the various series of tests. The
measured diaphragm strains from the various series of tests cannot be compared since they occur
in the various diaphragm types and at different locations and orientations. For each series of tests,
two lines of diaphragm strain data are presented; the first line presents data for the diaphragm
between Beams 1 and 2 (Diaphragm B1 in Fig. 2.3) while the second line is for strains in the
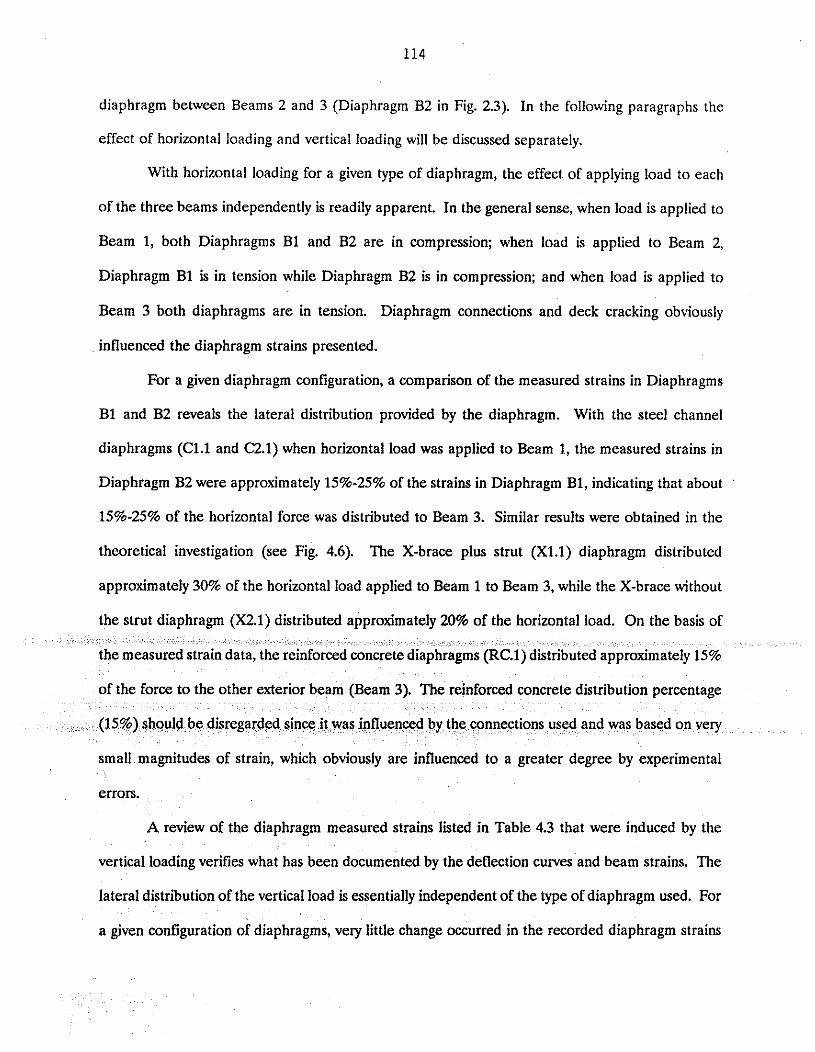
diaphragm between Beams 2 and 3 (Diaphragm B2 in Fig. 2.3). In the following paragraphs the
effect of horizontal loading and vertical loading will be discussed separately.
With horizontal loading for a given type of diaphragm, the effect of applying load to each
of the three beams independently is readily apparent. In the general sense, when load is applied to
Beam 1, both Diaphragms B1 and B2 are in compression; when load is applied to Beam 2,
Diaphragm B1 is in tension while Diaphragm B2 is in compression; and when load is applied to
Beam 3 both diaphragms are in tension. Diaphragm connections and deck cracking obviously
influenced the diaphragm strains presented.
For a given diaphragm configuration, a comparison of the measured strains in Diaphragms
B1 and B2 reveals the lateral distribution provided by the diaphragm. With the steel channel
diaphragms (C1.l and (2.1) when horizontal load was applied to Beam 1, the measured strains in
Diaphragm B2 were approximately 15%-25% of the strains in Diaphragm B1, indicating that about
15%-25% of the horizontal force was distributed to Beam 3. Similar results were obtained in the
theoretical investigation (see Fig. 4.6). The X-brace plus strut (X1.1) diaphragm distributed
approximately 30% of the horizontal load applied to Beam 1 to Beam 3, while the X-brace without
the strut diaphragm (X2.1) distributed approximately 20% of the horizontal load. On the basis of
small magnitudes of strain, which obviously are influenced to a greater degree by experimental
errors.
A review of the diaphragm measured strains listed in Table 4.3 that were induced by the
vertical loading verifies what has been documented by the deflection curves and beam strains. The
lateral distribution of the vertical load is essentially independent of the type of diaphragm used. For
a given configuration of diaphragms, very little change occurred in the recorded diaphragm strains

as the vertical load was moved from beam to beam. In fact, there was minimal variation between
the strain readings occurring in the various diaphragms. The only exception to this statement
occurred when reinforced concrete diaphragms were used. Measured strains in the reinforced
concrete diaphragm were very small. For additional analysis of the girder, deck, and diaphragm
strains the reader is referred to Ref. 9.
4.3. ComDarison of Analytical and Experimental Results
In the previous sections, theoretical and experimental results have been presented. In these
sections, the effects of the various diaphragms investigated on the horizontal and vertical load
distribution have been documented and compared. In this section, the experimental results will be
presented in different formats and compared with the theoretical results.
4.3.1. Dis~lacement Distribution Alone the Bridee Span
The nine figures (Figs. 4.33-4.41) in this section compare the theoretical and experimental
horizontal deflections that occurred when a 50-kip horizontal load was applied to the midspan of
Beam 1 (point 4) or the midspan of Beam 2 (point 5). In each of these figures, two theoretical
horizontal deflection curves are presented for each beam--one assuming the beams have pinned ends
isplacements, measured a t the
quarter points of the span and midspan of each of the three beams, is indicated in these Figures as
While the data in Figs. 4.30-4.32 were described as being equivalent to influence lines,
the data in these figures could be described as being influence surfaces--horizontal deflection for all
three beams is given for a particular horizontal load. A quick review of these nine figures reveals
that the horizontal deflections are very small. The maximum deflection occurs in the loaded beam.
As would be expected, the absolute maximum deflection occurred when diaphragms were not
present. Figure 4.33 presents the horizontal deflections of the three beams when there were no
diaphragms present and when the 50-kip horizontal load was applied at the midspan of Beam 1.
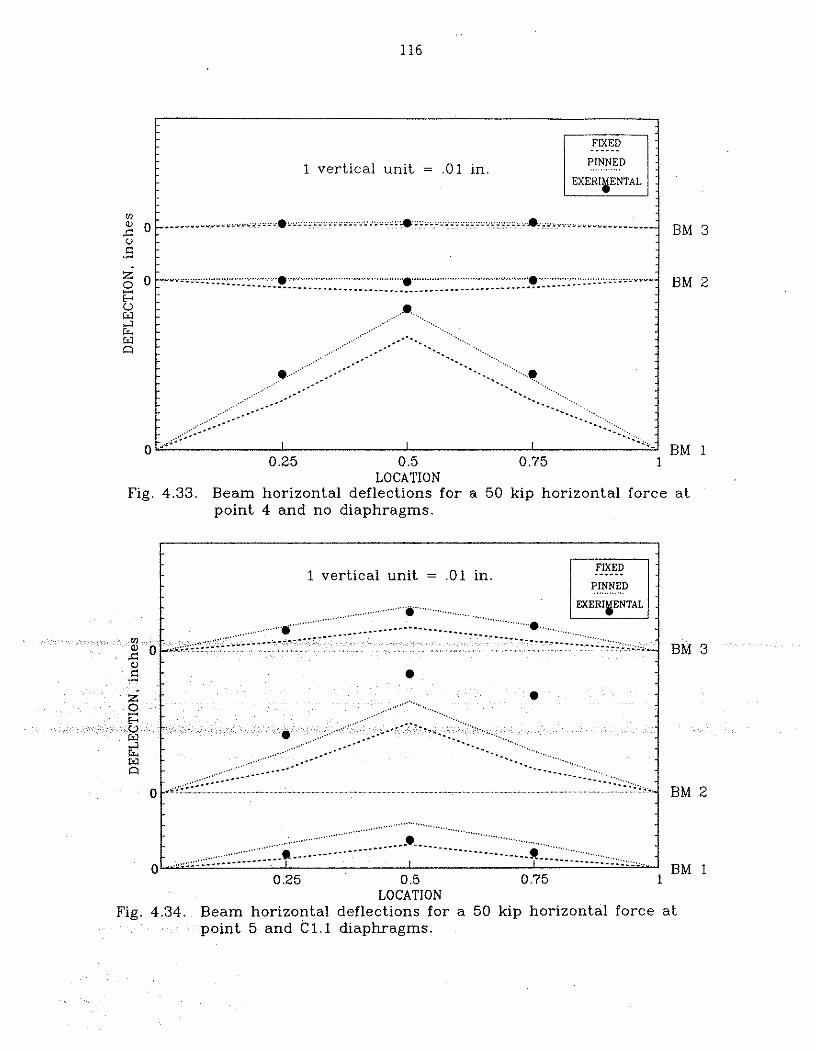
LOCATION Fig. 4.33. Beam horizontal deflections for a 50 kip horizontal force a t
point 4 and no diaphragms.
m 9, 0 ,I= U C ." i 0 0 E- U W 4 G. W !a
0
1 vertical unit = .O1 in.
BM 3
BM 2
...... PINNED ... ........ 1 vertical unit = .O1 in. ,
....... ;.;*..;;.;;; ...~2~z::::~:v. ..;.:us :........%"..'=... . Y % ~ ~ i s w " ~ " _ " " _ _ " _ _ _ - - - .
- .... ................. .....,.. ................................................... :-"";""---------- --- I - - - - - 1
......... ..... ... ... ..-- . . . . . . . _.--. .......... .. '.. ....... . . . . . ...:'.- -..: . - $i.
. . I I I
.a. -' Ci - -
0 0.25 0.5 0.75 1
BM 1
LOCATION Fig. 4.34. Beam horizontal deflections for a 50 kip horizontal force a t
point 5 and C1.1 diaphragms.
0.25 0.5 0.75 1
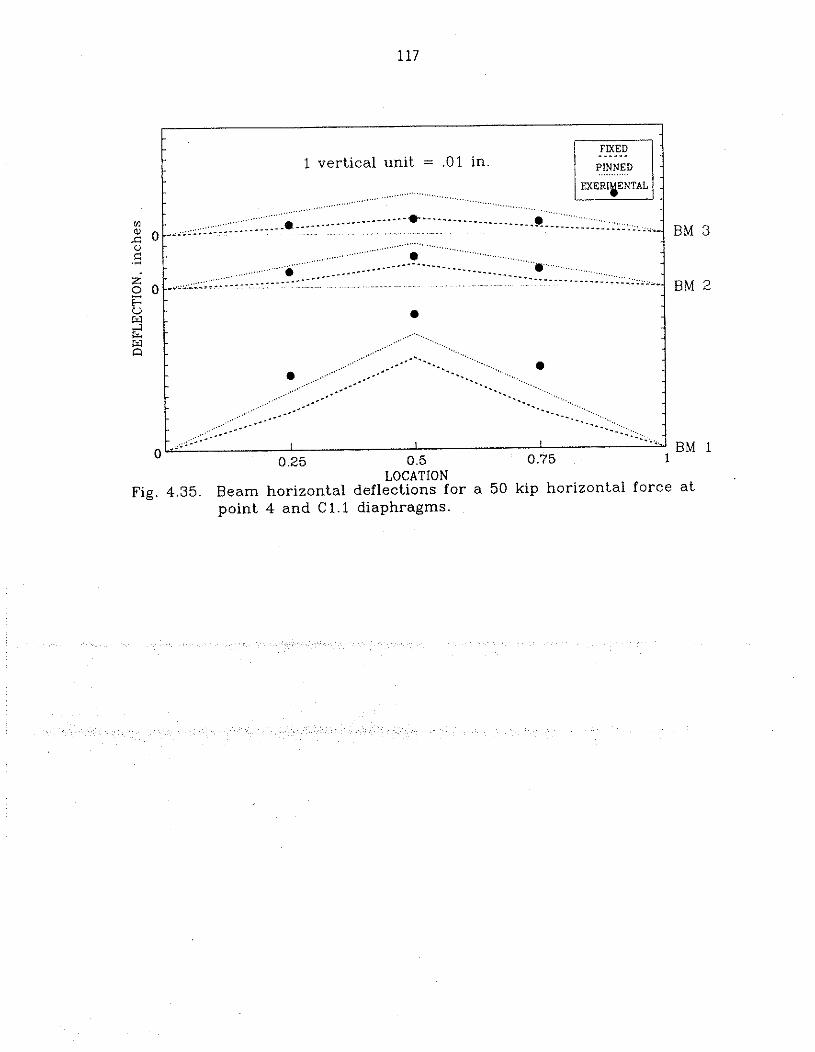
LOCATION Fig. 4.35. Beam horizontal deflections for a 50 kip horizontal force a t
point 4 and C 1 . l diaphragms.
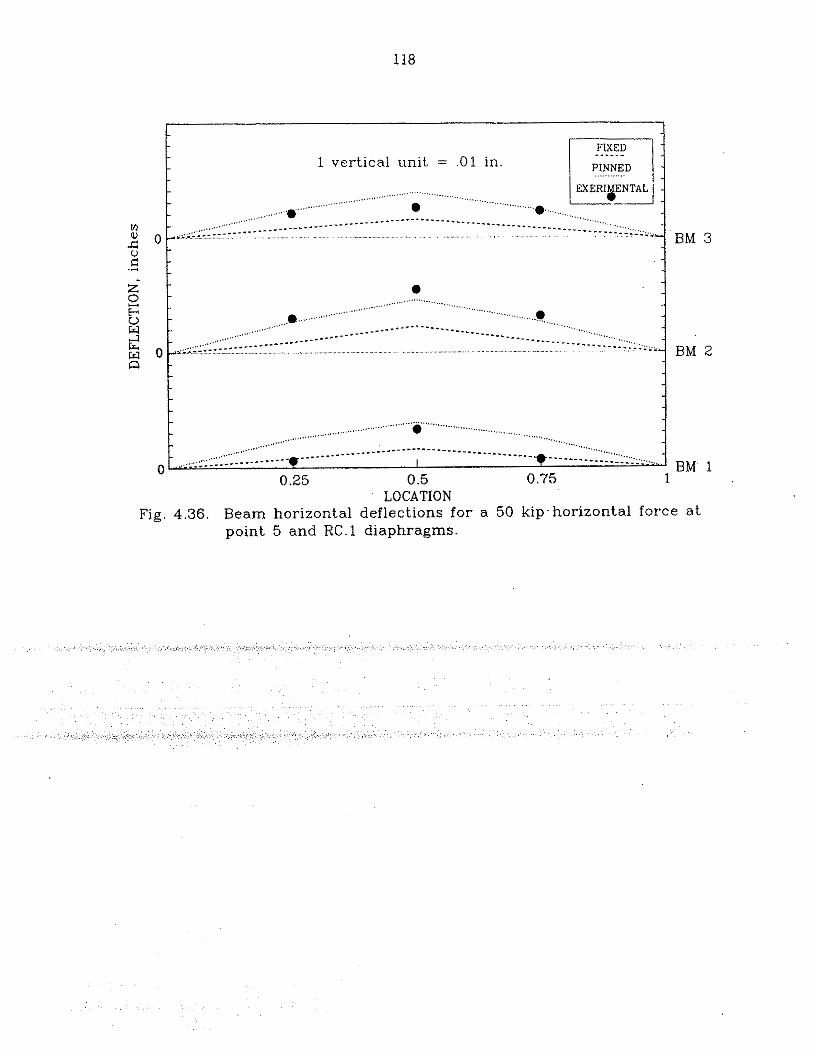
1 vertical unit = .O1 in.
0) 2 (I BM 3 G .- 2 2 E- U
2 w 0 La
BM 2
0 0.25
BM 1 0.5 0.75 1
LOCATION Fig. 4.36. Beam horizontal deflections for a 50 kip-horizontal force a t
point 5 and R C . l diaphragms.
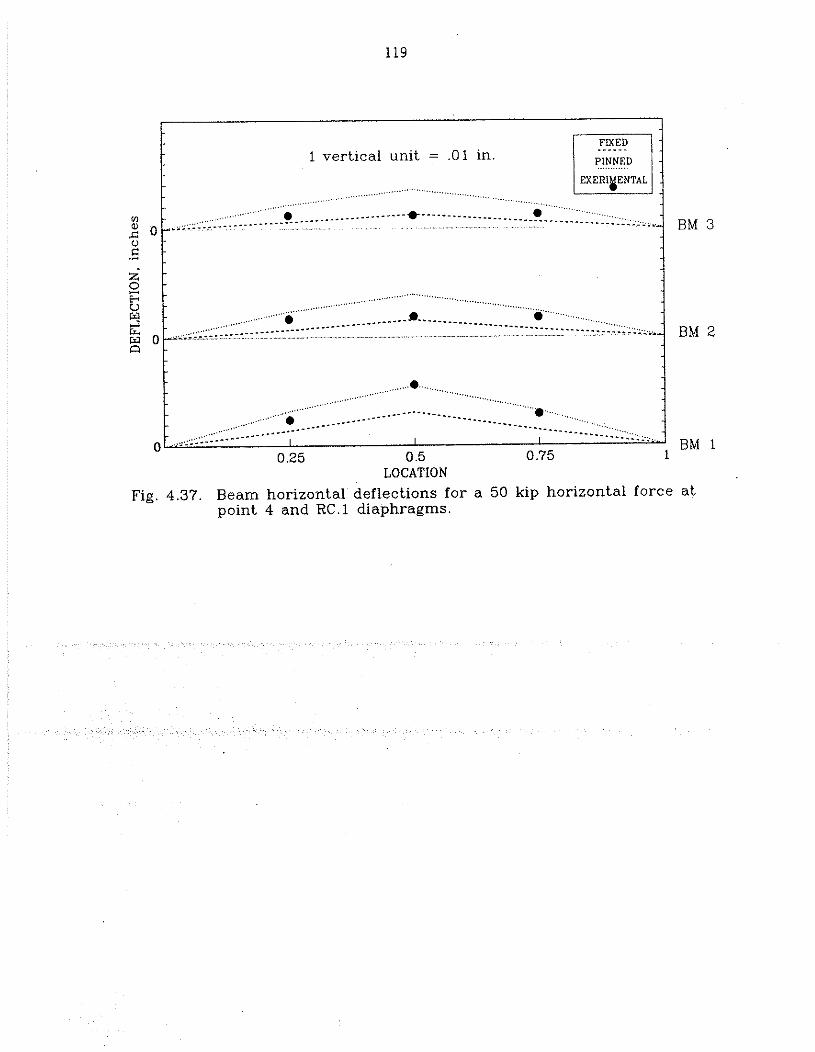
1 vertical unit = . O 1 in.
V1
2 0 BM 3 U C .-
LOCATION
Fig. 4.37. Beam horizontal deflections for a 50 kip horizontal force at point 4 and RC.l diaphragms.
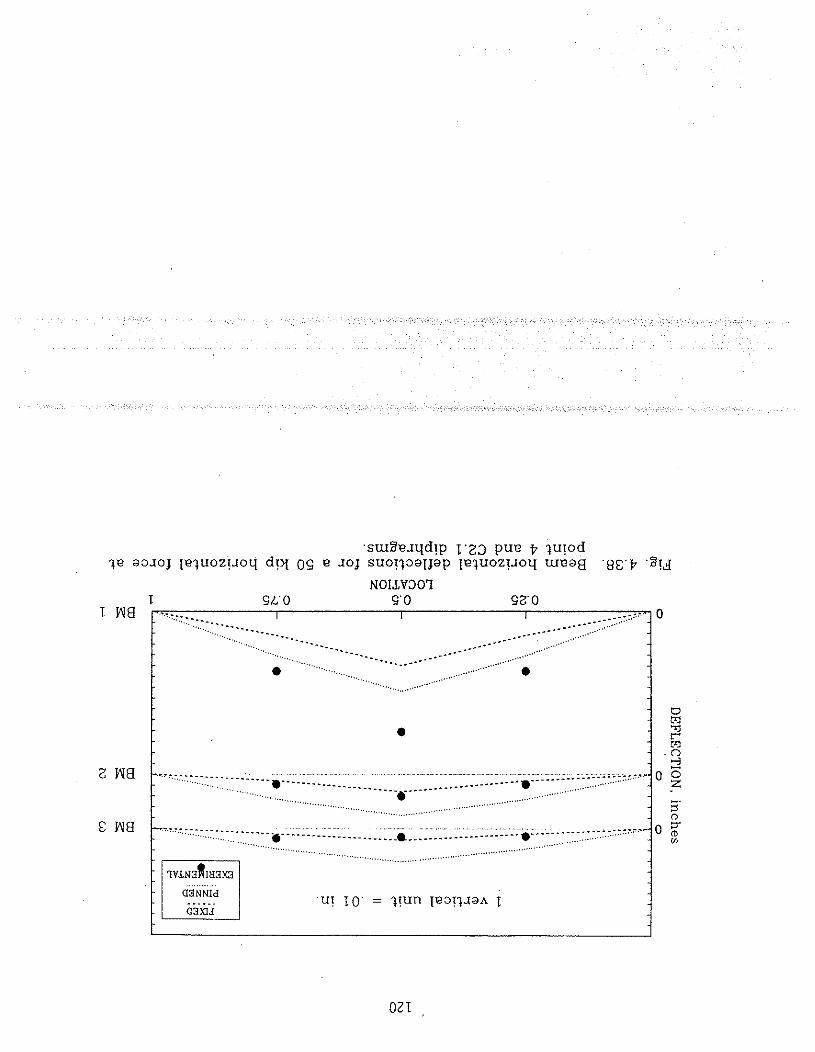
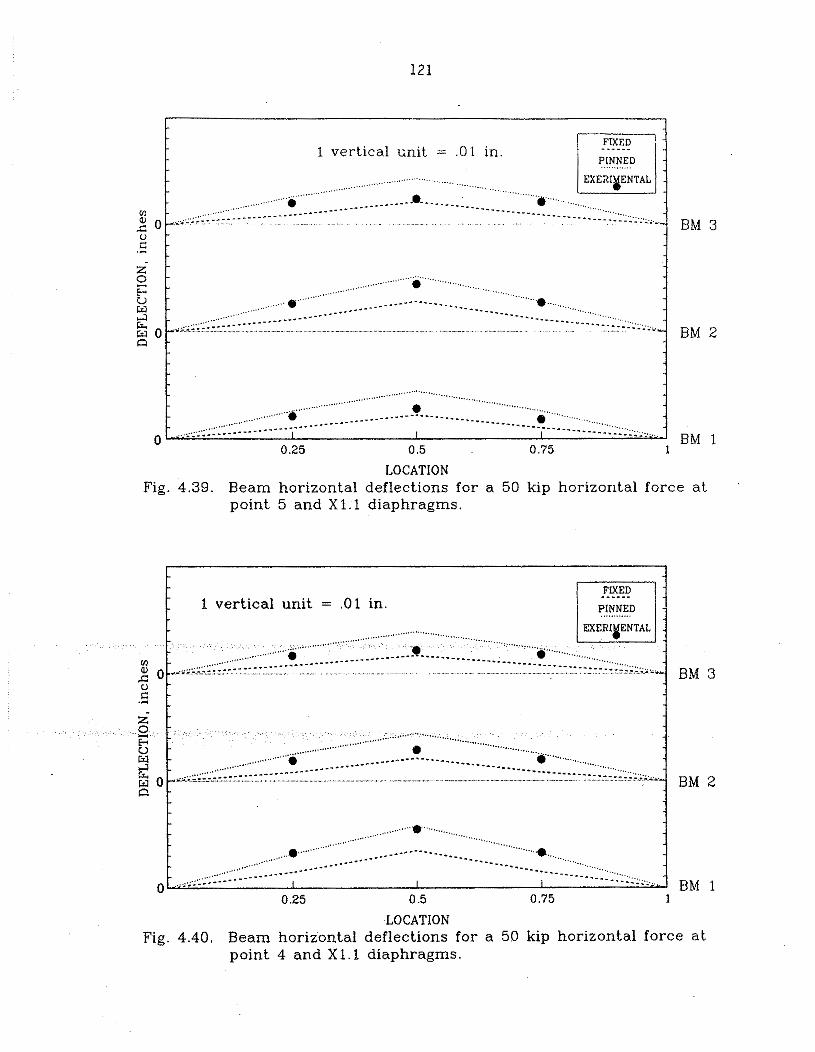
LOCATION Fig. 4.39. Beam horizontal deflections for a 50 kip horizontal force a t
point 5 and X I . 1 diaphragms.
J
1 vertical unit = .01 in.
- BM 3
LOCATION Fig. 4.40. Beam horizontal deflections for a 50 kip horizontal force a t
point 4 and X 1 . l diaphragms.
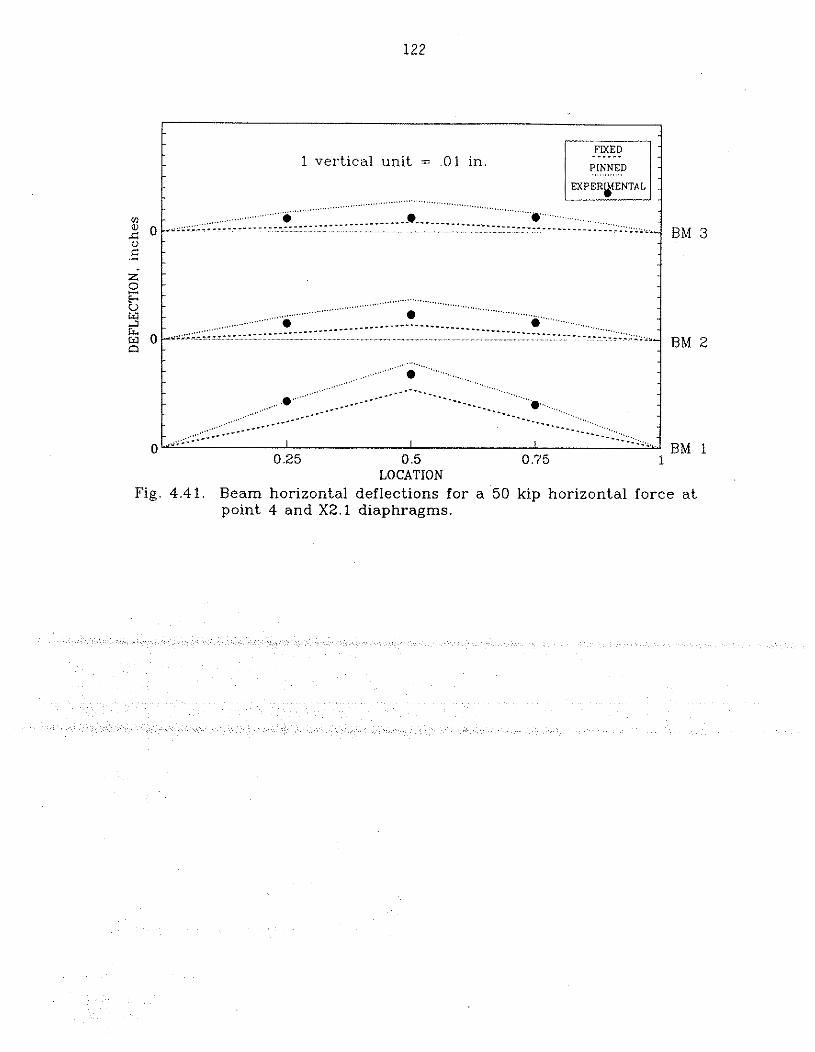
Fig. 4.41. Beam horizontal deflections for a 50 kip horizontal force at point 4 and X 2 . 1 diaphragms.
0: - 2 . i: .-
1 vertical unit = .01 in. PINNED . . . . , . . . . , . .
" " ~ . ...................... - -.--..--.._..._____iI_
- BM 3
.
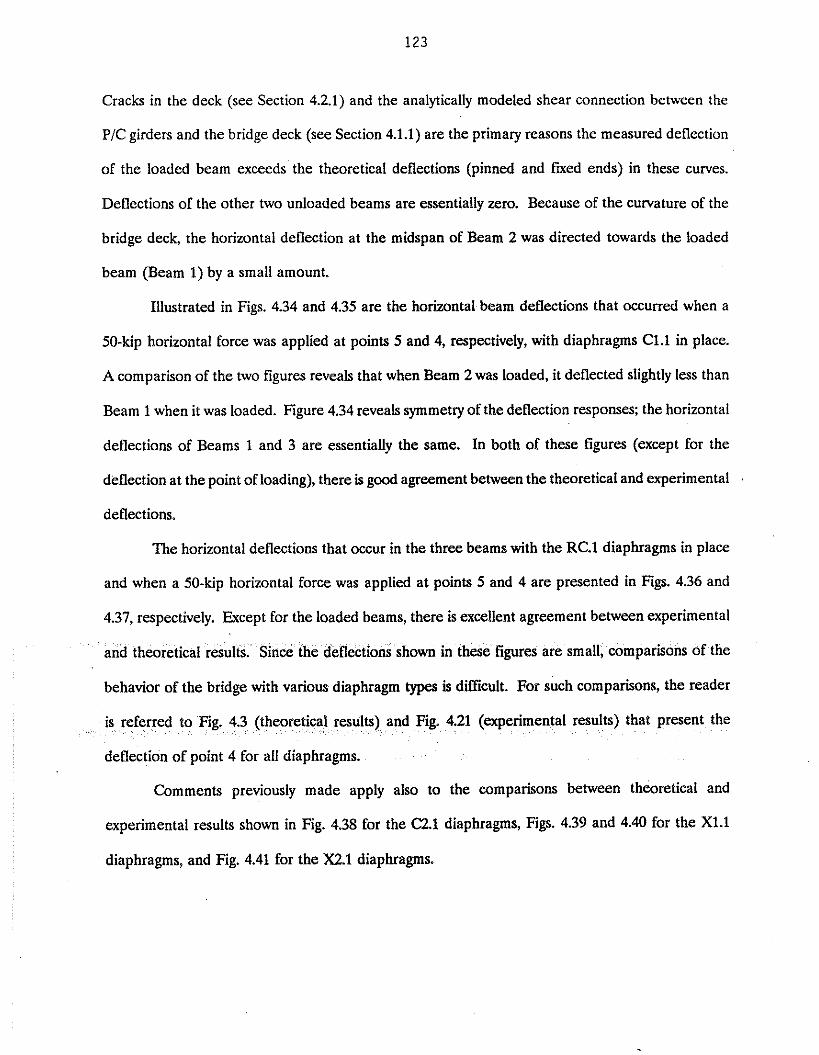
Cracks in the deck (see Section 4.2.1) and the analytically modeled shear connection between the
PIC girders and the bridge deck (see Section 4.1.1) are the primary reasons the measured deflection
of the loaded beam exceeds the theoretical deflections (pinned and fmed ends) in these curves.
Deflections of the other two unloaded beams are essentially zero. Because of the curvature of the
bridge deck, the horizontal deflection at the midspan of Beam 2 was directed towards the loaded
beam (Beam 1) by a small amount.
Illustrated in Figs. 4.34 and 4.35 are the horizontal beam deflections that occurred when a
50-kip horizontal force was applied at points 5 and 4 respectively, with diaphragms C1.l in place.
A comparison of the two figures reveals that when Beam 2 was loaded, it deflected slightly less than
Beam 1 when it was loaded. Figure 4.34 reveals symmetry of the deflection responses; the horizontal
deflections of Beams 1 and 3 are essentially the same. In both of these figures (except for the
deflection at the point of loading), there is good agreement behveen the theoretical and experimental
deflections.
The horizontal deflections that occur in the three beams with the RC.l diaphragms in place
and when a 50-kip horizontal force was applied at points 5 and 4 are presented in Figs. 4.36 and
4.37, respectively. Except for the loaded beams, there is excellent agreement between experimental
and theoretical results. Since the deflections shown in these figures are small, comparisons of the
behavior of the bridge with various diaphragm types is difficult. FOP such comparisons, the reader
erimental results) that present the
deflection of point 4 for all diaphragms.
Comments previously made apply also to the comparisons between theoretical and
experimental results shown in Fig. 4.38 for the (2.1 diaphragms, Figs. 4.39 and 4.40 for the X1.l
diaphragms, and Fig. 4.41 for the X2.1 diaphragms.
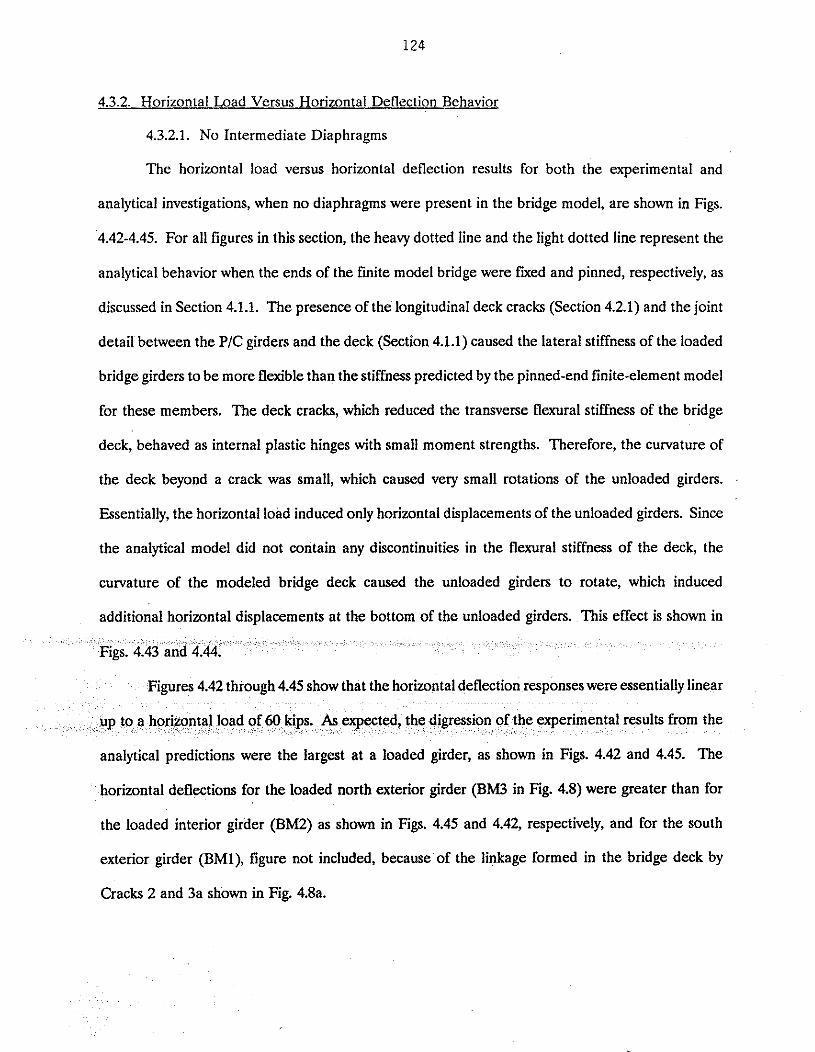
4.3.2. Horizontal Load Versus Horizontal Deflection Behavior
4.3.2.1. No Intermediate Diaphragms
The horizontal load versus horizontal deflection results for both the experimental and
analytical investigations, when no diaphragms were present in the bridge model, are shown in Figs.
4.42-4.45. For ail figures in this section, the heavy dotted line and the light dotted line represent the
analytical behavior when the ends of the finite model bridge were Tied and pinned, respectively, as
discussed in Section 4.1.1. The presence of the longitudinal deck cracks (Section 4.2.1) and the joint
detail between the PIC girders and the deck (Section 4.1.1) caused the lateral stiffness of the loaded
bridge girders to be more flexible than the stiffness predicted by the pinned-end finite-element model
for these members. The deck cracks, which reduced the transverse flexural stiffness of the bridge
deck, behaved as internal plastic hinges with small moment strengths. Therefore, the curvature of
the deck beyond a crack was small, which caused very small rotations of the unloaded girders.
Essentially, the horizontal load induced only horizontal displacements of the unloaded girders. Since
the analytical model did not contain any discontinuities in the flexural stiffness of the deck, the
curvature of the modeled bridge deck caused the unloaded girders to rotate, which induced
additional horizontal displacements at the bottom of the unloaded girders. This effect is shown in
analytical predictions were the largest a t a loaded girder, as shown in Figs. 4.42 and 4.45. The
horizontal deflections for the loaded north exterior girder (BM3 in Fig. 4.8) were greater than for
the loaded interior girder (BM2) as shown in Figs. 4.45 and 4.42, respectively, and for the south
exterior girder (BMl), figure not included, because of the linkage formed in the bridge deck by
Cracks 2 and 3a shown in Fig. 4.8a.
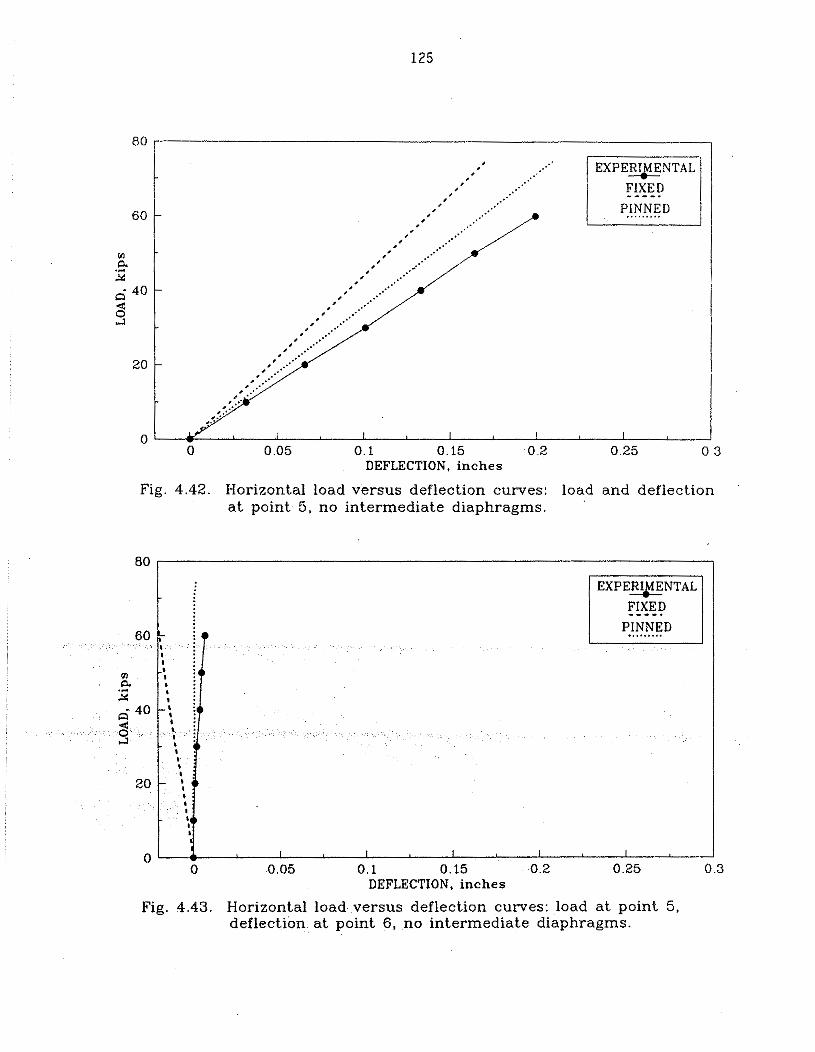
Fig. 4.42. Horizontal load versus deflection curves: load and deflection a t point 5, no intermediate diaphragms.
Fig. 4.43. Horizontal load versus deflection curves: load a t point 5, deflection a t point 6, no intermediate diaphragms.
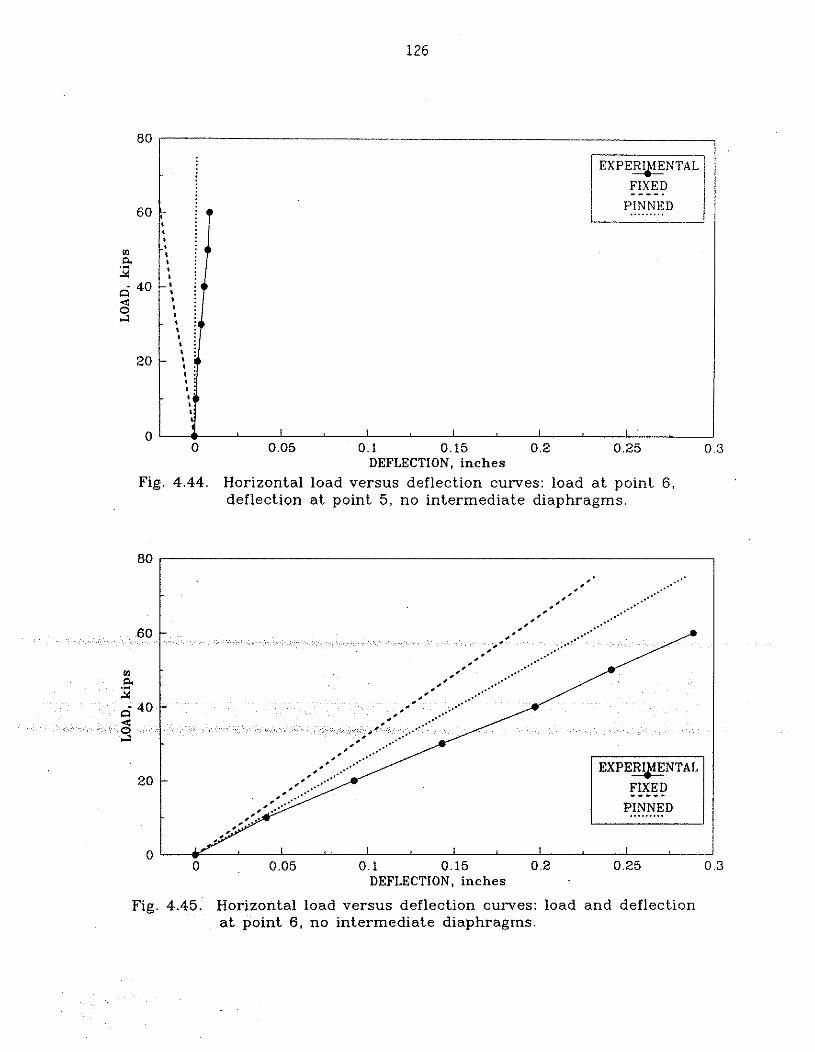
FIXED
PINNED . . . . . . . . .
80
60
V1 a 2
DEFLECTION, inches
: 7 PINNED
s : .* :,, 8 : 4 : a : I :
Fig. 4.45. Horizontal load versus deflection curves: load and deflection a t point 6, no intermediate diaphragms.
I I I I I
0 0 . 0 5 0 . 1 0 . 1 5 0.2 0.25 0.3 DEFLECTION. inches
Fig. 4.44. Horizontal load versus deflection curves: load a t point 6, deflection a t point 5, no intermediate diaphragms.
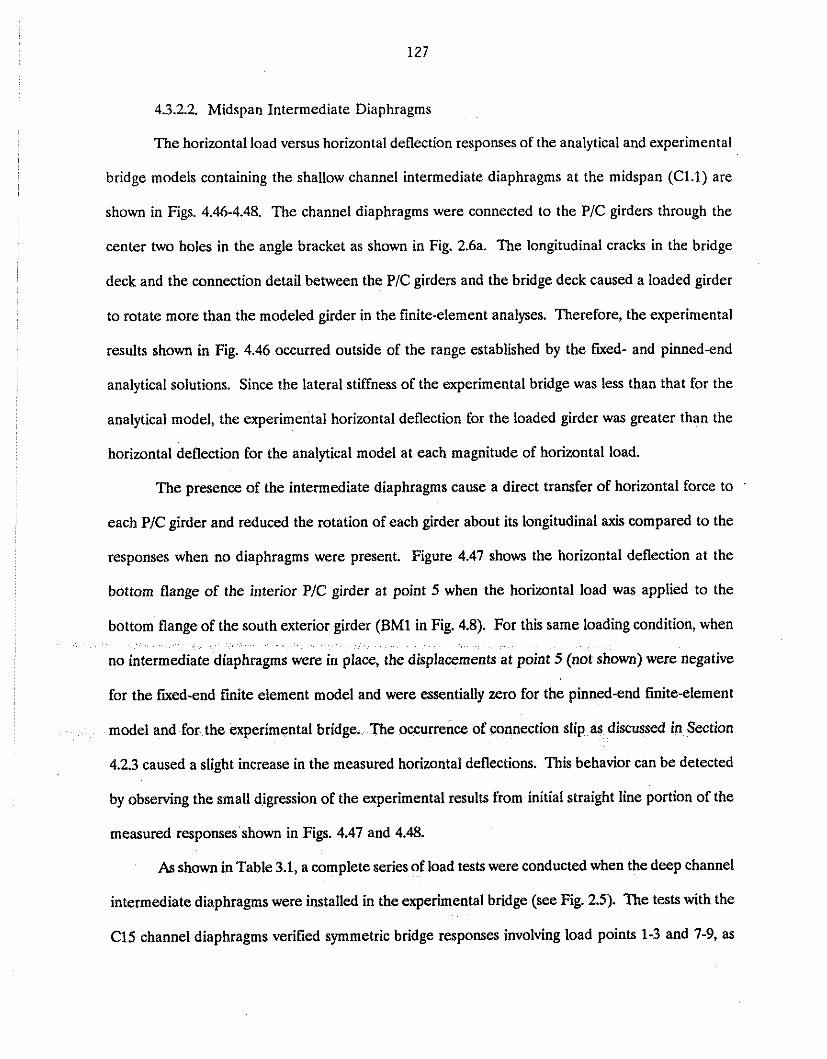
4.3.2.2. Midspan Intermediate Diaphragms
The horizontal load versus horizontal deflection responses of the analytical and experimental
bridge models containing the shallow channel intermediate diaphragms at the midspan (C1.l) are
shown in Figs. 4.46-4.48. The channel diaphragms were connected to the PIC girders through the
center two holes in the angle bracket as shown in Fig. 2.6a. The longitudinal cracks in the bridge
deck and the connection detail between the PIC girders and the bridge deck caused a loaded girder
to rotate more than the modeled girder in the finite-element analyses. Therefore, the experimental
results shown in Fig. 4.46 occurred outside of the range established by the fixed- and pinned-end
analytical solutions. Since the lateral stiffness of the experimental bridge was less than that for the
analytical model, the experimental horizontal deflection for the loaded girder was greater than the
horizontal deflection for the analytical model at each magnitude of horizontal load.
The presence of the intermediate diaphragms cause a direct transfer of horizontal force to
each PIC girder and reduced the rotation of each girder about its longitudinal axis compared to the
responses when no diaphragms were present. Figure 4.47 shows the horizontal deflection at the
bottom flange of the interior PIC girder at point 5 when the horizontal load was applied to the
bottom flange of the south exterior girder (BM1 in Fig. 4.8). For this same loading condition, when
oint 5 (not shown) were negative
for the fixed-end finite element model and were essentially zero for the pinned-end finite-element
model and for the experimental bridge. The occurrence of connection slip as discussed in Section
4.2.3 caused a slight increase in the measured horizontal deflections. This behavior can be detected
by observing the small digression of the experimental results from initial straight line portion of the
measured responses shown in Figs. 4.47 and 4.48.
As shown in Table 3.1, a complete series of load tests were conducted when the deep channel
intermediate diaphragms were installed in the experimental bridge (see Fig. 2.5). The tests with the
C15 channel diaphragms verified symmetric bridge responses involving load points 1-3 and 7-9, as
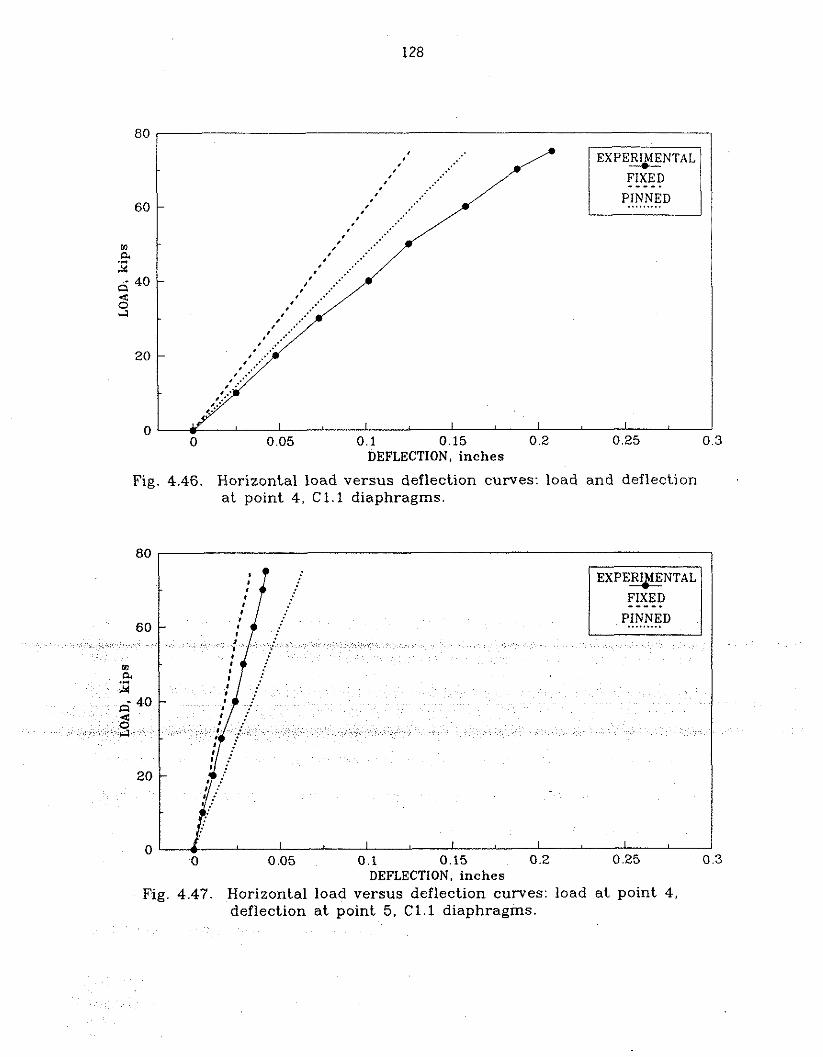
DEFLECTION, inches
Fig. 4.46. Horizontal load versus deflection curves: load and deflection at point 4, C 1 . l diaphragms.
Fig. 4.47. Horizontal load versus deflection curves: load a t point 4, deflection a t point 5, C 1 . l diaphragms.
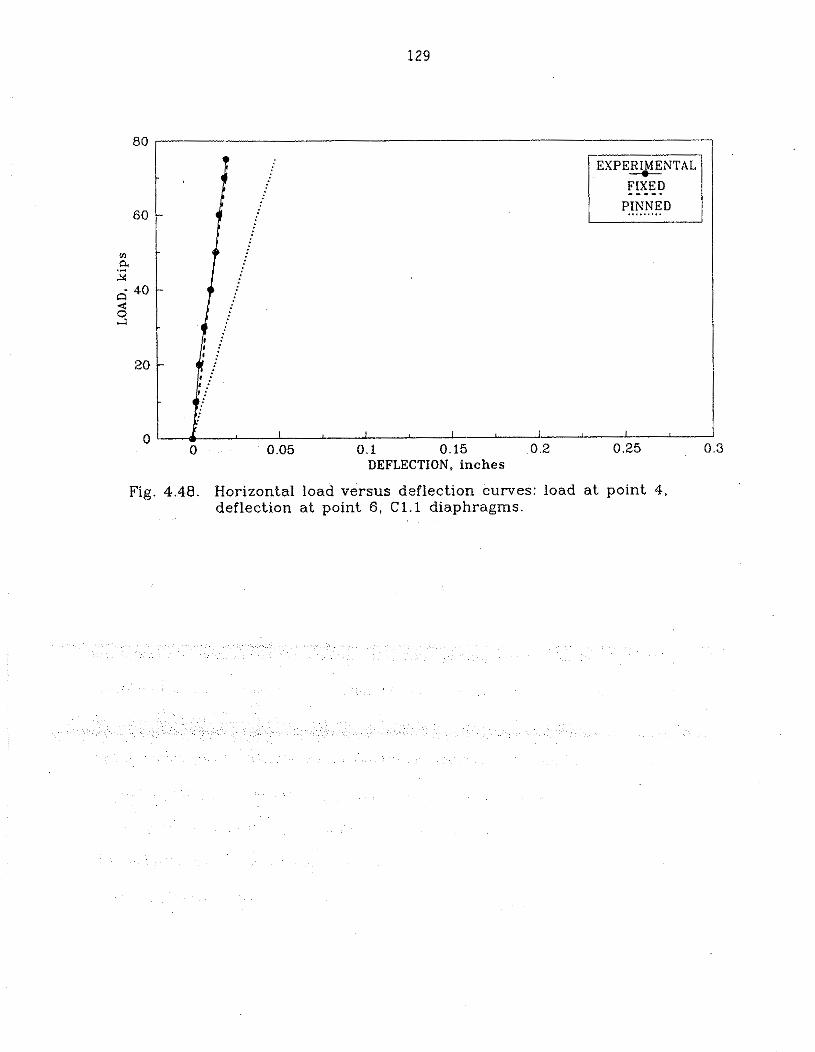
Fig. 4.48. Horizontal load versus deflection curves: load a t point 4, deflection a t point 6, C 1 . l diaphragms.
discussed in Section 3.3. Considering the horizontal load tests with the deep channel midspan
diaphragms (C2.1), Figs. 4.49-4.51 show the horizontal deflection response of the bottom flange of
the loaded PIC girders, corresponding to points 4-6, respectively. The horizontal deflection responses
For the bottom flange of the unloaded PIC girders are shown in Figs. 4.52-4.57.
A comparison of the analytical and experimental displacement results involving the loaded
girders (Figs. 4.49-4.51) reveals that the actual response of the model bridge was more flexible than
predicted by the analytical models involving either fLved or pinned ends. As previously discussed,
the PIC girder rotation associated with the experimental testing caused a significant increase in the
horizontal deflection of the loaded flange. As anticipated, the load versus deflection behavior OF the
interior PIC girder (Fig. 4.50) indicated a stiffer response than for the same behavior associated with
the exterior girders (Figs. 4.49 and 4.51) for both the analytical and experimental results. The
analytical models showed that symmetric responses occurred when loading points 4 and 6 (Figs. 4.49
and 4.51), while the experimental tests revealed that symmetry did not occur at these hvo points.
The differences in the experimental behavior were attributed to the cracks in the bridge deck, the
connection between the PIC girders and the bridge deck, and the connection detail between the
diaphragms and the PIC girder webs.
appropriate graphs of load versus deflection behavior should be identical. A comparison of Figs.
4.52 and 4.53, Figs. 4.54 and 4.55, and Figs. 4.56 and 4.57 reveals that this phenomenon was
confirmed analytically and was essentially satisfied experimentally. Because of the geometric
symmetry of the bridge, additional symmetry for the results can be observed by comparing Figs. 4.52
and 4.57, Figs. 4.53 and 4.56, Figs. 4.52 and 4.56, and Figs. 4.53 and 4.57. The analytically predicted
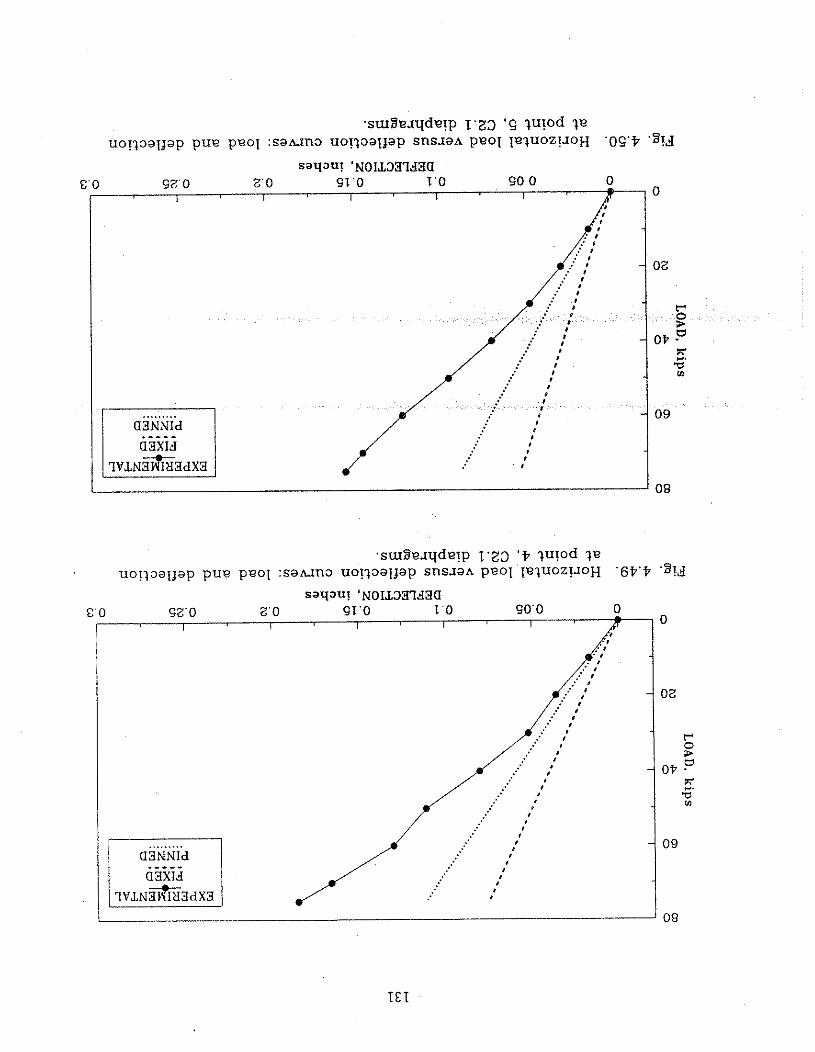
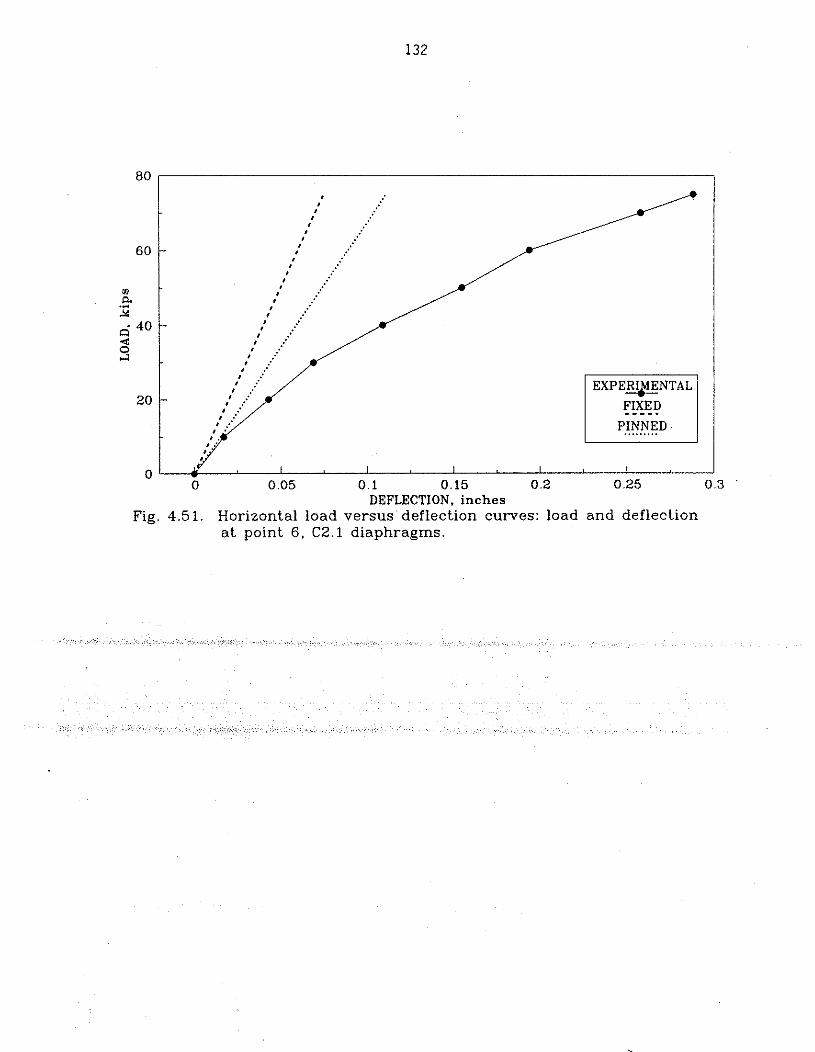
FIXED PINNED .... . ....
DEFLECTION. inches Fig. 4.51. Horizontal load versus deflection curves: load and deflection
a t point 6, C2.1 diaphragms.
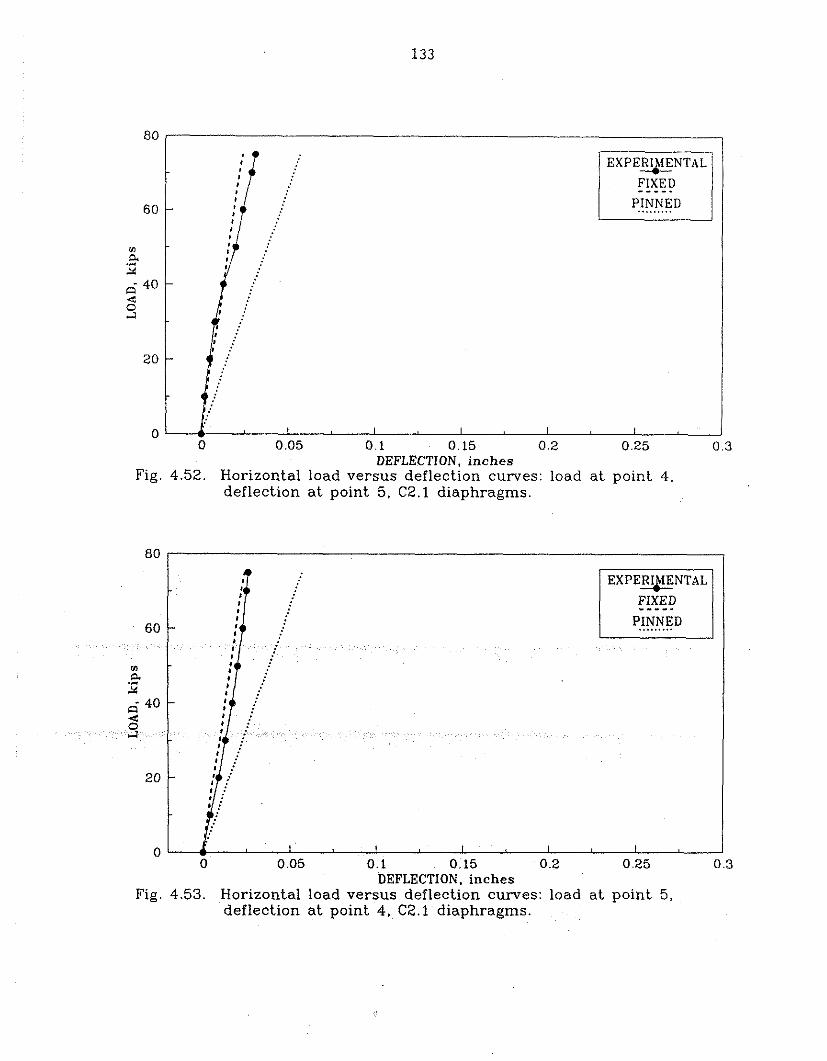
0 0 05 0 1 0 15 0 2 0 25 0 3 DEFLECTION. inches
Fig. 4.53. Horizontal load versus deflection curves: load a t point 5, deflection a t point 4, C2.1 diaphragms.
80
60
D a 2 6 40 b.
2
20
0
FIXED ----. - PINNED . . . . . . . . .
-
-
I I I I I - 0 0.05 0 1 0 15 0 2 0 25 0 3
DEFLECTION, inches Fig. 4.52. Horizontal load versus deflection curves: load a t point 4,
deflection a t point 5, C2.1 diaphragms.
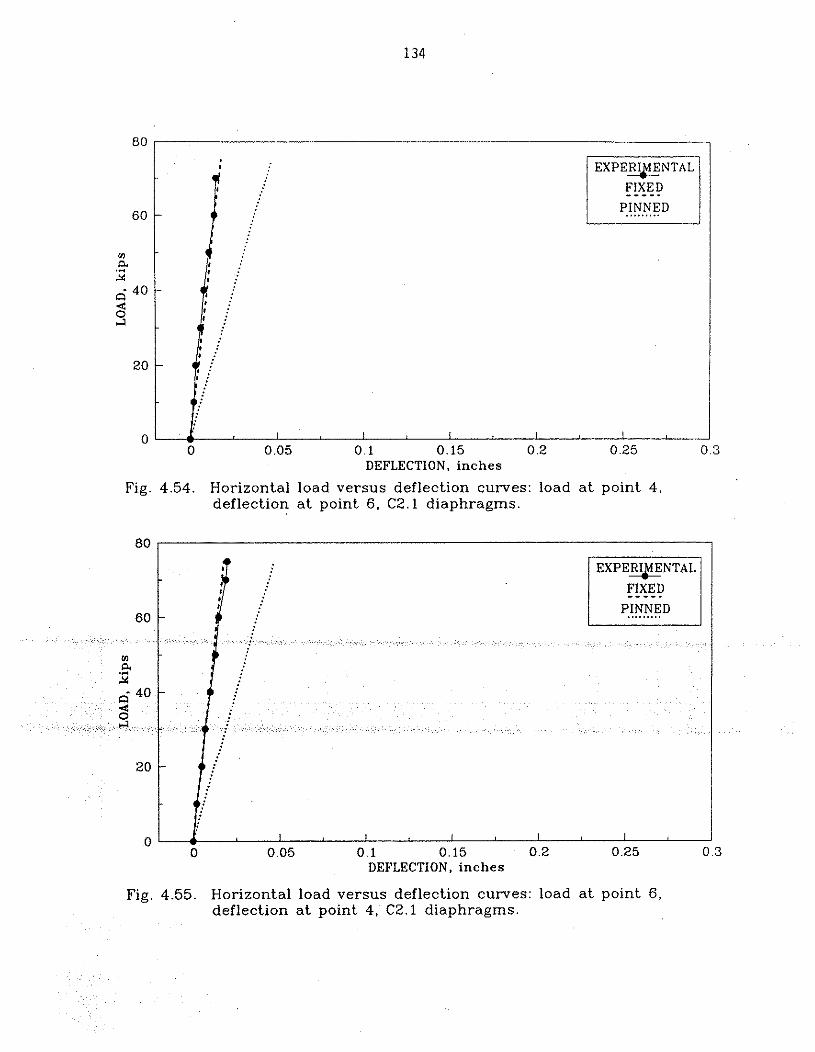
DEFLECTION, inches
0
Fig . 4.54. Horizontal load versus deflection curves: load a t point 4, deflection a t point 6. CZ.1 diaphragms.
0 0.05 0.1 0.15 0.2 0.25 0.3 DEFLECTION, inches
Fig. 4.55. Horizontal load versus deflection curves: load a t point 6, deflection a t point 4, C2.1 diaphragms.
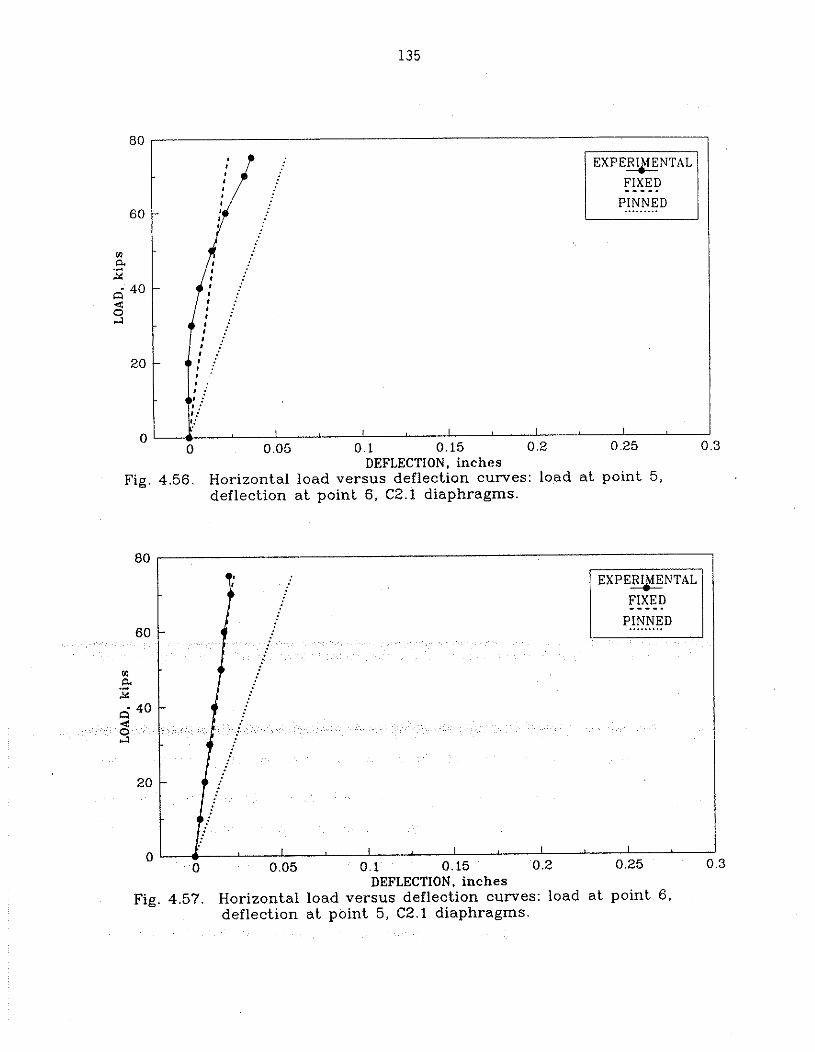
I E X P E Z E N T A L
FIXED ----. I 1
20 -
0 . - I I I I I
0 0 05 0 1 0 15 0 2 0 25 0 3 DEFLECTION, inches
Fig. 4.57. Horizontal load versus deflection curves: load a t point 6. deflection a t point 5, C2.1 diaphragms.
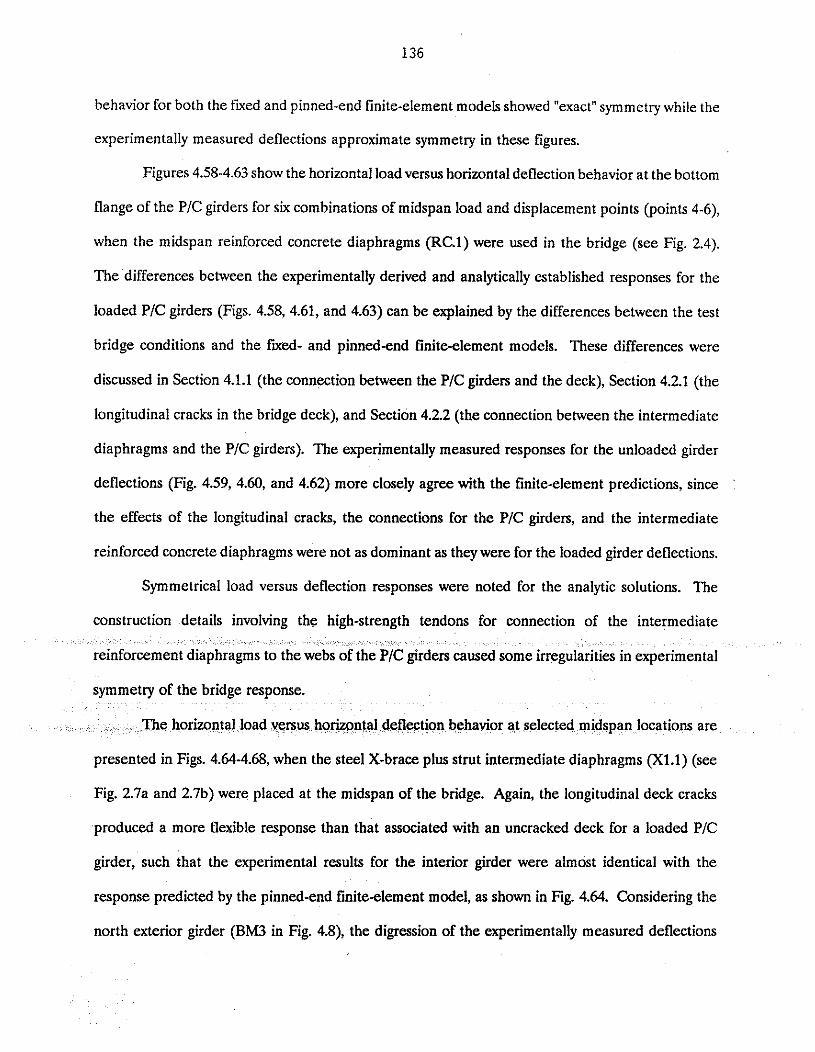
behavior for both the f i ed and pinned-end finite-element models showed "exact" symmetry while the
experimentally measured deflections approximate symmetry in these figures.
Figures 4.58-4.63 show the horizontal load versus horizontal deflection behavior at the bottom
flange of the PIC girders for six combinations of midspan load and displacement points (points 4-6),
when the midspan reinforced concrete diaphragms (RC.1) were used in the bridge (see Fig. 2.4).
The differences between the experimentally derived and analytically established responses for the
loaded PIC girders (Figs. 4.58, 4.61, and 4.63) can be explained by the differences between the test
bridge conditions and the fured- and pinned-end finite-element models. These differences were
discussed in Section 4.1.1 (the connection between the PIC girders and the deck), Section 4.2.1 (the
longitudinal cracks in the bridge deck), and Section 4.2.2 (the connection between the intermediate
diaphragms and the PIC girders). The experimentally measured responses for the unloaded girder
deflections (Fig. 4.59, 4.60, and 4.62) more closely agree with the finite-element predictions, since
the effects of the longitudinal cracks, the connections for the PIC girders, and the intermediate
reinforced concrete diaphragms were not as dominant as they were for the loaded girder deflections.
Symmetrical load versus deflection responses were noted for the analytic solutions. The
construction details involving the high-strength tendons for connection of the intermediate
avior at selected midspan locations are
presented in Figs. 4.64-4.68, when the steel X-brace plus strut intermediate diaphragms (X1.l) (see
Fig. 2.7a and 2.7b) were placed at the midspan of the bridge. Again, the longitudinal deck cracks
produced a more flexible response than that associated with an uncracked deck for a loaded PIC
girder, such that the experimental results for the interior girder were almost identical with the
response predicted by the pinned-end finite-element model, as shown in Fig. 4.64. Considering the
north exterior girder (BM3 in Fig. 4.8), the digression of the experimentally measured deflections
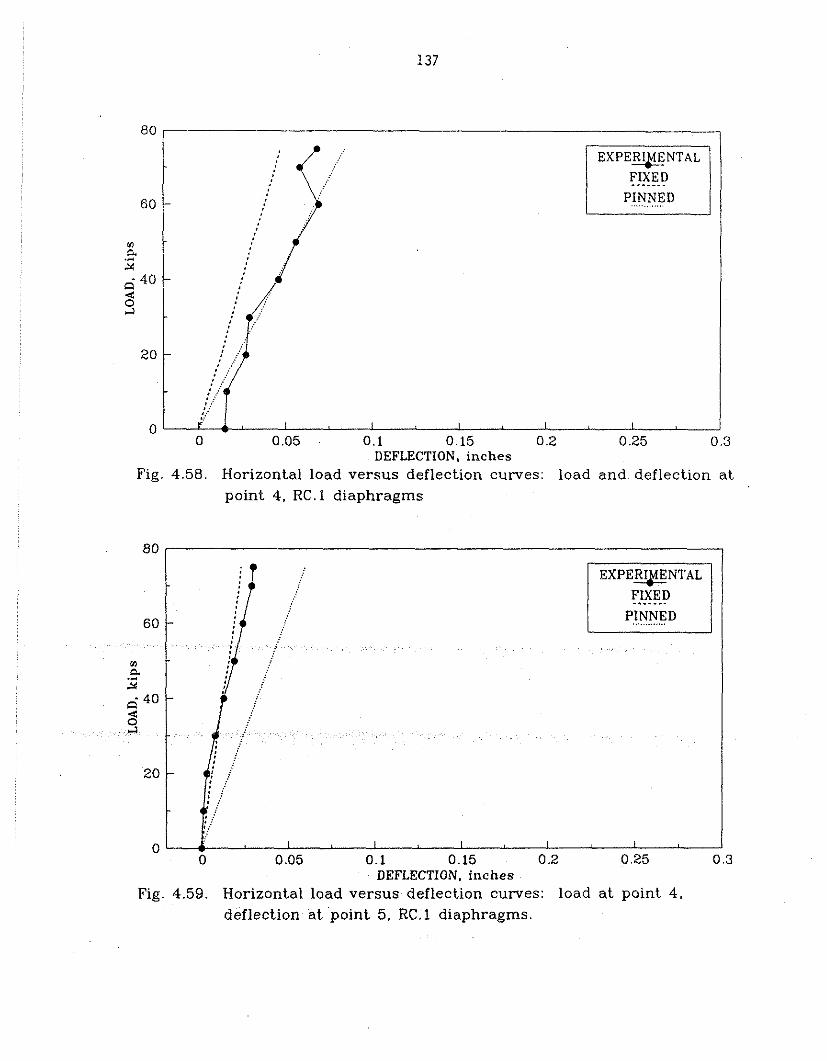
Fig. 4.58. Horizontal load versus deflection curves: load and deflection at point 4, RC. 1 diaphragms
0 0.05 0.1 0.15 0.2 0.25 0.3 DEFLECTION, inches
Fig. 4.59. Horizontal load versus deflection curves: load a t point 4, deflection a t 'point 5, RC. 1 diaphragms.
PINNED / / / .........
80
60
Y)
P 2
40 d
3
20
0
*. 0 - I I I I I
0 0.05 0.1 0.15 0.2 0 25 0 3 DEFLECTION, inches
Fig. 4.61. Horizontal load versus deflection curves: load and deflection a t
point 5, RC. l diaphragms.
DEFLECTION, inches
Fig. 4.60. Horizontal load versus deflection curves: load a t point 4.
deflection a t point 6, R C . l diaphragms.
FIXED : PINNED -
-
-
111
I : , : : : 1 : :
I: ': j t I I I I
0 0.05 0.1 0.15 0.2 0.25 0.3
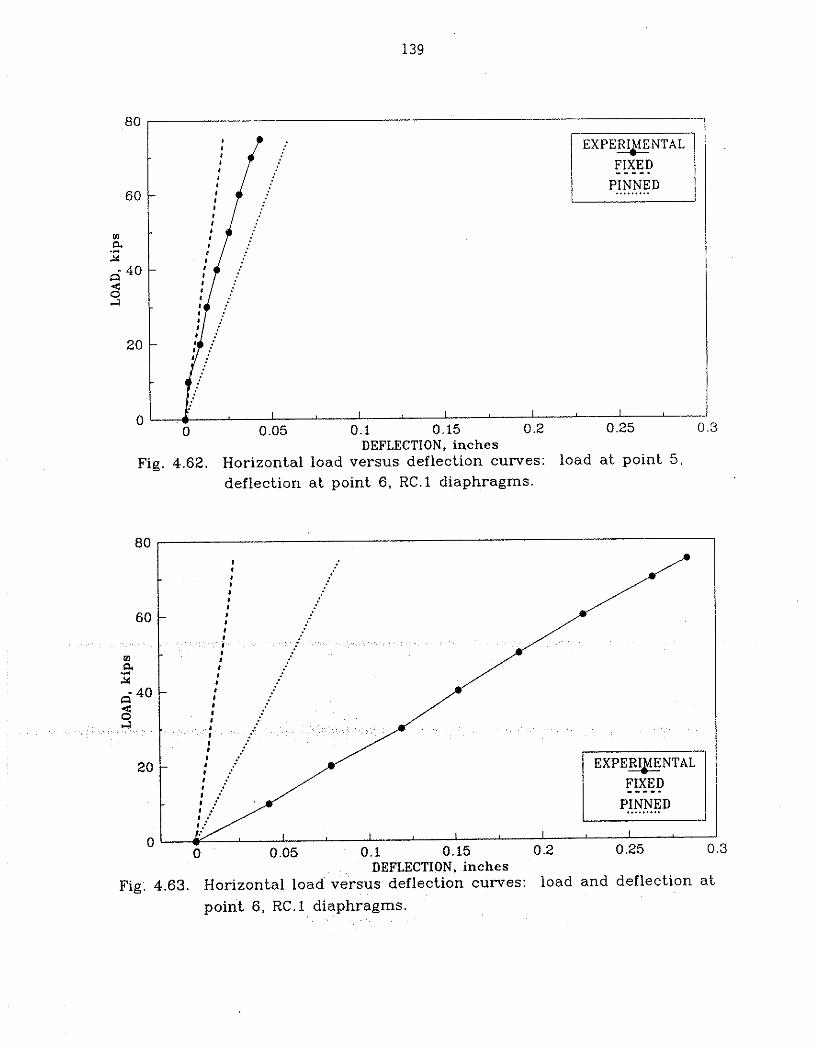
DEFLECTION, inches Fig. 4.62. Horizontal load versus deflection curves: load a t point 5,
deflection a t point 6, RC.l diaphragms.
point 6 , RC. l diaphragms.
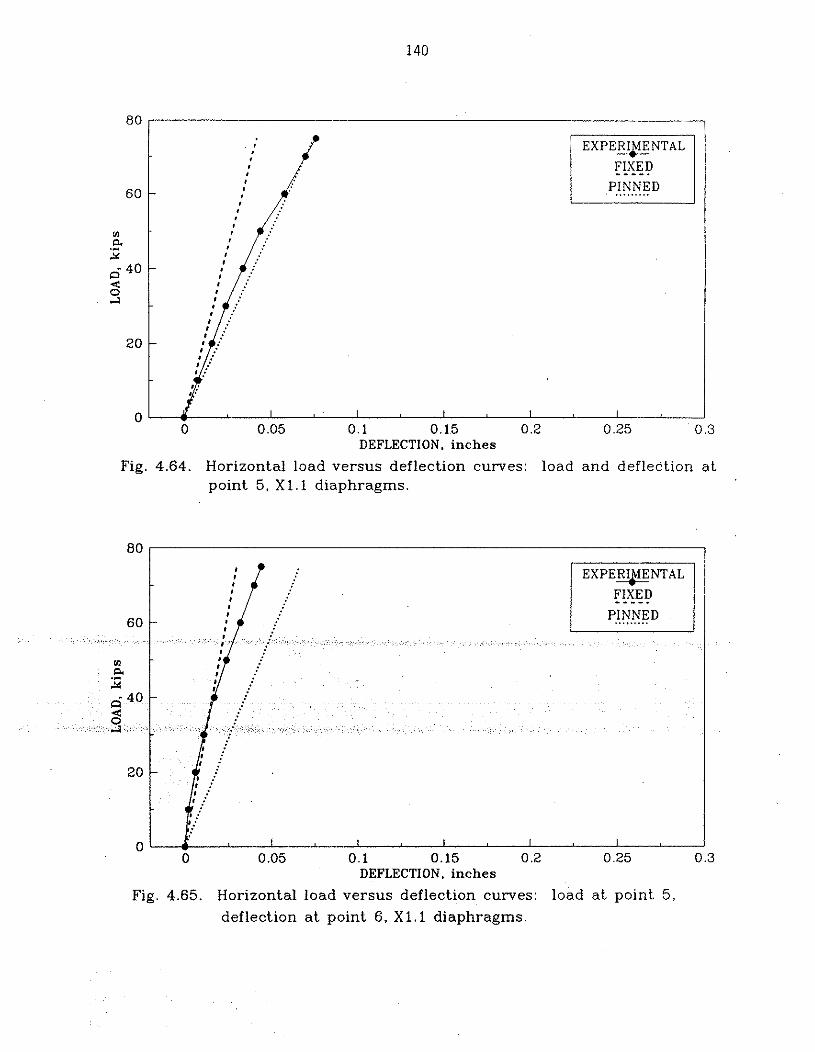
DEFLECTION, inches
Fig. 4.64. Horizontal load versus deflection curves: load and deflection at point 5. X 1 . l diaphragms.
0 0.05 0.1 0.15 0.2 0.25 0 .: DEFLECTION, inches
Fig. 4.65. Horizontal load versus deflection curves: load a t point 5 , deflection a t point 6, X 1 . l diaphragms.
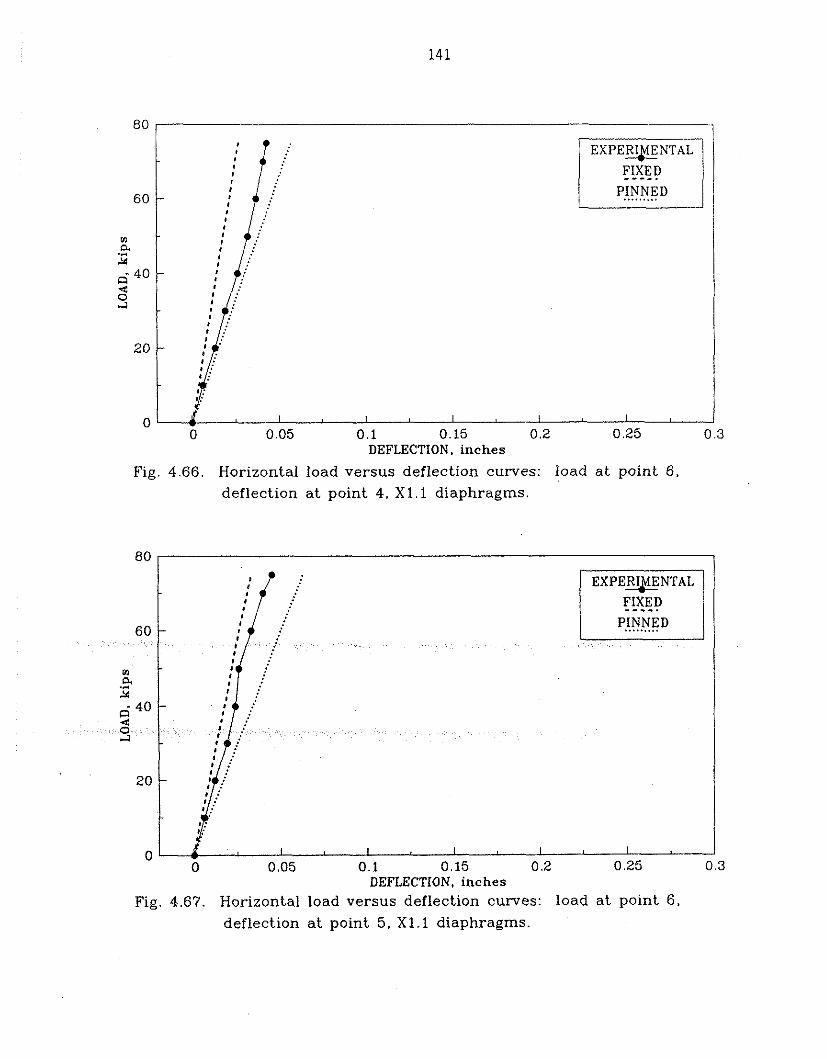
0 0.05 0 1 0 15 0.2 0 25 0 3 DEFLECTION. inches
Fig. 4.67. Horizontal load versus deflection curves: load a t point 6, deflection a t point 5, X 1 . l diaphragms.
80
60
Vi a 2 6 40 d
2
20
0
FIXED
- PINNED
-
-
I I I I - 0 0.05 0.1 0.15 0.2 0.25 0.3
DEFLECTION. inches
Fig. 4.66. Horizontal load versus deflection curves: load a t point 6, deflection a t point 4, X 1 . l diaphragms.
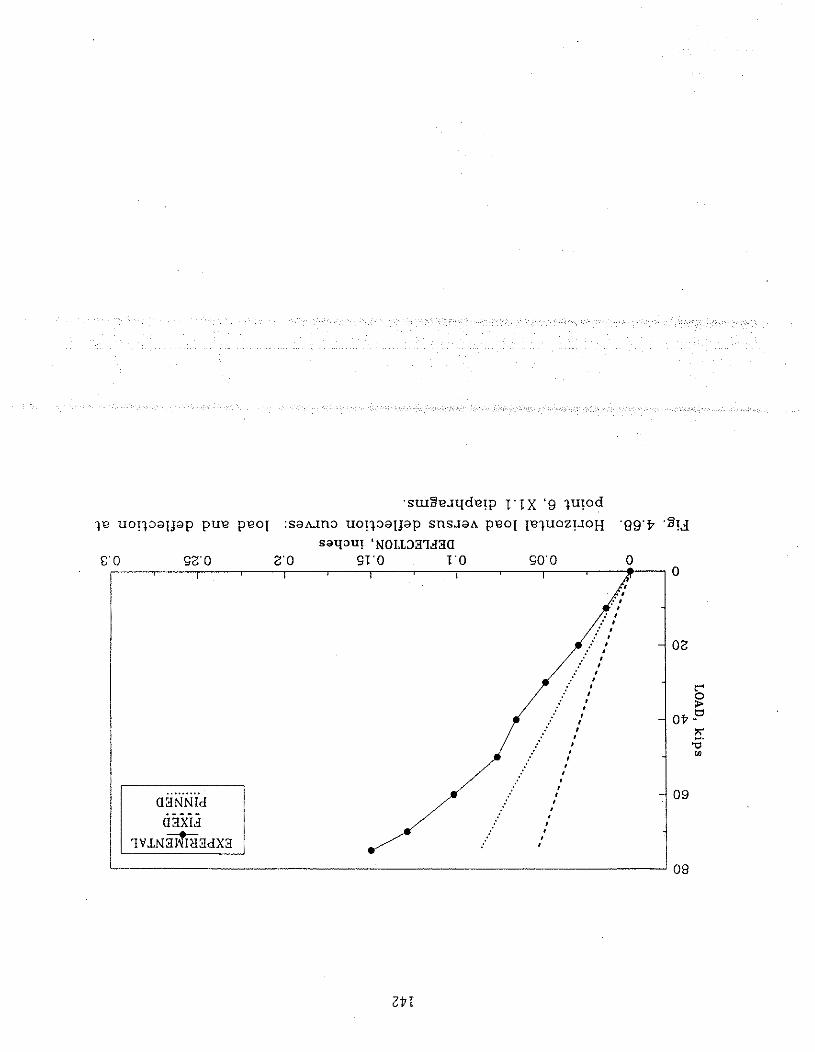
~e uo!23aijap PUI? P P O ~ : s a ~ ~ n a u0!13a1jap SnsJaA pe01 IP~UOZ!JOH .eg.+ .Z!J saq3u! ' N O I L ~ H T ~ H ~
E' 0 GZ'O Z'O S1 '0 1 ' 0 SO' 0 0 I I
-
-
-
0
OZ
r 0 z=
O P ? X 2
09
08

from the analytically predicted responses shown in Fig. 4.68 was attributed to the causes previously
discussed. As shown in Figs. 4.65-4.67, the deflection response for the unloaded girders occurred
between the limits established by the f i - and pinned-end analytical models.
Symmetrical deflection behavior, as required by the law of reciprocal displacements, was
satisfied for both the analytical and experimental results. Figures 4.65 and 4.67 show that the
horizontal deflection at point 6 due to a horizontal load of a given magnitude at point 5 equals the
horizontal deflection at point 5 due to a horizontal load of the same magnitude at point 6. Other
pairs of figures (not included) revealed similar results for other points.
Figures 4.69-4.73 show the horizontal load versus horizontal deflection relationships for both
the interior and north exterior P/C girders (BM2 and BM3 in Fig. 4.8) when the midspan X-brace
diaphragms without a strut (X2.1) (see Fig. 2 .7~) were installed in the bridge. The behavior for this
diaphragm configuration was very similar to the response observed both analytically and
experimentally for the X1.1 diaphragm arrangement (see Fig. 2.7a and 2.7b). As expected, the
horizontal deflection magnitudes for the loaded PIC girder increased when the horizontal strut was
removed from the X1.l diaphragms to form the X2.1 diaphragms. This effect can he observed by
comparing Figs. 4.64 and 4.69 for the interior girder and Figs. 4.68 and 4.73 for the north exterior
on magnitudes for the unloaded PIC girders decreased
when the horizontal strut was removed, as shown in a comparison of Figs. 4.65 and 4.70, Figs. 4.66
and 4.71, and Figs. 4.67 and 4.72 for BM3, BM1 and BM2, respectively.
4.3.2.3. Third-Point Intermediate Diaphragms
The horizontal load versus horizontal deflection responses at the bottom flange of the three
PIC girders, when the third-point, small channel, intermediate diaphragms (C1.3) were installed, are
shown in Figs. 4.74-4.76, corresponding to points 4-6, respectively. The horizontal load had been
applied on the bottom flange (point 5) at the midspan of the interior girder. These experimentally
measured deflection results are consistant with the analytically predicted displacements. The loaded
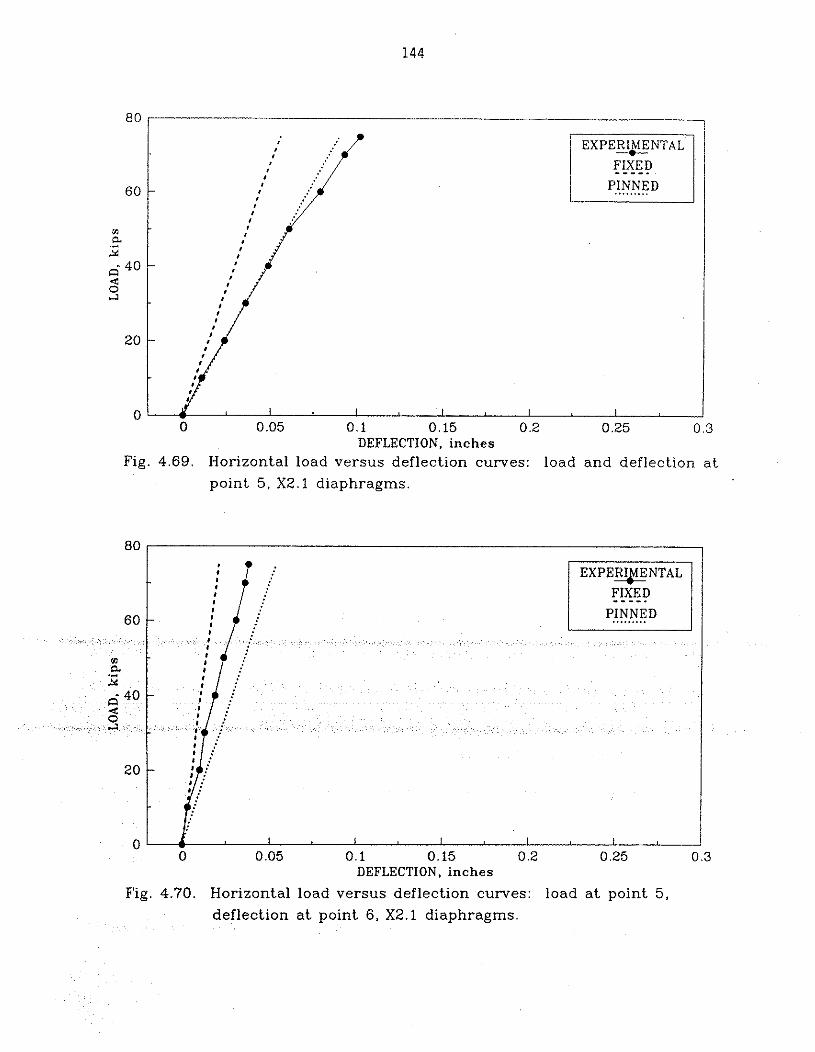
Fig. 4.69. Horizontal load versus deflection curves: load and deflection a t
point 5, X2.1 diaphragms.
FIXED
0 0 05 0 1 0.15 0 2 0 25 0 3 DEFLECTION, inches
Fig. 4.70. Horizontal load versus deflection curves: load a t point 5, deflection a t point 6, X2.1 diaphragms.
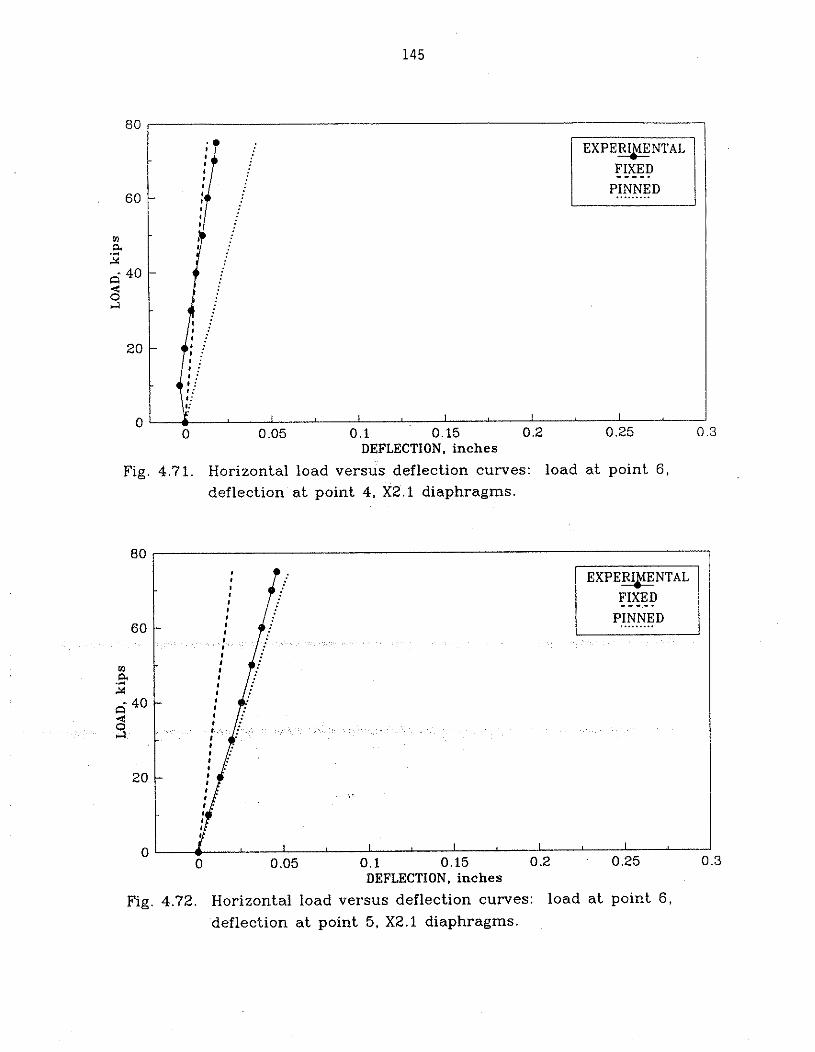
DEFLECTION, i n c h e s
Fig. 4.71. Horizontal load versus deflection curves: load a t point 6 ,
deflection a t point 4, X2.1 diaphragms.
60
V) a 2 6 40 4 2i
20
0 0 0 05 0.1 0 15 0.2 0.25 0 3
DEFLECTION, i n c h e s
Fig. 4.72. Horizontal load versus deflection curves: load a t point 6 ,
deflection a t point 5. X2.1 diaphragms
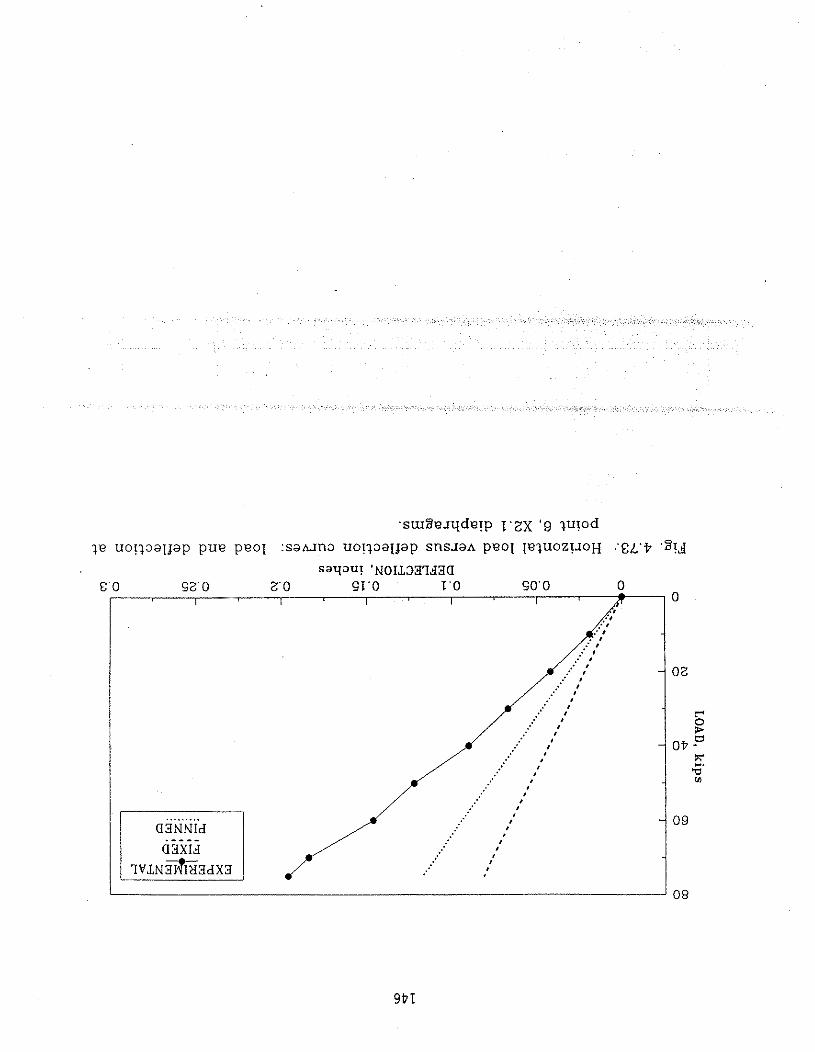
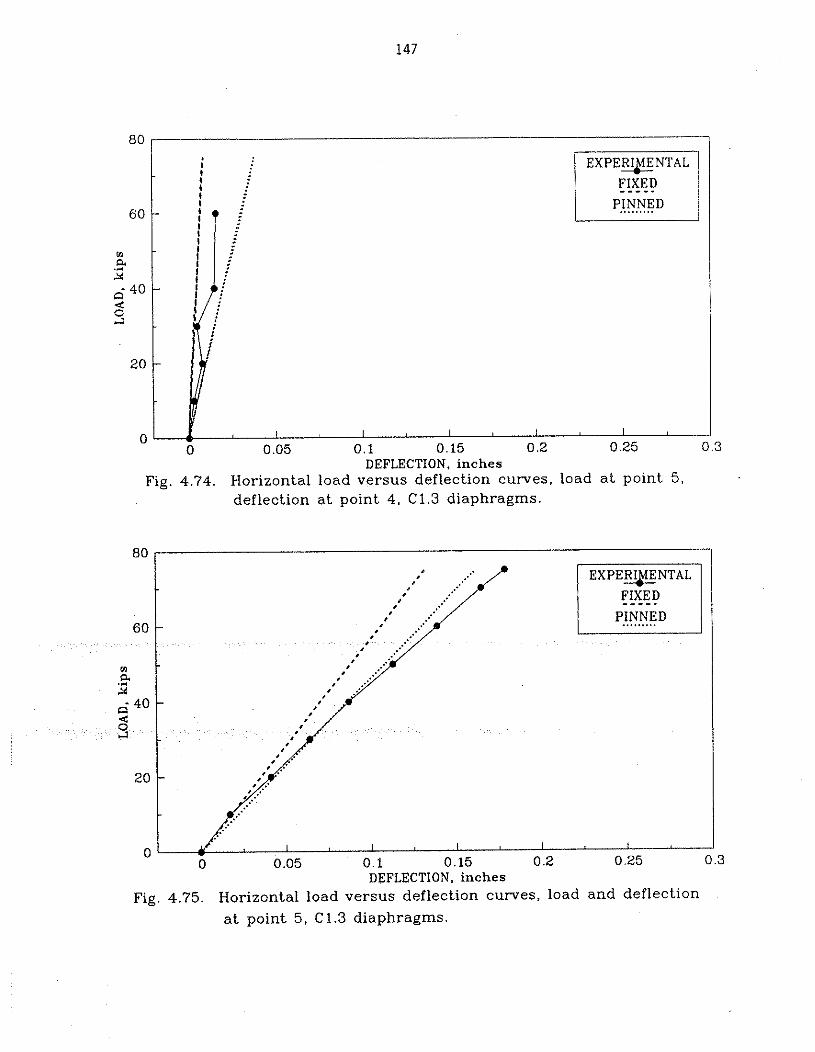
3 DEFLECTION, inches
Fig. 4.75. Horizontal load versus deflection curves, load and deflection a t point 5, C1 .3 diaphragms.
80
60
V1 a .- 3
6 4 0 -2
S
20
0
I I I I FIXED I I - I * : PINNED I
-
-
- I I I I I
0 0 . 0 5 0.1 0.15 0.2 0 . 2 5 0.3 DEFLECTION, inches
Fig. 4.74. Horizontal load versus deflection curves, load a t point 5, deflection at point 4, C1.3 diaphragms.
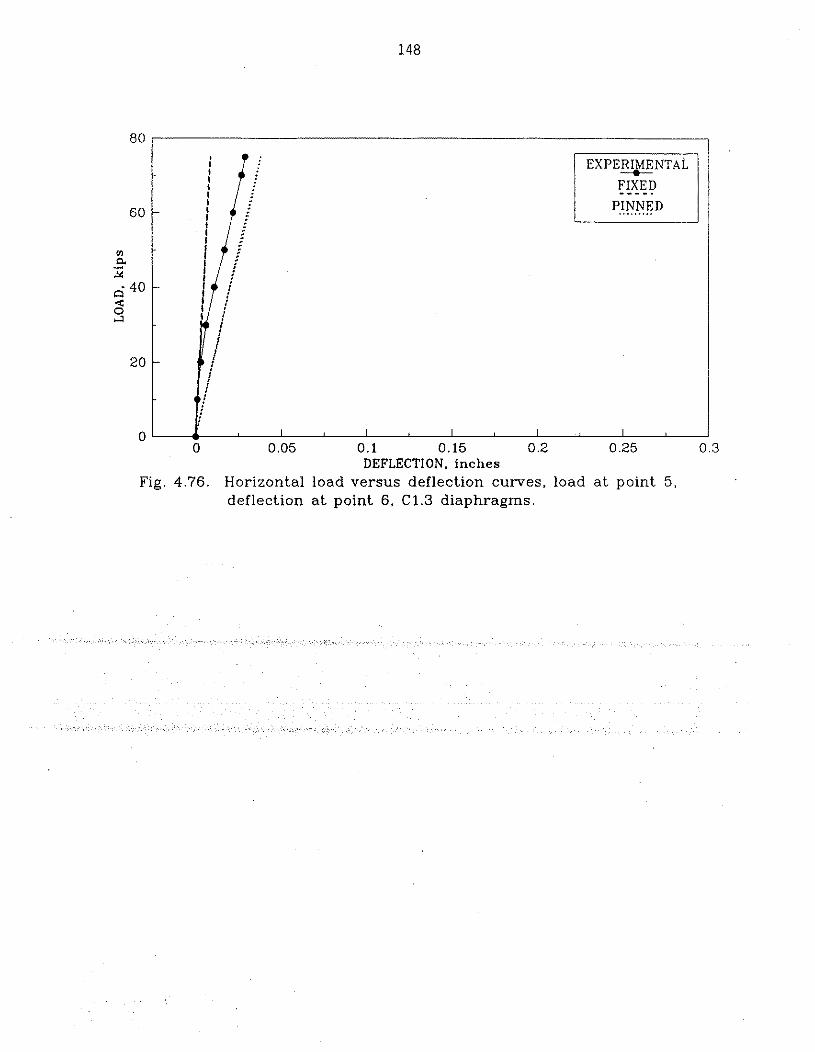

girder response for the experimental bridge was more flexible than the mathematical model behavior,
as shown in Fig. 4.75, for the reasons previously discussed.
Figures 4.77-4.79 show selected horizontal load versus horizontal deflection results for both
the experimental and analytical bridge models containing the third-point large channel intermediate
diaphragms ((2.3). The horizontal deflections are at points 4-6, respectively, when the horizontal
load was applied to the bottom flange of the north PIC girder (point 6). The experimentally
obtained horizontal deflections at point 6 (Fig. 4.79) appreciably digressed from the results predicted
by the pinned-end finite-element model, while the horizontal deflection responses (Figs. 4.77 and
4.78) of the unloaded girders more closely matched the analytical results. The overall displacement
behavior is consistent with the anticipated response considering the differences between the
experimental bridge and the analytical bridge model.
The displacement responses for the bridge containing third-point, reinforced concrete,
intermediate diaphragms (RC.3) are presented in Figs. 4.80-4.85. The flmations shown in the
experimental results for the horizontal load versus horizontal deflection for the loaded south exterior
PIC girder at point 4 (Fig. 4.80) was attributed to a displacement transducer malfunction and was
not an indication of the actual behavior of the bridge. As expected, the analytical models predicted
symmetric responses for the bridge, considering reciprocal displacements and geometric symmetry.
The construction details for the diaphragms and the longitudinal deck cracks prevented a precise
symmetric experimental response. Figure 4.85 shows the greatest divergence of the experimental
results from the theoretical solutions. However, this response was the characteristic experimental
deflection behavior associated with horizontal loads applied to the bottom flange of the north PIC
girder (BM3) when the reinforced concrete intermediate diaphragms (RC.1 or RC.3) were in place.
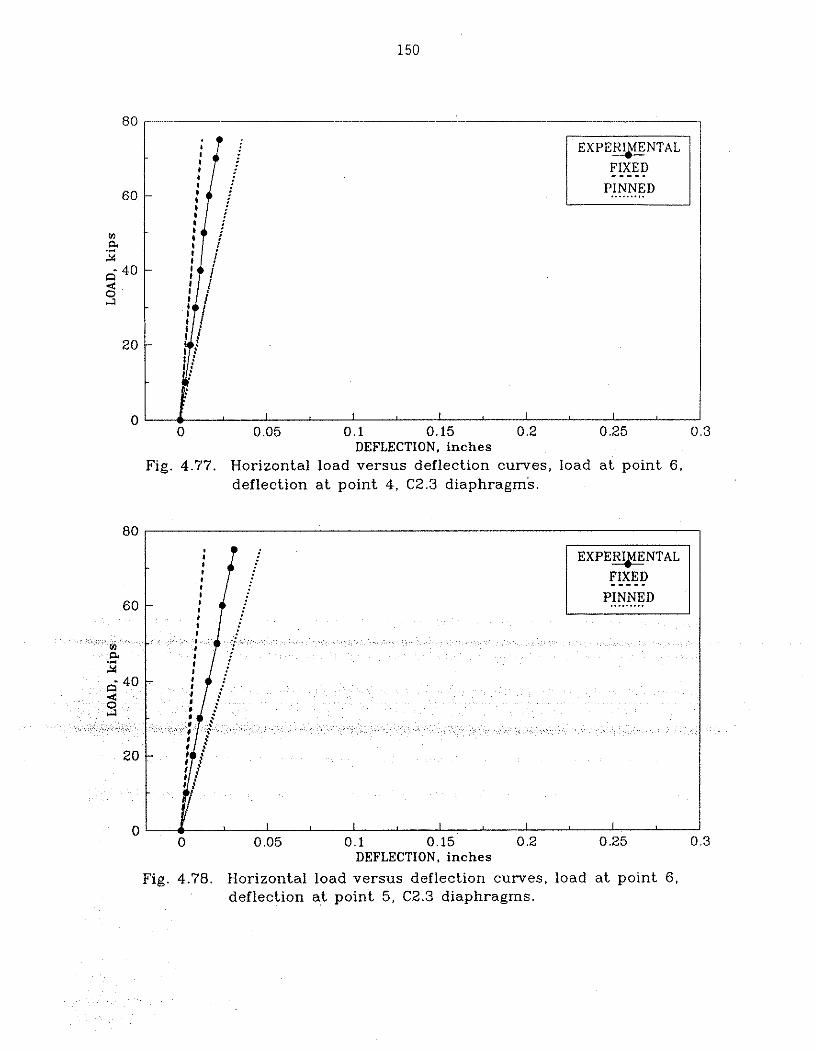
Fig. 4.77. Horizontal load versus deflection curves, load a t point 6 , deflection a t point 4, C2.3 diaphragms.
01 y I I I I I I 0 0.05 0.1 0.15 0.2 0.25 0 3
DEFLECTION. inches
Fig. 4.78. Horizontal load versus deflection curves, load a t point 6, deflection a t point 5, C2.3 diaphragms.
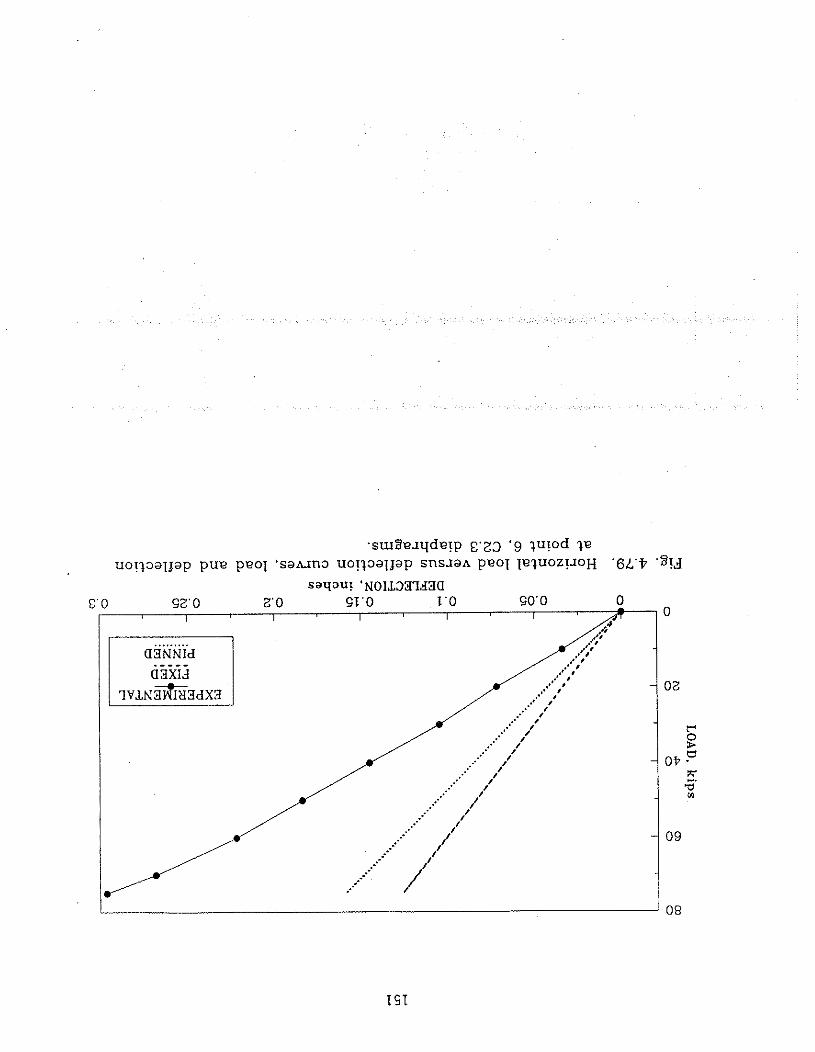
.su18e~qde!p 6.23 '9 ?u!od 3'2 uo!laaljap pue p ~ o l 'sa~.~n:, uo1laaljap snsJan. peol le?uoz!JoH .6~37 9 1 ~
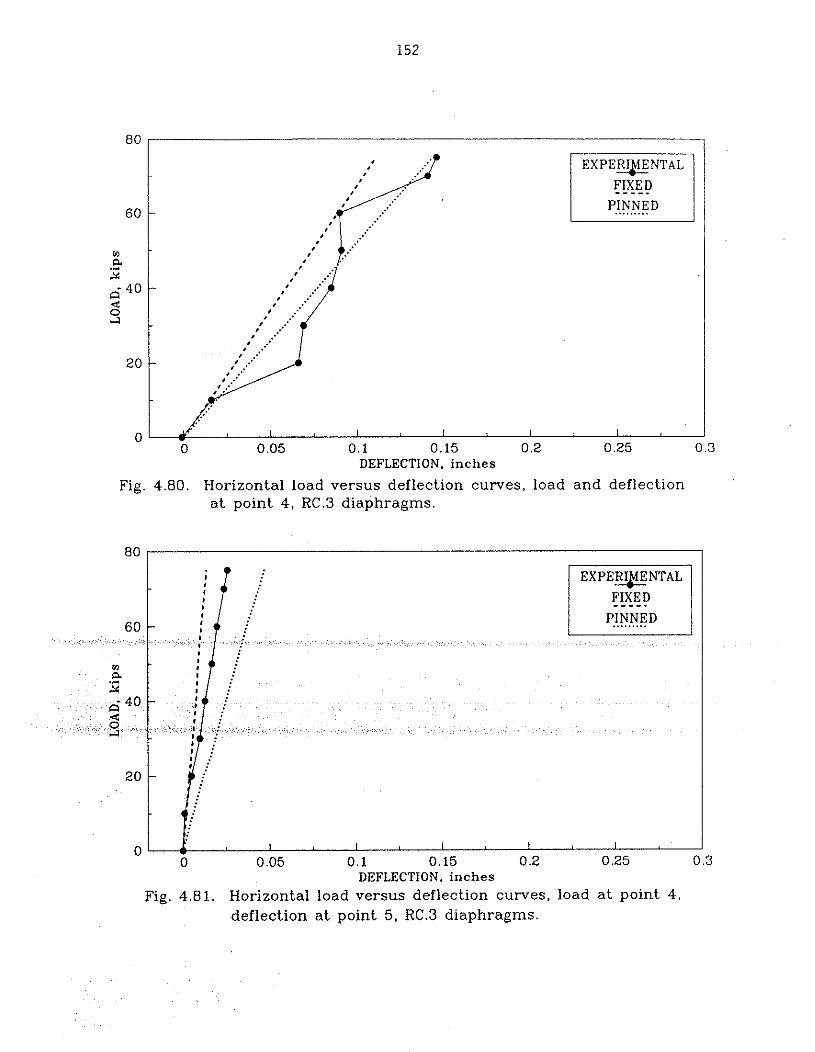
DEFLECTION, inches
Fig. 4.80. Horizontal load versus deflection curves, load and deflection a t point 4, RC.3 diaphragms.
0 0.05 0.1 0 . 1 5 0.2 0 . 2 5 0 . 3 DEFLECTION, inches
Fig. 4.81. Horizontal load versus deflection curves, load a t point 4, deflection a t point 5, RC.3 diaphragms.
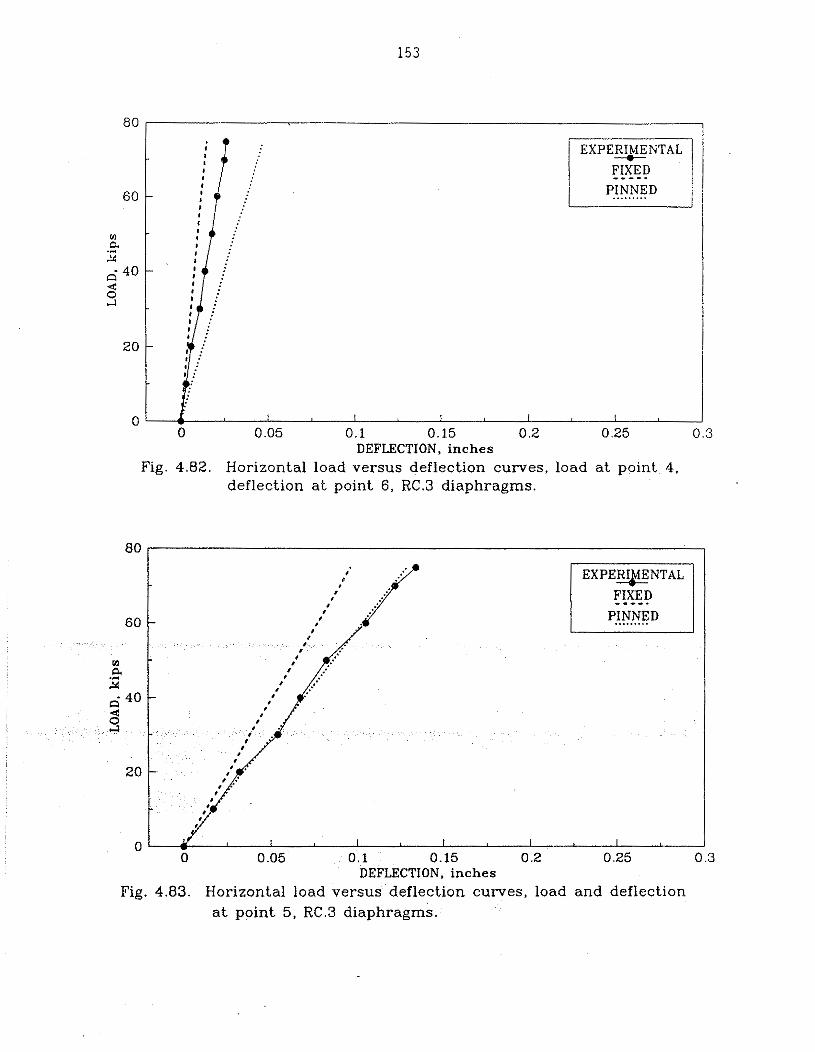
0 - I I I I I
0 0 05 0 1 0.15 0 2 0 25 0 3 DEFLECTION. inches
Fig. 4.83. Horizontal load versus deflection curves, load and deflection a t point 5, RC.3 diaphragms.
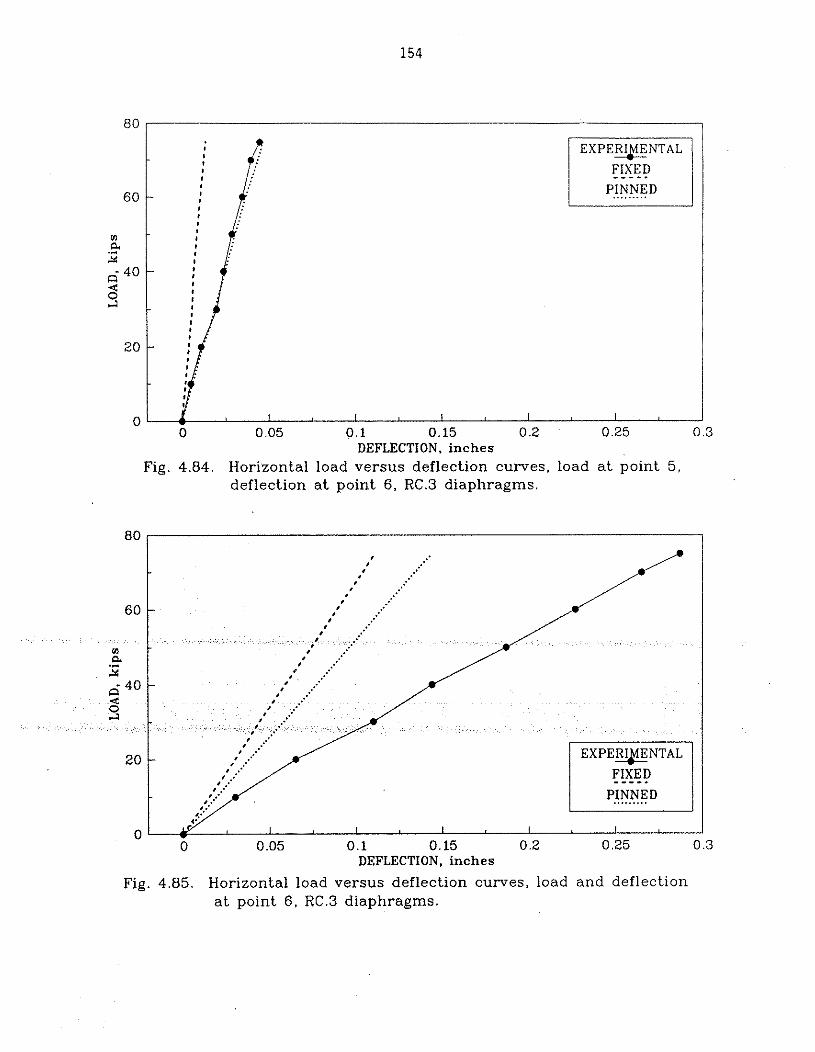
60 - PINNED
Vi a 4
40 - -z 2
20 -
0 - I I I I I
0 0.05 0.1 0.15 0.2 0.25 0.3 DEFLECTION, inches
Fig. 4.84. Horizontal load versus deflection curves, load a t point 5. deflection at point 6, RC.3 diaphragms.
Fig. 4.85. Horizontal load versus deflection curves, load and deflection a t point 6 , RC.3 diaphragms.
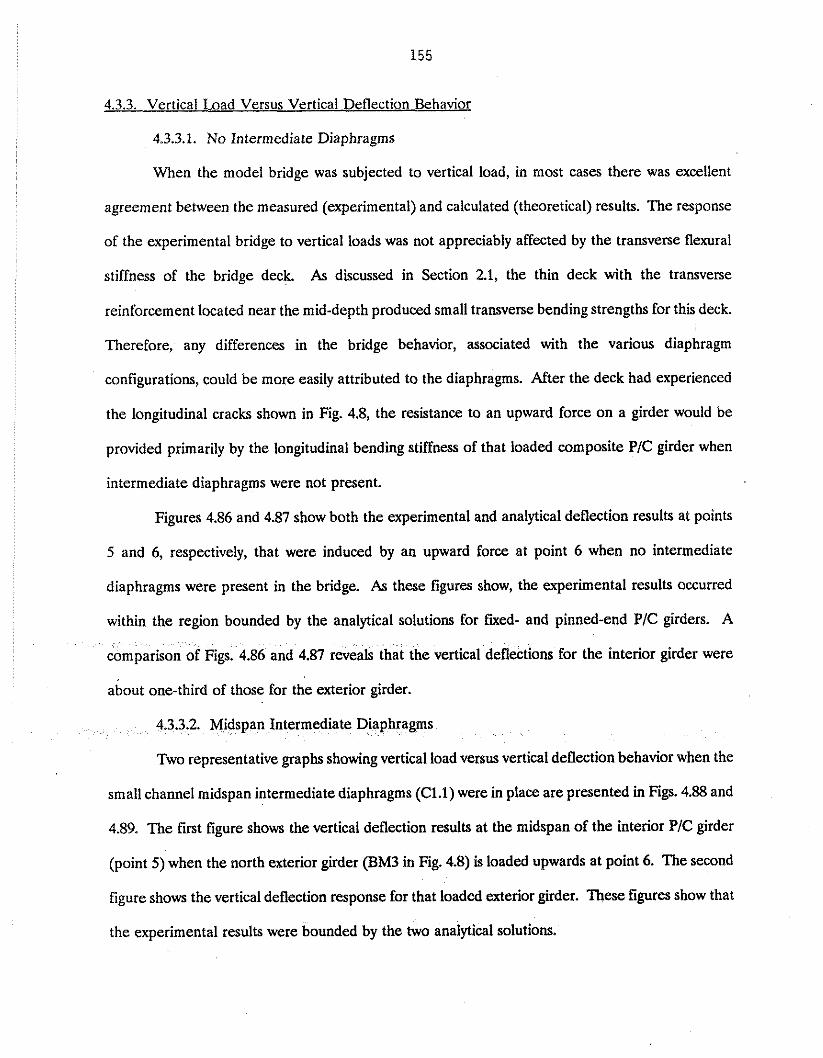
4.3.3. Vertical Load Versus Vertical Deflection Behanor
4.3.3.1. No Intermediate Diaphragms
When the model bridge was subjected to vertical load, in most cases there was excellent
agreement between the measured (experimental) and calculated (theoretical) results. The response
of the experimental bridge to vertical loads was not appreciably affected by the transverse flexural
stiffness of the bridge deck As discussed in Section 2.1, the thin deck with the transverse
reinforcement located near the mid-depth produced small transverse bending strengths for this deck.
Therefore, any differences in the bridge behavior, associated with the various diaphragm
configurations, could be more easily attributed to the diaphragms. After the deck had experienced
the longitudinal cracks shown in Fig. 4.8, the resistance to an upward force on a girder would be
provided primarily by the longitudinal bending stiffness of that loaded composite PIC girder when
intermediate diaphragms were not present.
Figures 4.86 and 4.87 show both the experimental and analytical deflection results at points
5 and 6, respectively, that were induced by an upward force at point 6 when no intermediate
diaphragms were present in the bridge. As these figures show, the experimental results occurred
within the region bounded by the analytical solutions for fixed- and pinned-end PIC girders. A
compari .87 reveals that the vertical deflections for the interior girder were
about one-third of those For the exterior girder.
Midspan Intermediate Diaphragms
Two representative graphs showing vertical load versus vertical deflection behavior when the
small channel midspan intermediate diaphragms (C1.l) were in place are presented in Figs. 4.88 and
4.89. The first figure shows the vertical deflection results at the midspan of the interior PIC girder
(point 5) when the north exterior girder (BM3 in Fig. 4.8) is loaded upwards at point 6. The second
figure shows the vertical deflection response for that loaded exterior girder. These figures show that
the experimental results were bounded by the hvo analytical solutions.
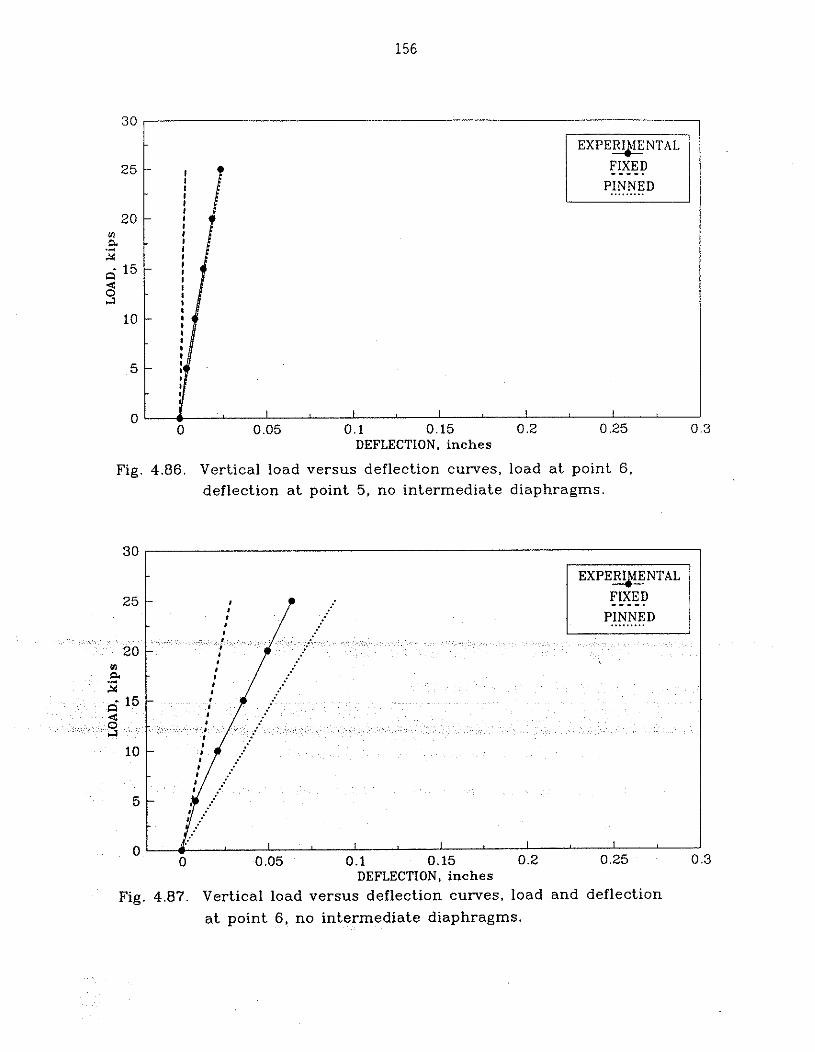
Fig. 4.86. Vertical load versus deflection curves, load a t point 6.
25
20 V1 a .* 3
6 15 u S
10
5
0
deflection a t point 5, no intermediate diaphragms.
- FIXED ----. PINNED
-
-
-
-
- - I I I I I
0 0.05 0.1 0.15 0.2 0 25 0 3 DEFLECTION, inches
0 0.05 0.1 0.15 0.2 0 25 DEFLECTION, inches
Fig. 4.87. Vertical load versus deflection curves, load and deflection
a t point 6, no intermediate diaphragms.
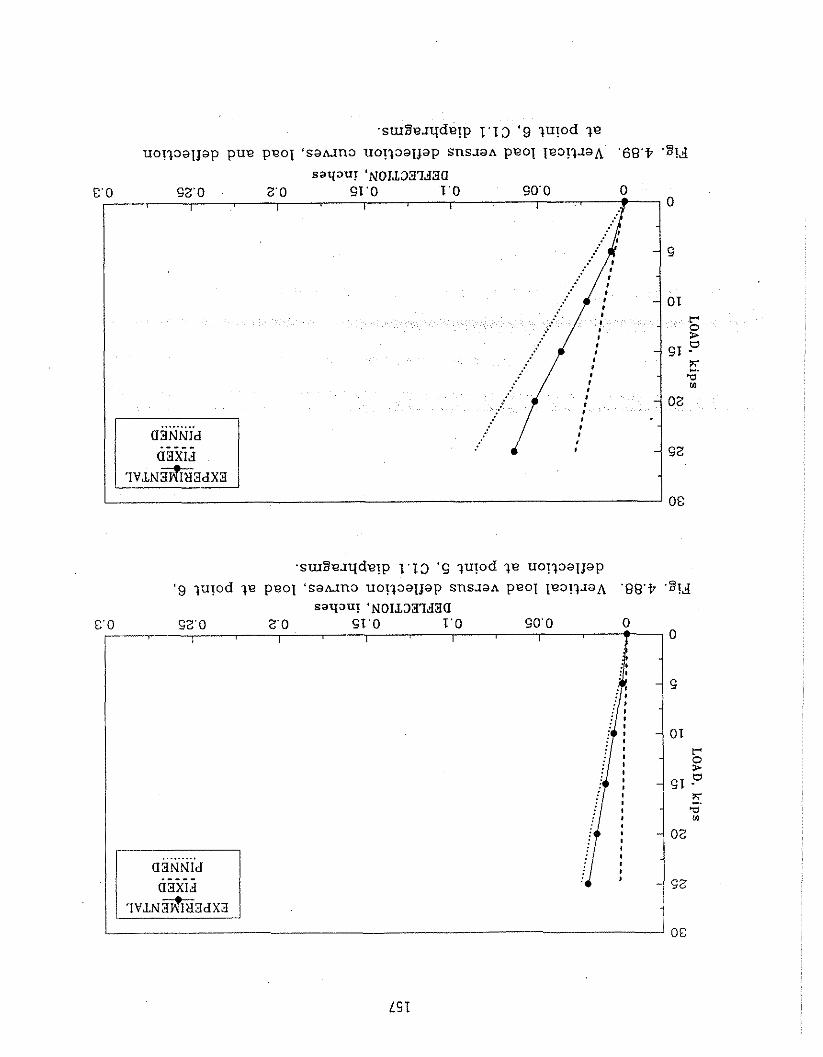
,sur2e~yde!p 1 . ~ 3 '9 lu!od -+e u o ~ l ~ a l j a p pulz plzol ' s a u n a uo!laaijap snsJaA peol Iea!l-xaA '6Q'V ,8!d
The vertical deflection response characteristics of the model bridge with the midspan
reinforced concrete diaphragms (RC.l) in place and vertical load at points 4, 5, and 6 are shown in
Figs. 4.90, 4.91, and 4.92, respectively. A comparison of the results for the exterior girders shown
in Figs. 4.90 and 4.92 reveals analytically predicted symmetrical responses for both the fured- and
pinned-end models and nonsymmetrical, experimentally measured responses. For the exterior
girders, the experimental results were within reasonable agreement with the analytical results. For
the interior girder (Fig. 4.91), the experimental deflections were significantly larger than the
deflections predicted by the analytical models. The deflection differences can be attributed to the
presence of the longitudinal cracks in the bridge deck.
An upward force applied to the bottom flange of the interior girder (BM2 in Fig. 4.8) at the
midspan of the bridge will cause Cracks 2 and 3a, shown in Fig. 4.8a, to open and Cracks 1 and 3b
to close. The presence of Cracks 2 and 3a in the slab span between BM2 and BM3 form a linkage;
therefore, the transverse flexural stiffness of this portion of the bridge deck will be significantly
smaller than the transverse flexural stiffness of the portion of the bridge deck between BM1 and
BM2. As previously noted, the analytical models did not involve deck cracking; thus, the predicted
deflection responses were for a structure that was stiffer than the actual experimental bridge. A
and 4.92 reveals
at the interior girder response produced significantly smaller deflections than those associated with
e loading of the exterior girders. This response was anticipated, since a vertical force applied to
the interior girder will cause a symmetrical uplift on the entire bridge structure. The absence of deck
and diaphragm continuity on the one side of an exterior girder will produce a more flexible
displacement response for that girder. A comparison of the experimental deflection results shown
in Figs. 4.90 and 4.91 and in Figs. 4.91 and 4.92 reveals that the measured vertical deflection
magnitudes were not significantly affected by which PIC girder was vertically loaded. This behavior
was attributed to the location of the longitudinal bridge deck cracks.
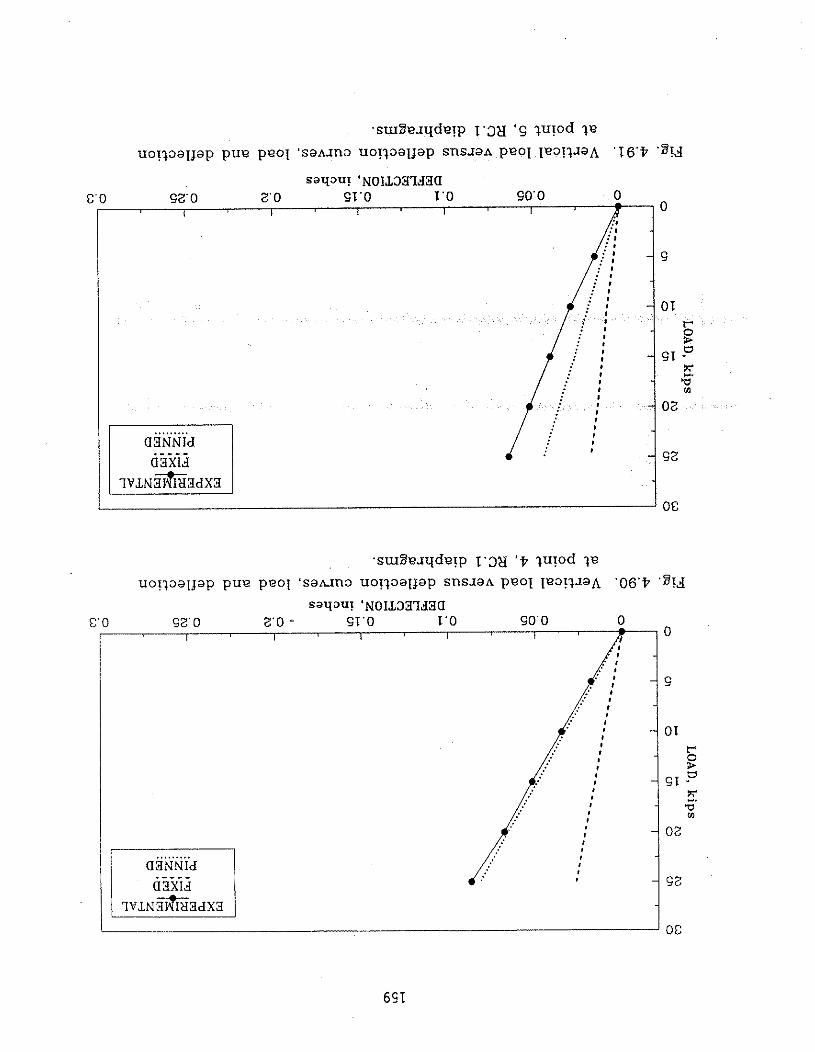
uoqaa~jap pue peoI 'saun:, u o ~ a a ~ j a p sns.xaA peol Iea!l-raA '06'9 , 8 ! ~
saqau! 'NOIL337dBa E O GZ 0 Z'O , 21'0 1'0 90'0 0
I I I I
-
-
-
-
. . . . . . . . . a3NNId .---- a3x1.i -
?vti;l~3%3d~3 1
0
S
01 r i?
GI 5 .o 0)
OZ
SZ
OE
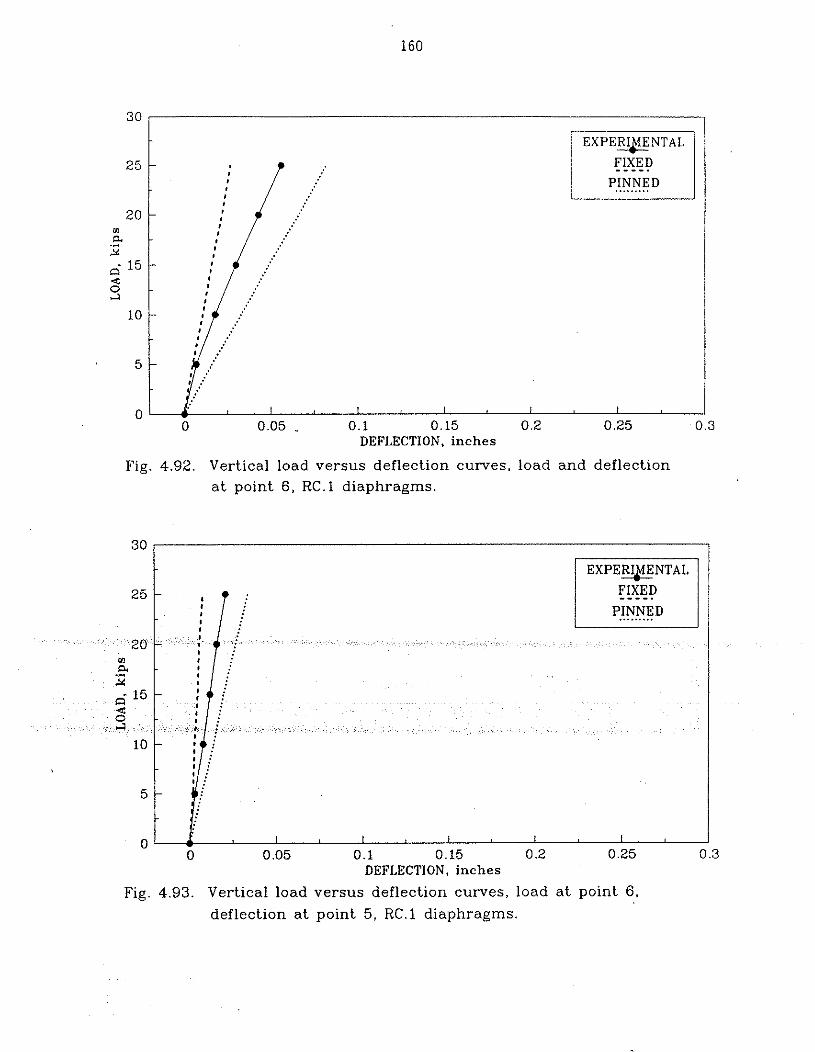
Fig. 4.92. Vertical load versus deflection curves, load and deflection
30
25
20
15
l o
5
0
a t point 6, R C . l diaphragms.
- FIXED PINNED
-
-
-
-
- I I I I
/ FIXED / / ----.
0 0.05 , 0.1 0.15 0.2 0.25 0.3 DEFLECTION. inches
DEFLECTION, inches
Fig. 4.93. Vertical load versus deflection curves, load a t point 6,
deflection a t point 5, R C . l diaphragms.
A typical vertical load versus vertical deflection response for an unloaded PIC girder is shown
in Fig. 4.93; as may be observed, the experimental results were bounded by the analytical results.
4.3.3.3. Third-Point intermediate Diaphragms
When diaphragms were located at the third points of the bridge span, the response
characteristics for vertical load versus vertical deflection were similar to those obtained when the
diaphragms were at the midspan. Therefore, only two figures have been presented to illustrate the
vertical deflection behavior for diaphragms at the third points in the bridge. Figures 4.94 and 4.95
present the analytical and experimental deflection results for an unloaded interior girder and loaded
exterior girder, respectively, when the third-point, reinforced concrete diaphragms (RC.3) were in
place. A comparison of Figs. 4.94 and 4.93 and Figs. 4.95 and 4.92 reveals almost identical vertical
load versus vertical deflection behaviors. Therefore, the response of the bridge for reinforced
concrete diaphragms at either the third points or at the midspan of the bridge was essentially the
same. Similar results occurred for the other types of intermediate diaphragms.
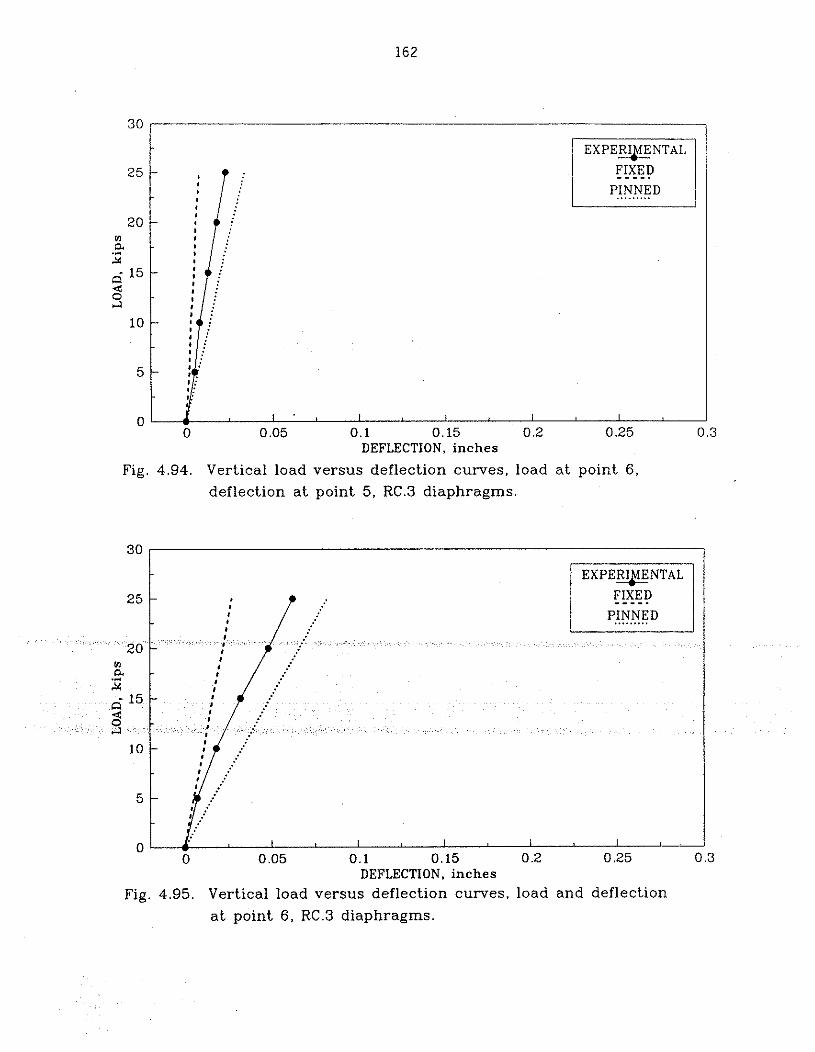
Fig. 4.94. Vertical load versus deflection curves, load a t point 6, deflection a t point 5, RC.3 diaphragms.
0 0.05 0.1 0.15 0.2 0.25 I DEFLECTION, inches
Fig. 4.95. Vertical load versus deflection curves, load and deflection
a t point 6, RC.3 diaphragms.
5. SUMMARY AND CONCLUSIONS
5.1. Summary
This report summarizes the research that was conducted for the purpose of determining
whether steel intermediate diaphragms of some conventional configuration are structurally equivalent
to the reinforced concrete intermediate diaphragms that are currently being used by the Iowa DOT.
The research included a review of previous investigations related to the performance of PIC girder
bridges subjected to lateral forces, a survey of design agencies to obtain information on intermediate
diaphragms and lateral impacts, three-dimensional, finiteelement analysis of the model PIC girder
bridge, and extensive experimental testing of a full-scale PIC girder bridge without intermediate
diaphragms and with four types of intermediate diaphragms positioned at either the one-third points
along the span or at the midspan.
A review of the literature revealed that although there have been numerous investigations
on the performance of intermediate diaphragms when a bridge is subjected to vertical loadings, very
little research has been conducted on the performance of intermediate diaphragms when the bridge
is subjected to lateral loadings, for example, when vehicles with loads too high to pass under the
superstructure strike the bottom flange@) of the PIC girder(s).
An in-depth questionnaire was sent to 63 design agencies in the United States and Canada;
responses were obtained from 86% of those questioned. The survey contained 33 multiple choice
questions which addressed topics such as the type of diaphragm used, diaphragm location and depth,
connection details to the PIC girders and deck, limitations on the use of either steel or RIC
intermediate diaphragms, design criteria for lateral impact loads, approximate occurrence of
overheight vehicle-bridge collisions, and categorization of the type and extent of bridge damage
caused by over-height loads. The respondents were asked to provide plans and specifications of
intermediate diaphragms used in their jurisdiction. Ninety-six percent of the respondents use cast-in-
place concrete diaphragms when the bridge is located above a highway or navigable waterway; 23%

of these respondents also spec$ steel channels. Over 90% of those responding stated that the
design of their standard diaphragms and connections is by a "rule of thumb" approach.
A finite-element model of the model bridge was developed using ANSYS. The mesh size
was selected to provide nodal points at the locations of the intermediate diaphragms. Each type and
configuration of intermediate diaphragm tested was modeled by using finite elements. The analytical
model was subjected to both horizontal and vertical loads at the midspan of each beam. Any
combination of horizontal and vertical loads could be obtained by the superposition of the results
of the respective cases of loading. Construction details, that is, ties between the end diaphragm and
the abutments, between the PIC girders and the end diaphragms, and between the deck and the end
diaphragm, resulted in considerable end restraint. To "bracket" experimental results, both fixed- and
pinned-end conditions were modeled and analyzed. The effects of the prestressing forces in the PIC
girders and the dead load of the bridge were not considered in the analysis, so that the results of the
analytical study could be compared directly with the experimental data.
A full-scale, simple-span, PIC girder bridge model containing three 40-ft long PIC beams on
6-ft centers was constructed and tested to evaluate the performance of intermediate reinforced
concrete and steel diaphragms currently being used by the Iowa DOT and other intermediate steel
intermediate diaphragm
effectiveness of intermediate diaphragms in distributing lateral forces. A secondary study involved
an analysis of vertical load distribution. Thus, the model was subjected to both horizontal and
vertical loads applied to the bottom flange of each of the girders. The loads were applied at the
one-third points along the bridge span and at the midspan. Several tests were conducted by using
combined vertical and horizontal forces to verify that the results of the individual vertical and
horizontal load tests could be superimposed to obtain the combined effects. The deck, girders, and

diaphragms were instrumented with strain gages to measure strains. Deflections of the bottom
flanges of the girders were monitored with direct current displacement transducers; the deflection
of the south deck edge was monitored with dial gages. A computer-controlled data acquisition
system was used to measure and record the strains and deflections.
The deflection results were extensively analyzed to establish the response characteristics of
the experimental bridge when horizontal or vertical loads were applied. Graphs of load versus
deflection have been presented to illustrate the deflection behavior associated with the various types
and locations of intermediate diaphragms. The experimentally measured deflections were compared
to the analytically predicted deflections obtained from a Tied- or pinned-end finite-element model.
In most instances, the analytical results bounded the experimental results, as would be expected,
since the rotational restraint at the ends of the PIC girders would be between the two types of
idealized end conditions. However, in some instances, the experimental deflections were outside of
the limits established by the analytical predictions; this behavior was due to the differences between
the analytical model and the experimental model bridge. The characteristics in the experimental
bridge that could not be modeled analytically included the longitudinal deck cracks, connection
slippage and prying that occurred between the steel channel diaphragms and PIC girder webs, and
the elongation of the tendons, which tied the W C intermediate diaphragms and PIC girders together.
Also, the connection between the PIC girders and the W C deck was approximated by connecting all
common nodes between the top of the girders and the bottom of the deck.
5 2 Conclusions
The conclusions presented in this section were formulated from the responses to the
questionnaire, and from the results obtained from both the analytical and experimental bridge
models. Recall that the bridge model contained three, Type A, PIC girders (32 in. total depth)
spaced 6-ft on centers and a 4-in.-thick R/C deck. Therefore, the large channel C2, the X-brace plus
strut XI, and the X-brace without stmt X2, intermediate diaphragms support a large portion of the
PIC girder depth. This obviously is not the case for the larger PIC girders. Tests involving the small
channel diaphragm C1 were conducted to address some of the issues related to diaphragm depth
versus girder depth. Also, the depth of the Type A PIC girder resulted in small angles of inclination
in the diagonal members of steel diaphragms which contained X-bracing. When the bridge model
was subjected to horizontal loading, the diagonal members of the X-brace were primarily subjected
to axial loading. In the case of larger PIC girders in addition to the axial load, the diagonal members
would be subjected to increased bending.
The following conclusions were developed as a result of this investigation:
1. The X-brace plus strut intermediate diaphragms (Xl) were determined to be essentially
structurally equivalent to the R/C intermediate diaphragms.
2. Vertical load and horizontal load distributions are affected by end restraint; however,
vertical load distribution is essentially independent of the type and location of
intermediate diaphragms, while the horizontal load distribution is a function of
diaphragm type and location.
3. The vast majority of the state departments of transportation require that RIC
intermediate diaphragms be used when traffic can pass beneath a PIC girder bridge.
indicated that steel channel
e as those
used in practice) resulted in significant rotational end restraint for vertical and horizontal
loading.
5. The channel-shaped steel diaphragms experienced slippage in the connections to the PIC
girder webs because of the presence of the horizontally slotted holes. Even though the
high-strength bolts were tightened by the turn-of-the-nut method, the frictional resistance
offered by the clamping force in the connection was exceeded by the applied horizontal

force. As expected, the small channel diaphragms (Cl) connected with 2 bolts at each
end experienced connection slippage at magnitudes of horizontal load that were smaller
than those that cause slippage for the large channel diaphragms (C2) connected with 4
bolts at each end.
6. The finite-element model with fixed- or pinned-ends for the PIC beams generally
bounded the experimental results. In some instances, the analytical model predicted
smaller deflections than were measured; these differences were due to the mathematical
model being stiffer than the test bridge. Construction details between the PIC girders
and the bridge deck and between the PIC girders and the intermediate diaphragms can
not be accurately modeled. Also the deck cracks, which could not be included in the
finite-element model, reduced the bridge stiffness.
7. When the intermediate diaphragms were located at the midspan of the bridge and when
horizontal loads were applied to the outside face of the bottom flange of the exterior
girder at its midspan, the measured horizontal deflection at the load point increased as
the diaphragm configuration was changed from RC.1 to X1.l, X1.l to X2.1, X2.1 to
(2.1, and C2.1 to C1.l. As expected, the greatest horizontal deflection of the loaded
exterior girder occurred when no interior diaphragms were present.
8. The midspan horizontal deflection of a horizontally loaded PIC girder increased, while
the horizontal deflection of the unloaded PIC girders decreased, when the horizontal
strut was removed from the X1.l diaphragms to form the X2.1 diaphragms.
9. For the load levels applied during most of the experimental tests of the model bridge,
essentially linear load versus deflection behavior was observed.
10. A large percentage of the horizontal deflection of a horizontally loaded girder in the
experimental bridge was caused by the rotation of the girder about its longitudinal axis,
rather than by the deflection of the bridge as a whole, when an exterior girder was

loaded and any type of intermediate diaphragms were present. The same was true when
the interior girder was loaded and either the shallow or deep channel diaphragms were
in place.
11. Symmetric load versus deflection behavior was confirmed experimentally, except in those
instances where the connection details and deck cracks directly affected the bridge's
response.

v e p
Jeaqs L~M-OM papaau aqq jo amos u!elqo 07 pasn aq plno3 (suo!le3g!pom aae!~do~dde qap)
'maisis %u!peol [eluoz!~oq aqa pue a%ppq lapow aq? 30 smeaq 313 aqJ, .siuamaIa asaql jo
salnl!ej Jeaqs ,%u!qx~nd,, l u a ~ a ~ d 01 sqam ~ap1!8 3/d aqa jo qi%uass Jeaqs be&-OW aql uo
papaau s! e l e a -sru%e~qde!p 30 ase3 aql u! sf aJaql ueql slap^!% 3/d aqi jo SqaM aql pue
iay3elq uo!l~auuo.s w%e~qde!p aql uaamtaq eale laeluo9 ssal s! alaq1 'sw%elqde!p Iaais q a ! ~ '2
'611n31~3!p 1emIujw q i y ~ (suo!lein%rJuo3 iaqio lo) sm%elqde!p padeqs-.>I aqi uo paurelqo
aq pp03 eiep 'azpgq lap'!% 3/d lapow %u!lspta aqi q r ! ~ .paisa1 uaaq amq sm%elqde!p
pals 30 suo~1em8guo~ je3g3e~d Ile Llle!luassa 'sm%e~qde!p padeqs-.>I 30 uo!ldagxa ayl q l ! ~ '1
S 3 I w cImNxLNm mcrN.mwImm '9
7. REFERENCES
American Association of State Highway and Transportation Officials. Standard Specifications for Highway Bridges 14th Edition. Washington: American Association of State Highway and Transportation Officials, 1989.
American Association of State Highway and Transportation Officials. Interim Specifications-- Bridge--1991. Washington: American Association of State Highway and Transportation Officials, 1991.
Bakht, B., and F. Moses, "Lateral Distribution Factors for Highway Bridges" ASCE, Journal of Structural Engineering, Vol. 114, No. 8 (August 1988) pp. 1785-1803.
Cheung. M. S, R. Jategaonkar, and L G. Jaeger, "Effects of Intermediate Diaphragms in Distributing Live Loads in Beam-and-Slab Bridges," Canadian Journal of Civil Engineering, Vol. 13, No. 13 (June 1986), pp. 278-292.
De Salvo, G. J, and J. A. Swanson, ANSYS Engineering Analysis Sjstem User's Manual, Vols. I and II, Houston, Penn.: Swanson Analysis System, Inc., 1985.
Kostem, C. N, and E. S. deCastro, "Effects of Diaphragms on Lateral Load Distribution in Beam-Slab Bridges," Transportation Research Record 903, Transportation Research Board, 1977, pp. 6-9.
Kulicki, J. M, D. R. Mertz I. M. Friedland, and NCHRP 12-33 project team. "Proposed LRFD Bridge Design Code," Modjeski and Masterr Harrisburg, Penn, 1991.
McCathy, W, K. R. White, and J. Minor, "Interior Diaphragms omitted on the Gallup East Interchange Bridge--Interstate 40," JournalofCi~l Engiheering Design, Vol. 1, No. 1, (1979) pp. 95-112.
Shafer, M. W. "Lateral Load Resistance ofeDiaphragms in Prestressed Concrete Girder Bridges." Master's thesis (in preparation), Iowa State University, h e $ 1991.
10. Shanafelf G. 0, and Horn, W. B, "Damage Evaluation and Repair Methods f o ~ Prestressed Concrete Bridge Membem" NCHRP Report 226, Nov. 1980, pp. 66.
11. Sengupta, S, and J. E. Breen, "The Effect of Diaphragms in Prestressed Concrete Girder and Slab Bridges," Research Report 158-1e Project 3-5-71-158 Center for Highway Research, The University of Texas at Austin, October 1973.
12. Sithichaikasem, S, and W. L. Gamble, "Effects of Diaphragms in Bridges with Prestressed Concrete I-Section Girders," CivilEnngineerhg Studim No. 383, University of Illinois, Urbana, 1972.
13. Wasset W. G, "Analytical and Experimental Investigations of Shell Structures Utilized as Bridges", Ph.D. diss, Iowa State University, Ames, 1991, pp. 162.

14. Wong, A. Y. C., and W. L Gamble, "ECfects of Diaphragms in Continuous Slab and Girder Highway Bridges," Civil Engineering Studies, Structural Research Series No. 391, University of Illinois, Urbana, 1973.
8 ACKNOWLEDGMENTS
The study presented in this final report was conducted by the Engineering Research Institute
of Iowa State University and was sponsored by the Iowa Department of Transportation, Highway
Division, through the Highway Research Advisory Board.
The authors wish to thank William Lundquist and John Harkin from the Iowa Department
of Transportation for their support of the research work on diaphragm effectiveness in distributing
lateral loads. Also, an expression of appreciation is extended to two corporate representatives for
their support of the research conducted. Donald Henrich, general manager of Iowa Prestressed
Concrete, Inc. (Iowa Falls, IA) provided the three A38 and the D PIC Beams, which were an integral
part of the experimental model bridge. Economy Forms Corporation (Des Moines, IA), provided
the metal forms for casting the abutments, end diaphragms, and the bridge deck. For their
contributions, the authors express their appreciation.
The authors acknowledge the assistance of Douglas Wood, Structural Laboratory Supervisor,
for his valuable contributions with the experimental program. Many students worked on the
construction of the model bridge. Those students who devoted a significant amount of time to the
project were Timothy Craven, Bret Farmer, Tony Jacobsen, Chris Maskrey, Amy Rechenmacher, and
Stephanie Young. Bret, Chris and Tony also assisted during the extensive testing of the bridge. The
authors greatly appreciated their help.
A significant contribution to the analytical investigations was provided by Wagdy Wassef who
developed the finite-element models and performed the analyses. For his important contributions
to the research work, the authors extend their sincere appreciation. Theresa Connor is to b e
thanked for her efforts in presenting both the analytical and experimental results in a graphical
format. The authors wish to thank Denise Wood, Structures Secretary, for typing this report.


DESIGN AGENCY QUESTIONNADRE RESULTS
The number in the parentheses ( ) represents the number of design agencies having that particular answer. The notes in the brackets [ ] are paraphrased comments from the respondents. An individual respondent's remarks are separated by a colon.
Part L General Prestressed Concrete Girder Bridge Geometry and Conditions
1. Has your state or agency ever specified intermediate diaphragms?
(51) Yes (Please complete the entire questionnaire)
( 1) No (Please stop here. Do complete questionnaire: however, please return the survey.)
2. Has your state or agency ever discontinued the use of intermediate diaphragms?
(10) Yes: When? Why?
[Unnecessary, - does not use AASHTO criteria: Not found beneficial in the load distribution or to the construction of concrete girder bridges: Nov. 1982, Except for overheads subject to high load impacts. Tests by others indicated diaphragms had little effect on live load distribution: 1975, Not needed when girders are under 50 ft. long: 1970, Their use was questionable: Early 701s, Due to research conducted by the University of Illinois indicating an adverse load redistribution between interior and exterior beams at location of intermediate diaphragms: Span Lengths less than 40 ft., not required by AASHTO: Feb. 1979, Research had indicated that they contribute very little to the overall performance of structures: 1980's, Research results indicated that diaphragms have little effect after composite slab was placed on beams.]
(40) No
Note: If you answered yes to this question, please answer the remaining questions with respect to the last time intermediate diaphragms were used.
3. Is your state or agency currently using intermediate diaphragms?
(47) Yes
( 9 ) No
4. Roadway classification for which intermediate diaphragms are used:
( 2) Primary roads only ( 2) Secondary roads only (41) Both primary and secondary roads

( 9) Other (please specify) [PIC bridges span wetlands only: Overhead structures over any railroad or roadway: Spans over 80 ft. are box beams, I-beams for any roads: Spans over 120 ft. to stabilize girders during erection: All roads: Interstate and off system (county): All Highways.]
5. What types of intermediate diaphragm material is permitted by your state or agency when the bridge is above a m? (please check all that apply)
(50) Cast-in-place concrete ( 4) Precast concrete (12) Steel channel ( 2) Steel I-shape ( 4) Steel truss ( 7) Steel cross-bracing ( 2) Other (please specify) [Bent plate: No other configuration has been requested by
contractors.]
6. What types of intermediate diaphragm material is permitted by your state or agency when the bridge is above a navieable waterway? (please check all that apply)
(44) Cast-in-place concrete ( 4) Precast concrete ( 9) Steel channel ( 1) Steel I-shape ( 3) Steel truss ( 5) Steel cross-bracing ( 4) Other (please specify) [Bent plate: No other configuration has been requested: No
navigable waterways of any consequence: Generally not applicable in - -1
7. What types of intermediate diaphragm material is permitted by your state or agency when the bridge is above a railroad rieht of way? (please check all that apply)
( 4) Other (please specify) [Bent plate: No other configuration has been requested: In general, local railroads will not permit concrete superstructures.]
8. What types of intermediate diaphragm material is permitted by your state or agency when the bridge spans a grade separation and has no traffic (highway, water, or rail) of any type below the girders. (please check all that apply)
(48) Cast-in-place concrete ( 4) Precast concrete (13) Steel channel ( 2) Steel I-shape ( 4) Steel truss

( 7) Steel cross-bracing ( 2) Other (please specify) [Bent plate]
9. At what location(s) are intermediate diaphragms specified? (please check all that apply)
(27) AASHTO spacing requirements (22) Girder midspan for girder spans of - ft. or more [25:40:50:51:65:80:~80:40 to 90 ft.:
All spans] (14) Girder 113 points for girder spans of - ft. or more [50:60.80:>80:100 ft.] ( 5) Girder 114 points for girder spans of - ft. or more [75:90:100 ft.] ( 1) Centerline of traffic below ( 7) Other (please specify) 125 ft. maximum: None required when spans are less than 40 ft:
We had used all three <categories> in the past: Minimum of one at the midspan or 30 ft. maximum spacing: Centerline of spans of 40 ft. or more: Diaphragms are placed at midspan, 113 points or 114 points with a maximum spacing of 40 ft.: Midspan for spans over 50 ft.: Temporary diaphragms at 114 and 314 points of exterior girders only.]
PART IL General Diaphragm Geometry and Coloditions
1. What nominal depth cast-in-dace concrete intermediate diaphragm does your state or agency specify?
( 1) Cast-in-place intermediate diaphragms are not used ( 0) Full depth of girder ( 9) Over the girder web depth (between flanges) only (31) From the underside of the slab to the top of the girder bottom flange (or top of flared
portion of the bottom flange) ( 2) From the bottom of the girder to the bottom of the top flange (or bottom of the flared
portion of the top flange) (12) Other (please specify) [Midspan, 113 points, or 114 points with a maximum spacing of
of 40 ft.: From the underside of the slab to the bottom of the flared portion of the bottom flange: From the underside of the slab to the mid-depth of the web: Start the diaphragm 6 in. below the slab, and stop the diaphragm 9 in. from the bottom of the girder: Between the flared portions of the flanges: Done on an individual basis for each design: Bottom of the top flange to the top of bottom flange: 2 ft.-0 in. for AASHTO Type 111 and 1% 2 ft. - 6 in. for Types V and VI (mesured from top of beam).]
2. What nominal depth -concrete intermediate diaphragm does your state or agency specify?
(40) Precast concrete intermediate diaphragms are not used ( 0) Full depth of girder ( 3) Over the girder web depth (between flanges) only ( 1) From underside of the slab to the top of the girder bottom flange (or top of the flared
portion of the bottom flange) ( 0) From the bottom of the girder to the bottom of the top flange (or bottom of the flared
portion of the top flange) ( 4) Other (please specify) [Between the flared portions of the flanges.]
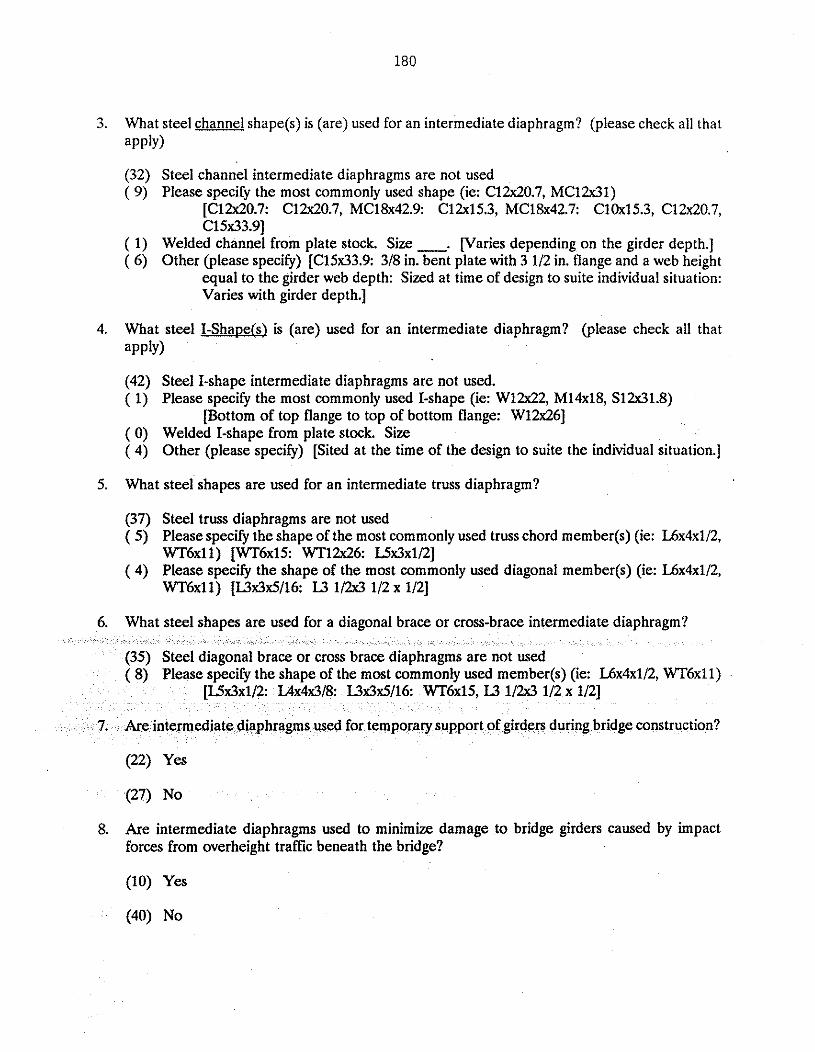
3. What steel channel shape(s) is (are) used for an intermediate diaphragm? (please check all that apply)
(32) Steel channel intermediate diaphragms are not used ( 9) Please specify the most commonly used shape (ie: C12x20.7, MC12x31)
[C12x20.7: C12x20.7, MC18x42.9: C12x15.3, MC18x42.7: C10x15.3, C12x20.7, C15x33.91
( 1) Welded channel from plate stock. Size-. var ies depending on the girder depth.] ( 6) Other (please specify) [C15x33.9: 318 in. bent plate with 3 112 in. flange and a web height
equal to the girder web depth: Sized at time of design to suite individual situation: Varies with girder depth.]
4. What steel I-Sha~e(s) is (are) used for an intermediate diaphragm? (please check all that apply)
(42) Steel I-shape intermediate diaphragms are not used. ( 1) Please specify the most commonly used I-shape (ie: W12x22, M14x18, S12x31.8)
W t t o m of top flange to top of bottom flange: W12x261 ( 0) Welded I-shape from plate stock. Size ( 4) Other (please specify) [Sited at the time of the design to suite the individual situation.]
5. What steel' shapes are used for an intermediate truss diaphragm?
(37) Steel truss diaphragms are not used ( 5) Pleasespecify the shape of the most commonly used truss chord member(s) (ie: L6x4x112,
WT6xll) [WT6x15: WT12x26: Ux3x1/2] ( 4) Please specify the shape of the most commonly used diagonal member(s) (ie: L6x4x112,
WT6xll) px3x5/16: L3 112x3 112 x 1/21
s used for temporary support of girders during bridge construction?
(22) Yes
8. Are intermediate diaphragms used to minimize damage to bridge girders caused by impact forces from overheight traffic beneath the bridge?
(10) Yes

PART nt Connection Details
1. How are intermediate cast-in- lace concrete diaphragms, that are in contact with the bottom of the slab, connected to the slab?
( 1) Cast-in-place concrete diaphragms are not used (14) Diaphragms not in contact with the slab ( 2) Not connected to the slab (14) Cast monolithically with the slab with dowels through the interface between the members ( 1) Cast monolithically with the slab without dowels through the interface between the
members (22) Steel reinforcing bars pass through a construction joint at the underside of the slab ( 4) Other (please specify) [Slab cast into keyway along the top of the diaphragm: Cast
monolithically with slab with U-shaped stirrups around steel x-bracing extending into the slab.]
2. How are intermediate concrete diaphragms, that are in contact with the bottom of the slab, connected to the slab?
(40) Precast concrete diaphragms are not used ( 2) Diaphragms not in contact with the slab ( 1) Not connected to the slab ( 2) Steel dowels or reinforcement extended above the top of the precast concrete diaphragm
to be cast into the slab ( 0) Threaded inserts cast in the diaphragm and slab for receiving a steel piece to join
members ( 0) Anchored weld plates cast in the diaphragm and slab for receiving a steel piece to join the
members ( 0) Combination of threaded inserts and anchored weld plates for receiving a steel piece to
connect the me ( 1) Other (please s
3. How are intermediate steel diaphragms that are in contact with the bottom of the slab, connected to the slab?
(31) Steel diaphragms are not used (12) Diaphragm not in contact with the slab ( 4) Not connected to the slab ( 0) Weld plates cast in the bottom of the slab to receive a steel piece to connect the members ( 0) Steel studs welded to the top of the steel diaphragm which are cast into the slab ( 0) Expansion bolts drilled into the bottom of the slab to be used to fasten a steel piece which
connects to the members ( 0) Other (please specify)
4. How are intermediate cast-in-olace concrete diaphragms connected to the girders?
( 3) Cast-in-place concrete diaphragms are not used ( 0) Not connected to the girders and girder face(s) is (are) not roughened ( 0) Not connected to the girders, however, the girder face(s) is (are) roughened (23) Coil ties placed through sleeves in the girders and extended into the diaphragm
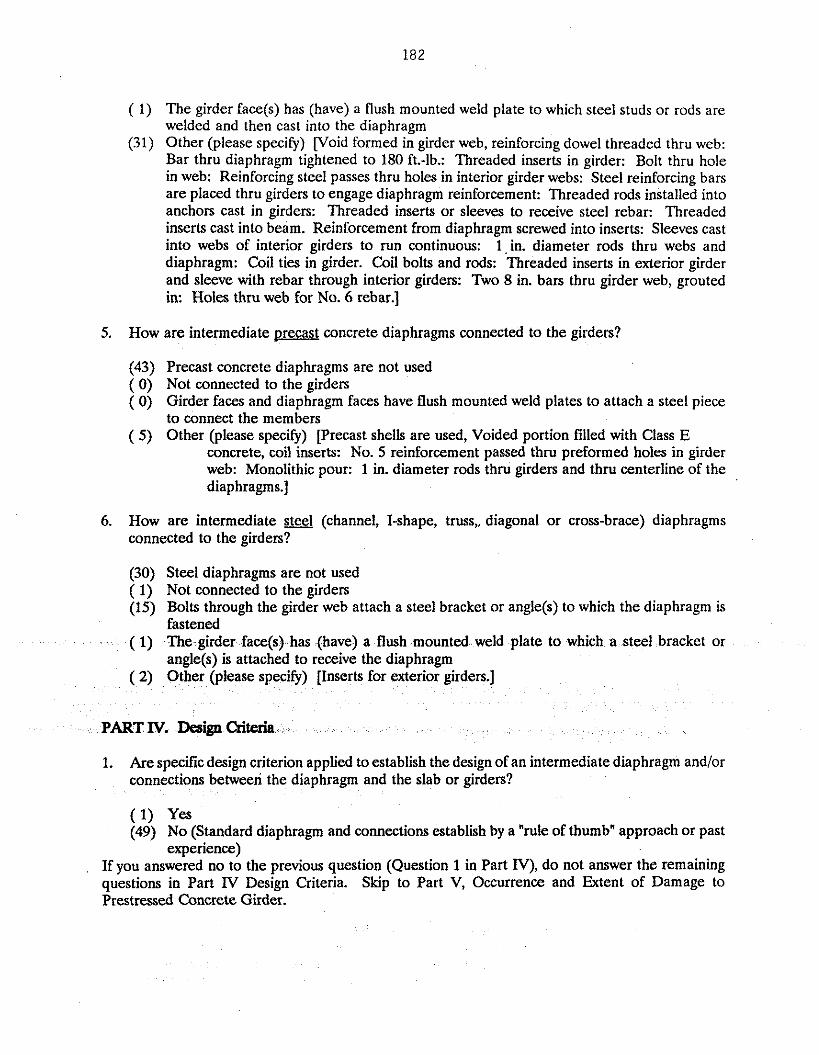
( 1) The girder face(s) has (have) a flush mounted weld plate to which steel studs or rods are welded and then cast into the diaphragm
(31) Other (please speciFy) v o i d formed in girder web, reinforcing dowel threaded thru web: Bar thru diaphragm tightened to 180 ft.-lb.: Threaded inserts in girder: Bolt thru hole in web: Reinforcing steel passes thru holes in interior girder webs: Steel reinforcing bars are placed thru girders to engage diaphragm reinforcement: Threaded rods installed into anchors cast in girders: Threaded inserts or sleeves to receive steel rebar: Threaded inserts cast into beam. Reinforcement from diaphragm screwed into inserts: Sleeves cast into webs of interior girders to run continuous: 1,in. diameter rods thru webs and diaphragm: Coil ties in girder. Coil bolts and rods: Threaded inserts in exterior girder and sleeve with rebar through interior girders: Two 8 in. bars thru girder web, grouted in: Holes thru web for No. 6 rebar.]
5. How are intermediate orecast concrete diaphragms connected to the girders?
(43) Precast concrete diaphragms are not used ( 0) Not connected to the girders ( 0) Girder faces and diaphragm faces have flush mounted weld plates to attach a steel piece
to connect the members ( 5) Other (please specify) [Precast shells are used, Voided portion filled with Class E
concrete, coil inserts: No. 5 reinforcement passed thru preformed holes in girder web: Monolithic pour: 1 in. diameter rods thru girders and thru centerline of the diaphragms.]
6. How are intermediate steel (channel, I-shape, truss,, diagonal or cross-brace) diaphragms connected to the girders?
(30) Steel diaphragms are not used ( 1) Not connected to the girders (15) Bolts through the girder web attach a steel bracket or angle(s) to which the diaphragm is
fastened ( 1) The girder face(s) has (have) a flush mounted weld plate to which a steel bracket or
angle@) is attached to receive the diaphragm ( 2) Other (please specify) [Inserts for exterior girders.]
PART IV. Design LXi
1. Are specific design criterion applied to establish the design of an intermediate diaphragm andlor connections between the diaphragm and the slab or girders?
( 1 ) yes (49) No (Standard diaphragm and connections establish by a " ~ l e of thumbw approach or past
experience) If you answered no to the previous question (Question 1 in Part IV), do not answer the remaining questions in Part IV Design Criteria. Skip to Part V, Occurrence and Extent of Damage to Prestressed Concrete Girder.

2. Does your agency or state use lateral impact loads as a basis for diaphragm design, excluding diaphragm location?
( 1) Yes
(6 ) No
3. Does your agency or state use lateral impact loads as a basis for diaphragm location?
4. What design criterion are applied to establish the diaphragm size?
( 7) No specific design criteria ( 0) Design criteria (please specify)
5. What design criterion are applied to establish the connection between the diaphragm and the &&?
( 1) No mechanical connection ( 5) No specific design criteria ( 1) Design criteria (please specify) [Develop shear.]
6. What design criterion are applied to establish the connection between the diaphragm and the m? ( 0) No mechanical connection ( 6) No specific design criteria
PART V. ckameace and Extent of Damage to Prestresd Concrete Girders
Secondary highways [13: 500: 4: 0: 17: 126: 34: 86.250: 0: 854: 130: 48: 331: 20: 12: 0: 2: 39: 20: 211: 6: 25: 24: 142: 50: 773: 0: 241: 383: 71: 13: 1101
Interstate highways [10: 2000: 1: 31: 60.158: 42: 500.85: 1323: 165: 74: 154: 40: 0: 129: 6: 316: 6: 101: 231: 539: 50: 1660: 20: 102: 116: 46: 182: 1261

2. When an overheight vehicle impacts a bridge superstructure, more than one girder may be damaged. Based on your past experiences (all years), indicate in the table below the occurrence of any type of damage to the girder(s) caused by lateral impacts.
1 Girder 2 Girders 3 Girders 4 Girders 5 or More Girders
~ f w a y s (29) ( 0) ( 0) ( 0) ( 0)
Usually (10) (16) ( 5) ( 0) ( 0)
Sometimes ( I ) (15) (19) (14) (12)
Never (1 ) ( 4 ) ( 8) (12) (14)
3. For each of the prestressed concrete girder damage categories listed in Table kl, give the occurrence of impacts from overheight loads in 1988 and 1989 [If possible, provide data for both years.]
4. Based on the total number of repairs, due to any cause, to prestressed concrete girder bridges, approximately what percentage are related to overheight vehicles impacting and damaging the girders?
PART VL Questionnaire Evaluation
ifficulty in answering by listing the questionnaire part and question numbers below, (i.e., V3 for Part V, Question 3)
Please send us a copy of your standardized details and specifications for all types of intermediate diaphragms that are used by your state or agency in prestressed girder bridges.
If you would like a copy of the complete survey, please check here.
(43) Yes, please send me a summary of the collected diaphragm data
(5 ) No
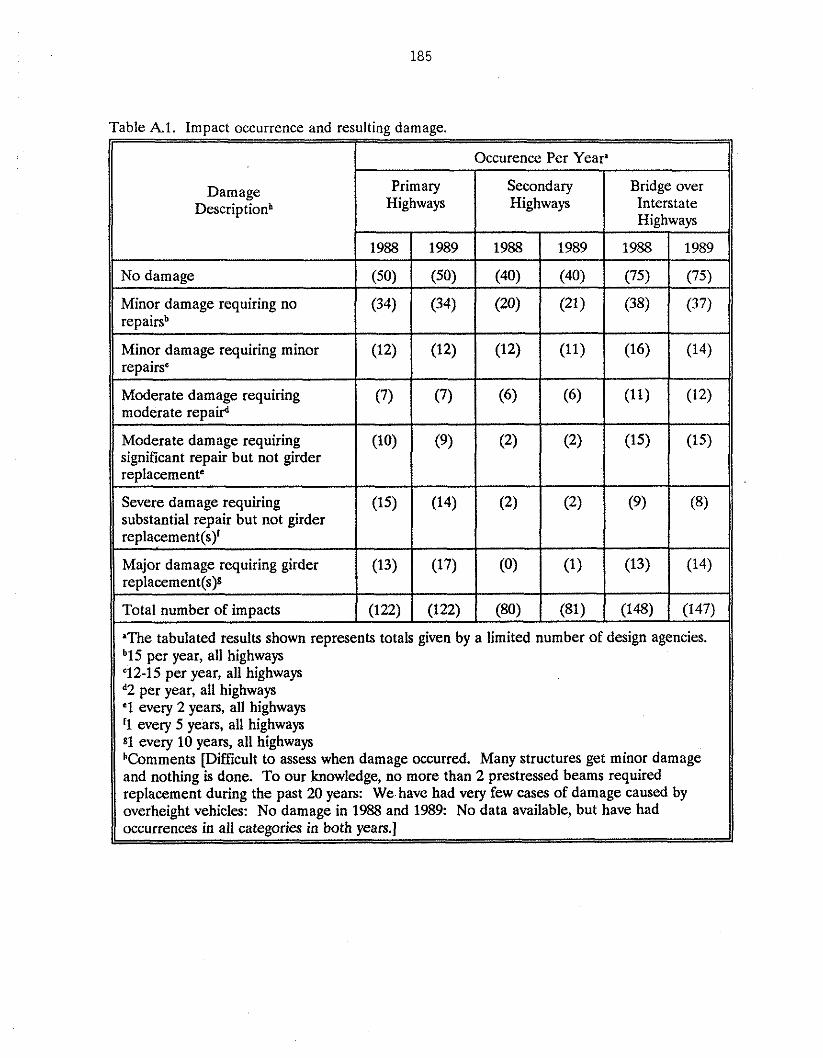
Table kl. Impact occurrence and resulting damage.
Y Major damage requiring girder replacement(s)8
Damage Descriptionh
No damage
Minor damage requiring minor repairsc
Moderate damage requiring moderate repairj
Moderate damage requiring significant repair but not girder replacement"
Severe damage requiring substantial repair but not girder replacementfs)'
"I'he tabulated results shown represents totals given by a limited number of design agencies. b15 per year, all highways "12-15 per year, all highways d2 per year, all highways "1 every 2 years, all highways '1 every 5 years, all highways 81 every 10 years, all highways hComments [Difficult to assess when damage occurred. Many structures get minor damage and nothing is done. To our knowledge, no more than 2 prestressed beams required replacement during the past 20 years: We have had very few cases of damage caused by overheight vehicles: No damage in 1988 and 1989: No data available, but have had occurrences in all categories in both years.]
Minor damage requiring no /I repairsb
Occurence Per Year
(12)
(7)
(10)
(15)
Total number of impacts
Primary Highways
(12)
(7)
(9)
(14)
(122)
1988
(50)
1989
(50)
Secondary Highways
(12)
(6)
(2)
(2)
(122)
Bridge over Interstate Highways
1988
(40)
(80) ( (81) 1 (148) 1 (147)
1988
(75)
1989
(40)
(11)
(6)
(2)
(2)
1989
(75)
(16)
(11)
(15)
(9)
(14)
(12)
(15)
(8)

Appendix B
BRIDGE DETAILS
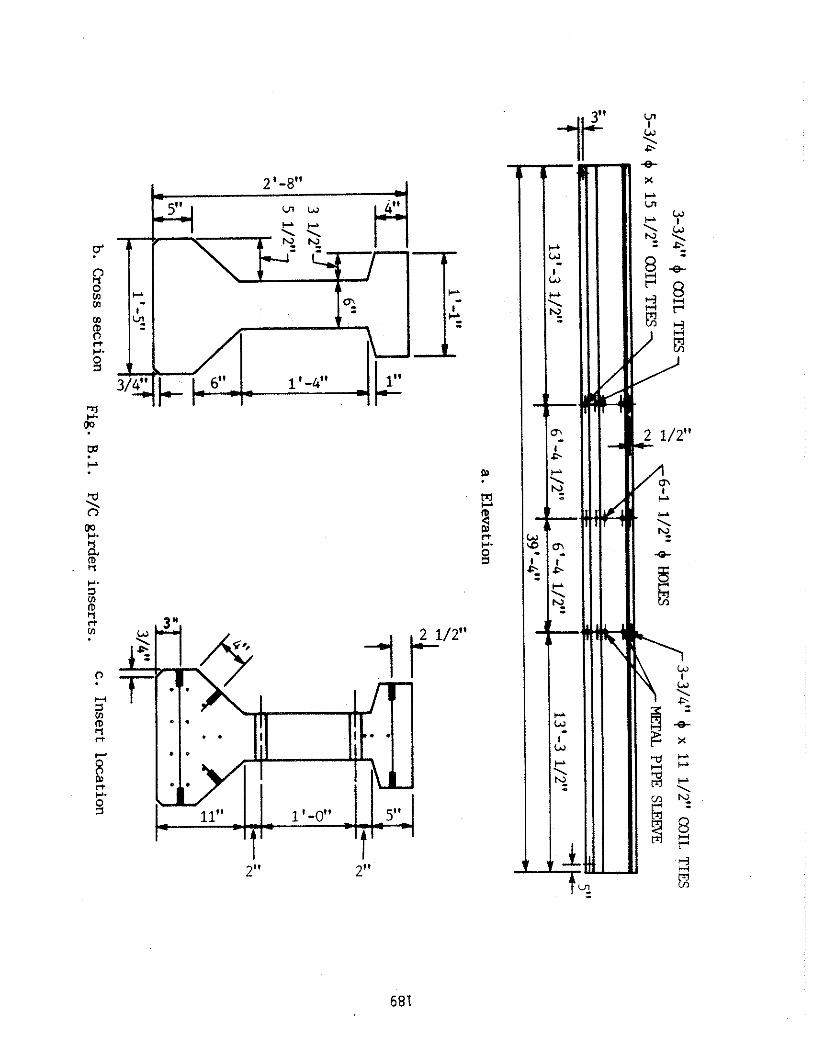
- 3-3/4"
COIL TIES -
3-3/4" 4 x 11 1/2"
COIL TIES
5-3/4 6 x 15 1/2" COIL TIES
METAL PIPE SLEEVE
".)
,
-f--
a. Elwation
Cross section
Fig. B.1.
P/C girder inserts. c.
Insert location
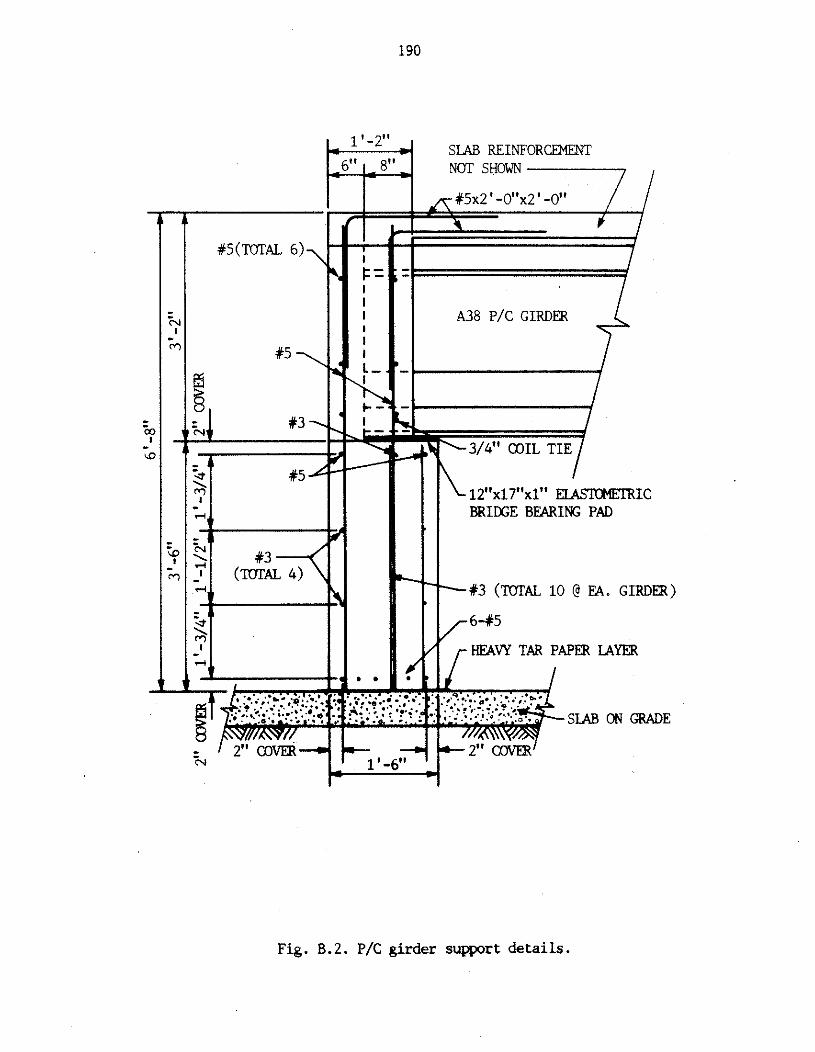
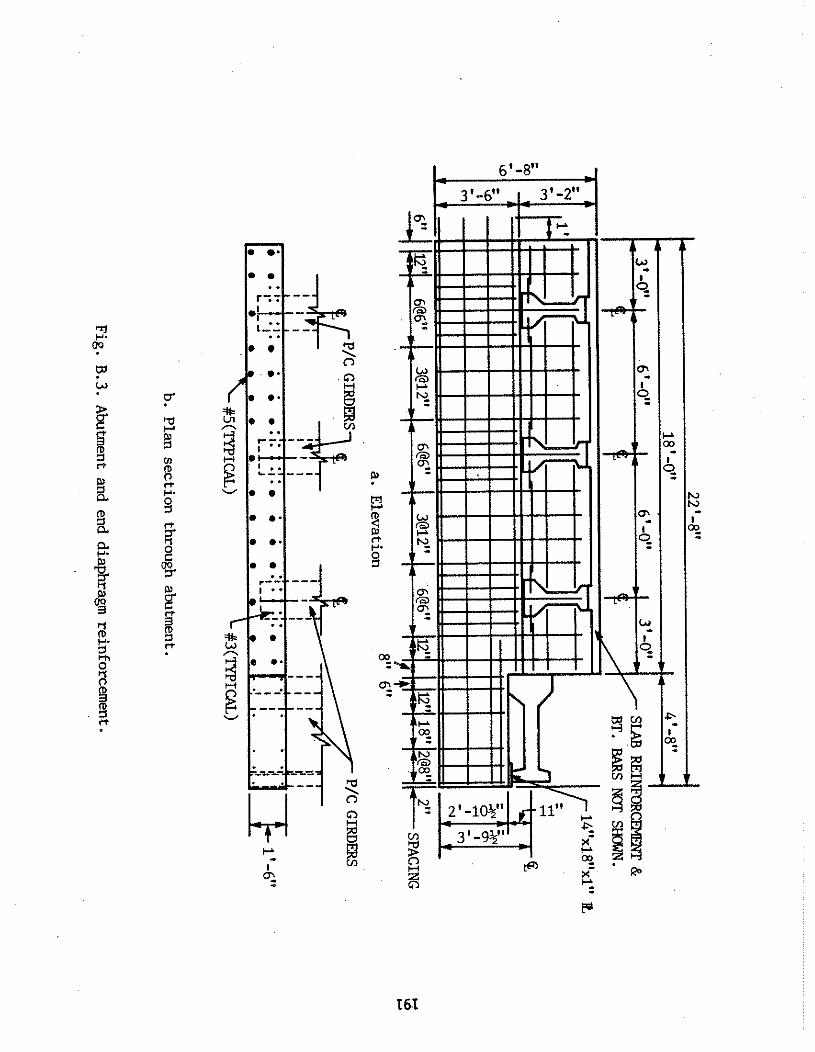
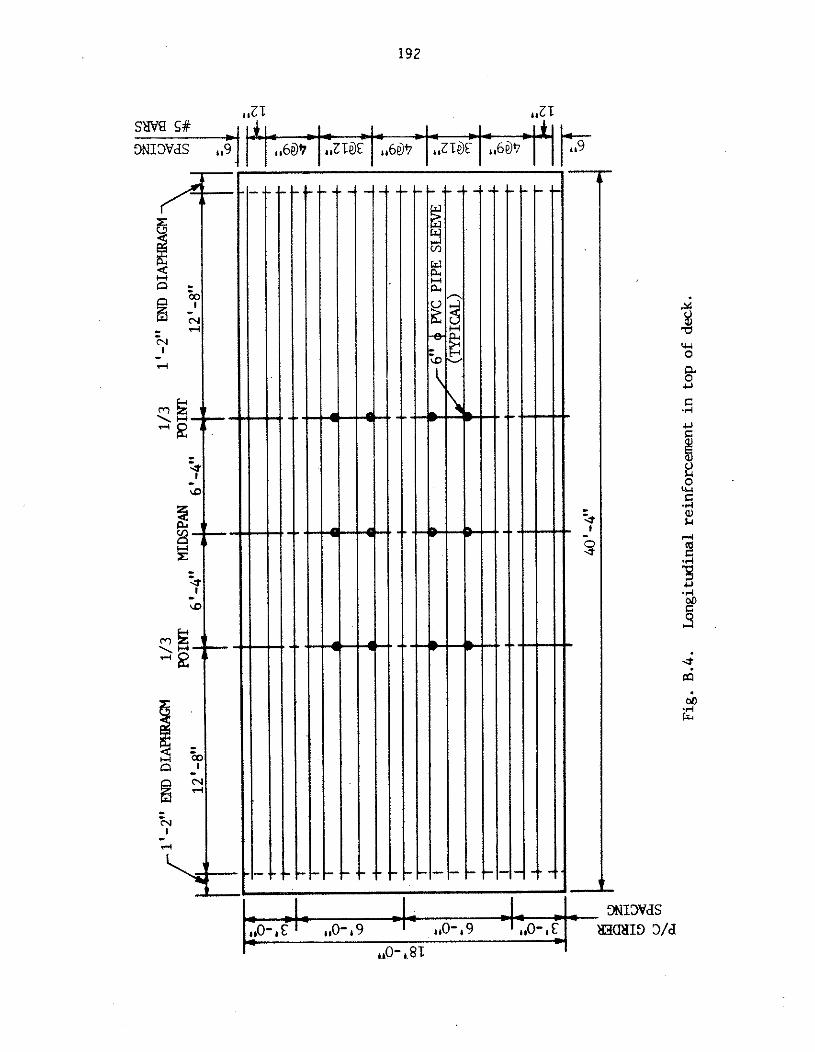
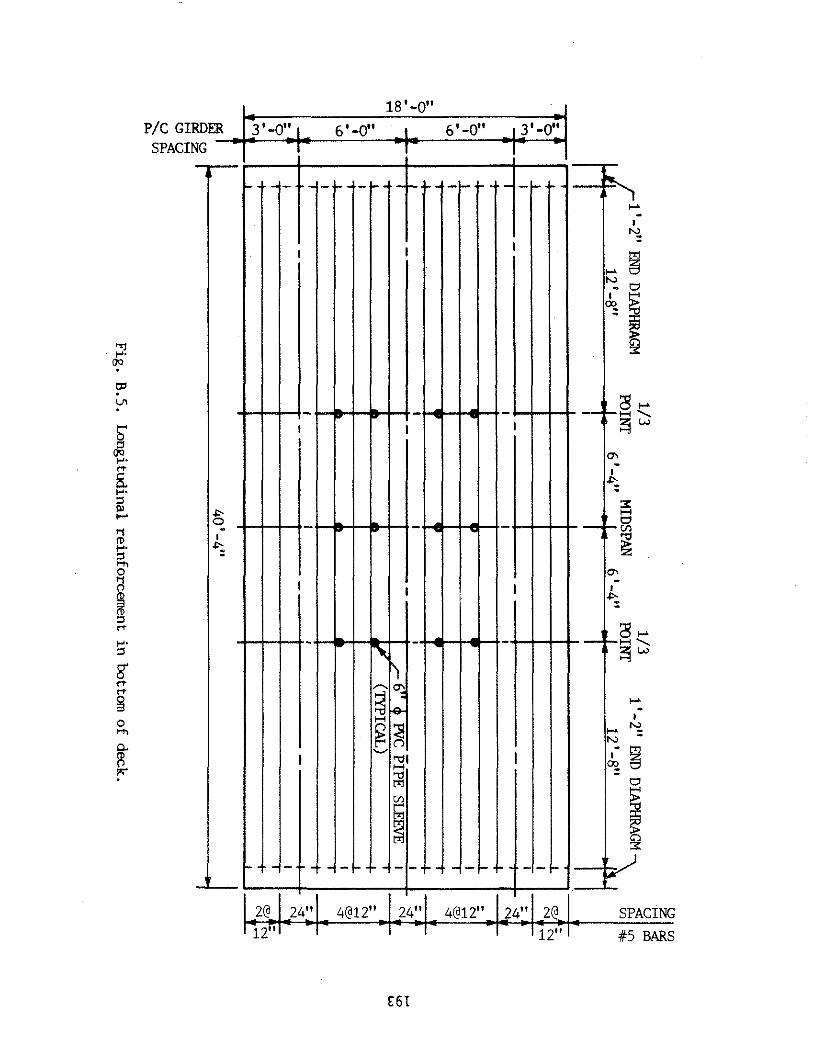
1'-2" END DIAPHRAGM
H)INT 1'-2" END DIAPHRAGM
C
w
U
Fig. B.5.
Longitudinal reinforcement in bottom of deck.
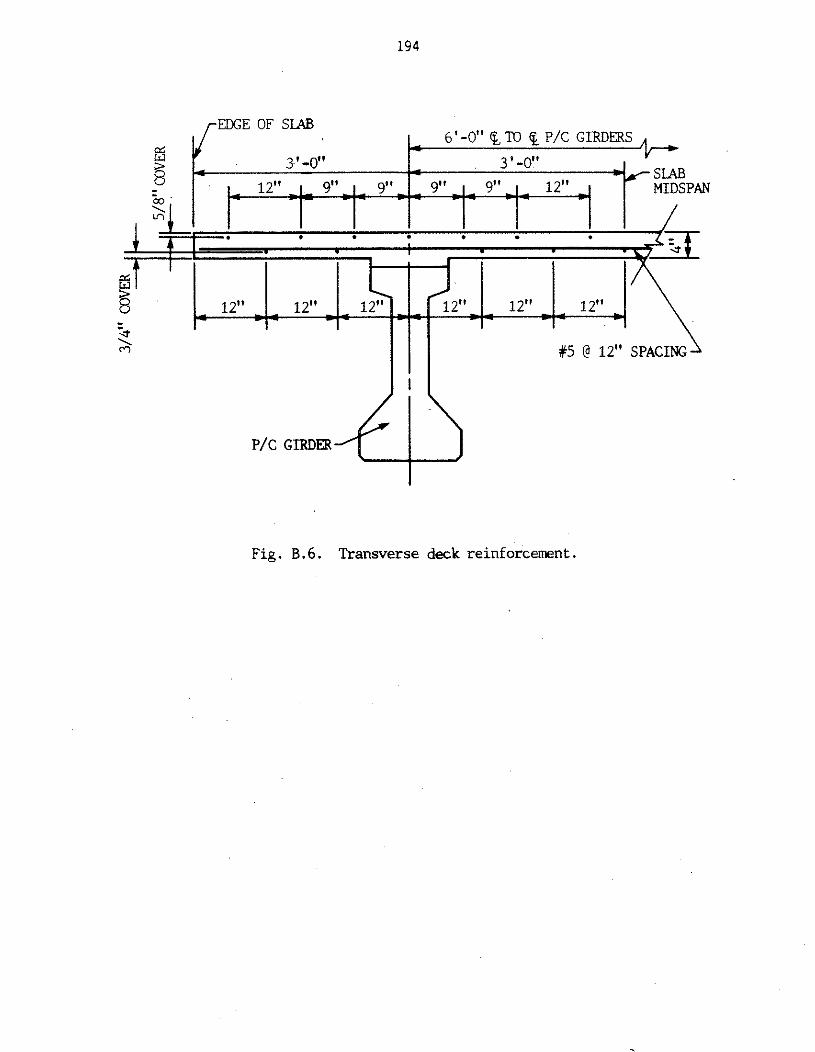
EDGE OF SLAB
P/C GIRDER
Fig. 8 . 6 . Transverse deck r e i n f o r c e n t .