colliers radar india office trends to watch for in 2018
TRANSCRIPT

Colliers Radar
15 January 2018
Robust occupier
demand driving
office market Surabhi Arora | Sr. Associate Director | India
We expect the Indian economy to grow at above 7% over the next three years and recover fully from the adverse repercussions of demonetisation and implementation of Goods and Services Tax (GST). We expect the commercial real estate market to remain on track with sustained demand from occupiers in coming years. Flexibility, collaboration, workspace efficiency, employee retention and cost effectiveness should be the key focus areas of Corporate Real Estate (CRE) heads in 2018. We advise developers to reformulate their workplace designs to cater to the changing dynamics of the workplace environment.
Forecast at a glance
Demand Primarily dominated by technology, engineering and banking sectors; coworking operators and warehousing to gain traction.
Supply About 90 million sq ft (0.8 million sq m) is under various stages of construction which we expect to push up total stock by 17-18% by 2020.
Vacancy rate We expect, vacancy to remain stable in most cities with upcoming supply likely to complement the demand in the next 3 years
Rent Premium building rents will continue in the upward growth trajectory across markets; we expect an average annual increase of 4-5% over the next three years. Price Should increase by 2-3% over the next three years as investor activity is set to rise.
Leasing momentum to be sustained over 2018
Notwithstanding the macroeconomic disruptions, the commercial real estate market remained robust in 2017. We recorded pan-Indian leasing volume of about 42.8 million sq ft (3.9 million sq m) excluding pre-commitments which is marginally up from 2016 numbers. The demand was well supported by net supply of about 34 million sq ft (3.1 million sq m) across India. Bengaluru grabbed the lion's share of overall office demand and remained the frontrunner in office leasing with record-breaking leasing of above 15 million sq ft (1.4 million sq m), giving Bengaluru (Bangalore) a 36% share followed by the NCR on 18%, Hyderabad on 13%, Mumbai on 12%, Chennai on 11% , Pune on 8% and Kolkata on 2%. Looking ahead, we expect demand to be driven by the technology, engineering, manufacturing and finance sectors. and by coworking operators. Although GDP growth weakened in the middle of 2017, positive projections by most economic forecasters have left companies confident that real GDP growth will exceed about 7% annually over the next few years. Taking cues from the positive policy reforms most large occupiers have been reviewing long pending CRE decisions. Tenants in expansion mode have started finalising their relocation and consolidation strategies and locked in large office spaces at favourable lease terms. The trend of pre-committing large spaces has picked up in 2017 with more than 4 million sq ft (0.3 million sq m) of office space pre-committed in projects under construction. Furthermore, as we predicted, operators of coworking or flexible working space have made their entry into the market in a big way, representing about 8% of total absorption in 2017 compared to last year's share of 3%. According to Oxford Economics' Asia City Outlook report June 2017, Indian cities should continue their rapid pace of growth. We expect that the office leasing market will remain robust in 2018 and over the subsequent few years, reflecting strong employment growth and economic reforms. However, we do not expect the absorption level to grow further since despite strong demand other factors such as the quest for workspace efficiency and the advent of flexible office space may hold down overall absorption volumes. Other concerns such as automation and artificial intelligence also have the potential to disrupt the Indian property market significantly. However, we expect the impact to be felt over the medium to long term.
Colliers Radar
INDIA | OFFICE 15 January 2018

2 Colliers Radar | 15 January 2018 | India | Office | Colliers International
Key trends to watch in 2018 In our opinion flexibility, collaborative workspaces, workspace efficiency, employee retention and cost effectiveness will be the key focus area of CRE heads in 2018. We expect the following key trends to dominate the commercial real estate in coming years.
1. Flexibility to remain key focus in work space strategies One of the biggest shifts in workplace strategies in India is likely to be the improvement in the degree of flexibility offered to occupiers by developers. Global leaders in flexible office space, including WeWork and Regus have led the charge in coworking space and leased substantial office space (above 100,000 sq ft or 9,290 sq metres in 2017). We expect these large players to compete against traditional offices to target major corporates besides focusing on small and medium enterprises. We recommend that landlords recognise the benefits of flexible workspace and redesign their office spaces across their portfolios. We advise landlords and developers to maximise opportunities by utilising underused spaces. Landlords can also redesign their existing space to create collaborative workspaces to meet the needs of smaller tenants – from which we are currently seeing strong demand. Landlords should look to offer quality and more efficient office space through subdividing floors into multiple office suites. Most recently, Coworks supported by RMZ developers has rolled out flexible work-space in their portfolio and opened several coworking spaces in their own buildings by investing in modern technologies for tenants hire out across India. Developers such as DLF, Vatika, Supertech and Ascendas alike are also exploring this new emerging work. Thus, we expect flexible office space to continue flourishing in coming years further given its convenience and cost-effectiveness. In the last two years (2016 and 2017) the flexible office operators leased more than 4.6 million sq ft (0.4 million sq m). We reaffirm our prediction of leasing of 8 to 9 million sq ft (0.7-0.8 million sq metres) by coworking operators till 2020 as forecasted in our earlier report "Coworking space - The New Kid on the Block" (20 March 2017).
2. Pre-commitments and BTS (Built to Suit) to remain popular Given the single- digit vacancy rates in the main Information Technology and Information Technology
Enabled Services (IT-ITeS) locations such as Bengaluru, Hyderabad, Pune and Chennai, occupiers continued to prefer built to suit and pre-commit large office spaces in 2017. Even in the high-vacancy markets such as Gurugram we witnessed the trend of pre-commitments picking up. Several large occupiers whose leases are coming up for expiry are looking to consolidate in newer locations to hedge against the increase in rents. In 2017, the preferred locations witnessed rental growth of 10-15% in most cities; the average rents increased by 3-4% in technology driven cities while traditional cities such as Delhi, Mumbai and Kolkata witnessed 1-2% decrease in rents. On the supply side, in keeping with the macro economic scenario, developers are cautious about building speculatively and look for pre-commitments in their upcoming office spaces. We expect this trend to continue in coming years. We advise the following classes of occupier to pre-commit office spaces in forthcoming grade A buildings and Special Economic Zones (SEZs). > Occupiers requiring large office spaces in the near
future with clear visibility over future expansion visibility
> Occupiers enjoying low rents in prime locations whose leases will expire in one to two years should also explore the newer emerging locations
3. Occupiers to explore Tier-II & III cities for back-office requirements We observe that technology and e-commerce companies are exploring expansion in Tier II and III Indian cities. The companies are exploring these cities in search of cheaper resources as Tier I cities are increasingly becoming expensive and subsequently the ma npower cost is also increasing. Cities such as Coimbatore, Chandigarh, Ahmedabad, Bhopal and Vishakhapatnam are a few of the cities being explored by the companies. Given the government's push for smart cities development, we believe that firms should consider expanding in the cities where the state governments intend to spur growth by offering more fiscal and non-fiscal incentives and building crucial infrastructure projects such as airports and railways. However, we advise occupiers to consider the talent pool in each city before making such decisions since due to increased urbanisation young talent is migrating towards Tier I cities, and talent acquisition and retention is a major challenge in smaller cities. Our Tech Trends in Asia Report (dated 05 December 2017) showed that technology companies still see Bangalore as the greatest source of talent within India and indeed as the third greatest in Asia after Beijing and Shanghai.

[Type here]
Contents Executive Summary | India | Robust occupier demand driving office market ................................................ 2
Infographics | 2017 Actual & 2018 Forecast ............................................ 4
Mumbai | Flexible space likely to dominate office market ...................... 6
Delhi | Rents in grade A properties to rise .................................................... 8
Gurugram | Demand set to improve . 10
NOIDA | Grade A supply to drive demand ........................................... 12
Bengaluru | Supply to complement demand in 2018 ................................ 14
Chennai | Steady rental rise to continue ............................................ 16
Pune | Slower take-up amid low vacancy ............................................ 18
Hyderabad | Office supply to surge in 2018 ................................................. 20
Kolkata | Demand set to revive in 2018 ................................................. 22

NCR
7.9 8.1
15.314.0
4.95.5
3.5 3.24.8 4.9
20172018 Forecast
0.81.2
5.2
ABSORPTIONOVERALL
Bengaluru Mumbai Pune Chennai Kolkata
4 Research & Forecast Report | 2018 | <<India>> | Colliers International 5 Research & Forecast Report | 2018 | <<India>> | Colliers International
2017 actual | 2018 forecast India Mumbai, Delhi-NCR, Bengaluru,
Chennai, Kolkata, Pune & Hyderabad
INDIA OFFICE TRENDS 3 TO WATCH IN 2018
1
2
3
GRADE A - AVERAGE RENTAL GROWTH
MUM
BAI
NCR
CHEN
NAI
KOLK
ATA
PUNE
BENG
ALUR
U DABAREDYH
NEW SUPPLY - 2017 & PIPELINE 2018
Deloitte Meenakshi Tech Park 14,00,000 Hyderabad
Siemens Gold hill Supreme Tech park 600,000 Bengaluru
Microsoft Prestige Fern Galaxy 589,000 Bengaluru
Qualcomm Bagmane ConstellationBusiness Park
560,000 Bengaluru
Lowe'sServices
Manyata Business Park 489,000 Bengaluru
Amazon Ramanujan IT SEZ 472,000 Chennai
TCS Godrej Factory Campus 250,000 Mumbai
Qualcomm Raheja Mindspace BuildingNo 7
200,000 Hyderabad
Valeo Cee Dee Yes IT Park 200,000 Chennai
Client Building Name Area(In Sq.ft.) City
VACANCY TRENDS
%-1
.0-2
.0%
13.7
%6.
0%
-2.4
%0.
5%
6.6%
5.0%
1.7%
3.6%
-2.1
%-1
.3%
1.0%
MUM
BAI
NCR
CHEN
NAI
KOLK
ATA
PUNE
BENG
ALUR
U DABAREDYH
2017 2018 Forecast (in MN SF)
4.2
5.7
12.7 13
.3
5.3
3.0
2.2 2.
9 4.2
2.5
0.9
4.9
12.0
Buyer : GICSeller : DLF CyberCity developers
INR 11,900 Cr(USD 1.85 bn)
Buyer : MilestoneSeller: E-Park Kharadi
INR 160 Cr(USD 24.5 mn)
E park
5.8
1.8
Source: Colliers International India research
*The above transactions are on the basis of both announcedand closed deals reported between 1 Jan 2017 to 25 Dec 2017
~42.8 mn sq ft (3.9 mn sq metre) was absorbed in 2017 in 7 major metros, almost at par with 2016 Bengaluru tops the chart with 36% share followed by Delhi NCR with 18% 56% of the total absorption was contributed by Technology Sector, 12% by Banking, Financial Services & Insurance sector
Hyderabad
Gurgaon
Cyber City
Buyer : Bharti AxaSeller : Parinee Group
INR 169 Cr(USD 26.6 mn)
Parinee Crescenzo
Mumbai
Buyer : Xander FinanceSeller: Shriram Gateway SEZ
INR 1220 Cr(USD 190 mn)
Shriram Gateway SEZ
Chennai
Buyer: Xander FinanceSeller : IL&FS
INR 300 Cr(USD 44.8 mn)
Express Trade Tower
Noida
Pune
One of the biggest shifts in workplace strategies in India is likely to be the improvement in �exibility o�ering to occupiers by developers. We expect the large players to compete against traditional o�ces to target major corporates beside focusing on small and medium enterprises.
With the single digit vacancies in the main IT-ITeS locations such as Bengaluru, Hyderabad, Pune and Chennai, occupiers continued to pre-commit large o�ce spaces. We expect the trend of high pre- commitment rate in large o�ce spaces and SEZs to follow in the upcoming years.
Technology and e-commerce companies are exploring expansion in Tier II and III Indian cities in search of cheaper resource as tier I cities are increasingly becoming expensive and subsequently the manpower cost is also increasing. It is expected that this trend will increase further.
MUM
BAI
N
CR
CHEN
NAI
KOLK
ATA
PUNE
BENG
ALUR
U DABAREDYH
2017 2018 Forecast (in MN SF)
28.0
%27
.5%
9.1%
9.0% 13
.0%
12.5
%
6.0%
5.4%
30.0
%31
.0%
6.0% 10
.0%
2017 2018 Forecast
11.0
%11
.0%
1.0%
TOP 10 LEASE TRANSACTIONS IN 2017MAJOR OFFICE SALE TRANSACTIONS*
Anthem Inc Manyata Business Park 477,000 Bengaluru
* Overall absorption is gross absorption excluding pre-commitments

Flexible space
likely to dominate
office market Surabhi Arora | Sr. Associate Director | India
With limited new supply pipeline, we anticipate that
the availability of Grade A buildings at affordable
rents will remain a concern in Mumbai for the next
several years. Thus, flexible workspaces located at
strategic locations should increase in popularity. In
view of the shortage of quality supply and high rents
in Mumbai at strategic locations, we recommend
occupiers to consider taking the advantage of
flexible office spaces instead of focusing purely on
spatial requirements.
Forecast at a glance
Demand Demand likely to remain tilted towards quality Grade A office space; alternative workspace solutions to gain momentum
Supply We project new supply of 9-10 million sq ft (0.8-0.9 million sq m) in the next three years resulting in the total stock of the Mumbai market growing by under 10%
Vacancy rate Average vacancy set to decline gradually at 12% in next three years; Grade A vacancies may go below 10% level by 2020
Rent Average 3-5% upward movement expected in rents YOY in 2018 due to restricted new supply and lower vacancy levels.
Price Capital values likely to strengthen further due to high appetite of investors for outright purchases in Grade A properties.
Muted leasing amid limited supply; Coworking set to flourish
The Mumbai office market recorded a decline of 12%
YOY in leasing volume with about 4.9 million sq ft (0.47
million sq m) of gross absorption in 2017. Andheri, Navi
Mumbai and Bandra Kurla Complex (BKC) remained the
most active micromarkets in terms of leasing volume
with 25%, 20% and 16% shares of total leasing,
respectively. While affordable rents drove the demand
for Navi Mumbai and Andheri, BKC remained popular
among occupiers looking for premium Grade A offices.
We expect the bulk of the demand to stay concentrated
in western suburbs and peripheral locations such as
Andheri and Navi Mumbai over the next three years.
However, BKC should remain the most sought-after
office destination among occupiers looking for premium
office space.
We witnessed several outright purchases of office space
in 2017 indicating keen interest from investors in the
Mumbai commercial property market. Notable
transactions include the purchase of 80,000 sq ft (7,400
sq m) office space in Goregaon by Zydus Healthcare
and 65,000 sq ft (6,000 sq m) by Bharti AXA. We expect
that investors' interest will remain high for Grade A
buildings in the land-starved city in the long-term.
Rental Value Trends
Micromarkets Rental Values1
QOQ Change
YOY Change
CBD 200-250 0.0% 0.0%
Andheri East 90-130 0.0% 0.0%
BKC 225-330 0.0% 1.8%
Lower Parel 140-195 0.0% 0.0%
Malad 80-100 0.0% 0.0%
Navi Mumbai 70-100 0.0% 0.0%
Powai 110-130 0.0% -2.0%
Worli/Prabhadevi 170-210 0.0% -2.6%
Goregaon / JVLR 100-130 0.0% -4.2%
Kalina 150-180 0.0% -10.8%
Thane 70-80 0.0% -6.3%
LBS 95-125 0.0% -8.3%
Source Colliers International India Research 1Indicative Grade A rentals in INR per sq ft per month
Colliers Radar
MUMBAI | OFFICE 15 January 2018

2 Colliers Radar | 15 January 2018 | Mumbai | office | Colliers International
For more information:
Surabhi Arora Senior Associate Director Research | India +91 98 7175 0808 [email protected]
Ravi Ahuja Senior Executive Director Mumbai & Developer Services [email protected]
Ritesh Sachdev Senior Executive Director Occupier Services | India [email protected]
17th Floor, Indiabulls Finance Center, Tower 3, Elphinstone (W), Mumbai - 400013 India
For more information:
Surabhi Arora Senior Associate Director Research | India +91 98 7175 0808 [email protected]
Hari Prakash Senior General Manager Office Services | Hyderabad [email protected]
Ritesh Sachdev Senior Executive Director Occupier Services | India [email protected]
Level 7, Maximus Towers Building 2A, Mindspace Complex, HITEC City, Hyderabad - 500 081, India
Fig 1: Rental Forecast (INR per sq ft per month)
Fig 2: Supply, Absorption & Vacancy Forecast
Major Lease Transactions in 2017
Client Building Name Area
(sq ft)
Location
TCS Godrej Factory Campus
250,000 Vikroli
Teva Pharma Seawoods 125,000 Navi Mumbai
CoWorks Birla Centuriun 95,000 Worli
Rosneft Godrej BKC 70,000 BKC
Ajanta Pharma Ltd.
Satellite Gazebo 22,000 Andheri East
Source: Colliers International Research
Note: All figures are based on market information as on 25 Dec 2017
In line with our forecast, flexible space providers gained
momentum and accounted for about 12% of total leasing
volume in 2017. We expect demand for flexible
workspaces to remain high in coming years bearing in
mind the restricted supply in key markets in Mumbai.
Limited supply to keep market landlord friendly
We project new supply of about 9-10 million sq ft (0.8-0.9
million sq m) over the next three years resulting in the
total stock of the Mumbai market growing by under 10%.
Most of the new supply will remain concentrated at
Thane-Belapur Road in Navi Mumbai and western
suburbs such as Andheri, Kurla, Malad and Goregaon.
Micromarkets such as Central suburbs and south
markets are likely to have negligible supply addition over
the next three years.
Limited supply to keep upward pressure on rents in
Grade A buildings while rents in Grade B expected to
remain under downward pressure. We expect 3-5% YOY
increase in average city rents in next 3 years.
Colliers' Forecast
The long-awaited Mumbai Draft Development Plan (DP)
2014-2034 has been cleared by the Brihanmumbai
Municipal Corporation (BMC) in August 2017, and the
state government’s clearance is likely to be given in
2018. We believe that the upcoming DP will not only
decide the spatial framework of the city but also enhance
plot potential with updated Floor Space Index (FSI) and
Transfer of Development Rights' (TDR) norms in the
island city.
Furthermore, in order to address the infrastructure
issues the Mumbai Metropolitan Region Development
Authority (MMRDA) has allocated almost 84% of the
total state budget of INR 68 billion (USD 1 billion) for
2017-18 to infrastructure projects. These initiatives
should benefit the Mumbai commercial market over the
next three to five years.
100
120
140
160
180
200
Q4 2
010
Q4 2
011
Q4 2
012
Q4 2
013
Q4 2
014
Q4 2
015
Q4 2
016
Q4 2
017
Q4 2
018F
Q4 2
019F
Q4 2
020F
0%
5%
10%
15%
20%
0.0
2.0
4.0
6.0
8.0
10.0
Absorption (In Mn sqft) New Supply (In Mn sqft)
Vacancy (In %)
Forecast
Copyright © 2018 Colliers International.
The information contained herein has been obtained from
sources deemed reliable. While every reasonable effort has
been made to ensure its accuracy, we cannot guarantee it. No
responsibility is assumed for any inaccuracies. Readers are
encouraged to consult their professional advisors prior to
acting on any of the material contained in this report.
Rents in Grade A
properties to rise Saif Lari | Assistant Manager | Delhi
Delhi's office market has experienced high leasing
momentum and the property owners of grade A
projects in high demand have swiftly increased
asking prices. In our view, developers have an
enticing opportunity to redevelop and redesign sub-
standard old projects, in order to unlock the
potential premium rentals in the undersupplied
market. However, this approach will be challenging
for strata-titled buildings.
Forecast at a glance
Demand Demand for office leasing to remain sturdy. Major contribution to be from Banking and Manufacturing sectors
Supply Limited supply pipeline in commercial office space except for 3.3 million sq ft (0.3 million sq m) of Grade A office space by NBCC over next three years which is primarily available for strata sale.
Vacancy rate Average vacancy rates likely to stay flattened at around 9-10% in the next 3 years. Higher vacancies expected in Grade B properties due to occupiers' preference for Grade A buildings.
Rent Rents to remain stable in the upcoming 3 year's forecast with an upward bias for Grade A buildings due to restricted supply.
Price Due to limited transaction volumes, capital values likely to remain stable in 2018 while we can expect 5-10% increase over the next 3 years
Leasing remains active with Aerocity gaining momentum
Leasing activity in the national capital remained very
active in 2017, as evidenced by robust gross absorption
of 1.3 million sq ft (0.1 million sq m) representing a jump
of 31% YOY. Aerocity emerged as the torchbearer in the
leasing activity with a share of about 28% closely
followed by Connaught Place (CBD) at 21%, Jasola at
8%, and Okhla at 7%. Other Secondary Business
Districts (SBD) micromarkets such as Nehru Place,
Saket, Bikaji Kama Place contributed lesser
transactions. In 2017, as a direct outcome of preference
among occupiers, Aerocity recorded a 17% YOY
increase in rents. Other traditional SBD micromarkets
such as Saket and Nehru Place were impacted
negatively and recorded 3-9% decreases in rent in 2017.
We expect Aerocity to remain a favourite among
occupiers' due to its locational advantages and ready
Grade A stock. DIAL (Delhi International Airport Limited)
has started allocating land parcels in phase II of Aerocity
for mixed-use development. However, it will take at least
three to five years for new building to materialise. Hence,
we expect that rents will rise by a further 8-10% in 2018
due to the lack of a visible supply pipeline over the next
three years.
In contrast to the trend of 2016, Delhi witnessed a lower
volume of new leasing by flexible workspace operators.
In our view, Delhi's market is gradually maturing in this
area; hence, the number of deals was smaller than in
2016.
Rental Value Trends
Micromarkets Rental Values1
QOQ Change
YOY Change
CBD 140 - 425 0.0% 4.6%
Nehru place 150 - 200 0.0% -9.1%
Saket 110 - 180 0.0% -9.4%
Jasola 80 - 115 0.0% -2.5%
Aerocity 180 - 200 0.0% 16.9%
Okhla 45 - 85 0.0% 0.0%
Source Colliers International India Research 1Indicative Grade A rentals in INR per sq ft per month
Colliers Radar
DELHI | OFFICE 15 January 2018

2 Colliers Radar | 15 January 2018 | Delhi | office | Colliers International
Copyright © 2018 Colliers International.
The information contained herein has been obtained from
sources deemed reliable. While every reasonable effort has
been made to ensure its accuracy, we cannot guarantee it. No
responsibility is assumed for any inaccuracies. Readers are
encouraged to consult their professional advisors prior to
acting on any of the material contained in this report.
For more information:
Surabhi Arora Senior Associate Director Research | India +91 98 7175 0808 [email protected]
Hari Prakash Senior General Manager Office Services | Hyderabad [email protected]
Ritesh Sachdev Senior Executive Director Occupier Services | India [email protected]
Level 7, Maximus Towers Building 2A, Mindspace Complex, HITEC City, Hyderabad - 500 081, India
For more information: Sanjay Chatrath Ritesh Sachdev 1st Floor, Ocus
Surabhi Arora Senior Associate Director | Research | India +91 98 7175 0808 [email protected]
Executive Director | NCR [email protected] Vineet Anand Director | Office Services | NCR [email protected]
Senior Executive Director | Occupier Services | India [email protected]
Technopolis Building, Golf Course Road, Sector 54, Gurugram 122002 India
Fig 1: Rental Forecast (INR per sq ft per month
Fig 2: Supply, Absorption & Vacancy Forecast
Major Lease Transactions in 2017
Client Building Name Area
(sq ft)
Location
Mitsui Worldmark 60,000 Aerocity
NSDC Worldmark 60,000 Aerocity
WHO Parsvnath Redfort Capital Tower
52,000 CBD
Cistera Vatika Mindspace 34,000 Okhla
Chegg India
Bani Corporate One 32,000 Jasola
Source: Colliers International Research Note: All figures are based on market information as on 25 Dec 2017
Most of the flexible workspace operators have in fact
started moving towards the neighbouring cities such as
Gurugram and Noida in order to optimise the cost per
desk. We assume a similar pattern will prevail in 2018.
Delays in the completion of some prime projects in the
CBD have meant that there has been no new major
supply in Delhi's office market in 2017. We expect supply
to remain restricted in coming years, with reduced supply
creating a scarcity of space in popular areas. For 2018,
we project new supply of roughly 300,000 sq ft (27,900
sq m), with all the supply concentrated in the CBD zone.
Besides, the state-owned developer NBCC is executing
a major project at Nauroji Nagar. With 3.3 million sq ft
(0.3 million sq m), this will be the first World Trade
Center in the national capital. Being located at a prime
location in South Delhi, the first e-auction witnessed
considerable success with public sector units such as
Power Finance Corporation, Hindustan Petroleum
Corporation Ltd. and Small Industry Development Bank
of India cumulatively buying about 0.28 million sq ft
(26,000 sq m) of office space at an average price of INR
38,000 (USD 587) per sq ft, that is 8-10% higher than
the CBD capital values. We expect the second tranche
of e-auctions in early 2018. In view of its prime location
and connectivity, investors looking for prime office space
may invest for their own office usage.
Colliers' Forecast
In line with our previous forecast, the Delhi office market
is likely to stay stable. We expect vacancy in the new
Grade A buildings to decline with an average vacancy
rate of about 9%, compared to the 2016-17's 10%
vacancy. We predict the vacancy levels to remain
around 9-10% till 2020. We see a clear appetite among
occupiers for Grade A and re-designed open-plan office
space. We recommend landlords and developers in CBD
areas to re-design their existing space and create
collaborative workspaces to meet the strong demands of
smaller tenants.
0
40
80
120
160
200
Q4
2008
Q4
2009
Q4
2010
Q4
2011
Q4
2012
Q4
2013
Q4
2014
Q4
2015
Q4
2016
Q4
2017
Q4
2018
F
Q4
2019
F
Q4
2020
F
0%
5%
10%
15%
20%
25%
0.0
0.5
1.0
1.5
2.0
2010 2011 2012 2013 2014 2015 2016 2017 2018F 2019F 2020F
New Supply (In Mn sqft) Absorption (In Mn sqft) Vacancy (In %)
Forecast

Demand set to
improve Surabhi Arora | Sr. Associate Director | India
Occupier preference is likely to remain tilted towards
premium, well-located developments. Thus, we
expect Grade A developments to continue
commanding a premium over market rents.
Peripheral locations will experience an increase in
vacancy rates with a large upcoming supply over the
period 2018-2020. Tenants should consider
decentralised options with good connectivity to
hedge against increasing rents in centralised
locations.
Forecast at a glance
Demand Demand for office leasing to remain sturdy as several occupiers are looking for new space
Supply We project 11.0 million sq ft (1.0 million sq m) of new supply addition by 2020 , resulting in a 16% increase in total stock. Most of the new supply is concentrated on NH8 and Golf Course Extension Road
Vacancy rate Average vacancy rate is likely to remain at high level above 30% due to significant supply in peripheral locations. Centralised locations have below 10% vacancy rate over the next three years
Rent Rents likely to remain stable with an upward bias for Grade A buildings in preffered micromarkets.
Price Due to limited transaction volumes, capital values likely to remain stable in 2018 while we can expect 5-10% increase over the next 3 years.
Occupiers expansion plan to keep momentum
Gurugram remained the preferred office destination in
the National Capital Region (NCR) with about a 57%
share of overall leasing. In 2017, we recorded nearly 4.5
million sq ft (0.4 million sq m) of leasing volume
excluding pre-commitments and renewals which
represents an increase of 5% YOY. The demand for
Grade A office space was driven by technology
companies which contributed 41% of overall demand,
followed by 18% for Banking, Financial Services and
Insurance (BFSI) sector and 12% for Engineering &
Manufacturing. Apart from Media and Entertainment,
Fast Moving Capital Goods (FMCG) and coworking
operators leased smaller office spaces that formed the
rest of leasing volume.
In line with our expectations, Golf Course Road and its
Extension Road remained the occupier preference with a
36% share of overall leasing, followed by 16% for Cyber
City, 12% for Sohna Road and 7% for National Highway
8 (NH8) respectively. With significant new supply
scheduled for completion along Golf Course Extension
Road by 2020, we expect this corridor to gain traction in
coming years. However, premium occupiers will probably
continue to prefer Cyber City, Golf Course Road and
NH8 owing to their enhanced connectivity after
completion of rapid metro and various underpasses
Rental Value Trends
Micromarkets Rental Values1
QOQ Change
YOY
Change
MG Road 105 - 135 0.0% -2.0%
Golf Course Road 110 - 220 0.0% 9.0%
Institutional Sectors (Sec 44, 32, 18)
60 - 90 0.0% 0.0%
Golf Course Road Ext./Sohna Road
55 - 80 1.0% -3.0%
National Highway 8 50 - 130 -6.0% -6.0%
Udyog Vihar & Industrial Sectors
50 - 70 0.0% 7.0%
Manesar 35 - 45 1.0% -8.0%
DLF Cyber City (IT) 115 - 120 0.0% 2.0%
Source Colliers International India Research 1Indicative Grade A rentals in INR per sq ft per month
Colliers Radar
GURUGRAM | OFFICE 15 January 2018

2 Colliers Radar | 15 January 2018 | Gurugram | office | Colliers International
Copyright © 2018 Colliers International.
The information contained herein has been obtained from
sources deemed reliable. While every reasonable effort has
been made to ensure its accuracy, we cannot guarantee it. No
responsibility is assumed for any inaccuracies. Readers are
encouraged to consult their professional advisors prior to
acting on any of the material contained in this report.
For more information:
Surabhi Arora Senior Associate Director | Research | India +91 9871750808 [email protected]
Sanjay Chatrath Executive Director | NCR [email protected] Vineet Anand Director | Office Services | NCR [email protected]
Ritesh Sachdev Senior Executive Director | Occupier Services | India [email protected]
1st Floor, Ocus Technopolis Building, Golf Course Road, Sector 54, Gurugram 122002 India
Fig 1. Rental Forecast (INR per sq ft per month)
Fig 2. Supply Absorption & Vacancy Forecast
Major Lease Transactions in 2017
Client Building Name Area
(sq ft)
Location
Pepsi Poineer Square 160,000 Golf Course Ext. Road
Google Rolta Tower 140,000 Udyog Vihar
Samsung Two Horizon Center
100,000 Golf Course Road
Wework Salcon Platina 80,000 MG Road
KPMG Building 10 B&C 71,000 Cyber city
Source: Colliers International Research Note: All figures are based on market information as on 25 Dec 2017
High vacancy and strong supply pipeline in peripheral locations to keep rents in check
In 2017, Gurugram witnessed the addition of only about 2.5 million sq ft (0.2 million sq m) of new office supply in the city's Grade A inventory. Although Colliers' database suggests nearly 11.0 million sq ft (1.0 million sq m) of new supply to be completed by 2020, we may expect some deferment in project completion looking at the overall high vacancy levels of above 30%. The overall average rents declined by 1% YOY in 2017 due to pressure on rents in peripheral markets. Premium buildings in preferred micro markets such as Golf Course Road and Cybercity continued to command a premium over the market average. Keeping the view of high vacancy level and supply pipeline, we expect average rent to remain stable. However, tenant appetite for higher quality office would stay in favour of Grade A developments, and they would be able to get premium over market rents.
Colliers' Forecast
We observed that the large occupiers are reviewing their long pending CRE decisions taking cues from the positive policy reforms. In 2017, several occupiers with leases expiring in the next couple of years formulated their relocation and consolidation strategies and pre-committed large office spaces in under construction projects in order to hedge against the rent increasing in the premium sub-markets in the future. We expect a similar trend to persist in coming years and peripheral locations such as Golf Course Extension Road, Southern Peripheral Road should gain traction among occupiers looking for affordable rents. Meanwhile Cyber city, NH8 and Golf Course Road should remain popular due to their location advantages and improved public transport system.
0
20
40
60
80
100
Q4 2
008
Q4 2
009
Q4 2
010
Q4 2
011
Q4 2
012
Q4 2
013
Q4 2
014
Q4 2
015
Q4 2
016
Q4 2
017
Q4 2
018F
Q4 2
019F
Q4 2
020F
0%
10%
20%
30%
40%
0.0
1.0
2.0
3.0
4.0
5.0
6.0
2010 2011 2012 2013 2014 2015 2016 2017 2018F 2019F 2020F
New Supply (In Mn sqft) Absorption (In Mn sqft) Vacancy (In %)
Forecast

Grade A supply to
drive demand Surabhi Arora | Sr. Associate Director | India
The addition of Grade A office supply supported by
infrastructure developments should drive occupiers'
interest in NOIDA market in coming years. The
market is likely to remain dominated by back-end
Information Technology occupiers, however,
upcoming Grade A supply is likely to attract
corporate occupiers in NOIDA market. We advise
developers to focus on improving the building
quality and property management to attract large
multinational occupiers.
Forecast at a glance
Demand Demand set to improve with a few completions of Grade A developments in NOIDA market
Supply
Total stock to be increased by about 45% in next 3 to 5 years, with approximately 13 million sq ft (1.2 million sq m) of new supply pipeline.
Vacancy rate
Vacancy rate set to remain high above 30% with new supply expected to add at already over supplied avenues.
Rent
Stable rents expected; slow moving inventory to keep a check on the rental values.
Price
Likely to stay subdued owing to lesser amount of strata-sale transaction activity.
Soft leasing trends leads to 22% dip YOY in gross absorption
After witnessing a record year in 2016, NOIDA's
commercial office market observed softening of leasing
activities in 2017. Colliers' database suggests that only
about 2.1 million sq ft (0.1 million sq m) was newly
leased in 2017 excluding pre-commitments and renewals
which represents a 22% dip YOY.
Our deal analysis shows that back-end Technology
Services and Banking, Financial Services and Insurance
(BFSI) continued to be the two major industries
dominating the overall leasing with 51% and 13% share
followed by 10% for Engineering and Manufacturing and
9% for Media & Entertainment. Although we expect that
back-end Technology Services should remain the key
demand driver in the city, there should be increased
traction from corporate occupiers as well in the next
three years. The upcoming Grade A commercial supply
is likely to attract corporate occupiers in NOIDA market.
About 44% of the total absorption was recorded in
Sector 62-65 micromarket followed by 26% for NOIDA
Expressway and the rest in the smaller micromarkets
such as Sector 16A and 18. Improved road connectivity
and expected metro completion in 2018 should derive
the occupier interest in Industrial and Institutional areas
of Sector 62-65 and NOIDA Expressway. However,
technology occupiers looking for large floor plates may
have limited grade A options in Sector 62-65, thus
leasing activities are likely to remain concentrated in
NOIDA Expressway in the coming years.
Rental Value Trends
Micromarkets Rental Values1
QOQ Change
YOY Change
Commercial Sectors 75 -105 -2.7% 0.0%
Institutional Sectors (Non IT)
75 - 95 0.0% -5.6%
Institutional Sectors (IT)
45 - 80 0.0% 8.7%
Industrial Area (IT) 35 - 45 -1.2% -1.2%
Source Colliers International India Research 1Indicative Grade A rentals in INR per sq ft per month
Colliers Radar
NOIDA | OFFICE 15 January 2018

2 Colliers Radar | 15 January 2018 | Noida | office | Colliers International
Fig 1. Rental Forecast (INR per sq ft per month)
Fig 2. Supply, Absorption & Vacancy Forecast
Major Lease Transactions in 2017
Client Building Name Area (sq ft) Location
Amazon Brookfield Infospace
150,000 Sec-62A
Intel Individual Building 120,000 Industrial Noida
Ameriprise Individual Building 120,000 Industrial Noida
NTT Data Oxygen Business park
100,000 Noida Expressway
3 Piller Brookfield Infospace
60,000 Sec-62A
Source Colliers International India Research
Notes: All figures are based on market information as on 25 Dec 2017
The investor interest remained titled towards residential
market in NOIDA in 2017 and investors such as Altico
Capital, Dalmia Group and Piramal showed keen interest
in projects looking for last-mile funding. We have not
witnessed any major commercial transaction except for
INR200 crore (USD 31.3 million) investment by ASK
property investment advisors in a mix-use project by
ATS infrastructure.
Ample supply to keep vacancy levels high
We assess that NOIDA's Grade A office market is
currently in the period of modest supply addition, with
about 2.2 million sq ft (0.2 million sq m) of office space is
in an advanced stage of development. In 2017, NOIDA
witnessed completion of only 1.59 million sq ft (0.15
million sq m) of office space. We anticipate the total
stock of NOIDA market to increase by about 45% in next
3 to 5 years with approximately 13 million sq ft (1.2
million sq m) of supply pipeline.
Colliers' Forecast
Recently, the state government revived the plan to build
an international airport in Jewar which should boost the
attractiveness of micromarkets such as Expressway &
Greater NOIDA. The travel time between NOIDA and the
business districts of South Delhi will reduce significantly
due to operation of Delhi Metro Magenta line which
operates from Botanical Garden to Kalkaji Mandir.
The lack of elite Grade A building and substandard
building management is one of the reason why
corporates shying away from this city despite lower
rentals. Upcoming commercial buildings in Expressway
set to change the market perception from IT dependent
to a multi-faceted tenant mix commercial destination.
However, in our opinion, developers in NOIDA needs to
focus on improving the quality of buildings and property
management to attract the corporate occupiers.
0
20
40
60
80
100
Q4 2
009
Q4 2
010
Q4 2
011
Q4 2
012
Q4 2
013
Q4 2
014
Q4 2
015
Q4 2
016
Q4 2
017
Q4 2
018F
Q4 2
019F
Q4 2
020F
0%
10%
20%
30%
40%
50%
0.0
1.0
2.0
3.0
4.0
5.0
6.0
7.0
2010 2011 2012 2013 2014 2015 2016 2017 2018F 2019F 2020F
New Supply (In Mn sqft) - - Absorption (In Mn sqft) - -
Vacancy (In %) - -
Forecast
For more information:
Surabhi Arora Senior Associate Director | Research | India +91 98 7175 0808 [email protected]
Sanjay Chatrath Executive Director | NCR [email protected] Vineet Anand Director | Office Service | NCR [email protected]
Ritesh Sachdev Senior Executive Director | Occupier Services | India [email protected]
Regus Assotech Business, Cresterra Upper Ground Level, Tower 2, Sector 135, Noida 201301 India
Copyright © 2018 Colliers International.
The information contained herein has been obtained from
sources deemed reliable. While every reasonable effort has
been made to ensure its accuracy, we cannot guarantee it. No
responsibility is assumed for any inaccuracies. Readers are
encouraged to consult their professional advisors prior to
acting on any of the material contained in this report.

Supply to
complement
demand in 2018 Teni Alice Abraham | Analyst | Bengaluru
In 2017, Bengaluru retained its dominant position in
office sector among all the Indian cities and
accounted for the highest percentage of overall
leasing volume. While the state government is
inclined to improve infrastructure and revise the
development policy, we expect Bengaluru to remain
the preferred city for technology occupiers. Given a
robust supply pipeline, we expect healthy leasing
activity to continue in 2018 and subsequent years.
Since tenants are focusing more on workplace
strategies to create a more collaborative working
environment and save on rents, demand for flexible
workspace is set to improve.
Forecast at a glance
Demand New technology and software development companies should drive demand momentum in coming years
Supply Demand likely to outstrip supply despite estimated new supply of 26 million sq ft (2.4 million sq m) over next 3 years, representing 20% increase in total stock
Vacancy rate Vacancy to remain under pressure and should gradually decrease to 7% by the end of 2020 from current 9%
Rent Rents to increase by 5-8% per annum over next 3 years with demand outstripping supply in preferred micromarkets
Price Capital values are set to increase in proportion to rental values.
Strong office demand to persist in 2018
Notwithstanding the speculation about the competition
from emerging neighbour, Hyderabad and the swelling
concerns of automation and its impact on office market,
Bengaluru maintained its Silicon Valley status and
recorded the highest gross absorption of 15.3 million sq
ft (1.4 million sq m) in 2017, representing 36% share of
the all India absorption. Out of this 1.3 million sq ft are
pre-commitments which got finalised in 2017. A
significant increase of 20% from the 2016 number of
12.8 million sq ft (1.18 million sq m).
We attribute the increase in absorption to steady
expansion by technology occupiers who contributed
about 56% of the total demand. Banking, Financial
Services & Insurance (BFSI) and Engineering &
Manufacturing followed with 11% and 9% share
respectively. As forecasted, Coworking operators with
7% share of overall office leasing continued to expand in
2017 and leased almost twice as much office space as in
2016. We anticipate that many more flexible workspace
operators will launch coworking spaces in 2018, not only
because Bengaluru houses the highest number of start-
ups but also in order to target large occupiers looking for
additional flexible office space. We anticipate the office
market will remain robust, with average gross absorption
of 14 million sq ft (1.3 million sq m) absorption YOY in
the next 3 years.
Rental Value Trends
Micromarkets Rental Values1
QOQ Change
YOY Change
CBD 110 - 190 7.1% 25.0%
Outer Ring Road (Sarjapur - Marathahalli)
80 - 90 6.3% 9.7%
Outter Ring Road (K.R. Puram - Hebbal)
70 - 85 3.3% 9.2%
Bannerghatta Road 60 - 85 16.0% 17.9%
Hosur Road 32 - 42 5.7% 5.7%
EPIP Zone/Whitefield 35 - 45* 0.0% 11.1%
Electronic City 35 - 45 14.3% 17.6%
Source: Colliers International India Research 1Indicative Grade A rentals in INR per sq ft per month * Excluding ITPL rent of Rs. 52 per sq ft per month
Colliers Radar
BENGALURU | OFFICE 15 January 2018

2 Colliers Radar | 15 January 2018 | BEngaluru | office | Colliers International
For more information:
Surabhi Arora Senior Associate Director Research | India +91 98 7175 0808 [email protected]
Goutam Chakraborty Senior Director | Office Services Bengaluru [email protected]
Ritesh Sachdev Senior Executive Director | Occupier Services | Bengaluru [email protected]
Prestige Garnet, Level 2 Unit No. 201/202, 36 Ulsoor Road Bengaluru - 560042 India
Surabhi Arora Senior Associate Director Research | India +91 98 7175 0808 [email protected]
Hari Prakash Senior General Manager Office Services | Hyderabad [email protected]
Ritesh Sachdev Senior Executive Director Occupier Services | India [email protected]
Level 7, Maximus Towers Building 2A, Mindspace Complex, HITEC City, Hyderabad - 500 081, India
Fig 1: Rental Forecast (INR per sq ft per month)
Fig 2: Supply, Absorption & Vacancy Forecast
Major Lease Transactions in 2017
Client Building Name Area
(sq ft)
Location
Siemens Gold hill Supreme Tech Park
600,000
Electronic City
Microsoft
Prestige Fern Galaxy 589,000
ORR
Qualcomm Bagmane Constellation Business Park
560,000 ORR
Lowe's Services
Manyata Business Park 489,000
ORR
Anthem Inc.
Manyata Business Park 477,000 ORR
Source: Colliers International Research Note: All figures are based on market information as on 25 Dec 2017
In 2017, Outer Ring Road (ORR) seized 46% share of
the total leasing volume followed by the Central
Business District (CBD) 9%, the Secondary Business
District (SBD) 13%, Whitefield (7%) and Electronic City
(6%) and, North (5%) and others (12%)
Supply to complement upcoming demand in 2018
Collier's database suggests new supply of 12.7 million sq
ft (1.1 million sq m) was added to the city inventory in
2017, recording a 30% increase from 2016. About 26
million sq ft (2.4 million sq m) of grade A office space is
scheduled for completion in Bengaluru between now and
2020. More than 60% of the total upcoming space is
concentrated in ORR and Whitefield, while rest of the
space is distributed among various micromarkets such
as North (10%), SBD (7%) and other micromarkets
(14%). We expect micromarkets such as ORR and
Whitefiled along with emerging market such as North
Bengaluru to complement the increasing demand.
We recorded an average rental increase of 13.7% YOY
in Bengaluru in 2017, the highest in India against a
background of demand outstripping the supply. While
sizable supply is under construction, we cannot rule out
about 8-10% YOY increase in grade A rents due to high
demand in preferred micromarkets.
Colliers' Forecast
We expect, demand to remain robust in Bengaluru.
Policy initiatives such as Revision of Master Plan (RMP)
2031 and Transit Oriented Development (TOD) should
further boost the supply situation. The upcoming
infrastructure such as Namma Metro Phase 2
(Bayapanahalli to Whitefield), metro connectivity to
Karnataka International Airport (KIA) and signal-free 17
km road extension of the ORR (Silk Road to Mysore
Road) is likely to address the infrastructure issues.
0
20
40
60
80
100
Q4 2
010
Q4 2
011
Q4 2
012
Q4 2
013
Q4 2
014
Q4 2
015
Q4 2
016
Q4 2
017
Q4 2
018F
Q4 2
019F
Q4 2
020F
0%
5%
10%
15%
20%
25%
0.0
4.0
8.0
12.0
16.0
New Supply (In Mn sqft) Absorption (In Mn sqft)
Vacancy (In %)
Copyright © 2018 Colliers International.
The information contained herein has been obtained from
sources deemed reliable. While every reasonable effort has
been made to ensure its accuracy, we cannot guarantee it. No
responsibility is assumed for any inaccuracies. Readers are
encouraged to consult their professional advisors prior to
acting on any of the material contained in this report.
Forecast

Steady rental rise
to continue Karthiga Ravindran | Analyst | Chennai
As the market demand continuing to be driven by
Information Technology and Information Technology
enabled Service (IT-ITeS) sector, the occupier
preference remained concentrated in preferred
micromarkets like Old Mahabalipuram Road (OMR)
pre-toll and Mount Poonamallee High (MPH) Road.
Considering the low vacancy in above mentioned
micromarkets, we advise occupiers to be strategic in
choosing their office locations and be proactive in
taking up the available supply.
Forecast at a glance
Demand Demand to gain momentum in MPH Road and Off CBD in 2018; Pallavaram Thoraipakkam Road (PTR) likely to be the next growth centre in south Chennai
Supply Total Grade A office stock to increase about 20% by 2020; Supply likely to be stable over next three years with average annual addition of about 4.0 million sq ft (0.4 million sq m)
Vacancy rate Vacancy should remain at 10-11% as the upcoming supply is likely to offset demand
Rent Steady increase in rents foreseen in preferred micromarkets pushing overall rents to increase by 8-9% by 2020
Price Capital Values set to increase in line with raising rents and steady demand
MPH Road and Off CBD to drive demand in 2018
The leasing segment and enquiries remained consistent
throughout 2017; however, larger size deals were less
than in 2016. We recorded about 4.8 million sq ft (0.46
million sq m) of overall leasing excluding pre-
commitments and renewals in 2017 representing a 10%
dip in absorption volumes YOY.
Regardless of high rents, OMR pre-toll micromarket
continued to garner maximum occupier interest
representing 32% of total transaction volume in the city.
With 17% and 16% share of overall leasing volume
respectively, MPH Road and Off Central Business
District (Off CBD) remained the second most active
market. The increasing demand resulted in almost
double absorption than 2016 in aforementioned
micromarkets. The shares of other micromarkets in the
gross office take up in 2017 is as follows: OMR post-toll
(16%), CBD (13%), GST Road (3%) and Ambattur (3%).
Considering the shrinking vacancy rates coupled with
rising rents in OMR pre-toll, occupiers' focus is likely to
shift towards OMR post-toll over next 3 years due to the
significant supply pipeline. In the medium term,
occupiers' interest likely to remain tilted towards active
business districts such as MPH Road and Off CBD due
to the availability of new Grade A supply.
Rental Value Trends
Micromarkets Rental Values1
QOQ Change
YOY Change
CBD 70 - 90 0.0% 0.0%
Off-CBD 60 - 75 0.0% 0.0%
GST Road 35 - 45 0.0% 0.0%
MPH Road 50 - 65 0.0% 0.0%
OMR Pre-Toll 55 - 78 0.0% 10.8%
OMR Post-Toll 30 - 40 0.0% 0.0%
Ambattur 30 - 45 0.0% 0.0%
Source: Colliers International India Research 1Indicative Grade A (non SEZ) rentals in INR per sq ft per month
Colliers Radar
CHENNAI | OFFICE 15 January 2018

2 Colliers Radar | 15 January 2018 | Chennai | office | Colliers International
Fig 1. Rental Forecast (INR per sq ft per month)
Fig 2. Supply, Absorption & Vacancy Forecast
Major Lease Transactions in 2017
Client Building Name
Area (sq ft)
Location
Amazon
Ramanujan IT SEZ
472,000
Taramani
Valeo
Cee Dee Yes IT Park
200,000
Navalur
BNY Mellon
DLF Cybercity
188,000
Manapakkam
Wells Fargo
Chennai One Magnum
123,000
Thoraipakkam
Renault Nissan
Ascendas Cybervale
120,000
Singaperumal koil
Source: Colliers International Research
Note: All figures are based on market information as on 25 Dec 2017
Supply pipeline to improve over next three years
Due to delay in project completions, 2017 witnessed new
supply of only 1.8 million sq ft (0.2 million sq m)
compared to our forecast of 4.15 million sq ft (0.38
million sq m). We expect, these deferred projects to see
completion in 2018. We also forecast Chennai market to
see an average 4 million sq ft of new supply for next 3
years resulting in 20% increase in total stock by 2020.
About 80% of the total upcoming supply is concentrated
in the southern part of the city followed by MPH Road
(16%) and Off-CBD (4%). Out of all locations in the
south, the PTR in OMR post-toll micromarket likely to get
maximum supply, with about 6.7 million sq ft (0.61 million
sq m) of office space under various stages of
construction. In contrast, scheduled completion in the
OMR pre-toll district amounts to only 2.2 million sq ft (0.2
million sq m) in next three years.
We expect the upcoming supply should ease the overall
vacancy rates and hold down rents in micromarkets like
Off CBD and OMR post-toll. However, rising demand
should push rents higher up to 10-15% in OMR pre-toll
and MPH Road over the next three years.
Colliers' Forecast
Various flexible workspace players made their debut in
Chennai market in 2017. We expect, flexible workspace
operators to increase footprint in the city as existing
players like Cowrks have planned their expansions and
new entrants like Awfis are already in action to set up
their office space in Chennai.
About INR 9850 crore (USD 1.54 billion) investment
announcements by companies like PSA, CEAT, Xuzhou
and Yamaha Musicals should increase the contribution
of automobile and manufacturing in office demand.
Special Economic Zones (SEZs) should continue to drive
sustained demand with increasing pre-commitments in
upcoming projects.
0
20
40
60
80
100
Q4 2
008
Q4 2
009
Q4 2
010
Q4 2
011
Q4 2
012
Q4 2
013
Q4 2
014
Q4 2
015
Q4 2
016
Q4 2
017
Q4 2
018F
Q4 2
019F
Q4 2
020F
0%
5%
10%
15%
20%
25%
0.0
1.0
2.0
3.0
4.0
5.0
6.0
20
10
20
11
20
12
20
13
20
14
20
15
20
16
20
17
20
18
F
20
19
F
20
20
F
New Supply (In Mn sqft) Absorption (In Mn sqft)
Vacancy (In %)
Forecast
For more information:
Surabhi Arora Senior Associate Director Research | India +91 98 7175 0808 [email protected]
Shaju Thomas Director Office Services | Chennai [email protected]
Ritesh Sachdev Senior Executive Director Occupier Services | India [email protected]
7th Floor, Infinite Tower A 21-22, Thiru-Vi-Ka Industrial Estate Guindy, Chennai - 600032 India
Copyright © 2018 Colliers International.
The information contained herein has been obtained from
sources deemed reliable. While every reasonable effort has
been made to ensure its accuracy, we cannot guarantee it. No
responsibility is assumed for any inaccuracies. Readers are
encouraged to consult their professional advisors prior to
acting on any of the material contained in this report.

Slower take-up
amid low vacancy Surabhi Arora | Sr. Associate Director | India
Chronically short stock of Grade A commercial
assets is making commercial leasing harder in the
Pune market. The market for existing commercial
office assets has been a developer market for nearly
two years with less than 5% vacancy on hand. While
the completion of a handful of Grade A commercial
properties may ease some of the pressure, we do
not expect the situation to reverse any time soon.
This will limit the upside to the leasing market's
contribution to overall commercial market growth in
2018. In view of the restricted supply, we advise
tenants to look for pre-commitments in upcoming
projects to support their expansion plans.
Forecast at a glance
Demand Likely to remain concentrated in micro markets such as Hinjewadi and Kharadi; technology companies continue to drive demand
Supply Supply likely to remain restricted; about 11 million sq ft (1.02 million sq m) is schedule for completion between now and 2020 but completions may be deferred
Vacancy rate Inventory pressure unlike to ease soon; vacancy set to remain below 5% in Grade A developments
Rent We expect an average 5-6% upward movement in rents YOY in 2018 due to restricted new supply and lower vacancy levels
Price Likely to witness upward pressure with increasing activity by investors
Inventory pressure unlikely to reverse anytime soon
In line with our forecast, the overall leasing volumes have dwindled further in 2017 due to the scarcity of quality supply. The total gross absorption excluding renewals and pre-commitments amounted to only 3.5 million sq ft (0.3 million sq m) in 2017, i.e. about 11% lower than in 2016 and almost 30% below the level of 2015. Notwithstanding the supply issues, the availability of a large talent pool has helped to sustain occupier interest in the Pune market, and so far we have not witnessed any significant relocation from the city. However, in our view, the ongoing leasing squeeze in Pune is structural in nature, and any further delay in completion of current under-construction projects will hamper occupiers' sentiment. Considering the limited new supply pipeline and low vacancy rate, we expect the absorption level in 2018 to remain at par with 2017. Technology firms are likely to remain the leading demand driver; they contributed about 72% of the overall transaction volumes in 2017. We expect more traction in coming years from flexible workspace operators which made their debut in the Pune market in 2017 with a 1.1% share of overall leasing transactions. 2017 witnessed the vacancy level drop to 5.0% from 9.8% in 2016. Despite sustained demand, new supply totalled only 2.0 million sq ft (0.18 million sq m) in 2017. Most of this supply was pre-committed by the existing
Rental Value Trends
Micromarkets Rental Values1
QOQ
Change
YOY Change
Baner 57-65 0.0% 8.0%
Bund Garden 55-70 0.0% 0.8%
Airport Rd/Pune Station 65-90 3.3% 3.3%
Aundh 60-65 4.2% 9.6%
Senapati Bapat Road 65-125 2.7% 8.6%
Bavdhan 45-50 0.0% 6.7%
Kalyani Nagar 55-65 2.6% 2.6%
Nagar Road 55-65 0.0% 2.6%
Hinjewadi 45-55 1.0% 1.0%
Hadapsar/Fursungi 68-75 2.1% 12.6%
Kharadi 55-110 8.6% 14.6%
Source Colliers International India Research 1Indicative Grade A rentals in INR per sq ft per month
Colliers Radar
PUNE | OFFICE 15 January 2018
2 Colliers Radar | 15 January 2018 | Pune | office | Colliers International
Fig 1. Rental Forecast (INR per sq ft per month)
Fig 2. Supply Absorption & Vacancy Forecast
Major Lease Transactions in 2017
Client Building Name Area
(sq ft)
Location
TIAA Global Business Services
World Trade Centre
195,000 Kharadi
Barclays Technology Centre
EON Free Zone 100,000 Kharadi
HSBC Software Development
Manikchand Icon Wing- B
90,000 Yerwada
Microland LTD Blue Ridge 88,700 Hinjewadi-1
HSBC Software Development
Manikchand Icon Wing- B
80,000 Dhole Patil Road
Source: Colliers International Research
Note: All figures are based on market information as on 25 Dec 2017
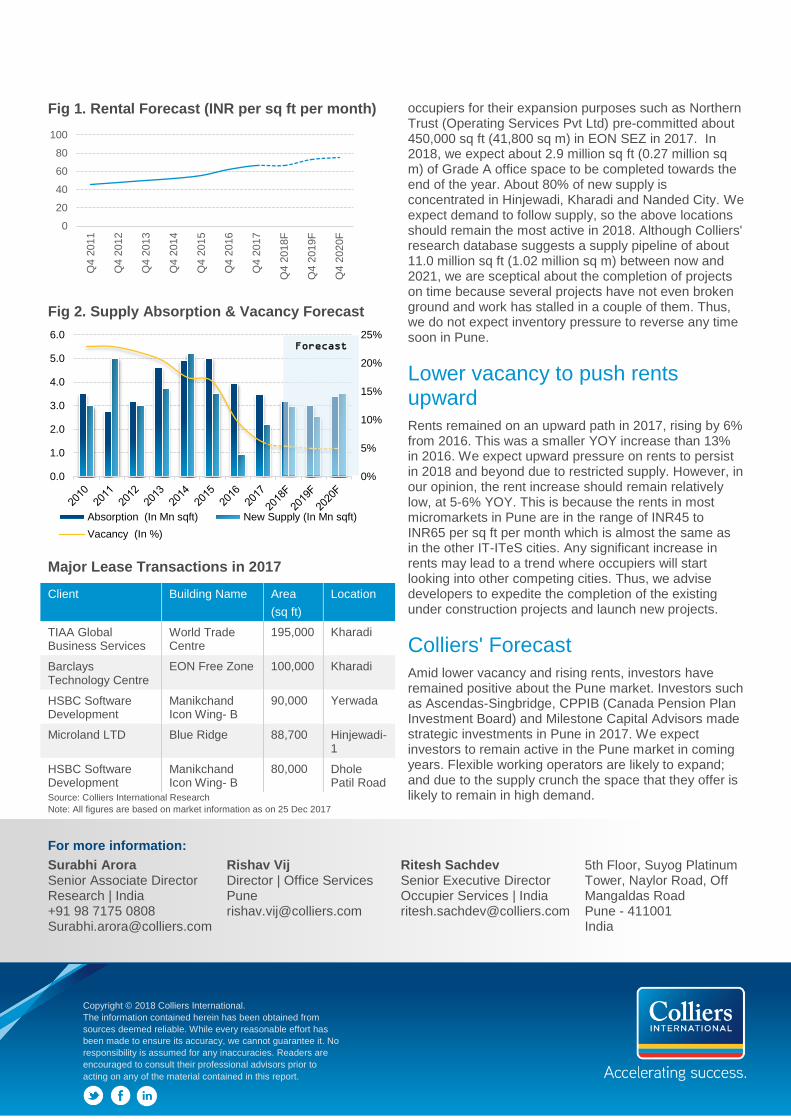
occupiers for their expansion purposes such as Northern Trust (Operating Services Pvt Ltd) pre-committed about 450,000 sq ft (41,800 sq m) in EON SEZ in 2017. In 2018, we expect about 2.9 million sq ft (0.27 million sq m) of Grade A office space to be completed towards the end of the year. About 80% of new supply is concentrated in Hinjewadi, Kharadi and Nanded City. We expect demand to follow supply, so the above locations should remain the most active in 2018. Although Colliers' research database suggests a supply pipeline of about 11.0 million sq ft (1.02 million sq m) between now and 2021, we are sceptical about the completion of projects on time because several projects have not even broken ground and work has stalled in a couple of them. Thus, we do not expect inventory pressure to reverse any time soon in Pune.
Lower vacancy to push rents upward
Rents remained on an upward path in 2017, rising by 6% from 2016. This was a smaller YOY increase than 13% in 2016. We expect upward pressure on rents to persist in 2018 and beyond due to restricted supply. However, in our opinion, the rent increase should remain relatively low, at 5-6% YOY. This is because the rents in most micromarkets in Pune are in the range of INR45 to INR65 per sq ft per month which is almost the same as in the other IT-ITeS cities. Any significant increase in rents may lead to a trend where occupiers will start looking into other competing cities. Thus, we advise developers to expedite the completion of the existing under construction projects and launch new projects.
Colliers' Forecast
Amid lower vacancy and rising rents, investors have remained positive about the Pune market. Investors such as Ascendas-Singbridge, CPPIB (Canada Pension Plan Investment Board) and Milestone Capital Advisors made strategic investments in Pune in 2017. We expect investors to remain active in the Pune market in coming years. Flexible working operators are likely to expand; and due to the supply crunch the space that they offer is likely to remain in high demand.
0
20
40
60
80
100
Q4 2
011
Q4 2
012
Q4 2
013
Q4 2
014
Q4 2
015
Q4 2
016
Q4 2
017
Q4 2
018F
Q4 2
019F
Q4 2
020F
0%
5%
10%
15%
20%
25%
0.0
1.0
2.0
3.0
4.0
5.0
6.0
Absorption (In Mn sqft) New Supply (In Mn sqft)
Vacancy (In %)
Forecast
For more information:
Surabhi Arora Senior Associate Director Research | India +91 98 7175 0808 [email protected]
Rishav Vij Director | Office Services Pune [email protected]
Ritesh Sachdev Senior Executive Director Occupier Services | India [email protected]
5th Floor, Suyog Platinum Tower, Naylor Road, Off Mangaldas Road Pune - 411001 India
Copyright © 2018 Colliers International.
The information contained herein has been obtained from
sources deemed reliable. While every reasonable effort has
been made to ensure its accuracy, we cannot guarantee it. No
responsibility is assumed for any inaccuracies. Readers are
encouraged to consult their professional advisors prior to
acting on any of the material contained in this report.

Office supply to
surge in 2018 Karthiga Ravindran | Analyst | Chennai
Hyderabad's office leasing demand continues to be
notably progressive since 2015 after the bifurcation
of the states (Andhra Pradesh and Telangana). With
respect to our viewpoint on strong fundamentals of
this market, we expect, Hyderabad to witness
consistent traction in 2018 as well. However, looking
at the excessive supply pipeline of about 32.6 million
sq ft (3.0 million sq m) scheduled for completions
over next 3 years, we advise developers to be
strategic in their plans and avoid too much of
speculative construction to maintain the demand-
supply balance in coming years
Forecast at a glance
Demand Steady demand likely with expansion plans of technology and e-commerce players; Coworking to gain momentum
Supply Robust supply pipeline of about 12.0 million sq ft (1.1 million sq m) in 2018. Over next 3 years, office stock likely to reach oversupply with an increase of about 70% in total stock if all the under-construction buildings follow scheduled completions.
Vacancy rate Vacancy to rise and remain in 13-15% range in next three years due to huge upcoming supply
Rent Keeping in view the upcoming supply, we expect rents to stabilize in 2018
Price Steady increase in capital values likely to continue in Secondary Business District (SBD) micromarket
4% rise in demand in 2017; 2018 outlook remains steady
Followed by a record year in the city's office leasing
market in 2016, Hyderabad witnessed another
remarkable year in 2017 with about 4% raise in leasing
volume at 5.8 million sq ft (0.4 million sq m). In line with
our earlier forecast, the demand was driven by the
expansion of large scale technology companies like
Deloitte, Qualcomm, Microsoft etc. The city also
witnessed an additional 0.8 million sq ft (0.07 million sq
m) of pre-commitments. In our opinion, Hyderabad
market is poised to grow steadily in coming years and to
be complemented by huge Grade A supply.
In 2017, the city's SBD remained the preferred
destination for technology occupiers and the
micromarket accounted for a 91% share in total leasing.
Other micromarkets such as Central Business District
(CBD), Off CBD and Peripheral Business District (PBD)
accounted each 3% share of total leasing. Being a well-
established technology hub with increasing quality Grade
A office developments, the SBD micromarket should
remain as the choice of occupiers eyeing for vast talent
pool in upcoming years.
With only 22% of deals signed in Special Economic
Zones (SEZs), the occupier preference in Hyderabad
stayed tilted towards non-SEZ spaces in 2017. In our
opinion, as occupiers focus remains on quality and
amenities irrespective of SEZ or non SEZ spaces, we
foresee that the trend will continue in upcoming years as
well.
Rental Value Trends
Micromarkets Rental Values1
QOQ Change
YOY Change
CBD 45 - 50 0.0% 0.0%
Off-CBD 45 - 50 0.0% 0.0%
SBD 55 - 65 0.0% 4.3%
PBD 25 - 30 0.0% 0.0%
Source Colliers International India Research 1Indicative Grade A rentals in INR per sq ft per month
Colliers Radar
HYDERABAD | OFFICE 15 January 2018

2 Colliers Radar | 15 January 2018 | Hyderabad | office | Colliers International
For more information:
Surabhi Arora Senior Associate Director Research | India +91 98 7175 0808 [email protected]
Hari Prakash Senior General Manager Office Services | Hyderabad [email protected]
Ritesh Sachdev Senior Executive Director Occupier Services | India [email protected]
Level 7, Maximus Towers Building 2A, Mindspace Complex, HITEC City, Hyderabad - 500 081, India
Fig 1: Rental Forecast (INR per sq ft per month)
Fig 2: Supply, Absorption & Vacancy Forecast
Major Lease Transactions in 2017
Client Building Name Area
(sq ft)
Location
Deloitte Meenakshi Tech 1,400,000 Hitech City
Qualcomm Mindspace Building No.7
200,000 Hitech City
Microsoft Knowledge City 166,000 Hitech City
Redbricks Phoenix Primea 140,000 Hitech City
Service Now
Knowledge City 136,300 Hitech City
Source: Colliers International Research
Note: All figures are based on market information as on 25 Dec 2017
Vacancy rate set to rise over next 3 years with upcoming supply
About 32.6 million sq ft (3.0 million sq m) of new supply
is at various stages of construction in Hyderabad.
Assuming, scheduled construction completion, we
expect new supply in 2018 to nearly triple in comparison
to 2017 with the addition of about 12.0 million sq ft (1.1
million sq m) of Grade A office space.
In our opinion, the demand side initiatives by the state
government such as recently held Global
Entrepreneurship Summit (GES 2017), the operation of
metro rail coupled with a supply-side push by clearance
of land litigation issues, and the auction of huge land
parcels for developments are likely to further drive the
market. However, we advise developers to keep a close
eye on demand and plan the construction timelines over
next 3 years to avoid oversupply by 2020.
Colliers' Forecast
According to Oxford Economics forecast released in
September 2017, Hyderabad should achieve 7.2%
average annual GDP growth over the period 2017 to
2021 driven by Pharmaceutical, biotech and IT-ITeS
sector. We expect the economic expansion driven by
these sectors should help boost the office demand
further in coming years.
Regardless of the concerns about automation and
layoffs, the technology and e-commerce players like
Google, Deloitte, Accenture, Amazon and alike are likely
to continue expanding their footprint in the city. With
coworking / shared spaces gaining thrust in Hyderabad
among start-ups, small companies and even with large
companies for specific project needs, the city likely to
become the next target city for shared office spaces.
30
35
40
45
Q4 2
012
Q4 2
013
Q4 2
014
Q4 2
015
Q4 2
016
Q4 2
017
Q4 2
018F
Q4 2
019F
Q4 2
020F
0%
5%
10%
15%
20%
25%
0.0
1.0
2.0
3.0
4.0
5.0
6.0
Absorption (In Mn sqft) New Supply (In Mn sqft)Vacancy (In %)
Forecast
Copyright © 2018 Colliers International.
The information contained herein has been obtained from
sources deemed reliable. While every reasonable effort has
been made to ensure its accuracy, we cannot guarantee it. No
responsibility is assumed for any inaccuracies. Readers are
encouraged to consult their professional advisors prior to
acting on any of the material contained in this report.

Copyright © 2018 Colliers International.
ensure its accuracy, we cannot guarantee it. No responsibility is assumed for any inaccuracies. Readers are encouraged to consult their professional advisors prior to acting on any of the material contained in this report.
About Colliers International Group Inc.Colliers International Group Inc. (NASDAQ: CIGI; TSX: CIG) is an industry leading global real estate services company with more than 15,000 skilled professionals operating in 68 countries. With an enterprising culture
occupiers, owners and investors worldwide. Services include strategic advice and execution for property
solutions; appraisal, valuation and tax consulting; customized research; and thought leadership consulting.
help clients accelerate their success. Colliers has been ranked among the tInternational Association of Outsourcing Professionals’ Global Outsourcing for 11 consecutive years, more
colliers.com
396 68 countries on 6 continentsUnited States: 153 Canada: 29 Latin America: 24 Asia : 36 ANZ: 43 EMEA: 111
$2.6billion in annual revenue
2billion square feet under management
15,000professionals
Primary Authors:
Regional Authors:
Saif Lari | Assistant Manager
Teni Abraham | Analyst
Karthiga Ravindran | Analyst
Contributors:
Surabhi AroraSenior Associate DirectorResearch | India +91 9871750808surabhi.arora @colliers.com
Amit Oberoi | National DirectorKnowledge Systems | [email protected]
Andrew Haskins | Executive Director Research | [email protected]
For more information, please contact:Ritesh Sachdev | Senior Executive DirectorOccupier Services | [email protected]
Colliers International | IndiaIndiabulls Finance Centre, 17th Floor, Unit No. 1701,Tower 3, Senapati Bapat Marg, Elphinstone (W)Mumbai - 400 013 | India+ 91 224 924 9780