collecting ab d processing data on fish … · collecting ab d processing data on fish eggs and...
TRANSCRIPT

COLLECTING Ab D PROCESSING DATA ON FISH EGGS AND LARVAE IN THE CALIFORNIA CURRENT REGION
BY
David Kramer, Mary J. Kalin, Elizabeth G . Stevens, James R. Thrailkill, and James R. Zweifel
National Marine Fisheries Service Southwest Fisheries Center La Jolla, California 92037
ABSTRACT
Descriptions are given for the methods used by the California Cooperative Oceanic Fisheries Investigations to collect and process plankton. These include details of the design of the station pattern in the survey area, the gear and methods used for plankton hauls, measuring plankton, and sorting plankton for fish eggs and larvae; some pro- cedures for identifying fish eggs and larvae; details of “hand” processing data for standardization of numbers of organisms collected in all plankton hauls; calibration of flowmeters; and some new procedures for automatic data processing.
INTRODUCTION
For more than 20 years the California Coop- erative Oceanic Fisheries Investigations (Cal- COFI) have conducted a program of intensive research in the California Current region in a designated area of approximately 500,000 square miles from the California-Oregon border to the t ip of Baja California. The investigations were originated in 1949 to determine the reason for the decline of the Pacific sardine fishery. Since then, the data have contributed a wealth of in- formation from which it has been possible to study the effects of the biological, physical, and chemical environment on all the resources in the area.
The chief participants in CalCOFI in ships, personnel, equipment, shoreside facilities, and data collection, processing and analyses are the California Department of Fish and Game (CF- &G) on the evaluation of resources by census of young and adult fishes, the University of Cal-
ifornia, Scripps Institution of Oceanography (SIO) , on the studies of the physical and chem- ical data and selected groups of invertebrates, and the National Oceanic and Atmospheric Ad- ministration (NOAA) , National Marine Fish- eries Service (NMFS) , formerly the Bureau of Commercial Fisheries, on the evaluation of re- sources by censuses of fish eggs and larvae. Other participating groups are the California Academy of Sciences and the Stanford Univer- sity, Hopkins Marine Station, chiefly in labora- tory research.
It is the purpose of this report to describe the methods and gear used by the CalCOFI for col- lecting and processing data on fish eggs and lar- vae. Some of these have been described in vary- ing detail (Ahlstrom, 1948, 1950) but none with the full treatment that we feel is warranted, as now reported here, in view of the requests for greater detail by visitors to our laboratory and some investigators who have cooperated with us in data collection a t sea.
1

THE SURVEY PATTERN AND AREA The pattern of stations (Fig. 1 ) covered by
most of the CalCOFI surveys was designed orig- inally on the basis of a centric-systematic-area sampling scheme (Milne, 1959) to determine the major spawning areas of the Pacific sardine off the coasts of the United States and Baja Cali- fornia, Mexico. This was done by conducting surveys on lines spaced 120 miles apart from the Columbia River to Sebastian Vizcaino Bay. As the spawning areas were delimited, additional lines of stations were added between the cardi- nal lines, and the surveys were concentrated off the coasts of California and Baja California.
The original lines of the pattern were based on line 80 off Point Conception, Calif., and set parallel to that line 120 miles apart, north to line 10 off the United States-Canadian border, and south to line 120 off Point Eugenia, Baja California. They were plotted to extend 30” southwest of lines of latitude, thus perpendicular to the coast of central California, north of Point Conception. It was intended that the 120-mile spacing would allow for additional lines to be plotted 12 miles apart between the cardinal lines and still be designated by whole numbers with- out resorting to fractions. However, when lines were added between cardinal lines, i t was deemed sufficient to space them a t 40-mile intervals. Thus, the major pattern consists of the cardinal lines in multiples of 10 ending in 0’s and the or- dinal lines ending in 3’s and 7’s. During the course of the investigations, lines were added finally to include line 157 just south of Cape San Lucas, Baja California.
The stations on the lines were laid out on the basis of a perpendicular to line 80, a t a point designated station 80.60. The perpendicular, through all lines parallel to line 80, aligned the stations designated as 60’s.
Most of the original stations shoreward and seaward from station 60 were plotted 40 miles apart, which allowed stations between the 40- mile points to be plotted as close as 4 miles apart and still retain whole numbers. In most cases, stations between the 40-mile points have been only 20 miles apart. Those closer than 20 miles, e.g., inshore or near islands, were so placed sim- ply because a 20-mile spacing would have placed a station on land and the omission of such a sta- tion would have left too large a space between
the last plotted station and the land. Closer spa- cing than 4 miles, using fractions for station numbers, has been resorted to in some instances, e.g., to locate the eggs of the increasingly rare Pacific sardine during the peak of its spawning season.
DATA COLLECTION
The Research Vessel A vessel used to collect oceanographic data
should be a relatively stable platform a t sea and be capable of reasonably rapid coverage of large areas for long periods of time. Today, most ves- sels used for biological and hydrographic re- search on the high seas are 100 or more feet long, powered to cruise at 10 to 15 knots, and capable of staying a t sea for 14 to 30 days. Some ships are of multipurpose design in that they can col- lect plankton and hydrographic data and convert to fishing operations to handle large fishing nets, trawls, seines, etc.
Gear common to the collections of plankton and hydrographic data are power winches equipped with high-strain wire, an over-the-side platform for handling gear clear of the ship’s side, and a weight a t the end of the wire. Ship- board facilities should include sheltered spaces for laboratory work and adequate storage spa- ces for gear and samples.
Essential gear for the collection of plankton are fine mesh plankton nets with detachable cod ends, rings to keep net mouths open, a bridle assembly to tow the nets, a cable clamp to attach a lead line to the towing cable, an inclinometer to measure angles of stray during a net tow, and flowmeters to measure water volume strained by the nets.
Some of the gear described here have spe- cifications included in figure captions for which simple descriptions will suffice to allow duplica- tion without need for further details. Some are purchased from their manufacturers or distrib- utors. Others have specifications too detailed to be included here. Table 1 lists all of the gear and materials described, the figures in which they are illustrated, and the places of their descrip- tions, and/or sources of specifications and sup- pliers.
The winches used for plankton tows or hydro- graphic casts should be electric or hydraulic and
2

40
3:
3(
2
2
R
,o<
Figure 1.-Basic station plan of the California Cooperative Oceanic Fisheries Investigations (CalCOFI) since 1950. Stations in the Gulf of California were occupied only on special surveys.
3

Table l.-Gear and apparatus used for the collection and processing of data on fish eggs and larvae in the California Current region.
Gear or apparatus Figure Description, specifications and/or source
Collecting Plankton
Hydrographic winch, wire, boom, block
Overside platform (“bucket”)
Weight
Plankton nets
Net rings
Bridle assembly and lead line
Cod end
Adapter-cod end to net
Flowmeter T.S-Flowmeter
(4-blade, &dial)
Inclinometer and telemetering circuitry
Cable clamp
Tow data sheet
Carboy for formaldehyde
Plastic syringes w/automatic double valve and cannula Becton, Dickinson (B-D) Yale Luer Lok syringe
B-D Automatic Double Valve for 50-ml syringe B-D Cannula for 20-ml syringe
(20- and 50-ml)
Inside and outside labels for plankton samples
Processing Plankton and Data
2, 3 4, 5, 12
4
6, 13
6
6
7
7
6, 13, 15, 33, 34
3, 8, 9
12
10
16
16, 17
18
Described in text.
Described in text.
Use described in text. Specifications in figure legend.
Described in text. Specifications available from NMFS, SWFC, La Jolla.
Specifications in figure legend.
Specifications in figure legend.
Described in text. Specifications available from NMFS, SWFC, La Jolla.
Specifications in figure legend.
Source of Supply - CM2, Inc., Mountain View, Calif., U.S.A., or Tsurumi Precision Instrument Co. (T.S.K.), Yokohama, Japan.
Use described in text. Specifications available from NMFS, SWFC, La Jolla.
Described in text. Source of supply - Scripps Institution of Oceanography, Research Support Shop. Available as illustrated or with 2 bolts and eyes. When ordering specify cable size for which grooves will be drilled by supplier.
Specifications in figure legend.
Described in text. Available from scientific supply houses.
Described in text. Available from surgical supply houses,
Specdications in text and figure legend.
T-guide and float to measure plankton volume
‘Nylon-mesh draining cone used to measure plankton
Plastic cylinder to measure preservative
21, 22 Specifications in figure.
23
Use described in figure legend.
Described in text and figure legend. Specifications available from NMFS, SWFC, La Jolla.
Specifications in figure legend.
and drain before sorting
23, 24
Microscope, Research Measuring rule for fish larvae
25 -- Described in text.
Available from scientific supply houses.
Board for calibrating flowmeters 33, 34 Specifications in figure legend.
with drum capacities of a t least 30,000 f t capable of handling conductor cable for tele- (9,000 m) , 3/16-in (5 mm) steel wire with a metering data from all depths to which gear may strain capacity of approximately 22,000 lb. be lowered. The NMFS research vessel, David (10,000 kg) -Figure 2. Some winches may be Starr Jordan, is so equipped, with its standard
4

Figure 2.-Starboard winch on N M F S research vessel David Starr Jordan used for plankton tows and Nansen bottle casts (see Table 1) . Details on drum size, wire, boom, and block are described in the text.
hydrographic winch starboard and its conductor- cable winch aport. Additional winches for trawl- ing operations or very heavy gear are located be- low decks with their wire coming above decks to be fairleaded astern to a powered H-frame and a stern ramp. Although the hydrographic-net tow wire is capable of the strain noted above, the boom supporting it (Figs. 2 and 3) can and need only support 5,000 lb. (2,200 kg). The block (Fig. 3) through which the wire is run also is capable of supporting 5,000 lb. and has three wheels of which one is a tensiometer.
To enable handling gear clear of the side of the ship, an overside platform (the “bucket”) - Figures 4 and 5-is another essential aid to data collection. It may be designed to be swung lat- erally outboard as on the Jordan or swung up- ward and outboard onto a ship’s rail to be fas- tened and kept there while at sea. The bucket is constructed of heavy steel, and its bottom is usually a steel grill which can drain immediately if water is shipped into it. A 100-lb. weight (45 kg)-Figure &is always attached to the end of the cable to aid in lowering the plankton net and the hydrographic cast of Nansen bottles.
Laboratory space on a research vessel may be of varying degrees of sophistication in size and
equipment. On a small ship, one space may serve for all functions but must be of sufficient size to accommodate a number of Nansen bottles with thermometers and space to read them, an area with running salt and fresh water and sink for preserving biological specimens and an area for preserving water samples and determining their chemical constituents.
A survey for plankton sampling, extending to 14 or more days, will yield large numbers of bi- ological samples for processing ashore. Ade- quate storage facilities must be available to keep them until off-loaded.
The Plankton Tow The objective of the plankton tow is to obtain
qualitative and quantitative samples of the zoo- plankton to the depth sampled at the time and place of the tow. Most important to the objective are the proper readings and recordings of the flowmeter, the recordings of the various parts of the towing times and wire angles, the neces- sity for the smooth paying out and retrieval of the net, rinsing the net, and the preservation and labelling of the sample.
5

Figure 3.-View of boom and block, upper left (also see Fig. 2 ) , on R/V Jordan. Plankton net tow in progress. Telemetering inclinometer (see also Fig. 8 and 9 ) , used to indicate wire angles, hangs from towing wire. Slack in wire indicates that the net is being lowered. Man on right is the winch operator at winch console, close to rail where he can watch net operations during launching and re- trieval. Man on left will record wire angles when net is retrieved (see plankton tow procedure).
6

THE GEAR
Figure 4.-Weight (100 lb. = 45 kg) being swung over- side at end of towing cable. The weight is a cast-iron tapered cylinder 7% inches (19.0 cm) in diameter, 13 inches (38 cm) high with its taper beginning about 9 inches (22.8 cm) from the bottom. One-inch (2.54 an) stock is anchored in the casting and an eye, 1-5/8-inch (4.5 a) I.D., of the same stock is welded to it. After casting, the unit is heavily galvanized. The diameter of the eye is enough to take a strong shackle and a heavy line through it. Note swivel between the shackles which keeps the weight from twisting the wire. Casing, par- tirally shown at lower right, is used to store the weight when not in use. Overside platform at left (also see Fig. 5 and 12) shows grill floor (description in text).
Plankton nets.-The quantitative plankton collections of the CalCOFI are made chiefly with nets which retain organisms 3 500 microns and 2 333 microns. Note: Most CalCOFI plankton tows were made with a 1-m silk or nylon net (ca. 0.5-mm. mesh). The directions for the tow indicate possible single or double rig.
Figure 5.-Overside platform (“bucket”) described in text, (also see Fig. 4 and 12), used to facilitate handling gear over water and away from side of ship. (The net is the Soutar-Hemingway Animal Trap (SHAT) used for vertical tows; it is not used or described here for standard collections for CalCOFI egg and larva data.)
7

Smith' described the plankton nets used on the surveys in this region and their history of de- sign and material changes from 1939 to 1969. The standard CalCOFI nets presently used have ?/& and l-m mouth openings and are made of nylon mesh (see Table 1 for source of net spe- cifications and Fig. 6 for description of mesh
Smith, P. E. Plankton sampling nets and their data on surveys off California and Baja California since 1939. (Unpublished manuscript.)
sizes and assemblies for making plankton tows with either or both nets). The detachable cod end, also of nylon mesh, in which plankton is concentrated during a tow is illustrated and de- scribed in Figure 7 (source of specifications, Table 1 ) . The adapter to couple the'cod end to the net is described in the caption of Figure 7.
Note: Captions in Figures 4, 6, and 12 emphasize need for swivels in the gear train, usually close to the appa- ratus, to avoid twisting or unlaying wire or lines.
Figure 6.-Standard CalCOFI nets, 1-m mouth opening, 505-p mesh throughout, and 0.5-m mouth opening, 333-fi mesh throughout (see Table 1 for source of specifications). Detachable cod ends are described in Figure 7. Flow- meters (see Table 1 for source of supply) are suspended in the mouth opening (also see Figures 13 and 15) by cloth-covered rubber shock cord. The cord is permanently attached to small metal eyes welded to the mouth rings.
The net rings and braces between them are 1-inch I.D. (25.4 mm) galvanized pipe. Large ring is 1 m I.D., small ring is 0.5 m I.D. Nets are tied to the rings with 1/8-inch (4 mm) cotton cord. The three-way bridle is made up of l/Z-inch (12.7 mm) line (hemp, nylon, or diamond-braided polyethylene). Apex of bridle is a 2- or 3-inch I.D. (51 or 76 mm) steel ring of 3/8-inch (9.5 mm) thickness. The apex is 1 m away from the frame when the lines are stretched evenly. (Note: The points of attachment of the bridle to the rings must be no farther apar t than shown. If greater than shown, the strain during any tow might bend the pipes to which the rings are welded.) The lead line, usually nylon or hemp, is 3/4- to 1-inch (20-25.5 mm) diameter for easy grasping when pulling nets aboard. (Note: A swivel should be attached between the lead line and the apex of the bridle and another swivel located at the cable clamp-(see Fig. 12).
If either net is used alone (see Fig. 14) as has been the case in many years of CalCOFI tows with the 1-m net, the same size rings with the same specifications are used with a three-line bridle attached at equal distances on a ring. For the 0.5-m net a lighter lead line may be used, e.g., 1/2 inch (12.7 mm).
Attachment to the lugs of the meters are by means of brass snap hooks.
8

Figure ".-cod end (left)-(see Table 1 for source of specifications) used to concentrate plankton collected by net, detached from plankton net (right). Both are fastened with hose clamps to an adapter made of polyvinyl chloride (PVC) pipe. The pipe is approximately 4 inches (127 mm) long, 3-1/2-inches (95 mm) O.D. with 1/4- inch (6.6 mm)-thick wall. It is turned down about 3/32 inch (2.5 mm) along its length leaving flanges at each end to keep hose clamps from slipping off during tow; dimensions are not critical when turning the pipe.
Flowmeters.-When the data on plankton are processed, plankton volumes are calculated as m1/1,000 m3 of water strained (see section 011
standardizing data). Water strained through the net is measured by a flowmeter suspended in the mouth of the net (Figs. 6 and 13) -see Table 1 for type of meter used and source of supply. The meters are calibrated according to the meth- ods described below in the section on standardiz- ing data.
Inclinometers.-The CalCOFI standard plank- ton tow is taken by lowering the net(s) to the desired depth and retrieving i t a t a given rate while the ship maintains a speed that keeps the tow wire a t an angle of 45". The instrument that measures the angle of stray, the "wire angle", is a quadrant called the inclinometer (Fig. 8) which, when hung on the wire (Fig. 3 ) , can be monitored to record the wire angles and to regulate the ship's speed to keep the desired angle.
Two kinds of inclinometers have been used.
The one shown in Figure 8 (see Table 1 for source of specifications) is equipped with a tele- metering device modified by Charles W. For- ester', Master of the research vessel Jordan. When equipped for telemetering, the angle of stray can be controlled from the bridge or engine room where wire angles are indicated in micro- amperes (Fig. 9) . Wire angles on the quadrant (Fig. 8) are recorded on the tow sheet by an observer on deck. The second kind of inclinom- eter is simply one without the telemetering de- vice. In this case, an officer of the watch or the recorder observes the wire angles during the tows and signals the bridge or engine room if the desired angle is not being maintained.
PROCEDURE FOR PLANKTON TOW The data sheet.-When the gear is assembled
as shown in Figure 6 and the data sheet for the plankton tow is prepared, the tow is ready to
Originally designed (a portable unit) by Daniel M. Brown, Scripps Institution of Oceanography, La Jolla, California.
9

Figure 8.-Inclinometer used to measure the angle of stray, Lvire angle, of towing cable during plankton net tow (also see Figure 3 where pendulum indicator is more clear; see Table 1 for source of specifications).
begin. The data sheet used here for the plankton tow (Fig. 10, specifications in figure legend) is preprinted to record data for tows up to 300 m of wire out. Twenty items are numbered for auto- matic data processing.
The tow.-Before the net-tow station is occu- pied, the following numbered items should have been recorded on the data sheet.
1-Cruise, 3-Date, 4-Order occupied, 5-Station, 11-Net number (regular and/or fine) this is usually the mesh-size number (see Fig. l o ) , 12-Meter number (regular and/or fine), 14- Carry-over, initial meter reading (regular and/or fine).
The net tow is made off either side of the ship as follows: (Tows off the stern are not rec-
ommended because of turbulence from ships’ screws.)
1. The ship is stopped; the station depth is requested from the bridge and recorded in the lower left hand section of the data sheet.
Note: With 300-m wire out, and the wire angle at 45O, the net is approximately 210 m deep. (Wire out X cosine of 45’-0.707-= net depth.) If station depth is less than 130 fathoms (238 m ) , a “Depth-of-Tow’’ graph (Fig. 11) is referred to in order to determine the proper amount of wire to pay out so that the net and gear will not hit the bottom. Shallow and deep tows are payed out and retrieved at the same rate as routine standard tows. For shallow and deep tows, other than routine (items 20-22), the section 20’-22’ should be used, recording lengths of wire out in decrements of 10, as called by thekinch man, and wire angles (see below, procedure for tow, item 7a) at such calls.
10

Figure 9.-Microammeter (lower left) on console in wheelhouse to indicate angle of s t ray registered by the telemetering inclinometer shown in Figures 3 and 8 (see Table 1 for source of specifications). “200 left” is 5O increase - 50° on inclinometer.
The zeroed meter (lower right) is synchronized with the meter on the deck console (see Fig. 3) enabling the officer on watch to know the amounts of wire out at the same time as the deck force making a net tow.
“0” indicates the desired 45’ wire angle. “200 right” is 5’ decrease - 40’ on inclinometer.
2. The flowmeter is read and checked against the recorded initial meter reading-item 14. If there had been a previous tow, this should have been the final meter reading-item 13 on the previous tow sheet. If the reading changed between tows, the last recording is crossed out, the new reading entered, and an explanation given in the Remarks sec- tion, lower right hand part of the data sheet.
3. The 100-lb. weight is lowered about 10 to 15 m below the surface of the water. If the ship is still slightly underway, the wire is pulled to the side of the bucket and fast- ened close with snap hook attached to the outside of the bucket (Fig. 12).
4. The bridle clamp (Fig. 12)-see Table 1 for source of supply-is fastened tightly to towing wire, and a safety chain or line (Fig. 12) is fastened to the wire above the clamp. The clamp should be about 15 to 20 m above the weight, less in shallow water
5.
6.
7.
(see Depth-of-Tow graph-Fig. 11-for directions concerning weight in shallow tows). The inclinometer is fastened to the wire above the clamp. Enough slack is left on the line to the inclinometer so that when the proper angle is achieved during tow (Fig. 3 ) , i t will not ride up on the cable to hit the block. (If the survey is for net tows only, the inclinometer may be left “permanently” on the tow wire. It is al- ways removed if a hydrographic cast has to be made with the cable.) The cable clamp is lowered to the sea sur- face, and the winch meter is zeroed. The ship is set underway, wind off the bow on the side on which the tow is taken., and the signal to start the tow is given from the bridge. The block or pin, which keeps the blades from revolving between tows, is re- moved from the meter (s) , and the net (s) is thrown into the water (Fig. 13). (Some
11

I 4 9 4 d s' c 9 3 ~2 48 ~7 ' / 7 1 47 WIREOUT1 300 290 280 2 70 260 250 240 2 30 220 I 210
LNLLLS L C L 4 L q8 4'f V L 4 d 0 47 98 Y L
I OTHER, TIME N E T ENTERS WATER: _ _ _ _ _ _ _ _ _ _ _ ANKLE2 WIRE CUT
ANGLES
WIRE OUT I
Figure 10.-Plankton-tow data sheet.-A sample copy of a sheet made out for station 80.52 on cruise 6907-J (see text). The sheet is a water-resistant linen designated "36-lb. ledger." Other qualities of paper, not so designated have been found to deteriorate when wetted by rain or handling. The sheets are delivered in pads glued at one end. When readied for use, two sheets a t a time are torn off, a carbon paper inserted between them, and all are placed on a clipboard and held at the bottom of the sheets by a heavy rubber band.
12

meters have “automatic” blocks that release the impeller blades when water flows through them.)
a. The stop watch is started when the flow- meter (s) is seen to sink below the surf- ace of the water.
1 . Se t weight 1 m e
2 . Read STATIOlv DEPW IN FAWOE t o n e a r e s t 2 fathoms.
3. Read corresponding po int on 45* diagona l l i n e .
4. Let out amount of wire ind ica ted ( i n meters ) : If po int i s on a 10, u s e it: a t 64 fm l e t out 150 m If between lo’s, round off t o lower one:
a t 98 fm l e t out 230 m
I N ~ ~ ~ ~ ~ I l l I l ~ l I I I I I I I I I I I I I I I I I 1 I / I I I I I I I l l I I I I l I I I I I I / 1 1 1 1 1 1 1 1 ’ 1 1 ’ 1 ~ ’ J
0 10 20 30 40 50 60 70 80 q0 100 110 120 130
STATION DEPRl IN FAMOHS
Figure 11.-Depth-of-tow graph.-To be used if station depth is 130 fathoms or less when standard tow is 300 m wire out. If standard tow is less than 300 m wire out, e.g., 100 m or 200 m, the graph is still applicable. For 100-m standard tow, use graph when station depth is 45 fathoms (82 m) or less. For 200-m standard tow, use graph when station depth is 165 fathoms or less. Except for the very shallow depths, 20 fathoms or less, where a tow is practically all a t the surface, the points on the diagonal line indicating the amounts of wire to be paid out a r e calculated to keep the net approximately 10 to 18 m off the bottom. This is con- sidered a safe margin, and i t is recommended that no changes be made when one considers that only the rocking of a ship in heavy seas can reduce a n 8-m safety margin to 5 or 3 m.
13

Figure 12.-Cable clamp attaching plankton net lead line to towing cable. Clamp is tightened (and loosened) with a steel rod (suspended in bucket) inserted into bolt eye. cable clamp, opened, showing grooves to accommodate cable. Note swivel between the two shackles (see legend for Fig. 6) . Small line hanging below man’s right hand is the safety line to be hooked t o the towing cable above the d a m n Line with hook hancinc a t side of bucket is used to retain the towing cable, after the weight is lowered,
Insert: (See Table 1 for source of supply).
- - if the ship has a slight way-on so that clamp and inclinometer can
b.
C.
The net (s) is allowed to stream out (Fig. 14) before lowering, and when it is ob- vious that it is not tangled, the wire is payed out at 50 m/min until the desired depth is reached. At the desired depth, the watch is e. stopped, sinking time is recorded (item 8), and w a t c h zeroed and restarted im- mediately.
Note: Since the net is “fishing” on the way down, sinking time is as important as that of retrieval. Recording the time is simplified if “Time Net Enters Water” is recorded to the nearest 5 min. (This is the item near 20-r 20’-Routine or Other, depending on tow-see later). This time is also recorded at item 6.
d.
be attached.
When the watch is restarted the net(s) is left a t the desired depth for 30 sec (hypothesized that a “falling” net (s) will straighten out at depth in the 30-sec interval). At the end of 30 sec the watch is not stopped, the angle is recorded for that depth, and retrieval is begun a t the rate of 10 m per 30 sec. The angle is recorded a t every 10 m in items 20-22 (Routine) or 20’-22’ (Other).
Note: Ship speed, during sinking, times at depth, and during retrieval, is maintained to keep the wire angle at 4 5 O . In dead calm, it may be necessary to run the ship in circles to maintain the wire angle.
14

Figure 13.-Launching 1/2- and 1-m nets to begin standard CalCOFI plankton tow.
f. The net (s) is brought directly out of the 9. water a t a steady rate. When the flow- meter (s) breaks the surface the watch is stopped. Its reading is the towing time (item 9).
8. The net (s) is rinsed to get all the plankton into the cod end, keeping the cod end(s) dangling and the net r ing(s) a t rail height (Fig. 15). The net(s) is brought aboard (Fig. 6 ) , and the cod end(s) removed, keeping the plankton sample@) from spil- ling ‘back into the net&). The plankton is preserved immediqtely
10.
The plankton is poured from the cod end into a j a r of appropriate size, usually a quart. The cod end is rinsed down to gather the last of the plankton at its bottom. When fairly well drained, the cod end is everted over and into the jar, and the remaining plankton washed off carefully. The preservative (50 ml full-strength for- maldehyde per quart) is added (see note below) when the j a r is a t least three- fourths full of seawater plus plankton in order to avoid “burning” the delicate plank- tonic organisms. Buffer to counteract the
15

Figure 14.-Streaming net just before lowering (see text). This is a 1-m net only.
11.
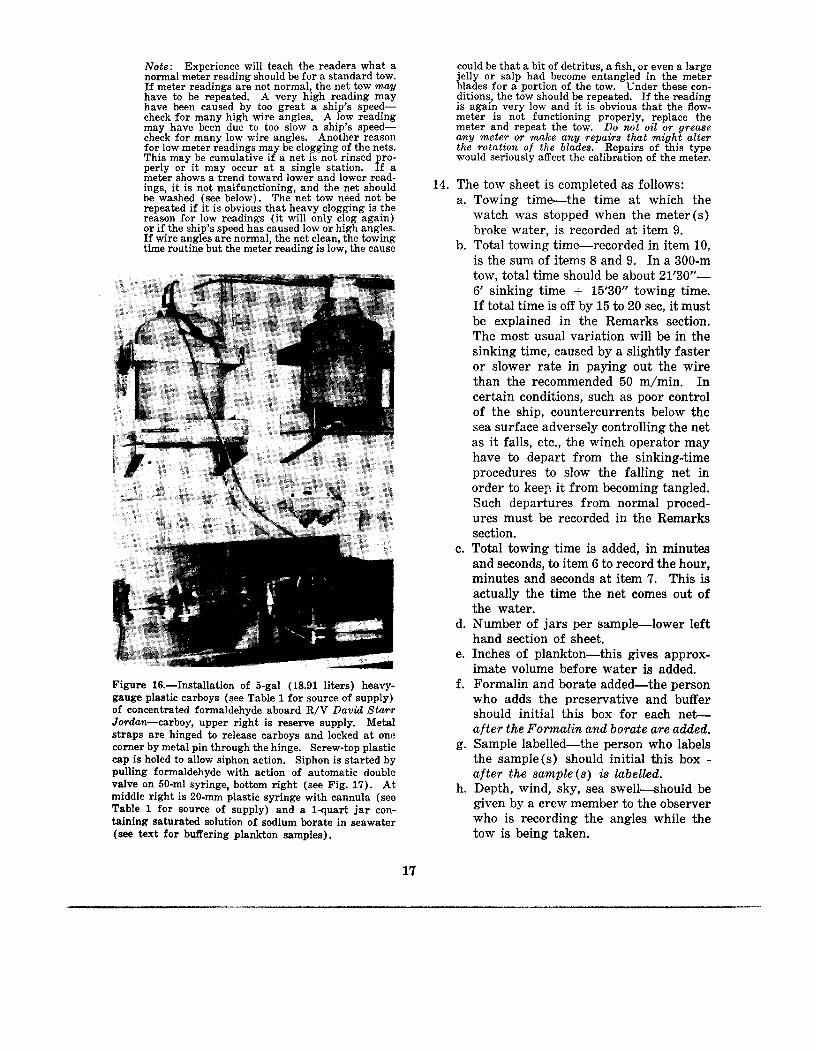
acidity of plankton in Formalin is added- 20 ml per quart- (saturated solution of so- dium borate in seawater). The j a r is filled almost to the top with seawater, capped, and shaken to insure a good mixture of pre- servative and plankton. Note : Full-strength formaldehyde aboard ship is kept in 5-gal polypropylene carboys (see Table 1 for source of supply). With the carboy moored securely above the sink (Fig. 16), the preservative is drawn by siphon action. A further safety mea- sure now adopted is to draw the formaldehyde via a teflon tube into a 50-ml plastic syringe through an automatic double valve (Fig. l7)-see Table 1 for source of supply. The buffer is added with a 20-ml plastic syringe fitted with cannula (a “needle ’ without a point).
Inside and outside labels are filled out. (The greater part of these might be filled out be- fore a station is occupied.) Inside and out-
is noted in the proper space on the tow sheet (see 14d below).
12. The cod end (s) is washed (i t may be left everted) and replaced on the net(s) in preparation for the next tow (Fig. 6 ) ,
13. Before leawing station the meter ( s ) is read and recorded as the final reading at item 13, and the initial reading, item 14, is sub- tracted from item 13.
side labels are illustrated in Figure 18. If Figure 15.-Rinsing down plankton af ter net tow, before removing cod end with sample. Note: Cod end should be removed after it is hung from the ship’s rail as shown in Figure 6.
more than One jar is used for a la- aR fl designated-1 Of 2,
of 3, 2 of 3, etc. The number of jars use.d Of 2, Or
16
Note: Experience will teach the readers what a normal meter reading should be for a standard tow. If meter readings are not normal, the net tow may have to be repeated. A very high reading may have been caused by too great a ship’s speed- check for many high wire angles, A low reading may have been due to too slow a ship’s speed- check for many low wire angles. Another reason for low meter readings may be clogging of the nets. This may be cumulative if a net is not rinsed pro- perly or it may occur a t a single station. If a meter shows a trend toward lower and lower read- ings, i t is not malfunctioning, and the net should be washed (see below). The net tow need not be repeated if i t is obvious that heavy clogging is the reason for low readings (it will only clog again) or if the ship’s speed has caused low or high angles. If wire angles a re normal, the net clean, the towing time routine but the meter reading is low, the cause
Figure 16.-Installation of 5-gal (18.91 liters) heavy- gauge plastic carboys (see Table 1 for source of supply) of concentrated formaldehyde aboard R/V David S t a r r Jordan-carboy, upper right is reserve supply. Metal straps are hinged to release carboys and locked at one corner by metal pin through the hinge. Screw-top plastic cap is holed to allow siphon action. Siphon is started by pulling formaldehyde with action of automatic double valve on 50-ml syringe, bottom right (see Fig. 17). At middle right is 20-mm plastic syringe with cannula (see Table 1 for source of supply) and a 1-quart j a r con- taining saturated solution of sodium borate in seawater (see text for buffering plankton samples).
could be that a bit of detritus, a fish, or even a large jelly o r salp had become entangled in the meter blades for a portion of the tow. Under these con- ditions, the tow should be repeated. If the reading is again very low and i t is obvious that the flow- meter is not functioning properly, replace the meter and repeat the tow. Do not oil o r grease any meter or make any repairs that might alter the rotation of the blades. Repairs of this type would seriously affect the calibration of the meter.
14. The tow sheet is completed as follows: a. Towing time-the time a t which the
watch was stopped when the meter(s) broke water, is recorded a t item 9.
b. Total towing time-recorded in item 10, is the sum of items 8 and 9. In a 300-m tow, total time should be about 21’30’’- 6’ sinking time + 15’30” towing time. If total time is off by 15 to 20 sec, it must be explained in the Remarks section. The most usual variation will be in the sinking time, caused by a slightly faster or slower rate in paying out the wire than the recommended 50 m,/min. In certain conditions, such as poor control of the ship, countercurrents below the sea surface adversely controlling the net as it falls, etc., the winch operator may have to depart from the sinking-time procedures to slow the falling net in order to keep, it from becoming tangled. Such departures from normal proced- ures must be recorded in the Remarks section.
c. Total towing time is added, in minutes and seconds, to item 6 to record the hour, minutes and seconds at item 7. This is actually the time the net comes out of the water.
d. Number of jars per sample-lower left hand section of sheet.
e. Inches of plankton-this gives approx- imate volume before water is added.
f. Formalin and borate added-the person who adds the preservative and buffer should initial this box for each net- after the Formalin and borate are added.
g. Sample labelled-the person who labels the sample(s) should initial this box - after the sample(s) is labelled.
h. Depth, wind, sky, sea swell-should be given by a crew member to the observer who is recording the angles while the tow is being taken.
17

Figure 17.-Two-way, double action valve on syringe (see Table 1 for source of supply). Usually the valve is fixed to the syringe by a screw-on action. In this illustration, the valve is fitted tightly by friction to a disposable plastic syringe.
Figure 18.-Labels for plankton samples. Clockwise from upper lefdl’ie-on cardboard label on l q u a r t (1 liter) bail-type j a r ; screw-on cap labeled with Martek pen, on l-pint (1/2 liter) j a r ; self-adhesive label on screw-on cap; inside label on which information dupli- cates (not in any of these cases) whatever is written on an outside label. Inside label is made of 32-lb., chem- ically resistant linen called “Resist-all.”
i. Amount of clogging-should be checked in one of the appropriate boxes. This is best observed by noting the variation of the meter readings (see 3b above). If washing is needed, one of three meth- ods may be used: (1) The net is everted, still on its ring, and brushed down with an ordinary sweeping broom and run- ning seawater; (2) rings are stood on edge, net is tightened along its length by tying down end (without cod end a b tached) and hosed down with high-pres- sure fire hose. This is very effective provided that plankton has not dried in the meshes; (3) net is detached from ring and put in a washing machine using a 30-min cycle, warm water (not hot) and a nonpolluting detergent.
j. Rips and holes in the net-the net should be looked a t after every tow to check on needs for repair or replacement. If holes or tears are small, they should be sewn before the next tow with nylon thread of a dark color (to be easily 10- cated for sewing machine repair later on shore). Check appropriate boxes. If
18

the net is torn beyond mending at sea, replace the net.
k. Recheck sheet to be sure that all items are filled in, Nonroutine items should be included in Remarks section, e.g., odd meter readings, prolonged stops a t sta- tions, delays between stations, etc.
1. The accepted position, item 16, may be listed when the station is occupied or a t the end of the cruise when the captain has compiled a complete list of the po- sitions of all stations.
m. The occupancy code, item 2, is filled in, onshore, a t the end of the cruise. This is usually one of a series of numbers used by the programmer to describe the type of tow or the station occupied.
15. The sheet is set up for the next station: items 1, 3, 4, 5, 1 1 , 12, and 14 are entered. Item 14 should be the final reading of the preceding tow and should be rechecked be- fore starting next tow.
Additional Data Collections
A tow for plankton is made at every station occupied during a CalCOFI survey. Additional work and data collection a t each station include: Collection of meteorological data; a bathyther- mogram with the expendable bathythermograph (XBT) , a surface temperature reading taken with a bucket thermometer, a sample of water from 10-m depth with a Nansen bottle from which shipboard analysis is made of salinity and nutrients including phosphate, nitrate, nitrite and sulphite; drift bottle releases at specified station, secchi disc reading a t all day stations and Pacific saury (Cololabis saira) observations at all night stations.
The XBT is dropped from a launching tube, located aft near a ship’s rail, to record temper- ature profiles to 1,000 f t (450 m) deep. The re- cording is made electronically in a sheltered space (laboratory, etc.) on the vessel (Saur and Stewart, 1967; Saur and Stevens, 1972). The XBT has replaced the former BT which was launched and retrieved on a cable with a small winch located aft near a ship’s rail recording temperature profiles on a smoked slide to 450 or 900 f t (137 or 355 m) .
PROCESSING PLANKTON AND STANDARDIZING DATA
Processing of plankton is begun at the labora- tory when the collections are brought back from sea. This is carried out in several steps: Mea- suring the volume of plankton in each sample, sorting out and enumerating all fish eggs and larvae, identifying all larvae, measuring certain larvae, identifying certain fish eggs and staging (ageing) some, and finally, curating all fish eggs and larvae. All data are standardized (see be- low) and now are subjected to automatic data processing (ADP) for final analyses and pub- lication. Two methods for standardization a re described, one, the old method of hand calcula- tion and two, the ADP which are described wherever changes have been affected, and for which a flow diagram is depicted in Figure 19.
Plankton Volume Determination
Plankton volumes are determined by displace- ment, (sometimes termed “wet volumes”) re- corded to the nearest milliliter. Two volumes are recorded for each sample:
1. Total volumeincludes everything in the sample except small adult fishes, juvenile fishes, squid, octupi, and adult pelagic crabs (Pleuroncodes) none of which are consid- ered planktonic.
2. Total volume minus large organisms-large planktonic organisms are jellies and tuni- cates whose individual volumes exceed 5 ml.
The plankton volumes for a cruise are recorded on a Plankton Volumes data sheets (Fig. 20) be- ginning with data from the original tow sheets, first listing all the stations occupied in their nu- merical order and noting the number of jars used for each sample. The plankton samples are re- moved from their boxes and readied for measur- ing their volumes by arranging them in the nu- merical order of stations. The procedure for determining volumes is as follows:
1. Each quart j a r sent to sea is calibrated and etched with a number (see Fig. 22) that represents its total volume when filled to a level at which a mark on one device (a float) matches a mark on another (a T- guide)-Figs. 21 and 22. When the cali- brated j a r contains a plankton sample, the
19

DATA PROCESSING
FISH EGGS and LARVAE
\/
Calibrate Flow meters
\ /
\ I
\I \ I
Ship f Returns
\ I
. , . Plankton r volume ‘4
\I
\ / \I
\ I \ I
20
. . \ I \ I \ I

Plankton Volumes C N h : 7 6 0 3 050, ” 1 of /o ,t b
**p*******U*+**
Figure 20.-Plankton-volume data sheet.-A sample copy of a sheet made out for stations 60.50 to 70.80 on cruise 7003-“Ogon.” (This does not match any of the sets of data for which examples a re shown in this report.) The data shown here were collected on a special cruise on the CalCOFI grid by a cooperating vessel, Ogon, of the U.S.S.R., to show fractioning of samples (no longer done at this laboratory-see note on description of Set IV in the section on processing data.) These samples were fractioned by agreement with the Russion participants in that each or- ganization would keep one half of each sample for study at its respective laboratory and exchange the data on all samples.
first step in measuring is to bring the plank- 3. ton plus its preservative to the “proper level” by using the T-guide and float as shown with Figure 22. (Alternative meth- od-If calibrated jars, T-guide, and float are not available, the sample and its pre- servative are poured into a graduated cyl- inder and enough preservative is added or subtracted to bring the level of the liquid to
volume is recorded.) 2. A funnel is placed in a clean graduated cyl-
inder (see Fig. 24 for specifications), and a 333-p-mesh nylon draining cone (source of specifications-Table 1) is placed in the funnel.
an even milliliter, usually 900 or 1,000; the 4.
The plankton and preservative in Step 1 (either alternative) are poured into the draining cone (Fig. 23). The plankton is retained in the cone while the liquid drains into the cylinder. The plankton is con- sidered drained when the liquid from the bottom of the cone diminishes to an occa- sional drop. Draining time varies with the size and composition of the sample. The volume of the drained liquid in the cylinder (Fig. 24) is subtracted from the initial volume of plankton plus liquid (Fig. 22)-caligrated quart j a r or graduate in alternate of step 1. The difference, the total volume of the sample, is recorded on the data sheet.
21

5. Large
Scale: actual s i z e Float (plexiglass
Figure 2l.-T-Guide and float, actual size (designed by J. R. Thrailkill, NMFS). This is used to calibrate quart j a rs and to adjust volumes of plankton + preservative in mea- suring plankton volumes. To use: the float, triangular section pointing up, is inserted between the vertical limbs of the T-guide. The apparatus is placed in a calibrated j a r of plankton plus preservative and the horizontal limbs rested on top of the j a r (also see Fig. 20). Liquid is added or subtracted causing the float to move up or down until the etched line on the float is between the etched double line on the T (see Fig. 22). The coincidence of the lines indicates that the proper level has been reached, i.e., the volume, in millimeters, etched on the jar-accuracy 1 ml.
jellies and tunicates are removed top quart j a r is used a t the time of collec- (estimated as equal to or larger than 5 ml in volume) , washed, and placed into a grad- uate with a known volume of 5% buffered Formalin. The difference in this reading and the known volume of added solution is the Volume of the Large Organisms which is subtracted from the Total Volume and recorded as Total Volume Minus Large Or- ganisms (Fig. 20).
6. The drained plankton and the large organ- isms are put into a pint jar(s)-see Note below, and the ja r ( s ) is filled with the ori- ginal preservative. The original inside 7. label (s) is placed in the j a r (s) . If a screw-
tion, the same lid is used on the pint jar . If that cap was marked with a writing pen (Martek) or a self-adhesive label, it is left as is. If a string label was used, as on a bail-type jar, the top of the cap is labelled with a self-adhesive label or Martek pen (Fig. 18). Note: Pint jars are used to store measured plank- ton because i t has been found that almost 90% of all single-jar samples on CalCOFI surveys will fit into pint jars. Even if more than one pint j a r is used for some samples, the boxes for storing this size j a r require very little more than half the storage space needed for quarts. Calibrated quart jars - with unmarked lids - are returned to wooden seagoing boxes (ca-
22

8.
Figure 22.-T-guide in use in first step in measuring plankton volume. The jar is cali- brated to 892 ml, liquid alone or liquid plus plankton. Liquid is being removed to match the etched lines on the float and T-guide (see Fig. 21 for directions for use).
pacity: 12 jars in eggcrate partitions) con- structed of ?/&inch (12.7 mm) plywood with hinged lids. If laboratory and storage space on shipboard are reasonably dry, the original cardboard containers can be used to store jars of plankton at sea. Pint jars with plankton are packed in nu- merical order of stations into cardboard cartons, and the outside of the cartons are labelled with cruise number and numerical listing of the stations in the box stored to be visible on shelves.
Plankton Sorting Each measured sample delivered to the sorting
laboratory is sorted for all fish eggs and larvae of which all are enumerated. Some fish eggs and larvae are identified, some are scanned and cat- egorized as “few”, “many”, or “abundant”, and some fish larvae are measured (Table 2).
Although techniques may vary with individual sorters, the general method for sorting is as follows:
1. The plankton is removed from its preserv- ative by straining it through a 333-p mesh nylon draining cone (the same kind used when measuring plankton), and the plank- ton, with about 2 liters of fresh water plus a few drops of full strength formaldehyde, is put into a 3-liter beaker. The original preservative is kept in its original jar. Fresh water is used because it has been found that prolonged exposure to concen- trations of Formalin in handling, stirring and under their eyes, even 3 to 596, may cause sorters to become sensitive and aller- gic to fumes and liquid. A sample can be kept as long as 1 month in the weak solution of fresh water with formaldehyde. This does not imply that such length of time is necessary for sorting any single sample. The average sorting time is about one sam- ple (100 ml plankton) per day per sorter.
2. The plankton is stirred and poured into a small beaker (200 ml) . This, in turn, is stirred and poured into a number of syra- cuse dishes (ground-glass sides) from
23
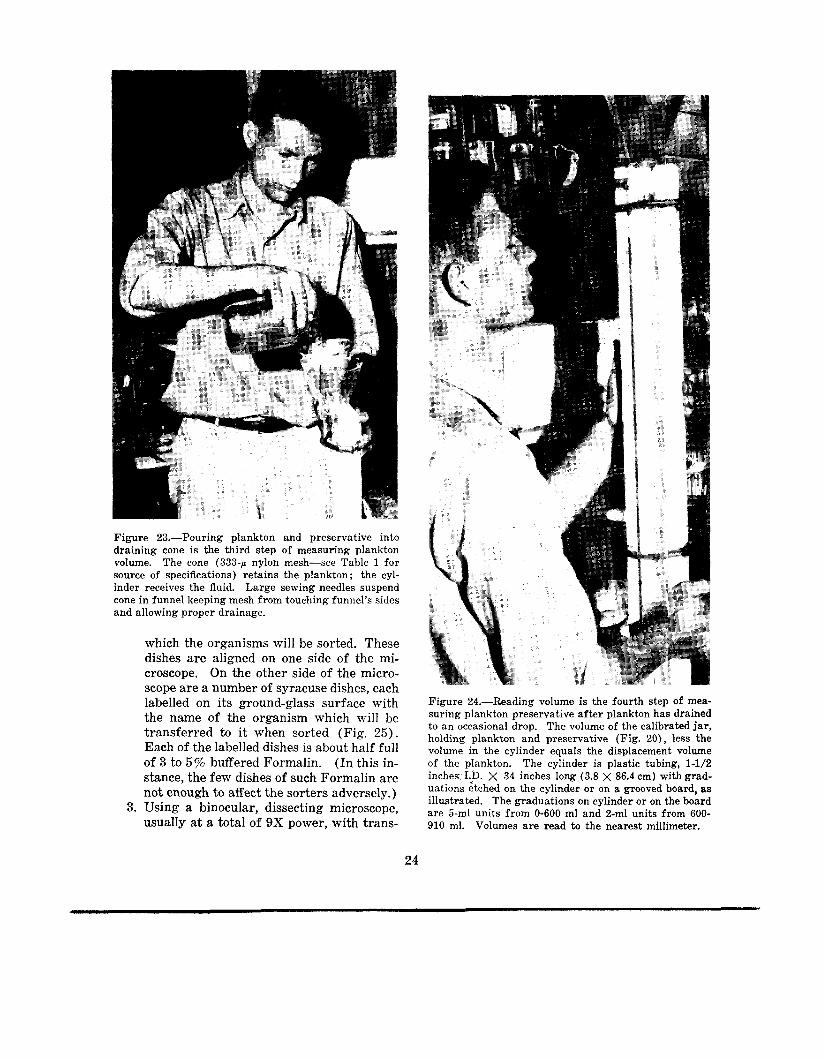
Figure 23.-Pouring plankton and preservative into draining cone is the third step of measuring plankton volume. The cone (333-p nylon mesh-see Table 1 for source of specifications) retains the plankton; the cyl- inder receives the fluid. Large sewing needles suspend cone in funnel keeping mesh from touching funnel’s sides and allowing proper drainage.
which the organisms will be sorted. These dishes are aligned on one side of the mi- croscope. On the other side of the micro- scope are a number of Syracuse dishes, each labelled on its ground-glass surface with the name of the organism which will be transferred to it when sorted (Fig. 25). Each of the labelled dishes is about half full of 3 to 5% buffered Formalin. (In this in- stance, the few dishes of such Formalin are not enough to affect the sorters adversely.)
3. Using a binocular, dissecting microscope, usually a t a total of 9X power, with trans-
Figure 24.-Reading volume is the fourth step of mea- suring plankton preservative after plankton has drained to an occasional drop. The volume of the calibrated jar , holding plankton and preservative (Fig. 20), less the volume in the cylinder equals the displacement volume of the plankton. The cylinder is plastic tubing, 1-1/2 inches1.D. X 34 inches long (3.8 X 86.4 cm) with grad- uations etched on the cylinder or on a grooved board, as illustrated. The graduations on cylinder or on the board are 5-ml units from 0-600 ml and 2-ml units from 600- 910 ml. Volumes are read to the nearest millimeter.
24

4.
5.
Figure 25.-Arrangement of plankton sorter’s work. Unsorted plankton on left side of microscope, sorted organisms on the right. (See text for procedures.)
mitted light, all fish eggs and larvae are picked out with pipettes and fine quality (stainless steel) forceps and transferred to their appropriately labelled dishes.
Note: Research quality microsco es are used be- cause any of infenor quality w o u d be detrimental to the eyesight of persons engaged in this type of week-long work for 6 to 8 h r per day.
When the fish eggs and larvae are sorted from a dish, its remaining contents are poured into a 3-liter beaker labelled “Sorted.” 7. Each dish of sorted organisms is checked for final identification when its contents are enumerated and/or measured as noted in Table 2. Fish larvae are measured to the nearest one-half millimeter on a transpar- ent millimeter rule (specifications below). Each measured species is tabulated on the form illustrated and described in Figure 26. Note: The scale for measuring fish larvae is a transparent plastic rule, about 0.5 mm thick on which the markings, in millimeters, a re etched on the plastic. A piece of the rule, about 50 mm, is ta ed between two thin pieces of glass-usually stanzard microscope slides 76 x 51 1 mm. The larvae a re piled in a small mass OR the slide,
6.
and individual specimens are gently dragged over the top of the scale with a clean dissecting needle. After measuring, they a re dragged away into an- other pile until all are measured. Finally they are placed in a vial and labelled.
The sorted plankton (invertebrates) is poured into the mesh cone to drain off the water, and the plankton is returned to its original j a r and preservative. (When a cruise is completed the samples are sent to SI0 for curation and study of selected in- vertebrates.) When the checking in step 5 is done an- other form, the sorter’s work sheet (Fig. 27), is filled out listing the numbers of or- ganisms of each type sorted. The form also includes other information as illustrated. Whole larvae, head sections and tail sections are listed and totaled for all species mea- sured and for other fish larvae. Totals listed for measured larvae should be the same as those on the tabulation sheets; (ex- ceptions noted in caption for sorter’s work sheeLFig . 27) the totals of head and tail sections-&ohld equal the DIS on the tab- ulation sheets (Fig. 26).

Table 2.-Organisms identified and enumerated and/or measured during sorting of CalCOFI plankton samples.
Species Common name Labelled Enumerated Measured’ Scanned’
Sardinops caeruleus Pacific sardine eggs Sardine E X -- -- larvae L X X --
Engraulis mordax Northern anchovy eggs Anchovy E X -- -- larvae L X X --
Merluccius productus Pacific hake eggs Hake E larvae L
Cololabis saira Pacific saury eggs Saury E X -- --
Trachurus Wmmet&cus Jack mackerel eggs Jack mackerel E - larvae L
Etrumeus acuminatus Round herring eggs Etrumeus E X -- -- larvae L X -- --
Other fish eggs OFE X -- -- larvae OFL X -- --
larvae L X -- -- 3 s - -- a 3 a - - -
* To nearest one-half millimeter. Categorized. Ocmsionally.
8. Each group of organisms is placed in a 2-dr vial with screw cap. An appropriately markel label is placed in each vial, and the vial is capped. Each label includes cruise number, station number, date of tow, or- ganism name and total. If organisms were measured this is indicated on the top of the cap on a self-adhesive label. Labels are written with pencil (grade equal to “H”) or waterproof ink (Higgins Engrossing Ink, No. 892, which does not clog the type of pen used here-Kohinoor Rapidograph, No. 0 or 00). Note: Paper for labels should be 100% rag con- tent. Inferior quality paper eventually deterior- ates in Formalin or loses legibility.
The type of screw cap used here is plastic with a vinyl insert (Fig. 28) that is “self- sealing” when screwed tightly on the vial, thus preventing evaporation for long peri- ods of time and decreasing amount of cur- ating time needed to replenish evaporated preservative (see section on Curating) . This is much preferred over corks, rubber
11. The vials of each station are banded and arranged in numerical order of stations in small cardboard boxes for delivery to the identification group and further work.
Identification of Fish Eggs and Larvae When the identifiers receive the vials and
master sheets from the sorting laboratory their procedures are generally as follows:
1. All eggs and larvae identified and enumer- ated by the sorters are verified, and their numbers listed in the appropriate boxes at the tops of the columns on the form illus- trated in Figure 30. Since our primary in- terest is in certain commercial species, those are prelisted as shown on the form.
2. The OFE’s (see Table 2) are verified. If any of the form’s prelisted species have been overlooked by the sorters, they are listed and added to the totals on the form shown in Figure 30. (Also see Figure 32 for method used for automatic data pro- cessing.)
stoppers, or screw caps with paper liners. 3. The OkL‘s (see Table 2) are identified ac- 9. All material is checked including the work cording to the classifications of Berg and
sheets and vials with labels. listed in the large space on the form. Se- 10. A sorter’s master sheet (Fig. 29) is com- bastodes = Sebastes (rockfishes)-not the
piled on which the sorting d a t a a r e sum- responsibility of the sorters-if present, marized for each station from each sorter’s are totaled and listed in the appropriate work sheet. box. Flatfishes, some of which are com-
26

I 1
I I I I I
5.5
P I I I I 3.5 I * W I I I 2 4
I ' I I I ' I
I
dll ?./
I I I I I I I I
6.0
I 4.5 Ipw
I
I I
I &ji-m 30
I I I 7.5 ImJmwH& I S 4
I I I I I 8.0 IN WHIM 1/11 64
1 I
Figure 26.-Plankton sorter's tab- ulation sheets for measuring fish larvae-sample copy of one of two sheets used to measure anchovy lar- vae for station 80.52, cruise 6801, regular mesh (505 p ) . The tabula- tions are made up on two sheets to include lengths of larvae by 0.5-mm sizes from 2.0 to 8.0 and 8.5 to 15.0 m with additional lines for longer lar- vae. At the bottom of the second sheet is a line for tabulating disint- egrated larvae (DIS) .
mercial species, if present, are listed first on the form, then all other OFL's and mycto- phids. The methods of identification in the taxonomy of fish larvae, worked out by E. H. Ahlstrom of our laboratory, are too in- volved to be discussed here. Suffice to say that the larvae of a t least 100 families are found in the California Current area. At present, approximately 100 kinds can be identified to species, 40 to genus and the rest to family. Size is an important factor in identification since identifying charac- ters of larvae change with growth. The identifiers can recognize more than 1,000 sizes, shapes, pigment patterns, eye forms,
etc., which characterize individual larvae of the various species. During identification the OFL's are checked for overlooked species that are the respon- sibility of the sorters. In most cases of omission, the larvae are in such poor state that it may be impossible for the sorters to have identified them or so poor a state that they could not be identified a t all. If identifiable, they are added to the other totals, where appropriate; if not they are put into a disintegrated (DIS) category. All identified fish are returned to one vial. Some, if in excellent condition, may be kept out for further study or the reference file.
27

TOTAL OR IG I rJAL VOLUM 6k TOTAL W I G . VOL. MINUS LG. CRG. Gf FRACTIONED: YES @
PERCENTAGE RIGHT
LEFT
PERCENTAGE VOLUME
as o v e r a l l condition, etc.) -7”4 & o& . . / r /
Y
SARDINE EGGS
SARDINE LARVAE
mOLE
HEAD SECTIONS: TAIL SECTIWS:
ANCHOVY EGGS:
7 5 ANCHOVY LARVAE:
WHOLE 7 1 2 HEAD SECTIONS 3 TAIL SECTIONS
SAURY EGGS
SAURY LARVAE
ETRUMUS EGGS
ETRUMUS LARVAE
1 \ 7 2 OTHER FISH EGGS
4 s7 OTHER F ISH LARVAE
m E 457 HEAD SECTIONS TAIL SECTIONS
Figure 27.-Plankton sorter’s work sheet-sample copy for station 80.52, cruise 6801-H, regular mesh (505 f i ) . Note that the count of anchovy larvae does not match that of the sorter’s tabulation sheet in Figure 26. A sorter’s count in such high numbers is rarely exact. The measurer’s count is exact because every larva is tabulated as i t is measured. The sorter’s original count on the master sheet (Fig. 29) has been changed by the measurer.
4. If sardine eggs are in the sample they are staged according to the method devised by Ahlstrom (1950) as to their state of de- velopment in ll phases from fertilization to full development before hatching. Then they are aged according to the water tem- perature and time of day a t which they were collected.
5. All labels are the same as those for plankton sorting. If larvae are bottled separately,
Figure 28.-Two-dram (7.4 ml) vials and caps used for sorted and identified fish eggs and larvae. Note vinyl insert in caps (see text).
28
I
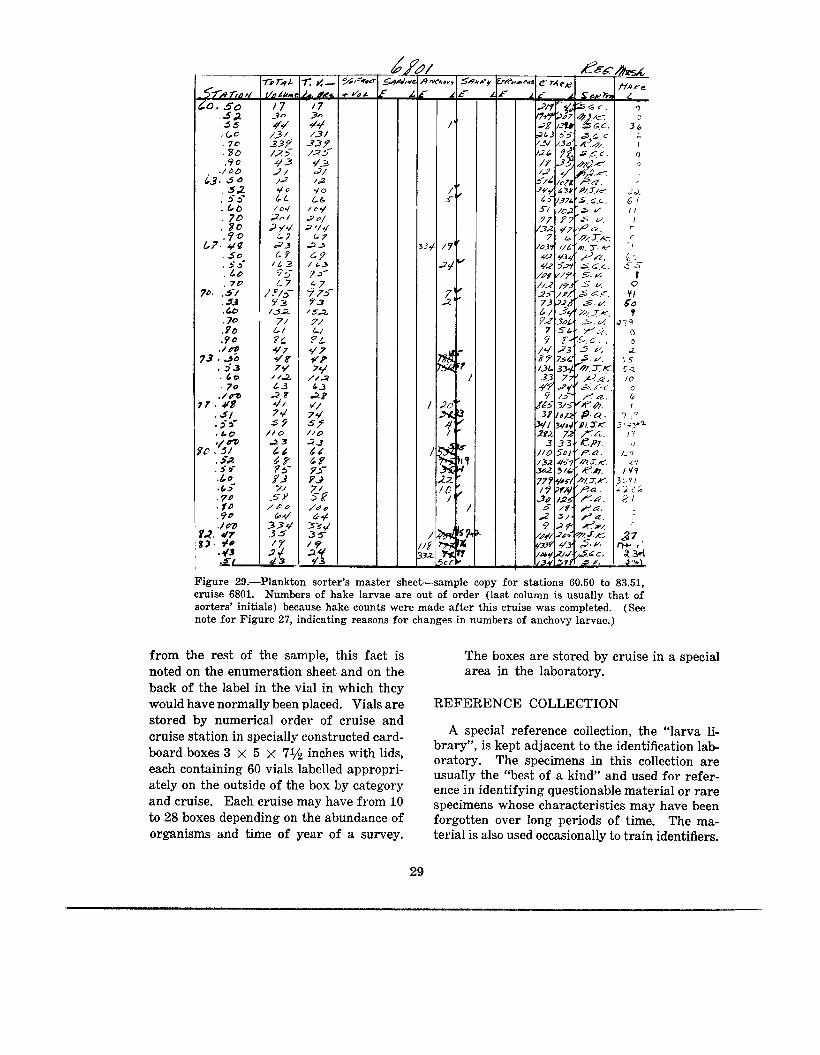
Figure 29.-Plankton sorter’s master sheet-sample copy for stations 60.50 to 83.51, cruise 6801. Numbers of hake larvae are out of order (last column is usually that of sorters’ initials) because hake counts were made after this cruise was completed. (See note for Figure 27, indicating reasons for changes in numbers of anchovy larvae.)
from the rest of the sample, this fact is noted on the enumeration sheet and on the back of the label in the vial in which they would have normally been placed. Vials are REFERENCE COLLECTION stored by numerical order of cruise and
A special reference collection, the “larva li- cruise station in specially constructed card- brary”, is kept adjacent to the identification lab- board boxes ‘ ’ ’s inches with lids’ oratory. The specimens in this collection are
ately On the Outside Of the box by category ence in identifying questionable material or rare and cruise. Each cruise may have from 10 specimens whose characteristics may have been to 28 boxes depending on the abundance of forgotten over long periods of time. The ma- organisms and time of year of a survey. terial is also used occasionally to train identifiers.
The boxes are stored by cruise in a special area in the laboratory.
each containing 60 vials labelled appropri- usually the “best of a kind” and used for refer-
29

ardine L. . mackerel ac. macker Hake
x p , c
Figure 30.-Identifier's tabulation sheet (see text for description of form)-sample copy of sheet for station 80.52, cruise 6801 (compare with plankton sorter's tabulation sheet and work sheet for the same station, Figures 26 and 27). On this form, the whole numbers are the identifier's counts for all species; their total is in the upper right hand corner. No change is made on the sorter's master sheet (Fig. 29). Standardized numbers (the decimals) a r e ob- tained by multiplying each species number by the standard haul factor ( SHF-top line- obtained by standardization of data; see text and Figure 37) and adding them for the standard total a t bottom right of largest space. Proce- dures used in automatic data processing of these identified species are described in the text and illustrated in part in Figures 31 and 32.
CURATING
The general and reference collections are peri- odically checked to assess the evaporation of pre- servative from the vials. The screw-top lid with the vinyl liner (Fig. 28, also see section on Plank- ton Sorting) now used on our vials is virtually evaporation-proof if well tightened when stored. Occasionally some vials with loose caps may lose liquid by evaporation in which case preservative is added, the cap tightened properly, and the vial stored again.
Standardization
During tows for plankton, different volumes of water are strained through the net depending on different speeds of the tow (more water with high speed) or different times of tow (in shallow versus standard depths).
In order to make tows comparable, all hauls are adjusted to a standard amount of water strained per unit of depth fished-10 m3 of water strained per meter of depth fished. This value is used because it gives a factor of approximately
30

Figure 31.-Sample sheet of code numbers, for automatic data proces- sing, assigned to the fishes of the California Current region. Coding was made on the basis of phyloge- netic sequence of orders, families, genera and species, and some com- mon names. Some numbers were left out in sequences to allow for insertion of new finds or possible name changes, some of which are il- lustrated here. The list was con- verted to alphabetical order to make i t easier for statistical personnel, unfamiliar with phylogenetic se- quence, to find and use the proper numbers when assigning them to the identifiers' sheet (see Fig. 32).
641
iiE 9 5 1
9 52
953
954
955
4 9 0
625
600
531
821
404
756
3Sg 523
9 5 8
4 2 0
670
855
571
01 9
019 01-0 166
650
6 1 0
165
674
577
Pimelometopon pulchrum
Pleuronichthys coenosus
Pleuronichthys decurrens
Pleuronichthys ritteri
PI euron ic hthy s sp . Pleuronichthys vert ica l i s
Polynemidae
Pomaccntridae
Pomadnsyidae
Pompano
Porichthys
Poromitra
Prionotus
Protomyctophum crockeri Protrmyc+ophvm sr. Psenes
Psettichthys melanostictus
"puffer"
"rockfish-not sebastodes)"
"ronquil"
Sarda
"sardine"
S dinops caerulea K d * . r r sa?u*
"saury"
Scaridae
Sciaenidae
Scomboresocidae
Scomber japonicus
Scombcromorus
1.0 for a net with a 1.0-m-diameter mouth open- ing. A standard haul factor (standardization factor) is derived for each haul by the following formulation:
S =
where S = D =
10 D 10 D v Or Rap standardized haul factor ( = SHF) . average depth of haul-derived by multiplying the cosine of the aver- age angle of stray by the length, in meters, of the towing cable. (The cosine of f i e average angle of spray, derived fram a a g e d of all angles, is considered more representative of the haul as a whole than the cosine
560 'Scombrid"
5 6 0 Scombridae
560 "Scombroid"
3 3 5 Scopelarchidae
3 3 6 '%copelarchoidcs dentatus
3 3 8 Scopelarchus
409 Scopeloberyx robustus
409 "Scopeloberys nychrinus"
412 Scopelogadus mizolepis bispinosua
4 1 2 "Scopelogadus bispinosue"
1 9 6 Scopelosaurus
678 Scorpaona guttata
736 Scorpaenlchthys
6 7 0 Scorpaenidae
6 6 5 Scorpidae
6 8 3 Sebastodes spp.
TO7 Sebastolobus
516 Seriola
425 Serranidae
641 Sheepshead Coh f p . V t d z C
486 Sphyraena argenta
485 Spliyraenidae
835 "stargazer"
2 9 2 Stenobrachius leucopaarus
1 0 0 Sternoptychidae
107 Sternoptyx
1 2 1 Stomlas
120 Stomiatidae
6 3 0 Stromateldae
310 "Sudtd"
i 0 9 st OI* 1 - 481 d e 1.
of the angle of stray a t the greatest depth.)
V = total volume of water strained in cubic meters.
R = total number of revolutions of the current meter during the tow.
a = cross section area of mouth of net in m.'
p = length of the column of water, in meters, needed to effect one revolu- tion of the current meter a t average speed at which the haul was taken (determined from the appropriate calibration graph-see calibration of flowmeters).
31

--
0 3 I
vdine L. . mackerel tc. macker iebastodes Ancbovv E. Sardine E. Saury E.
Figure 32.-Identifier’s tabulation sheet with the same identifications a s those listed in Figure 30. Here, how- ever, code numbers for the identifications (see Fig. 31) have been written in for keypunching and automatic data processing.
CALIBRATION OF FLOWMETERS For calibration, a meter (s) is hauled or pushed
at different speeds over a measured distance. (Our personnel have developed a method for cal- ibrating three meters at a time, fastening them to a bracket under a board-Figs. 33 and 34- and pushing them over the measured distance - 42 f t = 12.2 m.) Performance tests are made before (Fig. 35) and after every cruise, and a graph is constructed in which the independent variable is the length of a column of water needed to affect one revolution of the meter (meters per revolution) a t any given towing speed. The graph (Fig. 36) applicable to a given cruise is based on the average ef fflo caibraiion trials. The graph is curvilinear w i e t h e 4 i g L s t values of m h e v associated with the lowest numbers of
rev/sec because of friction a t low speeds. The curve flattens out with increase in speed and a corresponding decrease in friction.
With preparation by automatic data proces- sing (ADP), the meter calibrations are key punched and programmed to produce a regres- sion line where meters per revolution are plotted against seconds per revolution in order to lin- earize the relationship over the range of values obtained in all the plankton tows for which the meter was used.
Standardization of data for every station on a cruise is begun with the preparation of four “sets” (Fig. 37) as follows:
- to derive the SHF from the for- Set I 10 D 10 D
mula S = - v - = - 32

Figure 33.-Board used to calibrate T.S-Flowmeters (one meter attached). The board is balsa wood, covered with fiber glass to make it waterproof, 4 f t long, 15 in- ches wide X 2-1/2 inches thick (151.9 X 38 X 6.4 cm).
Set I1 - to determine the volume of plank- ton collected per 1,000 m3 of water strained.
Set I11 - the station data and plankton vol- umes for publication.
Set IV - to adjust SHF to percent of sample sorted-no longer done-see note following description of Set IV below.
In addition, if an improper meter reading was obtained or was missing for any tow, a scatter diagram and regression line (Fig. 38) had to be plotted and calculated for all meter readings (ordinate) against all average tangents (abscis- sa) in order to obtain an estimate of a meter “reading” to apply to that tow (see parenthe- sized data for station 60.70 in Figure 37).
Each set duplicated the cruise number, the ship, the dates of the cruise-start to end, meter number (s) and net number (s) .
On Set I, 14 columns are used of which the last is the SHF. The column headings are as fol- lows:
1. 2. 3.
4. 5.
6.
Station number-from tow data sheet. Order occupied-from tow data sheet. Total time of tow in minutes and seconds- from tow data sheet. Total time in seconds-derived from 3. Current meter revolutions, difference in final and initial reading-from tow data sheet. Revolutions per second current meter, from 5, divided by time in seconds.
Figure 34.-Brass frame under calibration board (see Fig. 33) on which to hang flowmeters. Only three meters a re calibrated a t one time, the hangers nearest the board are not used; meter readings were found to be erratic because of the turbulence in that area. The brass frame is 8 inches X 14 inches (20.3 X 35.5 cm) made of four pieces of brass welded a t their ends. The brass material is 3/16 inch X 2 inches (5 X 51 mm). The brass an- gles on which to hang the meters a re cut from 1/8-inch (3 mm) stock, 1-1/4 inches (32 mm) each side, 3 inches (72 mm) long. Holes are bored to conform to distance on centers of holes in meter lugs. Nuts are welded in position to take bolts that slip fit through meter lugs. Meters just hang on the bolts.
7. Average tangent-derived from tangents of all angles taken during tow.
8. Calibration factor = meters per revolution, the p in formula above-taken from cali- bration curve (Fig. 36).
9. Calibration factor x areal cross section of net = a constant which, when multiplied by R (total revolutions./haul) gives
10. Volume of water strained = Col 5 x Col 9 11. Cosine of average tangent from Col 7 12. Wire out = total wire out before net is
13. STD haul factor =
hauled in Col13 x 10
col
33
L u f -
L I . ..
- .~
.
- . .
- - - - . .
. .
. -.. - .
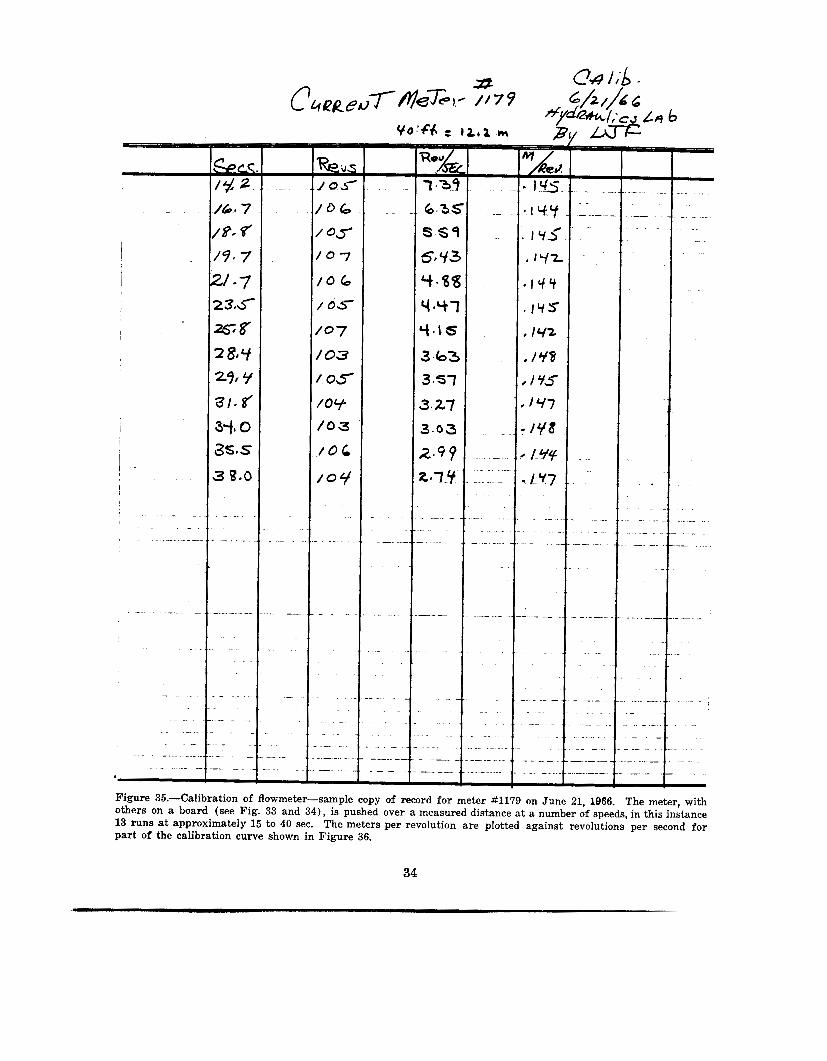
I Figure 35.-Calibration of flowmeter-sample copy of record for meter #1179 on June 21, 1966. The meter, with others on a board (see Fig. 33 and 34), is pushed over a measured distance a t a number of speeds, in this instance 13 runs at approximately 15 to 40 sec. The meters per revolution are plotted against revolutions per second for par t of the calibration curve shown in Figure 36.
34

4-d /&c. Figure 36.-Calibration curve for flowmeter 81179 obtained by plotting two sets of calibrations and drawing the curve on the average of the calibration points. The data of the first calibration are shown in Figure 35, the second, a simi- lar set, made after cruise 6607-5 are not illustrated.
Set 11 derives the plankton volume per 1,000 m3 Note: It has often been found that when some organ- ism such as rare and/or larger fish larvae a re scarce, fractioning a sample tends to give an erroneous count of actual numbers present, where i t is high1 probable that the few specimens in a sample can be 3kft in the unsorted portion of the plankton. Therefore, it has been our policy of late to sort 100% of all samples.
water strained by the following formula:
Vp/m3 = Y, v p 1,000
where Vp,ms =
v, =
v, =
plankton volume per 1,000 ms water strained. plankton volume collected in net tow (from plankton measured). cubic meters of water strained (from Set I ) .
With automatic data processing only two sets are printed out, one to obtain volumes of water strained, the standard haul factor for each plankton haul as for Set I above, and the other to produce station data and plankton volumes as for Set I11 above.
Set I11 combines all the station data for pub- lication.
Set IV adjusting for percent plankton sorted multiplies the SHF by reciprocal of the fraction sorted, e.g., 50% (one-half) of sample, multiply SHF by 2, 25% (one-fourth) sorted, multiply SHF by 4, etc.
These data sheets are prepared by using 20 items from plankton tow sheet (circled numbers on the tow sheet), the plankton volumes and the data of the computer's calibration curve de- scribed above.
For the new Set I, a printout will include sta- tions indicating errors or omissions of meter
35

CRUISE NUMBER 6 6 0 5 - J SET I VESSEL TorC(4 e
1 O F A CURRENT METERS. 1171 1113 I VI4 7/18-64 DATES
CRUISE NUMBER c 6 0 7 - J SET E VESSEL JO&C.4d
I O F L DATES YII s h e - 6 C
CRUISE NUMBER: 66 0 7 - J VESSEL61 : sotdo- - DATES : i l l - y / 1 0 - 6 6
Figure 37.-Sample copies of standardization of data in sets f o r the first 10 stations of cruise 6607-5 (see text for methods).
36


readings if any. A scatter diagram with regres- sion data are printed out and a second and final Set I is printed with corrections showing esti- mated meter readings, volumes of water strained, and the S H F derived from them.
N o t e : A scatter diagram and regression data are pre- pared whether needed or not in order to present a visual record of meter behavior during a cruise.
The final step in standardizing the data is to multiply all counts of eggs and larvae from each plankton tow by the standardized haul factor (Fig. 30). The standardized counts are filed on species cards by cruise and station. Measured larvae are standardized by numbers per size to the nearest one-half millimeter, then grouped in size classes, e.g., Kramer (1971). Sardine eggs are standardized by stage of development and totaled in “Age in Days” (see Step IV in identification of eggs and larvae), e.g., Kramer (1971).
For ADP a coding system is used now to stand- ardize the data. A number (code) is assigned to each fish larva, sized or unsized, as fa r as pos- sible to order, family, genus or species (Fig. 31). The code numbers are added to the identifiers sheet as shown in Figure 32, and the key punch operator puts the following information on a card for each species: cruise number, station number, larva or egg code number, and the stand- ard haul factor.
These data are then stored on tape for retriev- al for analysis and/or publication.
Data Publication
The data for each year of surveys are compiled for publication in two series. The first is “Zoo- plankton volumes of the Pacific coast, . . . ,” the old Sets I11 (now Set I1 by ADP) for each sur- vey, e.g., Thrailkill (1969). The second is “Sar- dine eggs and larvae and other fish larvae of the Pacific coast, . . .,” which include the stand-
ardized haul factors for all stations occupied on each survey and positive occurrences of partic- ular species as follows: Pacific sardine eggs by age in days, fish larvae by size classes including Pacific sardine, northern anchovy, jack mackerel and Pacific mackerel, and fish larvae unsized, including Pacific hake and rockfish spp., e.g., Kramer (1971).
ACKNOWLEDGMENTS
Sincere appreciation is extended to all person- nel and organizations without whose cooperation the exacting procedures and extensive work of the CalCOFI could never be accomplished.
LITERATURE CITED
Ahlstrom, E. H. 1948. A record of pilchard eggs and larvae col-
lected during surveys made in 1939 to 1941. U.S. Fish Wildl. Serv., Spec. Sci. Rep. 54, 76 p.
Influence of temperature on the rate of de- velopment of pilchard eggs in nature. U.S. Fish Wildl. Serv., Spec. Sci. Rep. Fish. 15: 132-167.
Sardine eggs and larvae and other fish larvae of the Pacific coast, 1958 and 1959. U.S. Dep. Commer., Natl. Oceanic Atmos. Admin., Natl. Mar. Fish. Serv., Data Rep. 68, 132 p.
1950.
Kramer, D. 1971.
Milne, A. 1959. The centric systematic area sample treated
as a random sample. Biometrics 15 (2) : 270-297. S a w , J. F. T., and D. D. Stewart.
Expendable bathythermograph data on sub- surface thermal structure in the eastern North Pacific Ocean. U.S. Fish Wildl. Serv., Spec. Sci. Rep. Fish. 548, 70 p.
Saur, 3. F. T., and P. D. Stevens.
1967.
1972. Expendable bathythermograph observations Mariners Weather from ships of opportunity.
Log 16(1). Thrailkill, J. R.
1969. Zooplankton volumes off the Pacific coast, 1960. U.S. Fish Wildl. Serv., Spec. Sci. Rep. Fish. 581, 50 p.
38