coke versus pepsi
TRANSCRIPT
Coke versus Pepsi∗
A Comparison of Financial Strategies
At the end of the 20th century, Coca-Cola and PepsiCo were the two largest beverage
companies in the world. Their competition had been fierce and enduring, but some industry
observers suggested that Coke already had won the ‘cola wars.’1 Pepsi’s response was to spin
off its restaurant businesses (Pizza Hut, KFC, Taco Bell) to focus exclusively on beverages and
snack foods. Two important questions are:
• From the viewpoint of their shareholders, was Pepsi really being crushed as badly as it appeared?
• Had Pepsi’s new focus already narrowed the gap?
The Coca-Cola Company
The Coca-Cola Company (Coke) began selling products in 1886 and was the largest
beverage company in the world. Coke specialized in nonalcoholic drinks – principally soft
drinks but also a variety of noncarbonated beverages. Out of approximately 48 billion beverages
consumed worldwide each day, about 1 billion (or roughly 2%) bore a company trademark (1997
10-K). Coke sold its beverages in nearly 200 countries, and had the leading soft drink product(s)
in most of these countries. Coke was also the world's largest distributor and marketer of juice
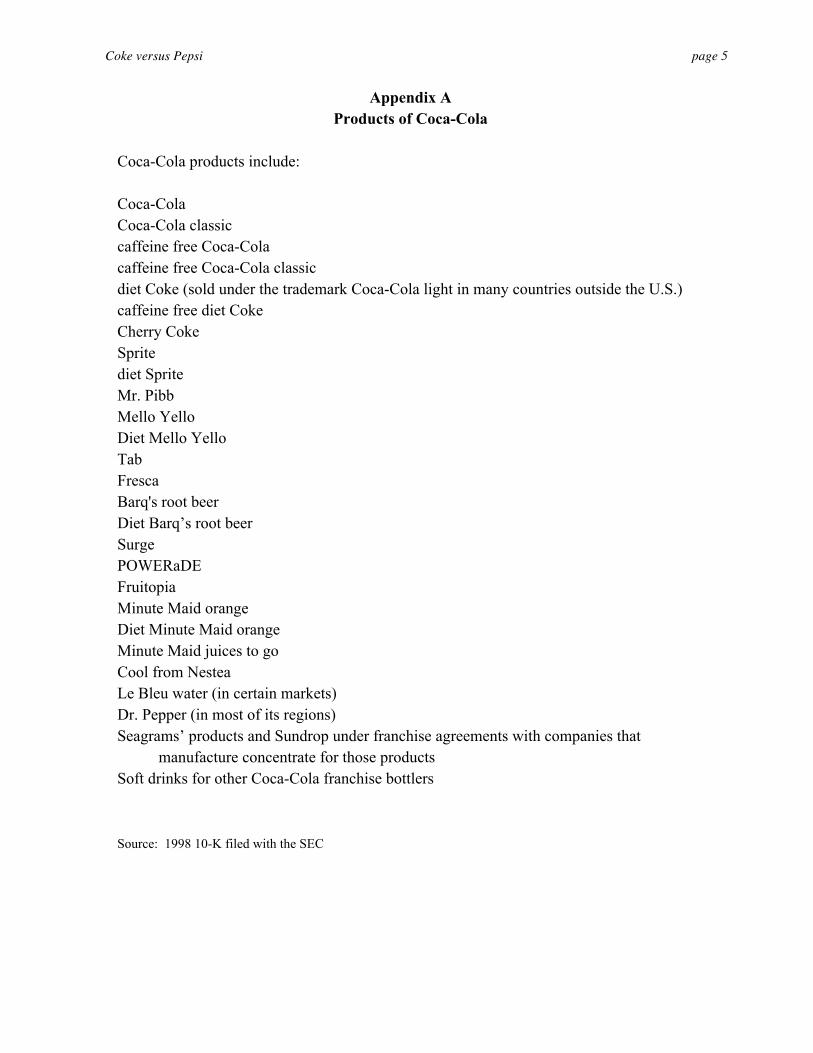
and juice-drink products. Appendix A provides a partial list of company products.
Coke manufactured and sold soft drink and noncarbonated beverage concentrates and
syrups to authorized bottling and canning operations.2 These bottlers added the remaining
ingredients (generally carbonated water) and packaged the finished soft drinks in authorized
containers bearing the company's trademarks for sale to retailers and wholesalers.
∗ This case was prepared by Professors Robert M. Bowen, Roland (Pete) Dukes, and Jane Kennedy of the
University of Washington using publicly available data. Revised September 2008. 1 For example, see “How Coke is Kicking Pepsi’s Can,” Fortune, October 28, 1996. 2 The Company also sells fountain syrups and finished beverages to authorized bottlers or distributors, who in turn
sell these products to retailers or, in some cases, wholesalers.
Coke versus Pepsi page 2 The New Pepsi Challenge?
In 1996, Pepsi-Cola products had 23% of the worldwide market for soft drinks (compared
to 47% for Coca-Cola). However, despite a 30-year record of growth averaging 14% annually,
earnings fell sharply in 1996 (28%) compared to the prior year. This led to in a major
restructuring in 1997.
From 1988 through 1994, PepsiCo (Pepsi) invested almost $7 billion in an effort to sustain
its high growth rate. Much of this was accomplished by adding thousands of restaurants to what
was formerly a beverage (Pepsi-Cola) and snack food (Frito-Lay) company. When restaurant
industry growth slowed in the mid-1990s, management discovered that it was difficult to run a
large number of restaurants efficiently. As a solution, in 1995, Pepsi began selling its restaurants
back to franchisees. Local owners were closer to the customer and were viewed as having a
better chance of running the business profitably. By year-end 1996, over 1000 restaurants had
been ‘refranchised’ and the financial situation of the restaurant business was stabilized. Despite
this improvement, Pepsi management decided to refocus the company by splitting it into two
distinct parts – PepsiCo (composed of Pepsi and Frito-Lay) and Tricon Global Restaurants
(composed of Pizza Hut, KFC and Taco Bell). Tricon was spun off to PepsiCo shareholders as a
separate public corporation in 1997. (See www.triconglobal.com.) The few remaining smaller
restaurant chains (e.g., Hot’n Now, California Pizza Kitchen) and the restaurant supply
distribution business were sold to outside investors. According to new CEO, Roger Enrico:
So what does all of this mean for our future? Can we put PepsiCo on a sustainable, consistent 15% annual earnings growth trajectory? I believe we can. … In other words, (we need to) stick to the things we do well, and do them better. Stop doing things we don’t do well – no matter how alluring they seem. And put the power of the entire corporation behind a few very big initiatives – ones that really count. In short, we need to do throughout the corporation what we’ve been doing for years at out strongest businesses, Pepsi-Cola in the United States and Frito-Lay. (1996 annual report, pp. 4-5)
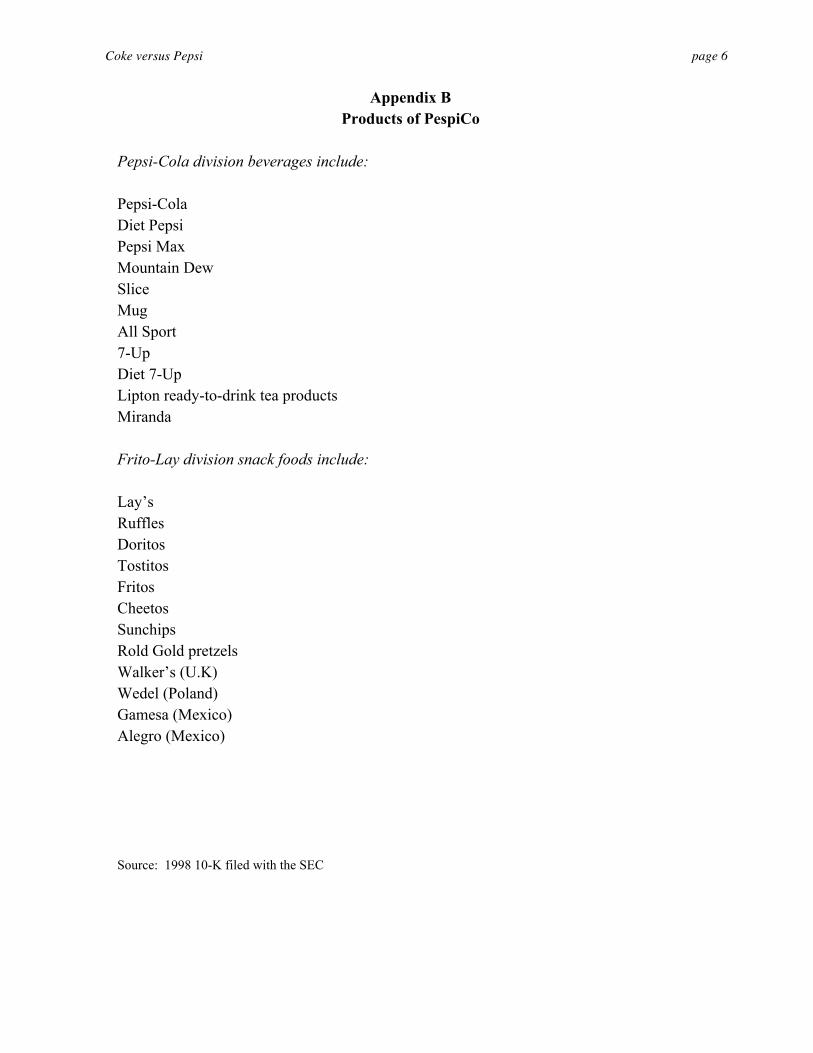
By year-end 1997, Pepsi was back exclusively in the packaged goods business. Appendix B
provides a partial list of the company’s current products.
Pepsi’s balance sheet for year-end 1997 reports the financial condition of the ongoing
beverage and snack foods company, i.e., the net assets of Tricon Global were transferred to
Tricon’s separate balance sheet. In contrast, Pepsi’s income statement shows earnings from both
companies through the date of the spin-off. However, earnings from continuing operations
(PepsiCo) and from discontinued operations (Tricon Global) are shown as separate line items.
Coke versus Pepsi page 3 Coke’s “49% solution” – reporting their Bottling companies as equity-method investments
A major purpose of this case is to understand the financial implications of ‘consolidated’
versus ‘equity-method’ accounting for affiliated companies. As of December 31, 1998 Coke had
substantial investments in a number of bottling operations including Coca-Cola Enterprises.
Despite owning less than 50% of each company, agreements with these bottlers gave Coke
substantial control over their operations. However, ownership of less than 50% permitted Coke
to account for these investments using the equity method. An alternative, if Coke controlled the
bottlers, was to consolidate all the assets and liabilities and present financial statements as if they
were one entity.3 Note 2 to Coke’s 1998 financial statements provides information about these
investments. This note can be viewed as having four parts.
• The first part provides summary financial data for Coca-Cola Enterprises (CCE), the world’s largest bottling company. Coca-Cola owns approximately 42% of CCE.
• The second part provides summary financial data for Coca-Cola Amatil Limited (CCA), an Australian-based bottling company that operates in 18 countries. Coca-Cola owns approximately 43% of CCA.
• The third part provides summary financial data for Other Equity Investments. • The final paragraphs discuss a) sales of Company ownership in other bottlers (e.g., 49%
ownership in Coca-Cola Beverages Ltd. of Canada to Cola-Cola Enterprises), and b) the market value of Company investments in bottlers other than CCE and CCA.
Questions: 1. For some people, it is difficult to distinguish between the primary soft drink of these two
competitors (Classic Coke versus Pepsi). Are their financial statements equally difficult to distinguish? Using the as reported data in the balance sheets and income statements of each company, a. Compare their assets, liabilities and shareholders’ equity as of year-end 1998. Which
company is larger? Which has relatively more debt in its financial structure? b. Compare their net income, return on assets and return on equity for 1998.4 Which
company appears to be more profitable?
2. Coke and Pepsi elected to pursue different operating and investing strategies. a. Compare the operating strategies of the two companies, e.g., to what extent are Coke
and Pepsi in the same businesses and markets? What effect will any differences have on the financial performance of each and on a comparison of the two companies?
b. Compare the investing strategies of the two companies, e.g., how do Coke and Pepsi differ in their ownership of bottling operations. What effect will these investing differences likely have on the financial performance of each and on a comparison of the two companies?
3 For example, Pepsi owned 100% of its bottlers and consolidated them in the financial statements. 4 To simplify the analysis, use end-of-period assets and shareholders’ equity in the denominator of these ratios.
Coke versus Pepsi page 4 3. As discussed above, Coke’s note 2 provides summary information for Coca-Cola
Enterprises (CCE) and other ‘equity-basis’ investments. a. How is an equity-basis investment shown in the financial statements of Coke (the parent
company)?
b. What effect would consolidation of these equity-basis investments have on the assets, liabilities and shareholders’ equity of Coke at year-end 1998? How does this balance sheet comparison of Coke versus Pepsi change after consolidation of Coke’s equity-basis investments? Hint: follow these steps to prepare the as if consolidated balance sheet for Coca-Cola:
Step 1. Find the template provided in Appendix C on the last page of the case. It will be used in the steps below to approximate the consolidation of Coca-Cola (the parent) with a) Coca-Cola Enterprises (CCE), b) Coca-Cola Amatil (CCA), and c) other equity investments as described in note 2.5
Step 2. Fill in the balance sheet amounts for the bottling companies in the appropriate columns in the spreadsheet using the information in note 2.
Step 3. Adjust long-term assets, shareholders’ equity (SE), and noncontrolling interest.
o Step 3a. Note that consolidated shareholders’ equity has been filled in for you – it should equal the amount on the parent’s balance sheet before consolidation.
o Step 3b. Long-term assets have to be adjusted to avoid double counting.
o Step 3c. Finally, to determine noncontrolling interest, you can either “plug” the amount needed to make assets equal liabilities plus shareholders’ equity on the consolidated balance sheet, or use the information in note 2 (but do not use the percentage ownership of the subsidiaries by the parent, which is also provided in note 2 but is misleading).
Step 4. Add the column amounts across to create the consolidated balances.
c. What effect would consolidation of these equity-basis investments have on the net income, return on assets and return on equity for Coke in 1998? (To avoid having to prepare a consolidation for 1997, use end-of-year assets and equity in the denominator of any ratios you calculate.) How do comparisons of Coke versus Pepsi change after consolidation of Coke’s equity-basis investments?
4. What is your overall assessment of Coke’s investing strategies? 5. If you were CEO of Pepsi, briefly how would you respond to Coke’s operating and
investing strategies?
5 To simplify the analysis, assume that all intercompany transactions (such as Coke’s sale of syrup to CCE) have already been eliminated in the financial data in note 2.
Coke versus Pepsi page 5
Appendix A Products of Coca-Cola
Coca-Cola products include: Coca-Cola Coca-Cola classic caffeine free Coca-Cola caffeine free Coca-Cola classic diet Coke (sold under the trademark Coca-Cola light in many countries outside the U.S.) caffeine free diet Coke Cherry Coke Sprite diet Sprite Mr. Pibb Mello Yello Diet Mello Yello Tab Fresca Barq's root beer Diet Barq’s root beer Surge POWERaDE Fruitopia Minute Maid orange Diet Minute Maid orange Minute Maid juices to go Cool from Nestea Le Bleu water (in certain markets) Dr. Pepper (in most of its regions) Seagrams’ products and Sundrop under franchise agreements with companies that
manufacture concentrate for those products Soft drinks for other Coca-Cola franchise bottlers Source: 1998 10-K filed with the SEC
Coke versus Pepsi page 6
Appendix B Products of PespiCo
Pepsi-Cola division beverages include: Pepsi-Cola Diet Pepsi Pepsi Max Mountain Dew Slice Mug All Sport 7-Up Diet 7-Up Lipton ready-to-drink tea products Miranda Frito-Lay division snack foods include: Lay’s Ruffles Doritos Tostitos Fritos Cheetos Sunchips Rold Gold pretzels Walker’s (U.K) Wedel (Poland) Gamesa (Mexico) Alegro (Mexico) Source: 1998 10-K filed with the SEC
Coke versus Pepsi page 7
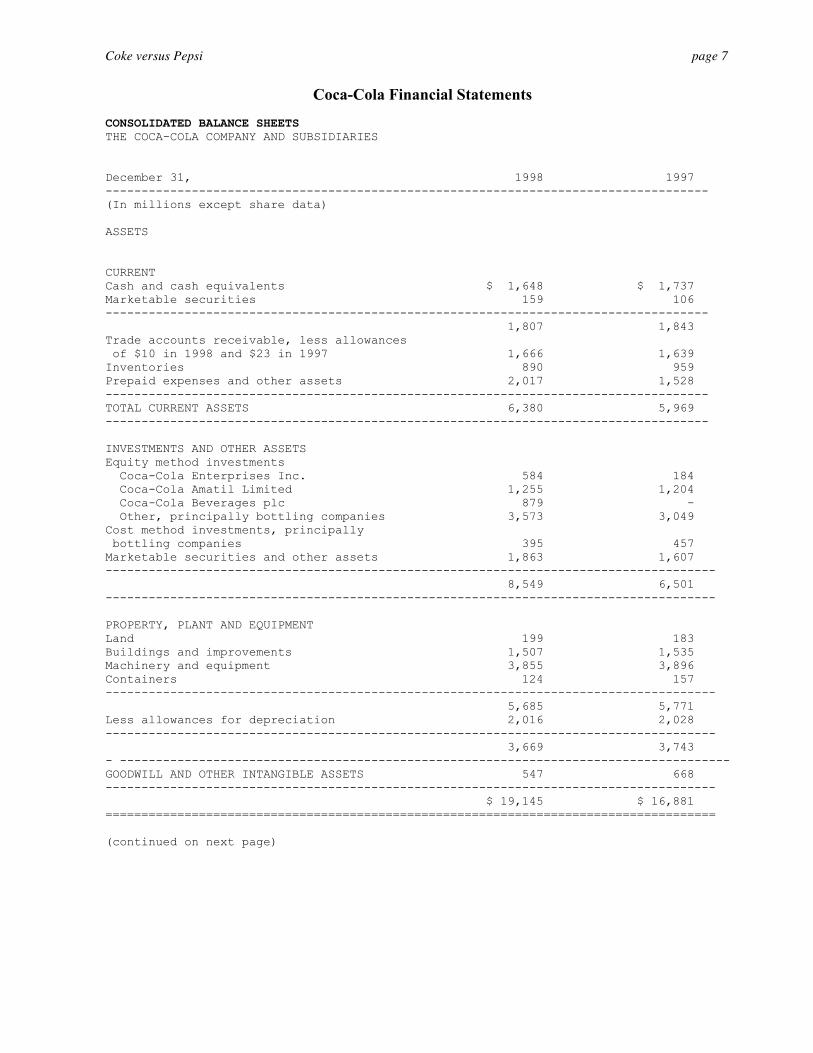
Coca-Cola Financial Statements CONSOLIDATED BALANCE SHEETS THE COCA-COLA COMPANY AND SUBSIDIARIES December 31, 1998 1997 ------------------------------------------------------------------------------------ (In millions except share data) ASSETS CURRENT Cash and cash equivalents $ 1,648 $ 1,737 Marketable securities 159 106 ------------------------------------------------------------------------------------ 1,807 1,843 Trade accounts receivable, less allowances of $10 in 1998 and $23 in 1997 1,666 1,639 Inventories 890 959 Prepaid expenses and other assets 2,017 1,528 ------------------------------------------------------------------------------------ TOTAL CURRENT ASSETS 6,380 5,969 ------------------------------------------------------------------------------------ INVESTMENTS AND OTHER ASSETS Equity method investments Coca-Cola Enterprises Inc. 584 184 Coca-Cola Amatil Limited 1,255 1,204 Coca-Cola Beverages plc 879 - Other, principally bottling companies 3,573 3,049 Cost method investments, principally bottling companies 395 457 Marketable securities and other assets 1,863 1,607 ------------------------------------------------------------------------------------- 8,549 6,501 ------------------------------------------------------------------------------------- PROPERTY, PLANT AND EQUIPMENT Land 199 183 Buildings and improvements 1,507 1,535 Machinery and equipment 3,855 3,896 Containers 124 157 ------------------------------------------------------------------------------------- 5,685 5,771 Less allowances for depreciation 2,016 2,028 ------------------------------------------------------------------------------------- 3,669 3,743 - ------------------------------------------------------------------------------------- GOODWILL AND OTHER INTANGIBLE ASSETS 547 668 ------------------------------------------------------------------------------------- $ 19,145 $ 16,881 ===================================================================================== (continued on next page)
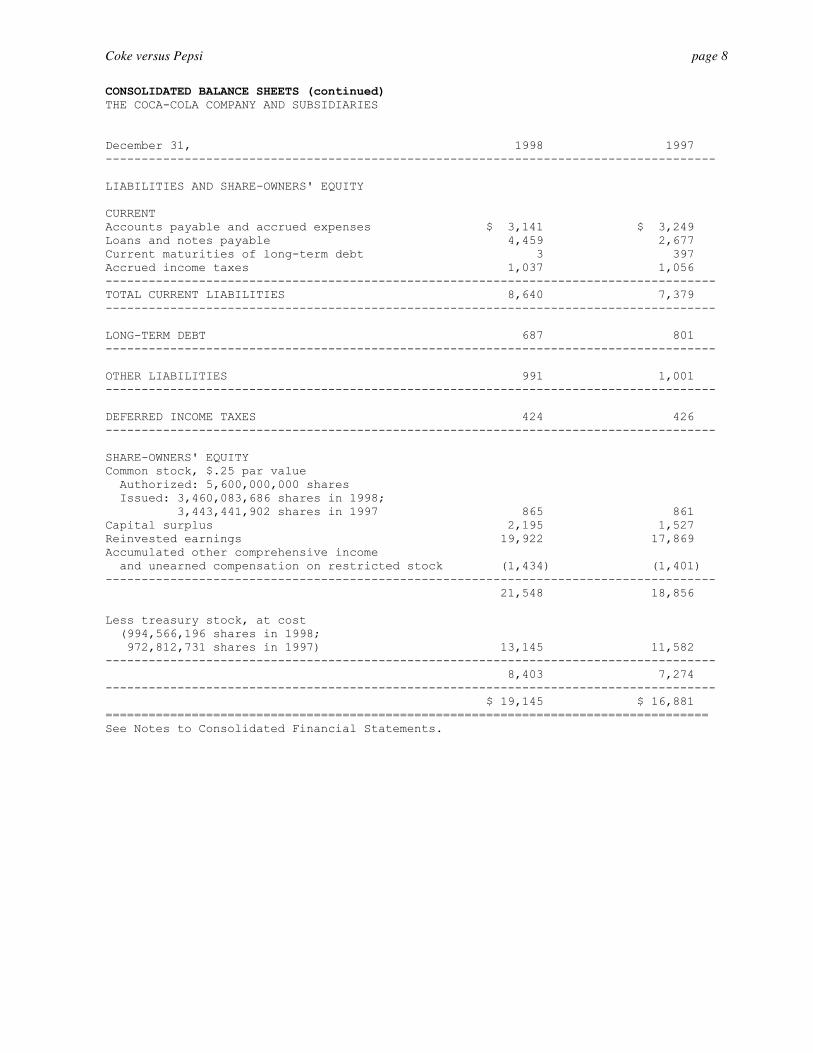
Coke versus Pepsi page 8 CONSOLIDATED BALANCE SHEETS (continued) THE COCA-COLA COMPANY AND SUBSIDIARIES December 31, 1998 1997 ------------------------------------------------------------------------------------- LIABILITIES AND SHARE-OWNERS' EQUITY CURRENT Accounts payable and accrued expenses $ 3,141 $ 3,249 Loans and notes payable 4,459 2,677 Current maturities of long-term debt 3 397 Accrued income taxes 1,037 1,056 ------------------------------------------------------------------------------------- TOTAL CURRENT LIABILITIES 8,640 7,379 ------------------------------------------------------------------------------------- LONG-TERM DEBT 687 801 ------------------------------------------------------------------------------------- OTHER LIABILITIES 991 1,001 ------------------------------------------------------------------------------------- DEFERRED INCOME TAXES 424 426 ------------------------------------------------------------------------------------- SHARE-OWNERS' EQUITY Common stock, $.25 par value Authorized: 5,600,000,000 shares Issued: 3,460,083,686 shares in 1998; 3,443,441,902 shares in 1997 865 861 Capital surplus 2,195 1,527 Reinvested earnings 19,922 17,869 Accumulated other comprehensive income and unearned compensation on restricted stock (1,434) (1,401) ------------------------------------------------------------------------------------- 21,548 18,856 Less treasury stock, at cost (994,566,196 shares in 1998; 972,812,731 shares in 1997) 13,145 11,582 ------------------------------------------------------------------------------------- 8,403 7,274 ------------------------------------------------------------------------------------- $ 19,145 $ 16,881 ==================================================================================== See Notes to Consolidated Financial Statements.
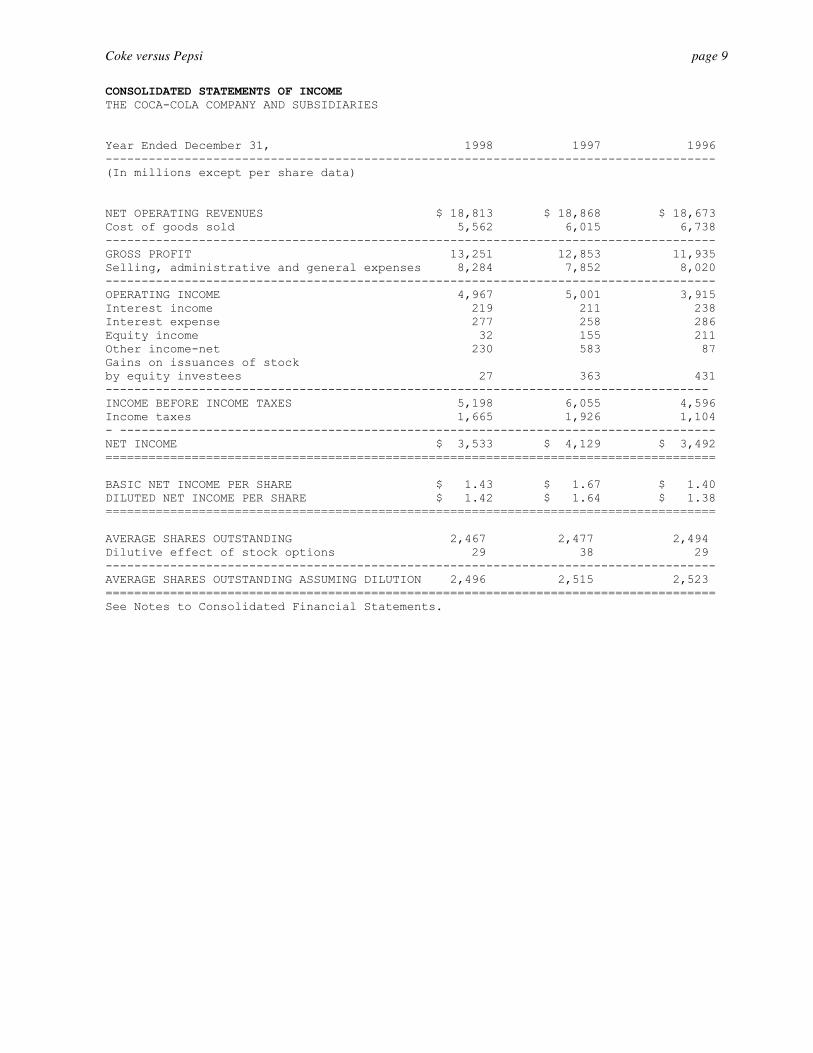
Coke versus Pepsi page 9 CONSOLIDATED STATEMENTS OF INCOME THE COCA-COLA COMPANY AND SUBSIDIARIES Year Ended December 31, 1998 1997 1996 ------------------------------------------------------------------------------------- (In millions except per share data) NET OPERATING REVENUES $ 18,813 $ 18,868 $ 18,673 Cost of goods sold 5,562 6,015 6,738 ------------------------------------------------------------------------------------- GROSS PROFIT 13,251 12,853 11,935 Selling, administrative and general expenses 8,284 7,852 8,020 ------------------------------------------------------------------------------------- OPERATING INCOME 4,967 5,001 3,915 Interest income 219 211 238 Interest expense 277 258 286 Equity income 32 155 211 Other income-net 230 583 87 Gains on issuances of stock by equity investees 27 363 431 ------------------------------------------------------------------------------------ INCOME BEFORE INCOME TAXES 5,198 6,055 4,596 Income taxes 1,665 1,926 1,104 - ----------------------------------------------------------------------------------- NET INCOME $ 3,533 $ 4,129 $ 3,492 ===================================================================================== BASIC NET INCOME PER SHARE $ 1.43 $ 1.67 $ 1.40 DILUTED NET INCOME PER SHARE $ 1.42 $ 1.64 $ 1.38 ===================================================================================== AVERAGE SHARES OUTSTANDING 2,467 2,477 2,494 Dilutive effect of stock options 29 38 29 ------------------------------------------------------------------------------------- AVERAGE SHARES OUTSTANDING ASSUMING DILUTION 2,496 2,515 2,523 ===================================================================================== See Notes to Consolidated Financial Statements.

Coke versus Pepsi page 10 CONSOLIDATED STATEMENTS OF CASH FLOWS THE COCA-COLA COMPANY AND SUBSIDIARIES Year Ended December 31, 1998 1997 1996 ----------------------------------------------------------------------------------- (In millions) OPERATING ACTIVITIES Net income $ 3,533 $ 4,129 $ 3,492 Depreciation and amortization 645 626 633 Deferred income taxes (38) 380 (145) Equity income, net of dividends 31 (108) (89) Foreign currency adjustments 21 37 (60) Gains on issuances of stock by equity investees (27) (363) (431) Gains on sales of assets, including bottling interests (306) (639) (135) Other items 124 18 316 Net change in operating assets and liabilities (550) (47) (118) ----------------------------------------------------------------------------------- Net cash provided by operating activities 3,433 4,033 3,463 ----------------------------------------------------------------------------------- INVESTING ACTIVITIES Acquisitions and investments, principally bottling companies (1,428) (1,100) (645) Purchases of investments and other assets (610) (459) (623) Proceeds from disposals of investments and other assets 1,036 1,999 1,302 Purchases of property, plant and equipment (863) (1,093) (990) Proceeds from disposals of property, plant and equipment 54 71 81 Other investing activities (350) 82 (175) ----------------------------------------------------------------------------------- Net cash used in investing activities (2,161) (500) (1,050) ----------------------------------------------------------------------------------- Net cash provided by operations after reinvestment 1,272 3,533 2,413 ----------------------------------------------------------------------------------- FINANCING ACTIVITIES Issuances of debt 1,818 155 1,122 Payments of debt (410) (751) (580) Issuances of stock 302 150 124 Purchases of stock for treasury (1,563) (1,262) (1,521) Dividends (1,480) (1,387) (1,247) ----------------------------------------------------------------------------------- Net cash used in financing activities (1,333) (3,095) (2,102) ----------------------------------------------------------------------------------- EFFECT OF EXCHANGE RATE CHANGES ON CASH AND CASH EQUIVALENTS (28) (134) (45) ----------------------------------------------------------------------------------- CASH AND CASH EQUIVALENTS Net increase (decrease) during the year (89) 304 266 Balance at beginning of the year 1,737 1,433 1,167 ----------------------------------------------------------------------------------- Balance at end of year $ 1,648 $ 1,737 $ 1,433 =================================================================================== See Notes to Consolidated Financial Statements.
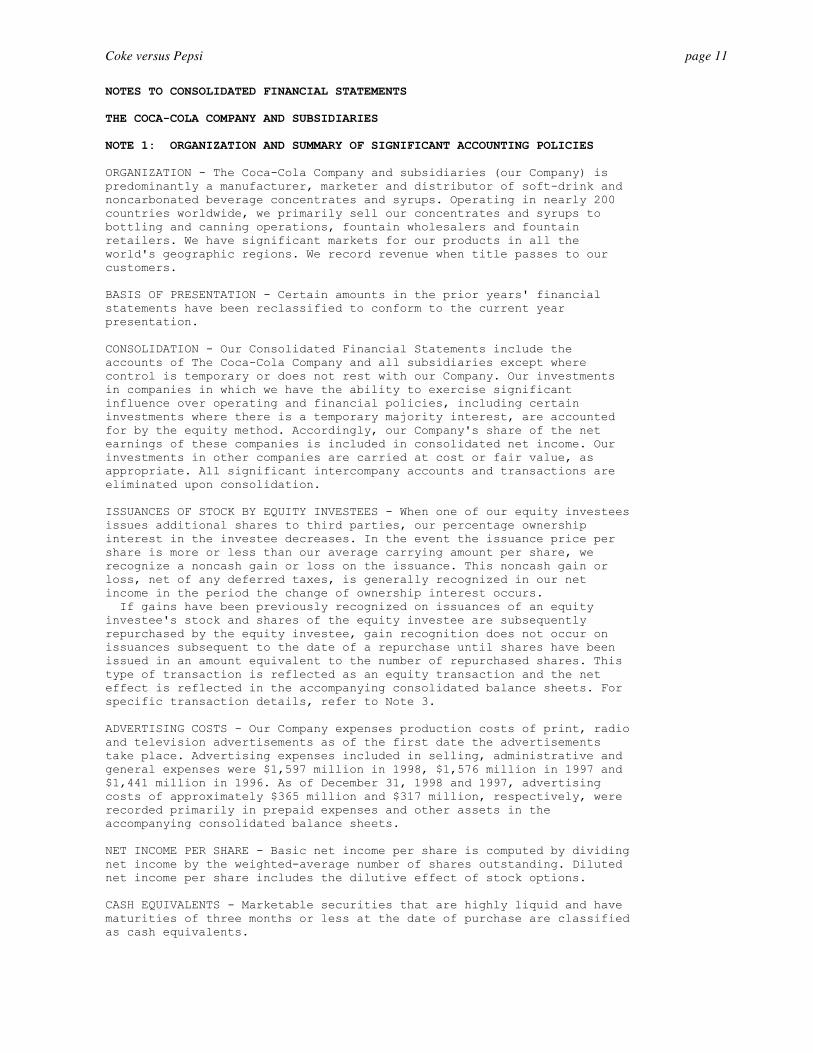
Coke versus Pepsi page 11 NOTES TO CONSOLIDATED FINANCIAL STATEMENTS THE COCA-COLA COMPANY AND SUBSIDIARIES NOTE 1: ORGANIZATION AND SUMMARY OF SIGNIFICANT ACCOUNTING POLICIES ORGANIZATION - The Coca-Cola Company and subsidiaries (our Company) is predominantly a manufacturer, marketer and distributor of soft-drink and noncarbonated beverage concentrates and syrups. Operating in nearly 200 countries worldwide, we primarily sell our concentrates and syrups to bottling and canning operations, fountain wholesalers and fountain retailers. We have significant markets for our products in all the world's geographic regions. We record revenue when title passes to our customers. BASIS OF PRESENTATION - Certain amounts in the prior years' financial statements have been reclassified to conform to the current year presentation. CONSOLIDATION - Our Consolidated Financial Statements include the accounts of The Coca-Cola Company and all subsidiaries except where control is temporary or does not rest with our Company. Our investments in companies in which we have the ability to exercise significant influence over operating and financial policies, including certain investments where there is a temporary majority interest, are accounted for by the equity method. Accordingly, our Company's share of the net earnings of these companies is included in consolidated net income. Our investments in other companies are carried at cost or fair value, as appropriate. All significant intercompany accounts and transactions are eliminated upon consolidation. ISSUANCES OF STOCK BY EQUITY INVESTEES - When one of our equity investees issues additional shares to third parties, our percentage ownership interest in the investee decreases. In the event the issuance price per share is more or less than our average carrying amount per share, we recognize a noncash gain or loss on the issuance. This noncash gain or loss, net of any deferred taxes, is generally recognized in our net income in the period the change of ownership interest occurs. If gains have been previously recognized on issuances of an equity investee's stock and shares of the equity investee are subsequently repurchased by the equity investee, gain recognition does not occur on issuances subsequent to the date of a repurchase until shares have been issued in an amount equivalent to the number of repurchased shares. This type of transaction is reflected as an equity transaction and the net effect is reflected in the accompanying consolidated balance sheets. For specific transaction details, refer to Note 3. ADVERTISING COSTS - Our Company expenses production costs of print, radio and television advertisements as of the first date the advertisements take place. Advertising expenses included in selling, administrative and general expenses were $1,597 million in 1998, $1,576 million in 1997 and $1,441 million in 1996. As of December 31, 1998 and 1997, advertising costs of approximately $365 million and $317 million, respectively, were recorded primarily in prepaid expenses and other assets in the accompanying consolidated balance sheets. NET INCOME PER SHARE - Basic net income per share is computed by dividing net income by the weighted-average number of shares outstanding. Diluted net income per share includes the dilutive effect of stock options. CASH EQUIVALENTS - Marketable securities that are highly liquid and have maturities of three months or less at the date of purchase are classified as cash equivalents.
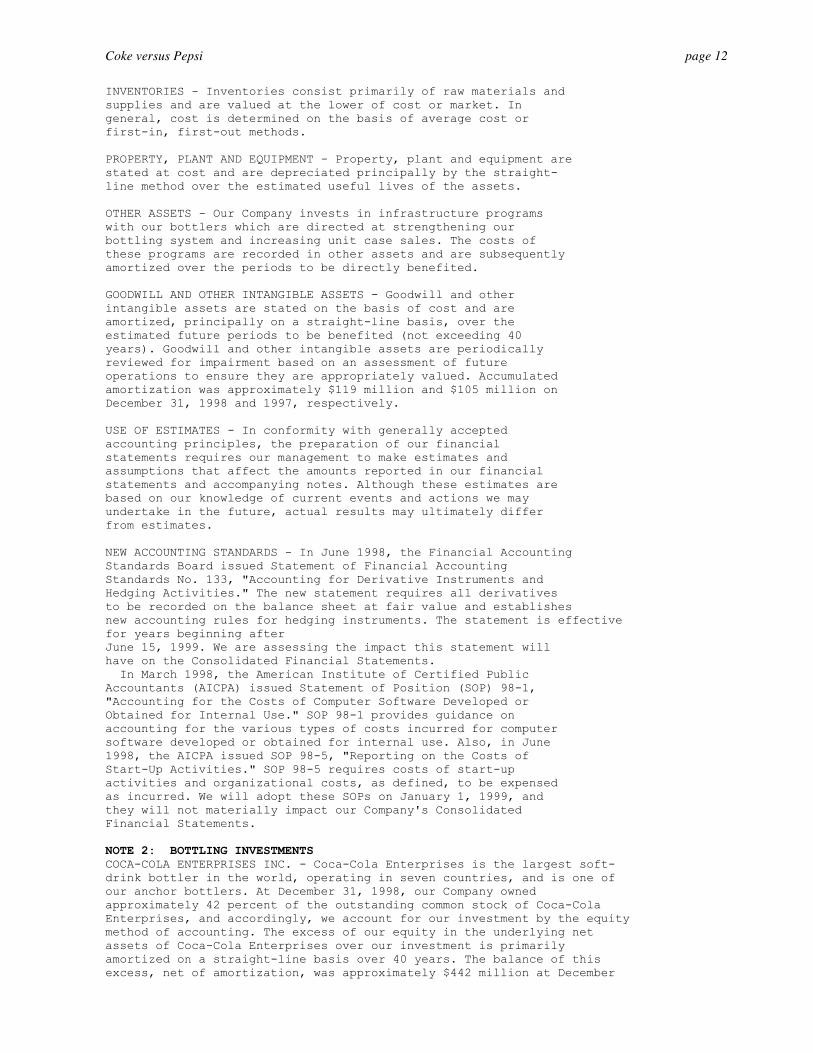
Coke versus Pepsi page 12 INVENTORIES - Inventories consist primarily of raw materials and supplies and are valued at the lower of cost or market. In general, cost is determined on the basis of average cost or first-in, first-out methods. PROPERTY, PLANT AND EQUIPMENT - Property, plant and equipment are stated at cost and are depreciated principally by the straight- line method over the estimated useful lives of the assets. OTHER ASSETS - Our Company invests in infrastructure programs with our bottlers which are directed at strengthening our bottling system and increasing unit case sales. The costs of these programs are recorded in other assets and are subsequently amortized over the periods to be directly benefited. GOODWILL AND OTHER INTANGIBLE ASSETS - Goodwill and other intangible assets are stated on the basis of cost and are amortized, principally on a straight-line basis, over the estimated future periods to be benefited (not exceeding 40 years). Goodwill and other intangible assets are periodically reviewed for impairment based on an assessment of future operations to ensure they are appropriately valued. Accumulated amortization was approximately $119 million and $105 million on December 31, 1998 and 1997, respectively. USE OF ESTIMATES - In conformity with generally accepted accounting principles, the preparation of our financial statements requires our management to make estimates and assumptions that affect the amounts reported in our financial statements and accompanying notes. Although these estimates are based on our knowledge of current events and actions we may undertake in the future, actual results may ultimately differ from estimates. NEW ACCOUNTING STANDARDS - In June 1998, the Financial Accounting Standards Board issued Statement of Financial Accounting Standards No. 133, "Accounting for Derivative Instruments and Hedging Activities." The new statement requires all derivatives to be recorded on the balance sheet at fair value and establishes new accounting rules for hedging instruments. The statement is effective for years beginning after June 15, 1999. We are assessing the impact this statement will have on the Consolidated Financial Statements. In March 1998, the American Institute of Certified Public Accountants (AICPA) issued Statement of Position (SOP) 98-1, "Accounting for the Costs of Computer Software Developed or Obtained for Internal Use." SOP 98-1 provides guidance on accounting for the various types of costs incurred for computer software developed or obtained for internal use. Also, in June 1998, the AICPA issued SOP 98-5, "Reporting on the Costs of Start-Up Activities." SOP 98-5 requires costs of start-up activities and organizational costs, as defined, to be expensed as incurred. We will adopt these SOPs on January 1, 1999, and they will not materially impact our Company's Consolidated Financial Statements. NOTE 2: BOTTLING INVESTMENTS COCA-COLA ENTERPRISES INC. - Coca-Cola Enterprises is the largest soft-drink bottler in the world, operating in seven countries, and is one of our anchor bottlers. At December 31, 1998, our Company owned approximately 42 percent of the outstanding common stock of Coca-Cola Enterprises, and accordingly, we account for our investment by the equity method of accounting. The excess of our equity in the underlying net assets of Coca-Cola Enterprises over our investment is primarily amortized on a straight-line basis over 40 years. The balance of this excess, net of amortization, was approximately $442 million at December
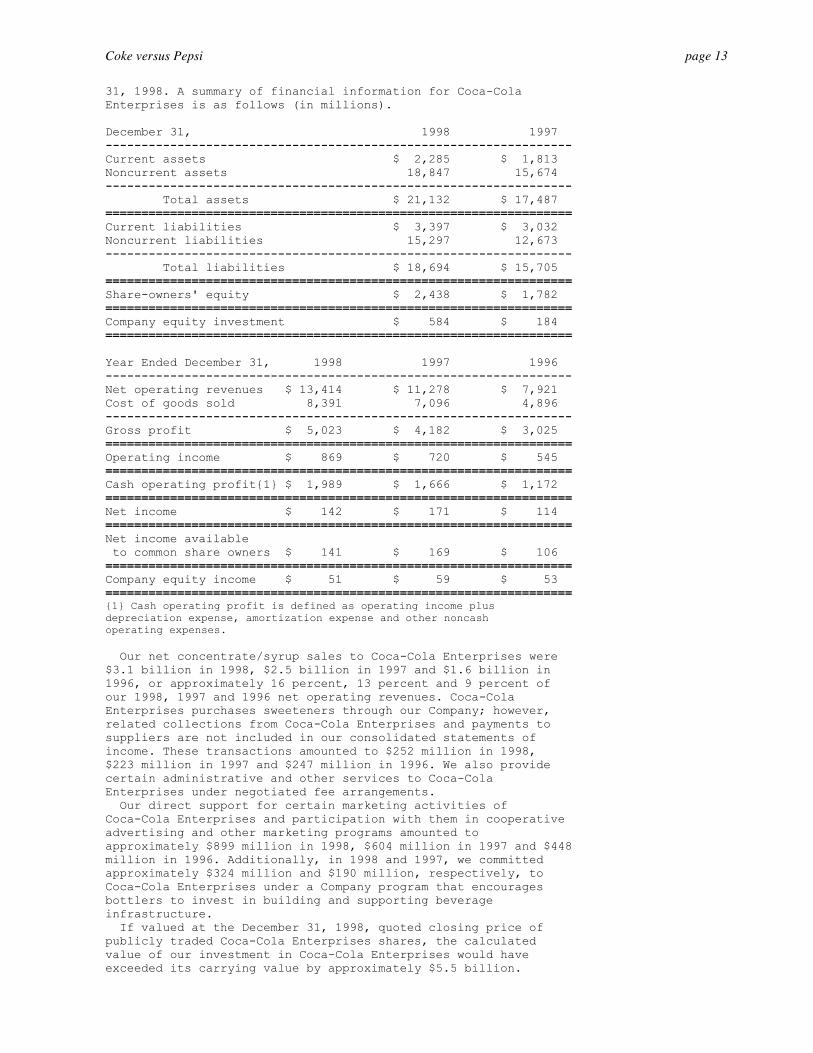
Coke versus Pepsi page 13 31, 1998. A summary of financial information for Coca-Cola Enterprises is as follows (in millions). December 31, 1998 1997 ----------------------------------------------------------------- Current assets $ 2,285 $ 1,813 Noncurrent assets 18,847 15,674 ----------------------------------------------------------------- Total assets $ 21,132 $ 17,487 ================================================================= Current liabilities $ 3,397 $ 3,032 Noncurrent liabilities 15,297 12,673 ----------------------------------------------------------------- Total liabilities $ 18,694 $ 15,705 ================================================================= Share-owners' equity $ 2,438 $ 1,782 ================================================================= Company equity investment $ 584 $ 184 ================================================================= Year Ended December 31, 1998 1997 1996 ----------------------------------------------------------------- Net operating revenues $ 13,414 $ 11,278 $ 7,921 Cost of goods sold 8,391 7,096 4,896 ----------------------------------------------------------------- Gross profit $ 5,023 $ 4,182 $ 3,025 ================================================================= Operating income $ 869 $ 720 $ 545 ================================================================= Cash operating profit{1} $ 1,989 $ 1,666 $ 1,172 ================================================================= Net income $ 142 $ 171 $ 114 ================================================================= Net income available to common share owners $ 141 $ 169 $ 106 ================================================================= Company equity income $ 51 $ 59 $ 53 ================================================================= {1} Cash operating profit is defined as operating income plus depreciation expense, amortization expense and other noncash operating expenses. Our net concentrate/syrup sales to Coca-Cola Enterprises were $3.1 billion in 1998, $2.5 billion in 1997 and $1.6 billion in 1996, or approximately 16 percent, 13 percent and 9 percent of our 1998, 1997 and 1996 net operating revenues. Coca-Cola Enterprises purchases sweeteners through our Company; however, related collections from Coca-Cola Enterprises and payments to suppliers are not included in our consolidated statements of income. These transactions amounted to $252 million in 1998, $223 million in 1997 and $247 million in 1996. We also provide certain administrative and other services to Coca-Cola Enterprises under negotiated fee arrangements. Our direct support for certain marketing activities of Coca-Cola Enterprises and participation with them in cooperative advertising and other marketing programs amounted to approximately $899 million in 1998, $604 million in 1997 and $448 million in 1996. Additionally, in 1998 and 1997, we committed approximately $324 million and $190 million, respectively, to Coca-Cola Enterprises under a Company program that encourages bottlers to invest in building and supporting beverage infrastructure. If valued at the December 31, 1998, quoted closing price of publicly traded Coca-Cola Enterprises shares, the calculated value of our investment in Coca-Cola Enterprises would have exceeded its carrying value by approximately $5.5 billion.
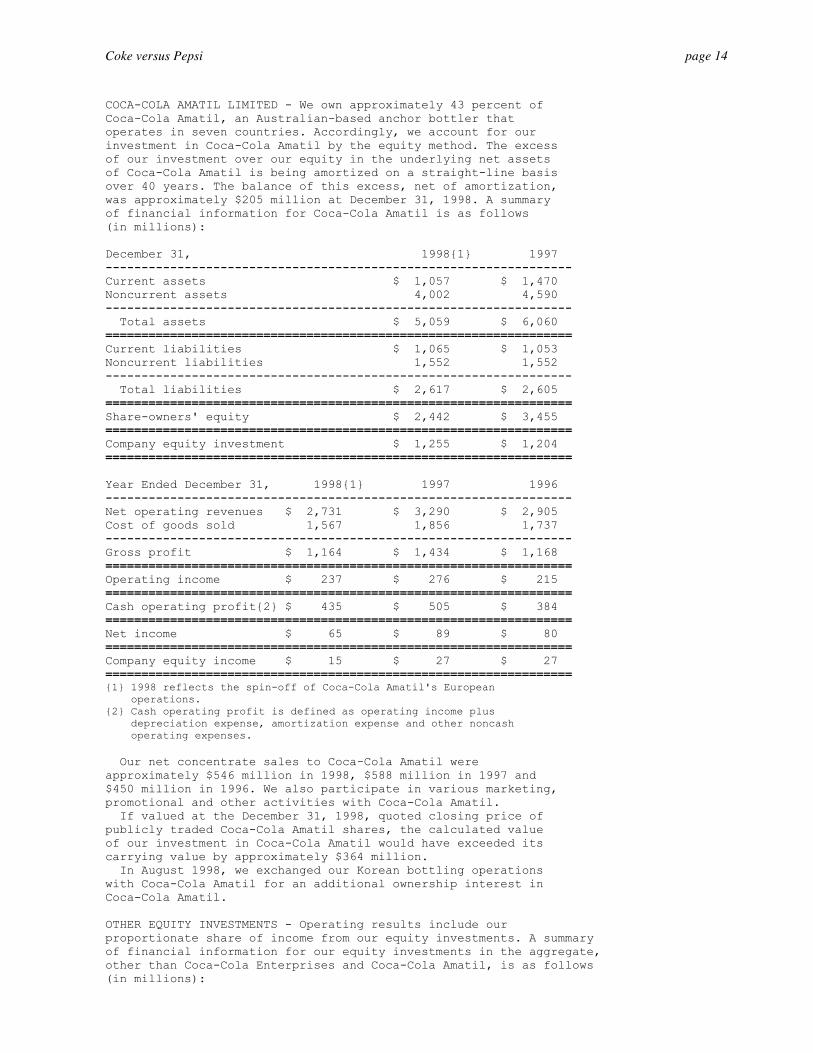
Coke versus Pepsi page 14 COCA-COLA AMATIL LIMITED - We own approximately 43 percent of Coca-Cola Amatil, an Australian-based anchor bottler that operates in seven countries. Accordingly, we account for our investment in Coca-Cola Amatil by the equity method. The excess of our investment over our equity in the underlying net assets of Coca-Cola Amatil is being amortized on a straight-line basis over 40 years. The balance of this excess, net of amortization, was approximately $205 million at December 31, 1998. A summary of financial information for Coca-Cola Amatil is as follows (in millions): December 31, 1998{1} 1997 ----------------------------------------------------------------- Current assets $ 1,057 $ 1,470 Noncurrent assets 4,002 4,590 ----------------------------------------------------------------- Total assets $ 5,059 $ 6,060 ================================================================= Current liabilities $ 1,065 $ 1,053 Noncurrent liabilities 1,552 1,552 ----------------------------------------------------------------- Total liabilities $ 2,617 $ 2,605 ================================================================= Share-owners' equity $ 2,442 $ 3,455 ================================================================= Company equity investment $ 1,255 $ 1,204 ================================================================= Year Ended December 31, 1998{1} 1997 1996 ----------------------------------------------------------------- Net operating revenues $ 2,731 $ 3,290 $ 2,905 Cost of goods sold 1,567 1,856 1,737 ----------------------------------------------------------------- Gross profit $ 1,164 $ 1,434 $ 1,168 ================================================================= Operating income $ 237 $ 276 $ 215 ================================================================= Cash operating profit{2} $ 435 $ 505 $ 384 ================================================================= Net income $ 65 $ 89 $ 80 ================================================================= Company equity income $ 15 $ 27 $ 27 ================================================================= {1} 1998 reflects the spin-off of Coca-Cola Amatil's European operations. {2} Cash operating profit is defined as operating income plus depreciation expense, amortization expense and other noncash operating expenses. Our net concentrate sales to Coca-Cola Amatil were approximately $546 million in 1998, $588 million in 1997 and $450 million in 1996. We also participate in various marketing, promotional and other activities with Coca-Cola Amatil. If valued at the December 31, 1998, quoted closing price of publicly traded Coca-Cola Amatil shares, the calculated value of our investment in Coca-Cola Amatil would have exceeded its carrying value by approximately $364 million. In August 1998, we exchanged our Korean bottling operations with Coca-Cola Amatil for an additional ownership interest in Coca-Cola Amatil. OTHER EQUITY INVESTMENTS - Operating results include our proportionate share of income from our equity investments. A summary of financial information for our equity investments in the aggregate, other than Coca-Cola Enterprises and Coca-Cola Amatil, is as follows (in millions):
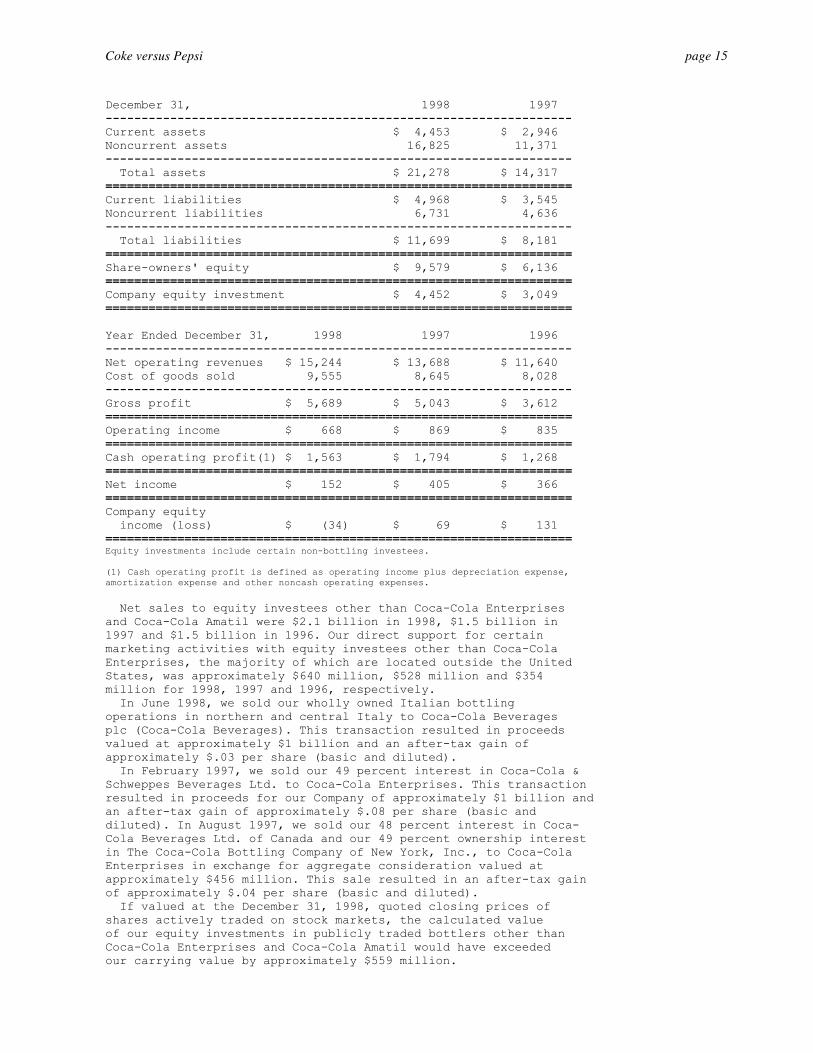
Coke versus Pepsi page 15 December 31, 1998 1997 ----------------------------------------------------------------- Current assets $ 4,453 $ 2,946 Noncurrent assets 16,825 11,371 ----------------------------------------------------------------- Total assets $ 21,278 $ 14,317 ================================================================= Current liabilities $ 4,968 $ 3,545 Noncurrent liabilities 6,731 4,636 ----------------------------------------------------------------- Total liabilities $ 11,699 $ 8,181 ================================================================= Share-owners' equity $ 9,579 $ 6,136 ================================================================= Company equity investment $ 4,452 $ 3,049 ================================================================= Year Ended December 31, 1998 1997 1996 ----------------------------------------------------------------- Net operating revenues $ 15,244 $ 13,688 $ 11,640 Cost of goods sold 9,555 8,645 8,028 ----------------------------------------------------------------- Gross profit $ 5,689 $ 5,043 $ 3,612 ================================================================= Operating income $ 668 $ 869 $ 835 ================================================================= Cash operating profit(1) $ 1,563 $ 1,794 $ 1,268 ================================================================= Net income $ 152 $ 405 $ 366 ================================================================= Company equity income (loss) $ (34) $ 69 $ 131 ================================================================= Equity investments include certain non-bottling investees. (1) Cash operating profit is defined as operating income plus depreciation expense, amortization expense and other noncash operating expenses. Net sales to equity investees other than Coca-Cola Enterprises and Coca-Cola Amatil were $2.1 billion in 1998, $1.5 billion in 1997 and $1.5 billion in 1996. Our direct support for certain marketing activities with equity investees other than Coca-Cola Enterprises, the majority of which are located outside the United States, was approximately $640 million, $528 million and $354 million for 1998, 1997 and 1996, respectively. In June 1998, we sold our wholly owned Italian bottling operations in northern and central Italy to Coca-Cola Beverages plc (Coca-Cola Beverages). This transaction resulted in proceeds valued at approximately $1 billion and an after-tax gain of approximately $.03 per share (basic and diluted). In February 1997, we sold our 49 percent interest in Coca-Cola & Schweppes Beverages Ltd. to Coca-Cola Enterprises. This transaction resulted in proceeds for our Company of approximately $1 billion and an after-tax gain of approximately $.08 per share (basic and diluted). In August 1997, we sold our 48 percent interest in Coca-Cola Beverages Ltd. of Canada and our 49 percent ownership interest in The Coca-Cola Bottling Company of New York, Inc., to Coca-Cola Enterprises in exchange for aggregate consideration valued at approximately $456 million. This sale resulted in an after-tax gain of approximately $.04 per share (basic and diluted). If valued at the December 31, 1998, quoted closing prices of shares actively traded on stock markets, the calculated value of our equity investments in publicly traded bottlers other than Coca-Cola Enterprises and Coca-Cola Amatil would have exceeded our carrying value by approximately $559 million.
Coke versus Pepsi page 16
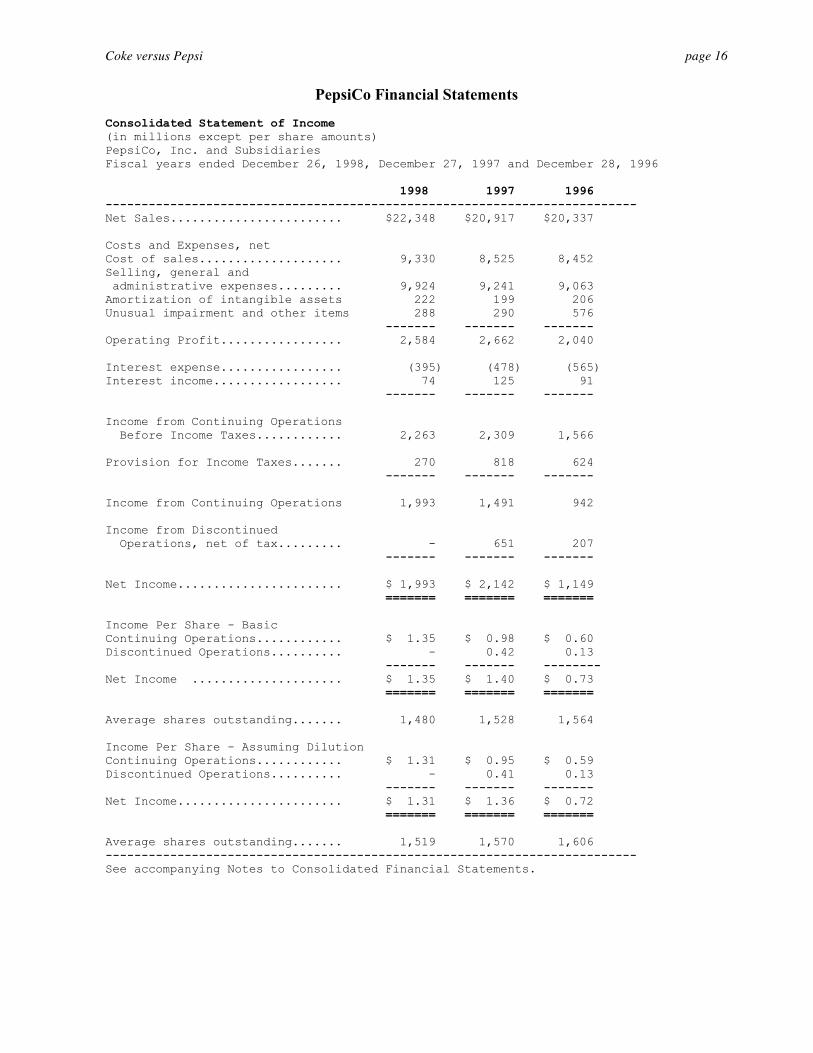
PepsiCo Financial Statements Consolidated Statement of Income (in millions except per share amounts) PepsiCo, Inc. and Subsidiaries Fiscal years ended December 26, 1998, December 27, 1997 and December 28, 1996 1998 1997 1996 -------------------------------------------------------------------------- Net Sales........................ $22,348 $20,917 $20,337 Costs and Expenses, net Cost of sales.................... 9,330 8,525 8,452 Selling, general and administrative expenses......... 9,924 9,241 9,063 Amortization of intangible assets 222 199 206 Unusual impairment and other items 288 290 576 ------- ------- ------- Operating Profit................. 2,584 2,662 2,040 Interest expense................. (395) (478) (565) Interest income.................. 74 125 91 ------- ------- ------- Income from Continuing Operations Before Income Taxes............ 2,263 2,309 1,566 Provision for Income Taxes....... 270 818 624 ------- ------- ------- Income from Continuing Operations 1,993 1,491 942 Income from Discontinued Operations, net of tax......... - 651 207 ------- ------- ------- Net Income....................... $ 1,993 $ 2,142 $ 1,149 ======= ======= ======= Income Per Share - Basic Continuing Operations............ $ 1.35 $ 0.98 $ 0.60 Discontinued Operations.......... - 0.42 0.13 ------- ------- -------- Net Income ..................... $ 1.35 $ 1.40 $ 0.73 ======= ======= ======= Average shares outstanding....... 1,480 1,528 1,564 Income Per Share - Assuming Dilution Continuing Operations............ $ 1.31 $ 0.95 $ 0.59 Discontinued Operations.......... - 0.41 0.13 ------- ------- ------- Net Income....................... $ 1.31 $ 1.36 $ 0.72 ======= ======= ======= Average shares outstanding....... 1,519 1,570 1,606 -------------------------------------------------------------------------- See accompanying Notes to Consolidated Financial Statements.
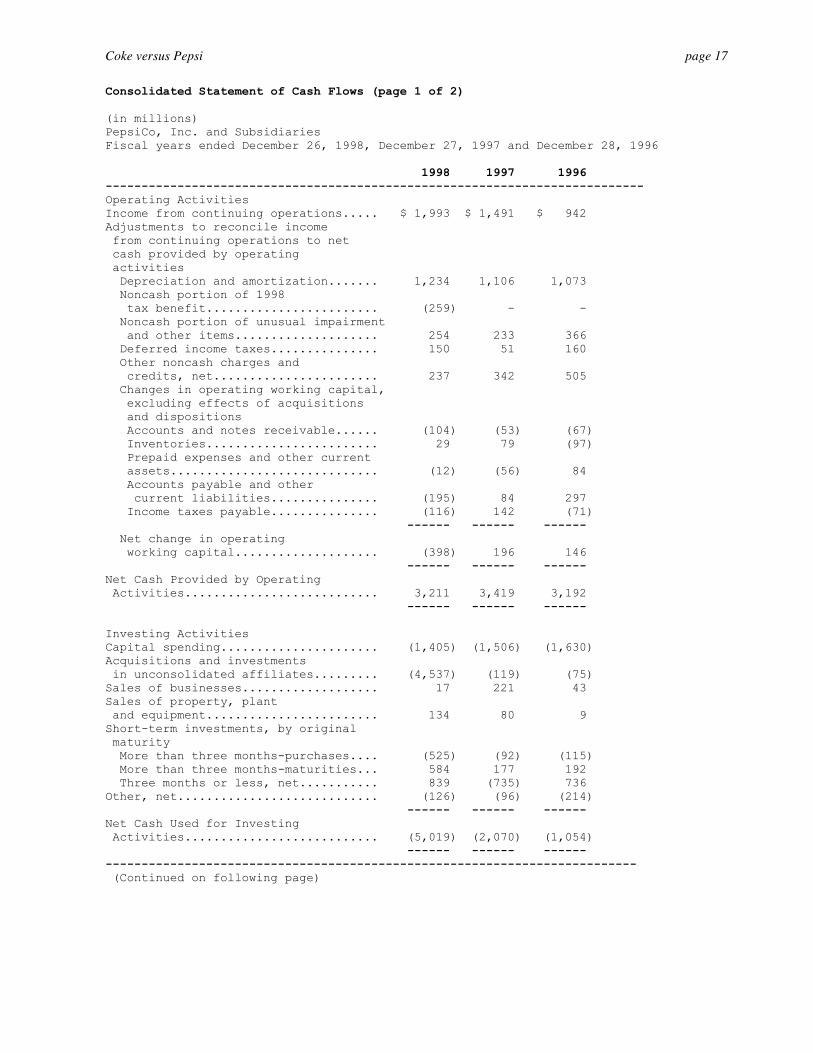
Coke versus Pepsi page 17 Consolidated Statement of Cash Flows (page 1 of 2) (in millions) PepsiCo, Inc. and Subsidiaries Fiscal years ended December 26, 1998, December 27, 1997 and December 28, 1996 1998 1997 1996 --------------------------------------------------------------------------- Operating Activities Income from continuing operations..... $ 1,993 $ 1,491 $ 942 Adjustments to reconcile income from continuing operations to net cash provided by operating activities Depreciation and amortization....... 1,234 1,106 1,073 Noncash portion of 1998 tax benefit........................ (259) - - Noncash portion of unusual impairment and other items.................... 254 233 366 Deferred income taxes............... 150 51 160 Other noncash charges and credits, net....................... 237 342 505 Changes in operating working capital, excluding effects of acquisitions and dispositions Accounts and notes receivable...... (104) (53) (67) Inventories........................ 29 79 (97) Prepaid expenses and other current assets............................. (12) (56) 84 Accounts payable and other current liabilities............... (195) 84 297 Income taxes payable............... (116) 142 (71) ------ ------ ------ Net change in operating working capital.................... (398) 196 146 ------ ------ ------ Net Cash Provided by Operating Activities........................... 3,211 3,419 3,192 ------ ------ ------ Investing Activities Capital spending...................... (1,405) (1,506) (1,630) Acquisitions and investments in unconsolidated affiliates......... (4,537) (119) (75) Sales of businesses................... 17 221 43 Sales of property, plant and equipment........................ 134 80 9 Short-term investments, by original maturity More than three months-purchases.... (525) (92) (115) More than three months-maturities... 584 177 192 Three months or less, net........... 839 (735) 736 Other, net............................ (126) (96) (214) ------ ------ ------ Net Cash Used for Investing Activities........................... (5,019) (2,070) (1,054) ------ ------ ------ -------------------------------------------------------------------------- (Continued on following page)

Coke versus Pepsi page 18 Consolidated Statement of Cash Flows (page 2 of 2) (in millions) PepsiCo, Inc. and Subsidiaries Fiscal years ended December 26, 1998, December 27, 1997 and December 28, 1996 1998 1997 1996 -------------------------------------------------------------------------- Financing Activities Proceeds from issuances of long-term debt................. 990 - 1,772 Payments of long-term debt...... (2,277) (1,875) (1,432) Short-term borrowings, by original maturity More than three months-proceeds 2,713 146 740 More than three months-payments (417) (177) (1,873) Three months or less, net..... 1,753 (1,269) 89 Cash dividends paid............. (757) (736) (675) Share repurchases............... (2,230) (2,459) (1,651) Proceeds from exercises of stock options.................. 415 403 323 Other, net...................... - 5 (9) ------- -------- ------- Net Cash Provided by (Used for) Financing Activities........... 190 (5,962) (2,716) ------- ------- ------- Net Cash Provided by Discontinued Operations..................... - 6,236 605 Effect of Exchange Rate Changes on Cash and Cash Equivalents...... 1 (2) (5) ------- ------- ------- Net (Decrease) Increase in Cash and Cash Equivalents........... (1,617) 1,621 22 Cash and Cash Equivalents - Beginning of Year............ 1,928 307 285 ------- ------- ------- Cash and Cash Equivalents - End of Year.................. $ 311 $ 1,928 $ 307 ======= ======= ======= - --------------------------------------------------------------------------- Supplemental Cash Flow Information Interest paid................... $ 367 $ 462 $ 538 Income taxes paid............... $ 521 $ 696 $ 611 Schedule of Noncash Investing and Financing Activities Fair value of assets acquired... $ 5,359 $ 160 $ 81 Cash paid and stock issued...... (4,537) (134) (76) ------- ------- ------- Liabilities assumed............. $ 822 $ 26 $ 5 ======= ======= ======= -------------------------------------------------------------------------- See accompanying Notes to Consolidated Financial Statements.

Coke versus Pepsi page 19 Consolidated Balance Sheet (in millions) PepsiCo, Inc. and Subsidiaries December 26, 1998 and December 27, 1997 1998 1997 ----------------------------------------------------------------------- ASSETS Current Assets Cash and cash equivalents................ $ 311 $ 1,928 Short-term investments, at cost.......... 83 955 ------- ------- 394 2,883 Accounts and notes receivable, less allowance: $127 in 1998 and $125 in 1997........... 2,453 2,150 Inventories.............................. 1,016 732 Prepaid expenses, deferred income taxes and other current assets................ 499 486 ------- ------- Total Current Assets................. 4,362 6,251 Property, Plant and Equipment, net....... 7,318 6,261 Intangible Assets, net................... 8,996 5,855 Investments in Unconsolidated Affiliates. 1,396 1,201 Other Assets............................. 588 533 ------- ------- Total Assets........................ $22,660 $20,101 ======= ======= LIABILITIES AND SHAREHOLDERS' EQUITY Current Liabilities Short-term borrowings.................... $ 3,921 $ - Accounts payable and other current liabilities ............................ 3,870 3,617 Income taxes payable..................... 123 640 ------- ------- Total Current Liabilities............ 7,914 4,257 Long-Term Debt........................... 4,028 4,946 Other Liabilities........................ 2,314 2,265 Deferred Income Taxes.................... 2,003 1,697 Shareholders' Equity Capital stock, par value 1 2/3(cent) per share: authorized 3,600 shares, issued 1,726 shares 29 29 Capital in excess of par value........... 1,166 1,314 Retained earnings........................ 12,800 11,567 Accumulated other comprehensive loss..... (1,059) (988) -------- ------- 12,936 11,922 Less: Treasury stock, at cost: 255 shares and 224 shares in 1998 and 1997, respectively..................... (6,535) (4,986) ------- ------- Total Shareholders' Equity........... 6,401 6,936 ------- ------- Total Liabilities and Shareholders' Equity............... $22,660 $20,101 ======= ======= ----------------------------------------------------------------------- See accompanying Notes to Consolidated Financial Statements.

Coke versus Pepsi page 20 Appendix C: Template for Consolidation of Coca-Cola and its Bottling Companies in 1998
Account Parent Coca-Cola Enterprises Coca-Cola Amatil Ltd. Other Equity Investmts Adjustment* Consolidated
Current assets 6,380 2,285
Noncurrent assets 12,765 18,847
Total assets 19,145 21,132
Current liab. 8,640 3,397
Noncurrent liab. 2,102 15,297
Total liabilities 10,742 18,694
Shareholders' equity 8,403 2,438 8,403
Noncontrolling Interest**
Total 19,145 21,132
Other information and Notes:
Parent's investment
Noncontrolling Interest
*Hints: CCE column has been filled in for you, as has consolidated SE. Consolidated SE should be the same before and after consolidation. "Plug" for noncontrolling interest and we will discuss how it can be derived. Noncurrent assets, noncontrolling interest, and shareholders' equity require adjustment.
**This is equivalent to 'minority interest' in a typical consolidation, but since Coke does not have a majority interest in these companies, noncontrolling interest may be a better term.