coherent groups and pmu
TRANSCRIPT

1
Abstract—In this paper graph theory is used to identify
coherent groups of generators and to locate PMUs for Inter-Area
monitoring. Initially, the problem of identifying coherent groups
is presented as a graphical problem. Then, three graph clustering
methods are implemented to group coherent generators. Finally,
when the electric network is separated in coherent regions, a
placement of PMU based on centrality criteria is proposed. This
can be used as a first stage in the implementation of a plan of
monitoring in a large electric power system. Dynamic simulations
and phasorial representation of simulations are done with the
reduced order equivalent of the interconnected New England
system (NETS) and New York power system (NYPS). The results
show that graph theory can be applied to identify coherent
groups and to locate PMUs to Inter-area monitoring.
Index Terms-- Coherency recognition, graph partitioning,
graph theory, inter-area monitoring, observability, Phasor
Measurement Unit (PMU), PMU placement.
I. INTRODUCTION
NTER-AREA mode oscillations consist of a swinging
group of generators against another group of generators.
The characteristics of these oscillations are complex and differ
significantly from those of local mode oscillations [1]. Even in
a system, where the voltage phasor may be available at each
node in real-time, monitoring the dynamic state is only the
first step for understanding dynamic stability properties of the
complex power system. For instance, in the context of angle
stability, we need to know whether or not a generator or group
of generators can potentially become unstable based on
interactions with other components in the system [2]. Also,
dividing system in coherent areas, have several advantages
[3]: 1) improvement of security margins with coherency-based
controllers; 2) simplification of control methodologies when
decentralized procedures are implemented; 3) greater
effectiveness of corrective control actions based on dynamic
islanding procedures; 4) reduction of required measurements
when adopting phasor measurement units (PMUs) for each
coherent area. Consequently, it is not necessary to place a
PMU at all nodes belonging to a coherent group.
Oscar Gómez is with School of Engineering, Universidad de Los Andes,
Bogotá, Colombia and School of Electrical Technology, Universidad
Tecnológica de Pereira, Pereira, Colombia (e-mails:
[email protected], [email protected]).
Mario A. Rios is with School of Engineering, Universidad de Los Andes,
Bogotá, Colombia (e-mail: [email protected]).
Several clustering algorithms have been used to identify
coherent groups of generators in power systems. In [4], a
method that consists of a time-domain based coherency
measure and a fuzzy clustering algorithm is presented. Since
the system dynamic behaviors are characterized by time-
domain responses, a coherency measure, which is derived
from the after-disturbance swing curves of generators, was
proposed to evaluate the coherency behaviors among
generators. The method is based on fuzzy c-means (FCM)
cluster analysis, using the coherency measures as a basis for
classification, and aims to group generators at different
prescribed number of coherent groups. As seen, a prescribed
number of coherent groups is necessary. In [5], the angular
speed deviations of synchronous generators have been used as
a criterion to perform the groups; a coherency quality index
and a tolerance to identify coherent groups is defined to reach
this purpose. [6] presents a technique to identify the coherent
groups of generators using fuzzy c-means clustering
algorithm. A recent time domain coherency identification
method introduced in the literature is the Principal Component
Analysis (PCA). The method transforms the system response,
e.g. generator angle variation, following a disturbance to
uncorrelated variables. In [7], PCA is supplemented by a
hierarchical clustering technique to accurately identify
coherent groups of generators in the system. Spatial distances
in a multi-dimensional space between transformed data are
used to construct a proximity measure describing the
coherency relationship between all generators.
Many real-world situations can be described by means of a
diagram consisting of a set of point together with lines joining
these points. Electrical power systems are an example of these
situations. These are composed of nodes that are linked by
mean of lines and can be represented graphically. This
representation allows the decomposition of the network into
several areas which main characteristic is that the elements in
the same area are strongly coupled, whereas elements in
different areas are weakly coupled. To the best of the authors'
knowledge there are few papers that use graph theory to
identify coherent generators. In [8], graph theory is used to
determine the boundary of each island when identification of
generator groups based on the slow coherency criterion has
been done. The proposed graph theoretic approach includes
two parts: a graph simplification method based on the
characteristic of the graph formed from a power system to
Identification of Coherent Groups and PMU
placement for Inter-Area monitoring Based on
Graph Theory Mario A. Rios, Member, IEEE, and Oscar Gómez
I
2
reduce the computational burden and a multi-level graph
partitioning method to solve the graph partitioning problem.
[9] presents the identification of the dynamic equivalent of a
power system from on-line measurements by using knowledge
of coherent generators to determine the model structure. By
using the interpretation of coherency from the graph model of
a power system, the coherent generators can be identified
without the necessity of dynamic parameters.
This paper shows how to model the electrical power system
with an equivalent graph for coherence identification. Then,
techniques from graph theory are applied to identify coherent
generators without carry out a transient stability study. They
are named “inherent coherent groups”. Finally, when coherent
groups have been identified, graph theory is again used to
locate a PMU in each area for supervising inter-area stability
problems. A case study involving the application of the
algorithms is carried out. The results from the case study are
discussed and future work is provided
II. GRAPH MODELING
Converting the generation system into an equivalent graph
with vertices and edges could give a clear view of the mutual
influence between a network structure and a dynamic
behavior, especially the coherency phenomenon. This
representation could indicate how many equivalent generators
should there be and how they are interconnected.
The graph model built here is based on methodology
presented in [10] where coherency is determined by using the
synchronizing power between a generator i and a node k given
by: ' cos( )ik i k ik ikH E V B (1)
Where E’ is the generator transient emf (electromotive
force), Vk is the voltage at the node of generator k, Bik is the
imaginary part of the element i, j in the transfer admittance
matrix, δik is the angular difference between nodes i and k.
The transfer admittance matrix corresponds to a reduced
equivalent network where the load are eliminated retaining
only the generator nodes and equivalent branches linking
them.
A disturbance in node k which changes the voltage angle in
a generator with inertia coefficient Mi from the initial value δk
to a value δk + Δδk, causes the rotor acceleration,
iki k
i
H
M (2)
According to [10], generators i and j are
electromechanically exactly coherent generators if their rotor
accelerations γi and γj caused by the disturbance are the same,
i.e.
jkik
i j
HH
M M (3)
As it can be seen coherency depends not only of the
electrical distances between generators but also on generator
inertia constants. This definition permits to develop a
methodology for identifying coherent groups based on an
equivalent graph where edges represent how much can a
generator be affected when other generator suffer a
disturbance.
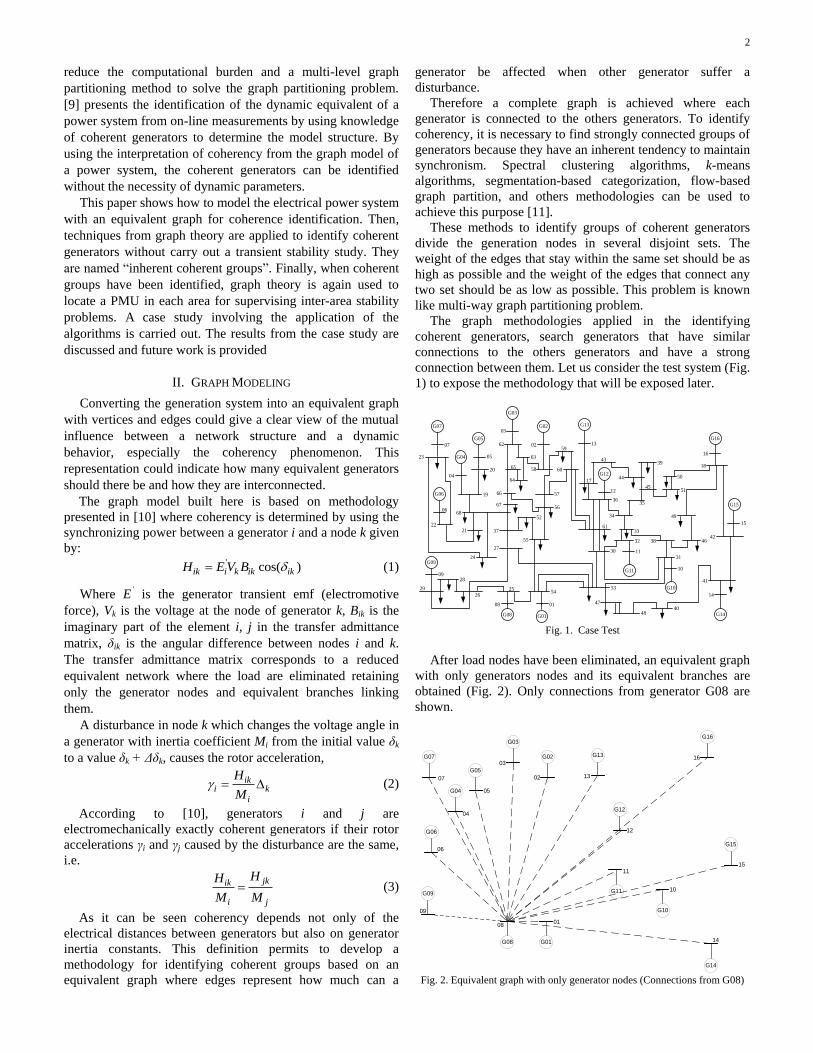
Therefore a complete graph is achieved where each
generator is connected to the others generators. To identify
coherency, it is necessary to find strongly connected groups of
generators because they have an inherent tendency to maintain
synchronism. Spectral clustering algorithms, k-means
algorithms, segmentation-based categorization, flow-based
graph partition, and others methodologies can be used to
achieve this purpose [11].
These methods to identify groups of coherent generators
divide the generation nodes in several disjoint sets. The
weight of the edges that stay within the same set should be as
high as possible and the weight of the edges that connect any
two set should be as low as possible. This problem is known
like multi-way graph partitioning problem.
The graph methodologies applied in the identifying
coherent generators, search generators that have similar
connections to the others generators and have a strong
connection between them. Let us consider the test system (Fig.
1) to expose the methodology that will be exposed later.
G07
05G04
G05
20
G06
2221
65
62
63
G03
03
64
58
G02
24G09
29
0928
26
G08 G01
G13
13
43
17
G12
12
36
61
30
53
47
4840
44
45
39
35
34
33
32
G11
1131
38
51
50
G10
10
46
49
G16
16
18
G15
15
42
G14
14
41
07
23
04
0668
19 66
67
57
56
52
55
54
27
37
25
08 01
0259
60
Fig. 1. Case Test
After load nodes have been eliminated, an equivalent graph
with only generators nodes and its equivalent branches are
obtained (Fig. 2). Only connections from generator G08 are
shown.
G07
07
05G04
04
G05
G06
06
G03
03G02
02
G09
09
G08
08
G01
01
G13
13
G12
12
G11
11
G10
10
G16
16
G15
15
G14
14
Fig. 2. Equivalent graph with only generator nodes (Connections from G08)
3
The graph G has a set of elements V called vertexes and a
set of elements E called edges. Each vertex represents a
generator of the system and they do not have weight. Each
edge represents how the connection is between two
generators. Particularly, it is a complete graph because every
pair of distinct vertexes is adjacent. According to (3) the
connection from generator i to generator k is ik
i
H
M and
connection from generator k to generator i is ki
k
H
M, so to
obtain a undirected graph, the edge between two generators is
defined by:
min ,ik ki
i k
H H
M M
(4)
III. COHERENCY IN TERM OF THE GRAPH MODEL
Two generators are said to be coherent if they tend to
swing together. Coherency among a group of generators
implies coherency between each pair of generators in the
group. Further, coherency of generators is not dependent on
the magnitude of disturbance. In general, the process of
partitioning a given graph consists of finding a group of edges
which when removed will split the original graph into desired
numbers of connected sub-graphs.
The groups of coherent generators can be identified by
analyzing for the particular structure of the graph, in which
the groups of coherent generators have the strong connections
between generators within their group and have the weak
connections among generators of other groups. Some
algorithms for graph partitioning are used as follow.
A. Recursive Spectral Bisection
The spectrum of a graph is the set of eigenvalues associated
with the matrices that represent the graph. A graph with n
vertices has n eigenvalues. Specifically, the spectra from the
different matrices contain information about the graph
connectivity, sizing, and degree of the nodes [12],[13].
The procedure to split a graph is carried out by the matrix
spectral analysis of the Laplacian matrix which provides
structural information about the graph. Initially the adjacency
matrix A is calculated and the degree matrix D to obtain the
Laplacian matrix; thus:
min , , ,( , )
0,
ik ki
i k
H Hif i k E
A i k M M
otherwise
(5)
deg 1, ,deg 2G GD diag (6)
Where degG N is the number of edges incident to the vertex N.
The Laplacian matrix of a graph G is defined as:
L D A (7)
Although, it is also possible to use the normalized
Laplacian matrix defined as:
1 1
2 2L I D A D
(8)
The eigenvalues of L will always be enumerated in the
increasing order λ1 ≤ λ2 ≤, … , ≤ λn repeated according to their
multiplicity.
The properties of the second eigenvalue and the
corresponding eigenvector ν2 of the Laplacian matrix reveal
connectivity properties of a graph. The eigen pair (,ν2) was
called the Algebraic Connectivity and the Characteristic
Valuation of G [14], [15]. The components of the second
eigenvector are assigned to the vertices of G; so that each
node of the graph is associated to a value of the second
eigenvector of the Laplacian matrix (that is, the node k is
associated to the kth component of the second eigenvector).
Positive and negative values of the second eigenvector
components, which are associated with each node, give the
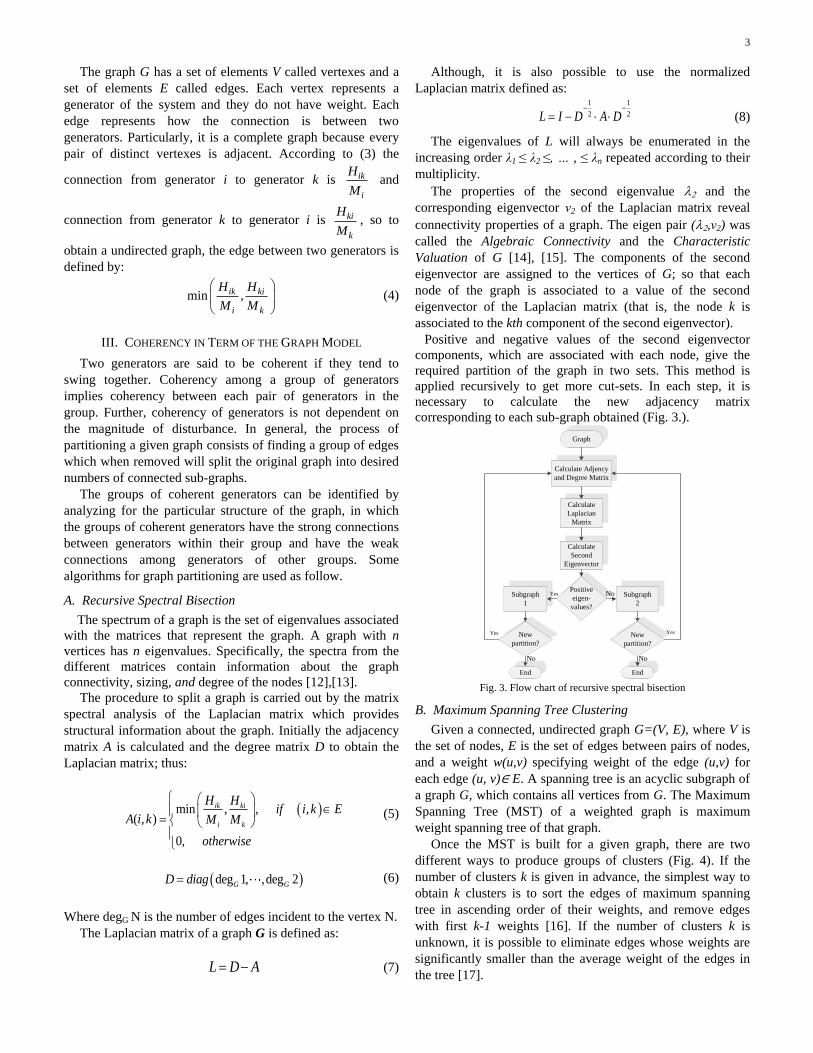
required partition of the graph in two sets. This method is
applied recursively to get more cut-sets. In each step, it is
necessary to calculate the new adjacency matrix
corresponding to each sub-graph obtained (Fig. 3.).
Calculate Adjency
and Degree Matrix
Calculate
Laplacian
Matrix
Calculate
Second
Eigenvector
Positive
eigen-
values?
Subgraph
2
NoSubgraph
1
New
partition?
End End
Graph
New
partition?
Yes
No No
Yes
Yes
Fig. 3. Flow chart of recursive spectral bisection
B. Maximum Spanning Tree Clustering
Given a connected, undirected graph G=(V, E), where V is
the set of nodes, E is the set of edges between pairs of nodes,
and a weight w(u,v) specifying weight of the edge (u,v) for
each edge (u, v)∈ E. A spanning tree is an acyclic subgraph of
a graph G, which contains all vertices from G. The Maximum
Spanning Tree (MST) of a weighted graph is maximum
weight spanning tree of that graph.
Once the MST is built for a given graph, there are two
different ways to produce groups of clusters (Fig. 4). If the
number of clusters k is given in advance, the simplest way to
obtain k clusters is to sort the edges of maximum spanning
tree in ascending order of their weights, and remove edges
with first k-1 weights [16]. If the number of clusters k is
unknown, it is possible to eliminate edges whose weights are
significantly smaller than the average weight of the edges in
the tree [17].
4
Build Maximum
Spanning tree
No
Graph
Yes Predefined
clusters?Define k
Calculate
average
weight
Sort edges iIn
ascending order
Remove edges with
first k-1 weight
Eliminate edges whose
weights are smaller
than the average weight
End
End
Fig. 4. Flow chart of recursive spectral bisection
Prim's algorithm can be used to find the maximum
spanning tree for the connected weighted undirected graph. It
finds a subset of the edges that forms a tree that includes every
vertex, where the total weight of all the edges in the tree is
maximized.
C. Minimum Cut Tree Clustering
Methodology is based on maximum flow techniques, in
particular minimum cut trees. The main idea behind maximum
flow (or equivalently, minimum cut) clustering techniques, is
to create clusters that have small inter-cluster cuts and
relatively large intra-cluster cuts [19].
Every graph has a weighted graph, which is named the
minimum cut tree (or simply, min-cut tree). The min-cut tree
has the property that it is possible to find the minimum cut
between two nodes by inspecting the path that connects the
nodes. The edge of minimum capacity on that path
corresponds to the minimum cut. The capacity of the edge is
equal to the minimum cut value, and its removal yields two
sets of nodes.
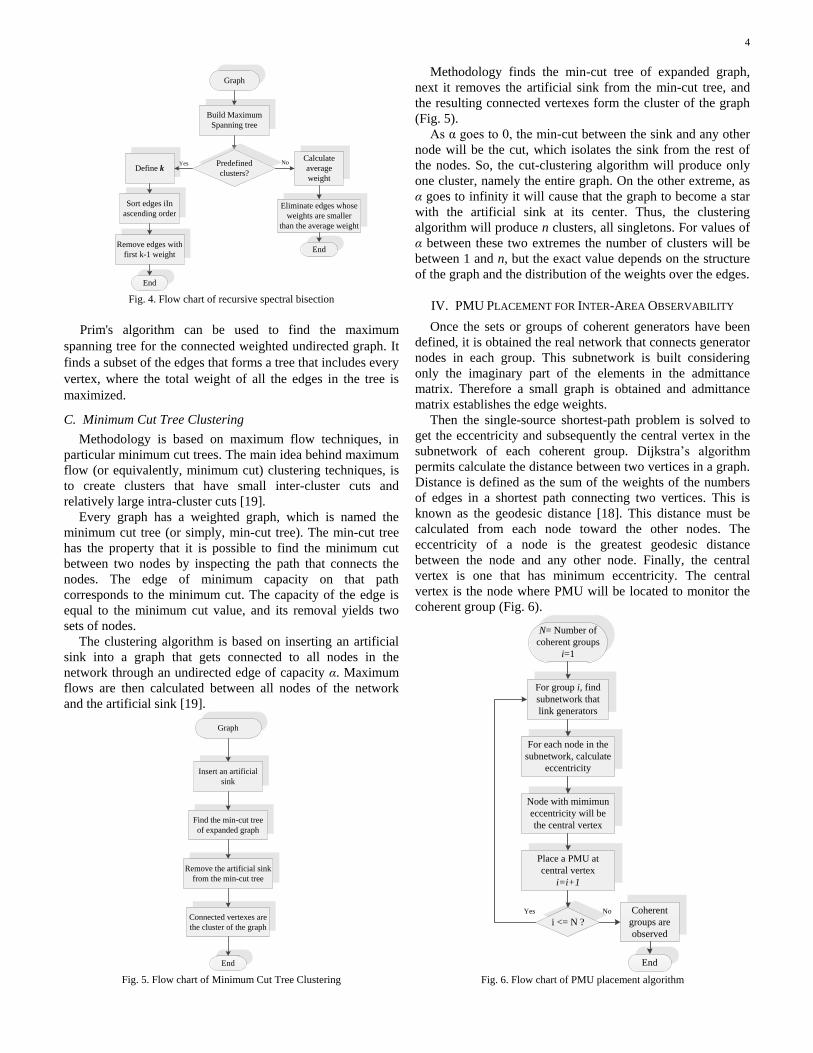
The clustering algorithm is based on inserting an artificial
sink into a graph that gets connected to all nodes in the
network through an undirected edge of capacity α. Maximum
flows are then calculated between all nodes of the network
and the artificial sink [19].
Insert an artificial
sink
Graph
End
Find the min-cut tree
of expanded graph
Remove the artificial sink
from the min-cut tree
Connected vertexes are
the cluster of the graph
Fig. 5. Flow chart of Minimum Cut Tree Clustering
Methodology finds the min-cut tree of expanded graph,
next it removes the artificial sink from the min-cut tree, and
the resulting connected vertexes form the cluster of the graph
(Fig. 5).
As α goes to 0, the min-cut between the sink and any other
node will be the cut, which isolates the sink from the rest of
the nodes. So, the cut-clustering algorithm will produce only
one cluster, namely the entire graph. On the other extreme, as
α goes to infinity it will cause that the graph to become a star
with the artificial sink at its center. Thus, the clustering
algorithm will produce n clusters, all singletons. For values of
α between these two extremes the number of clusters will be
between 1 and n, but the exact value depends on the structure
of the graph and the distribution of the weights over the edges.
IV. PMU PLACEMENT FOR INTER-AREA OBSERVABILITY
Once the sets or groups of coherent generators have been
defined, it is obtained the real network that connects generator
nodes in each group. This subnetwork is built considering
only the imaginary part of the elements in the admittance
matrix. Therefore a small graph is obtained and admittance
matrix establishes the edge weights.
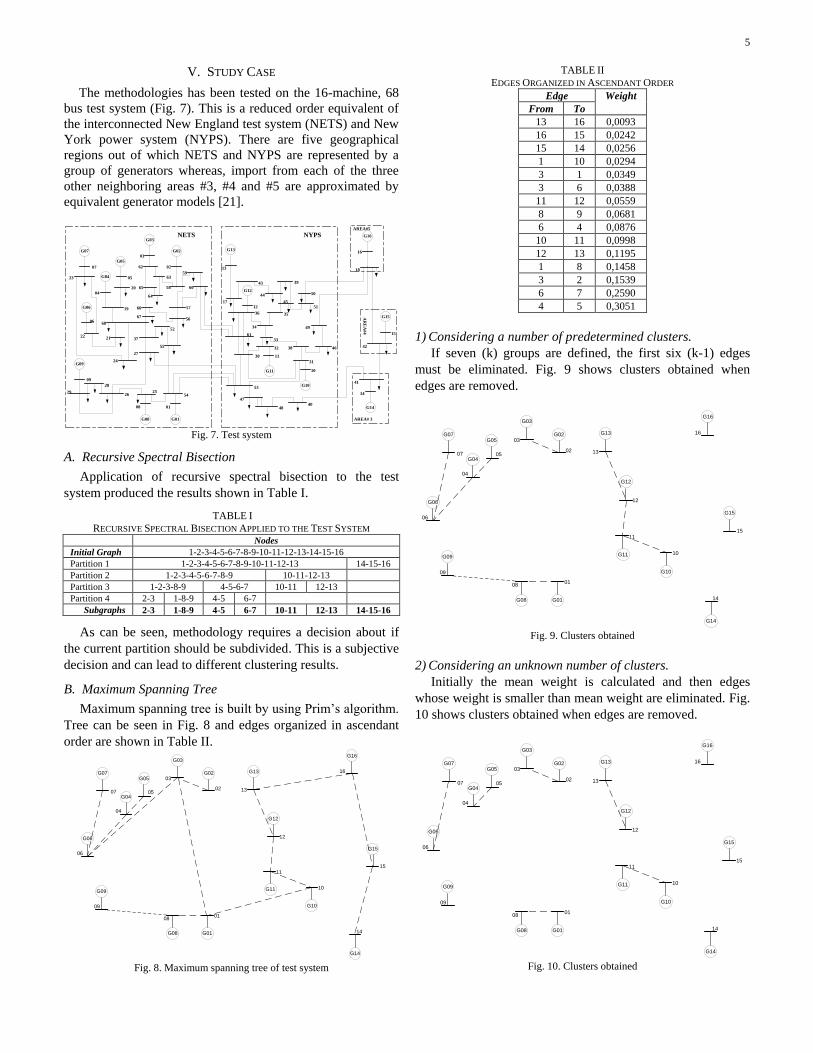
Then the single-source shortest-path problem is solved to
get the eccentricity and subsequently the central vertex in the
subnetwork of each coherent group. Dijkstra’s algorithm
permits calculate the distance between two vertices in a graph.
Distance is defined as the sum of the weights of the numbers
of edges in a shortest path connecting two vertices. This is
known as the geodesic distance [18]. This distance must be
calculated from each node toward the other nodes. The
eccentricity of a node is the greatest geodesic distance
between the node and any other node. Finally, the central
vertex is one that has minimum eccentricity. The central
vertex is the node where PMU will be located to monitor the
coherent group (Fig. 6).
For group i, find
subnetwork that
link generators
No
N= Number of
coherent groups
i=1
Yes
i <= N ?
Coherent
groups are
observed
End
For each node in the
subnetwork, calculate
eccentricity
Node with mimimun
eccentricity will be
the central vertex
Place a PMU at
central vertex
i=i+1
Fig. 6. Flow chart of PMU placement algorithm
5
V. STUDY CASE
The methodologies has been tested on the 16-machine, 68
bus test system (Fig. 7). This is a reduced order equivalent of
the interconnected New England test system (NETS) and New
York power system (NYPS). There are five geographical
regions out of which NETS and NYPS are represented by a
group of generators whereas, import from each of the three
other neighboring areas #3, #4 and #5 are approximated by
equivalent generator models [21].
G07
07
23 05G04
04
G05
19
20
G06
06
22
68
21
65
62
63
G03
03
64
66
67
58
G02
02
60
59
57
56
52
37
27
24G09
29
09
28
2625
G08
08
54
G01
01
55
G13
13
43
17
G12
12
36
61
30
53
47
4840
44
45
39
35
34
33
32
G11
11
31
38
51
50
G10
10
46
49
G16
16
18
G15
15
42
G14
14
41
NETS NYPSAREA#5
AR
EA
#4
AREA# 3
Fig. 7. Test system
A. Recursive Spectral Bisection
Application of recursive spectral bisection to the test
system produced the results shown in Table I.
TABLE I
RECURSIVE SPECTRAL BISECTION APPLIED TO THE TEST SYSTEM Nodes
Initial Graph 1-2-3-4-5-6-7-8-9-10-11-12-13-14-15-16
Partition 1 1-2-3-4-5-6-7-8-9-10-11-12-13 14-15-16
Partition 2 1-2-3-4-5-6-7-8-9 10-11-12-13
Partition 3 1-2-3-8-9 4-5-6-7 10-11 12-13
Partition 4 2-3 1-8-9 4-5 6-7
Subgraphs 2-3 1-8-9 4-5 6-7 10-11 12-13 14-15-16
As can be seen, methodology requires a decision about if
the current partition should be subdivided. This is a subjective
decision and can lead to different clustering results.
B. Maximum Spanning Tree
Maximum spanning tree is built by using Prim’s algorithm.
Tree can be seen in Fig. 8 and edges organized in ascendant
order are shown in Table II.
G07
07 05G04
04
G05
G06
06
G03
03G02
02
G09
09
G08
08
G01
01
G13
13
G12
12
G11
11
G10
10
G16
16
G15
15
G14
14
Fig. 8. Maximum spanning tree of test system
TABLE II
EDGES ORGANIZED IN ASCENDANT ORDER
Edge Weight
From To
13 16 0,0093
16 15 0,0242
15 14 0,0256
1 10 0,0294
3 1 0,0349
3 6 0,0388
11 12 0,0559
8 9 0,0681
6 4 0,0876
10 11 0,0998
12 13 0,1195
1 8 0,1458
3 2 0,1539
6 7 0,2590
4 5 0,3051
1) Considering a number of predetermined clusters.
If seven (k) groups are defined, the first six (k-1) edges
must be eliminated. Fig. 9 shows clusters obtained when
edges are removed.
G07
07 05G04
04
G05
G06
06
G03
03G02
02
G09
09
G08
08
G01
01
G13
13
G12
12
G11
11
G10
10
G16
16
G15
15
G14
14
Fig. 9. Clusters obtained
2) Considering an unknown number of clusters.
Initially the mean weight is calculated and then edges
whose weight is smaller than mean weight are eliminated. Fig.
10 shows clusters obtained when edges are removed.
G07
07 05G04
04
G05
G06
06
G03
03G02
02
G09
09
G08
08
G01
01
G13
13
G12
12
G11
11
G10
10
G16
16
G15
15
G14
14
Fig. 10. Clusters obtained

6
C. Minimum Cut Tree Clustering
To build the min-cut tree an artificial node connected to all
nodes in the network through an edge of weight 0.13 was
used. Min-cut tree (Fig. 11) was obtained by using Gomory
and Hu algorithm [20].
G07
07 05G04
04
G05
G03
03G02
02
G09
09
G08
08
G01
01
G13
13
12
G11
11
G10
10
G16
16
G15
15
G14
14
17
G12
G06
Fig. 11. Min-cut tree with the artificial node
When artificial node is retired from the graph, connected
nodes form the clusters of graph (Fig. 12).
G07
07 05G04
04
G05
06
G03
03G02
02
G09
09
G08
08
G01
01
G13
13
12
G11
11
G10
10
G16
16
G15
15
G14
14
G12
G06
Fig. 12. Clusters obtained
D. PMU Placement for Inter-Area Observability
If generators G01, G08, and G09 from Fig. 7 are a coherent
group, the network that connects generators is as Fig. 13
shows.
G09
29
09
26 25
G08
08
54
G01
01
PMU
Fig. 13. Subnetwork for generators G01, G08, and G09 and installed PMU
For the subnetwork shown in Fig. 13, node 25 is the central
vertex, so a PMU will be placed there to monitor the coherent
group.
In Fig. 14, it is possible to visualize phasors of coherent
group and monitored phasor for an operating point. Fig 14
shows graphically 7 phasors which it is possible to see 6; one
of them is under the bold line which represents the PMU
placed at node 25 to monitor the coherent group. Three
phasors are above bold line and others three phasors are below
the bold line. The nodes are respectively labeled in the figure.
Fig. 14. Phasor measurements of the coherent group
It should be noted that the central vertex voltage is located
between coherent group voltages; hence, voltage group can be
monitored by checking the central vertex voltage which
represent the group behavior.
E. Dynamic simulation
By using methodology presented in section IV, PMUs
were located at nodes 25, 22, 19, 63, 17, 30 and 41 to
monitor groups defined at Table I. A three-phase-to-ground
fault was created at 0.16 seconds into the simulation at bus
22 and the fault is cleared after 100 ms, followed by
opening line connecting buses 21 and 22.
Fig. 15 shows the dynamic behavior of the groups by
mean of phasors graphed in t=0 s, t=0.99 s and t=1.5 s.
Fig. 15. Phasor measurements of the coherent groups
The movement of the phasor located at node 22 (marked
with an asterisk) illustrates the angular separation of area of
generators 6 and 7 from rest of areas and the decrease in
voltage magnitude due to fault.

7
VI. CONCLUSIONS
In this paper graph theory was used to identify coherent
groups of generators and to locate PMUs for Inter-Area
monitoring. The problem of identifying coherent groups
was presented as a graphical problem and three graph
clustering methods were implemented to group coherent
generators. A placement of PMU based on centrality criteria
was proposed and dynamic simulations with a phasorial
representation of simulations were done in a test system.
The results showed that graph theory can be applied to
identify coherent groups without perform transient stability
studies which require large amounts of computational effort
in terms of time and memory. Although, some of them
require of subjective decisions to coherency identification,
they provide flexibility to choose the number of coherent
groups according to different needs and applications.
Recursive spectral bisection identifies groups with
similar characteristics according its connections. It uses
information of the entire graph and detects generators
strongly connected. However it require of external
decisions to define the number of groups.
Maximum spanning tree identifies generators that can be
isolated of the system, i.e. generators that represent external
equivalent systems. However it is not appropriated to find
groups with similar characteristics.
Minimum cut tree clustering, based on expanded graphs,
provide a means for finding good coherent groups. By
using the parameter α, it is possible to control the amount of
groups that can be built without to define exactly the groups
desired. It means the groups are a natural result of the
algorithm.
Concepts of graph theory were applied to get the
eccentricity and subsequently the central vertex of each
coherent group. It permit locate PMUs in each area to Inter-
area monitoring without calculate centers of inertia which
usually obtain an equivalent node that physically do not
exist in the system.
VII. REFERENCES
[1] P. Kundur, Power System Stability and Control, New York: McGraw-
Hill, 1994, p. 1176.
[2] V. Venkatasubramanian, M. Sherwood, V. Ajjarapu, B. Leonardi, “Real-
Time Security Assessment of Angle Stability and Voltage Stability
Using Synchrophasors”, Final Project Report, PSERC Document 10-10,
May 2010.
[3] E. De Tuglie, S. M. Iannone, F. Torelli, “A Coherency Recognition
Based on Structural Decomposition Procedure”, IEEE Transactions on
Power Systems, vol. 23, no. 2, pp. 555-563, May 2008.
[4] Shu-Chen Wang, Pei-Hwa Huang, "Fuzzy c-means clustering for power
system coherency," in Proc. IEEE International Conference on Systems,
Man and Cybernetics 2005, vol. 3, pp. 2850- 2855, October 10-12, 2005.
[5] L. Mariotto, H. Pinheiro, G. Cardoso, A.P. Morais, M.R. Muraro,
“Power systems transient stability indices: an algorithm based on
equivalent clusters of coherent generators”, IET Generation
Transmission Distribution, vol. 4, Iss. 11, pp. 1223–1235. 2010.
[6] Mahdi M. M. El-arini, Ahmed Fathy. “Identification of Coherent Groups
of Generators Based on Fuzzy Algorithm”, in Proc. 14th International
Middle East Power Systems Conference (MEPCON’10), Cairo
University, Egypt, December 19-21, 2010.
[7] M. Abdulaziz, Almutairi, Soon Kiat Yee, J.V. Milanović, “Identification
of Coherent Generators Using PCA and Cluster Analysis” presented at
16th Power Systems Computation Conference (PSCC2008), Glasgow,
Scotland, July 14-18, 2008.
[8] Bo Yang, Vittal, V., Heydt, G.T., Sen, A., "A Novel Slow Coherency
Based Graph Theoretic Islanding Strategy," in Proc. IEEE Power
Engineering Society General Meeting, 2007, pp.1-7, June 24-28, 2007.
[9] Singhavilai, T., Anaya-Lara, O., Lo K.L., "Identification of the dynamic
equivalent of a power system", in Proc. 44th International Universities
Power Engineering Conference (UPEC), 2009. pp. 1-5, September 1-4,
2009.
[10] J. Machowskim, J. W. Bialek, J. R. Bumby, Power System Dynamics:
Stability and Control, John Wiley & Sons, Ltd., 2008.
[11] C. C. Aggarwal, H.Wang, Managing and Mining Graph Data, Advances
in Database Systems 40, Springer Science+Business Media, LLC 2010.
[12] A. Pothen, H.D. Simon, K. Liou, “Partiotioning Sparse Matrices with
Eigenvectors of Graphs”, SIAM Journal on Matrix Analysis and
Applications, vol. 11, pp. 430-452, July, 1990.
[13] Moreno, R., Rios, M.A, Torres, A., “Security schemes of power systems
against blackouts”, in Proc. Bulk Power System Dynamics and Control
(iREP), VIII (iREP), 2010, pp. 1-6, 2010.
[14] M. Fiedler, “Algebraic Connectivity of Graphs”, Czechoslovak
Mathematical Journal. vol. 23, no. 98, pp. 298–305, 1973.
[15] M. Fiedler, “A Property of Eigenvectors of Nonnegative Symmetric
Matrices and its Application to Graph Theory”, Czechoslovak
Mathematical Journal. vol. 25, no. 4, pp. 619–633, 1973.
[16] S.P.Victor, S.John Peter, “A Novel Minimum Spanning Tree Based
Clustering Algorithm for Image Mining”, European Journal of Scientific
Research, vol. 40, no.4, pp.540-546, 2010.
[17] S. John Peter, “Minimum Spanning Tree-based Structural Similarity
Clustering for Image Mining with Local Region Outliers”, International
Journal of Computer Applications vol. 8, no.6, October, 2010.
[18] Asgharbeygi N., Maleki A., “Geodesic K-means Clustering”, presented
at the International Conference on Pattern Recognition, ICPR 2008,
Tampa, Florida, USA, December 8-11, 2008.
[19] Gary William Flake, Robert E. Tarjan, Kostas Tsioutsiouliklis, “Graph
Clustering and Minimum Cut Trees” Internet Mathematics, vol. 1, no. 4,
pp. 385-408, 2003.
[20] R. E. Gomory, T. Hu, “Multi-terminal network flows” Journal of the
Society for Industrial and Applied Mathematics, vol. 9, no. 4, pp. 551–
570, December, 1961.
[21] B. Pal, B. Chaudhuri, Robust Control in Power Systems, Springer
Science+Business Media, Inc., 2005.
VIII. BIOGRAPHIES
Oscar Gómez was born in Pereira, Colombia, on
April 4, 1979. He obtained his BScEE and MScEE
from Universidad Tecnológica de Pereira, Pereira, in
2003 and 2005, respectively. Currently, he is
Assistant Professor at the Department of Electrical
Technology at Universidad Tecnológica de Pereira
and he is pursuing the Ph.D. degree at the
Universidad de Los Andes, Bogotá. (e-mail:
Mario A. Ríos (M’89) received a degree in
electrical engineering in 1991 and an M.Sc. degree
in electrical engineering in 1992, both from
Universidad de los Andes, Bogotá, Colombia. He
received a Ph.D. degree in electrical engineering
from INPG-LEG, France, in 1998, and a Doctoral
degree in engineering from Universidad de los
Andes, in 1998. Currently, he is Associate Professor
at the Department of Electrical Engineering at
School of Engineering, Universidad de Los Andes,
Bogotá. (e-mail: [email protected]).