codes and standards enhancement initiative … · 21/7/2014 · 2.1.3 existing standards ... 84...
TRANSCRIPT
CODE
DrafCon
Measur
Residen
2016 C
Califor
Prepar
This report wutility custom
Copyright 20Company, Lo
All rights rese
Neither PG&liability or rein this documcopyrights.
ES AND S
ft Repditionre Number:
ntial Envelo
CALIFORN
rnia Utilities
red by: Julia
Cathy
was prepared by thmers under the ausp
014 Pacific Gas anos Angeles Departm
erved, except that
&E, SCE, SDG&Eesponsibility for thment; or represen
STANDA
port – ned Sp
2016-RES-E
ope
NIA BUILD
Statewide C
nna Wei (TR
y Chappell, A
he California Statepices of the Califo
nd Electric Compament of Water and
this document ma
E, SoCalGas, LADhe accuracy, compts that its use will
ARDS EN
Residpace / H
ENV1-D
DING ENE
Codes and St
RC Energy S
Abhijeet Pan
ewide Codes and Srnia Public Utilitie
any, Southern Cald Power.
ay be used, copied,
DWP nor any of ipleteness or useful not infringe any
NHANCE
dentialHigh P
ERGY EF
tandards Tea
Services)
nde, Matthew
Standards Enhancees Commission.
ifornia Edison, So
, and distributed w
its employees makulness of any datay privately-owned
EMENT I
l DuctPerfor
FFICIENC
am
w Christie (T
ement (CASE) Pro
outhern California
without modificatio
kes any warranty,a, information, me
rights including,
NITIATI
s in rmanc
Y STAND
TRC Energy
ogram that is fund
a Gas Company, S
on.
, express of implieethod, product, po but not limited to
VE (CAS
ce Atti
DARDS
July14,
Services)
ded, in part, by Ca
San Diego Gas &
ed; or assumes anolicy or process do, patents, tradem
SE)
ics
2014
alifornia
Electric
ny legal disclosed marks or
2016 CASE Report – 2016-RES-ENV1-D Page i
TABLE OF CONTENTS
Table of Contents ...................................................................................................... i
Executive Summary ................................................................................................ ix
1. Introduction ........................................................................................................ 1
2. Measure Description .......................................................................................... 3
2.1 Measure Overview ...........................................................................................................3
2.1.1 Measure Description ...................................................................................................... 3
2.1.2 Measure History ............................................................................................................. 3
2.1.3 Existing Standards .......................................................................................................... 5
2.1.4 Alignment with Zero Net Energy Goals ........................................................................ 6
2.1.5 Relationship to Other Title 24 Measures ....................................................................... 8
2.2 Summary of Changes to Code Documents ....................................................................8
2.2.1 Catalogue of Proposed Changes .................................................................................... 8
2.2.2 Standards Change Summary ........................................................................................ 12
2.2.3 Standards Reference Appendices Change Summary ................................................... 12
2.2.4 Residential Alternative Calculation Method (ACM) Reference Manual Change Summary ...................................................................................................................... 12
2.2.5 Compliance Forms Change Summary ......................................................................... 12
2.2.6 Simulation Engine Adaptations ................................................................................... 12
2.2.7 Other Areas Affected ................................................................................................... 12
2.3 Code Implementation ....................................................................................................12
2.3.1 Verifying Code Compliance ........................................................................................ 12
2.3.2 Code Implementation ................................................................................................... 13
2.3.3 Field Verification and Diagnostic Testing ................................................................... 14
2.4 Issues Addressed During CASE Development Process ..............................................14
3. Market Analysis ............................................................................................... 17
3.1 Market Structure ...........................................................................................................17
3.1.1 Ducts in Conditioned Space (DCS) ............................................................................. 17
3.1.2 High Performance Attics (HPA) .................................................................................. 21
3.2 Market Availability and Current Practices ................................................................23
3.2.1 Overview of Market Acceptance of DCS/HPA ........................................................... 23
2016 CASE Report – 2016-RES-ENV1-D Page ii
3.2.2 Multiple Options for Ducts in Conditioned Space and High Performance Attics ....... 27
3.2.3 Need for Additional Training and Industry Support .................................................... 27
3.3 Useful Life, Persistence, and Maintenance ..................................................................28
3.4 Market Impacts and Economic Assessments ..............................................................28
3.4.1 Impact on Builders ....................................................................................................... 28
3.4.2 Impact on Building Designers ...................................................................................... 28
3.4.3 Impact on Occupational Safety and Health .................................................................. 29
3.4.4 Impact on Building Owners and Occupants ................................................................ 29
3.4.5 Impact on Retailers (including manufacturers and distributors) .................................. 29
3.4.6 Impact on Energy Consultants ..................................................................................... 29
3.4.7 Impact on Building Inspectors ..................................................................................... 29
3.4.8 Impact on Statewide Employment ............................................................................... 30
3.5 Economic Impacts .........................................................................................................30
3.5.1 Creation or Elimination of Jobs ................................................................................... 31
3.5.2 Creation or Elimination of Businesses within California ............................................ 31
3.5.3 Competitive Advantages or Disadvantages for Businesses within California ............. 32
3.5.4 Increase or Decrease of Investments in the State of California ................................... 32
3.5.5 Incentives for Innovation in Products, Materials, or Processes ................................... 32
3.5.6 Effects on the State General Fund, State Special Funds and Local Governments ....... 32
4. Methodology ..................................................................................................... 35
4.1 Existing Conditions .......................................................................................................35
4.2 Proposed Conditions .....................................................................................................35
4.3 Prototype Building(s) ....................................................................................................35
4.4 Climate Dependent ........................................................................................................36
4.5 Time Dependent Valuation ...........................................................................................36
4.6 Energy Impacts Methodology ......................................................................................37
4.6.1 Per Unit Energy Impacts Methodology ....................................................................... 37
4.6.2 Statewide Energy Impacts Methodology ..................................................................... 38
4.7 Cost-effectiveness Methodology ...................................................................................38
4.7.1 Incremental Cost Methodology .................................................................................... 38
4.7.2 Cost Savings Methodology .......................................................................................... 42
4.7.3 Cost-effectiveness Methodology .................................................................................. 42
4.8 Environmental Impacts Methodology .........................................................................43
2016 CASE Report – 2016-RES-ENV1-D Page iii
4.8.1 Greenhouse Gas Emissions Impacts Methodology ...................................................... 43
4.8.2 Material Impacts Methodology (Optional) .................................................................. 43
4.8.3 Other Impacts Methodology ........................................................................................ 43
5. Analysis and Results ........................................................................................ 44
5.1.1 Per Unit Energy Impacts Results ................................................................................. 44
5.1.2 Statewide Energy Impacts Results ............................................................................... 46
5.2 Cost-effectiveness Results .............................................................................................47
5.2.1 Incremental Cost Results ............................................................................................. 47
5.2.2 Energy Cost Savings Results ....................................................................................... 50
5.2.3 Cost-effectiveness Results ........................................................................................... 51
5.3 Environmental Impacts Results ...................................................................................52
5.3.1 Cost Savings Results .................................................................................................... 52
5.3.2 Greenhouse Gas Emissions Results ............................................................................. 52
5.3.3 Water Use and Water Quality Impacts ......................................................................... 52
5.3.4 Material Impacts Results (Optional) ............................................................................ 53
5.3.5 Other Impacts Results .................................................................................................. 53
6. Proposed Language .......................................................................................... 54
6.1 Standards ........................................................................................................................54
6.2 Reference Appendices ...................................................................................................60
6.3 ACM Reference Manual ...............................................................................................63
6.4 Compliance Manuals .....................................................................................................63
6.5 Compliance Forms .........................................................................................................63
7. References and Other Research ..................................................................... 64
8. Appendix A: Environmental Impacts Methodology .................................... 67
9. Appendix B: DCS and HPA Strategies .......................................................... 69
9.1 Ducts in Conditioned Spaces ........................................................................................69
9.1.1 Vented Attic, Dropped Ceiling .................................................................................... 69
9.1.2 Vented Attic, Conditioned plenum space..................................................................... 71
9.1.3 Vented Attic, Open Web Floor Truss .......................................................................... 72
9.1.4 Unvented attic (Sealed) ................................................................................................ 74
9.1.5 Mechanical Closet (and Placement of Sealed Combustion Furnace) .......................... 77
9.1.6 Ductless Systems .......................................................................................................... 78
2016 CASE Report – 2016-RES-ENV1-D Page iv
9.2 High Performance Attics ..............................................................................................79
9.2.1 Roof deck insulation .................................................................................................... 79
9.2.2 Increase Duct insulation to R8 in all Climate Zones.................................................... 82
9.2.3 Reduced Duct Leakage ................................................................................................ 83
9.2.4 Energy Truss (Raised Heel or Extension Truss) .......................................................... 84
9.2.5 Reduce Duct Surface Area (Duct Design Layout) ....................................................... 85
10. Appendix C: Cost Data Sources ..................................................................... 88
11. Appendix D: Simulation Results Using CBECC-Res ................................... 90
11.1 DCS Strategies ...............................................................................................................90
11.1.1 Vented Attic ................................................................................................................. 90
11.1.2 Unvented Attic ............................................................................................................. 93
11.2 HPA Individual Measures ............................................................................................96
11.2.1 Roof Deck Insulation (in addition to Ceiling Insulation)............................................. 96
11.2.2 Duct Insulation and Leakage Rate ............................................................................... 97
11.2.3 Raised Heel Trusses ................................................................................................... 99
11.2.4 Roof Reflectance and Roof Deck Insulation ................................................................ 99
11.3 HPA Measure Package ................................................................................................101
11.3.1 R-8 Above Deck Insulation + Higher Duct Insulation + Lower Leakage ................. 103
11.3.2 R-6 Above Deck Insulation + Higher Duct Insulation + Lower Leakage ................. 104
11.3.3 R-4 Above Deck Insulation + Higher Duct Insulation + Lower Leakage ................. 105
11.3.4 R-11 Below Deck Insulation + Higher Duct Insulation + Lower Leakage ............... 106
12. Appendix E: DCS and HPA Cost-Effectiveness Comparison ................... 107
13. Appendix F: Roof Covering and Roof Deck Insulation Fire Rating Requirements ........................................................................................................ 115
13.1 Roof Covering Fire Rating .........................................................................................115
13.2 Plastic Roof Deck Insulation Fire Rating ..................................................................115
13.3 Impact of Above Deck Insulation on Roof Assembly Fire Rating ..........................116
13.4 Summary of Fire Tests ................................................................................................117
13.5 Examples of ICC-ES Evaluation Reports .................................................................117
14. Appendix G: Attic Ventilation for High Performance Attics Package .... 123
15. Appendix H: Cost Methodology and Results for Other DCS and HPA Measures Investigated ......................................................................................... 126
2016 CASE Report – 2016-RES-ENV1-D Page v
15.1 Project-Level Construction Cost Results ..................................................................126
15.2 Per Unit Construction Cost Results ...........................................................................130
15.3 DCS Soft Costs .............................................................................................................133
2016 CASE Report – 2016-RES-ENV1-D Page vi
List of Tables
Table 1: Scope of Code Change Proposal....................................................................................... x
Table 2: Estimated First Year Energy Savings ............................................................................ xiv
Table 3: Cost-effectiveness Summary .......................................................................................... xv
Table 4: Estimated Statewide Greenhouse Gas Emissions Impacts ............................................ xvi
Table 5: 2013 Title 24 Part 6 Prescriptive Measures in Table 150.1-A ......................................... 5
Table 6: Steps to Achieving ZNE Designs for Individual Buildings .............................................. 7
Table 7: Scope of Code Change Proposal....................................................................................... 8
Table 8: Sections of Standards Impacted by Proposed Code Change ............................................ 9
Table 9: Appendices Impacted by Proposed Code Change .......................................................... 10
Table 10: Sections of ACM Impacted by Proposed Code Change ............................................... 11
Table 11: AHRI Database Summary for Residential Furnaces .................................................... 19
Table 12: Above-Deck Insulation Types and Manufacturers ....................................................... 20
Table 13: Below-Deck Insulation Type and Manufacturers ......................................................... 21
Table 14: Ductlass System Type and Manufacturers ................................................................... 21
Table 15: Home Builders in California with DCS Strategy Experience ...................................... 23
Table 16: Ducts in Conditioned Space Strategies in High Performance Building Programs ....... 24
Table 17: High Performance Building in California with DCS/HPA........................................... 25
Table 18. High Performance Building in the U.S. with DCS/HPA .............................................. 26
Table 19: Industries Receiving Energy Efficiency Related Investment, by North American Industry Classification System (NAICS) Code ...................................................................... 32
Table 20: Prototype Buildings used for Energy, Demand, Cost, and Environmental Impacts Analysis .................................................................................................................................. 36
Table 21: Pertinent Parameters of Prototype Buildings ................................................................ 36
Table 21: Key assumptions for per unit Energy Impacts Analysis - DCS .................................... 37
Table 22: Key assumptions for per unit Energy Impacts Analysis - HPA ................................... 38
Table 23: Ranges for Incremental Construction Cost – DCS Dropped Ceiling ........................... 40
Table 24: Key "Soft" Cost Considerations for DCS ..................................................................... 41
Table 25: Energy Impacts per Prototype Building - DCS Verified Ducts Entirely in Conditioned Space1 ..................................................................................................................................... 45
2016 CASE Report – 2016-RES-ENV1-D Page vii
Table 26: Energy Impacts per Prototype Building - HPA Package (with R-13 Below Roof Deck Insulation)1 ............................................................................................................................. 46
Table 27: Statewide Energy Impacts ............................................................................................ 47
Table 28: Incremental Construction Cost – HPA ......................................................................... 48
Table 29: Per unit Incremental Construction Cost - HPA ............................................................ 48
Table 30: Incremental Construction Cost – Verified DCS – Dropped Ceiling ............................ 49
Table 31: Key Assumptions for per unit Incremental Construction Cost – DCS: Dropped Ceiling ................................................................................................................................................ 49
Table 32: TDV Energy Cost Savings Over 30 Year Period of Analysis - Per Unit ..................... 50
Table 33: Cost-effectiveness Summary1 ....................................................................................... 51
Table 34: Statewide Greenhouse Gas Emissions Impacts ............................................................ 52
Table 35: Impacts of Water Use and Water Quality ..................................................................... 53
Table 36: Impacts of Material Use ................................................................................................ 53
Table 37: Dropped Ceiling Option for DCS in Vented Attics (adopted from Ductsinside.org) . 69
Table 38: Options for Conditioned Plenum Space (adopted from Ductsinside.org and CEC 2003c) ..................................................................................................................................... 71
Table 39: Open Web Floor Truss (adopted from Ductsinside.org and Steven Winter Associates, Inc. 2014) ............................................................................................................................... 72
Table 40: Unvented Attic (adopted from Ductsinside.org) ......................................................... 74
Table 41: Air-Impermeable Insulation Requirement by IRC Climate Zone ................................ 77
Table 42: Interior Furnace with Ducts in Conditioned Plenum Space (IBACOS 2013) .............. 77
Table 43: Whole House Ductless System (Daikin variable refrigerant flow system) .................. 78
Table 44: Above and Below Deck Insulation Comparison .......................................................... 79
Table 45: Ventilation for Asphalt Shingles (ARMA Form No. 211-RR-94 2008) ...................... 80
Table 46: Ventilation for Tile Roofing – Counter Batten (CBIA Forum) .................................... 81
Table 47: Moisture Management in Above Roof Deck Insulation (BSC) .................................... 82
Table 48: EPA Responses to ENERGY STAR 2011 Qualified New Homes Comments ............ 84
Table 49: Duct Surface Area Summary (Table 5 from DEG 2002 report) ................................... 86

2016 CASE Report – 2016-RES-ENV1-D Page viii
Document Information Category: Codes and Standards
Keywords: Statewide CASE, Statewide Codes and Standards Team, Statewide C&S Team, Codes and Standards Enhancements, Title 24, 2016, efficiency, Ducts in Conditioned Space (DCS), ducts and equipment in conditioned space, High Performance Attic (HPA), ductless systems, roof deck insulation, unvented attic.
2016 CASE Report – 2016-RES-ENV1-D Page ix
EXECUTIVE SUMMARY
Introduction The Codes and Standards Enhancement (CASE) initiative presents recommendations to support California Energy Commission’s (CEC) efforts to update California’s Building Energy Efficiency Standards (Title 24) to include new requirements or to upgrade existing requirements for various technologies. The four California Investor Owned Utilities (IOUs) – Pacific Gas and Electric Company, San Diego Gas and Electric, Southern California Edison and Southern California Gas Company – and Los Angeles Department of Water and Power (LADWP) sponsored this effort. The program goal is to prepare and submit proposals that will result in cost-effective enhancements to energy efficiency in buildings. This report and the code change proposal presented herein is a part of the effort to develop technical and cost-effectiveness information for proposed regulations on building energy efficient design practices and technologies.
The overall goal of this CASE Report is to propose a code change proposal for measure name. The report contains pertinent information that justifies the code change including:
Description of the code change proposal, the measure history, and existing standards (Section 2);
Market analysis, including a description of the market structure for specific technologies, market availability, and how the proposed standard will impact building owners and occupants, builders, and equipment manufacturers, distributers, and sellers (Section 3);
Methodology and assumption used in the analyses energy and electricity demand impacts, cost-effectiveness, and environmental impacts (Section 4);
Results of energy and electricity demand impacts analysis, Cost-effectiveness Analysis, and environmental impacts analysis (Section 5); and
Proposed code change language (Section 6).
This is a draft version of the CASE Report. The 2016 Time Dependent Valuation (TDV) values were not yet available when this draft report was being developed. The TDV energy and cost savings presented in this draft report were developed using 2013 TDV values. The TDV energy and cost savings presented in this draft report were developed using 2013 TDV values and TDV cost saving are in 2011 dollars. The Statewide Statewide CASE Team will be submitting a revised version of this report in fall 2014, which will include the final recommended code change proposal and a updated TDV energy and cost savings results that use the 2016 TDV values.
2016 CASE Report – 2016-RES-ENV1-D Page x
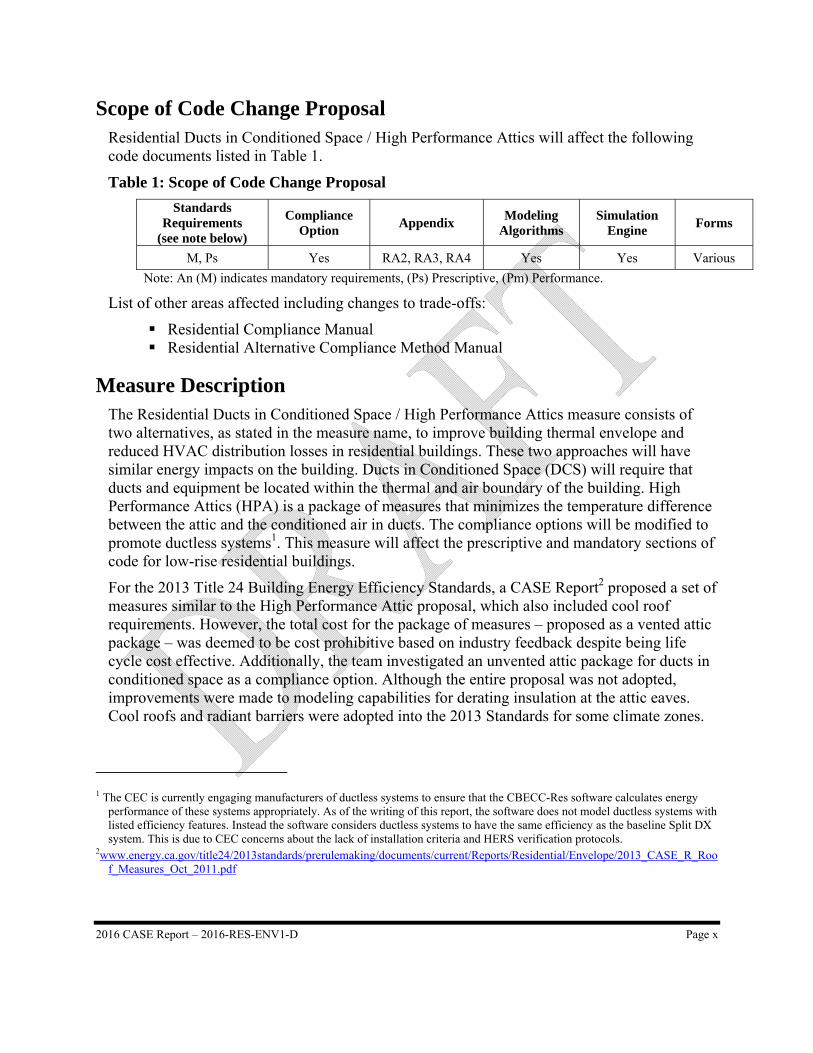
Scope of Code Change Proposal Residential Ducts in Conditioned Space / High Performance Attics will affect the following code documents listed in Table 1.
Table 1: Scope of Code Change Proposal
Standards Requirements
(see note below)
Compliance Option
Appendix Modeling
Algorithms Simulation
Engine Forms
M, Ps Yes RA2, RA3, RA4 Yes Yes Various
Note: An (M) indicates mandatory requirements, (Ps) Prescriptive, (Pm) Performance.
List of other areas affected including changes to trade-offs:
Residential Compliance Manual Residential Alternative Compliance Method Manual
Measure Description The Residential Ducts in Conditioned Space / High Performance Attics measure consists of two alternatives, as stated in the measure name, to improve building thermal envelope and reduced HVAC distribution losses in residential buildings. These two approaches will have similar energy impacts on the building. Ducts in Conditioned Space (DCS) will require that ducts and equipment be located within the thermal and air boundary of the building. High Performance Attics (HPA) is a package of measures that minimizes the temperature difference between the attic and the conditioned air in ducts. The compliance options will be modified to promote ductless systems1. This measure will affect the prescriptive and mandatory sections of code for low-rise residential buildings.
For the 2013 Title 24 Building Energy Efficiency Standards, a CASE Report2 proposed a set of measures similar to the High Performance Attic proposal, which also included cool roof requirements. However, the total cost for the package of measures – proposed as a vented attic package – was deemed to be cost prohibitive based on industry feedback despite being life cycle cost effective. Additionally, the team investigated an unvented attic package for ducts in conditioned space as a compliance option. Although the entire proposal was not adopted, improvements were made to modeling capabilities for derating insulation at the attic eaves. Cool roofs and radiant barriers were adopted into the 2013 Standards for some climate zones.
1 The CEC is currently engaging manufacturers of ductless systems to ensure that the CBECC-Res software calculates energy
performance of these systems appropriately. As of the writing of this report, the software does not model ductless systems with listed efficiency features. Instead the software considers ductless systems to have the same efficiency as the baseline Split DX system. This is due to CEC concerns about the lack of installation criteria and HERS verification protocols.
2www.energy.ca.gov/title24/2013standards/prerulemaking/documents/current/Reports/Residential/Envelope/2013_CASE_R_Roof_Measures_Oct_2011.pdf
2016 CASE Report – 2016-RES-ENV1-D Page xi
Section 2 of this report provides detailed information about the code change proposal including: Section 2.2 Summary of Changes to Code Documents (page 8) provides a section-by-section description of the proposed changes to the standards, appendices, alternative compliance manual and other documents that will be modified by the proposed code change. See the following tables for an inventory of sections of each document that will be modified:
Table 7: Scope of Code Change Proposal (page 8)
Table 8: Sections of Standards Impacted by Proposed Code Change (page 9)
Table 9: Appendices Impacted by Proposed Code Change (page 10)
Table 10: Sections of ACM Impacted by Proposed Code Change (page 11)
Detailed proposed changes to the text of the building efficiency standards, the reference appendices, and are given in Section 6 of this report. This section proposes modifications to language with additions identified with underlined text and deletions identified with struck out text.
Market Analysis and Regulatory Impact Assessment DCS and HPA strategies are not widely implemented in the California residential market which is dominated by ducts on top of the ceiling insulation in cold and/or hot attics. But the numbers are increasing in the high performance homes market due to tighter energy budgets and greater difficulty in achieving the “above code targets” for incentive programs. DCS and HPA will both have adjustments to attic insulation placement and possibly insulation type. There are different options and combinations of insulation that can be used which are widely available from retailers and distributors. Additionally, the DCS strategy will require a sealed furnace, which is available from multiple manufacturers and some of these sealed furnaces meet current federal minimum efficiency requirements.
If installed properly and according to best design guidelines, these measures will be low maintenance and persist for the life of the measure.
This proposal is cost effective over the period of analysis. Overall this proposal increases the wealth of the State of California. California consumers and businesses save more money on energy than they do for financing the efficiency measure. As a result this leaves more money available for discretionary and investment purposes.
The expected impacts of the proposed code change on various stakeholders are summarized below:
Impact on builders: The DCS strategy will require modifications to building designs and practices that will impact builders and trades. The HPA measure will have minor impact on building practices, with the exception of installing roof deck insulation. HVAC contractors will need to be part of the design team and provide duct system layout and sizing for inclusion in the plans. Site building superintendents will need to modify scheduling to allow access of subcontractors in the sequence needed to perform the work.
2016 CASE Report – 2016-RES-ENV1-D Page xii
Impact on building designers: The DCS strategy will require that designers integrate the HVAC system and layout with the rest of the plans as part of the design process. From the beginning of the design process, designers will need to determine the strategy to be used and what spaces are needed to accommodate the strategy.
Impact on occupational safety and health: The proposed code change is not expected to have an impact on occupational safety and health.
Impact on building owners and occupants: Since this measure is cost-effective, the building owner or occupant who pays the energy bills will experience net cost savings over their additional mortgage or rent costs.
Impact on equipment retailers (including manufacturers and distributors): The DCS and HPA strategies may increase demand for certain building products, such as various options for roof deck insulation. The DCS strategy will also have impacts on certified low-leakage air handlers and sealed combustion furnaces.
Impact on energy consultants: This measure is not expected to have any significant impacts on energy consultants.
Impact on building inspectors: No new inspections will be introduced, and, as compared to the overall code enforcement effort, this measure has negligible impact on the effort required to enforce the building codes.
Statewide Employment Impacts: The proposed measures will increase the demand for trades with specific skill, knowledge and experience working with these strategies and products.
Impacts on the creation or elimination of businesses in California: The updates to Title 24 as a whole are expected to drive additional business creation in California. This is discussed in greater detail below in Section 3.5.2. This measure is not expected to have an appreciable impact on any paritcualr business in California.
Impacts on the potential advantages or disadvantages to California businesses: California businesses would benefit from an overall reduction in energy costs. This could help California businesses gain competitive advantage over businesses operating in other states or countries and an increase in investment in California. This measure is not expected to have an appreciable impact on any paritcualr business in California.
Impacts on the potential increase or decrease of investments in California: As described in Section 3.5 of this report, the California Air Resources Board (CARB) economic analysis of greenhouse gas reduction strategies for the State of California indicates that higher levels of energy efficiency and 33% Renewable Portfolio Standard (RPS) will increase investment in California by about 3% in 2020 compared to 20% RPS and lower levels of energy efficiency. After reviewing the CARB analysis, the Statewide Statewide CASE Team concluded that the majority of the increased investment of the more aggressive strategy is attributed to the benefits of efficiency (CARB 2010b Figures 7a and 10a). The specific code change proposal presented in this report is not expected to have an appreciable impact on investments in California.
2016 CASE Report – 2016-RES-ENV1-D Page xiii
Impacts on incentives for innovations in products, materials or processes: Updating Title 24 standards will encourage innovation through the adoption of new technologies to better manage energy usage and achieve energy savings. There are no projected impediments to, or incentives for, innovation that would result from the proposed measures.
Impacts on the State General Fund, Special Funds and local government: The proposed measure is not expected to have an appreciable impact on the State General Fund, Special Funds, or local government funds.
Cost of enforcement to State Government and local governments: Building inspection requirements remain the same. Likewise, training or additional time spent on enforcement, which may lead to increased enforcement costs for the state or local government, are minimal.
State government already has budgeted for code development, education, and compliance enforcement. While state government will be allocating resources to update the Title 24 standards, including updating education and compliance materials and responding to questions about the revised standards, these activities are already covered by existing state budgets. The costs to state government are small when compared to the overall costs savings and policy benefits associated with the code change proposals.
The building code is updated on a triennial basis, and local governments plan and budget for retraining every time the code is updated. There are numerous resources available to local governments to support compliance training that can help mitigate the cost of retraining. Although retraining is a cost of the revised standards, Title 24 energy efficiency standards are expected to increase economic growth and income with positive impacts on local revenue.
Impacts on migrant workers; persons by age group, race, or religion: This proposal and all measures adopted by CEC into Title 24, part 6 do not advantage or discriminate in regards to race, religion or age group.
Impact on Homeowners (including potential first time home owners): This proposal is cost-effective for the homeowner. As a result the combined mortgage costs and utility bill payment for the homeowner are less if the measure is incorporated into all new homes.
Impact on Renters: This proposal is advantageous to renters as it reduces the cost of utilities which are typically paid by renters. Since the measure saves more energy cost on a monthly basis than the measure costs on the mortgage as experiences by the landlord, the pass-through of added mortgage costs into rents is less than the energy cost savings experienced by renters.
Impact on Commuters: This proposal and all measures adopted by CEC into Title 24, part 6 are not expected to have an impact on commuters
2016 CASE Report – 2016-RES-ENV1-D Page xiv
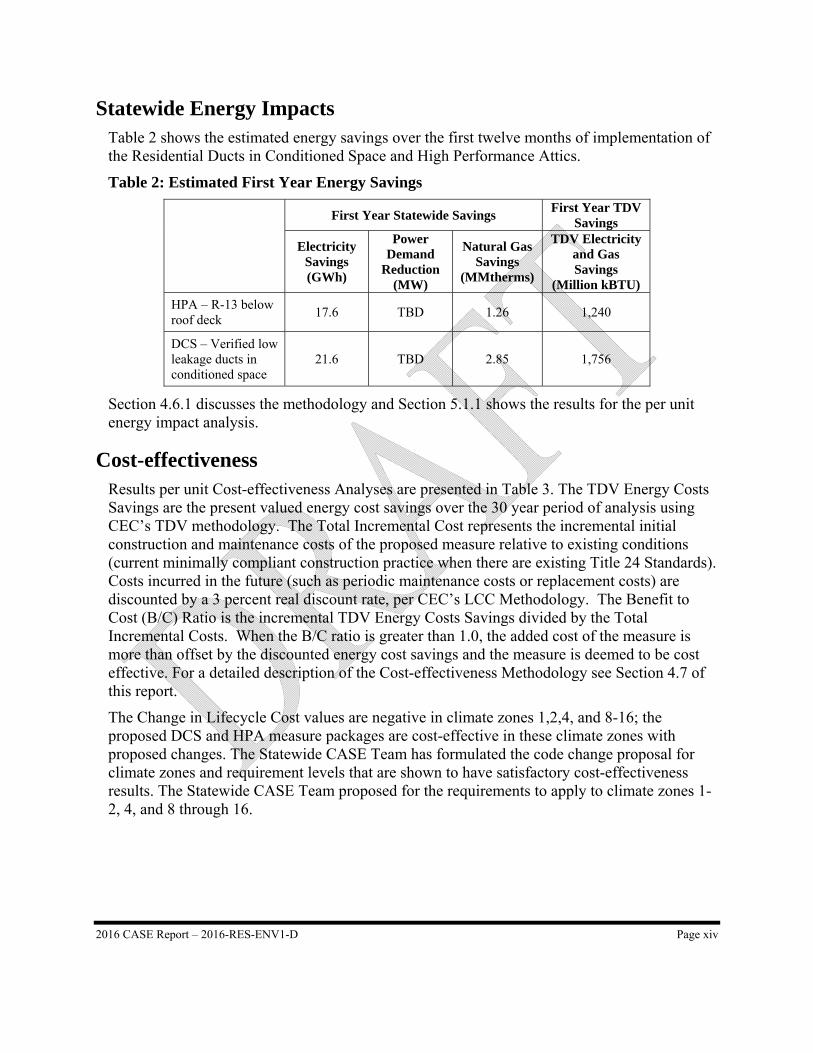
Statewide Energy Impacts Table 2 shows the estimated energy savings over the first twelve months of implementation of the Residential Ducts in Conditioned Space and High Performance Attics.
Table 2: Estimated First Year Energy Savings
First Year Statewide Savings
First Year TDV Savings
Electricity Savings (GWh)
Power Demand
Reduction (MW)
Natural Gas Savings
(MMtherms)
TDV Electricity and Gas Savings
(Million kBTU)
HPA – R-13 below roof deck
17.6 TBD 1.26 1,240
DCS – Verified low leakage ducts in conditioned space
21.6 TBD 2.85 1,756
Section 4.6.1 discusses the methodology and Section 5.1.1 shows the results for the per unit energy impact analysis.
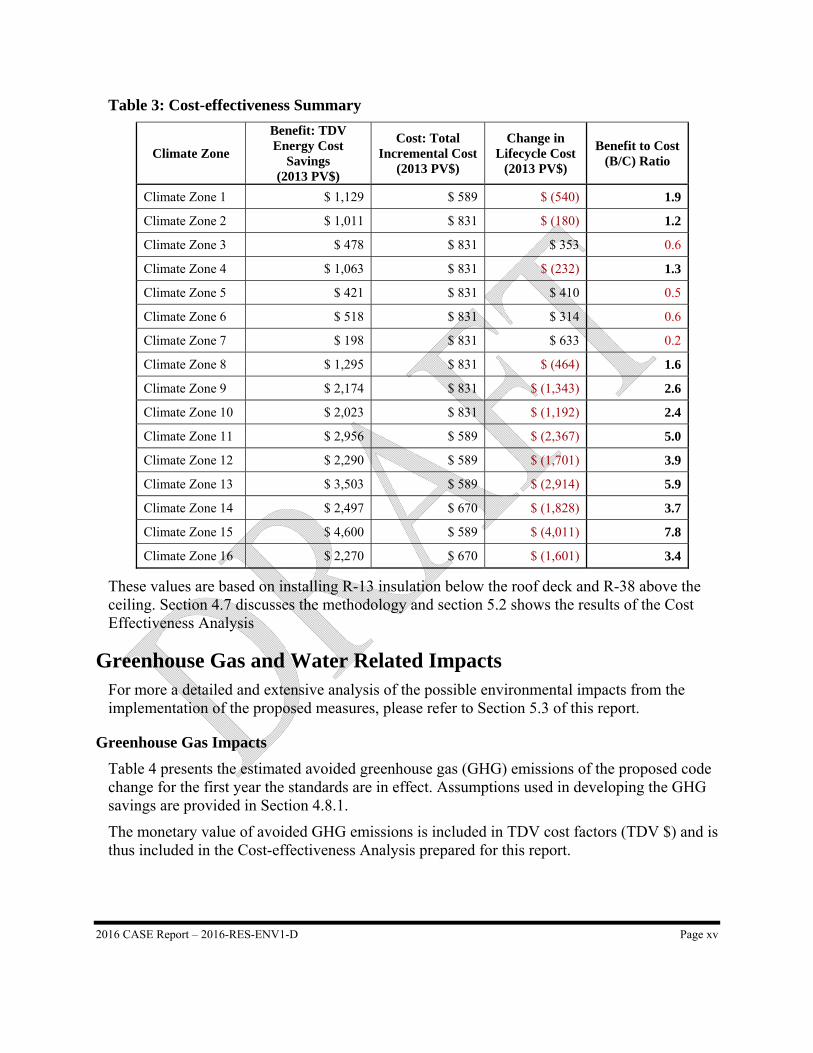
Cost-effectiveness Results per unit Cost-effectiveness Analyses are presented in Table 3. The TDV Energy Costs Savings are the present valued energy cost savings over the 30 year period of analysis using CEC’s TDV methodology. The Total Incremental Cost represents the incremental initial construction and maintenance costs of the proposed measure relative to existing conditions (current minimally compliant construction practice when there are existing Title 24 Standards). Costs incurred in the future (such as periodic maintenance costs or replacement costs) are discounted by a 3 percent real discount rate, per CEC’s LCC Methodology. The Benefit to Cost (B/C) Ratio is the incremental TDV Energy Costs Savings divided by the Total Incremental Costs. When the B/C ratio is greater than 1.0, the added cost of the measure is more than offset by the discounted energy cost savings and the measure is deemed to be cost effective. For a detailed description of the Cost-effectiveness Methodology see Section 4.7 of this report.
The Change in Lifecycle Cost values are negative in climate zones 1,2,4, and 8-16; the proposed DCS and HPA measure packages are cost-effective in these climate zones with proposed changes. The Statewide CASE Team has formulated the code change proposal for climate zones and requirement levels that are shown to have satisfactory cost-effectiveness results. The Statewide CASE Team proposed for the requirements to apply to climate zones 1-2, 4, and 8 through 16.
2016 CASE Report – 2016-RES-ENV1-D Page xv
Table 3: Cost-effectiveness Summary
Climate Zone
Benefit: TDV Energy Cost
Savings
(2013 PV$)
Cost: Total Incremental Cost
(2013 PV$)
Change in Lifecycle Cost
(2013 PV$)
Benefit to Cost (B/C) Ratio
Climate Zone 1 $ 1,129 $ 589 $ (540) 1.9
Climate Zone 2 $ 1,011 $ 831 $ (180) 1.2
Climate Zone 3 $ 478 $ 831 $ 353 0.6
Climate Zone 4 $ 1,063 $ 831 $ (232) 1.3
Climate Zone 5 $ 421 $ 831 $ 410 0.5
Climate Zone 6 $ 518 $ 831 $ 314 0.6
Climate Zone 7 $ 198 $ 831 $ 633 0.2
Climate Zone 8 $ 1,295 $ 831 $ (464) 1.6
Climate Zone 9 $ 2,174 $ 831 $ (1,343) 2.6
Climate Zone 10 $ 2,023 $ 831 $ (1,192) 2.4
Climate Zone 11 $ 2,956 $ 589 $ (2,367) 5.0
Climate Zone 12 $ 2,290 $ 589 $ (1,701) 3.9
Climate Zone 13 $ 3,503 $ 589 $ (2,914) 5.9
Climate Zone 14 $ 2,497 $ 670 $ (1,828) 3.7
Climate Zone 15 $ 4,600 $ 589 $ (4,011) 7.8
Climate Zone 16 $ 2,270 $ 670 $ (1,601) 3.4
These values are based on installing R-13 insulation below the roof deck and R-38 above the ceiling. Section 4.7 discusses the methodology and section 5.2 shows the results of the Cost Effectiveness Analysis
Greenhouse Gas and Water Related Impacts For more a detailed and extensive analysis of the possible environmental impacts from the implementation of the proposed measures, please refer to Section 5.3 of this report.
Greenhouse Gas Impacts
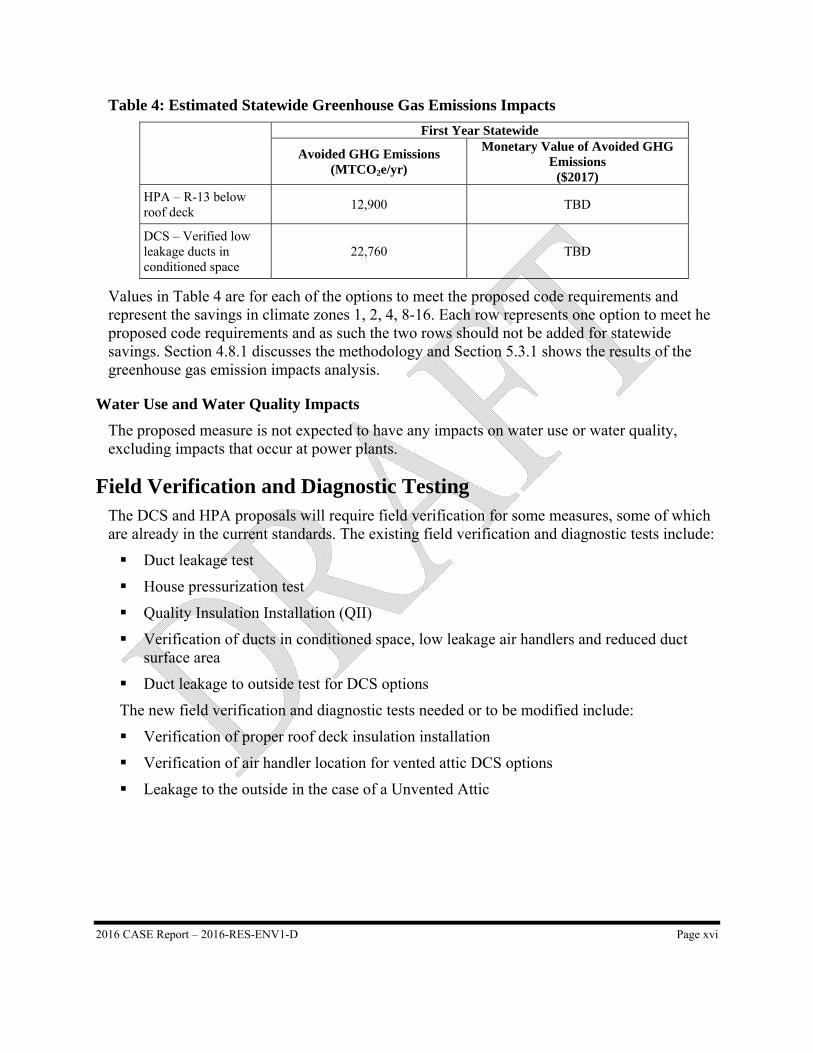
Table 4 presents the estimated avoided greenhouse gas (GHG) emissions of the proposed code change for the first year the standards are in effect. Assumptions used in developing the GHG savings are provided in Section 4.8.1.
The monetary value of avoided GHG emissions is included in TDV cost factors (TDV $) and is thus included in the Cost-effectiveness Analysis prepared for this report.
2016 CASE Report – 2016-RES-ENV1-D Page xvi
Table 4: Estimated Statewide Greenhouse Gas Emissions Impacts
First Year Statewide
Avoided GHG Emissions (MTCO2e/yr)
Monetary Value of Avoided GHG Emissions
($2017)
HPA – R-13 below roof deck
12,900 TBD
DCS – Verified low leakage ducts in conditioned space
22,760 TBD
Values in Table 4 are for each of the options to meet the proposed code requirements and represent the savings in climate zones 1, 2, 4, 8-16. Each row represents one option to meet he proposed code requirements and as such the two rows should not be added for statewide savings. Section 4.8.1 discusses the methodology and Section 5.3.1 shows the results of the greenhouse gas emission impacts analysis.
Water Use and Water Quality Impacts
The proposed measure is not expected to have any impacts on water use or water quality, excluding impacts that occur at power plants.
Field Verification and Diagnostic Testing The DCS and HPA proposals will require field verification for some measures, some of which are already in the current standards. The existing field verification and diagnostic tests include:
Duct leakage test
House pressurization test
Quality Insulation Installation (QII)
Verification of ducts in conditioned space, low leakage air handlers and reduced duct surface area
Duct leakage to outside test for DCS options
The new field verification and diagnostic tests needed or to be modified include:
Verification of proper roof deck insulation installation
Verification of air handler location for vented attic DCS options
Leakage to the outside in the case of a Unvented Attic
2016 CASE Report – 2016-RES-ENV1-D Page 1
1. INTRODUCTION The Codes and Standards Enhancement (CASE) initiative presents recommendations to support California Energy Commission’s (CEC) efforts to update California’s Building Energy Efficiency Standards (Title 24) to include new requirements or to upgrade existing requirements for various technologies. The four California Investor Owned Utilities (IOUs) – Pacific Gas and Electric Company, San Diego Gas and Electric, Southern California Edison and Southern California Gas Company – and Los Angeles Department of Water and Power (LADWP) sponsored this effort. The program goal is to prepare and submit proposals that will result in cost-effective enhancements to energy efficiency in buildings. This report and the code change proposal presented herein is a part of the effort to develop technical and cost-effectiveness information for proposed regulations on building energy efficient design practices and technologies.
The overall goal of this CASE Report is to propose a code change proposal for Residential Ducts in Conditioned Spaces/High Performance Attics. The report contains pertinent information that justifies the code change.
Section 2 of this CASE Report provides a description of the measure, how the measure came about, and how the measure helps achieve the state’s zero net energy (ZNE) goals. This section presents how the Statewide Statewide CASE Team envisions the proposed code change would be enforced and the expected compliance rates. This section also summarized key issues that the Statewide Statewide CASE Team addressed during the CASE development process, including issues discussed during a public stakeholder meeting that the Statewide Statewide CASE Team hosted in May 2014.
Section 3 presents the market analysis, including a review of the current market structure, a discussion of product availability, and the useful life and persistence of the proposed measure. This section offers an overview of how the proposed standard will impact various stakeholders including builders, building designers, building occupants, equipment retailers (including manufacturers and distributors), energy consultants, and building inspectors. Finally, this section presents estimates of how the proposed change will impact statewide employment.
Section 4 describes the methodology and approach the Statewide Statewide CASE Team used to estimate energy, demand, costs, and environmental impacts. Key assumptions used in the analyses can be also found in Section 4.
Results from the energy, demand, costs, and environmental impacts analysis are presented in Section 5. The Statewide Statewide CASE Team calculated energy, demand, and environmental impacts using two metrics: (1) per unit, and (2) statewide impacts during the first year buildings complying with the 2016 Title 24 Standards are in operation. Time Dependent Valuation (TDV) energy impacts, which accounts for the higher value of peak savings, are presented for the first year both per unit and statewide. The incremental costs, relative to existing conditions are presented as are present value of year TDV energy cost savings and the overall cost impacts over the year period of analysis.
2016 CASE Report – 2016-RES-ENV1-D Page 2
The report concludes with specific recommendations for language for the Standards, Appendices, Alternate Calculation Method (ACM) Reference Manual, and Compliance Forms.
This is a draft version of the CASE Report. The 2016 TDV values were not yet available when this draft report was being developed. The TDV energy and cost savings presented in this draft report were developed using 2013 TDV values. The TDV energy and cost savings presented in this draft report were developed using 2013 TDV values and TDV cost saving are in 2011 dollars. The Statewide Statewide CASE Team will be submitting a revised version of this report in fall 2014, which will include the final recommended code change proposal and a updated TDV energy and cost savings results that use the 2016 TDV values
2016 CASE Report – 2016-RES-ENV1-D Page 3
2. MEASURE DESCRIPTION
2.1 Measure Overview
2.1.1 Measure Description
The measure consists of two alternatives for accomplishing improved building thermal envelope and reduced HVAC distribution losses in residential buildings. These two approaches will have similar energy impacts on the building.
High Performance Attics (HPA) implements measures that minimize temperature difference between the attic space and the conditioned air being transported through ductwork in the attic.
Ducts in Conditioned Space (DCS), locates ducts and air handlers in the building’s thermal and air barrier envelope. Installing ductless systems meets the DCS requirement.
Appendix B: DCS and HPA Strategies provides examples of various DCS and HPA strategies.
The proposed measures will add or modify mandatory and prescriptive requirements related to attic, roof, air handler, and ducts in residential buildings. The proposed measures will modify compliance options for ductless systems and add or modify modeling procedures for all of the above measures in the performance method. Details are provided in Section 2.2 of this document.
As a result of the change, the Standards will address energy issues related to air losses from air handlers and ducts in attics while allowing several compliance options to meet the requirements with alternate systems or strategies. The proposed change does not modify or expand the scope of the Standards themselves.
2.1.2 Measure History
Common construction practice in California is slab-on-grade, with air handlers and associated ductwork located in an unconditioned attic. During the cooling season, particularly in the Central Valley and other inland climates, attic temperatures can reach temperatures much higher than the outside air temperatures (Lstiburek 2013, BSC 2010, EPA 2000), resulting in loss of cooling capacity delivered to the interior and increased energy use by the HVAC system to provide desired occupant comfort.
For the 2013 Title 24 Building Energy Efficiency Standards, the Statewide CASE Team analyzed a set of measures to reduce undesirable heat gain and loss through the roof assembly and to improve duct conditions (AEC/HMG)3. The team established a vented attic package,
3www.energy.ca.gov/title24/2013standards/prerulemaking/documents/current/Reports/Residential/Envelope/2013_CASE_R_Roo
f_Measures_Oct_2011.pdf
2016 CASE Report – 2016-RES-ENV1-D Page 4
which initially included cool roof requirements, roof deck insulation, raised heel trusses and increased duct insulation. Modeling capabilities were also developed to account for the derating of insulation value when insulation is compressed at the eave (e.g. when a raised heel trusses is not used). However, the final adopted code language only modified cool roof solar reflectance requirements, increased duct insulation and required radiant barrier in specific climate zones.
The measures from the 2013 CASE that did not get adopted in the 2013 standards did not meet cost feasibility criteria based on the CEC’s imposed threshold of $2000 incremental costs for all new residential building measures. Also roof deck insulation faced substantial building industry pushback. The CEC contracted the Building Science Corporation (BSC), a leader in advanced building methods, to conduct a moisture analysis for this option. The results indicated that air permeable insulation may be installed under the roof deck of a vented attic without moisture issues in all climate zones but CZ16. The report laid out the necessary steps required to prevent moisture issues due to roof deck insulation in a vented attic (BSC 20114). The CEC rejected the measure due to industry concerns.
Currently, there are several national programs and organizations promoting the adoption of high performance residential building envelopes and ducts in conditioned space. The DOE Challenge Home (recently renamed the “DOE Zero Energy Ready Homes” initiative) launched new national program requirements in 2012 (and updated April 21, 20145) that require ducts in conditioned space as a mandatory requirement for participation under the prescriptive path. There are several alternatives allowed to ducts in conditioned space including unvented/unvented attics, unvented crawl spaces, and ductless systems. DOE Building America’s ongoing research projects showcase case studies and produce measure guidelines that demonstrate the options and benefits of implementing these advanced measures. The National Association of Home Builders (NAHB) has produced guidelines and case studies to inform builders and assist in identifying solutions to possible barriers for moving ducts into conditioned space.
California utilities are researching these design options through emerging technology projects and working with builders to increase their knowledge and experience. Both Southern California Edison (SCE) and Pacific Gas & Electric (PG&E) are conducting projects that work directly with builders through the design process, selection of measures, and construction phase for implementing DCS or HPA strategies. SMUD’s Home of the Future program encourages locating ducts and equipment in conditioned space and other advanced building techniques. The utility emerging technology programs and projects provide expertise and assistance with the technical and implementation barriers for builders to make the transition; these efforts inform and greatly support the development of the CASE study. In addition to
4 www.buildingscience.com/documents/reports/rr-1110-hygrothermal-analysis-california-attics 5 energy.gov/sites/prod/files/2014/04/f15/doe_zero_energy_ready_home_requirements_rev04.pdf
2016 CASE Report – 2016-RES-ENV1-D Page 5
these programs, a national production builder has made ducts in conditioned space a standard feature for all homes, and other advanced home builders are investigating these options.
2.1.3 Existing Standards
2013 Title 24 Building Energy Efficiency Standards
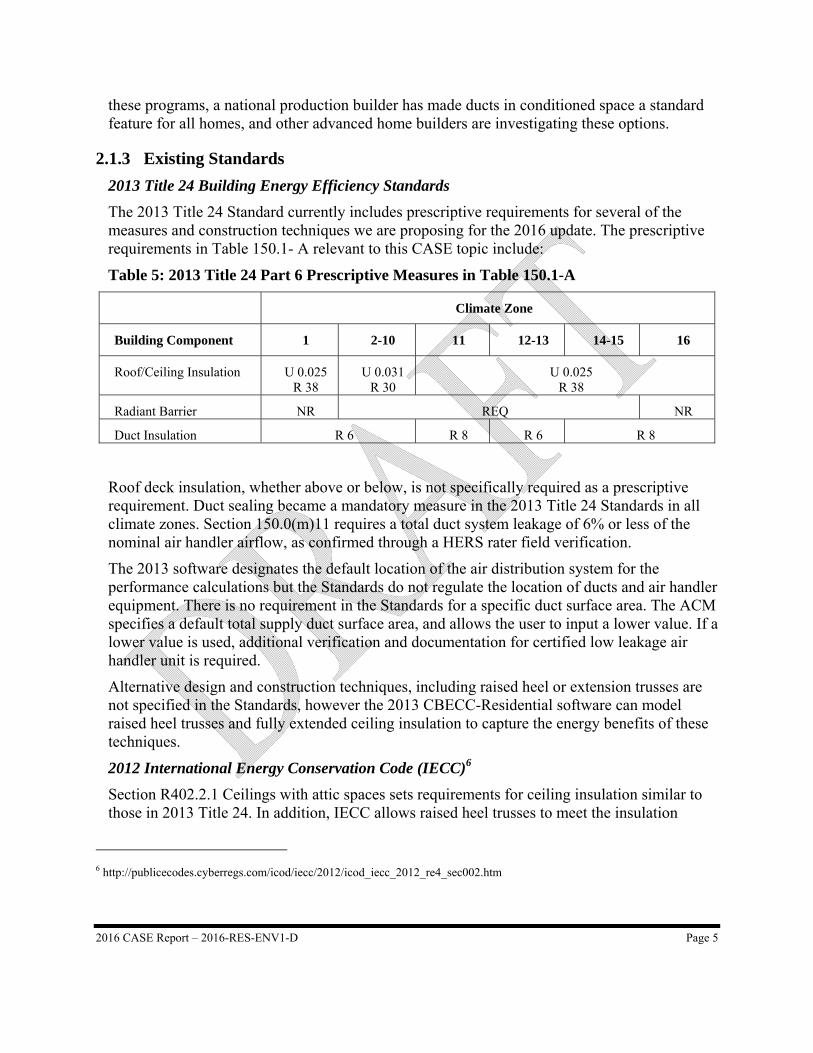
The 2013 Title 24 Standard currently includes prescriptive requirements for several of the measures and construction techniques we are proposing for the 2016 update. The prescriptive requirements in Table 150.1- A relevant to this CASE topic include:
Table 5: 2013 Title 24 Part 6 Prescriptive Measures in Table 150.1-A
Climate Zone
Building Component 1 2-10 11 12-13 14-15 16
Roof/Ceiling Insulation U 0.025R 38
U 0.031R 30
U 0.025 R 38
Radiant Barrier NR REQ NR
Duct Insulation R 6 R 8 R 6 R 8
Roof deck insulation, whether above or below, is not specifically required as a prescriptive requirement. Duct sealing became a mandatory measure in the 2013 Title 24 Standards in all climate zones. Section 150.0(m)11 requires a total duct system leakage of 6% or less of the nominal air handler airflow, as confirmed through a HERS rater field verification.
The 2013 software designates the default location of the air distribution system for the performance calculations but the Standards do not regulate the location of ducts and air handler equipment. There is no requirement in the Standards for a specific duct surface area. The ACM specifies a default total supply duct surface area, and allows the user to input a lower value. If a lower value is used, additional verification and documentation for certified low leakage air handler unit is required.
Alternative design and construction techniques, including raised heel or extension trusses are not specified in the Standards, however the 2013 CBECC-Residential software can model raised heel trusses and fully extended ceiling insulation to capture the energy benefits of these techniques.
2012 International Energy Conservation Code (IECC)6
Section R402.2.1 Ceilings with attic spaces sets requirements for ceiling insulation similar to those in 2013 Title 24. In addition, IECC allows raised heel trusses to meet the insulation
6 http://publicecodes.cyberregs.com/icod/iecc/2012/icod_iecc_2012_re4_sec002.htm
2016 CASE Report – 2016-RES-ENV1-D Page 6
requirements with lower insulation levels installed at the ceiling. For example, when Section R402.1.1 requires R-38 in the ceiling, R-30 is deemed to satisfy the requirement wherever the full height of uncompressed R-30 insulation extends over the wall top plate at the eaves (through raised heel truss). Similarly, R-38 shall be deemed to satisfy the requirement for R-49 wherever the full height of uncompressed R-38 insulation extends over the wall top plate at the eaves. This reduction shall not apply to the U-factor alternative approach in Section R402.1.3 and the total UA alternative in Section R402.1.4.
Section R403.2.2 Ducts requires R-8 duct insulation on all supply lines in attics and has a total duct tightness requirement of 4 cubic feet per minute per one hundred square feet of conditioned floor area (with handler) at 25 Pascal. This is equal to 28 cfm per ton of AC capacity at one ton for each 700 square foot of conditioned floor area, which is 7% of the flow. Ducts that are located completely inside the building thermal envelope are exempt from the duct insulation requirement or the total duct leakage requirement. In addition, it requires that air handlers have an air leakage rate of no more than 2% of the design air flow rate, tested in accordance with the ASHRAE 193 standard.
2.1.4 Alignment with Zero Net Energy Goals
The proposed modifications to the residential standards are aligned with California’s ZNE goals, and are supported by the current IOU residential single family new construction program, California Advanced Homes Program (CAHP).
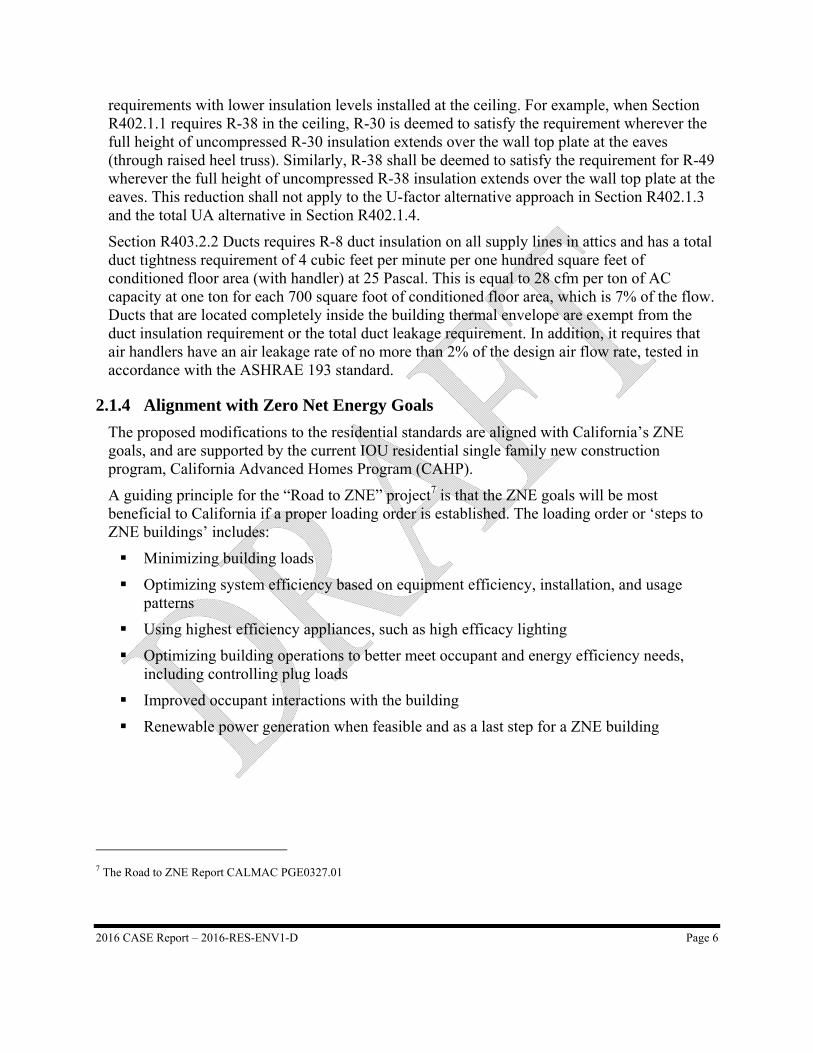
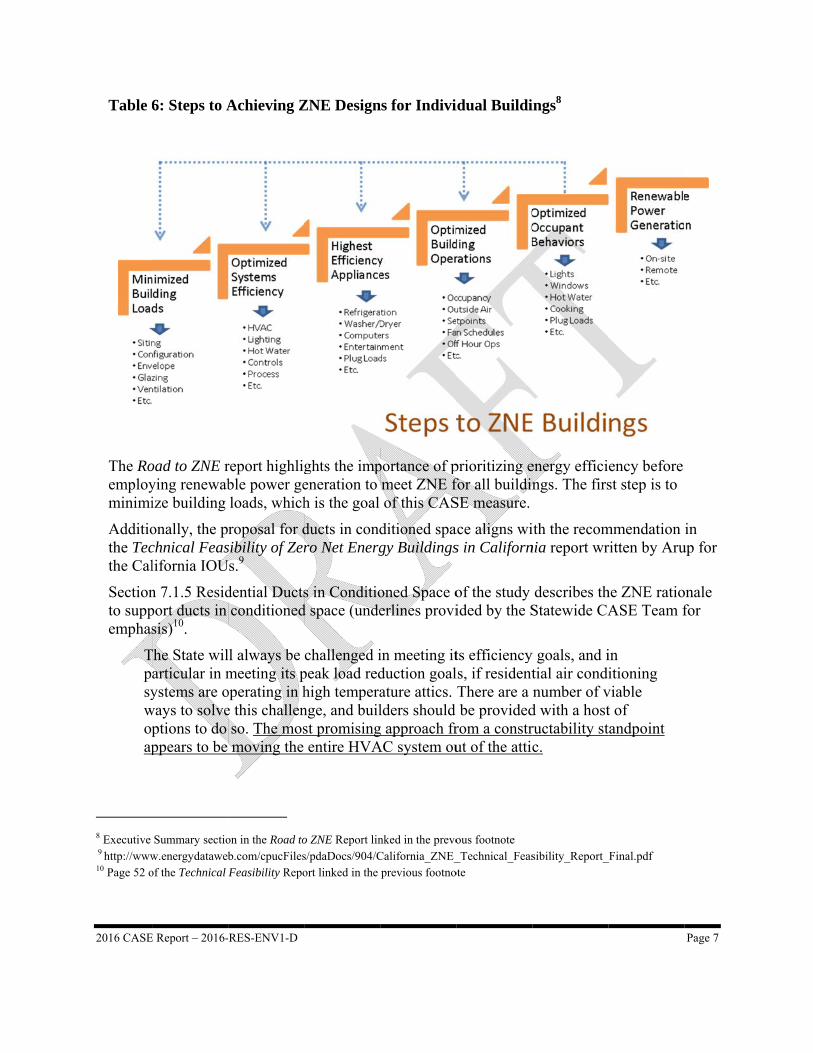
A guiding principle for the “Road to ZNE” project7 is that the ZNE goals will be most beneficial to California if a proper loading order is established. The loading order or ‘steps to ZNE buildings’ includes:
Minimizing building loads
Optimizing system efficiency based on equipment efficiency, installation, and usage patterns
Using highest efficiency appliances, such as high efficacy lighting
Optimizing building operations to better meet occupant and energy efficiency needs, including controlling plug loads
Improved occupant interactions with the building
Renewable power generation when feasible and as a last step for a ZNE building
7 The Road to ZNE Report CALMAC PGE0327.01
2016 CASE
Table 6
The Roemployminimi
Additiothe Tecthe Cal
Sectionto suppemphas
Tpsywopap
8 Executive 9 http://www10 Page 52 o
E Report – 2016-
6: Steps to A
oad to ZNE rying renewabize building
onally, the pchnical Feaslifornia IOU
n 7.1.5 Residport ducts in sis)10.
The State wilarticular in mystems are o
ways to solveptions to do ppears to be
Summary sectiow.energydatawebof the Technical
-RES-ENV1-D
Achieving Z
report highligble power geloads, which
roposal for dsibility of Zer
Us.9
dential Ductsconditioned
ll always be meeting its poperating in he this challenso. The mosmoving the
on in the Road tob.com/cpucFilesFeasibility Repo
ZNE Design
ghts the impeneration to h is the goal
ducts in condro Net Energ
s in Conditiod space (unde
challenged ipeak load redhigh temperange, and builst promisingentire HVA
o ZNE Report lins/pdaDocs/904/Cort linked in the
ns for Indivi
portance of pmeet ZNE fof this CAS
ditioned spagy Buildings
oned Space oerlines provi
in meeting itduction goalature attics. lders should
g approach frAC system ou
nked in the prevoCalifornia_ZNE_previous footno
idual Buildi
prioritizing efor all buildinSE measure.
ace aligns wis in Californ
of the study ided by the S
ts efficiencyls, if residentThere are a be provided
rom a construt of the attic
ous footnote _Technical_Feas
ote
ings8
energy efficings. The firs
ith the recomnia report wr
describes thStatewide CA
y goals, and itial air condinumber of v
d with a hostructability stc.
sibility_Report_
ency before st step is to
mmendation ritten by Aru
he ZNE ratioASE Team f
in itioning
viable t of tandpoint
_Final.pdf
Page 7
in up for
onale for
2016 CASE Report – 2016-RES-ENV1-D Page 8
A better insulated home, with high performance windows, proper orientation, and ducts in the conditioned space can have considerably lower air conditioning loads than does a standard home today. That reduced load, in turn, allows for a much smaller duct system to provide the necessary cooling. The reduced duct sizing facilitates installation when the HVAC system is no longer located in the attic. Hydronic delivery systems are another viable strategy, with additional potential fan energy savings.
Recommendation: Rather than continuing to focus on ways to reduce attic temperatures, it appears that residential building standards should instead work towards moving HVAC systems within the conventional building envelope. Isolating the home from attic heat is then a much simpler problem, solved by adding additional blown-in insulation (perhaps with a raised heel truss). A builder could, through the Title 24 performance compliance process, achieve the same energy benefits by providing sufficient insulation at the roof deck if the builder preferred that method.
2.1.5 Relationship to Other Title 24 Measures
This DCS/HPA CASE topic is synergistic with the Residential High Performance Walls topic as both studies propose ways to increase the energy performance of building envelope.
2.2 Summary of Changes to Code Documents The sections below provide a summary of how each Title 24 documents will be modified by the proposed change. See Section 6 of this report for detailed proposed revisions to code language.
2.2.1 Catalogue of Proposed Changes
Scope
Table 7 identifies the scope of the code change proposal. This measure will impact the following areas (marked by a “Yes”).
Table 7: Scope of Code Change Proposal
Mandatory Prescriptive Performance Compliance
Option Trade-Off Modeling
Algorithms Forms Y Y Y Y Y Y Y
Standards
The proposed code change will modify the sections of the California Building Energy Efficiency Standards (Title 24, Part 6) identified in Table 8.

2016 CASE Report – 2016-RES-ENV1-D Page 9
Table 8: Sections of Standards Impacted by Proposed Code Change
Title 24, Part 6 Section Number
Section Title
Mandatory (M) Prescriptive (Ps)
Performance (Pm)
Modify Existing (E)
New Section (N)
150.0 (g) Vapor Retarder M E
150.0 (h) Space-Conditioning Equipment: 1. Building Cooling and Heating Loads
M E
150.0 (m) Air-Distribution and Ventilation System Ducts, Plenums and Fans:
1. CMC Compliance
11. Duct System Sealing and Leakage Testing
M E
150.1 Performance and Prescriptive Compliance Approaches for Newly Constructed Residential Buildings
M E
150.1 (b) Performance Standards:
4. Compliance Demonstration Requirements for Performance Standards
B iii. Low Leakage Air Handler
Pm E
150.1 (c)
Prescriptive Standards:
1. Insulation
A. Roof/Ceiling insulation
2. Radiant Barrier
9. Space Conditioning Ducts
11. Roofing Products
12. Ventilation Cooling
Ps E/N
Table 150.1-A COMPONENT PACKAGE-A Standard Building Design
Roofs/Ceilings
Radiant Barrier
Ducts: Duct Insulation
Appendices
The proposed code change will modify the sections of the indicated appendices presented in Table 9. If an appendix is not listed, then the proposed code change is not expected to have an effect on that appendix.
2016 CASE Report – 2016-RES-ENV1-D Page 10
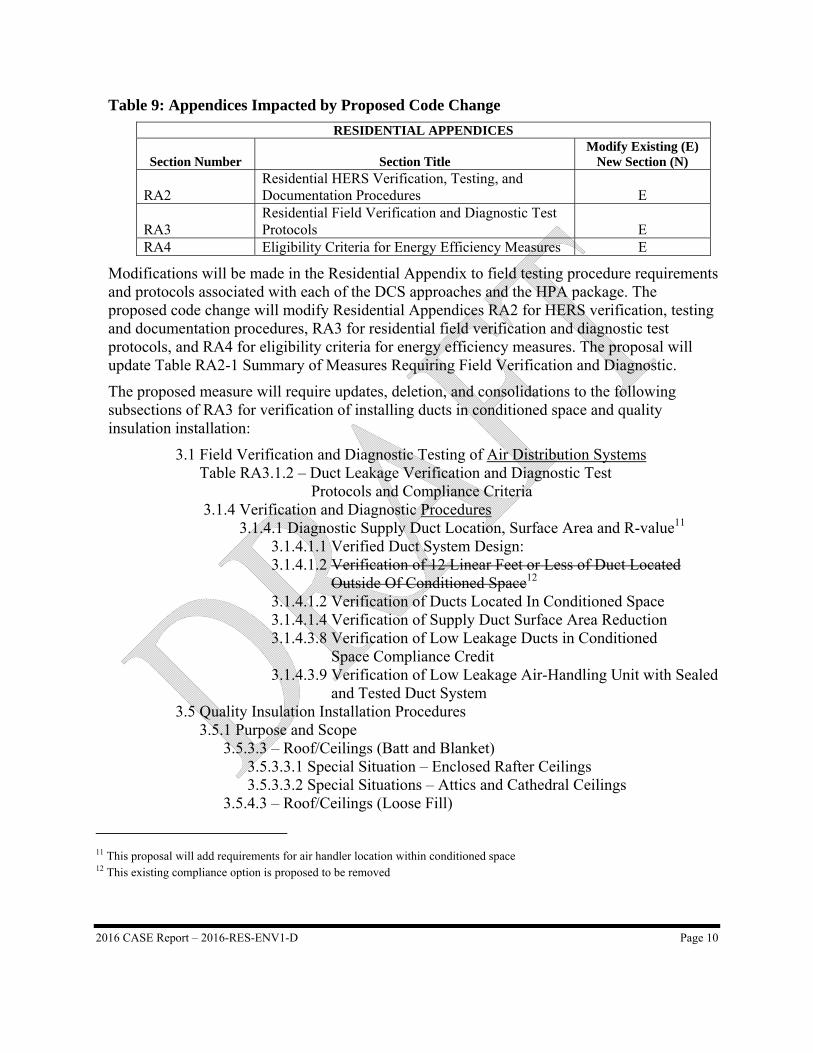
Table 9: Appendices Impacted by Proposed Code Change
RESIDENTIAL APPENDICES
Section Number Section Title Modify Existing (E)
New Section (N)
RA2 Residential HERS Verification, Testing, and Documentation Procedures E
RA3 Residential Field Verification and Diagnostic Test Protocols E
RA4 Eligibility Criteria for Energy Efficiency Measures E
Modifications will be made in the Residential Appendix to field testing procedure requirements and protocols associated with each of the DCS approaches and the HPA package. The proposed code change will modify Residential Appendices RA2 for HERS verification, testing and documentation procedures, RA3 for residential field verification and diagnostic test protocols, and RA4 for eligibility criteria for energy efficiency measures. The proposal will update Table RA2-1 Summary of Measures Requiring Field Verification and Diagnostic.
The proposed measure will require updates, deletion, and consolidations to the following subsections of RA3 for verification of installing ducts in conditioned space and quality insulation installation:
3.1 Field Verification and Diagnostic Testing of Air Distribution Systems Table RA3.1.2 – Duct Leakage Verification and Diagnostic Test Protocols and Compliance Criteria 3.1.4 Verification and Diagnostic Procedures 3.1.4.1 Diagnostic Supply Duct Location, Surface Area and R-value11 3.1.4.1.1 Verified Duct System Design: 3.1.4.1.2 Verification of 12 Linear Feet or Less of Duct Located Outside Of Conditioned Space12 3.1.4.1.2 Verification of Ducts Located In Conditioned Space 3.1.4.1.4 Verification of Supply Duct Surface Area Reduction 3.1.4.3.8 Verification of Low Leakage Ducts in Conditioned Space Compliance Credit 3.1.4.3.9 Verification of Low Leakage Air-Handling Unit with Sealed and Tested Duct System 3.5 Quality Insulation Installation Procedures 3.5.1 Purpose and Scope 3.5.3.3 – Roof/Ceilings (Batt and Blanket) 3.5.3.3.1 Special Situation – Enclosed Rafter Ceilings 3.5.3.3.2 Special Situations – Attics and Cathedral Ceilings 3.5.4.3 – Roof/Ceilings (Loose Fill)
11 This proposal will add requirements for air handler location within conditioned space 12 This existing compliance option is proposed to be removed
2016 CASE Report – 2016-RES-ENV1-D Page 11
3.5.5.3 – Roof/Ceilings (Rigid Foam Board) 3.5.6.3 – Roof/Ceilings (SPF) 3.5.6.3.2 Special Situations – Attics and Cathedral Ceilings
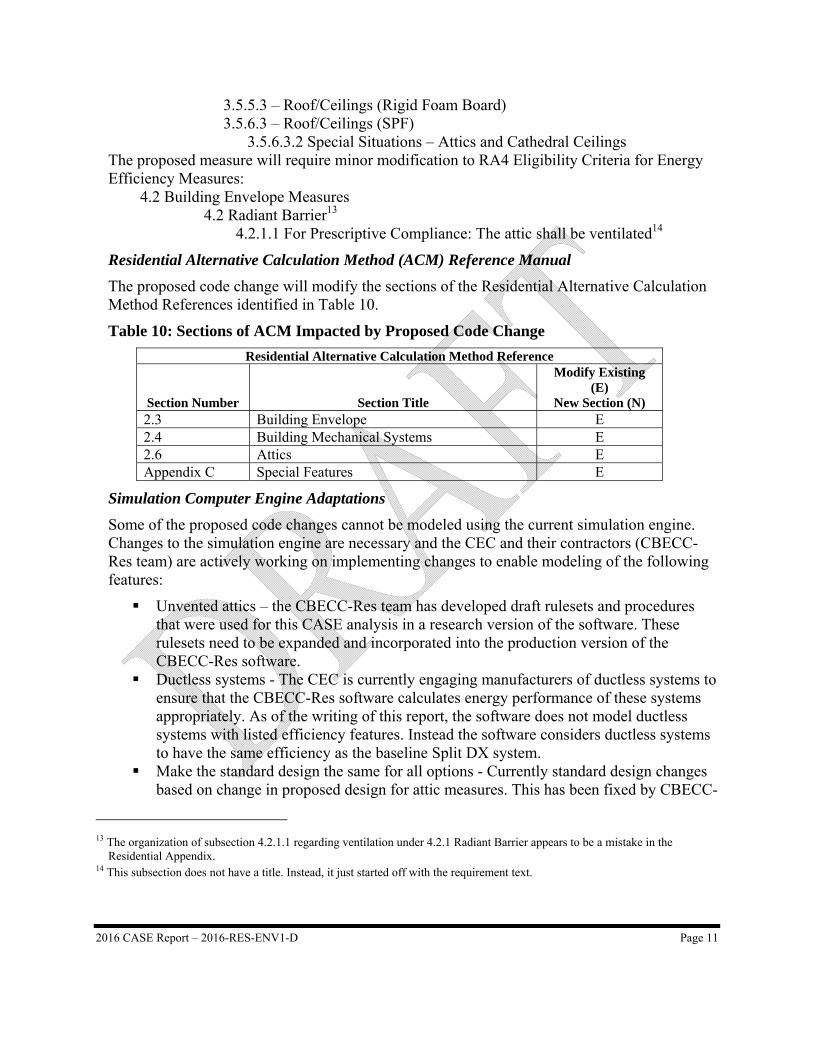
The proposed measure will require minor modification to RA4 Eligibility Criteria for Energy Efficiency Measures: 4.2 Building Envelope Measures 4.2 Radiant Barrier13 4.2.1.1 For Prescriptive Compliance: The attic shall be ventilated14
Residential Alternative Calculation Method (ACM) Reference Manual
The proposed code change will modify the sections of the Residential Alternative Calculation Method References identified in Table 10.
Table 10: Sections of ACM Impacted by Proposed Code Change
Residential Alternative Calculation Method Reference
Section Number Section Title
Modify Existing (E)
New Section (N) 2.3 Building Envelope E 2.4 Building Mechanical Systems E 2.6 Attics E Appendix C Special Features E
Simulation Computer Engine Adaptations
Some of the proposed code changes cannot be modeled using the current simulation engine. Changes to the simulation engine are necessary and the CEC and their contractors (CBECC-Res team) are actively working on implementing changes to enable modeling of the following features:
Unvented attics – the CBECC-Res team has developed draft rulesets and procedures that were used for this CASE analysis in a research version of the software. These rulesets need to be expanded and incorporated into the production version of the CBECC-Res software.
Ductless systems - The CEC is currently engaging manufacturers of ductless systems to ensure that the CBECC-Res software calculates energy performance of these systems appropriately. As of the writing of this report, the software does not model ductless systems with listed efficiency features. Instead the software considers ductless systems to have the same efficiency as the baseline Split DX system.
Make the standard design the same for all options - Currently standard design changes based on change in proposed design for attic measures. This has been fixed by CBECC-
13 The organization of subsection 4.2.1.1 regarding ventilation under 4.2.1 Radiant Barrier appears to be a mistake in the
Residential Appendix. 14 This subsection does not have a title. Instead, it just started off with the requirement text.
2016 CASE Report – 2016-RES-ENV1-D Page 12
Res team in the research version provided to the Statewide CASE Team and will be implemented in the production version of the software before the 2013 standards come into effect.
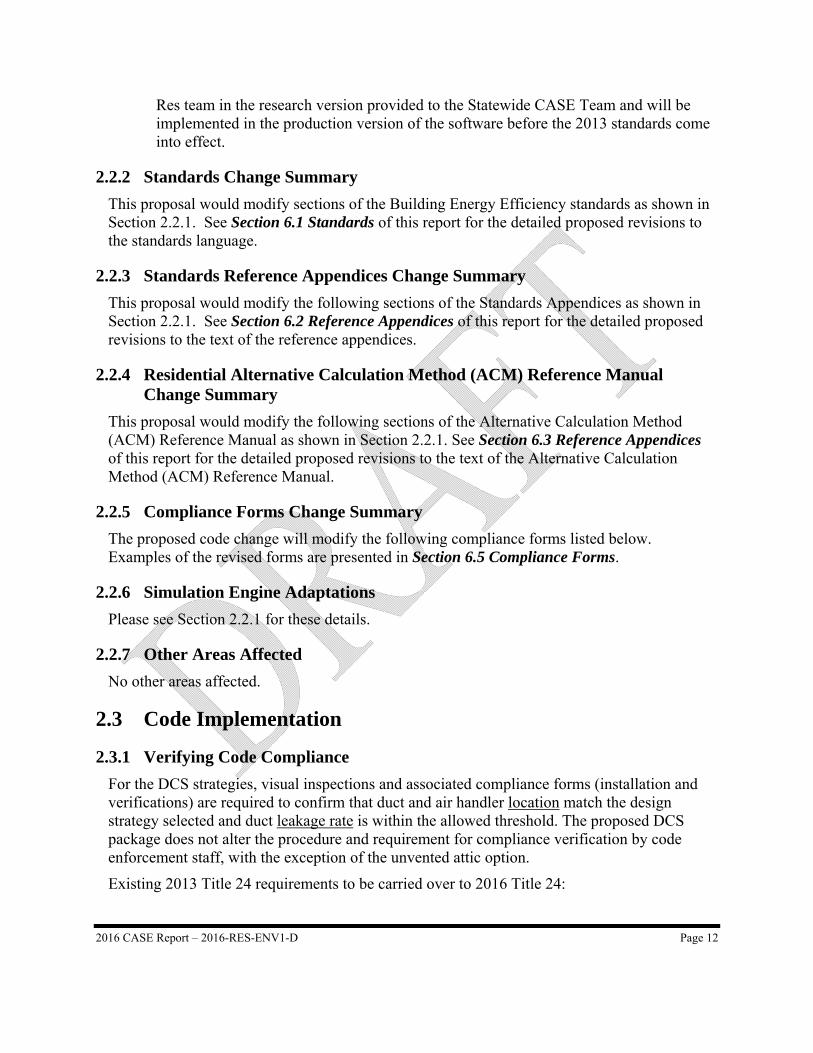
2.2.2 Standards Change Summary
This proposal would modify sections of the Building Energy Efficiency standards as shown in Section 2.2.1. See Section 6.1 Standards of this report for the detailed proposed revisions to the standards language.
2.2.3 Standards Reference Appendices Change Summary
This proposal would modify the following sections of the Standards Appendices as shown in Section 2.2.1. See Section 6.2 Reference Appendices of this report for the detailed proposed revisions to the text of the reference appendices.
2.2.4 Residential Alternative Calculation Method (ACM) Reference Manual Change Summary
This proposal would modify the following sections of the Alternative Calculation Method (ACM) Reference Manual as shown in Section 2.2.1. See Section 6.3 Reference Appendices of this report for the detailed proposed revisions to the text of the Alternative Calculation Method (ACM) Reference Manual.
2.2.5 Compliance Forms Change Summary
The proposed code change will modify the following compliance forms listed below. Examples of the revised forms are presented in Section 6.5 Compliance Forms.
2.2.6 Simulation Engine Adaptations
Please see Section 2.2.1 for these details.
2.2.7 Other Areas Affected
No other areas affected.
2.3 Code Implementation
2.3.1 Verifying Code Compliance
For the DCS strategies, visual inspections and associated compliance forms (installation and verifications) are required to confirm that duct and air handler location match the design strategy selected and duct leakage rate is within the allowed threshold. The proposed DCS package does not alter the procedure and requirement for compliance verification by code enforcement staff, with the exception of the unvented attic option.
Existing 2013 Title 24 requirements to be carried over to 2016 Title 24:
2016 CASE Report – 2016-RES-ENV1-D Page 13
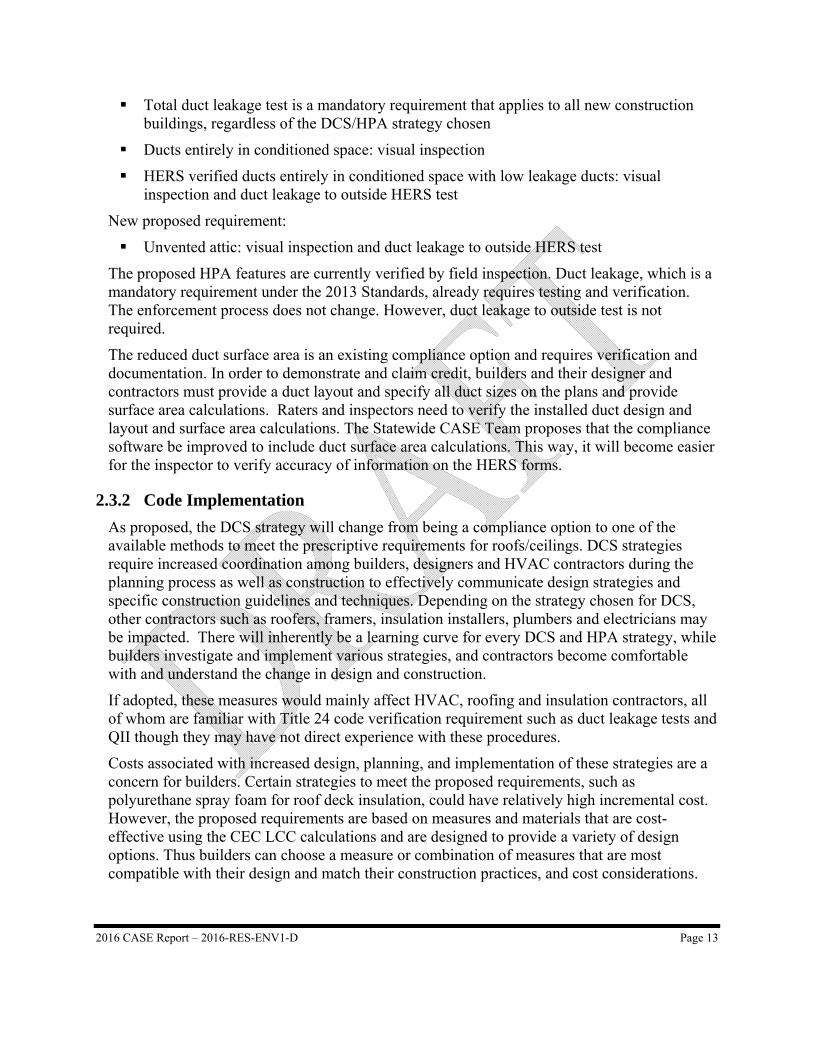
Total duct leakage test is a mandatory requirement that applies to all new construction buildings, regardless of the DCS/HPA strategy chosen
Ducts entirely in conditioned space: visual inspection
HERS verified ducts entirely in conditioned space with low leakage ducts: visual inspection and duct leakage to outside HERS test
New proposed requirement:
Unvented attic: visual inspection and duct leakage to outside HERS test
The proposed HPA features are currently verified by field inspection. Duct leakage, which is a mandatory requirement under the 2013 Standards, already requires testing and verification. The enforcement process does not change. However, duct leakage to outside test is not required.
The reduced duct surface area is an existing compliance option and requires verification and documentation. In order to demonstrate and claim credit, builders and their designer and contractors must provide a duct layout and specify all duct sizes on the plans and provide surface area calculations. Raters and inspectors need to verify the installed duct design and layout and surface area calculations. The Statewide CASE Team proposes that the compliance software be improved to include duct surface area calculations. This way, it will become easier for the inspector to verify accuracy of information on the HERS forms.
2.3.2 Code Implementation
As proposed, the DCS strategy will change from being a compliance option to one of the available methods to meet the prescriptive requirements for roofs/ceilings. DCS strategies require increased coordination among builders, designers and HVAC contractors during the planning process as well as construction to effectively communicate design strategies and specific construction guidelines and techniques. Depending on the strategy chosen for DCS, other contractors such as roofers, framers, insulation installers, plumbers and electricians may be impacted. There will inherently be a learning curve for every DCS and HPA strategy, while builders investigate and implement various strategies, and contractors become comfortable with and understand the change in design and construction.
If adopted, these measures would mainly affect HVAC, roofing and insulation contractors, all of whom are familiar with Title 24 code verification requirement such as duct leakage tests and QII though they may have not direct experience with these procedures.
Costs associated with increased design, planning, and implementation of these strategies are a concern for builders. Certain strategies to meet the proposed requirements, such as polyurethane spray foam for roof deck insulation, could have relatively high incremental cost. However, the proposed requirements are based on measures and materials that are cost-effective using the CEC LCC calculations and are designed to provide a variety of design options. Thus builders can choose a measure or combination of measures that are most compatible with their design and match their construction practices, and cost considerations.
2016 CASE Report – 2016-RES-ENV1-D Page 14
There are potential moisture management issues associated with roof deck insulation if proper installation procedures are not followed. The Statewide CASE Team has worked with industry stakeholders to identify potential solutions. Manufacturers of insulation and roof products have various methods of alleviating moisture issues that must be followed to ensure that the roof maintains structural and hygrothermal integrity.
Reducing duct surface area is currently a compliance option, but has not been widely used because of the difficulty and time required for documentation and verification. The procedure for demonstrating compliance may become easier to perform if HVAC system designs are more integral pieces of the overall building design. There are additional costs associated with HERS verification.
2.3.3 Field Verification and Diagnostic Testing
The DCS and HPA proposals will require field verification for some measures, some of which are in the current standards, including:
Duct leakage test: diagnostic testing; mandatory for all new construction
House pressurization test: diagnostic testing for compliance credit
Verified low leakage with ducts entirely in conditioned space: visual inspection and field diagnostics test that run a duct leakage test and house pressure test tougher for compliance credit
Field verification and diagnostic tests that do not currently exist, or will be modified in the standards include:
Roof deck insulation installation: to verify proper moisture management: field verification
Insulation and air sealing to make a mechanical closet be inside the conditioned space: add language to the compliance forms for Ducts Entirely in Conditioned Space and the Verified case
2.4 Issues Addressed During CASE Development Process The Statewide Statewide CASE Team solicited feedback from a variety of stakeholders when developing the code change proposal presented in this report. In addition to personal outreach to key stakeholders, the Statewide Statewide CASE Team conducted a public stakeholder meeting to discuss the proposals. The issues that were addressed during development of the code change proposal are summarized below.
2016 CASE Report – 2016-RES-ENV1-D Page 15
Moisture Management – stakeholders raised concerns about potential moisture issues of above or below roof deck insulation assemblies. Based on our review of studies15 and conversations with a number of home builders with implementation experience and insulation manufacturers (spray foam, blown-in fiberglass), the Statewide CASE Team concludes that solutions and precautions, including proper sealing and insulation installation are available to address the issue. See Sections 9.1.4 (DCS) and 9.2.1 (HPA) for additional details.
Fire Rating – Roofing product manufacturers raised concerns on how the inclusion of above deck insulation will void their products’ fire rating classifications. This is especially a concern for products used in Wildlife Urban Interface (WUI) regions, which require a Class A fire rating. The primary issue is that roof assemblies including above roof deck insulation (typically rigid foam board) have not yet been tested.
The Statewide CASE Team researched California’s building fire code and relevant sections of Building Mechanical Codes to investigate the issues. The team also collected information on insulation product fire rating requirements and extensive product specification searches. The team then engaged and discussed the issues with roofing and insulation manufacturers and the Office of the State Fire Marshal to discuss implications from the code change proposal. Per the Statewide CASE Team’s discussions with the roofing industry representative and the Office of the State Fire Marshal representative, application of above-deck insulation indeed affects the fire rating of the roof covering products. Even though the components of the roof assemblies (the insulation, the deck, the roof coverings) all meet their respective fire rating tests, further testing for certification purposes is required for roof coverings used in assemblies incorporating above-deck insulation products. See Section 13 for more information.
Ventilation for Roofing Products – Roofing manufacturers raised concerns that above-deck insulation physically prevents ventilation between the roof covering and deck below, causing the products to experience higher temperature and resulting in shorter product life. Through roof and insulation product research, review of ARMA literature recommendation and discussion with a roof manufacturer, the Team identified solutions to provide roof product ventilation when using above-deck insulation. Roofers may either use spacers (for asphalt shingles) or counter/elevated batten and other specialty products (for tile) to maintain the small gap to provide adequate ventilation under the roofing products. See Section 9.1.4 (DCS - Unvented Attic) and 9.2.1 (HPA) for more information.
Treatment and Test Requirement of Duct Leakage to Outside for DCS Strategies – There was concern that the duct leakage to outside test was too onerous to perform, and that most HVAC contractors and some HERS raters may find it hard to perform. This test is required and preformed for taking the DCS package of placing ducts in conditioned space. It involves a simultaneous house pressurization and duct leakage test. This test will likely be performed by a
15 Literature with specific emphasis on moisture management reviewed by the CASE team included a number of Building
Science Corporation (BSC in appendix) reports with field and hygrothermal modeling results, technical bulletins from APA, SPFA, PIMA, as well as Building America’s Solution Center on Above-deck insulation.
2016 CASE Report – 2016-RES-ENV1-D Page 16
HERS rater because, according to industry interviews, most HVAC contractors do not have a house pressurization in their possession.
Use of Sealed Combustion Furnace – There was a concern that the requirement to place ducts into conditioned space (as part of the DCS strategy with vented attics) is federally pre-empted because it will require sealed combustion. Currently, sealed combustion furnaces are not widely installed because placing equipment in conditioned space is not common. The majority of products available are also condensing units and exceed the 80% AFUE set as the minimum in Title 20. The Statewide CASE Team proposed for DCS to be an alternative prescriptive path to the HPA package so to steer clear of pre-emption concerns. See details in Section 3.1.1.
2016 CASE Report – 2016-RES-ENV1-D Page 17
3. MARKET ANALYSIS The Statewide Statewide CASE Team performed a market analysis with the goals of identifying current technology availability, current product availability, and market trends. The Statewide Statewide CASE Team considered how the proposed standard may impact the market in general and individual market players. The Statewide Statewide CASE Team gathered information about the incremental cost of complying with the proposed measure. Estimates of market size and measure applicability were identified through research and outreach with key stakeholders including utility program staff, CEC, and a wide range of industry players who were invited to participate in a public stakeholder meeting that the Statewide Statewide CASE Team held in May 2014.
3.1 Market Structure It is important to note that almost every Zero Net Energy (ZNE) or ZNE-capable or near-ZNE building designed and constructed in the state has included one or the other option for DCS/HPA. In this section, we identify the available products for achieving these strategies and the principal manufacturers/suppliers. The market structure descriptions demonstrate that these design strategies are achievable and products available from multiple providers. Discussions on market penetrations of these strategies and measures and viabilities are included later in the report, in Section 3.2 titled Market Availability and Current Practices.
3.1.1 Ducts in Conditioned Space (DCS)
DCS is primarily a design strategy that is achieved in the field through a set of construction techniques. Successful examples have been demonstrated through California’s builder experience, California High Performance (CAHP) building programs and utility Emerging Technology projects. DCS as discussed in this report involves having both ducts and air handler within the building’s thermal envelope or keep them out of unconditioned attics. There are several methods of achieving the design intent of the DCS approach as outlined in this section, which allows a homebuilder to select a method that works best with their design and construction practices.
Vented Attic Strategies
Vented attic strategies for installing ducts in conditioned space include the use of dropped ceiling, or the use of conditioned plenum space, or the use of open floor truss. The first two strategies involve additional framing, drywall and sealing needs depending on the “new space” for duct runs and whether it is above or below the ceiling plane. Scissor truss or plenum trusses can be used to create the furred-out conditioned plenum. Major manufacturers of trusses include national companies Alpine and MiTek as well as various regional companies. Construction materials associated with implemented these two strategies are widely used in residential new homes today.
Open-web floor trusses are commonly available component in residential construction from floor joist manufacturers such as RedBuilt, TrimJoist, SpaceJoist and Open Joist.
2016 CASE Report – 2016-RES-ENV1-D Page 18
Use of vented attic DCS strategies would require placement of furnace in conditioned space as well which can be done in various ways depending on the dwelling floor plan.
Unvented Attic Strategies
Implementation of an unvented attic involves installation of roof deck insulation products and sealing the interior space to roof junction. A wide variety of roof deck insulation products are available; names of manufacturers organized by their product types are presented in Table 12 and Table 13.
Since the primary insulation layer in a building with unvented attic is at the roof deck, below-deck spray polyurethane foam is typically used to achieve the higher insulation value needed. However, unvented attic construction can also utilize a combination of above- and below-deck insulation at the roof deck. Even though a unvented attic construction allows the ducts and equipment to remain in the attic space, it would require a sealed combustion furnace.
Sealed Combustion Furnaces in Conditioned Space
Part of the DCS strategy includes placing equipment in conditioned space. Some builders are using a hot water coil in an air handler for heating because furnace capacities are too large. The system known as “combined hydronic” since the same water heater is used for both heating and domestic hot water. This approach meets the “in conditioned space” requirement by being in an indoor location. With the use of a furnace this could be accomplished by housing equipment in dedicated mechanical closets within the thermal boundary of the building or in a sealed (or unvented) attics. If a gas furnace is installed within conditioned space, it must be a sealed combustion furnace which takes no combustion air from the indoors.
Currently, the majority (~95%) of sealed combustion furnaces are condensing units (AHRI Directory of Certified Products, accessed April 2014).
The Statewide CASE Team utilized the certified product database hosted by AHRI website to assess the prevalence of qualifying furnaces on the market. The results are shown in Table 11. In summary, almost 90% of all available furnaces are gas powered. Of the gas furnaces, non-condensing models account for 68%, and “direct vent” (the database’s equivalent to “sealed combustion) models account for 33%. A review of the current AHRI database showed that there are limited manufacturers and numbers of models of sealed combustion gas furnaces –2 manufacturers, each with 6 models (distinct model numbers) – at the minimum AFUE.
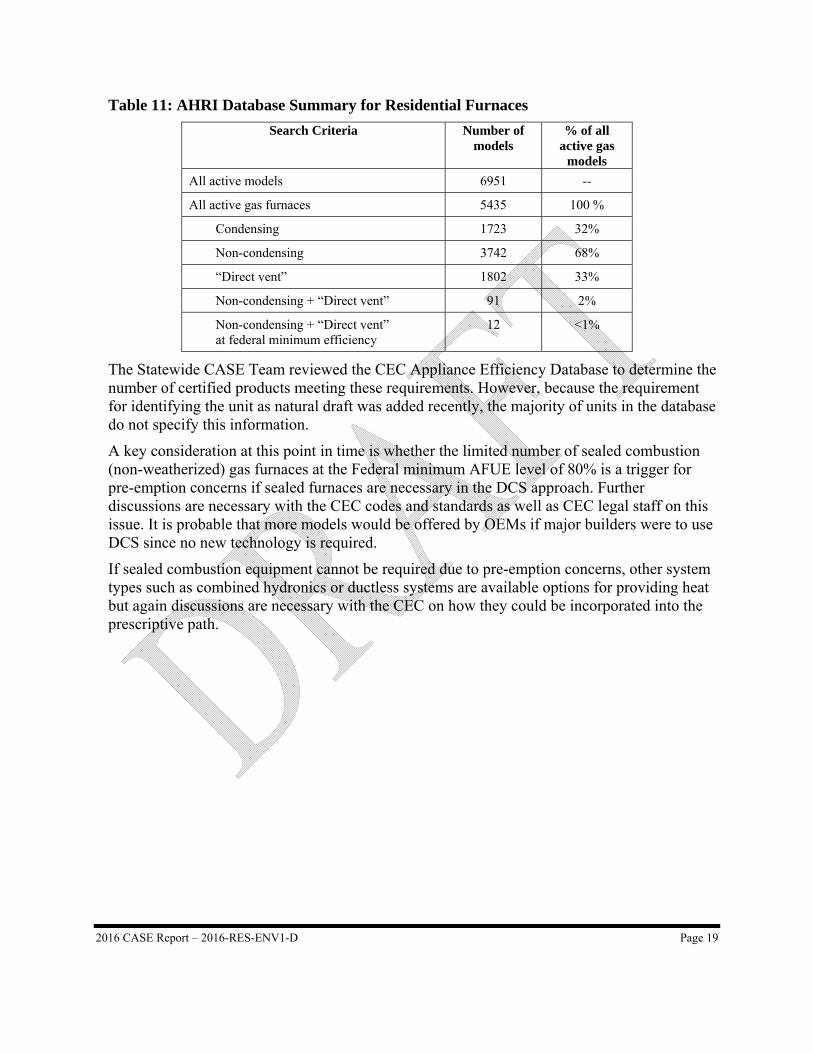
2016 CASE Report – 2016-RES-ENV1-D Page 19
Table 11: AHRI Database Summary for Residential Furnaces
Search Criteria Number of models
% of all active gas
models
All active models 6951 --
All active gas furnaces 5435 100 %
Condensing 1723 32%
Non-condensing 3742 68%
“Direct vent” 1802 33%
Non-condensing + “Direct vent” 91 2%
Non-condensing + “Direct vent” at federal minimum efficiency
12 <1%
The Statewide CASE Team reviewed the CEC Appliance Efficiency Database to determine the number of certified products meeting these requirements. However, because the requirement for identifying the unit as natural draft was added recently, the majority of units in the database do not specify this information.
A key consideration at this point in time is whether the limited number of sealed combustion (non-weatherized) gas furnaces at the Federal minimum AFUE level of 80% is a trigger for pre-emption concerns if sealed furnaces are necessary in the DCS approach. Further discussions are necessary with the CEC codes and standards as well as CEC legal staff on this issue. It is probable that more models would be offered by OEMs if major builders were to use DCS since no new technology is required.
If sealed combustion equipment cannot be required due to pre-emption concerns, other system types such as combined hydronics or ductless systems are available options for providing heat but again discussions are necessary with the CEC on how they could be incorporated into the prescriptive path.
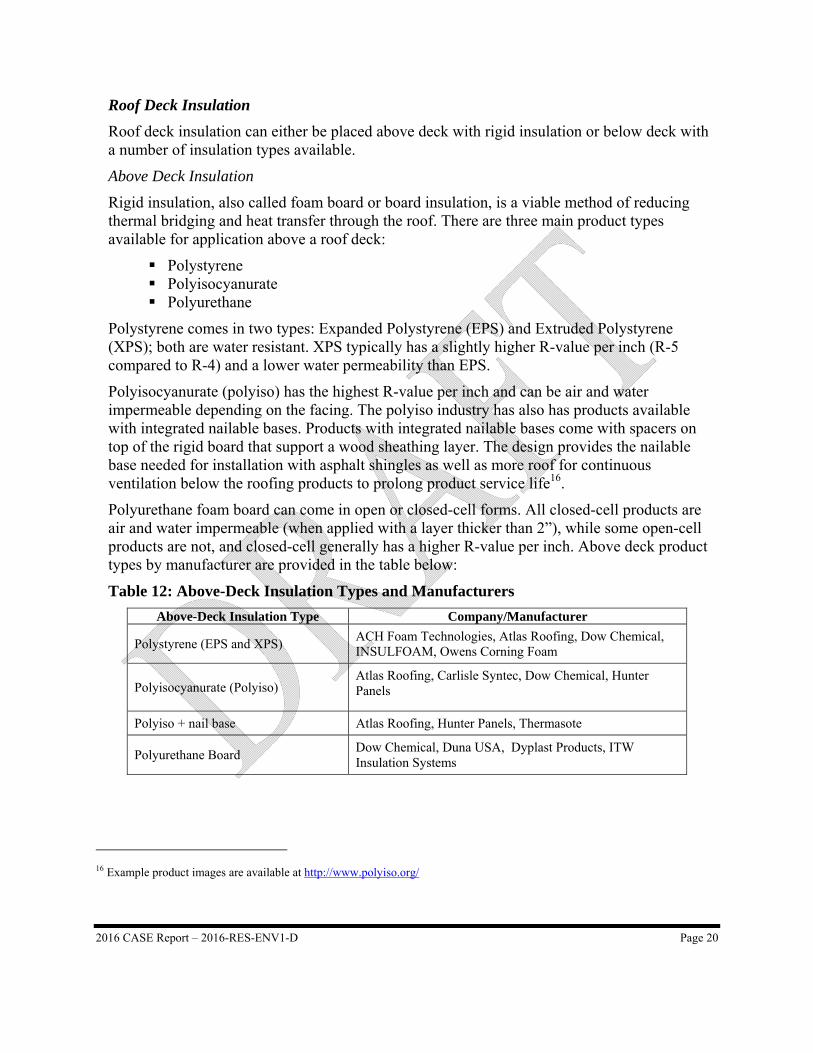
2016 CASE Report – 2016-RES-ENV1-D Page 20
Roof Deck Insulation
Roof deck insulation can either be placed above deck with rigid insulation or below deck with a number of insulation types available.
Above Deck Insulation
Rigid insulation, also called foam board or board insulation, is a viable method of reducing thermal bridging and heat transfer through the roof. There are three main product types available for application above a roof deck:
Polystyrene Polyisocyanurate Polyurethane
Polystyrene comes in two types: Expanded Polystyrene (EPS) and Extruded Polystyrene (XPS); both are water resistant. XPS typically has a slightly higher R-value per inch (R-5 compared to R-4) and a lower water permeability than EPS.
Polyisocyanurate (polyiso) has the highest R-value per inch and can be air and water impermeable depending on the facing. The polyiso industry has also has products available with integrated nailable bases. Products with integrated nailable bases come with spacers on top of the rigid board that support a wood sheathing layer. The design provides the nailable base needed for installation with asphalt shingles as well as more roof for continuous ventilation below the roofing products to prolong product service life16.
Polyurethane foam board can come in open or closed-cell forms. All closed-cell products are air and water impermeable (when applied with a layer thicker than 2”), while some open-cell products are not, and closed-cell generally has a higher R-value per inch. Above deck product types by manufacturer are provided in the table below:
Table 12: Above-Deck Insulation Types and Manufacturers
Above-Deck Insulation Type Company/Manufacturer
Polystyrene (EPS and XPS) ACH Foam Technologies, Atlas Roofing, Dow Chemical, INSULFOAM, Owens Corning Foam
Polyisocyanurate (Polyiso) Atlas Roofing, Carlisle Syntec, Dow Chemical, Hunter Panels
Polyiso + nail base Atlas Roofing, Hunter Panels, Thermasote
Polyurethane Board Dow Chemical, Duna USA, Dyplast Products, ITW Insulation Systems
16 Example product images are available at http://www.polyiso.org/
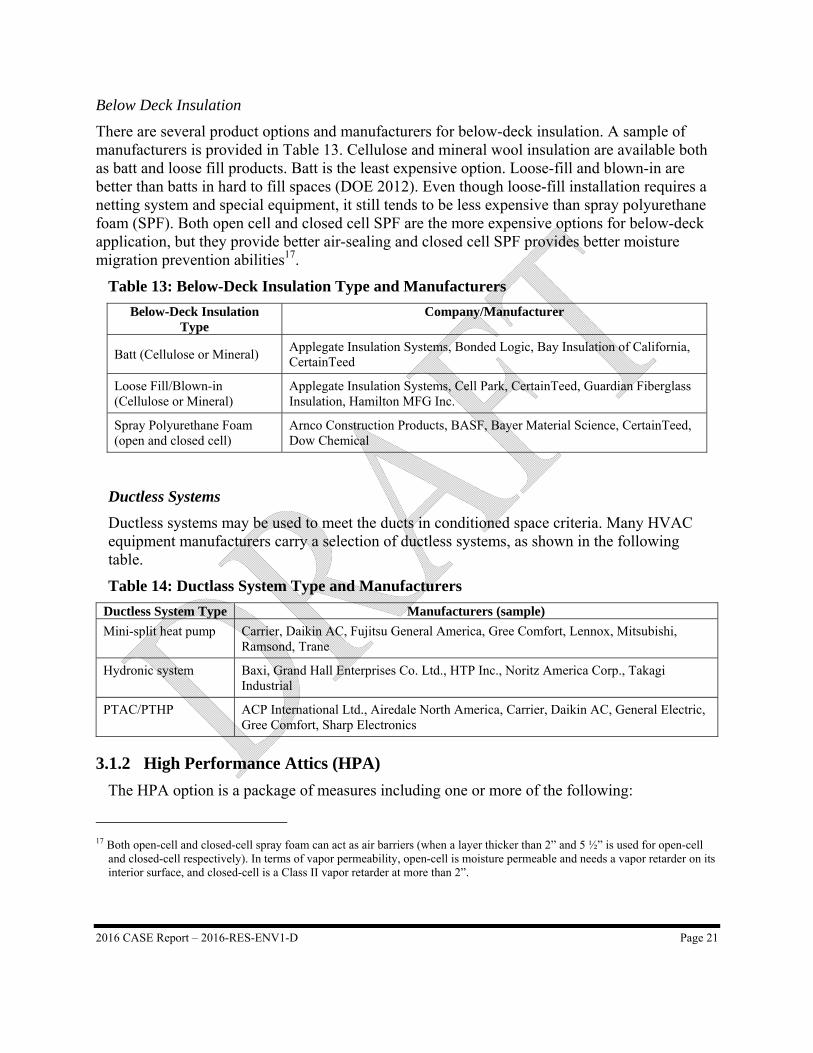
2016 CASE Report – 2016-RES-ENV1-D Page 21
Below Deck Insulation
There are several product options and manufacturers for below-deck insulation. A sample of manufacturers is provided in Table 13. Cellulose and mineral wool insulation are available both as batt and loose fill products. Batt is the least expensive option. Loose-fill and blown-in are better than batts in hard to fill spaces (DOE 2012). Even though loose-fill installation requires a netting system and special equipment, it still tends to be less expensive than spray polyurethane foam (SPF). Both open cell and closed cell SPF are the more expensive options for below-deck application, but they provide better air-sealing and closed cell SPF provides better moisture migration prevention abilities17.
Table 13: Below-Deck Insulation Type and Manufacturers
Below-Deck Insulation Type
Company/Manufacturer
Batt (Cellulose or Mineral) Applegate Insulation Systems, Bonded Logic, Bay Insulation of California, CertainTeed
Loose Fill/Blown-in (Cellulose or Mineral)
Applegate Insulation Systems, Cell Park, CertainTeed, Guardian Fiberglass Insulation, Hamilton MFG Inc.
Spray Polyurethane Foam (open and closed cell)
Arnco Construction Products, BASF, Bayer Material Science, CertainTeed, Dow Chemical
Ductless Systems
Ductless systems may be used to meet the ducts in conditioned space criteria. Many HVAC equipment manufacturers carry a selection of ductless systems, as shown in the following table.
Table 14: Ductlass System Type and Manufacturers
Ductless System Type Manufacturers (sample)
Mini-split heat pump Carrier, Daikin AC, Fujitsu General America, Gree Comfort, Lennox, Mitsubishi, Ramsond, Trane
Hydronic system Baxi, Grand Hall Enterprises Co. Ltd., HTP Inc., Noritz America Corp., Takagi Industrial
PTAC/PTHP ACP International Ltd., Airedale North America, Carrier, Daikin AC, General Electric, Gree Comfort, Sharp Electronics
3.1.2 High Performance Attics (HPA)
The HPA option is a package of measures including one or more of the following:
17 Both open-cell and closed-cell spray foam can act as air barriers (when a layer thicker than 2” and 5 ½” is used for open-cell
and closed-cell respectively). In terms of vapor permeability, open-cell is moisture permeable and needs a vapor retarder on its interior surface, and closed-cell is a Class II vapor retarder at more than 2”.
2016 CASE Report – 2016-RES-ENV1-D Page 22
Roof deck insulation: above or below deck Increase duct insulation Lower duct leakage rate Raised Heel Trusses or Extension Trusses Reduce Duct Surface Area
Roof Deck Insulation
Please refer to discussion of roof deck insulation products in Section 3.1.1.
Increased Duct Insulation
Duct insulation is integrated with flex ducts; the designer specifies the insulation value, and then the ducts are manufactured and brought on-site. Manufacturers supply distributors with duct insulation products, which are then available to HVAC contractors who stock the products for use on job sites.
Ducts are then placed into the home with insulation already included. Multiple industry experts stated that the R-8 ducts are difficult for contractors to place because they are less maneuverable than ducts with R-6 insulation so there may some impacts on installation time and thus labor costs.
Reduced Duct Leakage
Current Title 24 standards require a maximum duct leakage of 6% as verified by a HERS rater test. HERS duct leakage testing, using a Duct Blaster™, is common practice and has been used prior to the 2013 standards to achieve compliance credit (2013 Title 24 made this a mandatory measure). This proposal would require a verified leakage rate lower than 6% - potentially 4% or 5% depending on the results of the cost-effectiveness analysis.
Input from five high performance building experts, including HERS raters, energy consultants and builders, note that to get to 4% or lower total leakage rate a factory-sealed low leakage air handling Unit (LLAH) and/or performing sealing tasks is required. This is because in general LLAH lowers the duct leakage level by roughly 2%.
Currently, a “LLAH verification and sealed and tested duct system” compliance credit is available for the 2013 Title 24 Standards. The 2013 changes to JA9.2, the leakage rate for a low leakage handler was modified to 1.4% at a total external static pressure of 0.5 inch of water column (IWC). Air handler manufacturers will have to certify their equipment to the new standard for submission and admission into the CEC databases.
Reduce Supply Duct Surface Area (Duct Design/Layout)
Designing ducts according to ACCA Manual D is performed as part of the HVAC design process. The duct layout and sizing schedule are included on the construction documents. Although duct systems are designed and included in the construction documents, most HVAC contractors may not always follow the plans. Ductwork is typically installed wherever it fits, with little reference made to the drawn plans or awareness to the length and placement of duct runs. The goal of this proposal is to promote efficient duct designs, including elements such as
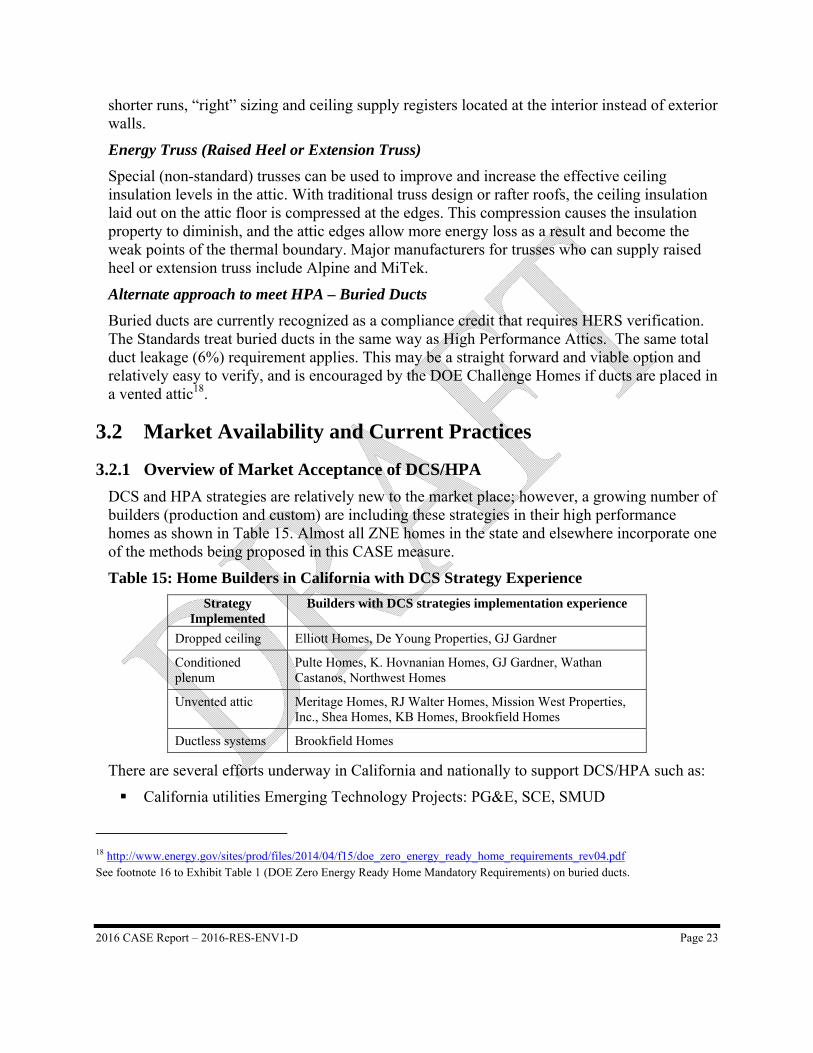
2016 CASE Report – 2016-RES-ENV1-D Page 23
shorter runs, “right” sizing and ceiling supply registers located at the interior instead of exterior walls.
Energy Truss (Raised Heel or Extension Truss)
Special (non-standard) trusses can be used to improve and increase the effective ceiling insulation levels in the attic. With traditional truss design or rafter roofs, the ceiling insulation laid out on the attic floor is compressed at the edges. This compression causes the insulation property to diminish, and the attic edges allow more energy loss as a result and become the weak points of the thermal boundary. Major manufacturers for trusses who can supply raised heel or extension truss include Alpine and MiTek.
Alternate approach to meet HPA – Buried Ducts
Buried ducts are currently recognized as a compliance credit that requires HERS verification. The Standards treat buried ducts in the same way as High Performance Attics. The same total duct leakage (6%) requirement applies. This may be a straight forward and viable option and relatively easy to verify, and is encouraged by the DOE Challenge Homes if ducts are placed in a vented attic18.
3.2 Market Availability and Current Practices
3.2.1 Overview of Market Acceptance of DCS/HPA
DCS and HPA strategies are relatively new to the market place; however, a growing number of builders (production and custom) are including these strategies in their high performance homes as shown in Table 15. Almost all ZNE homes in the state and elsewhere incorporate one of the methods being proposed in this CASE measure.
Table 15: Home Builders in California with DCS Strategy Experience
Strategy Implemented
Builders with DCS strategies implementation experience
Dropped ceiling Elliott Homes, De Young Properties, GJ Gardner
Conditioned plenum
Pulte Homes, K. Hovnanian Homes, GJ Gardner, Wathan Castanos, Northwest Homes
Unvented attic Meritage Homes, RJ Walter Homes, Mission West Properties, Inc., Shea Homes, KB Homes, Brookfield Homes
Ductless systems Brookfield Homes
There are several efforts underway in California and nationally to support DCS/HPA such as:
California utilities Emerging Technology Projects: PG&E, SCE, SMUD
18 http://www.energy.gov/sites/prod/files/2014/04/f15/doe_zero_energy_ready_home_requirements_rev04.pdf See footnote 16 to Exhibit Table 1 (DOE Zero Energy Ready Home Mandatory Requirements) on buried ducts.
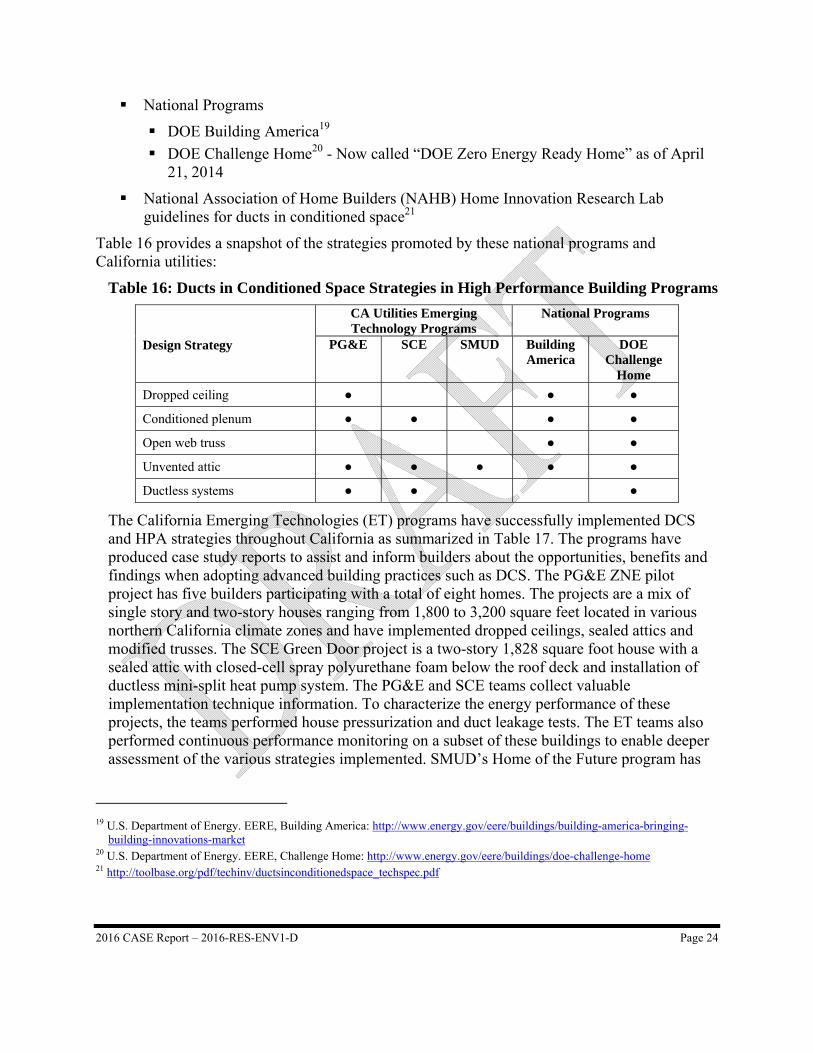
2016 CASE Report – 2016-RES-ENV1-D Page 24
National Programs
DOE Building America19
DOE Challenge Home20 - Now called “DOE Zero Energy Ready Home” as of April 21, 2014
National Association of Home Builders (NAHB) Home Innovation Research Lab guidelines for ducts in conditioned space21
Table 16 provides a snapshot of the strategies promoted by these national programs and California utilities:
Table 16: Ducts in Conditioned Space Strategies in High Performance Building Programs
Design Strategy
CA Utilities Emerging Technology Programs
National Programs
PG&E SCE SMUD Building America
DOE Challenge
Home
Dropped ceiling ● ● ●
Conditioned plenum ● ● ● ●
Open web truss ● ●
Unvented attic ● ● ● ● ●
Ductless systems ● ● ●
The California Emerging Technologies (ET) programs have successfully implemented DCS and HPA strategies throughout California as summarized in Table 17. The programs have produced case study reports to assist and inform builders about the opportunities, benefits and findings when adopting advanced building practices such as DCS. The PG&E ZNE pilot project has five builders participating with a total of eight homes. The projects are a mix of single story and two-story houses ranging from 1,800 to 3,200 square feet located in various northern California climate zones and have implemented dropped ceilings, sealed attics and modified trusses. The SCE Green Door project is a two-story 1,828 square foot house with a sealed attic with closed-cell spray polyurethane foam below the roof deck and installation of ductless mini-split heat pump system. The PG&E and SCE teams collect valuable implementation technique information. To characterize the energy performance of these projects, the teams performed house pressurization and duct leakage tests. The ET teams also performed continuous performance monitoring on a subset of these buildings to enable deeper assessment of the various strategies implemented. SMUD’s Home of the Future program has
19 U.S. Department of Energy. EERE, Building America: http://www.energy.gov/eere/buildings/building-america-bringing-
building-innovations-market 20 U.S. Department of Energy. EERE, Challenge Home: http://www.energy.gov/eere/buildings/doe-challenge-home 21 http://toolbase.org/pdf/techinv/ductsinconditionedspace_techspec.pdf
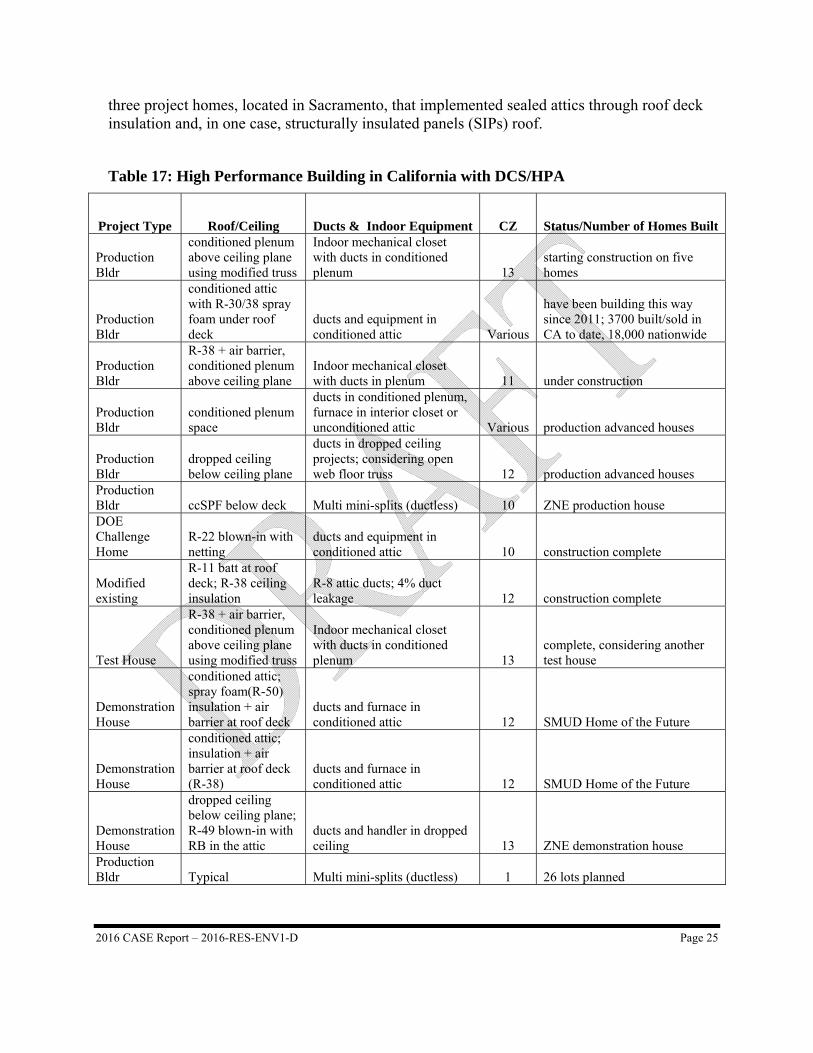
2016 CASE Report – 2016-RES-ENV1-D Page 25
three project homes, located in Sacramento, that implemented sealed attics through roof deck insulation and, in one case, structurally insulated panels (SIPs) roof.
Table 17: High Performance Building in California with DCS/HPA
Project Type Roof/Ceiling Ducts & Indoor Equipment CZ Status/Number of Homes Built
Production Bldr
conditioned plenum above ceiling plane using modified truss
Indoor mechanical closet with ducts in conditioned plenum 13
starting construction on five homes
Production Bldr
conditioned attic with R-30/38 spray foam under roof deck
ducts and equipment in conditioned attic Various
have been building this way since 2011; 3700 built/sold in CA to date, 18,000 nationwide
Production Bldr
R-38 + air barrier, conditioned plenum above ceiling plane
Indoor mechanical closet with ducts in plenum 11 under construction
Production Bldr
conditioned plenum space
ducts in conditioned plenum, furnace in interior closet or unconditioned attic Various production advanced houses
Production Bldr
dropped ceiling below ceiling plane
ducts in dropped ceiling projects; considering open web floor truss 12 production advanced houses
Production Bldr ccSPF below deck Multi mini-splits (ductless) 10 ZNE production house DOE Challenge Home
R-22 blown-in with netting
ducts and equipment in conditioned attic 10 construction complete
Modified existing
R-11 batt at roof deck; R-38 ceiling insulation
R-8 attic ducts; 4% duct leakage 12 construction complete
Test House
R-38 + air barrier, conditioned plenum above ceiling plane using modified truss
Indoor mechanical closet with ducts in conditioned plenum 13
complete, considering another test house
Demonstration House
conditioned attic; spray foam(R-50) insulation + air barrier at roof deck
ducts and furnace in conditioned attic 12 SMUD Home of the Future
Demonstration House
conditioned attic; insulation + air barrier at roof deck (R-38)
ducts and furnace in conditioned attic 12 SMUD Home of the Future
Demonstration House
dropped ceiling below ceiling plane; R-49 blown-in with RB in the attic
ducts and handler in dropped ceiling 13 ZNE demonstration house
Production Bldr Typical Multi mini-splits (ductless) 1 26 lots planned
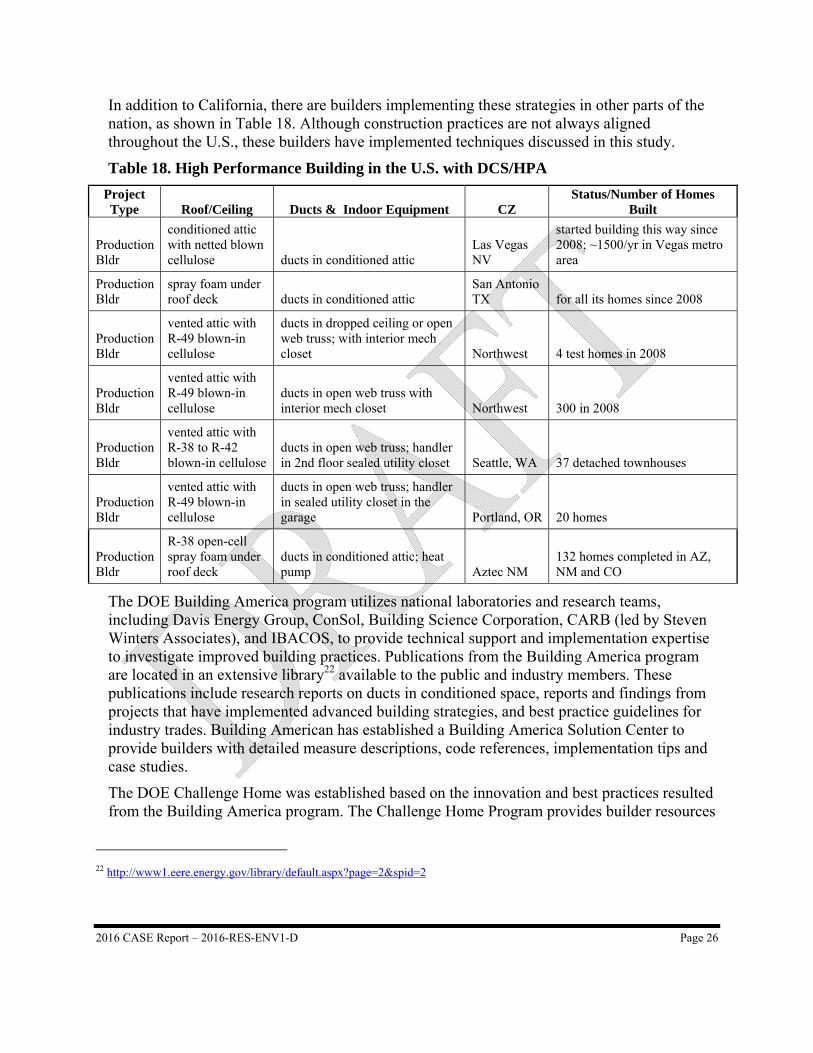
2016 CASE Report – 2016-RES-ENV1-D Page 26
In addition to California, there are builders implementing these strategies in other parts of the nation, as shown in Table 18. Although construction practices are not always aligned throughout the U.S., these builders have implemented techniques discussed in this study.
Table 18. High Performance Building in the U.S. with DCS/HPA
Project Type Roof/Ceiling Ducts & Indoor Equipment CZ
Status/Number of Homes Built
Production Bldr
conditioned attic with netted blown cellulose ducts in conditioned attic
Las Vegas NV
started building this way since 2008; ~1500/yr in Vegas metro area
Production Bldr
spray foam under roof deck ducts in conditioned attic
San Antonio TX for all its homes since 2008
Production Bldr
vented attic with R-49 blown-in cellulose
ducts in dropped ceiling or open web truss; with interior mech closet Northwest 4 test homes in 2008
Production Bldr
vented attic with R-49 blown-in cellulose
ducts in open web truss with interior mech closet Northwest 300 in 2008
Production Bldr
vented attic with R-38 to R-42 blown-in cellulose
ducts in open web truss; handler in 2nd floor sealed utility closet Seattle, WA 37 detached townhouses
Production Bldr
vented attic with R-49 blown-in cellulose
ducts in open web truss; handler in sealed utility closet in the garage Portland, OR 20 homes
Production Bldr
R-38 open-cell spray foam under roof deck
ducts in conditioned attic; heat pump Aztec NM
132 homes completed in AZ, NM and CO
The DOE Building America program utilizes national laboratories and research teams, including Davis Energy Group, ConSol, Building Science Corporation, CARB (led by Steven Winters Associates), and IBACOS, to provide technical support and implementation expertise to investigate improved building practices. Publications from the Building America program are located in an extensive library22 available to the public and industry members. These publications include research reports on ducts in conditioned space, reports and findings from projects that have implemented advanced building strategies, and best practice guidelines for industry trades. Building American has established a Building America Solution Center to provide builders with detailed measure descriptions, code references, implementation tips and case studies.
The DOE Challenge Home was established based on the innovation and best practices resulted from the Building America program. The Challenge Home Program provides builder resources
22 http://www1.eere.energy.gov/library/default.aspx?page=2&spid=2
2016 CASE Report – 2016-RES-ENV1-D Page 27
and trainings, including marketing materials and access to profiles and case studies from participating builders. Challenge Home provides the opportunity for innovative builders who are early adopters and pursue high performance strategies such as DCS to receive recognition for their commitment and efforts.
3.2.2 Multiple Options for Ducts in Conditioned Space and High Performance Attics
As identified in Section 3.2.1 there are multiple methods that have been tried, tested and used by various home builders across California as well as the rest of the nation. In Appendix B of this document, we provide details on these construction/design options and provide the potential pros and cons of the various options.
3.2.3 Need for Additional Training and Industry Support
Despite the increasing use of DCS design strategies, additional support to designers, builders, subcontractors (HVAC, insulation, drywall, etc.), site superintendents is needed including design guidelines, fact sheets, training classes, and informational materials. The placement of ducts in conditioned space requires planning and integration of the HVAC system with other building systems and components which is currently not common practice. It is essential to communicate the DCS plan from the beginning for successful implementation and avoidance of errors. In addition to coordination between designers and HVAC contractors, communication must occur with other building trades that might experience impacts to their routine schedules and installation practices. These trades will also require training to correctly implement these construction techniques. For instance, electricians and plumbers must be made aware of the HVAC design plans and where penetrations can and cannot be made. In order to ensure plans and direction are followed, additional project oversight will be required.
The following are reports and best practice guidelines that provide insight and recommendations for trade coordination and design implementation from projects that have implemented DCS strategies, such as those listed above. A partial list of currently available (as of April 2014) resources is:
CEC 2003 Home Builders Guide to Ducts in Conditioned Space - http://www.energy.ca.gov/2003publications/CEC-500-2003-082/CEC-500-2003-082-A-16.PDF
CEC 2003 Residential Duct Placement: Market Barriers - http://www.energy.ca.gov/2003publications/CEC-500-2003-082/CEC-500-2003-082-A-30.PDF
DOE EERE Measure Guidelines: Summary of Interior Ducts in New Construction, Including an Efficient, Affordable Method to Install Fur-Down Interior Ducts - http://www.fsec.ucf.edu/en/publications/pdf/FSEC-RR-385-11.pdf
DOE Building America Solution Center - https://basc.pnnl.gov/
DuctsInside.org for Building with Ducts in Conditioned Spaces, 2011; a joint project by the DOE and Northwest Energy Efficiency Alliance (NEEA) - http://ductsinside.org/
2016 CASE Report – 2016-RES-ENV1-D Page 28
California IOUs provide classes and trainings that are available to audiences including builders, architects, HVAC contractors, HERS raters, building inspectors, and other audiences. Current classes and trainings available from various resources include:
PG&E’s Pacific Energy Center (PEC) and the Energy Training Center (ETC):
Introduction to ACCA Quality Installation Training Series: Manual J – Equipment Sizing & Selection; Manual D and Advanced Manual D – Duct Design
Go Ductless California, Try Mini-Splits!
SCE’s Energy Education Centers:
Zero Net Energy Homes – Design Fundamentals, Integrated Project Delivery, Enclosures and Assemblies, Mechanical Systems
3.3 Useful Life, Persistence, and Maintenance Field inspection and diagnostic tests where applicable help secure the energy savings from proposed measures. All of the measures proposed are assumed to last for the entire residential building lifetime of 30 years.
The methodology the Statewide Statewide CASE Team used to determine the costs associated with incremental maintenance costs, relative to existing conditions, is presented in Section 4.7.1. The incremental maintenance costs of the proposed code change are presented in Section 5.2.1.
3.4 Market Impacts and Economic Assessments
3.4.1 Impact on Builders
The proposed DCS strategies will require designers to alter practices to implement these design changes. Depending on the design, trades that will see the most impact include roofers, insulation installers, framers and HVAC contractors. There will be a learning curve to communicate the design intent, details and associated testing requirements for the whole construction team. There are substantial cost implications as well; details on implementation costs are provided in Section 5.2.1.
The proposed HPA measure, with the exception of roof deck insulation, does not significantly change current builder practices. For roof deck insulation, builders will likely have to develop new standard procedures to ensure the roof assemblies address fire rating and moisture management requirements.
3.4.2 Impact on Building Designers
The proposed DCS strategies does not require substantial changes to the design practices. The designers and architects would, as always, consider and integrate the HVAC equipment and layout into the house design. Enhanced coordination between designers and HVAC designer is needed for designs that include moving ducts into conditioned space. Currently, HVAC
2016 CASE Report – 2016-RES-ENV1-D Page 29
contractors are responsible for HVAC designs and layouts, but the system is not considered an integral component when planning the overall house design. Although there may be a modification in the design and planning process to focus around the HVAC system design, performing this step at the beginning of planning will minimize redesign and burden later in the construction process.
3.4.3 Impact on Occupational Safety and Health
The proposed code changes do not alter any existing federal, state, or local regulations pertaining to safety and health, including rules enforced by the California Department of Occupational Safety and Health (Cal/OSHA). All existing health and safety rules will remain in place. Complying with the proposed code change is not anticipated to have any impact on the safety or health occupants or those involved with the construction, commissioning, and ongoing maintenance of the building.
3.4.4 Impact on Building Owners and Occupants
If the proposed measures are implemented according to their design intent, the building and their systems should afford the occupants a more thermally comfortable living space. Since this measure is cost-effective, building owners who pay their energy bills are reducing their energy costs more than their mortgage costs are for the cost of the measure (i.e. there are experiencing net cost savings). For building occupants that are paying for their energy bills, since the measure saves more energy cost on a monthly basis than the measure costs on the mortgage as experiences by the building owner, the pass-through of added mortgage costs into rents is less than the energy cost savings experienced by occupants.
3.4.5 Impact on Retailers (including manufacturers and distributors)
The proposed DCS strategies may increase the demand for certain building products, such as various types of roof deck insulation, certified low-leakage air handlers and sealed combustion furnaces.
3.4.6 Impact on Energy Consultants
Energy consultants will continue to provide value by identifying and advising builders on design options and efficiency measures. Impact on energy consultants include understanding new prescriptive requirements and performance modeling rule sets.
3.4.7 Impact on Building Inspectors
Some of the proposed measures involve more detailed inspection process and time (i.e. reduced duct surface area), but none of the field verification aspects associated with proposed measures are new to the standards and how building officials conduct inspections.
2016 CASE Report – 2016-RES-ENV1-D Page 30
3.4.8 Impact on Statewide Employment
The proposed measures will increase the demand for trades with specific skills, knowledge and experience working with these strategies and products. Examples of the increase workforce demand, include:
HVAC contractor with design and installation experience with compact layout designs
Roofing contractors with above-deck rigid foam boards installation experience.
Insulation installers with roof deck product and procedures experience, including air sealing procedures for use of blow-in fiberglass below the roof deck and spray foam installers with appropriate certification.
Framing contactors with experience incorporating modified trusses, such as raised heel, scissor or plenum trusses.
3.5 Economic Impacts The proposed Title 24 code changes, including this measure, are expected to increase job creation, income, and investment in California. As a result of the proposed code changes, it is anticipated that less money will be sent out of state to fund energy imports, and local spending is expected to increase due to higher disposable incomes due to reduced energy costs.23 For instance, the statewide life cycle net present value of this measure is $151 million over the 30 year period of analysis. In other words, utility customers will have $151 million to spend elsewhere in the economy. In addition, more dollars will be spent in state on improving the energy efficiency of new residential buildings.
The economic impacts of energy efficiency in general (above and beyond this CASE initiative) are documented in several resources including the California Air Resources Board’s (CARB) Updated Economic Analysis of California’s Climate Change Scoping Plan, which compares the economic impacts of several scenario cases (CARB, 2010b). CARB include one case (Case 1) with a 33% renewable portfolio standard (RPS) and higher levels of energy efficiency compared to an alternative case (Case 4) with a 20% RPS and lower levels of energy efficiency. Gross state production (GSP)24, personal income, and labor demand were between 0.6% and 1.1% higher in the case with the higher RPS and more energy efficiency (CARB 2010b, Table 26). While CARB’s analysis does not report the benefits of energy efficiency and the RPS separately, we expect that the benefits of the package of measures are primarily due to energy efficiency. Energy efficiency measures are expected to reduce costs by $2,133 million annually (CARB 2008, pC-117) whereas the RPS implementation is expected to cost $1,782
23 Energy efficiency measures may result in reduced power plant construction, both in-state and out-of-state. These plants tend to
be highly capital-intensive and often rely on equipment produced out of state, thus we expect that displaced power plant spending will be more than off-set from job growth in other sectors in California.
24 GSP is the sum of all value added by industries within the state plus taxes on production and imports.
2016 CASE Report – 2016-RES-ENV1-D Page 31
million annually, not including the benefits of GHG and air pollution reduction (CARB 2008, pC-130).
Macro-economic analysis of past energy efficiency programs and forward-looking analysis of energy efficiency policies and investments similarly show the benefits to California’s economy of investments in energy efficiency (Roland-Holst 2008; UC Berkeley 2011).
3.5.1 Creation or Elimination of Jobs
CARB’s economic analysis of higher levels of energy efficiency and 33% RPS implementation estimates that this scenario would result in a 1.1% increase in statewide labor demand in 2020 compared to 20% RPS and lower levels of energy efficiency (CARB 2010b, Tables 26 and 27). CARB’s economic analysis also estimates a 1.3% increase in small business employment levels in 2020 (CARB 2010b, Table 32). The proposed CASE measure contributes energy savings and increases in labor demand associated with achieving the “higher levels of energy efficiency and RPS” scenario in CARB’s analysis.
3.5.2 Creation or Elimination of Businesses within California
CARB’s economic analysis of higher levels of energy efficiency and 33% RPS implementation (as described above) estimates that this scenario would result in 0.6% additional GSP in 2020 compared to 20% RPS and lower levels of energy efficiency (CARB 2010b, Table ES-2). We expect that higher GSP will drive additional business creation in California. In particular, local small businesses that spend a much larger proportion of revenue on energy than other businesses (CARB 2010b, Figures 13 and 14) should disproportionately benefit from lower energy costs due to energy efficiency standards. Increased labor demand, as noted earlier, is another indication of business creation.
Table 19 below shows California industries that are expected to receive the economic benefit of the proposed Title 24 code changes. It is anticipated that these industries will expand due to an increase in funding as a result of energy efficiency improvements. The list of industries is based on the industries that the University of California, Berkeley identified as being impacted by energy efficiency programs (UC Berkeley 2011 Table 3.8).25 This list provided below is an approximation of the industries that may receive benefit from the 2016 Title 24 code changes.
25 Table 3.8 of the UC Berkeley report includes industries that will receive benefits of a wide variety of efficiency interventions,
including Title 24 standards and efficiency programs. The authors of the UC Berkeley report did not know in 2011 which Title 24 measures would be considered for the 2016 adoption cycle, so the UC Berkeley report was likely conservative in their approximations of industries impacted by Title 24. Statewide CASE Team believes that industries impacted by utilities efficiency programs is a more realistic and reasonable proxy for industries potentially affected by upcoming Title 24 standards. Therefore, the table provided in this CASE Report includes the industries that are listed as benefiting from Title 24 and utility energy efficiency programs.
2016 CASE Report – 2016-RES-ENV1-D Page 32
Table 19: Industries Receiving Energy Efficiency Related Investment, by North American Industry Classification System (NAICS) Code
Industry NAICS Code Residential Building Construction 2361 Roofing Contractors 238160 Electrical Contractors 23821 Plumbing, Heating, and Air-Conditioning Contractors 23822 Insulation Contractors 23831 Asphalt Paving, Roofing, and Saturated Materials 32412 Manufacturing 32412 Ventilation, Heating, Air-Conditioning, & Commercial Refrigeration Equip. Manf. 3334 Building Inspection Services 541350
3.5.3 Competitive Advantages or Disadvantages for Businesses within California
California businesses would benefit from an overall reduction in energy costs. This could help California businesses gain competitive advantage over businesses operating in other states or countries and an increase in investment in California, as noted below.
3.5.4 Increase or Decrease of Investments in the State of California
CARB’s economic analysis indicate that higher levels of energy efficiency and 33% RPS will increase investment in California by about 3% in 2020 compared to 20% RPS and lower levels of energy efficiency (CARB 2010b Figures 7a and 10a). Overall, the proposed code change may bring forth further investment in the supply, distribution and sales channels of affected products. These include various types of roof deck insulation, ceiling insulation, drywall and air sealing products, certified low-leakage air handlers and sealed combustion furnaces.
3.5.5 Incentives for Innovation in Products, Materials, or Processes
Updating Title 24 standards will encourage innovation through the adoption of new technologies to better manage energy usage and achieve energy savings. The proposed DCS package will increase innovation both in terms of product as well as process. Increase in the envelope/HVAC energy performance requirement will drive innovation in insulation and HVAC system products, design practices and installation techniques. On the process level, the proposed codes changes will encourage enhanced coordination between trades in the field.
3.5.6 Effects on the State General Fund, State Special Funds and Local Governments
Higher property valuations due to energy efficiency enhancements may also result in positive local property tax revenues. The Statewide Statewide CASE Team has not obtained specific data to quantify potential revenue benefits for this measure.
2016 CASE Report – 2016-RES-ENV1-D Page 33
3.5.6.1 Cost of Enforcement
Cost to the State
State government has budget for code development, education, and compliance enforcement. While state government will be allocating resources to update the Title 24 standards, including updating education and compliance materials and responding to questions about the revised standards, these activities are already covered by existing state budgets. The proposed code change does not require increased level of enforcement efforts and resources. Thus the costs to state government are small when compared to the overall costs savings and policy benefits associated with the code change proposals. Also, the proporsed requirements only impact residential new constructions, and will have no impact on the costs of state buildings.
Cost to Local Governments
All revisions to Title 24 will result in changes to Title 24 compliance determinations. Local governments will need to train permitting staff on the revised Title 24 standards. While this re-training is an expense to local governments, it is not a new cost associated with the 2016 code change cycle. The building code is updated on a triennial basis, and local governments plan and budget for retraining every time the code is updated. There are numerous resources available to local governments to support compliance training that can help mitigate the cost of retraining. As noted earlier, although retraining is a cost of the revised standards, Title 24 energy efficiency standards are expected to increase economic growth and income with positive impacts on local revenue.
This standard would revise an existing measure without significantly affecting the complexity of this measure. Therefore, on-going costs are not expected to change significantly.
3.5.6.2 Impacts on Specific Persons
The proposed changes to Title 24 are not expected to have a differential impact on any of the following groups relative to the state population as a whole:
Migrant Workers
Persons by age
Persons by race
Persons by religion
Commuters
We expect that the proposed code changes for the 2016 Title 24 code change cycle would reduce energy costs and could put potential first-time homeowners in a better position to afford mortgage payments. On the other hand, homeowners may experience higher first costs to the extent that builders pass-through the increased costs of Title 24 compliance to home buyers. Some financial institutions have progressive policies that recognize that home buyers can

2016 CASE Report – 2016-RES-ENV1-D Page 34
better afford energy efficiency homes (even with a higher first cost) due to lower energy costs.26
Renters will typically benefit from lower energy bills if they pay energy bills directly. These savings should more than offset any capital costs passed-through from landlords. Renters who do not pay directly for energy costs may see more of less of the net savings based on how much landlords pass the energy cost savings on to renters.
On average, low-income families spend less on energy than higher income families, however lower income families spend a much larger portion of their incomes on energy (Roland-Holst 2008). Thus it seems reasonable that low-income families would disproportionately benefit from Title 24 standards that reduce residential energy costs.
26 For example, see US EPA’s Energy Star website for examples:
http://www.energystar.gov/index.cfm?fuseaction=new_homes_partners.showStateResults&s_code=CA.
2016 CASE Report – 2016-RES-ENV1-D Page 35
4. METHODOLOGY This section describes the methodology and approach the Statewide Statewide CASE Team used to estimate energy, demand, costs, and environmental impacts. The Statewide Statewide CASE Team calculated the impacts of the proposed code change by comparing existing conditions to the conditions if the proposed code change is adopted. This section of the CASE Report goes into more detail on the assumptions about the existing and proposed conditions, prototype buildings, and the methodology used to estimate energy, demand, cost, and environmental impacts.
4.1 Existing Conditions To assess the energy, demand, costs, and environmental impacts, the Statewide CASE Team compared current design practices to design practices that would comply with the proposed requirements. There are existing Title 24 standards requirements for some of the proposed measures and compliance modeling assumptions for duct location as well as all of the HPA measures.
The Statewide CASE Team used baseline models that are minimally compliant with the 2013 Title 24 requirements. This means that HVAC distribution ducts are placed 100% in vented attics for single-story buildings, and 65%/35% split between conditioned space and vented attic for buildings with two or more stories. Ceiling insulation is installed on the attic floor with radiant barrier application. Details of these values are shown in Section 2.2. These duct and system location and insulation parameters largely reflect current market practice.
4.2 Proposed Conditions The proposed conditions are defined as the design conditions that will comply with the proposed code change. Specifically, for DCS strategies the proposed code change will modify the distribution system default location within the compliance software.
For the HPA package, the proposed code changes will update the ceiling/roof insulation levels (and possibly assembly U-factor) requirement to reflect the addition of roof deck insulation. The requirement for radiant barrier will be removed for the baseline case with insulation below the roof deck because it does not make physical sense and is not practical to install radiant barrier below the below-deck insulation.
4.3 Prototype Building(s) Table 20 presents the details of the prototype building(s) used in the analysis.
Table 21 presents details on pertinent parameters for the CASE topic, per the ACM reference manual.
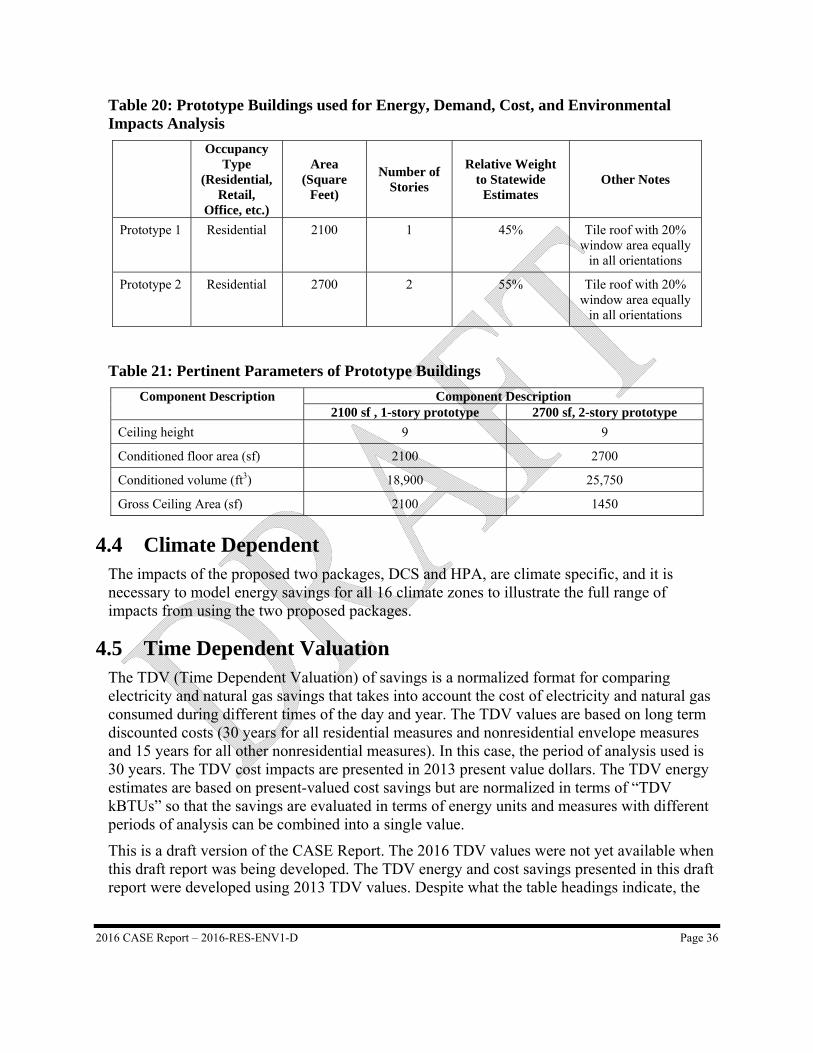
2016 CASE Report – 2016-RES-ENV1-D Page 36
Table 20: Prototype Buildings used for Energy, Demand, Cost, and Environmental Impacts Analysis
Occupancy Type
(Residential, Retail,
Office, etc.)
Area (Square
Feet)
Number of Stories
Relative Weight to Statewide
Estimates Other Notes
Prototype 1 Residential 2100 1 45% Tile roof with 20% window area equally
in all orientations
Prototype 2 Residential 2700 2 55% Tile roof with 20% window area equally
in all orientations
Table 21: Pertinent Parameters of Prototype Buildings
Component Description Component Description 2100 sf , 1-story prototype 2700 sf, 2-story prototype
Ceiling height 9 9
Conditioned floor area (sf) 2100 2700
Conditioned volume (ft3) 18,900 25,750
Gross Ceiling Area (sf) 2100 1450
4.4 Climate Dependent The impacts of the proposed two packages, DCS and HPA, are climate specific, and it is necessary to model energy savings for all 16 climate zones to illustrate the full range of impacts from using the two proposed packages.
4.5 Time Dependent Valuation The TDV (Time Dependent Valuation) of savings is a normalized format for comparing electricity and natural gas savings that takes into account the cost of electricity and natural gas consumed during different times of the day and year. The TDV values are based on long term discounted costs (30 years for all residential measures and nonresidential envelope measures and 15 years for all other nonresidential measures). In this case, the period of analysis used is 30 years. The TDV cost impacts are presented in 2013 present value dollars. The TDV energy estimates are based on present-valued cost savings but are normalized in terms of “TDV kBTUs” so that the savings are evaluated in terms of energy units and measures with different periods of analysis can be combined into a single value.
This is a draft version of the CASE Report. The 2016 TDV values were not yet available when this draft report was being developed. The TDV energy and cost savings presented in this draft report were developed using 2013 TDV values. Despite what the table headings indicate, the
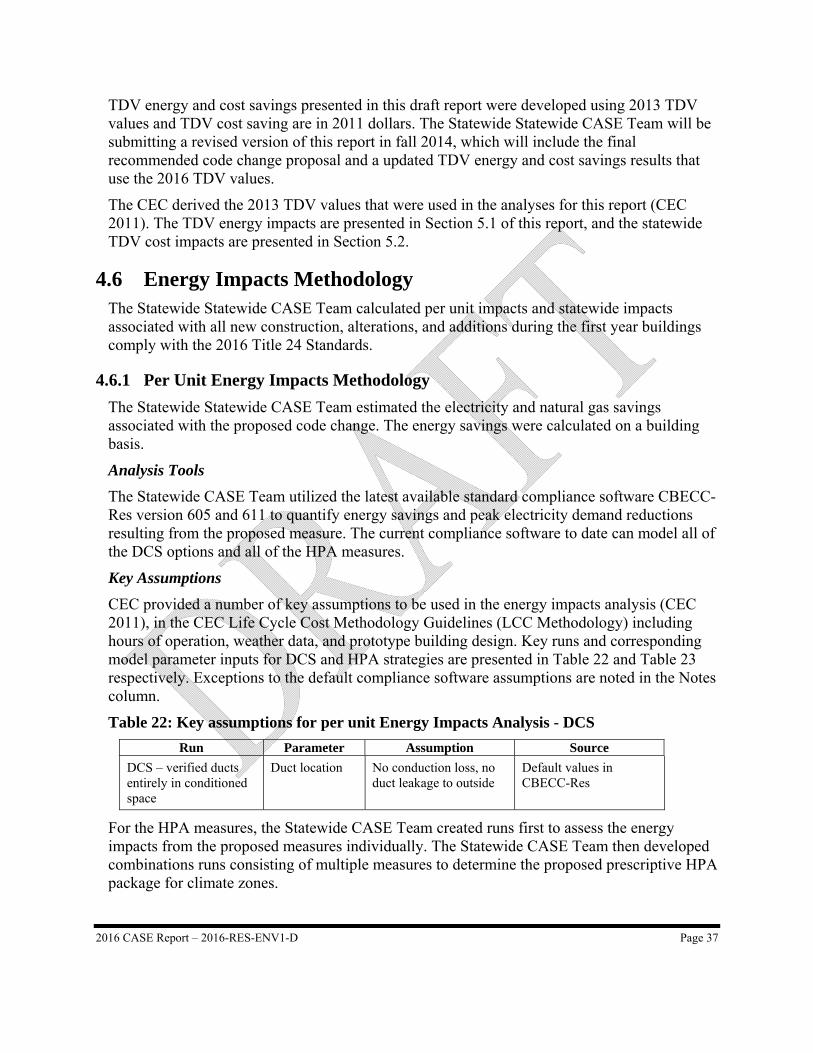
2016 CASE Report – 2016-RES-ENV1-D Page 37
TDV energy and cost savings presented in this draft report were developed using 2013 TDV values and TDV cost saving are in 2011 dollars. The Statewide Statewide CASE Team will be submitting a revised version of this report in fall 2014, which will include the final recommended code change proposal and a updated TDV energy and cost savings results that use the 2016 TDV values.
The CEC derived the 2013 TDV values that were used in the analyses for this report (CEC 2011). The TDV energy impacts are presented in Section 5.1 of this report, and the statewide TDV cost impacts are presented in Section 5.2.
4.6 Energy Impacts Methodology The Statewide Statewide CASE Team calculated per unit impacts and statewide impacts associated with all new construction, alterations, and additions during the first year buildings comply with the 2016 Title 24 Standards.
4.6.1 Per Unit Energy Impacts Methodology
The Statewide Statewide CASE Team estimated the electricity and natural gas savings associated with the proposed code change. The energy savings were calculated on a building basis.
Analysis Tools
The Statewide CASE Team utilized the latest available standard compliance software CBECC-Res version 605 and 611 to quantify energy savings and peak electricity demand reductions resulting from the proposed measure. The current compliance software to date can model all of the DCS options and all of the HPA measures.
Key Assumptions
CEC provided a number of key assumptions to be used in the energy impacts analysis (CEC 2011), in the CEC Life Cycle Cost Methodology Guidelines (LCC Methodology) including hours of operation, weather data, and prototype building design. Key runs and corresponding model parameter inputs for DCS and HPA strategies are presented in Table 22 and Table 23 respectively. Exceptions to the default compliance software assumptions are noted in the Notes column.
Table 22: Key assumptions for per unit Energy Impacts Analysis - DCS
Run Parameter Assumption Source
DCS – verified ducts entirely in conditioned space
Duct location No conduction loss, no duct leakage to outside
Default values in CBECC-Res
For the HPA measures, the Statewide CASE Team created runs first to assess the energy impacts from the proposed measures individually. The Statewide CASE Team then developed combinations runs consisting of multiple measures to determine the proposed prescriptive HPA package for climate zones.
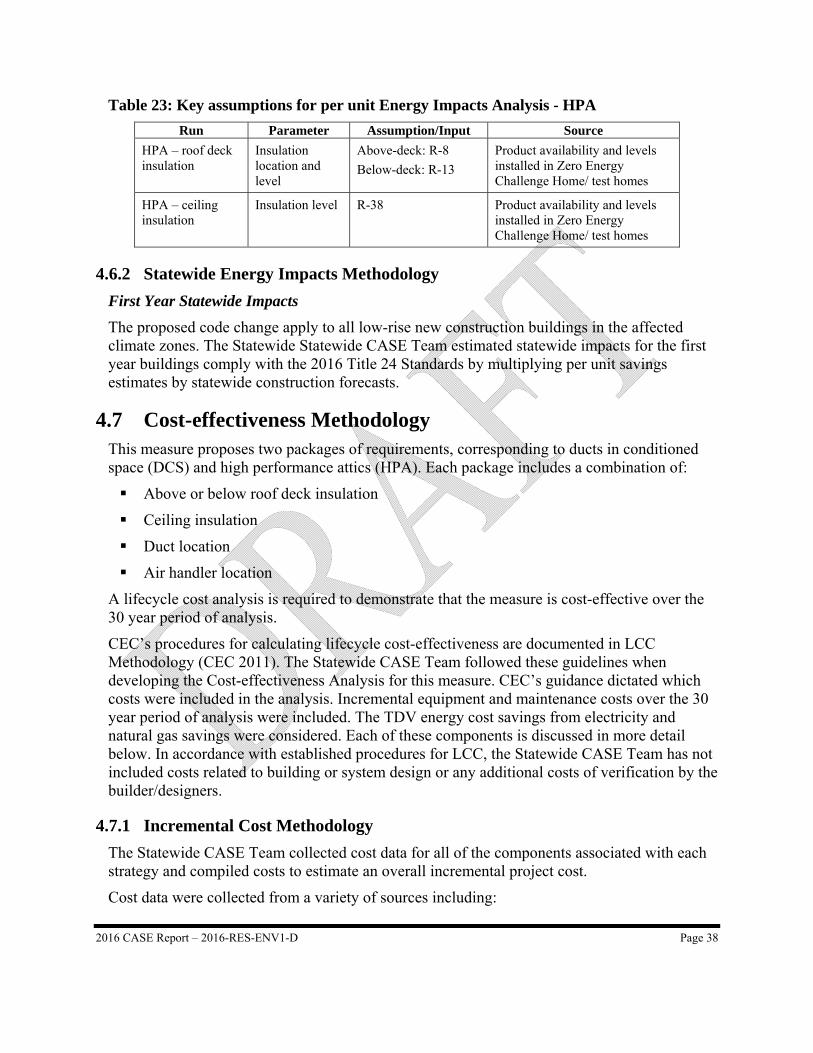
2016 CASE Report – 2016-RES-ENV1-D Page 38
Table 23: Key assumptions for per unit Energy Impacts Analysis - HPA
Run Parameter Assumption/Input Source
HPA – roof deck insulation
Insulation location and level
Above-deck: R-8
Below-deck: R-13
Product availability and levels installed in Zero Energy Challenge Home/ test homes
HPA – ceiling insulation
Insulation level R-38 Product availability and levels installed in Zero Energy Challenge Home/ test homes
4.6.2 Statewide Energy Impacts Methodology
First Year Statewide Impacts
The proposed code change apply to all low-rise new construction buildings in the affected climate zones. The Statewide Statewide CASE Team estimated statewide impacts for the first year buildings comply with the 2016 Title 24 Standards by multiplying per unit savings estimates by statewide construction forecasts.
4.7 Cost-effectiveness Methodology This measure proposes two packages of requirements, corresponding to ducts in conditioned space (DCS) and high performance attics (HPA). Each package includes a combination of:
Above or below roof deck insulation
Ceiling insulation
Duct location
Air handler location
A lifecycle cost analysis is required to demonstrate that the measure is cost-effective over the 30 year period of analysis.
CEC’s procedures for calculating lifecycle cost-effectiveness are documented in LCC Methodology (CEC 2011). The Statewide CASE Team followed these guidelines when developing the Cost-effectiveness Analysis for this measure. CEC’s guidance dictated which costs were included in the analysis. Incremental equipment and maintenance costs over the 30 year period of analysis were included. The TDV energy cost savings from electricity and natural gas savings were considered. Each of these components is discussed in more detail below. In accordance with established procedures for LCC, the Statewide CASE Team has not included costs related to building or system design or any additional costs of verification by the builder/designers.
4.7.1 Incremental Cost Methodology
The Statewide CASE Team collected cost data for all of the components associated with each strategy and compiled costs to estimate an overall incremental project cost.
Cost data were collected from a variety of sources including:
2016 CASE Report – 2016-RES-ENV1-D Page 39
Published product reports and presentations
Research reports and presentations
Survey results from IOU ET projects
Interviews with high performance building experts including HERS raters, energy consultants, builders, IOU residential new construction and emerging technology program managers, and building science experts.
Retailers in California including ‘big-box’ retail chains such as Home Depot and Lowes.
RS Means
Please see Appendix C: Cost Data Sources for a full list of data sources.
Overall, the Statewide CASE Team used best judgment with the data and qualitative input available to estimate incremental costs to implement the various strategies. The team assumed conservative estimates for incremental costs due to the variability and low number of data points. The incremental costs used in the analysis will likely be overestimates for actual implementation when the code takes effect in 2017. The Statewide CASE Team expects that not all builders will find all of the potential strategies cost-effective in all projects based on their practices, but there will be at least one strategy that will be cost-effective for a particular builder.
Both DCS and HPA strategies include a mix of additional construction and labor costs as well as material and labor savings. The strategies will likely result in temporary (short-term) increased labor costs for a learning curve while trades become better acquainted with implementing the design options.
Incremental Construction Cost Methodology
As requested by CEC, the Statewide CASE Team estimated the Current Incremental Construction Costs and Post-adoption Incremental Construction Costs. The Current Incremental Construction Cost (ΔCIC) represents the cost of the incremental cost of the measure if a building meeting the proposed standard were built today. The Post-adoption Incremental Construction Cost (ΔCIPA) represents the anticipated cost assuming full market penetration of the measure as a result of the new Standards, resulting in possible reduction in unit costs as manufacturing practices improve over time and with increased production volume of qualifying products the year the Standard becomes effective.
The Current Incremental Construction Cost is based on available cost data and qualitative input from several sources. The Statewide CASE Team considered both primary material and labor costs when determining the cost implications of the DCS and HPA strategies.
Material and labor costs were normalized to the 2100 and 2700 square foot CEC prototypes to compare cost points on the same scale. The best estimates for each component were selected based on the information available to provide a range of potential whole house incremental costs for each strategy.
DCS Strategies Costs
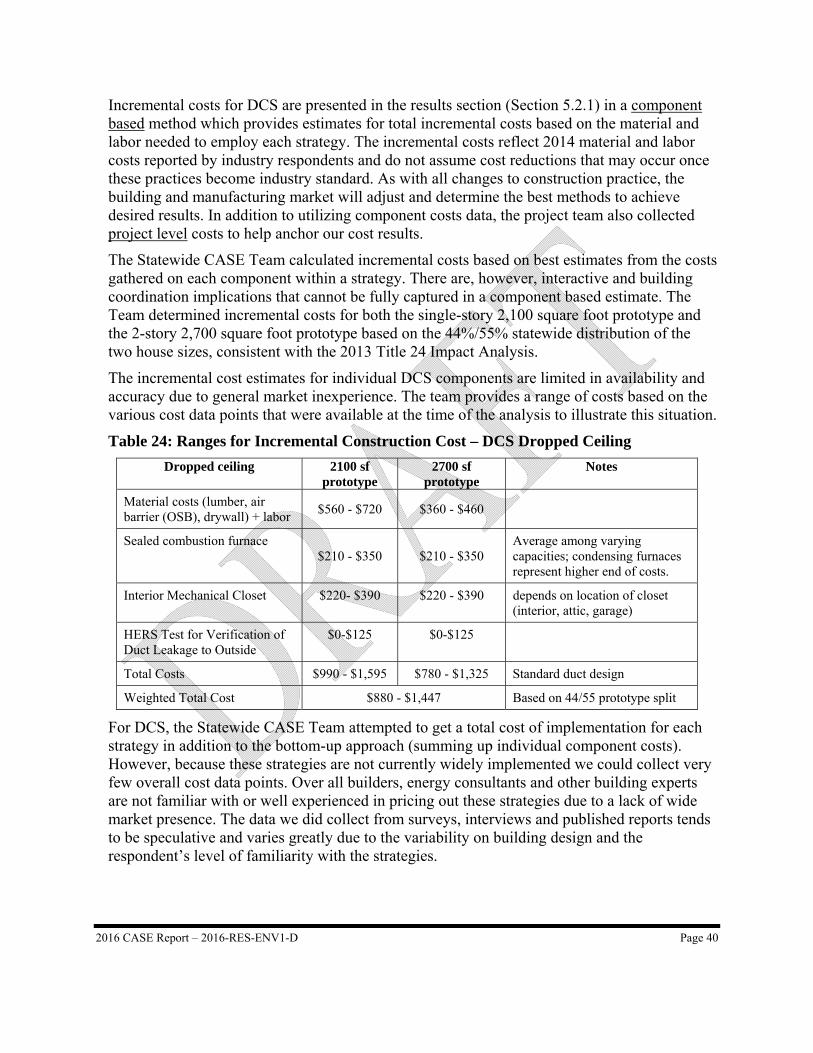
2016 CASE Report – 2016-RES-ENV1-D Page 40
Incremental costs for DCS are presented in the results section (Section 5.2.1) in a component based method which provides estimates for total incremental costs based on the material and labor needed to employ each strategy. The incremental costs reflect 2014 material and labor costs reported by industry respondents and do not assume cost reductions that may occur once these practices become industry standard. As with all changes to construction practice, the building and manufacturing market will adjust and determine the best methods to achieve desired results. In addition to utilizing component costs data, the project team also collected project level costs to help anchor our cost results.
The Statewide CASE Team calculated incremental costs based on best estimates from the costs gathered on each component within a strategy. There are, however, interactive and building coordination implications that cannot be fully captured in a component based estimate. The Team determined incremental costs for both the single-story 2,100 square foot prototype and the 2-story 2,700 square foot prototype based on the 44%/55% statewide distribution of the two house sizes, consistent with the 2013 Title 24 Impact Analysis.
The incremental cost estimates for individual DCS components are limited in availability and accuracy due to general market inexperience. The team provides a range of costs based on the various cost data points that were available at the time of the analysis to illustrate this situation.
Table 24: Ranges for Incremental Construction Cost – DCS Dropped Ceiling
Dropped ceiling 2100 sf prototype
2700 sf prototype
Notes
Material costs (lumber, air barrier (OSB), drywall) + labor
$560 - $720 $360 - $460
Sealed combustion furnace $210 - $350 $210 - $350
Average among varying capacities; condensing furnaces represent higher end of costs.
Interior Mechanical Closet $220- $390 $220 - $390 depends on location of closet (interior, attic, garage)
HERS Test for Verification of Duct Leakage to Outside
$0-$125 $0-$125
Total Costs $990 - $1,595 $780 - $1,325 Standard duct design
Weighted Total Cost $880 - $1,447 Based on 44/55 prototype split
For DCS, the Statewide CASE Team attempted to get a total cost of implementation for each strategy in addition to the bottom-up approach (summing up individual component costs). However, because these strategies are not currently widely implemented we could collect very few overall cost data points. Over all builders, energy consultants and other building experts are not familiar with or well experienced in pricing out these strategies due to a lack of wide market presence. The data we did collect from surveys, interviews and published reports tends to be speculative and varies greatly due to the variability on building design and the respondent’s level of familiarity with the strategies.
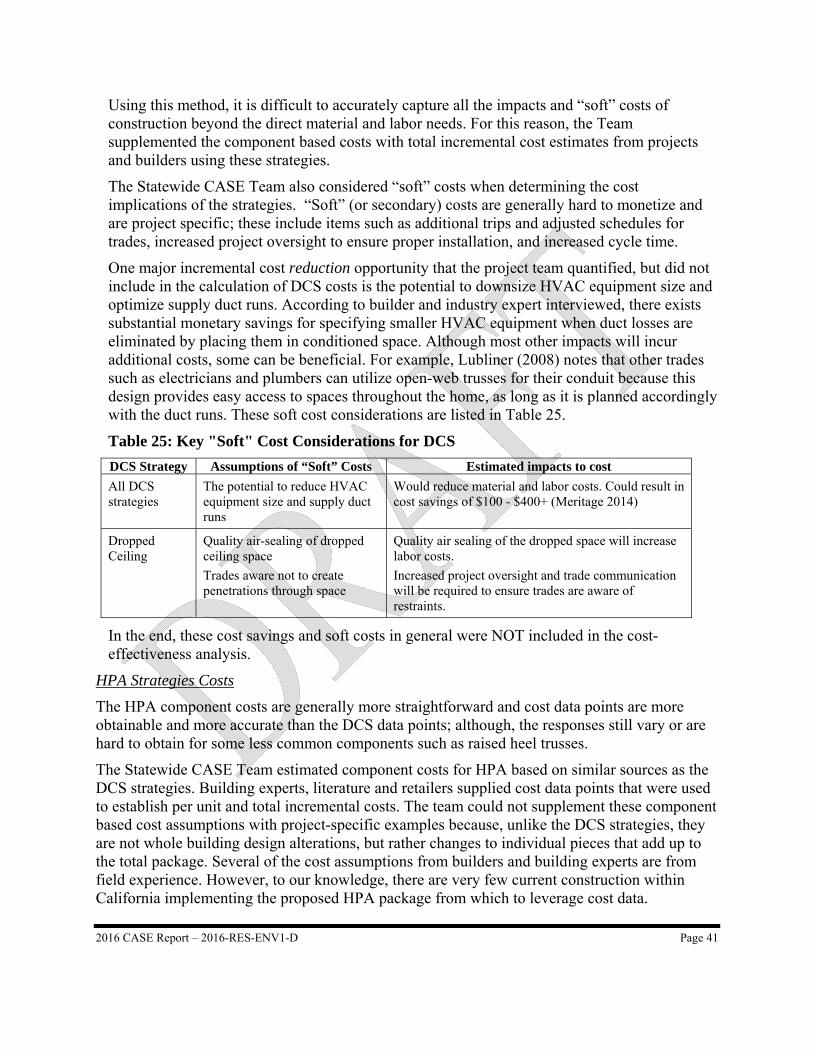
2016 CASE Report – 2016-RES-ENV1-D Page 41
Using this method, it is difficult to accurately capture all the impacts and “soft” costs of construction beyond the direct material and labor needs. For this reason, the Team supplemented the component based costs with total incremental cost estimates from projects and builders using these strategies.
The Statewide CASE Team also considered “soft” costs when determining the cost implications of the strategies. “Soft” (or secondary) costs are generally hard to monetize and are project specific; these include items such as additional trips and adjusted schedules for trades, increased project oversight to ensure proper installation, and increased cycle time.
One major incremental cost reduction opportunity that the project team quantified, but did not include in the calculation of DCS costs is the potential to downsize HVAC equipment size and optimize supply duct runs. According to builder and industry expert interviewed, there exists substantial monetary savings for specifying smaller HVAC equipment when duct losses are eliminated by placing them in conditioned space. Although most other impacts will incur additional costs, some can be beneficial. For example, Lubliner (2008) notes that other trades such as electricians and plumbers can utilize open-web trusses for their conduit because this design provides easy access to spaces throughout the home, as long as it is planned accordingly with the duct runs. These soft cost considerations are listed in Table 25.
Table 25: Key "Soft" Cost Considerations for DCS
DCS Strategy Assumptions of “Soft” Costs Estimated impacts to cost
All DCS strategies
The potential to reduce HVAC equipment size and supply duct runs
Would reduce material and labor costs. Could result in cost savings of $100 - $400+ (Meritage 2014)
Dropped Ceiling
Quality air-sealing of dropped ceiling space
Trades aware not to create penetrations through space
Quality air sealing of the dropped space will increase labor costs.
Increased project oversight and trade communication will be required to ensure trades are aware of restraints.
In the end, these cost savings and soft costs in general were NOT included in the cost-effectiveness analysis.
HPA Strategies Costs
The HPA component costs are generally more straightforward and cost data points are more obtainable and more accurate than the DCS data points; although, the responses still vary or are hard to obtain for some less common components such as raised heel trusses.
The Statewide CASE Team estimated component costs for HPA based on similar sources as the DCS strategies. Building experts, literature and retailers supplied cost data points that were used to establish per unit and total incremental costs. The team could not supplement these component based cost assumptions with project-specific examples because, unlike the DCS strategies, they are not whole building design alterations, but rather changes to individual pieces that add up to the total package. Several of the cost assumptions from builders and building experts are from field experience. However, to our knowledge, there are very few current construction within California implementing the proposed HPA package from which to leverage cost data.
2016 CASE Report – 2016-RES-ENV1-D Page 42
Incremental Maintenance Cost Methodology
According to the LCC Methodology (CEC 2011), incremental maintenance costs should be included in the lifecycle cost analysis. Upon review, the Statewide Statewide CASE Team determined that there is no incremental maintenance costs associated with the proposed code change.
The maintenance requirements associated with the code change proposal, relative to existing conditions, are described qualitatively in Section 3.2.2 of this report.
4.7.2 Cost Savings Methodology
Energy Cost Savings Methodology
The PV of the energy savings were calculated using the method described in the LCC Methodology (CEC 2011). In short, the hourly energy savings estimates for the first year of building operation were multiplied by the 2013 TDV cost values to arrive at the PV of the cost savings over the period of analysis. The standard TDV cost values of $xxx/TDV kBTU (TBD) was used to convert the energy savings into equivalent savings in 2014 dollars. The proposed two packages are weather sensitive, so the energy cost savings were calculated for each climate zone using climate zone specific TDV multipliers.
Other Cost Savings Methodology
As described previously in the subsection titled “DSC Soft Costs,” implementation of either of the proposed packages could bring forth the additional cost savings from downsizing HVAC equipment. However, the project team did not include the cost savings into the Cost-effectiveness analysis reported in this report. This CASE topic does not have other non-energy cost savings.
4.7.3 Cost-effectiveness Methodology
The Statewide Statewide CASE Team calculated the cost-effectiveness using the LCC Methodology (CEC 2011. According to CEC’s definitions, a measure is cost effective if it reduces overall lifecycle cost from the current base case (existing conditions). The LCC Methodology clarifies that absolute lifecycle cost of the proposed measure does not need to be calculated. Rather, it is necessary to calculate the change in lifecycle cost from the existing conditions to the proposed conditions.
If the change in lifecycle cost is negative then the measure is cost-effective, meaning that the present value of TDV energy savings is greater than the cost premium, or the proposed measure reduces the total lifecycle cost as compared to the existing conditions. Propane TDV costs are not used in the evaluation of energy efficiency measures.
The Planning Benefit to Cost (B/C) Ratio is another metric that can be used to evaluate cost-effectiveness. The B/C Ratio is calculated by dividing the total present value TDV energy cost savings (the benefit) by the present value of the total incremental cost (the cost). If the B/C
2016 CASE Report – 2016-RES-ENV1-D Page 43
Ratio is greater than 1.0 (i.e. the present valued benefits are greater than the present valued costs over the period of analysis), then the measure is cost effective.
4.8 Environmental Impacts Methodology
4.8.1 Greenhouse Gas Emissions Impacts Methodology
Greenhouse Gas Emissions Impacts Methodology
The Statewide Statewide CASE Team calculated avoided GHG emissions assuming an emission factor of 353 metric tons of carbon dioxide equivalents (MTCO2e) per GWh of electricity savings. As described in more detail in Appendix A, the electricity emission factor represents savings from avoided electricity generation and accounts for the GHG impacts if the state meets the Renewable Portfolio Standard (RPS) goal of 33 percent renewable electricity generation by 2020. Avoided GHG emissions from natural gas savings were calculated using an emission factor of 5,303 MTCO2e/million therms (U.S. EPA 2011).
Greenhouse Gas Emissions Monetization Methodology
The 2013 TDV cost values include the monetary value of avoided GHG emissions, so the Cost-effectiveness Analysis presented in Section 5.2 of this report does include the cost savings from avoided GHG emissions. The monetization for the TDV values includes permit (retail) cost of avoided GHG emissions, but it does not include the social costs of avoided emissions. As evident in the results of the Cost-effectiveness Analysis, the value of avoided GHG emissions is aggregated into the total TDV cost savings and the contribution of GHG emissions is not easily discernible. To demonstrate the value of avoided GHG emissions, the Statewide Statewide CASE Team disaggregated the value of avoided GHG emissions from the overall TDV cost savings value. The Statewide Statewide CASE Team will use the same monetary values that are used in the TDV factors, which was not available at the tiem of writing. The next version of this report will include the monetary value of carbon.
4.8.2 Material Impacts Methodology (Optional)
The project team did not develop material impact estimate.
4.8.3 Other Impacts Methodology
The project team did not quantify or develop other non-energy impacts associated with the proposed packages.
2016 CASE Report – 2016-RES-ENV1-D Page 44
5. ANALYSIS AND RESULTS Results from the energy, demand, cost, and environmental impacts analyses are presented in this section.
For both Ducts in Conditioned Space and High Performance Attics strategies, the project team derived cost-effectiveness results from
Energy cost savings from modeled building-level energy savings and Incremental first costs from various retail, project and industry resources.
Both the DCS strategies and the proposed HPA package may be used to achieve TDV energy savings on the level of 13 % in comparison to the baseline that is minimally compliant to the 2013 Standards. Contrary to common perception, it does not necessarily cost more to implement DCS strategies than the combination of selective measures for HPA.
Since the proposed measures are consisted of a combination of building envelope and HVAC distribution system design changes, the energy performance implications are highly climate dependent. The savings potential are much higher in cooling dominant climate zones (such as CZ 13-15) than the milder climate zones (such as CZ 1, 3 and 5). For examples, a building in CZ 13 Fresno implementing an HPA package with R-13 below deck insulation will yield electric savings of 330 kWh. This is more than ten times the electric energy savings from implementing the same package in CZ 1 Arcata with 29 kWh. The differences in themrs savings are not as large as electric savings. Thought both CZ 13 and 1 both have gas savings when implementing the proposed HPA package, CZ 1, with 33 therms savings, yields twice the gas therm savings.
5.1.1 Per Unit Energy Impacts Results
Due to the complexity of the proposed DCS strategies and HPA measures, the project team performed energy simulation runs for individual measures as well as measure combinations. The results presented in this section focus on the DCS strategies and HPA measure combinations that perform the best in terms of energy savings and their cost-effectiveness. In “creating” the proposed HPA package, the project team also took into consideration the measures’ physical compatibility with one another and feasibility of implementation.
Appendix D: Simulation Results Using CBECC-Res provides further details and discussions on savings results for individual DCS strategies and HPA measures. These results and discussions form the basis of our code proposal recommendations and provide explanations on nuances that are sometimes hard to detect between the wide variety of options to achieve DCS or HPA.
Per building energy and demand impacts of the proposed DCS and HPA measure are presented in Table 26 and Table 27 respectively. Weighted average per building savings for the first year are expected to be 194 kilowatt-hours per year (kWh/yr) and13.8 therms/year. Demand savings will be presented in the next version of this report. The intention of proposing two parallel
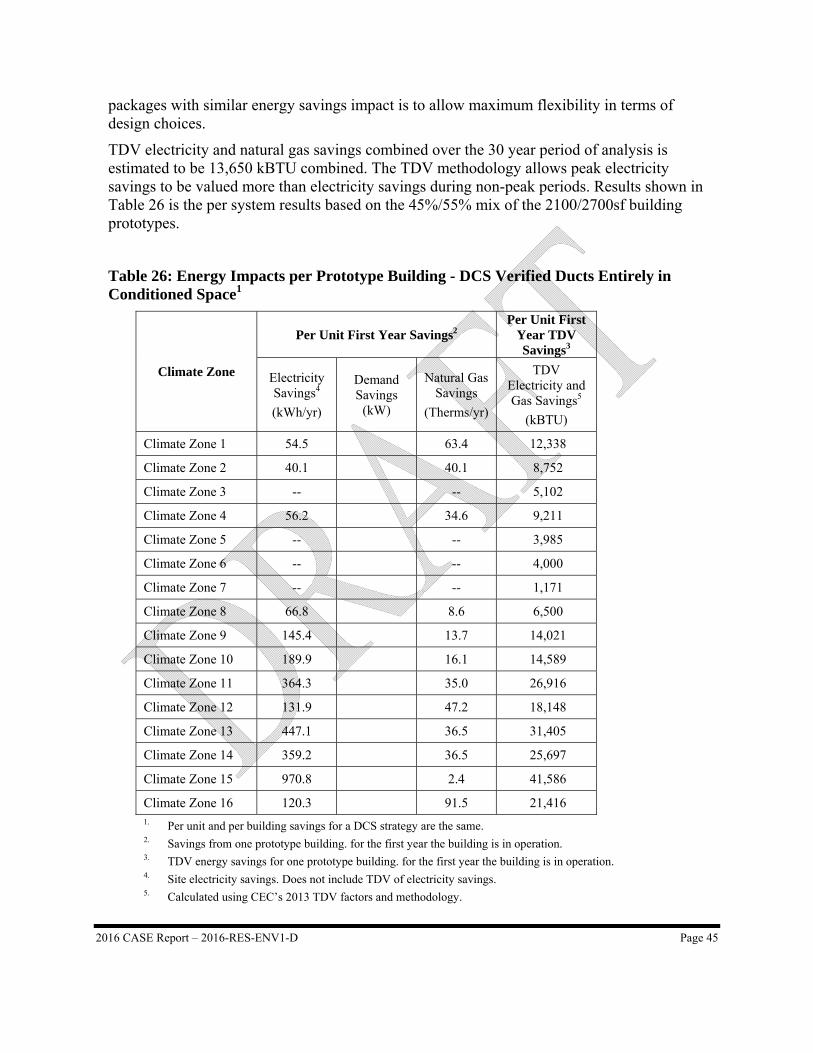
2016 CASE Report – 2016-RES-ENV1-D Page 45
packages with similar energy savings impact is to allow maximum flexibility in terms of design choices.
TDV electricity and natural gas savings combined over the 30 year period of analysis is estimated to be 13,650 kBTU combined. The TDV methodology allows peak electricity savings to be valued more than electricity savings during non-peak periods. Results shown in Table 26 is the per system results based on the 45%/55% mix of the 2100/2700sf building prototypes.
Table 26: Energy Impacts per Prototype Building - DCS Verified Ducts Entirely in Conditioned Space1
Climate Zone
Per Unit First Year Savings2 Per Unit First
Year TDV Savings3
Electricity Savings4
(kWh/yr)
Demand Savings
(kW)
Natural Gas Savings
(Therms/yr)
TDV Electricity and Gas Savings5
(kBTU)
Climate Zone 1 54.5 63.4 12,338
Climate Zone 2 40.1 40.1 8,752
Climate Zone 3 -- -- 5,102
Climate Zone 4 56.2 34.6 9,211
Climate Zone 5 -- -- 3,985
Climate Zone 6 -- -- 4,000
Climate Zone 7 -- -- 1,171
Climate Zone 8 66.8 8.6 6,500
Climate Zone 9 145.4 13.7 14,021
Climate Zone 10 189.9 16.1 14,589
Climate Zone 11 364.3 35.0 26,916
Climate Zone 12 131.9 47.2 18,148
Climate Zone 13 447.1 36.5 31,405
Climate Zone 14 359.2 36.5 25,697
Climate Zone 15 970.8 2.4 41,586
Climate Zone 16 120.3 91.5 21,416 1. Per unit and per building savings for a DCS strategy are the same. 2. Savings from one prototype building. for the first year the building is in operation. 3. TDV energy savings for one prototype building. for the first year the building is in operation. 4. Site electricity savings. Does not include TDV of electricity savings. 5. Calculated using CEC’s 2013 TDV factors and methodology.
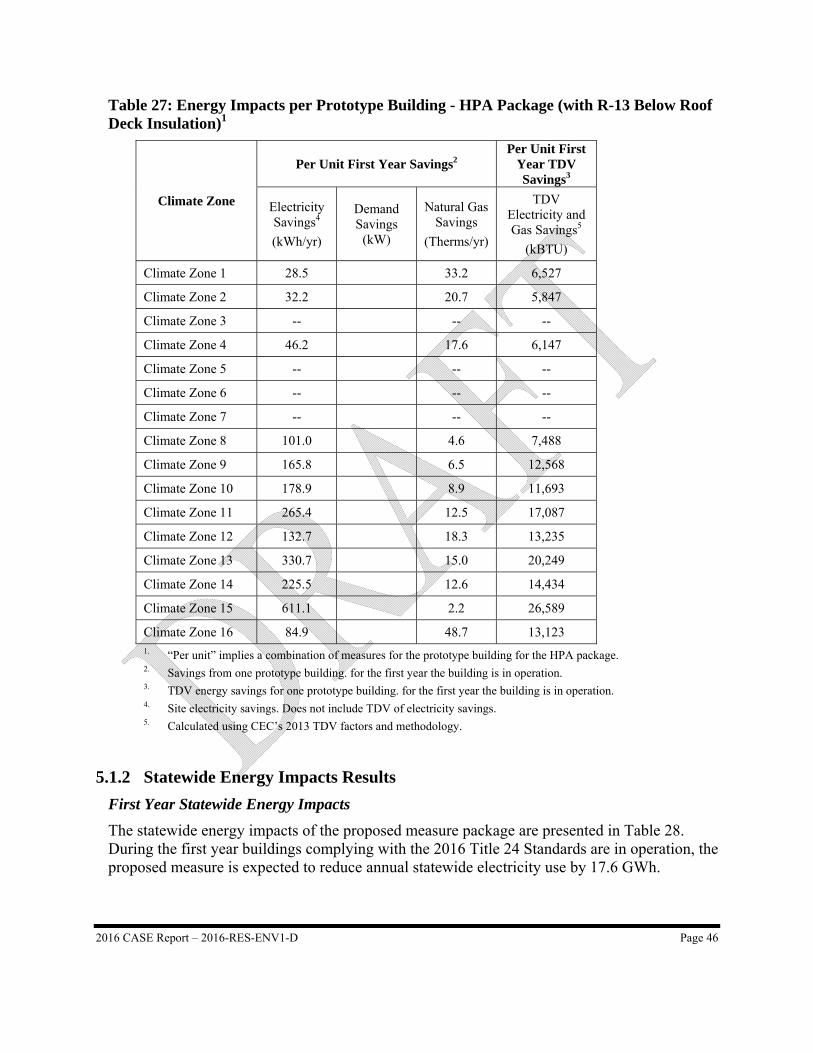
2016 CASE Report – 2016-RES-ENV1-D Page 46
Table 27: Energy Impacts per Prototype Building - HPA Package (with R-13 Below Roof Deck Insulation)1
Climate Zone
Per Unit First Year Savings2 Per Unit First
Year TDV Savings3
Electricity Savings4
(kWh/yr)
Demand Savings
(kW)
Natural Gas Savings
(Therms/yr)
TDV Electricity and Gas Savings5
(kBTU)
Climate Zone 1 28.5 33.2 6,527
Climate Zone 2 32.2 20.7 5,847
Climate Zone 3 -- -- --
Climate Zone 4 46.2 17.6 6,147
Climate Zone 5 -- -- --
Climate Zone 6 -- -- --
Climate Zone 7 -- -- --
Climate Zone 8 101.0 4.6 7,488
Climate Zone 9 165.8 6.5 12,568
Climate Zone 10 178.9 8.9 11,693
Climate Zone 11 265.4 12.5 17,087
Climate Zone 12 132.7 18.3 13,235
Climate Zone 13 330.7 15.0 20,249
Climate Zone 14 225.5 12.6 14,434
Climate Zone 15 611.1 2.2 26,589
Climate Zone 16 84.9 48.7 13,123 1. “Per unit” implies a combination of measures for the prototype building for the HPA package. 2. Savings from one prototype building. for the first year the building is in operation. 3. TDV energy savings for one prototype building. for the first year the building is in operation. 4. Site electricity savings. Does not include TDV of electricity savings. 5. Calculated using CEC’s 2013 TDV factors and methodology.
5.1.2 Statewide Energy Impacts Results
First Year Statewide Energy Impacts
The statewide energy impacts of the proposed measure package are presented in Table 28. During the first year buildings complying with the 2016 Title 24 Standards are in operation, the proposed measure is expected to reduce annual statewide electricity use by 17.6 GWh.
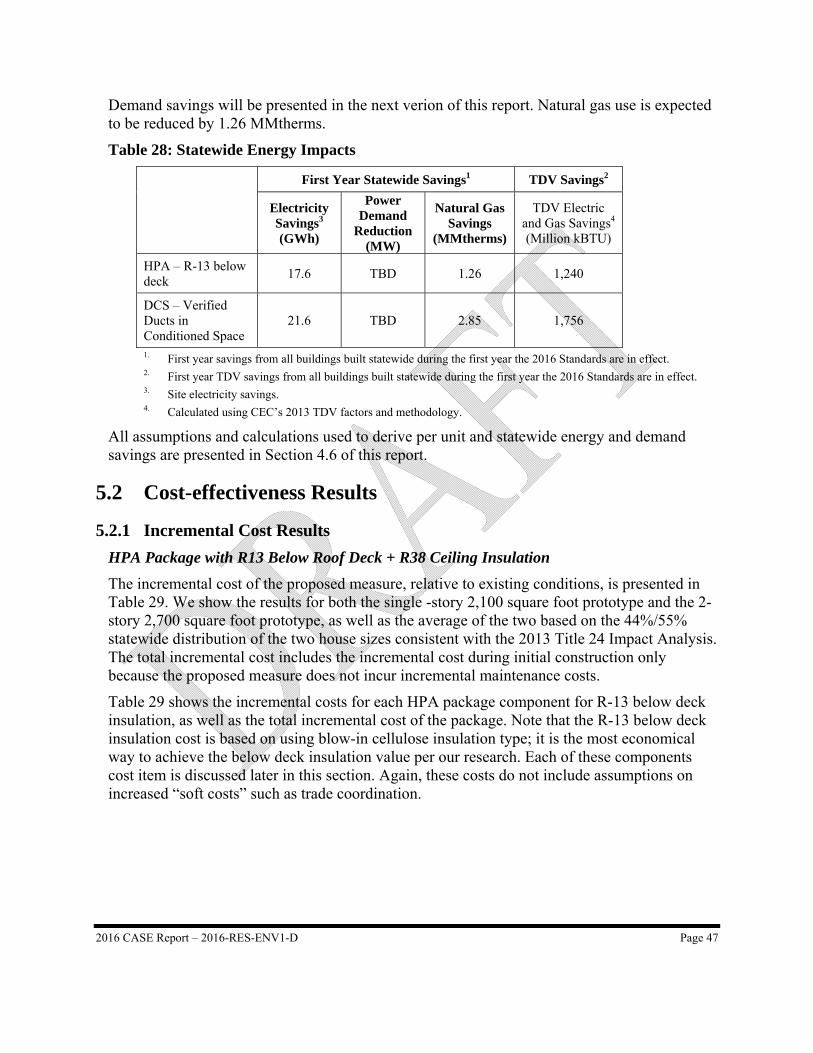
2016 CASE Report – 2016-RES-ENV1-D Page 47
Demand savings will be presented in the next verion of this report. Natural gas use is expected to be reduced by 1.26 MMtherms.
Table 28: Statewide Energy Impacts
First Year Statewide Savings1 TDV Savings2
Electricity Savings3 (GWh)
Power Demand
Reduction (MW)
Natural Gas Savings
(MMtherms)
TDV Electric and Gas Savings4 (Million kBTU)
HPA – R-13 below deck
17.6 TBD 1.26 1,240
DCS – Verified Ducts in Conditioned Space
21.6 TBD 2.85 1,756
1. First year savings from all buildings built statewide during the first year the 2016 Standards are in effect. 2. First year TDV savings from all buildings built statewide during the first year the 2016 Standards are in effect. 3. Site electricity savings. 4. Calculated using CEC’s 2013 TDV factors and methodology.
All assumptions and calculations used to derive per unit and statewide energy and demand savings are presented in Section 4.6 of this report.
5.2 Cost-effectiveness Results
5.2.1 Incremental Cost Results
HPA Package with R13 Below Roof Deck + R38 Ceiling Insulation
The incremental cost of the proposed measure, relative to existing conditions, is presented in Table 29. We show the results for both the single -story 2,100 square foot prototype and the 2-story 2,700 square foot prototype, as well as the average of the two based on the 44%/55% statewide distribution of the two house sizes consistent with the 2013 Title 24 Impact Analysis. The total incremental cost includes the incremental cost during initial construction only because the proposed measure does not incur incremental maintenance costs.
Table 29 shows the incremental costs for each HPA package component for R-13 below deck insulation, as well as the total incremental cost of the package. Note that the R-13 below deck insulation cost is based on using blow-in cellulose insulation type; it is the most economical way to achieve the below deck insulation value per our research. Each of these components cost item is discussed later in this section. Again, these costs do not include assumptions on increased “soft costs” such as trade coordination.
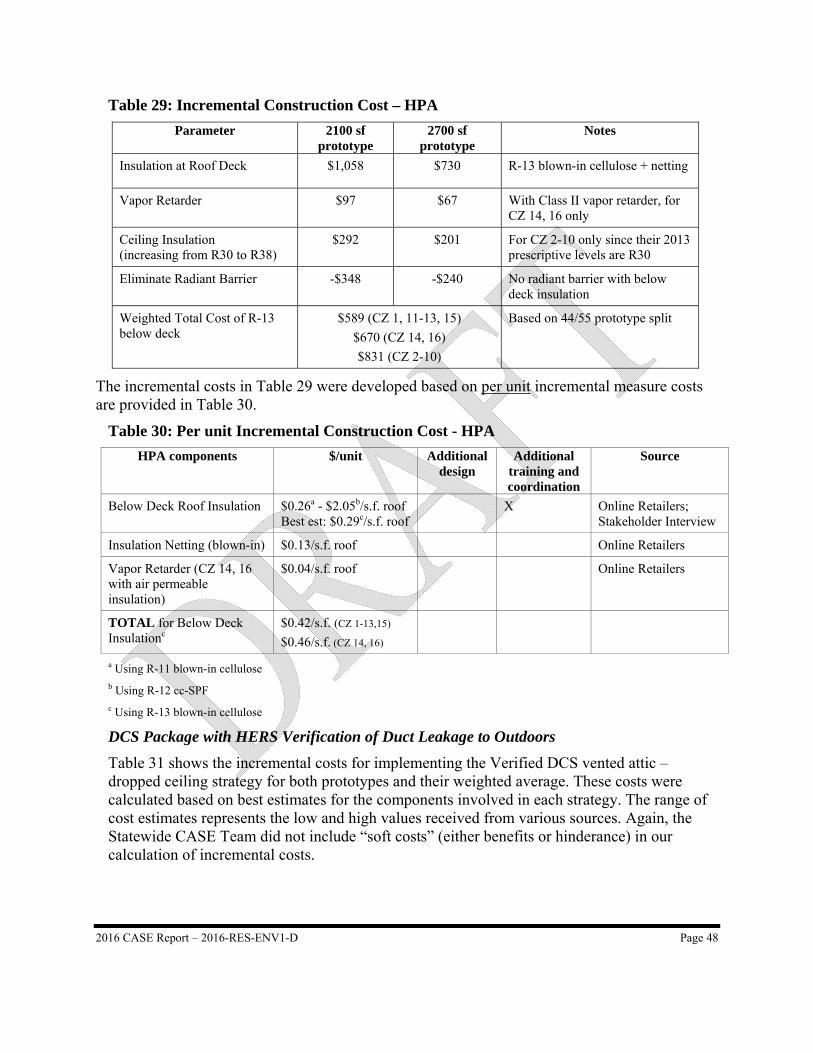
2016 CASE Report – 2016-RES-ENV1-D Page 48
Table 29: Incremental Construction Cost – HPA
Parameter 2100 sf prototype
2700 sf prototype
Notes
Insulation at Roof Deck $1,058 $730 R-13 blown-in cellulose + netting
Vapor Retarder $97 $67 With Class II vapor retarder, for CZ 14, 16 only
Ceiling Insulation (increasing from R30 to R38)
$292 $201 For CZ 2-10 only since their 2013 prescriptive levels are R30
Eliminate Radiant Barrier -$348 -$240 No radiant barrier with below deck insulation
Weighted Total Cost of R-13 below deck
$589 (CZ 1, 11-13, 15)
$670 (CZ 14, 16)
$831 (CZ 2-10)
Based on 44/55 prototype split
The incremental costs in Table 29 were developed based on per unit incremental measure costs are provided in Table 30.
Table 30: Per unit Incremental Construction Cost - HPA
HPA components $/unit Additional design
Additional training and coordination
Source
Below Deck Roof Insulation $0.26a - $2.05b/s.f. roof Best est: $0.29c/s.f. roof
X Online Retailers; Stakeholder Interview
Insulation Netting (blown-in) $0.13/s.f. roof Online Retailers
Vapor Retarder (CZ 14, 16 with air permeable insulation)
$0.04/s.f. roof Online Retailers
TOTAL for Below Deck Insulationc
$0.42/s.f. (CZ 1-13,15)
$0.46/s.f. (CZ 14, 16)
a Using R-11 blown-in cellulose b Using R-12 cc-SPF c Using R-13 blown-in cellulose
DCS Package with HERS Verification of Duct Leakage to Outdoors
Table 31 shows the incremental costs for implementing the Verified DCS vented attic – dropped ceiling strategy for both prototypes and their weighted average. These costs were calculated based on best estimates for the components involved in each strategy. The range of cost estimates represents the low and high values received from various sources. Again, the Statewide CASE Team did not include “soft costs” (either benefits or hinderance) in our calculation of incremental costs.
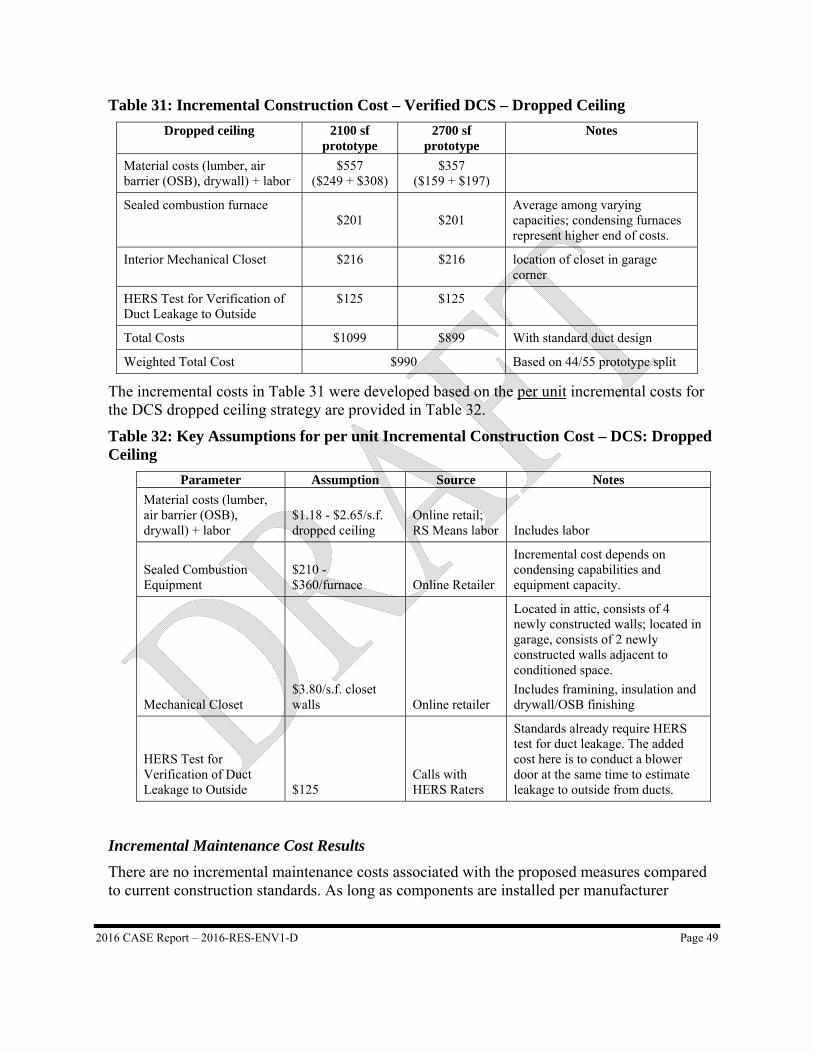
2016 CASE Report – 2016-RES-ENV1-D Page 49
Table 31: Incremental Construction Cost – Verified DCS – Dropped Ceiling
Dropped ceiling 2100 sf prototype
2700 sf prototype
Notes
Material costs (lumber, air barrier (OSB), drywall) + labor
$557 ($249 + $308)
$357 ($159 + $197)
Sealed combustion furnace $201 $201
Average among varying capacities; condensing furnaces represent higher end of costs.
Interior Mechanical Closet $216 $216 location of closet in garage corner
HERS Test for Verification of Duct Leakage to Outside
$125 $125
Total Costs $1099 $899 With standard duct design
Weighted Total Cost $990 Based on 44/55 prototype split
The incremental costs in Table 31 were developed based on the per unit incremental costs for the DCS dropped ceiling strategy are provided in Table 32.
Table 32: Key Assumptions for per unit Incremental Construction Cost – DCS: Dropped Ceiling
Parameter Assumption Source Notes
Material costs (lumber, air barrier (OSB), drywall) + labor
$1.18 - $2.65/s.f. dropped ceiling
Online retail; RS Means labor Includes labor
Sealed Combustion Equipment
$210 - $360/furnace Online Retailer
Incremental cost depends on condensing capabilities and equipment capacity.
Mechanical Closet $3.80/s.f. closet walls Online retailer
Located in attic, consists of 4 newly constructed walls; located in garage, consists of 2 newly constructed walls adjacent to conditioned space.
Includes framining, insulation and drywall/OSB finishing
HERS Test for Verification of Duct Leakage to Outside $125
Calls with HERS Raters
Standards already require HERS test for duct leakage. The added cost here is to conduct a blower door at the same time to estimate leakage to outside from ducts.
Incremental Maintenance Cost Results
There are no incremental maintenance costs associated with the proposed measures compared to current construction standards. As long as components are installed per manufacturer
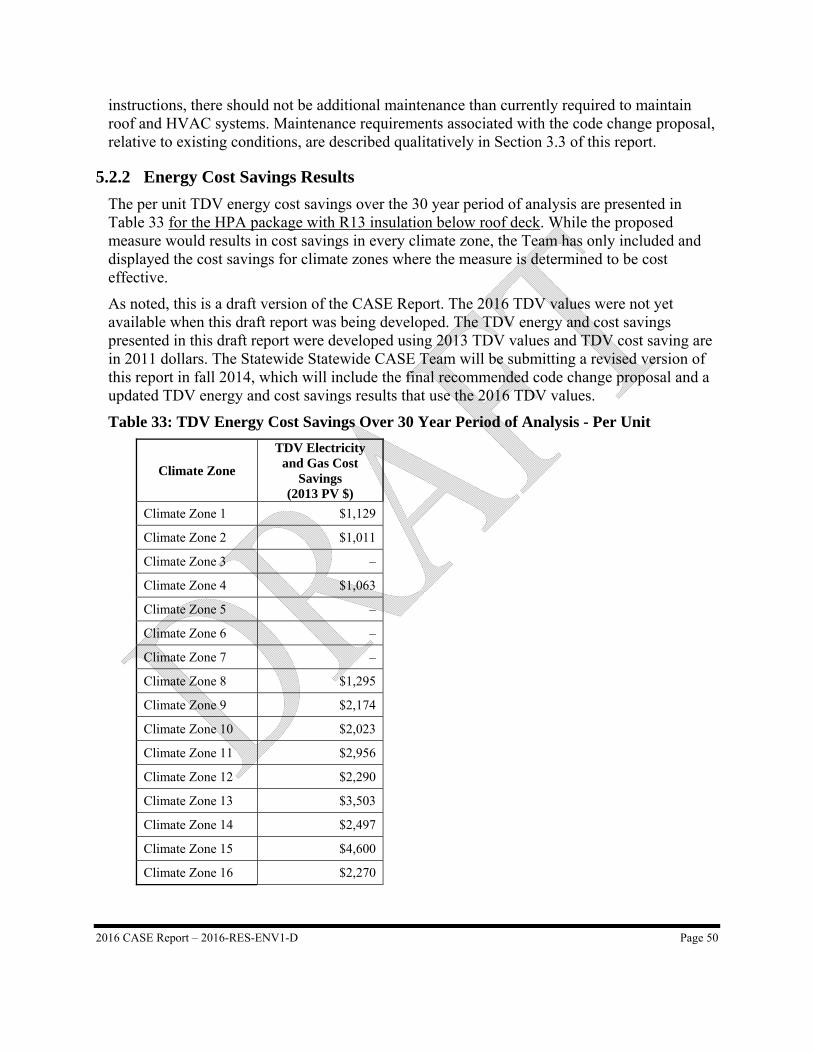
2016 CASE Report – 2016-RES-ENV1-D Page 50
instructions, there should not be additional maintenance than currently required to maintain roof and HVAC systems. Maintenance requirements associated with the code change proposal, relative to existing conditions, are described qualitatively in Section 3.3 of this report.
5.2.2 Energy Cost Savings Results
The per unit TDV energy cost savings over the 30 year period of analysis are presented in Table 33 for the HPA package with R13 insulation below roof deck. While the proposed measure would results in cost savings in every climate zone, the Team has only included and displayed the cost savings for climate zones where the measure is determined to be cost effective.
As noted, this is a draft version of the CASE Report. The 2016 TDV values were not yet available when this draft report was being developed. The TDV energy and cost savings presented in this draft report were developed using 2013 TDV values and TDV cost saving are in 2011 dollars. The Statewide Statewide CASE Team will be submitting a revised version of this report in fall 2014, which will include the final recommended code change proposal and a updated TDV energy and cost savings results that use the 2016 TDV values.
Table 33: TDV Energy Cost Savings Over 30 Year Period of Analysis - Per Unit
Climate Zone
TDV Electricity and Gas Cost
Savings (2013 PV $)
Climate Zone 1 $1,129
Climate Zone 2 $1,011
Climate Zone 3 –
Climate Zone 4 $1,063
Climate Zone 5 –
Climate Zone 6 –
Climate Zone 7 –
Climate Zone 8 $1,295
Climate Zone 9 $2,174
Climate Zone 10 $2,023
Climate Zone 11 $2,956
Climate Zone 12 $2,290
Climate Zone 13 $3,503
Climate Zone 14 $2,497
Climate Zone 15 $4,600
Climate Zone 16 $2,270
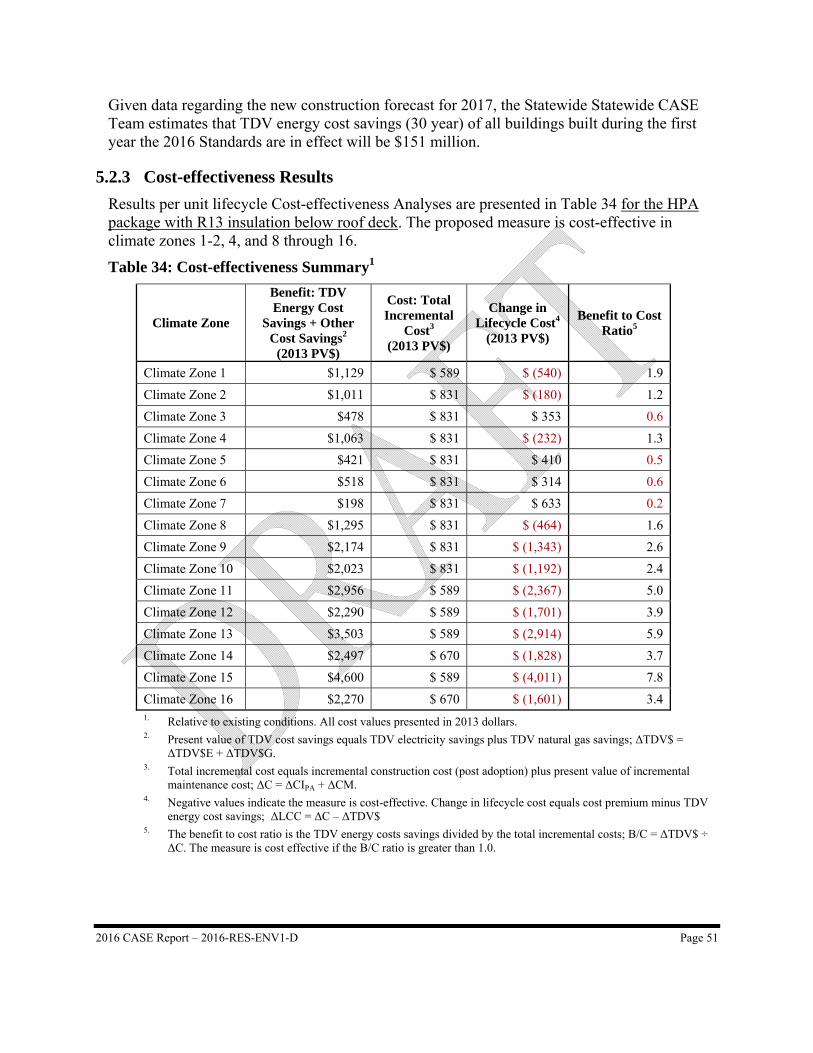
2016 CASE Report – 2016-RES-ENV1-D Page 51
Given data regarding the new construction forecast for 2017, the Statewide Statewide CASE Team estimates that TDV energy cost savings (30 year) of all buildings built during the first year the 2016 Standards are in effect will be $151 million.
5.2.3 Cost-effectiveness Results
Results per unit lifecycle Cost-effectiveness Analyses are presented in Table 34 for the HPA package with R13 insulation below roof deck. The proposed measure is cost-effective in climate zones 1-2, 4, and 8 through 16.
Table 34: Cost-effectiveness Summary1
Climate Zone
Benefit: TDV Energy Cost
Savings + Other Cost Savings2
(2013 PV$)
Cost: Total Incremental
Cost3
(2013 PV$)
Change in Lifecycle Cost4
(2013 PV$)
Benefit to Cost Ratio5
Climate Zone 1 $1,129 $ 589 $ (540) 1.9
Climate Zone 2 $1,011 $ 831 $ (180) 1.2
Climate Zone 3 $478 $ 831 $ 353 0.6
Climate Zone 4 $1,063 $ 831 $ (232) 1.3
Climate Zone 5 $421 $ 831 $ 410 0.5
Climate Zone 6 $518 $ 831 $ 314 0.6
Climate Zone 7 $198 $ 831 $ 633 0.2
Climate Zone 8 $1,295 $ 831 $ (464) 1.6
Climate Zone 9 $2,174 $ 831 $ (1,343) 2.6
Climate Zone 10 $2,023 $ 831 $ (1,192) 2.4
Climate Zone 11 $2,956 $ 589 $ (2,367) 5.0
Climate Zone 12 $2,290 $ 589 $ (1,701) 3.9
Climate Zone 13 $3,503 $ 589 $ (2,914) 5.9
Climate Zone 14 $2,497 $ 670 $ (1,828) 3.7
Climate Zone 15 $4,600 $ 589 $ (4,011) 7.8
Climate Zone 16 $2,270 $ 670 $ (1,601) 3.41. Relative to existing conditions. All cost values presented in 2013 dollars. 2. Present value of TDV cost savings equals TDV electricity savings plus TDV natural gas savings; ΔTDV$ =
ΔTDV$E + ΔTDV$G. 3. Total incremental cost equals incremental construction cost (post adoption) plus present value of incremental
maintenance cost; ΔC = ΔCIPA + ΔCM. 4. Negative values indicate the measure is cost-effective. Change in lifecycle cost equals cost premium minus TDV
energy cost savings; ΔLCC = ΔC – ΔTDV$ 5. The benefit to cost ratio is the TDV energy costs savings divided by the total incremental costs; B/C = ΔTDV$ ÷
ΔC. The measure is cost effective if the B/C ratio is greater than 1.0.
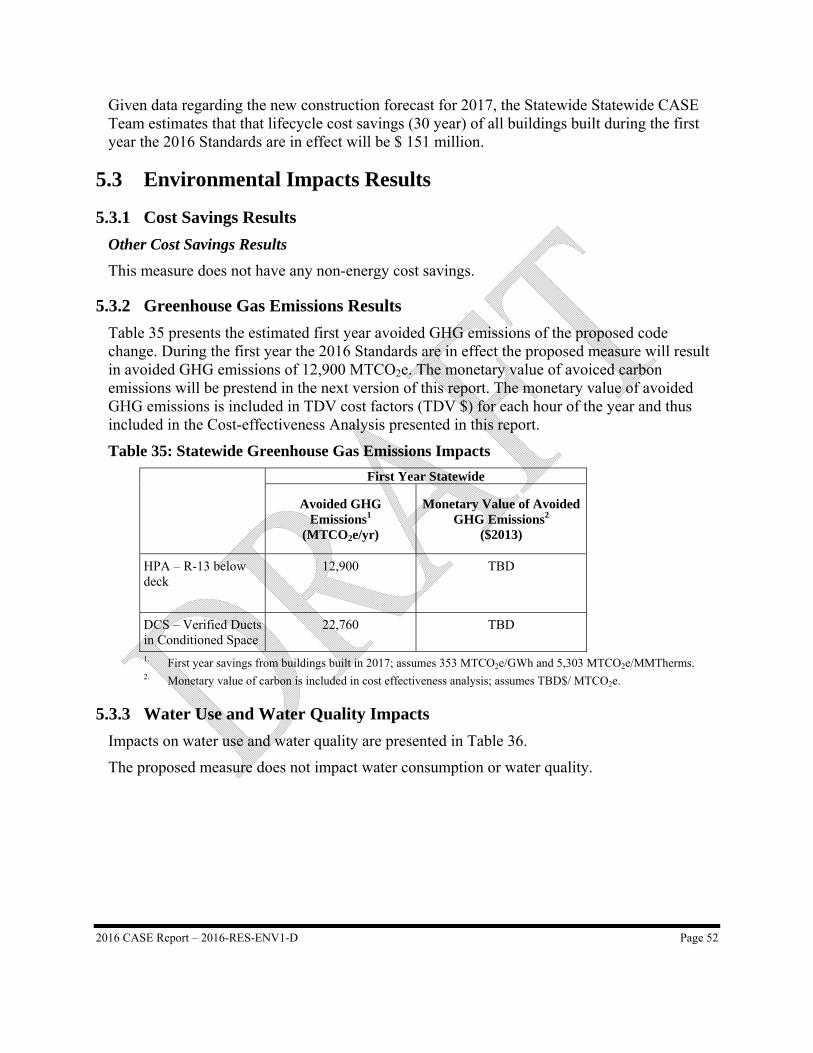
2016 CASE Report – 2016-RES-ENV1-D Page 52
Given data regarding the new construction forecast for 2017, the Statewide Statewide CASE Team estimates that that lifecycle cost savings (30 year) of all buildings built during the first year the 2016 Standards are in effect will be $ 151 million.
5.3 Environmental Impacts Results
5.3.1 Cost Savings Results
Other Cost Savings Results
This measure does not have any non-energy cost savings.
5.3.2 Greenhouse Gas Emissions Results
Table 35 presents the estimated first year avoided GHG emissions of the proposed code change. During the first year the 2016 Standards are in effect the proposed measure will result in avoided GHG emissions of 12,900 MTCO2e. The monetary value of avoiced carbon emissions will be prestend in the next version of this report. The monetary value of avoided GHG emissions is included in TDV cost factors (TDV $) for each hour of the year and thus included in the Cost-effectiveness Analysis presented in this report.
Table 35: Statewide Greenhouse Gas Emissions Impacts
First Year Statewide
Avoided GHG Emissions1
(MTCO2e/yr)
Monetary Value of Avoided GHG Emissions2
($2013)
HPA – R-13 below deck
12,900 TBD
DCS – Verified Ducts in Conditioned Space
22,760 TBD
1. First year savings from buildings built in 2017; assumes 353 MTCO2e/GWh and 5,303 MTCO2e/MMTherms. 2. Monetary value of carbon is included in cost effectiveness analysis; assumes TBD$/ MTCO2e.
5.3.3 Water Use and Water Quality Impacts
Impacts on water use and water quality are presented in Table 36.
The proposed measure does not impact water consumption or water quality.
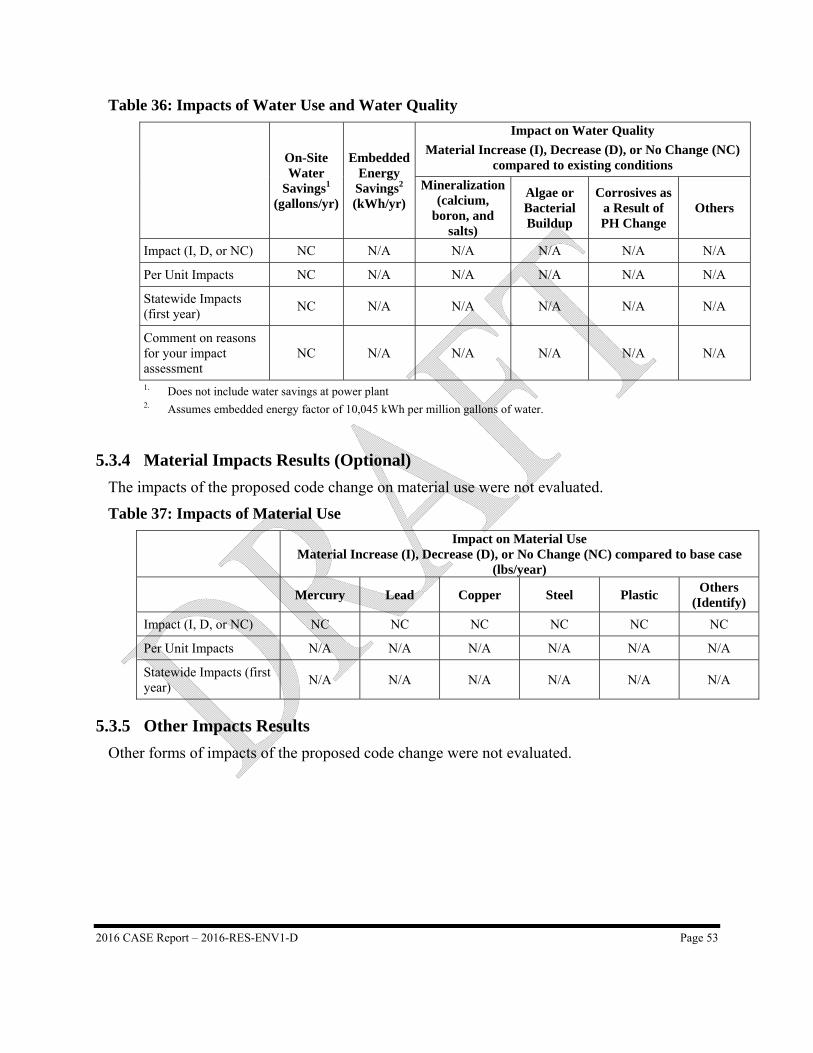
2016 CASE Report – 2016-RES-ENV1-D Page 53
Table 36: Impacts of Water Use and Water Quality
On-Site Water
Savings1 (gallons/yr)
Embedded Energy Savings2 (kWh/yr)
Impact on Water Quality
Material Increase (I), Decrease (D), or No Change (NC) compared to existing conditions
Mineralization(calcium,
boron, and salts)
Algae or Bacterial Buildup
Corrosives as a Result of PH Change
Others
Impact (I, D, or NC) NC N/A N/A N/A N/A N/A
Per Unit Impacts NC N/A N/A N/A N/A N/A
Statewide Impacts (first year)
NC N/A N/A N/A N/A N/A
Comment on reasons for your impact assessment
NC N/A N/A N/A N/A N/A
1. Does not include water savings at power plant 2. Assumes embedded energy factor of 10,045 kWh per million gallons of water.
5.3.4 Material Impacts Results (Optional)
The impacts of the proposed code change on material use were not evaluated.
Table 37: Impacts of Material Use
Impact on Material Use
Material Increase (I), Decrease (D), or No Change (NC) compared to base case (lbs/year)
Mercury Lead Copper Steel Plastic Others
(Identify)
Impact (I, D, or NC) NC NC NC NC NC NC
Per Unit Impacts N/A N/A N/A N/A N/A N/A
Statewide Impacts (first year)
N/A N/A N/A N/A N/A N/A
5.3.5 Other Impacts Results
Other forms of impacts of the proposed code change were not evaluated.
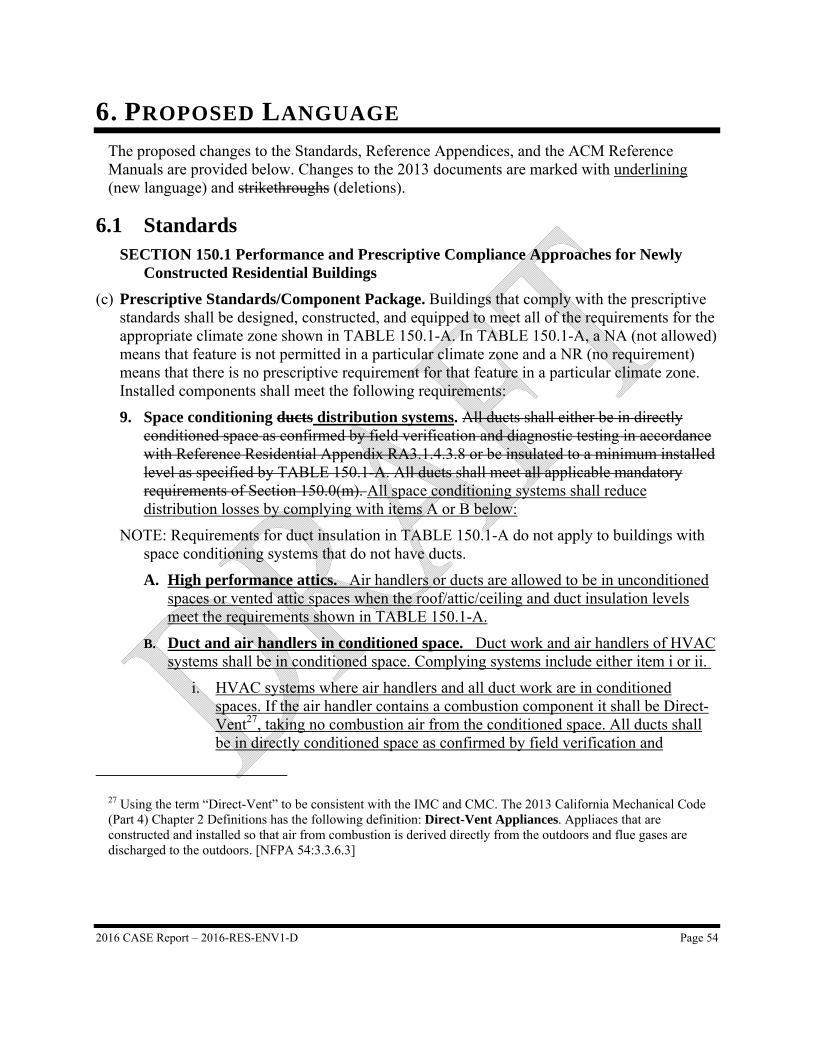
2016 CASE Report – 2016-RES-ENV1-D Page 54
6. PROPOSED LANGUAGE The proposed changes to the Standards, Reference Appendices, and the ACM Reference Manuals are provided below. Changes to the 2013 documents are marked with underlining (new language) and strikethroughs (deletions).
6.1 Standards SECTION 150.1 Performance and Prescriptive Compliance Approaches for Newly
Constructed Residential Buildings
(c) Prescriptive Standards/Component Package. Buildings that comply with the prescriptive standards shall be designed, constructed, and equipped to meet all of the requirements for the appropriate climate zone shown in TABLE 150.1-A. In TABLE 150.1-A, a NA (not allowed) means that feature is not permitted in a particular climate zone and a NR (no requirement) means that there is no prescriptive requirement for that feature in a particular climate zone. Installed components shall meet the following requirements:
9. Space conditioning ducts distribution systems. All ducts shall either be in directly conditioned space as confirmed by field verification and diagnostic testing in accordance with Reference Residential Appendix RA3.1.4.3.8 or be insulated to a minimum installed level as specified by TABLE 150.1-A. All ducts shall meet all applicable mandatory requirements of Section 150.0(m). All space conditioning systems shall reduce distribution losses by complying with items A or B below:
NOTE: Requirements for duct insulation in TABLE 150.1-A do not apply to buildings with space conditioning systems that do not have ducts.
A. High performance attics. Air handlers or ducts are allowed to be in unconditioned spaces or vented attic spaces when the roof/attic/ceiling and duct insulation levels meet the requirements shown in TABLE 150.1-A.
B. Duct and air handlers in conditioned space. Duct work and air handlers of HVAC systems shall be in conditioned space. Complying systems include either item i or ii.
i. HVAC systems where air handlers and all duct work are in conditioned spaces. If the air handler contains a combustion component it shall be Direct-Vent27, taking no combustion air from the conditioned space. All ducts shall be in directly conditioned space as confirmed by field verification and
27 Using the term “Direct-Vent” to be consistent with the IMC and CMC. The 2013 California Mechanical Code (Part 4) Chapter 2 Definitions has the following definition: Direct-Vent Appliances. Appliaces that are constructed and installed so that air from combustion is derived directly from the outdoors and flue gases are discharged to the outdoors. [NFPA 54:3.3.6.3]

2016 CASE Report – 2016-RES-ENV1-D Page 55
diagnostic testing in accordance with Reference Residential Appendix RA3.1.4.3.8. All ducts shall meet all applicable mandatory requirements of Section 150.0(m).
ii. Ductless HVAC systems including but not limited to: ductless mini-split systems, hydronic heating and cooling systems, packaged terminal heat pumps, packaged terminal air conditioners with hydronic heating or sealed gas heating, and sealed combustion wall furnaces.
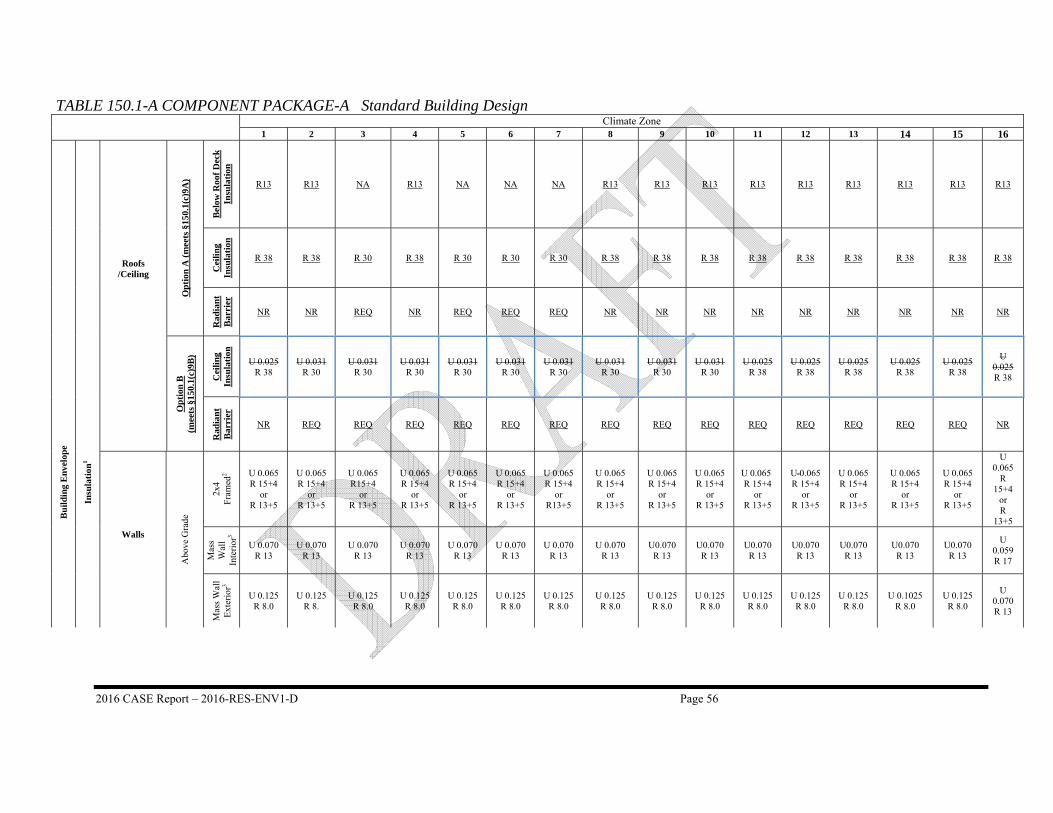
2016 CASE Report – 2016-RES-ENV1-D Page 56
TABLE 150.1-A COMPONENT PACKAGE-A Standard Building Design
Climate Zone 1 2 3 4 5 6 7 8 9 10 11 12 13 14 15 16
Roofs /Ceiling
Op
tion
A (
mee
ts §
150.
1(c)
9A)
Bel
ow R
oof
Dec
k
Insu
lati
on
R13 R13 NA R13 NA NA NA R13 R13 R13 R13 R13 R13 R13 R13 R13
Cei
ling
In
sula
tion
R 38 R 38 R 30 R 38 R 30 R 30 R 30 R 38 R 38 R 38 R 38 R 38 R 38 R 38 R 38 R 38
Rad
ian
t B
arri
er
NR NR REQ NR REQ REQ REQ NR NR NR NR NR NR NR NR NR
Bu
ild
ing
Env
elop
e
Insu
lati
on1
Op
tion
B
(mee
ts §
150.
1(c)
9B)
Cei
ling
In
sula
tion
U 0.025 R 38
U 0.031 R 30
U 0.031 R 30
U 0.031 R 30
U 0.031 R 30
U 0.031 R 30
U 0.031 R 30
U 0.031 R 30
U 0.031 R 30
U 0.031 R 30
U 0.025 R 38
U 0.025 R 38
U 0.025 R 38
U 0.025 R 38
U 0.025 R 38
U 0.025 R 38
Rad
ian
t B
arri
er
NR REQ REQ REQ REQ REQ REQ REQ REQ REQ REQ REQ REQ REQ REQ NR
Walls
Abo
ve G
rade
2x4
Fra
med
2 U 0.065 R 15+4
or R 13+5
U 0.065 R 15+4
or R 13+5
U 0.065 R15+4
or R 13+5
U 0.065 R 15+4
or R 13+5
U 0.065 R 15+4
or R 13+5
U 0.065 R 15+4
or R 13+5
U 0.065 R 15+4
or R13+5
U 0.065 R 15+4
or R 13+5
U 0.065 R 15+4
or R 13+5
U 0.065 R 15+4
or R 13+5
U 0.065 R 15+4
or R 13+5
U 0.065 R 15+4
or R 13+5
U 0.065 R 15+4
or R 13+5
U 0.065 R 15+4
or R 13+5
U 0.065 R 15+4
or R 13+5
U 0.065
R 15+4
or R
13+5
Mas
s W
all
Inte
rior
3
U 0.070 R 13
U 0.070 R 13
U 0.070 R 13
U 0.070 R 13
U 0.070 R 13
U 0.070 R 13
U 0.070 R 13
U 0.070 R 13
U0.070 R 13
U0.070 R 13
U0.070 R 13
U0.070 R 13
U0.070 R 13
U0.070 R 13
U0.070 R 13
U 0.059 R 17
Mas
s W
all
Ext
erio
r3
U 0.125 R 8.0
U 0.125 R 8.
U 0.125 R 8.0
U 0.125 R 8.0
U 0.125 R 8.0
U 0.125 R 8.0
U 0.125 R 8.0
U 0.125 R 8.0
U 0.125 R 8.0
U 0.125 R 8.0
U 0.125 R 8.0
U 0.125 R 8.0
U 0.125 R 8.0
U 0.1025 R 8.0
U 0.125 R 8.0
U 0.070 R 13
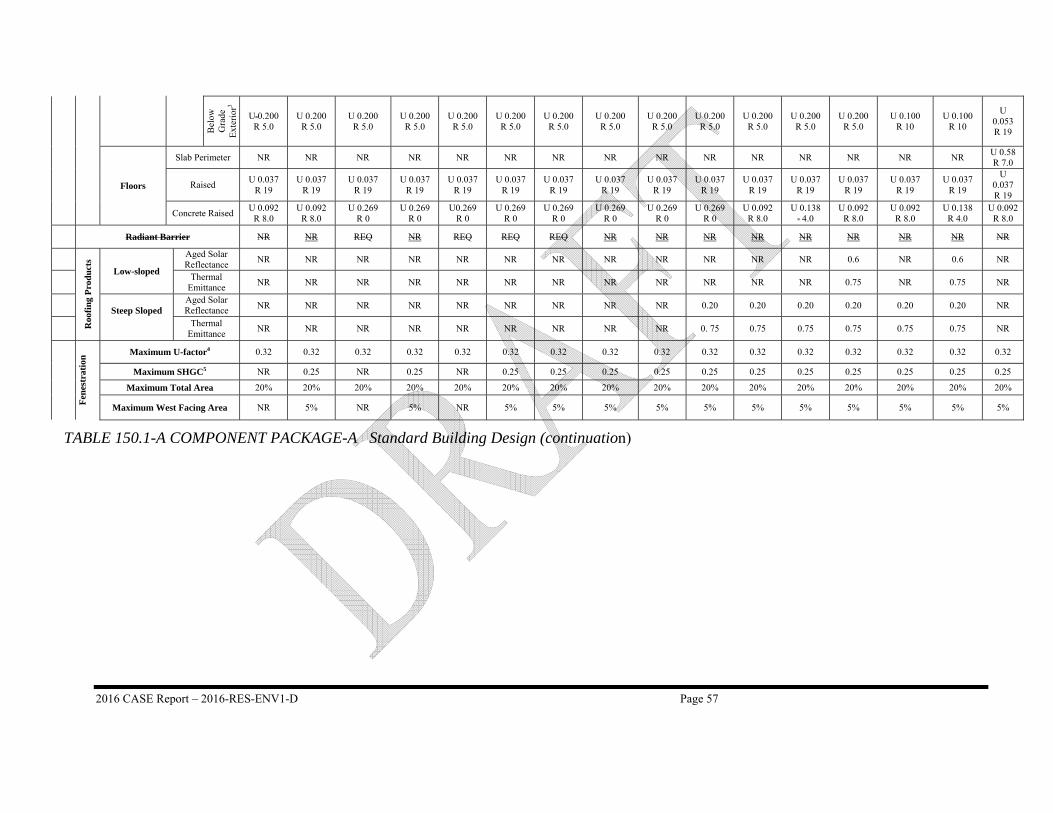
2016 CASE Report – 2016-RES-ENV1-D Page 57
TABLE 150.1-A COMPONENT PACKAGE-A Standard Building Design (continuation)
Bel
ow
Gra
de
Ext
erio
r3
U 0.200 R 5.0
U 0.200 R 5.0
U 0.200 R 5.0
U 0.200 R 5.0
U 0.200 R 5.0
U 0.200 R 5.0
U 0.200 R 5.0
U 0.200 R 5.0
U 0.200 R 5.0
U 0.200 R 5.0
U 0.200 R 5.0
U 0.200 R 5.0
U 0.200 R 5.0
U 0.100 R 10
U 0.100 R 10
U 0.053 R 19
Floors
Slab Perimeter NR NR NR NR NR NR NR NR NR NR NR NR NR NR NR U 0.58 R 7.0
Raised U 0.037
R 19 U 0.037
R 19 U 0.037
R 19 U 0.037
R 19 U 0.037
R 19 U 0.037
R 19 U 0.037
R 19 U 0.037
R 19 U 0.037
R 19 U 0.037
R 19 U 0.037
R 19 U 0.037
R 19 U 0.037
R 19 U 0.037
R 19 U 0.037
R 19
U 0.037 R 19
Concrete Raised U 0.092
R 8.0 U 0.092
R 8.0 U 0.269
R 0 U 0.269
R 0 U0.269
R 0 U 0.269
R 0 U 0.269
R 0 U 0.269
R 0 U 0.269
R 0 U 0.269
R 0 U 0.092
R 8.0 U 0.138
4.0 U 0.092
R 8.0 U 0.092
R 8.0 U 0.138
R 4.0 U 0.092
R 8.0
Radiant Barrier NR NR REQ NR REQ REQ REQ NR NR NR NR NR NR NR NR NR
Roo
fing
Pro
duc
ts
Low-sloped
Aged Solar Reflectance
NR NR NR NR NR NR NR NR NR NR NR NR 0.6 NR 0.6 NR
Thermal Emittance
NR NR NR NR NR NR NR NR NR NR NR NR 0.75 NR 0.75 NR
Steep Sloped
Aged Solar Reflectance NR NR NR NR NR NR NR NR NR 0.20 0.20 0.20 0.20 0.20 0.20 NR
Thermal Emittance
NR NR NR NR NR NR NR NR NR 0. 75 0.75 0.75 0.75 0.75 0.75 NR
Fen
estr
atio
n
Maximum U-factor4 0.32 0.32 0.32 0.32 0.32 0.32 0.32 0.32 0.32 0.32 0.32 0.32 0.32 0.32 0.32 0.32
Maximum SHGC5 NR 0.25 NR 0.25 NR 0.25 0.25 0.25 0.25 0.25 0.25 0.25 0.25 0.25 0.25 0.25
Maximum Total Area 20% 20% 20% 20% 20% 20% 20% 20% 20% 20% 20% 20% 20% 20% 20% 20%
Maximum West Facing Area NR 5% NR 5% NR 5% 5% 5% 5% 5% 5% 5% 5% 5% 5% 5%
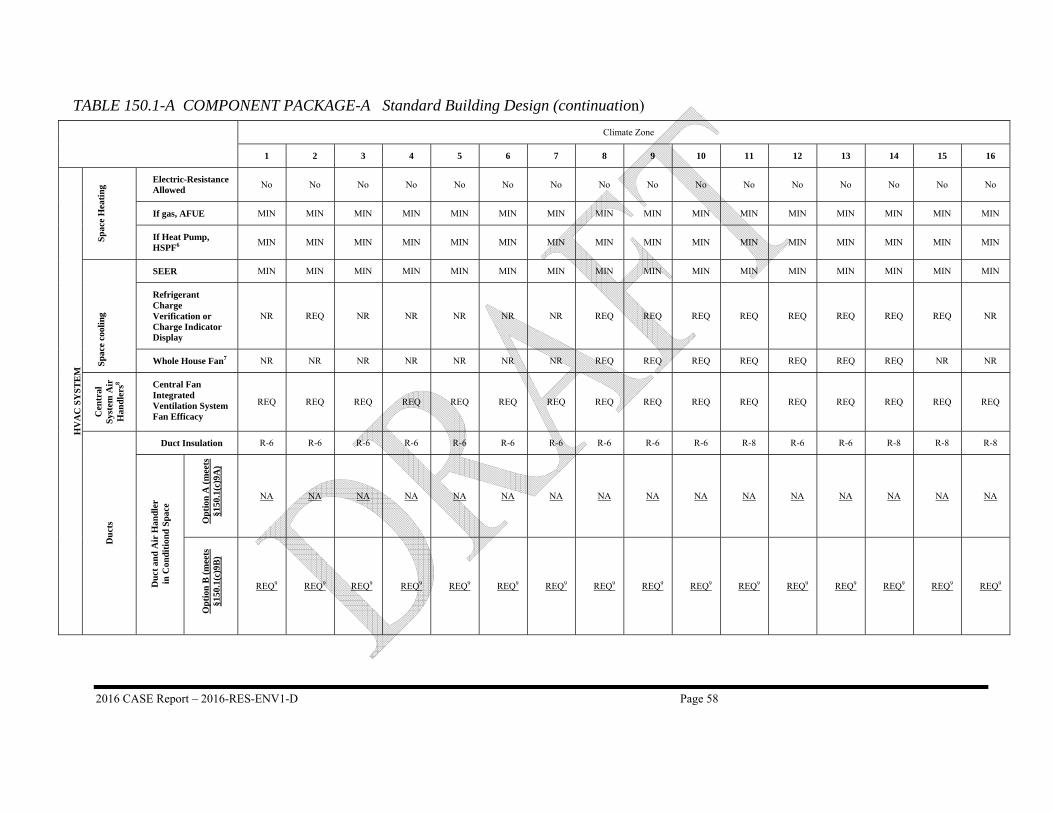
2016 CASE Report – 2016-RES-ENV1-D Page 58
TABLE 150.1-A COMPONENT PACKAGE-A Standard Building Design (continuation)
Climate Zone
1 2 3 4 5 6 7 8 9 10 11 12 13 14 15 16
HV
AC
SY
ST
EM
Sp
ace
Hea
ting
Electric-Resistance Allowed
No No No No No No No No No No No No No No No No
If gas, AFUE MIN MIN MIN MIN MIN MIN MIN MIN MIN MIN MIN MIN MIN MIN MIN MIN
If Heat Pump, HSPF6
MIN MIN MIN MIN MIN MIN MIN MIN MIN MIN MIN MIN MIN MIN MIN MIN
Sp
ace
cool
ing
SEER MIN MIN MIN MIN MIN MIN MIN MIN MIN MIN MIN MIN MIN MIN MIN MIN
Refrigerant Charge Verification or Charge Indicator Display
NR REQ NR NR NR NR NR REQ REQ REQ REQ REQ REQ REQ REQ NR
Whole House Fan7 NR NR NR NR NR NR NR REQ REQ REQ REQ REQ REQ REQ NR NR
Cen
tral
S
yste
m A
ir
Han
dler
s8
Central Fan Integrated Ventilation System Fan Efficacy
REQ REQ REQ REQ REQ REQ REQ REQ REQ REQ REQ REQ REQ REQ REQ REQ
Du
cts
Duct Insulation R-6 R-6 R-6 R-6 R-6 R-6 R-6 R-6 R-6 R-6 R-8 R-6 R-6 R-8 R-8 R-8
Du
ct a
nd
Air
Han
dler
in
Con
diti
ond
Spa
ce
Op
tion
A (
mee
ts
§150
.1(c
)9A
)
NA NA NA NA NA NA NA NA NA NA NA NA NA NA NA NA
Op
tion
B (
mee
ts
§150
.1(c
)9B
)
REQ9 REQ9 REQ9 REQ9 REQ9 REQ9 REQ9 REQ9 REQ9 REQ9 REQ9 REQ9 REQ9 REQ9 REQ9 REQ9
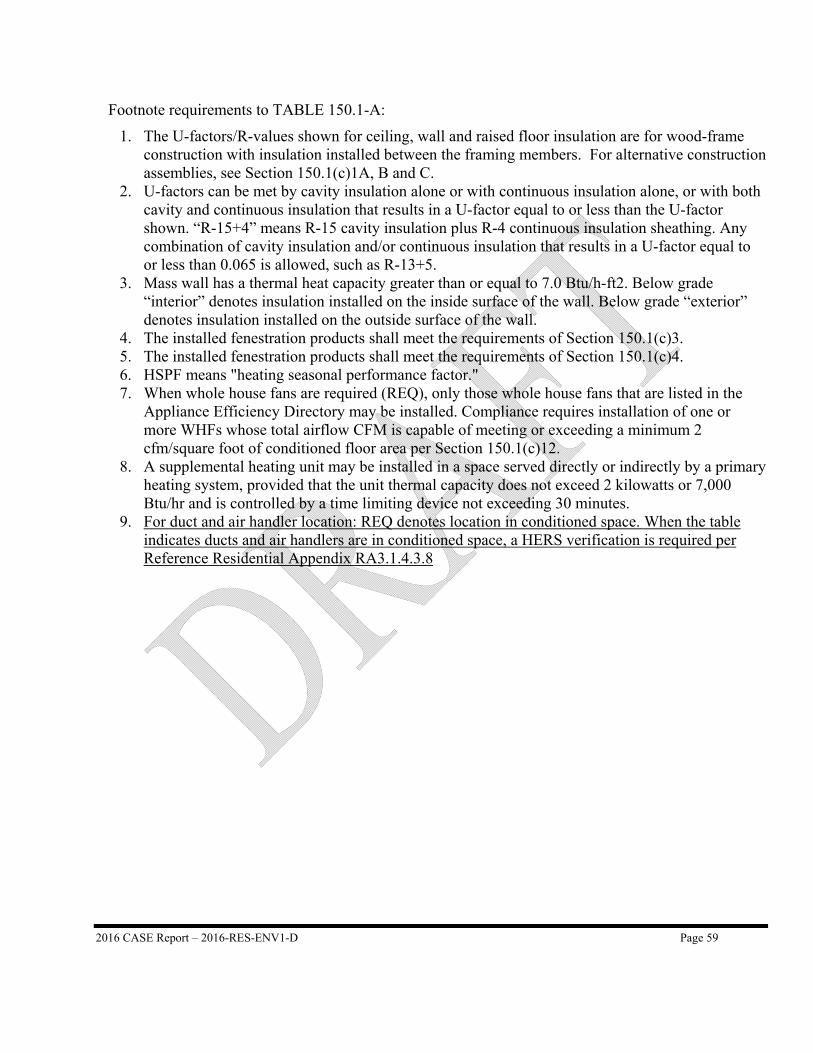
2016 CASE Report – 2016-RES-ENV1-D Page 59
Footnote requirements to TABLE 150.1-A:
1. The U-factors/R-values shown for ceiling, wall and raised floor insulation are for wood-frame construction with insulation installed between the framing members. For alternative construction assemblies, see Section 150.1(c)1A, B and C.
2. U-factors can be met by cavity insulation alone or with continuous insulation alone, or with both cavity and continuous insulation that results in a U-factor equal to or less than the U-factor shown. “R-15+4” means R-15 cavity insulation plus R-4 continuous insulation sheathing. Any combination of cavity insulation and/or continuous insulation that results in a U-factor equal to or less than 0.065 is allowed, such as R-13+5.
3. Mass wall has a thermal heat capacity greater than or equal to 7.0 Btu/h-ft2. Below grade “interior” denotes insulation installed on the inside surface of the wall. Below grade “exterior” denotes insulation installed on the outside surface of the wall.
4. The installed fenestration products shall meet the requirements of Section 150.1(c)3. 5. The installed fenestration products shall meet the requirements of Section 150.1(c)4. 6. HSPF means "heating seasonal performance factor." 7. When whole house fans are required (REQ), only those whole house fans that are listed in the
Appliance Efficiency Directory may be installed. Compliance requires installation of one or more WHFs whose total airflow CFM is capable of meeting or exceeding a minimum 2 cfm/square foot of conditioned floor area per Section 150.1(c)12.
8. A supplemental heating unit may be installed in a space served directly or indirectly by a primary heating system, provided that the unit thermal capacity does not exceed 2 kilowatts or 7,000 Btu/hr and is controlled by a time limiting device not exceeding 30 minutes.
9. For duct and air handler location: REQ denotes location in conditioned space. When the table indicates ducts and air handlers are in conditioned space, a HERS verification is required per Reference Residential Appendix RA3.1.4.3.8
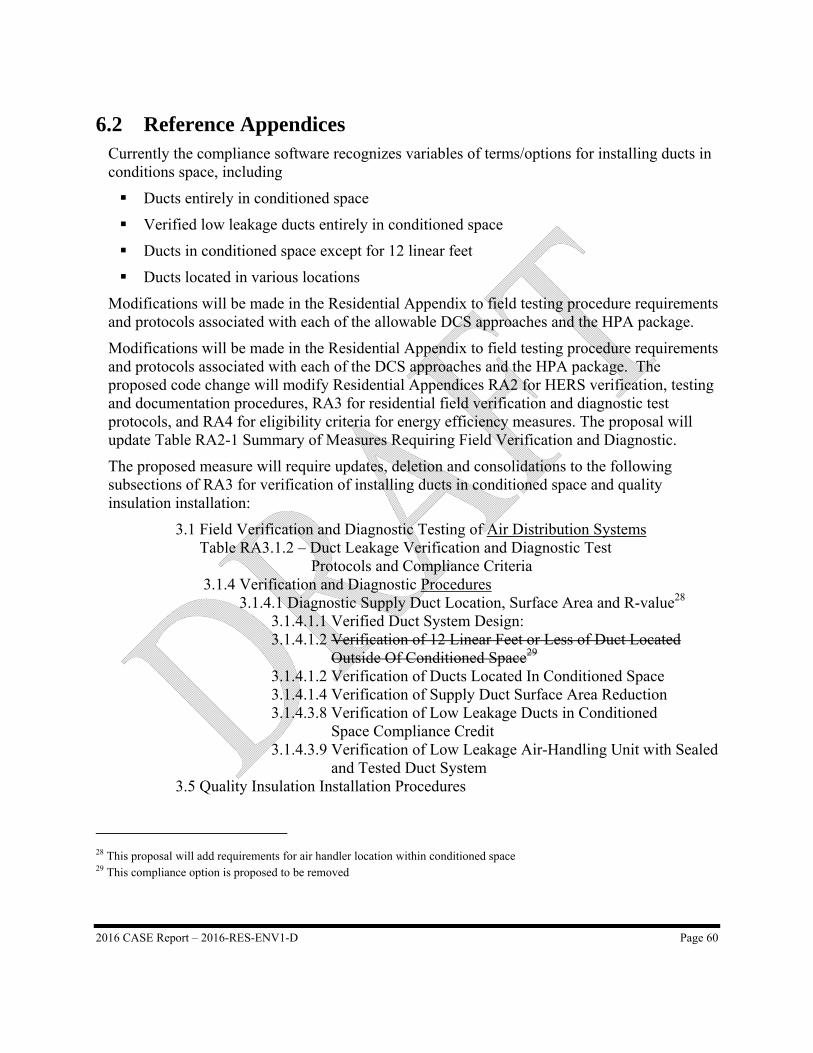
2016 CASE Report – 2016-RES-ENV1-D Page 60
6.2 Reference Appendices Currently the compliance software recognizes variables of terms/options for installing ducts in conditions space, including
Ducts entirely in conditioned space
Verified low leakage ducts entirely in conditioned space
Ducts in conditioned space except for 12 linear feet
Ducts located in various locations
Modifications will be made in the Residential Appendix to field testing procedure requirements and protocols associated with each of the allowable DCS approaches and the HPA package.
Modifications will be made in the Residential Appendix to field testing procedure requirements and protocols associated with each of the DCS approaches and the HPA package. The proposed code change will modify Residential Appendices RA2 for HERS verification, testing and documentation procedures, RA3 for residential field verification and diagnostic test protocols, and RA4 for eligibility criteria for energy efficiency measures. The proposal will update Table RA2-1 Summary of Measures Requiring Field Verification and Diagnostic.
The proposed measure will require updates, deletion and consolidations to the following subsections of RA3 for verification of installing ducts in conditioned space and quality insulation installation:
3.1 Field Verification and Diagnostic Testing of Air Distribution Systems Table RA3.1.2 – Duct Leakage Verification and Diagnostic Test Protocols and Compliance Criteria 3.1.4 Verification and Diagnostic Procedures 3.1.4.1 Diagnostic Supply Duct Location, Surface Area and R-value28 3.1.4.1.1 Verified Duct System Design: 3.1.4.1.2 Verification of 12 Linear Feet or Less of Duct Located Outside Of Conditioned Space29 3.1.4.1.2 Verification of Ducts Located In Conditioned Space 3.1.4.1.4 Verification of Supply Duct Surface Area Reduction 3.1.4.3.8 Verification of Low Leakage Ducts in Conditioned Space Compliance Credit 3.1.4.3.9 Verification of Low Leakage Air-Handling Unit with Sealed and Tested Duct System 3.5 Quality Insulation Installation Procedures
28 This proposal will add requirements for air handler location within conditioned space 29 This compliance option is proposed to be removed
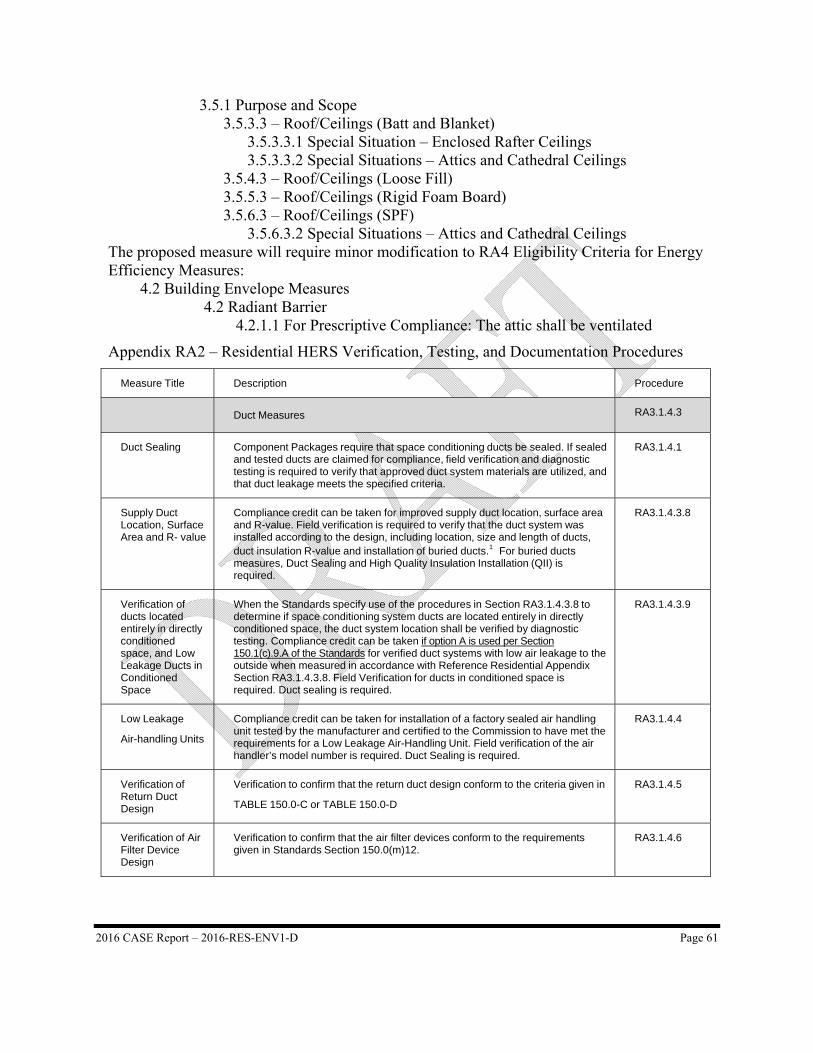
2016 CASE Report – 2016-RES-ENV1-D Page 61
3.5.1 Purpose and Scope 3.5.3.3 – Roof/Ceilings (Batt and Blanket) 3.5.3.3.1 Special Situation – Enclosed Rafter Ceilings 3.5.3.3.2 Special Situations – Attics and Cathedral Ceilings 3.5.4.3 – Roof/Ceilings (Loose Fill) 3.5.5.3 – Roof/Ceilings (Rigid Foam Board) 3.5.6.3 – Roof/Ceilings (SPF) 3.5.6.3.2 Special Situations – Attics and Cathedral Ceilings
The proposed measure will require minor modification to RA4 Eligibility Criteria for Energy Efficiency Measures: 4.2 Building Envelope Measures 4.2 Radiant Barrier 4.2.1.1 For Prescriptive Compliance: The attic shall be ventilated
Appendix RA2 – Residential HERS Verification, Testing, and Documentation Procedures
Measure Title Description Procedure
Duct Measures RA3.1.4.3
Duct Sealing Component Packages require that space conditioning ducts be sealed. If sealed and tested ducts are claimed for compliance, field verification and diagnostic testing is required to verify that approved duct system materials are utilized, and that duct leakage meets the specified criteria.
RA3.1.4.1
Supply Duct Location, Surface Area and R- value
Compliance credit can be taken for improved supply duct location, surface area and R-value. Field verification is required to verify that the duct system was installed according to the design, including location, size and length of ducts, duct insulation R-value and installation of buried ducts.1 For buried ducts measures, Duct Sealing and High Quality Insulation Installation (QII) is required.
RA3.1.4.3.8
Verification of ducts located entirely in directly conditioned space, and Low Leakage Ducts in Conditioned Space
When the Standards specify use of the procedures in Section RA3.1.4.3.8 to determine if space conditioning system ducts are located entirely in directly conditioned space, the duct system location shall be verified by diagnostic testing. Compliance credit can be taken if option A is used per Section 150.1(c).9.A of the Standards for verified duct systems with low air leakage to the outside when measured in accordance with Reference Residential Appendix Section RA3.1.4.3.8. Field Verification for ducts in conditioned space is required. Duct sealing is required.
RA3.1.4.3.9
Low Leakage
Air-handling Units
Compliance credit can be taken for installation of a factory sealed air handling unit tested by the manufacturer and certified to the Commission to have met the requirements for a Low Leakage Air-Handling Unit. Field verification of the air handler’s model number is required. Duct Sealing is required.
RA3.1.4.4
Verification of Return Duct Design
Verification to confirm that the return duct design conform to the criteria given in
TABLE 150.0-C or TABLE 150.0-D RA3.1.4.5
Verification of Air Filter Device Design
Verification to confirm that the air filter devices conform to the requirements given in Standards Section 150.0(m)12.
RA3.1.4.6
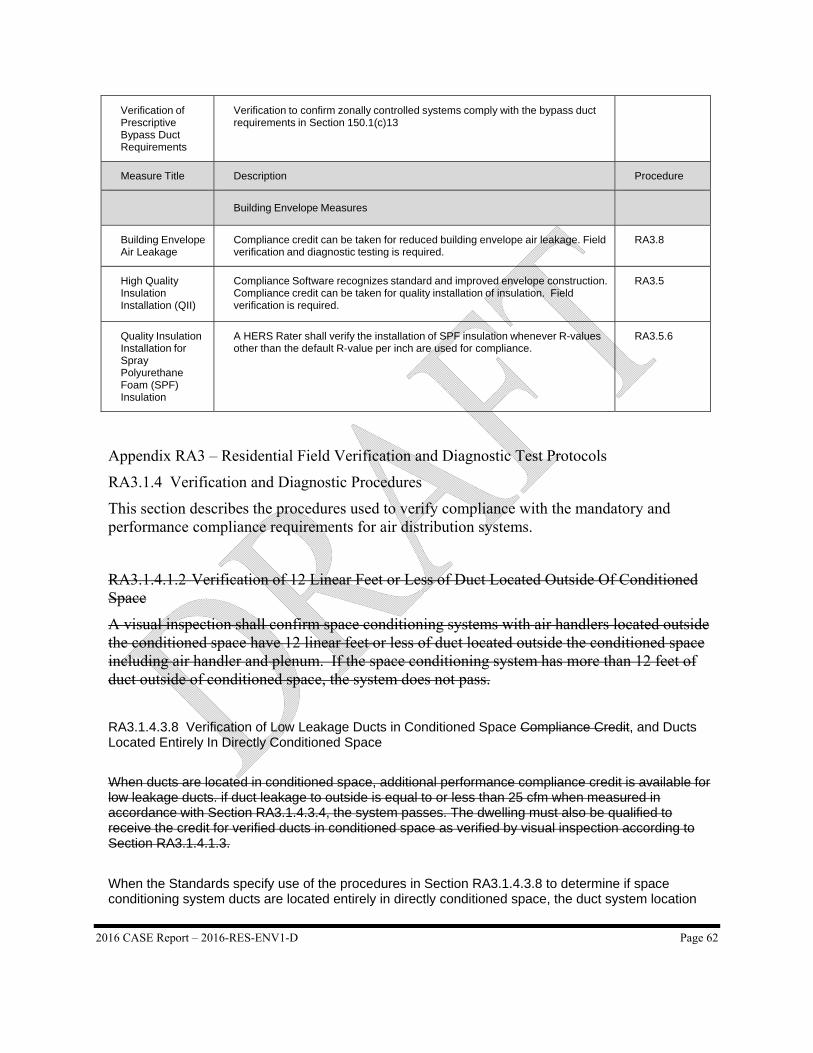
2016 CASE Report – 2016-RES-ENV1-D Page 62
Verification of Prescriptive Bypass Duct Requirements
Verification to confirm zonally controlled systems comply with the bypass duct requirements in Section 150.1(c)13
Measure Title Description Procedure
Building Envelope Measures
Building Envelope Air Leakage
Compliance credit can be taken for reduced building envelope air leakage. Field verification and diagnostic testing is required.
RA3.8
High Quality Insulation Installation (QII)
Compliance Software recognizes standard and improved envelope construction. Compliance credit can be taken for quality installation of insulation. Field verification is required.
RA3.5
Quality Insulation Installation for Spray Polyurethane Foam (SPF) Insulation
A HERS Rater shall verify the installation of SPF insulation whenever R-values other than the default R-value per inch are used for compliance.
RA3.5.6
Appendix RA3 – Residential Field Verification and Diagnostic Test Protocols
RA3.1.4 Verification and Diagnostic Procedures
This section describes the procedures used to verify compliance with the mandatory and performance compliance requirements for air distribution systems.
RA3.1.4.1.2 Verification of 12 Linear Feet or Less of Duct Located Outside Of Conditioned Space
A visual inspection shall confirm space conditioning systems with air handlers located outside the conditioned space have 12 linear feet or less of duct located outside the conditioned space including air handler and plenum. If the space conditioning system has more than 12 feet of duct outside of conditioned space, the system does not pass.
RA3.1.4.3.8 Verification of Low Leakage Ducts in Conditioned Space Compliance Credit, and Ducts Located Entirely In Directly Conditioned Space
When ducts are located in conditioned space, additional performance compliance credit is available for low leakage ducts. if duct leakage to outside is equal to or less than 25 cfm when measured in accordance with Section RA3.1.4.3.4, the system passes. The dwelling must also be qualified to receive the credit for verified ducts in conditioned space as verified by visual inspection according to Section RA3.1.4.1.3.
When the Standards specify use of the procedures in Section RA3.1.4.3.8 to determine if space conditioning system ducts are located entirely in directly conditioned space, the duct system location
2016 CASE Report – 2016-RES-ENV1-D Page 63
shall be verified by diagnostic testing according to the following criterion: If duct leakage to outside is equal to or less than 25 cfm when measured in accordance with Section RA3.1.4.3.4, the system ducts shall be considered to be located entirely in directly conditioned space. Duct systems that do not meet this criterion shall not be considered to be located entirely in directly conditioned space.
RA3.1.4.3.9 Verification of Low Leakage Air-Handling Unit with Sealed and Tested Duct System
An additional performance compliance credit is available for verified low leakage ducts if a qualified low leakage air-handling unit is installed. The low leakage air-handling unit cabinet (furnace, or heat pump fan and inside coil) shall conform to the qualification requirements given in Reference Joint Appendix JA9, and shall be included in the list of low leakage air handling units published by the Energy Commission. The qualified air handler must be connected to a sealed and tested new duct system to receive the credit.
In order to comply with this credit, the duct system shall be verified to leak less than or equal to the leakage rate specified on the Certificate of Compliance using the methods in Section RA3.1.4.3.1, and the air handler manufacturer make and model number shall be verified to be a model certified to the Energy Commission as qualified for credit as a low leakage air handler.
6.3 ACM Reference Manual This section will be updated in the Final CASE report.
6.4 Compliance Manuals This section will be updated in the Final CASE report.
6.5 Compliance Forms This section will be updated in the Final CASE report.
2016 CASE Report – 2016-RES-ENV1-D Page 64
7. REFERENCES AND OTHER RESEARCH [ACC] American Chemistry Council. 2012. “Polyurethane Products: Overview of U.S. Model
Building Code Fire Performance Requirements.” Washington, District of Columbia. http://polyurethane.americanchemistry.com/Resources-and-Document-Library/11361.pdf
[ASTM Standard] American Society for Testing and Materials Standard E108, 2011. “Standard Test Methods for Fire Tests of Roof Coverings.” ASTM International, West Conshohocken, PA, 2011, DOI: 10.1520/E0108-11. http://www.astm.org/Standards/E108.htm
ASTM Standard E84, 2014. “Standard Test Method for Surface Burning Characteristics of Building Materials.” ASTM International, West Conshohocken, PA, 2011, DOI: 10.1520/E0084. http://www.astm.org/Standards/E84.htm
[BA] U.S. Department of Energy (DOE) Building America Technologies Program. 2010a. “Moisture-Safe Unvented Wood Roof Systems (BA Report 1001).” Prepared by Straube, J., Smegal, J. & J. Smith of BSC. http://www.buildingscience.com/documents/bareports/ba-1001-moisture-safe-unvented-wood-roof-systems
__. 2010b. “Case Study: Schneider Homes, Inc.” https://basc.pnnl.gov/sites/default/files/case-studies/Final_BA_NewResidentialCS_Schneider_030613.pdf
__. 2010c. “Building America Special Research Project: High-R Roofs Case Study Analysis.” Prepared by Straube, J. & A. Grin of BSC. http://www.buildingscience.com/documents/bareports/ba-1006-ba-high-r-roofs-case-study-analysis
__. 2011 “Measure Guidelines: Summary of Interior Ducts in New Construction, Including an Efficient, Affordable Method to Install Fur-Down Interior Ducts.” Prepared by Beal, D., Fonorow, K., Martin, E., & J. McIlvaine. http://www.fsec.ucf.edu/en/publications/pdf/FSEC-RR-385-11.pdf
__. 2013. “Application of Spray Foam Insulation Under Plywood and Oriented Strand Board Roof Sheathing (BA Report 1312).” Prepared by Grin, A., Smegal, J. & J. Lstiburek of BSC. http://www.buildingscience.com/documents/bareports/ba-1312-application-of-spray-foam-insulation-under-plywood-and-osb-roof-sheathing
__. 2014. “Above Deck Rigid Foam Insulation for Existing Roofs.” Available at the Building America Solution Center: https://basc.pnnl.gov/resource-guides/above-deck-rigid-foam-insulation-existing-roofs
[BSC] Building Science Corporation. 1998. “Vented and Sealed Attics in Hot Climates (RR-9801).” Prepared by Rudd, A. & J. Lstiburek.
2016 CASE Report – 2016-RES-ENV1-D Page 65
http://www.buildingscience.com/documents/reports/rr-9801-vented-and-sealed-attics-in-hot-climates
__. 2006. “Understanding Attic Ventilation (BSD-102).” Prepared by Lstiburek, J. http://www.buildingscience.com/documents/digests/bsd-102-understanding-attic-ventilation
__. 2007. “Unvented Roof Assemblies for All Climates (BSD-149).” Schumacher, C. http://www.buildingscience.com/documents/digests/bsd-149-unvented-roof-assemblies-for-all-climates
__. 2011a. “Higher Performance Housing FAQ: 2009 IRC Conditioned Attics”. Prepared as part of the U.S. Department of Energy (DOE) Building America (BA) Technologies Program. http://www.buildingscience.com/documents/guides-and-manuals/irc-faqs/irc-faq-conditioned-attics/at_download/file
__. 2011b. “Hygrothermal Analysis of California Attics (RR-1110).” Prepared by Lstiburek, J. & C. Schumacher. http://www.buildingscience.com/documents/reports/rr-1110-hygrothermal-analysis-california-attics
__. 2013a. “Duct Dynasty (BSI-074).” Prepared by Lstiburek, J. http://www.buildingscience.com/documents/insights/bsi-074-duct-dynasty
[CARB] California Air Resources Board. 2010. “Proposed Regulation for a California Renewable Electricity Standard Staff Report: Initial Statement of Reasons Appendix D.” http://www.arb.ca.gov/regact/2010/res2010/res10d.pdf. Accessed November 12, 2013.
__. 2011a. California Air Resources Board. “Appendix C: Cost Effectiveness Calculation Methodology.” March 10. http://www.arb.ca.gov/msprog/moyer/guidelines/2011gl/appc_3_10_11.pdf.
__. 2011b. “Emission Reduction Offsets Transaction Cost Summary Report for 2011.” http://www.arb.ca.gov/nsr/erco/erco.htm.
__. 2012a. “Emission Reduction Offsets Transaction Cost Summary Report for 2012.” http://www.arb.ca.gov/nsr/erco/erco.htm.
__. 2012b. “Ducts in Conditioned Space.” Presented at EEBA Conference.
__. 2013a. “Mail-Out #MSC 13-09.” March 25. http://www.arb.ca.gov/msprog/mailouts/msc1309/msc1309.pdf.
__. 2013b. “California Air Resources Board Quarterly Auction 3, May 2013 – Summary Results Report.” http://www.arb.ca.gov/cc/capandtrade/auction/may-2013/results.pdf.
[CEC] California Energy Commission. Hedrick, R. 2003a. “Home Builders Guide to Ducts in Conditioned Space (500-03-082-A-16).” Prepared by GARD Analytics, Inc. as part of the CEC’s Public Interest Research (PIER) program. http://www.energy.ca.gov/2003publications/CEC-500-2003-082/CEC-500-2003-082-A-16.PDF
2016 CASE Report – 2016-RES-ENV1-D Page 66
__. 2003b. “Residential Duct Placement: Market Barriers (500-03-082-A-30).” Prepared by GARD Analytics, Inc. as part of the CEC’s Public Interest Research (PIER) program. http://www.energy.ca.gov/2003publications/CEC-500-2003-082/CEC-500-2003-082-A-30.PDF
__. 2003c. “Costs & Savings for Houses Built With Ducts in Conditioned Space: Technical Information Report (500-03-082-A-31).” Prepared by GARD Analytics, Inc. as part of the CEC’s Public Interest Research (PIER) program. http://www.energy.ca.gov/2003publications/CEC-500-2003-082/CEC-500-2003-082-A-31.PDF
__.2011 “Life-Cycle Cost Methodology, 2013 California Building Energy Efficiency Standards”. Prepared by Architectural Energy Corporation for the California Energy Commission. http://www.energy.ca.gov/title24/2013standards/prerulemaking/documents/general_cec_documents/2011-01-14_LCC_Methodology_2013.pdf
Fonorow, K., Jenkins, D., Thomas-Rees, S., and Chandra, S. “Low Cost Interior Duct Systems for High Performance Homes in Hot Climates”, ACEEE Summer Study on Energy Efficiency in Buildings, Pacific Grove, Calif., August 15-20, 2010. http://www.aceee.org/files/proceedings/2010/data/papers/1938.pdf
[ICC] International Code Council. 2012a. International Energy Conservation Code. http://publicecodes.cyberregs.com/icod/iecc/2012/
__. 2012b. International Residential Code.
Lubliner et al. 2008. “Moving Ducts Inside: Big Builders, Scientists Find Common Ground.” Paper presented at the ACEEE Summer Study Conference, Pacific Grove, Calif., Aug 17-22. http://www.energy.wsu.edu/documents/aceee_ducts_inside.pdf
[NAHB] National Association of Home Builders Research Center. “ToolBase TechSpecs: Ducts in Conditioned Space.” Prepared for the Partnership for Advancing Technology in Housing (PATH). http://www.toolbase.org/pdf/techinv/ductsinconditionedspace_techspec.pdf
Roberts, D and Winkler, J. 2010. “Ducts in the Attic? What Were They Thinking?” Paper presented at the ACEEE Summer Study on Energy Efficiency in Buildings. http://www.nrel.gov/docs/fy10osti/48163.pdf
Rudd, A. 2006. “Eliminating Attic Vents.” BUILDER (January).
[U.S. EPA] United States Environmental Protection Agency. 2011. “Emission Factors for Greenhouse Gas Inventories.” http://www.epa.gov/climateleadership/documents/emission-factors.pdf. Accessed December 2, 2013.
2016 CASE Report – 2016-RES-ENV1-D Page 67
8. APPENDIX A: ENVIRONMENTAL IMPACTS
METHODOLOGY
Greenhouse Gas Emissions Impacts Methodology
The avoided GHG emissions were calculated assuming an emission factor of 353 metric tons of carbon dioxide equivalents (MTCO2e) per GWh of electricity savings. The Statewide Statewide CASE Team calculated air quality impacts associated with the electricity savings from the proposed measure using emission factors that indicate emissions per GWh of electricity generated.30 When evaluating the impact of increasing the Renewable Portfolio Standard (RPS) from 20 percent renewables by 2020 to 33 percent renewables by 2020, California Air Resources Board (CARB) published data on expected air pollution emissions for various future electricity generation scenarios (CARB 2010). The Statewide Statewide CASE Team used data from CARB’s analysis to inform the air quality analysis presented in this report.
The GHG emissions factor is a projection for 2020 assuming the state will meet the 33 percent RPS goal. CARB calculated the emissions for two scenarios: (1) a high load scenario in which load continues at the same rate; and (2) a low load rate that assumes the state will successfully implement energy efficiency strategies outlined in the AB32 scoping plan thereby reducing overall electricity load in the state.
To be conservative, the Statewide Statewide CASE Team calculated the emissions factors of the incremental electricity between the low and high load scenarios. These emission factors are intended to provide a benchmark of emission reductions attributable to energy efficiency measures that could help achieve the low load scenario. The incremental emissions were calculated by dividing the difference between California emissions in the high and low generation forecasts by the difference between total electricity generated in those two scenarios. While emission rates may change over time, 2020 was considered a representative year for this measure.
Avoided GHG emissions from natural gas savings were calculated using an emission factor of 5,303 MTCO2e/million therms (U.S. EPA 2011).
Greenhouse Gas Emissions Monetization Methodology
The 2013 TDV cost values used in the LCC Methodology includes the monetary value of avoided GHG emissions based on a proxy for permit costs (not social costs) and the Cost-effectiveness Analysis presented in Section 5.2 of this report does include the cost savings from avoided GHG emissions. To demonstrate the cost savings of avoided GHG emissions, the
30 California power plants are subject to a GHG cap and trade program and linked offset programs until 2020 and potentially
beyond.

2016 CASE Report – 2016-RES-ENV1-D Page 68
Statewide Statewide CASE Team disaggregated value of avoided GHG emissions from the other economic impacts. The Statewide Statewide CASE Team used the same monetary values that are used in the TDV factors – $TBD /MTCO2e.
Water Use and Water Quality Impacts Methodology
This measure is not expected to have any direct impacts on water use and water quality.
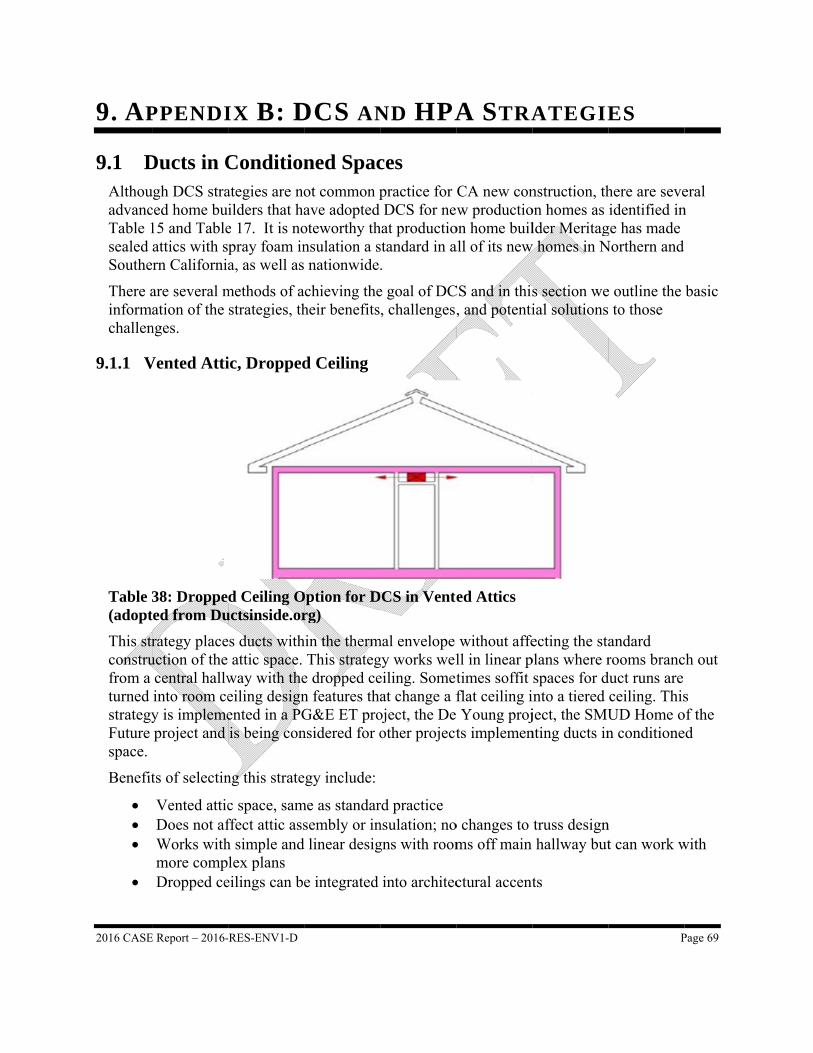
2016 CASE
9. AP
9.1 DAlthouadvancTable 1sealed Southe
There ainformchallen
9.1.1 V
Table 3(adopt
This strconstrufrom a turned strategyFuture space.
Benefit
E Report – 2016-
PPENDI
Ducts in Cugh DCS straced home bu15 and Tableattics with srn California
are several mation of the
nges.
Vented Atti
38: Droppeted from Du
rategy placeuction of the central hallwinto room cey is implemeproject and
ts of selectin
Vented atticDoes not afWorks withmore compDropped ce
-RES-ENV1-D
IX B: D
Conditionategies are noilders that hae 17. It is nopray foam ina, as well as
methods of astrategies, th
ic, Dropped
d Ceiling Ouctsinside.or
es ducts withattic space.
way with theeiling designented in a PGis being con
ng this strate
c space, samffect attic assh simple andlex plans
eilings can be
DCS AN
ned Spacot common pave adopted oteworthy thnsulation a s nationwide
achieving theheir benefits
d Ceiling
Option for Drg)
hin the thermThis strateg
e dropped cen features thaG&E ET pronsidered for o
egy include:
me as standarsembly or in
d linear desig
e integrated
ND HPA
ces practice for DCS for ne
hat productiostandard in a.
e goal of DC, challenges,
DCS in Vente
mal envelope gy works weleiling. Sometat change a f
oject, the Deother project
rd practice nsulation; nogns with room
into architec
A STRA
CA new conw productio
on home builall of its new
CS and in this, and potenti
ed Attics
without affell in linear ptimes soffit flat ceiling i Young projts implemen
o changes to ms off main
ctural accent
ATEGIE
nstruction, thon homes as lder Meritag
w homes in N
s section weial solutions
ecting the staplans where rspaces for d
into a tiered ject, the SMUnting ducts in
truss designhallway but
ts
P
ES
here are seveidentified in
ge has made Northern and
e outline the to those
andard rooms branc
duct runs are ceiling. ThisUD Home on conditione
n t can work w
Page 69
eral n
basic
ch out
s of the ed
with
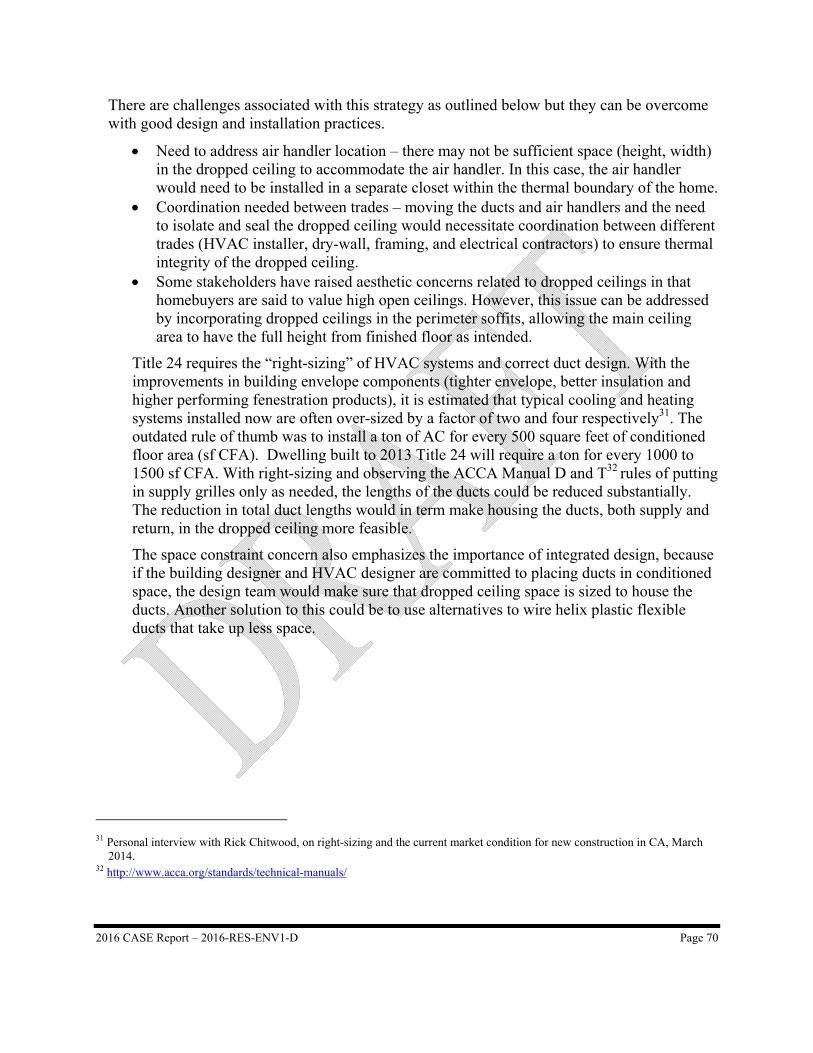
2016 CASE Report – 2016-RES-ENV1-D Page 70
There are challenges associated with this strategy as outlined below but they can be overcome with good design and installation practices.
Need to address air handler location – there may not be sufficient space (height, width) in the dropped ceiling to accommodate the air handler. In this case, the air handler would need to be installed in a separate closet within the thermal boundary of the home.
Coordination needed between trades – moving the ducts and air handlers and the need to isolate and seal the dropped ceiling would necessitate coordination between different trades (HVAC installer, dry-wall, framing, and electrical contractors) to ensure thermal integrity of the dropped ceiling.
Some stakeholders have raised aesthetic concerns related to dropped ceilings in that homebuyers are said to value high open ceilings. However, this issue can be addressed by incorporating dropped ceilings in the perimeter soffits, allowing the main ceiling area to have the full height from finished floor as intended.
Title 24 requires the “right-sizing” of HVAC systems and correct duct design. With the improvements in building envelope components (tighter envelope, better insulation and higher performing fenestration products), it is estimated that typical cooling and heating systems installed now are often over-sized by a factor of two and four respectively31. The outdated rule of thumb was to install a ton of AC for every 500 square feet of conditioned floor area (sf CFA). Dwelling built to 2013 Title 24 will require a ton for every 1000 to 1500 sf CFA. With right-sizing and observing the ACCA Manual D and T32
rules of putting in supply grilles only as needed, the lengths of the ducts could be reduced substantially. The reduction in total duct lengths would in term make housing the ducts, both supply and return, in the dropped ceiling more feasible.
The space constraint concern also emphasizes the importance of integrated design, because if the building designer and HVAC designer are committed to placing ducts in conditioned space, the design team would make sure that dropped ceiling space is sized to house the ducts. Another solution to this could be to use alternatives to wire helix plastic flexible ducts that take up less space.
31 Personal interview with Rick Chitwood, on right-sizing and the current market condition for new construction in CA, March
2014. 32 http://www.acca.org/standards/technical-manuals/
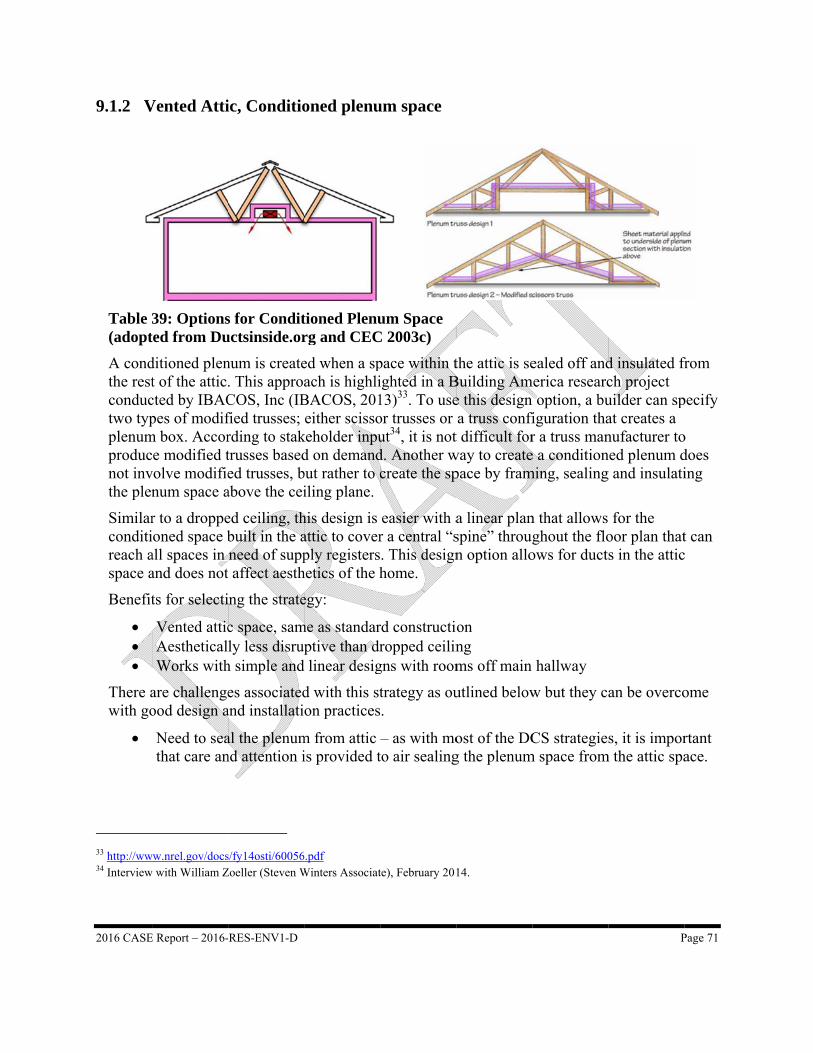
2016 CASE
9.1.2 V
Table 3(adopt
A condthe restconductwo typplenumproducnot invthe plen
Similarconditireach aspace a
Benefit
There awith go
33 http://ww34 Interview
E Report – 2016-
Vented Atti
39: Optionsted from Du
ditioned plent of the atticcted by IBACpes of modif
m box. Accore modified t
volve modifienum space a
r to a droppeioned space ball spaces in and does not
ts for selecti
Vented atticAestheticalWorks with
are challengeood design a
Need to seathat care an
ww.nrel.gov/docsw with William Z
-RES-ENV1-D
ic, Conditio
s for Condituctsinside.or
num is create. This approaCOS, Inc (IBfied trusses; rding to staktrusses baseded trusses, babove the cei
ed ceiling, thbuilt in the aneed of supp
t affect aesth
ing the strate
c space, samly less disrup
h simple and
es associatedand installati
al the plenumnd attention i
s/fy14osti/60056Zoeller (Steven W
oned plenu
tioned Plenurg and CEC
ed when a spach is highli
BACOS, 201either scisso
keholder inpud on demandbut rather to ciling plane.
his design is attic to coverply registers
hetics of the h
egy:
me as standarptive than dr
d linear desig
d with this ston practices
m from atticis provided t
6.pdf Winters Associat
um space
um Space C 2003c)
pace within tighted in a B13)33. To useor trusses or ut34, it is notd. Another wcreate the sp
easier with ar a central “s. This designhome.
rd constructiropped ceilin
gns with room
trategy as ou.
– as with moto air sealing
te), February 201
the attic is seBuilding Ame this design a truss confi
t difficult forway to createpace by fram
a linear planspine” througn option allo
on ng ms off main
utlined below
ost of the DCg the plenum
14.
ealed off andmerica researcn option, a bufiguration thar a truss mane a conditionming, sealing
n that allows ghout the floows for duct
hallway
w but they ca
CS strategiem space from
P
d insulated frch project uilder can spat creates a nufacturer toned plenum dg and insulati
for the oor plan thats in the attic
an be overco
s, it is imporm the attic spa
Page 71
from
pecify
o does ing
t can c
ome
rtant ace.
2016 CASE
9.1.3 V
Table 4(adopt
This ophouse dbut areand Openoughheightsover thfloor trpracticto wire
Coordiensure betweethe secarea, Q
E Report – 2016-
May requirespecificatiofeasible and
Vented Atti
40: Open Wted from Du
ption can woducts. Open- available fr
pen Joist. Thh space for sus. An industrhe limit estabruss, there is es such as fo
e helix plastic
ination betwethat ducts ar
en floors to hond story an
Quadrant Hom
-RES-ENV1-D
e modified tons that can bd manufactur
ic, Open W
Web Floor Tuctsinside.or
ork for two-s-web floor trrom several fhe depth of flupply ducts.ry expert alsoblished by lo
a need to prorcing 14” dc flexible du
een the archre correctly house ducts pnd the ceilingmes and New
trusses in whbe met. Feedrers are capa
Web Floor T
Truss rg and Steve
story construrusses are nofloor joist mloor joists m The increaso suggested
ocal jurisdictreserve cons
ducts into a 1ucts that take
hitect and thesized and truprescribes thg or upper ww Tradition H
hich case madback from sable of provi
Truss
en Winter A
uction and mot a common
manufacturersmay need to b
sed joist depthat sometimion. Becausetruction qua2” joist spac
e up less spa
e HVAC enguss depths arhat supply rewall in the fir
Homes, hav
anufacturers stakeholdersiding these t
Associates, I
makes use of n components such as Rebe increased pth may impames this coue of the size
ality and prevces. Another
ace.
gineer and/orre appropriategisters be atrst story. Twe extensively
need to be ps is that this itrusses.
Inc. 2014)
the space bet in residentidBuilt, Trimin order to c
act interior duld push the b
constraints vent undesirr option is to
r contractor tely selectedt the floor or
wo builders iny used this d
P
provided witis technically
etween floorial constructi
mJoist, Spacecreate a largedetails and wbuilding heifrom using t
rable construo use alternat
is needed tod. Using the r lower wall n the Washindesign and se
Page 72
th y
rs to ion, eJoist e
wall ght the uction tives
o area in ngton ee
2016 CASE Report – 2016-RES-ENV1-D Page 73
the benefits of open web floor trusses, which can also be used to house components of other systems (Lubliner 200835).
Benefits for selecting this strategy include:
Works for homes with two or more stories Vented attic space remains same as standard practice Allows access to all rooms across joists since the truss is between floors Open access for other plumbing and electrical needs
There are challenges associated with this strategy as outlined below but they can be overcome with good design and installation practices.
Lack of experience in California with this strategy – This approach has been done for decades but has not been emphasized. We have not found any recent subdivision scale projects within California that have implemented this strategy; however, it has been adopted by two builders in the Pacific Northwest: Quadrant Homes and New Tradition Homes.
Requires designer and trade coordination: structural, HVAC, and architectural – As with many of these strategies, knowing where trades can place their components and make penetrations is important. Training and coordination are critical to ensure that trades don’t get in the way of each other or cause damage to work done by another trade.
May require deep or enhanced openings trusses to fit ducts, which could affect house height and exterior details and materials – HVAC contractors need to be consulted during the design phase so that the builder knows what truss openings will be needed to accommodate ducts and what possible impacts this will have on the height of the building Another solution to this could be to use alternatives to wire helix plastic flexible ducts that take up less space.
Need to seal and insulate rim joists - as with most of the DCS strategies, it is important that care and attention is provided to air sealing the rim joists separating the exterior conditions from the truss cavity. Two options to accomplish this are to use high-density spray foam at the rim joist, or to use a combination of fiberglass and rigid foam insulation in the joist bay at the rim location36 (NEEA 2011). A visual inspection is necessary to ensure that the joiss are sealed properly.
Running ducts to rooms above unconditioned space (garage) – The joist cavities need to be insulated for areas separating conditioned and unconditioned spaces. There is often not space for both ducts and insulation in these cavities. Options to solve this are to either run ducts up interior walls to serve these rooms or run ducts through cavity
35 http://www.energy.wsu.edu/documents/aceee_ducts_inside.pdf 36 http://ductsinside.org/

2016 CASE
9.1.4 U
Table 4(adopt
Interviedeck anconditiis in linfrom thphysica
Builderand Buusing thsaid thaenergyhe furthbe diffi
Advancstrategypursue reduce ceiling other nmethodMeritagrather twith la
Benefit
E Report – 2016-
and place in2011).
Unvented at
41: Unventeted from Du
ews with indnd sealing thioned space. ne with currehe ceiling to al enclosure
rs participatiuilding Amerhis method. at “sealed at. The additioher noted thaicult for prod
ced buildersy in the marksealed atticsheating andlevel, which
necessary comd to be cost-ege’s chief suthan implem
arge scale pro
ts for selecti
-RES-ENV1-D
nsulation bel
ttic (Sealed
ed Attic uctsinside.or
dustry experthe attic spaceThis design
ent constructthe roof lineof the house
ing in IOU Erica programOne of the btics are by faonal conditioat “this strateduction hom
such as Pultket. Meritags in all reside
d cooling loah is often commponents. Aeffective in tustainability
menting it in aocurements.
ing this strate
low the area
d)
rg)
ts on high pee is a commo
n allows for dtion practicee – effectivee.
Emerging Tems have provbuilders worfar the most eoned space isegy might b
mes.”
te Homes, Sge, a nationalential constrds. They foumpromised b
Although the the market aofficer notea few develo
egy:
as where the
erformance bonly construducts and eqes. The mainly extending
echnology prvided positivrking with thefficient mets more than e cost prohib
Shea Homes l home buildruction after und that sealby penetratiocosts may a
and they havs that the tra
opments bec
ducts are uti
buildings shucted option quipment to bn change is thg the buildin
rograms, DOve feedback ohe IOU Emerthod of consoffset by thebitive and co
and Meritagder, made the
researchingled attics elimons for light
appear high, e found way
ansition was ause of their
ilizing the ca
hows that insfor getting dbe placed in hat the insula
ng thermal en
OE Challengor showcaserging Technserving spacee energy savonstruction s
ge have imple decision ar
g and comparminate the nting, sprinkeMeritage ha
ys to offset smade acros
r ability to d
P
avity (NEEA
sulating the rducts in the attic, whation is movnclosure to th
ge Home prod positive re
nology progre conditionin
vings.” Howescheduling m
lemented thiround 2006 tring options
need to seal aer heads, andas found thisome of the cs the compan
drive costs do
Page 74
A
roof
hich ved he
ogram esults am ng ever,
may
s to to
at the d s costs. ny own
2016 CASE Report – 2016-RES-ENV1-D Page 75
Bring attic temperatures closer to conditioned space – effectively making the attic space a ‘semi-conditioned’ space
Ducts and equipment stay out of the way and do not take up valuable floor space as in the traditional vented attic
Reduces the need to seal ceiling plane around penetrations such as lighting, sprinklers etc.
There are challenges associated with this strategy as outlined below but they can be overcome with good design and installation practices.
Need to address moisture management (similar to HPA options) – There are no documented moisture issues associated with implementing sealed attics in California to the Statewide CASE Team’s knowledge. Several building science research studies have provided solutions for California climate zones based on field and simulated observations. Production builders that are using roof deck insulation have reported that they have not seen any issues related to moisture damage. If care is taken and proper materials are used, moisture should not be an issue for this strategy. These solutions are elaborated on below.
Need to seal attic-to-deck junction - as with most of the DCS strategies, it is important that care and attention is provided to air sealing the attic edges. Quality air-sealing can be accomplished with the use of air-impermeable spray foam insulation.
Use of sealed combustion equipment – All furnaces require flue vents to remove combustion gases from the building. Natural draft furnaces that draw combustion air from the space in which they are located or through ducts to the outside as specified in the mechanical code. Sealed combustion equipment will need combustion air piping or ducting installed as specified by the manufacturer.
Product service life for asphalt tile roofing – A study performed by BSC (2006)37 found that the impact to roof surface temperature due to unvented attics is the same as adding a radiant barrier in a vented attic. Roof color and orientation have more important impact on lifespan that the presence of roof deck insulation. Builders who are concerned can use above-deck insulation products with integrated ventilation, or add spacers or “counter batten” to provide more air spaces for ventilation.
There is wide variety of available insulation products that can be used for sealed attic, however, special attention is needed when using air-permeable insulation under the roof deck. Installation of air-permeable insulation below the roof deck on its own allows interior moisture source to cause condensation on the interior surface and within insulation via air movement. Since the attic space is unvented, the interior moisture will not have proper dryer potential to air out any moisture accumulated in the insulation. Therefore, proper measures are needed to use air-permeable below deck insulation for unventee attics.
37 http://www.buildingscience.com/documents/digests/bsd-102-understanding-attic-ventilation
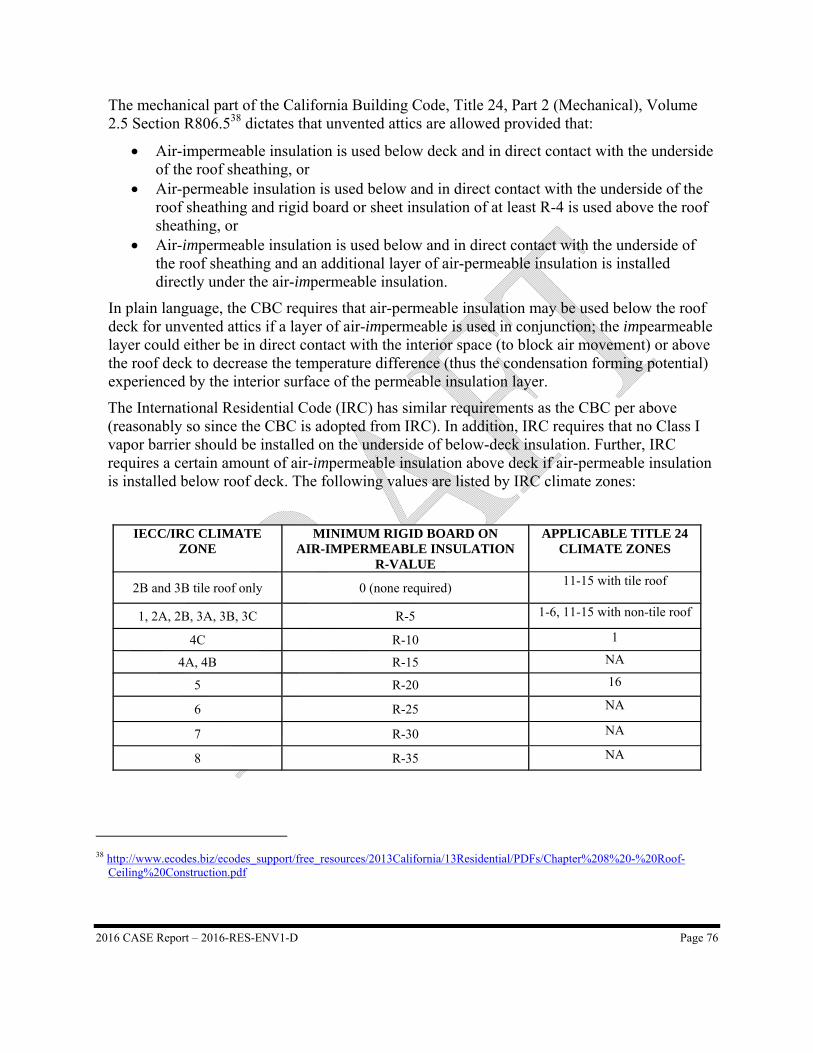
2016 CASE Report – 2016-RES-ENV1-D Page 76
The mechanical part of the California Building Code, Title 24, Part 2 (Mechanical), Volume 2.5 Section R806.538 dictates that unvented attics are allowed provided that:
Air-impermeable insulation is used below deck and in direct contact with the underside of the roof sheathing, or
Air-permeable insulation is used below and in direct contact with the underside of the roof sheathing and rigid board or sheet insulation of at least R-4 is used above the roof sheathing, or
Air-impermeable insulation is used below and in direct contact with the underside of the roof sheathing and an additional layer of air-permeable insulation is installed directly under the air-impermeable insulation.
In plain language, the CBC requires that air-permeable insulation may be used below the roof deck for unvented attics if a layer of air-impermeable is used in conjunction; the impearmeable layer could either be in direct contact with the interior space (to block air movement) or above the roof deck to decrease the temperature difference (thus the condensation forming potential) experienced by the interior surface of the permeable insulation layer.
The International Residential Code (IRC) has similar requirements as the CBC per above (reasonably so since the CBC is adopted from IRC). In addition, IRC requires that no Class I vapor barrier should be installed on the underside of below-deck insulation. Further, IRC requires a certain amount of air-impermeable insulation above deck if air-permeable insulation is installed below roof deck. The following values are listed by IRC climate zones:
IECC/IRC CLIMATE ZONE
MINIMUM RIGID BOARD ON AIR-IMPERMEABLE INSULATION
R-VALUE
APPLICABLE TITLE 24 CLIMATE ZONES
2B and 3B tile roof only 0 (none required) 11-15 with tile roof
1, 2A, 2B, 3A, 3B, 3C R-5 1-6, 11-15 with non-tile roof
4C R-10 1
4A, 4B R-15 NA
5 R-20 16
6 R-25 NA
7 R-30 NA
8 R-35 NA
38 http://www.ecodes.biz/ecodes_support/free_resources/2013California/13Residential/PDFs/Chapter%208%20-%20Roof-
Ceiling%20Construction.pdf
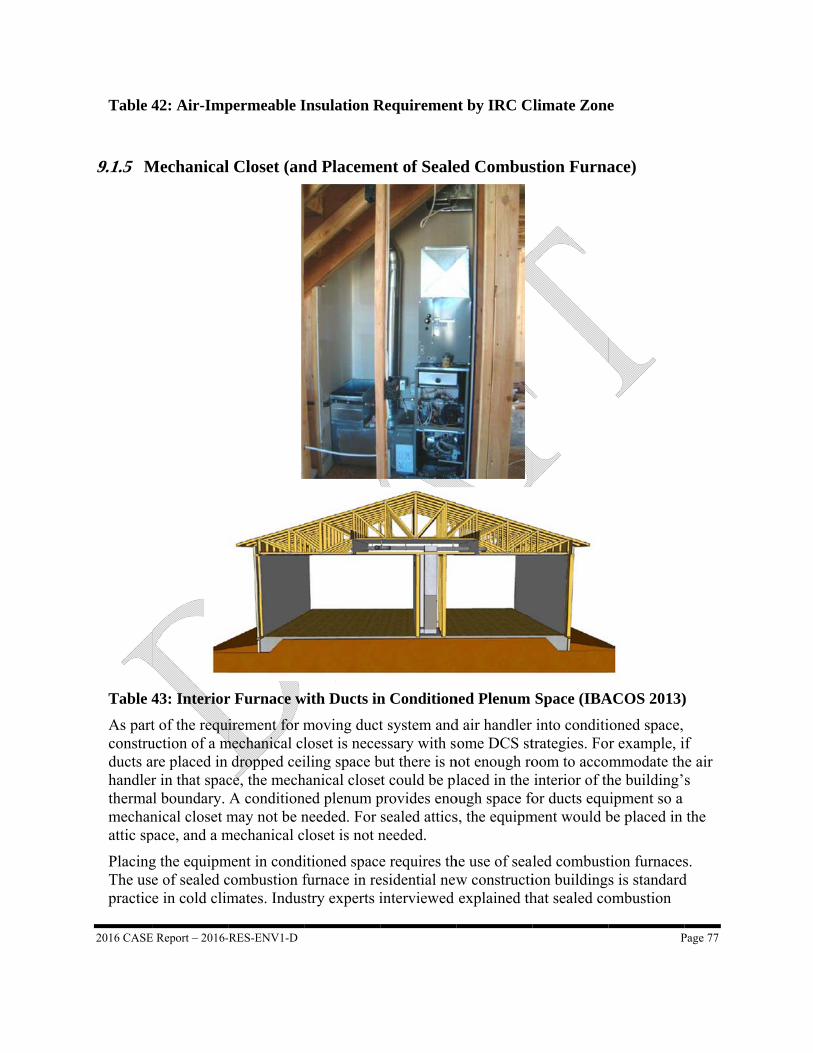
2016 CASE
Table 4
9.1.5 M
Table 4
As partconstruducts ahandlerthermamechanattic sp
PlacingThe usepractic
E Report – 2016-
42: Air-Imp
Mechanical
43: Interior
t of the requuction of a mare placed in r in that spac
al boundary. nical closet mpace, and a m
g the equipme of sealed ce in cold clim
-RES-ENV1-D
permeable I
l Closet (an
r Furnace w
irement for mmechanical cl
dropped ceice, the mechA conditionmay not be n
mechanical c
ment in condicombustion fmates. Indus
Insulation R
nd Placeme
with Ducts in
moving ductloset is neceiling space b
hanical closened plenum pneeded. For loset is not n
itioned spacefurnace in restry experts i
Requiremen
ent of Seale
n Condition
t system andessary with sbut there is nt could be pl
provides enosealed atticsneeded.
e requires thesidential newinterviewed
nt by IRC C
ed Combus
ned Plenum
d air handler ome DCS st
not enough rolaced in the
ough space fos, the equipm
he use of seaw constructiexplained th
limate Zone
stion Furna
Space (IBA
into condititrategies. Fooom to accointerior of th
for ducts equment would b
led combustion buildinghat sealed co
P
e
ace)
ACOS 2013)
ioned space, r example, immodate thhe building’
uipment so a be placed in
tion furnacess is standard
ombustion
Page 77
)
f he air s
the
s. d
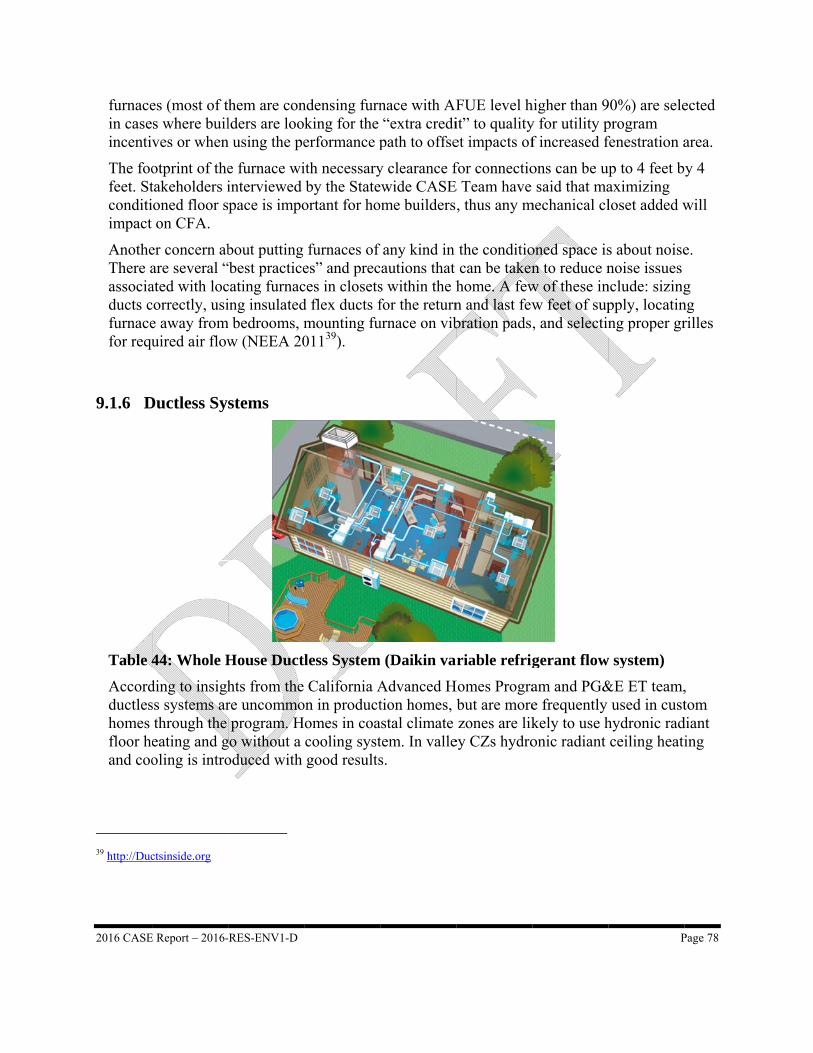
2016 CASE
furnacein caseincentiv
The foofeet. Stconditiimpact
AnotheThere aassociaducts cfurnacefor requ
9.1.6 D
Table 4
Accordductleshomes floor heand coo
39 http://Duc
E Report – 2016-
es (most of ts where builves or when
otprint of thetakeholders iioned floor son CFA.
er concern abare several “ated with loccorrectly, usie away fromuired air flow
Ductless Sy
44: Whole H
ding to insighss systems arthrough the eating and goling is intro
ctsinside.org
-RES-ENV1-D
hem are conlders are loo
n using the pe
e furnace wiinterviewed pace is impo
bout putting “best practicecating furnacing insulated
m bedrooms, mw (NEEA 20
stems
House Duct
hts from the re uncommoprogram. H
go without a oduced with
ndensing furnking for the erformance p
ith necessaryby the State
ortant for ho
furnaces of es” and precces in closetsd flex ducts fmounting fu01139).
less System
California Aon in productomes in coacooling systgood results
nace with AF“extra credipath to offse
y clearance fewide CASEome builders
f any kind in cautions that s within the hfor the returnurnace on vib
(Daikin va
Advanced Htion homes, b
astal climate tem. In valles.
FUE level hit” to qualityet impacts of
for connectioE Team have
, thus any m
the conditiocan be takenhome. A fewn and last fewbration pads
riable refrig
Homes Prograbut are morezones are lik
ey CZs hydro
higher than 9y for utility pf increased f
ons can be usaid that ma
mechanical cl
oned space isn to reduce n
w of these inw feet of sup, and selectin
gerant flow
am and PG&e frequently kely to use honic radiant
P
90%) are seleprogram fenestration a
up to 4 feet baximizing loset added w
s about noisenoise issues
nclude: sizingpply, locatinng proper gr
w system)
&E ET team,used in cust
hydronic radceiling heati
Page 78
ected
area.
y 4
will
e.
g ng rilles
, tom
diant ing
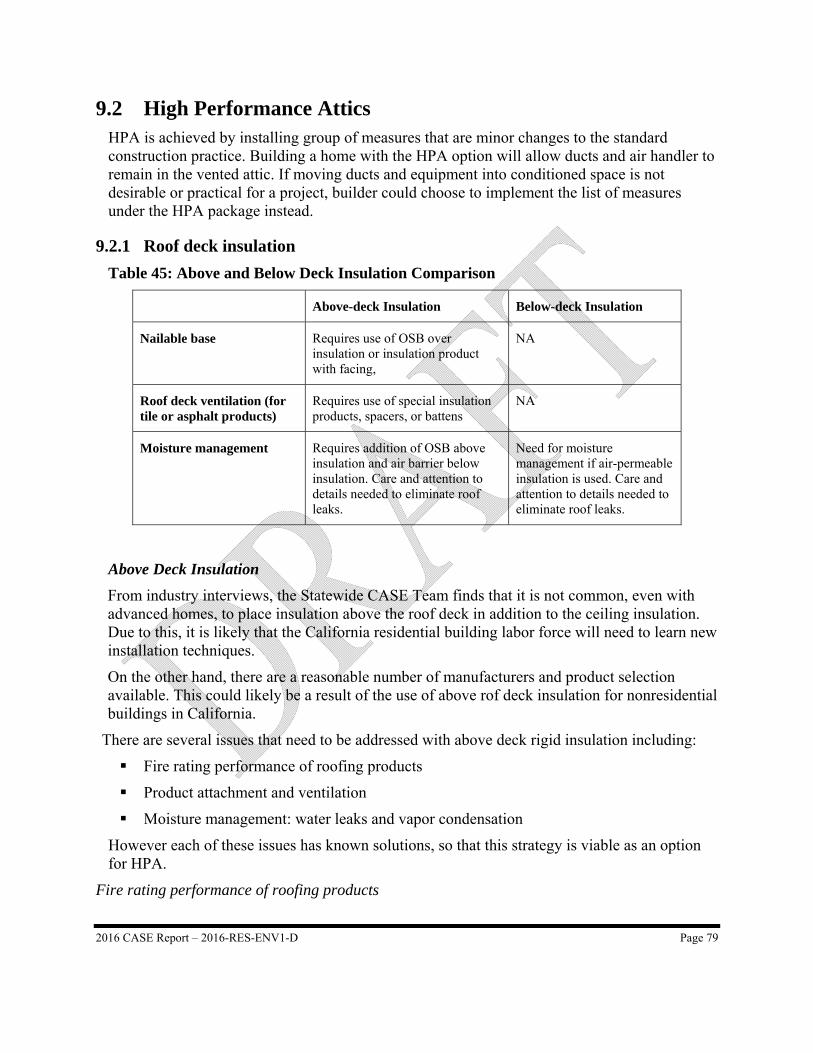
2016 CASE Report – 2016-RES-ENV1-D Page 79
9.2 High Performance Attics HPA is achieved by installing group of measures that are minor changes to the standard construction practice. Building a home with the HPA option will allow ducts and air handler to remain in the vented attic. If moving ducts and equipment into conditioned space is not desirable or practical for a project, builder could choose to implement the list of measures under the HPA package instead.
9.2.1 Roof deck insulation
Table 45: Above and Below Deck Insulation Comparison
Above-deck Insulation Below-deck Insulation
Nailable base Requires use of OSB over insulation or insulation product with facing,
NA
Roof deck ventilation (for tile or asphalt products)
Requires use of special insulation products, spacers, or battens
NA
Moisture management Requires addition of OSB above insulation and air barrier below insulation. Care and attention to details needed to eliminate roof leaks.
Need for moisture management if air-permeable insulation is used. Care and attention to details needed to eliminate roof leaks.
Above Deck Insulation
From industry interviews, the Statewide CASE Team finds that it is not common, even with advanced homes, to place insulation above the roof deck in addition to the ceiling insulation. Due to this, it is likely that the California residential building labor force will need to learn new installation techniques.
On the other hand, there are a reasonable number of manufacturers and product selection available. This could likely be a result of the use of above rof deck insulation for nonresidential buildings in California.
There are several issues that need to be addressed with above deck rigid insulation including:
Fire rating performance of roofing products
Product attachment and ventilation
Moisture management: water leaks and vapor condensation
However each of these issues has known solutions, so that this strategy is viable as an option for HPA.
Fire rating performance of roofing products
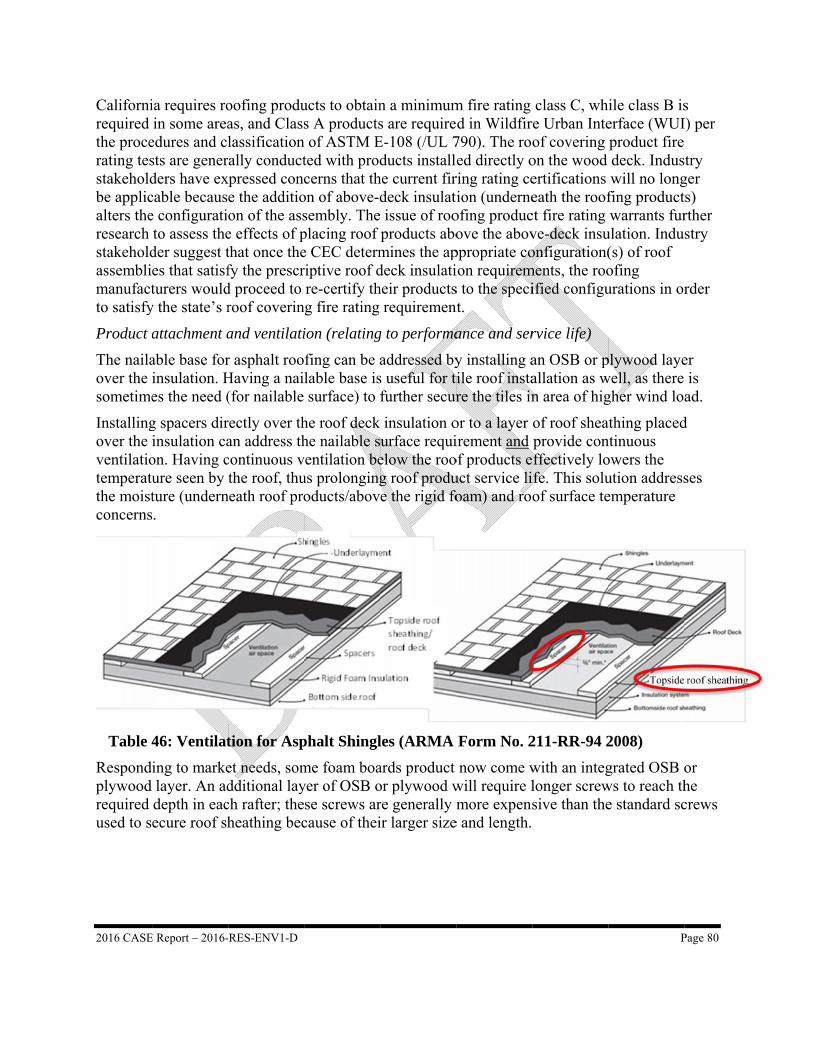
2016 CASE
Californirequired the procerating tesstakeholdbe applicalters theresearch stakeholdassemblimanufactto satisfy
Product a
The nailaover the sometime
Installingover the ventilatiotemperatuthe moistconcerns
Table 4
Respondplywood required used to s
E Report – 2016-
ia requires roin some area
edures and clsts are generders have excable because configuratito assess the
der suggest tes that satisfturers would
y the state’s r
attachment a
able base forinsulation. Hes the need (
g spacers dirinsulation caon. Having cure seen by ture (undern.
46: Ventilat
ing to markelayer. An addepth in eacecure roof sh
-RES-ENV1-D
oofing produas, and Classlassification
rally conductxpressed conce the additioon of the asse effects of pthat once thefy the prescrd proceed to roof coverin
and ventilati
r asphalt rooHaving a nai(for nailable
rectly over than address thcontinuous vthe roof, thu
neath roof pro
tion for Asp
et needs, somdditional laych rafter; theheathing bec
ucts to obtains A products
n of ASTM Eted with prodcerns that th
on of above-dsembly. Theplacing roof e CEC determriptive roof dre-certify th
ng fire rating
ion (relating
fing can be alable base issurface) to f
he roof deck he nailable s
ventilation beus prolongingoducts/abov
phalt Shingl
me foam boayer of OSB ose screws arcause of thei
n a minimums are requireE-108 (/UL 7ducts install
he current firdeck insulati issue of rooproducts abomines the apdeck insulatiheir products
requirement
g to performa
addressed bys useful for tifurther secur
insulation ourface requielow the roog roof produe the rigid fo
les (ARMA
ards product or plywood wre generally mir larger size
m fire rating d in Wildfir
790). The rooed directly o
ring rating ceion (underne
ofing producove the abov
ppropriate coion requirems to the specint.
ance and ser
y installing aile roof instare the tiles in
or to a layer irement andof products euct service lioam) and roo
Form No. 2
now come wwill require lmore expens
e and length.
class C, whre Urban Inteof covering on the wood ertifications eath the roofct fire rating ve-deck insuonfiguration(
ments, the rooified configu
rvice life)
an OSB or pallation as wn area of hig
of roof sheaprovide conffectively lo
ife. This soluof surface te
211-RR-94 2
with an integlonger screwsive than the
P
ile class B iserface (WUIproduct fire deck. Induswill no long
fing productwarrants fur
ulation. Indu(s) of roof ofing urations in or
plywood layewell, as there gher wind lo
athing placedntinuous owers the ution addressemperature
2008)
grated OSB ows to reach the standard sc
Topside
Page 80
s I) per
try ger ts) rther stry
rder
er is
ad.
d
ses
or he crews
roof sheathing
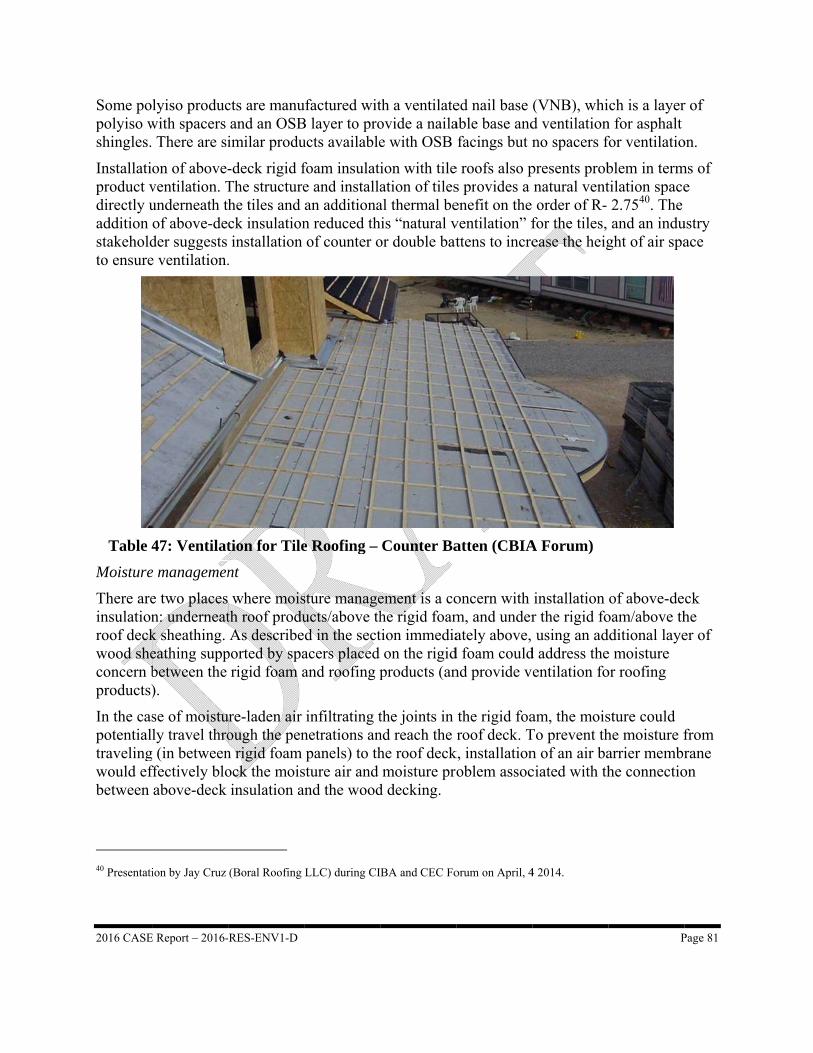
2016 CASE
Some popolyiso wshingles.
Installatiproduct vdirectly uaddition stakeholdto ensure
Table 4
Moisture
There areinsulationroof deckwood sheconcern bproducts)
In the caspotentialtravelingwould efbetween
40 Presentati
E Report – 2016-
lyiso producwith spacers There are si
on of above-ventilation. Tunderneath thof above-deder suggests e ventilation.
47: Ventilat
e managemen
e two placesn: underneatk sheathing. eathing suppbetween the ).
se of moistuly travel thro
g (in betweenffectively bloabove-deck
ion by Jay Cruz
-RES-ENV1-D
cts are manuand an OSBimilar produ
-deck rigid fThe structurehe tiles and ck insulationinstallation
.
tion for Tile
nt
where moisth roof produAs describe
ported by sparigid foam a
ure-laden air ough the penn rigid foam ock the moisinsulation a
(Boral Roofing
ufactured witB layer to proucts available
foam insulatie and installaan additionan reduced thof counter o
e Roofing –
sture manageucts/above thd in the sectacers placed and roofing p
infiltrating tnetrations anpanels) to th
sture air and and the wood
LLC) during CI
th a ventilateovide a nailae with OSB
ion with tileation of tilesal thermal behis “natural vor double bat
Counter Ba
ement is a cohe rigid foamtion immediaon the rigid
products (an
the joints in nd reach the he roof deckmoisture pro
d decking.
BA and CEC Fo
ed nail base able base andfacings but n
e roofs also ps provides a enefit on the ventilation” fttens to incre
atten (CBIA
oncern with m, and underately above,
d foam couldnd provide v
the rigid foaroof deck. T
k, installationoblem assoc
orum on April, 4
(VNB), whid ventilationno spacers f
presents probnatural vent order of R- for the tiles, ease the heig
A Forum)
installation r the rigid fousing an ad
d address theentilation fo
am, the moisTo prevent thn of an air baciated with th
4 2014.
P
ch is a layern for asphalt for ventilatio
blem in termtilation space2.7540. The and an indu
ght of air spa
of above-deoam/above thdditional layee moisture or roofing
sture could he moisture farrier membrhe connectio
Page 81
r of
on.
ms of e
ustry ace
ck he er of
from rane
on
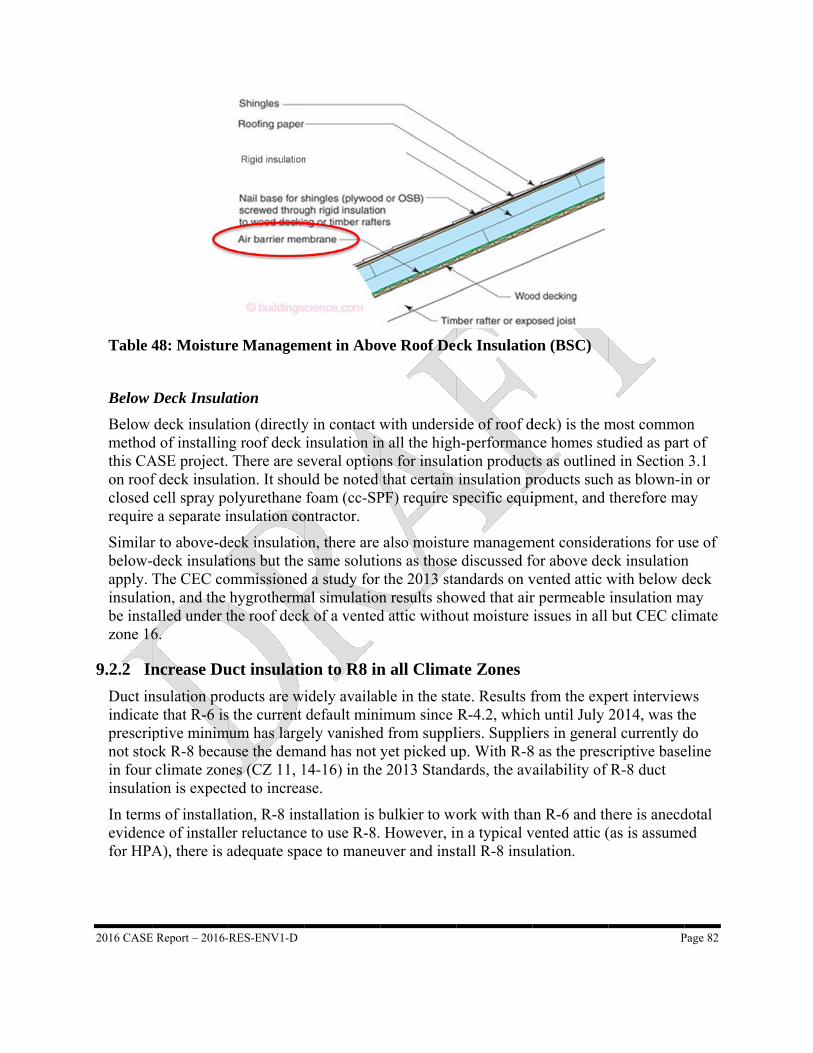
2016 CASE
Table 4
Below
Below methodthis CAon roofclosed require
Similarbelow-apply. insulatibe instazone 16
9.2.2 In
Duct inindicatprescripnot stocin four insulati
In termevidencfor HPA
E Report – 2016-
48: Moistur
Deck Insula
deck insulatd of installinASE project.f deck insulacell spray po
e a separate i
r to above-dedeck insulatThe CEC coion, and the alled under t6.
ncrease Du
nsulation proe that R-6 isptive minimck R-8 becauclimate zon
ion is expect
ms of installace of installeA), there is a
-RES-ENV1-D
re Managem
ation
tion (directlyng roof deck There are se
ation. It shouolyurethane insulation co
eck insulatiotions but the ommissionedhygrotherm
the roof deck
uct insulati
oducts are ws the current
mum has larguse the dema
nes (CZ 11, 1ted to increa
ation, R-8 inser reluctanceadequate spa
ment in Abo
y in contact winsulation ineveral optionuld be noted foam (cc-SP
ontractor.
on, there are same soluti
d a study for al simulationk of a vented
ion to R8 in
idely availabdefault miniely vanishedand has not 14-16) in thease.
stallation is be to use R-8.ace to maneu
ove Roof De
with undersin all the highns for insulathat certain
PF) require s
also moistuons as thosethe 2013 sta
n results shod attic withou
n all Clima
ble in the staimum since d from supplyet picked u
e 2013 Stand
bulkier to wo However, inuver and inst
ck Insulatio
ide of roof dh-performanation productinsulation p
specific equi
ure manageme discussed foandards on vowed that airut moisture
ate Zones
ate. Results fR-4.2, which
liers. Supplieup. With R-8dards, the av
ork with than a typical vtall R-8 insu
on (BSC)
deck) is the mnce homes stuts as outlined
products suchipment, and
ment considerfor above decvented attic wr permeable issues in all
from the exph until July ers in genera
8 as the prescailability of
an R-6 and thvented attic (ulation.
P
most commoudied as pard in Section h as blown-itherefore ma
rations for uck insulationwith below dinsulation mbut CEC cli
pert interview2014, was thal currently dcriptive baseR-8 duct
here is anecd(as is assume
Page 82
on rt of
3.1 n or ay
use of n deck
may imate
ws he do eline
dotal ed
2016 CASE Report – 2016-RES-ENV1-D Page 83
9.2.3 Reduced Duct Leakage
Standard duct installations in CA often meet or exceed the 6% duct leakage requirement in Title 24. The HERS database does not track the actual duct leakage rate – just whether the building meets the Title 24 requirements. However, anecdotal evidence through our interviews with industry experts suggest that reducing duct leakage below the current 6% requirement is common among advanced new home construction in California where HERS testing has been required for a while and there is overall intent to improve building performance.
According to our interviews with HERS raters, there are duct leakage “weak points” within current installation practices that present opportunities for achieving lower leakage rates:
air handler unit
the connection at joints
Between duct boots to drywall/carpet.
Most interview respondents noted that using low leakage air-handlers (LLAHs) is the best way to achieve 4% or lower leakage. Further one of the interviewees notes that Pulte Homes exclusively uses LLAHs (Personal communication 2014).
Low leakage air handlers are factory certified to have leakage lower than 2% of the nominal airflow rate. Though these low leakage units are higher in costs, there are many available products in the market certified through the ENERGY STAR® program41 as well as listed in the CEC database. The CEC’s 2008 database contains over 1600 certified low leakage air handler models from many major manufacturers42.
Leakage that occurs at duct boot connection to interior space can be reduced by installing boots with flanges or other parts designed to lower duct leakage. Installers could also ensure tighter connections by applying the appropriate amount of sealant material/ties and properly strapping and sealing inner linings at connections. HVAC contractors and painters do not agree on whose responsibility it is to perform sealing at the connection (HVAC contractor vs. painter), so clear division of responsibility in the project team could also mean the job gets done properly.
Although there are duct sealing protocols to follow to achieve tighter ducts, the experts interviewed agreed that there are implementation challenges in a production home environment. The challenges stem from having a tight construction schedule and its impact on time and attention allotted to installation details. Most production builders feel that they can’t get the systems any tighter than it currently is. The implication for production builders is that HVAC contractors will have to be trained on the improved installation practices.
41 Program Criteria for 4.0 for Furnaces:
http://www.energystar.gov/ia/partners/prod_development/revisions/downloads/furnaces/Final_Version_4.0_Specification.pdf?0803-1d33
42 http://www.energy.ca.gov/title24/equipment_cert/llahu/index.html
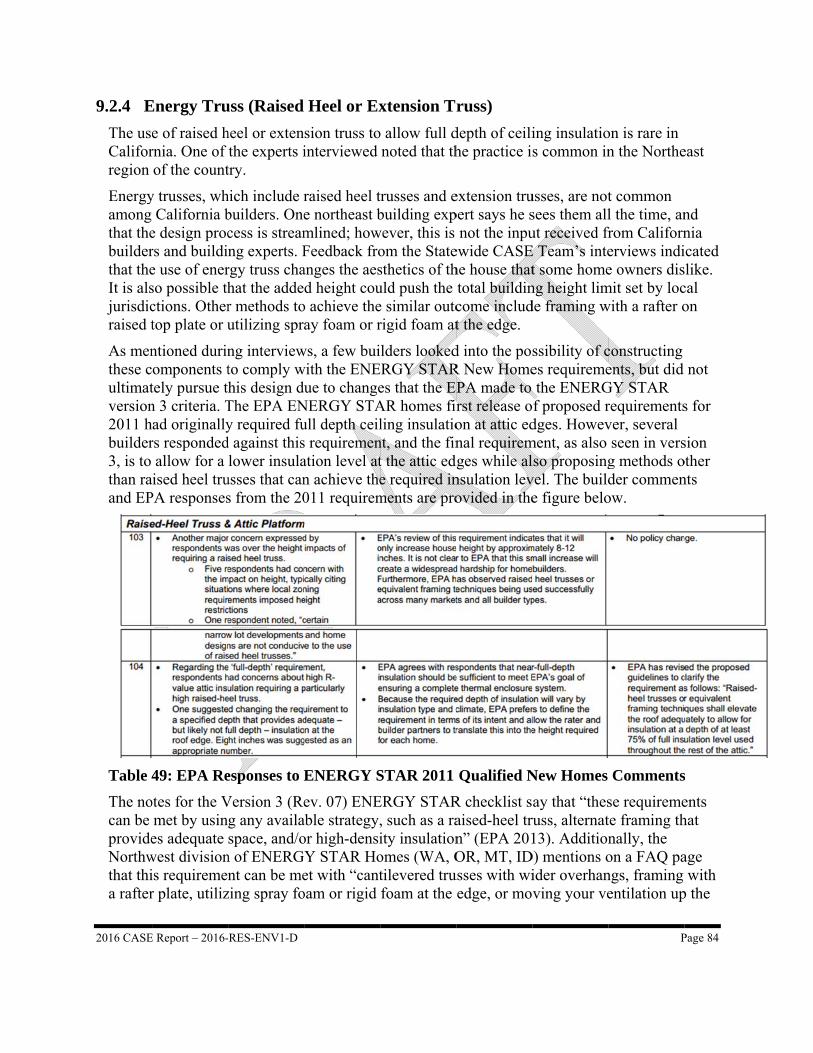
2016 CASE
9.2.4 E
The useCaliforregion
Energyamong that thebuilderthat theIt is alsjurisdicraised t
As menthese cultimatversion2011 hbuilder3, is to than raand EP
Table 4
The nocan be provideNorthwthat thia rafter
E Report – 2016-
Energy Tru
e of raised hrnia. One of of the count
y trusses, whCalifornia b
e design procrs and buildine use of enerso possible thctions. Othertop plate or u
ntioned durinomponents ttely pursue thn 3 criteria. Tad originally
rs respondedallow for a
aised heel truPA responses
49: EPA Re
otes for the Vmet by usines adequate
west divisionis requiremenr plate, utiliz
-RES-ENV1-D
uss (Raised
heel or extenthe experts itry.
hich include rbuilders. Onecess is streamng experts. Frgy truss chahat the adder methods toutilizing spra
ng interviewto comply whis design duThe EPA ENy required fu
d against thislower insula
usses that cans from the 20
esponses to E
Version 3 (Reg any availaspace, and/o
n of ENERGnt can be me
zing spray fo
Heel or Ex
sion truss tointerviewed
raised heel te northeast bmlined; howFeedback froanges the aesd height cou
o achieve theay foam or r
ws, a few buiwith the ENE
ue to changeNERGY STAull depth ceils requiremenation level atn achieve the011 requirem
ENERGY S
ev. 07) ENEable strategy,or high-densiY STAR Hoet with “cantoam or rigid
xtension Tr
o allow full dnoted that th
trusses and ebuilding exp
wever, this is om the Statesthetics of thuld push the e similar outcrigid foam at
lders lookedERGY STARes that the EPAR homes firling insulatio
nt, and the fint the attic ede required inments are pro
STAR 2011
ERGY STAR, such as a raity insulationomes (WA, Otilevered trufoam at the
russ)
depth of ceilihe practice i
extension trupert says he s
not the inpuewide CASEhe house thattotal buildincome includt the edge.
d into the posR New HomePA made to rst release oon at attic ednal requirem
dges while alnsulation levovided in the
Qualified N
R checklist saised-heel trn” (EPA 201OR, MT, ID
usses with wiedge, or mo
ing insulatios common in
usses, are notsees them allut received fr
E Team’s intet some homeng height limde framing w
ssibility of ces requiremethe ENERGf proposed r
dges. Howevment, as also lso proposingvel. The builde figure belo
New Homes
ay that “thesruss, alternat13). Addition
D) mentions oider overhanving your ve
P
on is rare in n the Northe
t common l the time, an
from Californerviews indie owners dis
mit set by locwith a rafter o
constructing ents, but did GY STAR requirementsver, several seen in vers
g methods oder commenow.
Comments
se requiremete framing thnally, the on a FAQ pangs, framing entilation up
Page 84
east
nd nia icated slike. cal on
not
s for
sion other nts
s
ents hat
age with
p the
2016 CASE Report – 2016-RES-ENV1-D Page 85
roof deck to eliminate baffles and increase space for insulation”.43 Another alternative provided by a building expert from an IOU ET project, though noted as probably not the best option, is to add soffits at the exterior walls and allow the loose fill insulation to fill the cavity.
Energy trusses have been tried out by several builders, including Meritage, Standard Pacific, GJ Gardner and Wathan Castanos, but has not been adopted as a standard or prevalent practice by any.
Benefits for using an energy truss include:
Helps realize full benefit of insulation May provide more space for air handler and duct systems It is easy for the truss manufacturer to customize trusses through pre-fabrication
Challenges for using energy trusses include:
Low level of installation experience in California and corresponding labor experience Changes aesthetics of the house, and sometimes create building height that exceed
height limit set by local jurisdictions. Builders and energy consultants cited that the modeling software does not give the
proper credit, so the extra cost and effort is not “worth the trouble”. This should no longer be an issue with the release of the 2013 software, which allows for modeling of raised heel trusses and provides credit for the additional insulation at the edges.
9.2.5 Reduce Duct Surface Area (Duct Design Layout)
Reduced duct surface area is currently a compliance credit, titled “Verification of Supply Duct Surface Area Reduction”, but feedback received from industry experts indicates that it is rarely taken due to various barriers that make the process burdensome for builders and HVAC contractors. Observations from a CAHP program manager is that builders are beginning to claim this credit in the program, but at a very low occurrence.
The standards require the following procedure to qualify for the compliance certificate:
1. A scaled drawing that identify all equipment location, supply and return grilles, sizes, insulation values and location of each duct segment, and
2. Installer certificates and HERS verifications and certificates. The Statewide CASE Team received the following reasons from industry experts, including HERS raters and energy consultants, for why builders do not use this compliance option frequently:
Duct layout can change in the field during installation; so builders do not want to commit to a layout to perform compliance calculation before the plans and construction are completed.
43 Northwest ENERGY STAR Homes 2013:
http://www.northwestenergystar.com/sites/default/files/resources/NWESH_FAQ_0.pdf
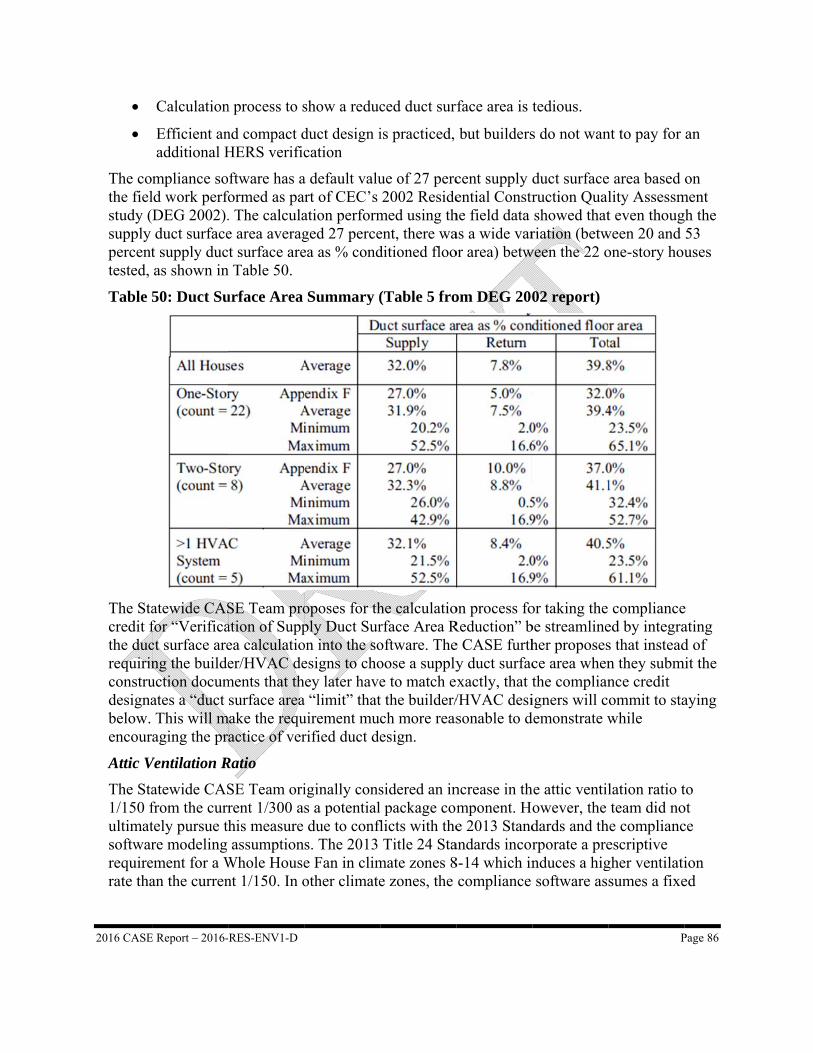
2016 CASE
The cothe fielstudy (supply percenttested,
Table 5
The Stacredit fthe ducrequirinconstrudesignabelow. encour
Attic V
The Sta1/150 fultimatsoftwarrequirerate tha
E Report – 2016-
Calculation
Efficient anadditional H
mpliance sold work perfoDEG 2002).duct surface
t supply ducas shown in
50: Duct Su
atewide CASfor “Verificact surface areng the buildeuction documates a “duct This will maging the pr
Ventilation R
atewide CASfrom the currtely pursue thre modeling
ement for a Wan the curren
-RES-ENV1-D
n process to s
nd compact dHERS verific
ftware has aformed as pa. The calculae area averagt surface are
n Table 50.
urface Area
SE Team proation of Suppea calculatioer/HVAC de
ments that thsurface area
make the requactice of ver
Ratio
SE Team orirent 1/300 ahis measure assumption
Whole Housent 1/150. In o
show a reduc
duct design ication
a default valuart of CEC’s ation performged 27 perceea as % cond
Summary (
oposes for thply Duct Suron into the soesigns to cho
hey later havea “limit” thatuirement mucrified duct de
iginally conss a potentialdue to confls. The 2013 e Fan in climother climate
ced duct sur
is practiced,
ue of 27 perc2002 Reside
med using thent, there waditioned floo
(Table 5 fro
he calculatiorface Area Roftware. Theoose a supplye to match et the builder/ch more reasesign.
sidered an in package com
flicts with theTitle 24 Sta
mate zones 8e zones, the
rface area is t
but builders
cent supply dential Constr
he field data as a wide varor area) betw
om DEG 200
on process foReduction” be CASE furthy duct surfacxactly, that t/HVAC desisonable to d
ncrease in thmponent. Hoe 2013 Stand
andards incor8-14 which incompliance
tedious.
s do not wan
duct surfaceruction Qualshowed that
riation (betwween the 22 o
02 report)
or taking the be streamlineher proposesce area whenthe complianigners will c
demonstrate w
he attic ventilowever, the dards and thrporate a prenduces a higsoftware as
P
nt to pay for
e area based lity Assessmt even thoug
ween 20 and one-story hou
complianceed by integras that insteadn they submnce credit ommit to stawhile
lation ratio tteam did no
he compliancescriptive gher ventilatisumes a fixe
Page 86
an
on ment gh the 53 uses
e ating d of
mit the
aying
to ot ce
ion ed

2016 CASE Report – 2016-RES-ENV1-D Page 87
ventilation rate of 1/300, so this measure is already factored in to the energy budget in the compliance software.
2016 CASE Report – 2016-RES-ENV1-D Page 88
10. APPENDIX C: COST DATA SOURCES Abe Cubano (Owens Corning). 2014. Personal communication. June 6.
All Truss Inc. 2014. Personal communication. May 19.
[CARB] Consortium for Advanced Residential Buildings. Shapiro, C., Magee, A., & W. Zoeller. 2013. “Reducing Thermal Losses and Gains with Buried and Encapsulated Ducts in Hot-Humid Climates (DOE/GO - 102013-3719).” Prepared as part of the U.S. DOE Building America Technologies Program.
[CEC] California Energy Commission. Hedrick, R. 2003. “Home Builders Guide to Ducts in Conditioned Space (500-03-082-A-16).” Prepared by GARD Analytics, Inc. as part of the California Energy Commission’s Public Interest Energy Research (PIER) program. http://www.energy.ca.gov/2003publications/CEC-500-2003-082/CEC-500-2003-082-A-16.PDF
California Utilities Statewide Codes and Standards Team. 2011. “Codes and Standards Enhancement Initiative: Residential Roof Envelope Measures.” http://www.energy.ca.gov/title24/2013standards/prerulemaking/documents/current/Reports/Residential/Envelope/2013_CASE_R_Roof_Measures_Oct_2011.pdf
Dan Granback (Energy Inspectors). 2014. Personal communication. June 4.
[DOE EERE] U.S. Department of Energy, Office of Energy Efficiency and Renewable Energy. Beal, D. et al. 2011. “Measure Guidelines: Summary of Interior Ducts in New Construction, Including an Efficient, Affordable Method to Install Fur-Down Interior Ducts.” Prepared by BA-PIRC/FSEC for U.S. DOE Building America Building Technologies Program. http://www.fsec.ucf.edu/en/publications/pdf/FSEC-RR-385-11.pdf
DuctTesters. 2014. Personal communication. June 6.
Elite Roofing Company, Inc. 2014. Personal communication. May 28.
[FSEC] Florida Solar Energy Center. Fonorow, K., et al. 2010. “Low Cost Interior Duct Systems for High Performance Homes in Hot Climates.” Presented at ACEEE Summer Study on Energy Efficiency in Buildings, Aug 15-20, in Pacific Grove, CA. http://www.aceee.org/files/proceedings/2010/data/papers/1938.pdf
J&J Roofing. 2014. Personal communication. March 27, May 23.
Kerr, R. 2008. “Green Production Building – Moving Ducts Inside.” Home Energy: May/June. ACEEE Proceedings on the same subject, titled http://www.aceee.org/files/proceedings/2010/data/papers/1941.pdf
Lilly, Bill (California Living and Energy). 2014. Personal communication. January 29.
Lubliner et al. 2008. “Moving Ducts Inside: Big Builders, Scientists Find Common Ground.” Paper presented at the ACEEE Summer Conference. http://www.energy.wsu.edu/documents/aceee_ducts_inside.pdf
2016 CASE Report – 2016-RES-ENV1-D Page 89
RS Means 2014 for Residential New Construction
Flores, John (Valley Duct Testing). 2014. Personal communication. January 28.
Marcos Hernandez (Beutler Corporation). 2014. Personal communication. June 5.
Mike Walker Lumber, Inc. 2014. Personal communication. May 28.
Molluzzo, Vinny, McGhi, Cody and Mahrou, Amber (Energy Inspectors). 2014. Personal Communication. January 31.
Online retail: Lowes, Home Depot, AC Wholesalers, Alpine Home Air Products.
Pacific Gas and Electric / Davis Energy Group Emerging Technology ZNE pilot project survey
Tyler Allwood (Eagle Roofing). 2014. Personal communication. May 28.
Southern California Edison Emerging Technology Green Door project
William Zoeller. 2014. Personal communication. April 22.
2016 CASE Report – 2016-RES-ENV1-D Page 90
11. APPENDIX D: SIMULATION RESULTS USING
CBECC-RES
11.1 DCS Strategies
11.1.1 Vented Attic
The following modeling options for DCS are available in the 2013 Standards44:
Ducts in conditioned space except for 12 linear feet: visual inspection Ducts entirely in conditioned space: visual inspection HERS verified ducts entirely in conditioned space: visual inspection, duct leakage to
outside HERS test
All three of the DCS -Vented Attic strategies (dropped ceiling, conditioned plenum and open web floor trusses) are variations of the “ducts entirely in conditioned space” performance option. The “verified” option is available if a verified “leakage to outside” test is performed to demonstrate performance.
The energy impacts of duct placement is climate dependent. Climate zones with the highest cooling loads have the largest savings from minimizing duct losses via placing them in vented attics. The first option, “except < 12 lineal feet” is the lowest performing because parts of the duct lengths are assumed to be exposed to the vented attic with associated convection and leakage losses.
Savings range from 17% in the hottest climate zones (CZ13) for the “verified” option, to 2.5% in the mildest climate zone (CZ7) for the not “verified” option. The statewide weighted TDV savings from these DCS strategies are 7.5% for “except < 12 lineal feet” (Case 1), 9.4% for “ducts entirely in conditioned space” (Case 2), and 13.3% for the “verified” option (Case 3) as shown in the table below.
44 Total duct leakage HERS test is a mandatory requirements that applies to all new construction buildings, regardless of whether
DCS design strategy is chosen
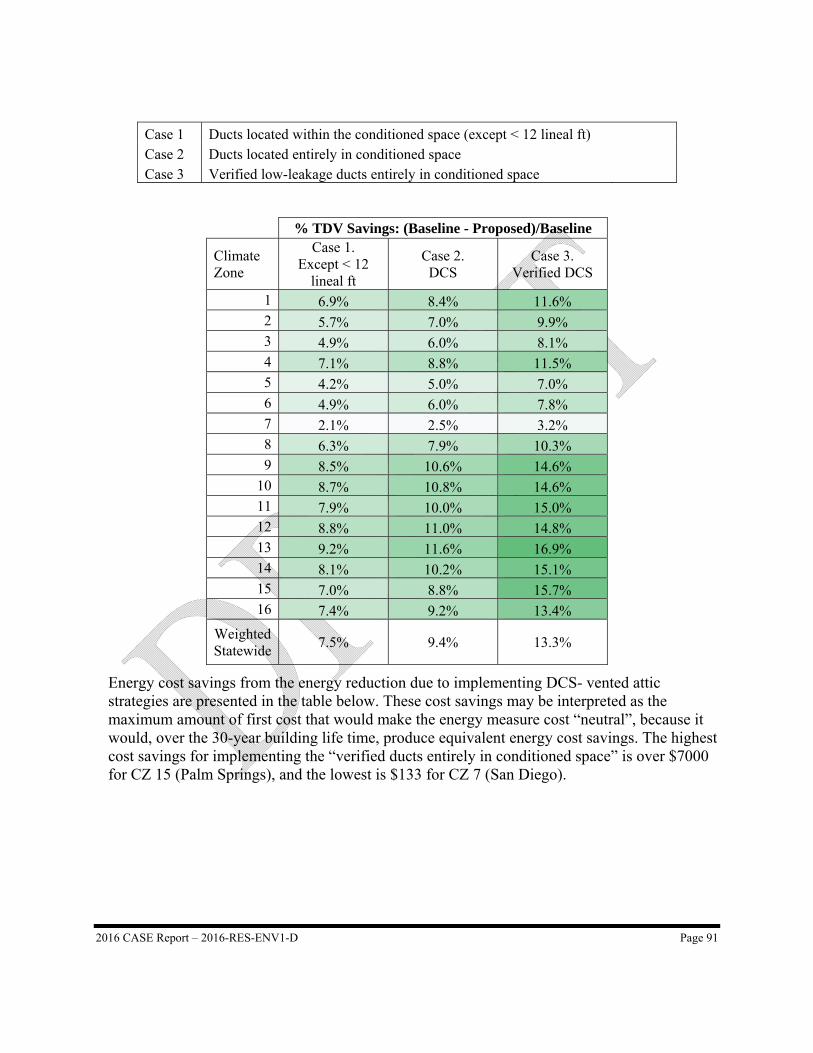
2016 CASE Report – 2016-RES-ENV1-D Page 91
Case 1 Ducts located within the conditioned space (except < 12 lineal ft) Case 2 Ducts located entirely in conditioned space Case 3 Verified low-leakage ducts entirely in conditioned space
% TDV Savings: (Baseline - Proposed)/Baseline
Climate Zone
Case 1. Except < 12
lineal ft
Case 2. DCS
Case 3. Verified DCS
1 6.9% 8.4% 11.6% 2 5.7% 7.0% 9.9% 3 4.9% 6.0% 8.1% 4 7.1% 8.8% 11.5% 5 4.2% 5.0% 7.0% 6 4.9% 6.0% 7.8% 7 2.1% 2.5% 3.2% 8 6.3% 7.9% 10.3% 9 8.5% 10.6% 14.6%
10 8.7% 10.8% 14.6% 11 7.9% 10.0% 15.0% 12 8.8% 11.0% 14.8% 13 9.2% 11.6% 16.9% 14 8.1% 10.2% 15.1% 15 7.0% 8.8% 15.7% 16 7.4% 9.2% 13.4%
Weighted Statewide
7.5% 9.4% 13.3%
Energy cost savings from the energy reduction due to implementing DCS- vented attic strategies are presented in the table below. These cost savings may be interpreted as the maximum amount of first cost that would make the energy measure cost “neutral”, because it would, over the 30-year building life time, produce equivalent energy cost savings. The highest cost savings for implementing the “verified ducts entirely in conditioned space” is over $7000 for CZ 15 (Palm Springs), and the lowest is $133 for CZ 7 (San Diego).
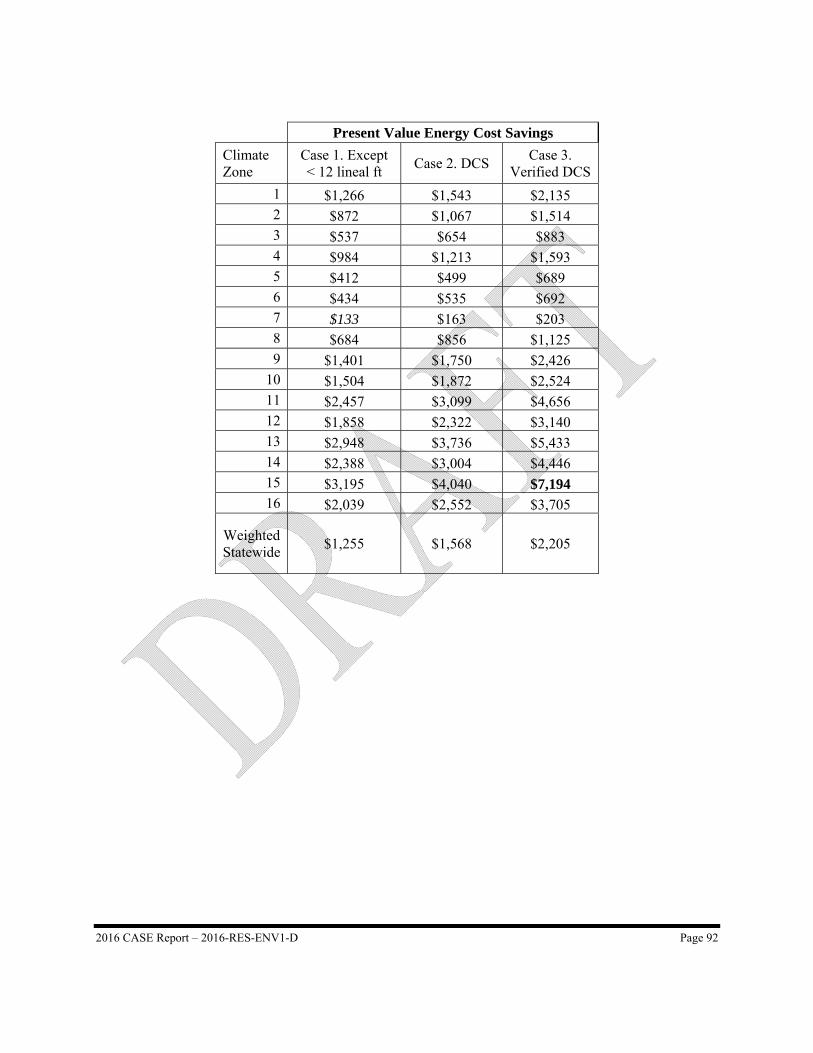
2016 CASE Report – 2016-RES-ENV1-D Page 92
Present Value Energy Cost Savings
Climate Zone
Case 1. Except < 12 lineal ft
Case 2. DCS Case 3.
Verified DCS
1 $1,266 $1,543 $2,135 2 $872 $1,067 $1,514 3 $537 $654 $883 4 $984 $1,213 $1,593 5 $412 $499 $689 6 $434 $535 $692 7 $133 $163 $203 8 $684 $856 $1,125 9 $1,401 $1,750 $2,426
10 $1,504 $1,872 $2,524 11 $2,457 $3,099 $4,656 12 $1,858 $2,322 $3,140 13 $2,948 $3,736 $5,433 14 $2,388 $3,004 $4,446 15 $3,195 $4,040 $7,194 16 $2,039 $2,552 $3,705
Weighted Statewide
$1,255 $1,568 $2,205
2016 CASE Report – 2016-RES-ENV1-D Page 93
11.1.2 Unvented Attic
As described in Section 3.2.3, another way to have ducts and equipment in conditioned space is moving the thermal boundary of the house from the ceiling to the roof line and creating an Unvented Attic for placement of ducts and a sealed combustion furnace. The implementation of an unvented attic in CBECC-res was made possible by the CBECC-res software team through a research version. In this version, the attic over the garage was eliminated since the software cannot handle multiple attics when modeling unvented attics.
Overall, utilizing unvented attics to house ducts and equipment in conditioned space did not perform as well as choosing DCS strategies with vented attics. Even with R-38 at the roof line of an unvented attic, the weighted statewide savings (at 8.6%) performs inferior to the case of “ducts entirely in conditioned space” for the vented attic (with no verification).
The CBECC-res team identified several key reasons for this:
A whole house fan is not feasible with an unvented attic and as such is not modeled for unvented attics. This decision was made because a whole house fan operation defeats the primary purpose of constructing an unvented attic by purposefully introducing ventilation air from the conditioned space that has no outlet to the exterior.
The software does not include a radiant barrier for unvented attics since installation of below-deck insulation (most prevalent method of insulating the roof deck) makes installation of radiant barrier impractical.
The performance of insulation degrades as the delta across the insulation increases. For an unvented attic, the temperature difference across the insulation (roof deck on one side, semi-conditioned space on the other side) is much higher than the temperature difference for the same insulation when installed in a vented attic. Thus, R38 at roof deck has lower overall performance than R38 at the ceiling.
The software assumes that the overall leakage from the house is the same regardless of whether the attic is vented or unvented. Since most attic leaks occur at the junction of the roof deck and ceiling, there is no net difference in overall leakage from the attic, assuming that the junction is not sealed, which is standard practice even in unvented attics due to the difficulty of sealing that junction.
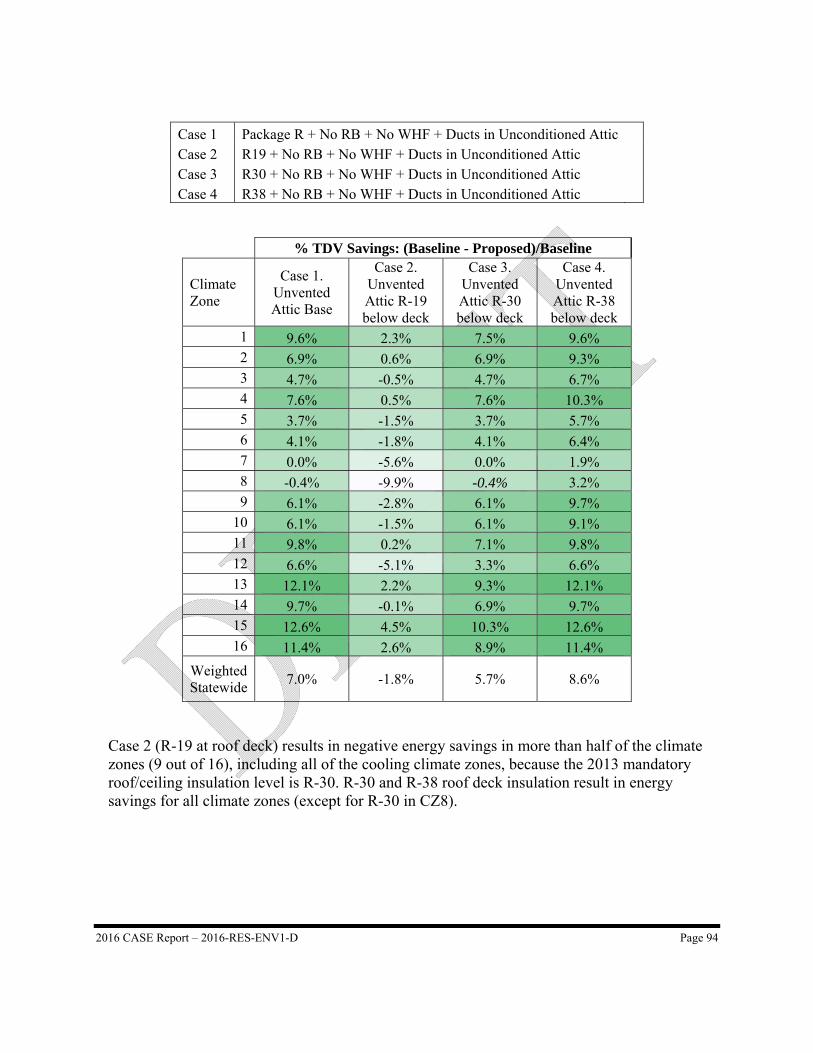
2016 CASE Report – 2016-RES-ENV1-D Page 94
Case 1 Package R + No RB + No WHF + Ducts in Unconditioned Attic Case 2 R19 + No RB + No WHF + Ducts in Unconditioned Attic Case 3 R30 + No RB + No WHF + Ducts in Unconditioned Attic Case 4 R38 + No RB + No WHF + Ducts in Unconditioned Attic
% TDV Savings: (Baseline - Proposed)/Baseline
Climate Zone
Case 1. Unvented Attic Base
Case 2. Unvented Attic R-19 below deck
Case 3. Unvented Attic R-30 below deck
Case 4. Unvented Attic R-38 below deck
1 9.6% 2.3% 7.5% 9.6% 2 6.9% 0.6% 6.9% 9.3% 3 4.7% -0.5% 4.7% 6.7% 4 7.6% 0.5% 7.6% 10.3% 5 3.7% -1.5% 3.7% 5.7% 6 4.1% -1.8% 4.1% 6.4% 7 0.0% -5.6% 0.0% 1.9% 8 -0.4% -9.9% -0.4% 3.2% 9 6.1% -2.8% 6.1% 9.7%
10 6.1% -1.5% 6.1% 9.1% 11 9.8% 0.2% 7.1% 9.8% 12 6.6% -5.1% 3.3% 6.6% 13 12.1% 2.2% 9.3% 12.1% 14 9.7% -0.1% 6.9% 9.7% 15 12.6% 4.5% 10.3% 12.6% 16 11.4% 2.6% 8.9% 11.4%
Weighted Statewide
7.0% -1.8% 5.7% 8.6%
Case 2 (R-19 at roof deck) results in negative energy savings in more than half of the climate zones (9 out of 16), including all of the cooling climate zones, because the 2013 mandatory roof/ceiling insulation level is R-30. R-30 and R-38 roof deck insulation result in energy savings for all climate zones (except for R-30 in CZ8).
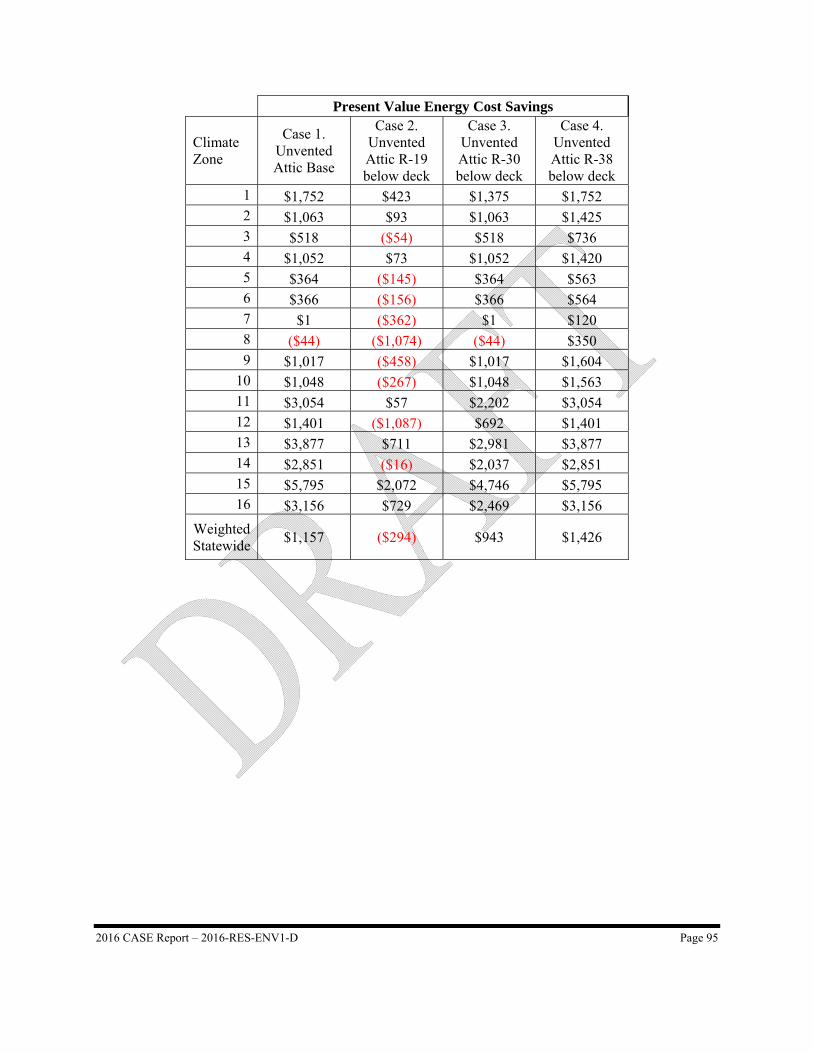
2016 CASE Report – 2016-RES-ENV1-D Page 95
Present Value Energy Cost Savings
Climate Zone
Case 1. Unvented Attic Base
Case 2. Unvented Attic R-19 below deck
Case 3. Unvented Attic R-30 below deck
Case 4. Unvented Attic R-38 below deck
1 $1,752 $423 $1,375 $1,752 2 $1,063 $93 $1,063 $1,425 3 $518 ($54) $518 $736 4 $1,052 $73 $1,052 $1,420 5 $364 ($145) $364 $563 6 $366 ($156) $366 $564 7 $1 ($362) $1 $120 8 ($44) ($1,074) ($44) $350 9 $1,017 ($458) $1,017 $1,604
10 $1,048 ($267) $1,048 $1,563 11 $3,054 $57 $2,202 $3,054 12 $1,401 ($1,087) $692 $1,401 13 $3,877 $711 $2,981 $3,877 14 $2,851 ($16) $2,037 $2,851 15 $5,795 $2,072 $4,746 $5,795 16 $3,156 $729 $2,469 $3,156
Weighted Statewide
$1,157 ($294) $943 $1,426
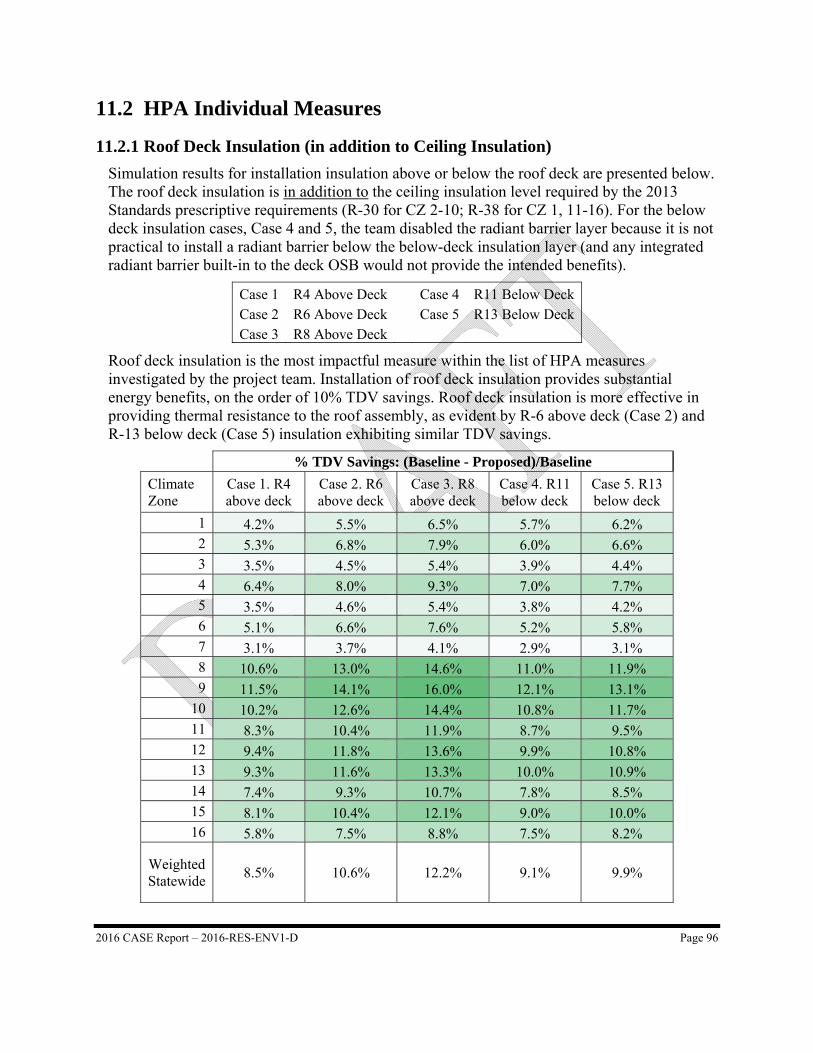
2016 CASE Report – 2016-RES-ENV1-D Page 96
11.2 HPA Individual Measures
11.2.1 Roof Deck Insulation (in addition to Ceiling Insulation)
Simulation results for installation insulation above or below the roof deck are presented below. The roof deck insulation is in addition to the ceiling insulation level required by the 2013 Standards prescriptive requirements (R-30 for CZ 2-10; R-38 for CZ 1, 11-16). For the below deck insulation cases, Case 4 and 5, the team disabled the radiant barrier layer because it is not practical to install a radiant barrier below the below-deck insulation layer (and any integrated radiant barrier built-in to the deck OSB would not provide the intended benefits).
Case 1 R4 Above Deck Case 4 R11 Below Deck Case 2 R6 Above Deck Case 5 R13 Below Deck Case 3 R8 Above Deck
Roof deck insulation is the most impactful measure within the list of HPA measures investigated by the project team. Installation of roof deck insulation provides substantial energy benefits, on the order of 10% TDV savings. Roof deck insulation is more effective in providing thermal resistance to the roof assembly, as evident by R-6 above deck (Case 2) and R-13 below deck (Case 5) insulation exhibiting similar TDV savings.
% TDV Savings: (Baseline - Proposed)/Baseline
Climate Zone
Case 1. R4 above deck
Case 2. R6 above deck
Case 3. R8 above deck
Case 4. R11 below deck
Case 5. R13 below deck
1 4.2% 5.5% 6.5% 5.7% 6.2% 2 5.3% 6.8% 7.9% 6.0% 6.6% 3 3.5% 4.5% 5.4% 3.9% 4.4% 4 6.4% 8.0% 9.3% 7.0% 7.7% 5 3.5% 4.6% 5.4% 3.8% 4.2% 6 5.1% 6.6% 7.6% 5.2% 5.8% 7 3.1% 3.7% 4.1% 2.9% 3.1% 8 10.6% 13.0% 14.6% 11.0% 11.9% 9 11.5% 14.1% 16.0% 12.1% 13.1%
10 10.2% 12.6% 14.4% 10.8% 11.7% 11 8.3% 10.4% 11.9% 8.7% 9.5% 12 9.4% 11.8% 13.6% 9.9% 10.8% 13 9.3% 11.6% 13.3% 10.0% 10.9% 14 7.4% 9.3% 10.7% 7.8% 8.5% 15 8.1% 10.4% 12.1% 9.0% 10.0% 16 5.8% 7.5% 8.8% 7.5% 8.2%
Weighted Statewide
8.5% 10.6% 12.2% 9.1% 9.9%
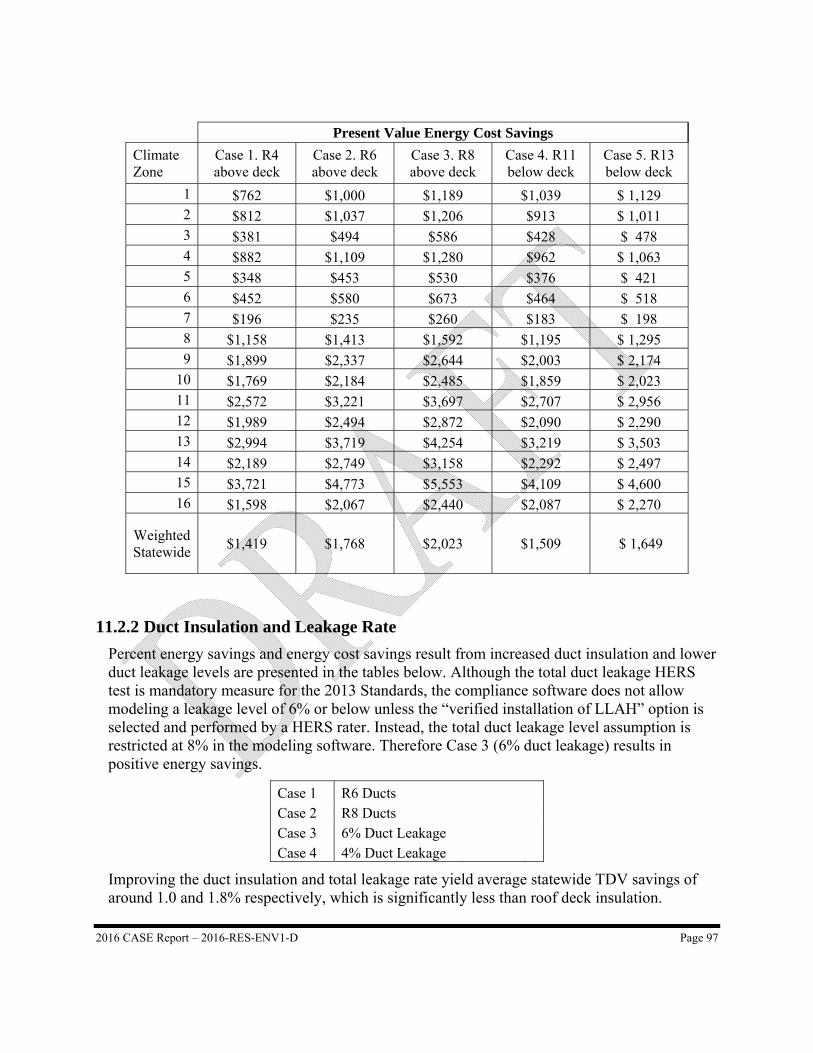
2016 CASE Report – 2016-RES-ENV1-D Page 97
Present Value Energy Cost Savings
Climate Zone
Case 1. R4 above deck
Case 2. R6 above deck
Case 3. R8 above deck
Case 4. R11 below deck
Case 5. R13 below deck
1 $762 $1,000 $1,189 $1,039 $ 1,129 2 $812 $1,037 $1,206 $913 $ 1,011 3 $381 $494 $586 $428 $ 478 4 $882 $1,109 $1,280 $962 $ 1,063 5 $348 $453 $530 $376 $ 421 6 $452 $580 $673 $464 $ 518 7 $196 $235 $260 $183 $ 198 8 $1,158 $1,413 $1,592 $1,195 $ 1,295 9 $1,899 $2,337 $2,644 $2,003 $ 2,174
10 $1,769 $2,184 $2,485 $1,859 $ 2,023 11 $2,572 $3,221 $3,697 $2,707 $ 2,956 12 $1,989 $2,494 $2,872 $2,090 $ 2,290 13 $2,994 $3,719 $4,254 $3,219 $ 3,503 14 $2,189 $2,749 $3,158 $2,292 $ 2,497 15 $3,721 $4,773 $5,553 $4,109 $ 4,600 16 $1,598 $2,067 $2,440 $2,087 $ 2,270
Weighted Statewide
$1,419 $1,768 $2,023 $1,509 $ 1,649
11.2.2 Duct Insulation and Leakage Rate
Percent energy savings and energy cost savings result from increased duct insulation and lower duct leakage levels are presented in the tables below. Although the total duct leakage HERS test is mandatory measure for the 2013 Standards, the compliance software does not allow modeling a leakage level of 6% or below unless the “verified installation of LLAH” option is selected and performed by a HERS rater. Instead, the total duct leakage level assumption is restricted at 8% in the modeling software. Therefore Case 3 (6% duct leakage) results in positive energy savings.
Case 1 R6 Ducts Case 2 R8 Ducts Case 3 6% Duct Leakage Case 4 4% Duct Leakage
Improving the duct insulation and total leakage rate yield average statewide TDV savings of around 1.0 and 1.8% respectively, which is significantly less than roof deck insulation.
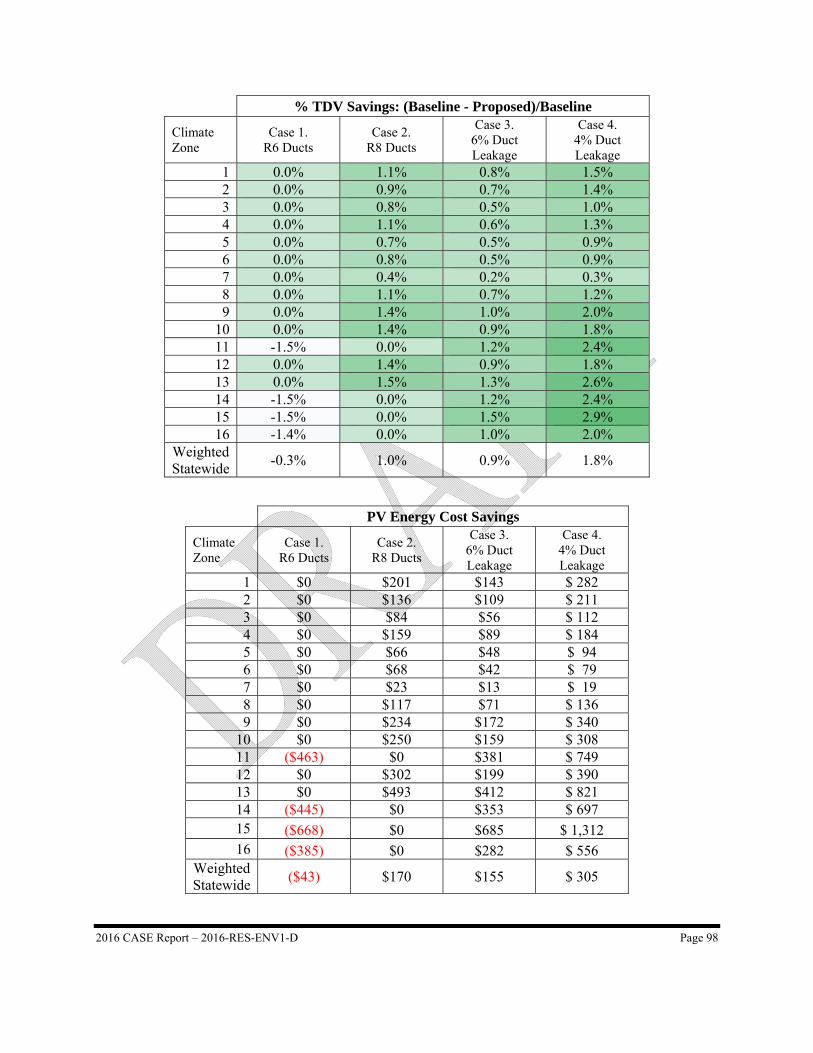
2016 CASE Report – 2016-RES-ENV1-D Page 98
% TDV Savings: (Baseline - Proposed)/Baseline
Climate Zone
Case 1. R6 Ducts
Case 2. R8 Ducts
Case 3. 6% Duct Leakage
Case 4. 4% Duct Leakage
1 0.0% 1.1% 0.8% 1.5% 2 0.0% 0.9% 0.7% 1.4% 3 0.0% 0.8% 0.5% 1.0% 4 0.0% 1.1% 0.6% 1.3% 5 0.0% 0.7% 0.5% 0.9% 6 0.0% 0.8% 0.5% 0.9% 7 0.0% 0.4% 0.2% 0.3% 8 0.0% 1.1% 0.7% 1.2% 9 0.0% 1.4% 1.0% 2.0%
10 0.0% 1.4% 0.9% 1.8% 11 -1.5% 0.0% 1.2% 2.4% 12 0.0% 1.4% 0.9% 1.8% 13 0.0% 1.5% 1.3% 2.6% 14 -1.5% 0.0% 1.2% 2.4% 15 -1.5% 0.0% 1.5% 2.9% 16 -1.4% 0.0% 1.0% 2.0%
Weighted Statewide
-0.3% 1.0% 0.9% 1.8%
PV Energy Cost Savings
Climate Zone
Case 1. R6 Ducts
Case 2. R8 Ducts
Case 3. 6% Duct Leakage
Case 4. 4% Duct Leakage
1 $0 $201 $143 $ 282 2 $0 $136 $109 $ 211 3 $0 $84 $56 $ 112 4 $0 $159 $89 $ 184 5 $0 $66 $48 $ 94 6 $0 $68 $42 $ 79 7 $0 $23 $13 $ 19 8 $0 $117 $71 $ 136 9 $0 $234 $172 $ 340
10 $0 $250 $159 $ 308 11 ($463) $0 $381 $ 749 12 $0 $302 $199 $ 390 13 $0 $493 $412 $ 821 14 ($445) $0 $353 $ 697 15 ($668) $0 $685 $ 1,312 16 ($385) $0 $282 $ 556
Weighted Statewide
($43) $170 $155 $ 305

2016 CASE Report – 2016-RES-ENV1-D Page 99
11.2.3 Raised Heel Trusses
The compliance software assumes a truss heel height of 3 ½” as the default and thus assumes that the insulation is compressed at the truss heel and derates the value of the installed insulation. Incorporating a raised heel truss with a modified heel height of 12” accommodates the full thickness of R-30 and R-38 blown-in fiberglass insulation, enabling full account of the installed insulation. The energy and cost savings results from installing a 12” raised heel are presented in the table below.
% TDV Savings: (Baseline - Proposed)/Baseline
PV Energy Cost Savings
Climate Zone
RHT – 12” RHT – 12”
1 0.8% $139 2 0.9% $138 3 0.7% $78 4 1.1% $156 5 0.8% $80 6 1.0% $92 7 1.0% $63 8 1.6% $177 9 1.6% $259
10 1.5% $253 11 1.3% $409 12 1.6% $347 13 1.2% $400 14 1.4% $404 15 0.9% $400 16 0.9% $261
Weighted Statewide
1.3% $219
11.2.4 Roof Reflectance and Roof Deck Insulation
The project team performed insulation runs with higher reflectance roof tiles with values, 0.35 and 0.55, in comparison to the prescriptive requirements of 0.20 for CZ 10-15 for steep slope roofs. The results show that increasing the reflectance level yields approximately 2% and 4.7% TDV savings, respectively.
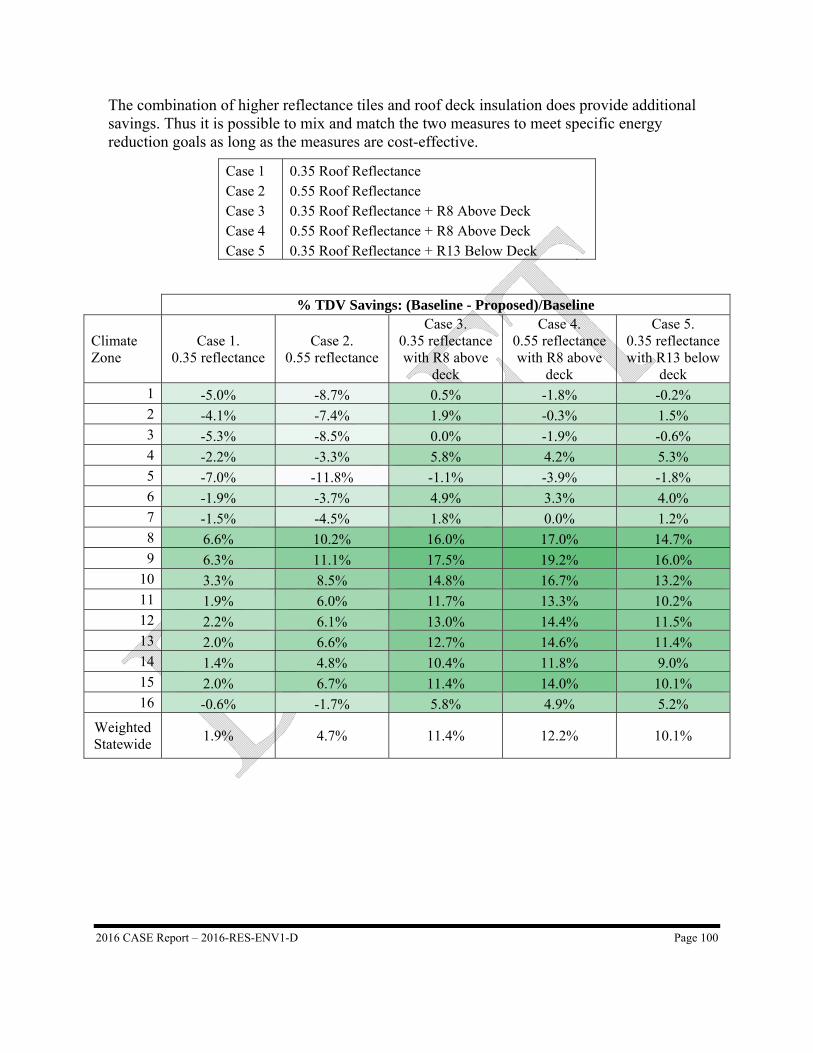
2016 CASE Report – 2016-RES-ENV1-D Page 100
The combination of higher reflectance tiles and roof deck insulation does provide additional savings. Thus it is possible to mix and match the two measures to meet specific energy reduction goals as long as the measures are cost-effective.
Case 1 0.35 Roof Reflectance Case 2 0.55 Roof Reflectance Case 3 0.35 Roof Reflectance + R8 Above Deck Case 4 0.55 Roof Reflectance + R8 Above Deck Case 5 0.35 Roof Reflectance + R13 Below Deck
% TDV Savings: (Baseline - Proposed)/Baseline
Climate Zone
Case 1. 0.35 reflectance
Case 2. 0.55 reflectance
Case 3. 0.35 reflectance with R8 above
deck
Case 4. 0.55 reflectance with R8 above
deck
Case 5. 0.35 reflectance with R13 below
deck 1 -5.0% -8.7% 0.5% -1.8% -0.2% 2 -4.1% -7.4% 1.9% -0.3% 1.5% 3 -5.3% -8.5% 0.0% -1.9% -0.6% 4 -2.2% -3.3% 5.8% 4.2% 5.3% 5 -7.0% -11.8% -1.1% -3.9% -1.8% 6 -1.9% -3.7% 4.9% 3.3% 4.0% 7 -1.5% -4.5% 1.8% 0.0% 1.2% 8 6.6% 10.2% 16.0% 17.0% 14.7% 9 6.3% 11.1% 17.5% 19.2% 16.0%
10 3.3% 8.5% 14.8% 16.7% 13.2% 11 1.9% 6.0% 11.7% 13.3% 10.2% 12 2.2% 6.1% 13.0% 14.4% 11.5% 13 2.0% 6.6% 12.7% 14.6% 11.4% 14 1.4% 4.8% 10.4% 11.8% 9.0% 15 2.0% 6.7% 11.4% 14.0% 10.1% 16 -0.6% -1.7% 5.8% 4.9% 5.2%
Weighted Statewide
1.9% 4.7% 11.4% 12.2% 10.1%
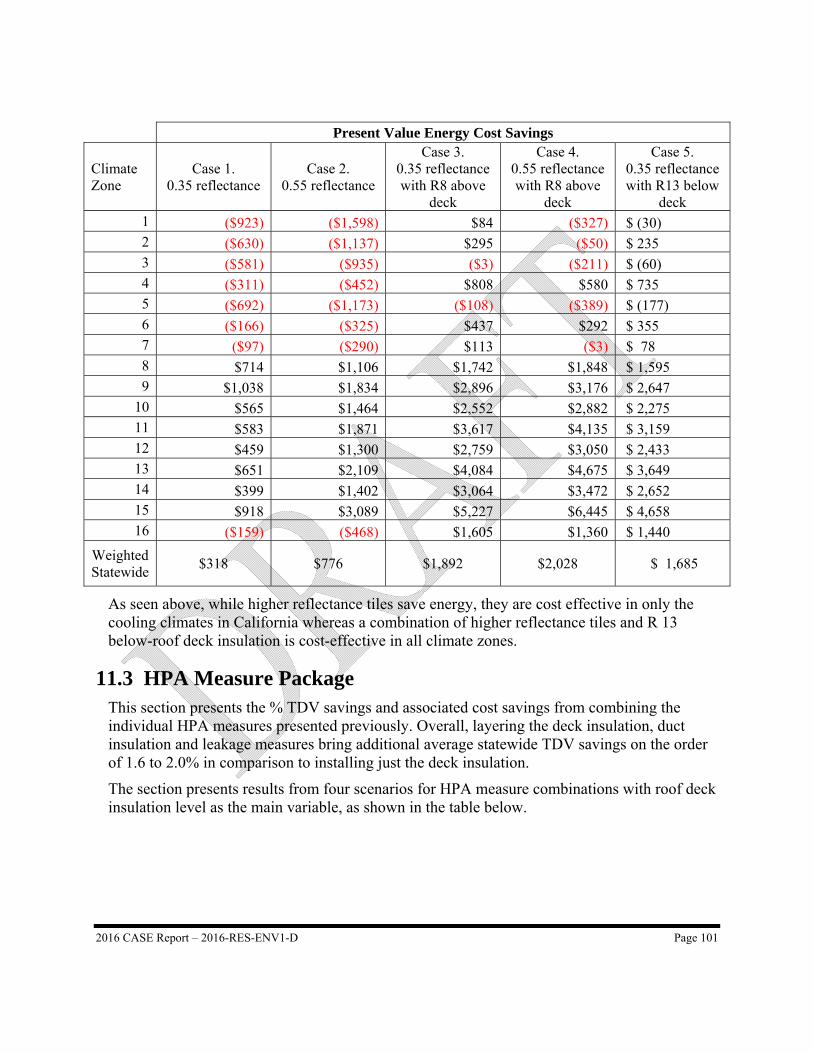
2016 CASE Report – 2016-RES-ENV1-D Page 101
Present Value Energy Cost Savings
Climate Zone
Case 1. 0.35 reflectance
Case 2. 0.55 reflectance
Case 3. 0.35 reflectance with R8 above
deck
Case 4. 0.55 reflectance with R8 above
deck
Case 5. 0.35 reflectance with R13 below
deck 1 ($923) ($1,598) $84 ($327) $ (30) 2 ($630) ($1,137) $295 ($50) $ 235 3 ($581) ($935) ($3) ($211) $ (60) 4 ($311) ($452) $808 $580 $ 735 5 ($692) ($1,173) ($108) ($389) $ (177) 6 ($166) ($325) $437 $292 $ 355 7 ($97) ($290) $113 ($3) $ 78 8 $714 $1,106 $1,742 $1,848 $ 1,595 9 $1,038 $1,834 $2,896 $3,176 $ 2,647
10 $565 $1,464 $2,552 $2,882 $ 2,275 11 $583 $1,871 $3,617 $4,135 $ 3,159 12 $459 $1,300 $2,759 $3,050 $ 2,433 13 $651 $2,109 $4,084 $4,675 $ 3,649 14 $399 $1,402 $3,064 $3,472 $ 2,652 15 $918 $3,089 $5,227 $6,445 $ 4,658 16 ($159) ($468) $1,605 $1,360 $ 1,440
Weighted Statewide
$318 $776 $1,892 $2,028 $ 1,685
As seen above, while higher reflectance tiles save energy, they are cost effective in only the cooling climates in California whereas a combination of higher reflectance tiles and R 13 below-roof deck insulation is cost-effective in all climate zones.
11.3 HPA Measure Package This section presents the % TDV savings and associated cost savings from combining the individual HPA measures presented previously. Overall, layering the deck insulation, duct insulation and leakage measures bring additional average statewide TDV savings on the order of 1.6 to 2.0% in comparison to installing just the deck insulation.
The section presents results from four scenarios for HPA measure combinations with roof deck insulation level as the main variable, as shown in the table below.
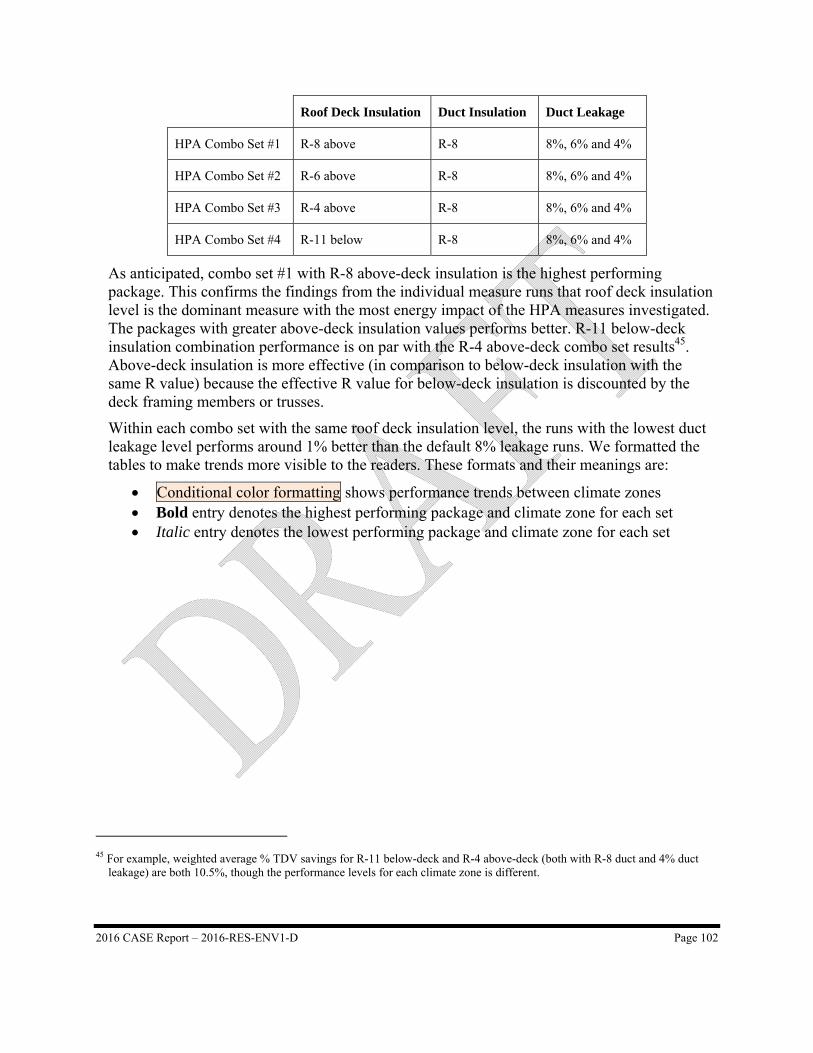
2016 CASE Report – 2016-RES-ENV1-D Page 102
Roof Deck Insulation Duct Insulation Duct Leakage
HPA Combo Set #1 R-8 above R-8 8%, 6% and 4%
HPA Combo Set #2 R-6 above R-8 8%, 6% and 4%
HPA Combo Set #3 R-4 above R-8 8%, 6% and 4%
HPA Combo Set #4 R-11 below R-8 8%, 6% and 4%
As anticipated, combo set #1 with R-8 above-deck insulation is the highest performing package. This confirms the findings from the individual measure runs that roof deck insulation level is the dominant measure with the most energy impact of the HPA measures investigated. The packages with greater above-deck insulation values performs better. R-11 below-deck insulation combination performance is on par with the R-4 above-deck combo set results45. Above-deck insulation is more effective (in comparison to below-deck insulation with the same R value) because the effective R value for below-deck insulation is discounted by the deck framing members or trusses.
Within each combo set with the same roof deck insulation level, the runs with the lowest duct leakage level performs around 1% better than the default 8% leakage runs. We formatted the tables to make trends more visible to the readers. These formats and their meanings are:
Conditional color formatting shows performance trends between climate zones Bold entry denotes the highest performing package and climate zone for each set Italic entry denotes the lowest performing package and climate zone for each set
45 For example, weighted average % TDV savings for R-11 below-deck and R-4 above-deck (both with R-8 duct and 4% duct
leakage) are both 10.5%, though the performance levels for each climate zone is different.
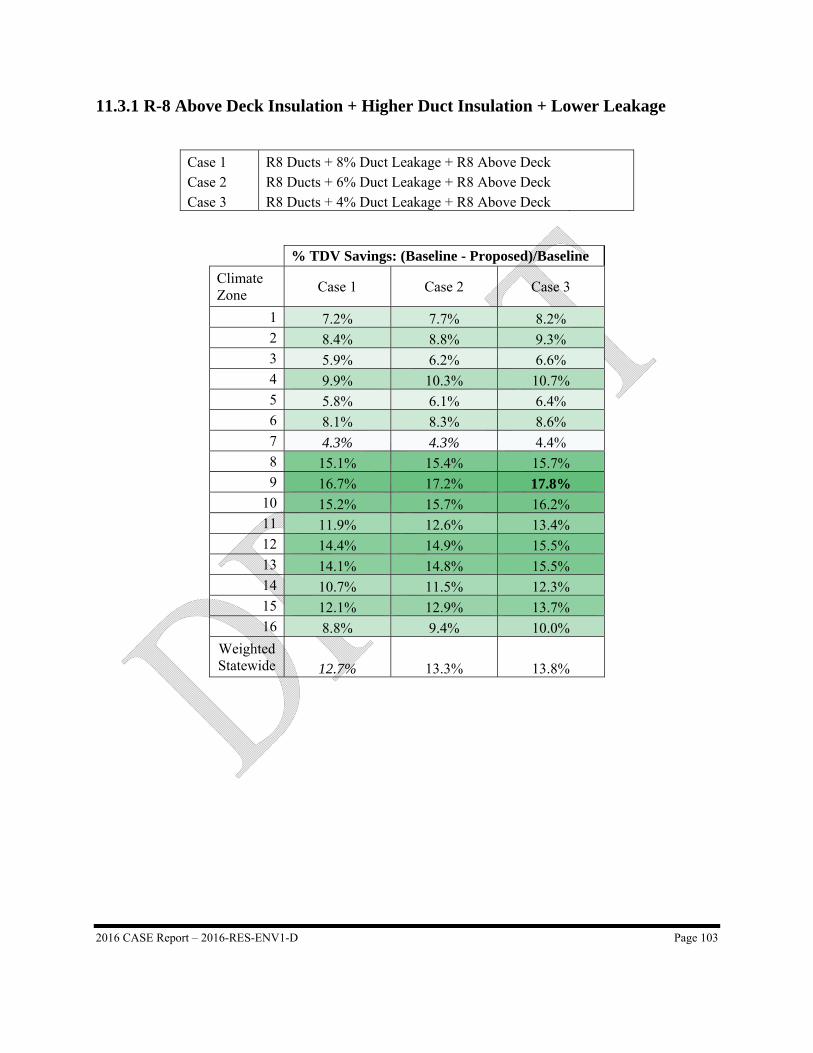
2016 CASE Report – 2016-RES-ENV1-D Page 103
11.3.1 R-8 Above Deck Insulation + Higher Duct Insulation + Lower Leakage
Case 1 R8 Ducts + 8% Duct Leakage + R8 Above Deck Case 2 R8 Ducts + 6% Duct Leakage + R8 Above Deck Case 3 R8 Ducts + 4% Duct Leakage + R8 Above Deck
% TDV Savings: (Baseline - Proposed)/Baseline
Climate Zone
Case 1 Case 2 Case 3
1 7.2% 7.7% 8.2% 2 8.4% 8.8% 9.3% 3 5.9% 6.2% 6.6% 4 9.9% 10.3% 10.7% 5 5.8% 6.1% 6.4% 6 8.1% 8.3% 8.6% 7 4.3% 4.3% 4.4% 8 15.1% 15.4% 15.7% 9 16.7% 17.2% 17.8%
10 15.2% 15.7% 16.2% 11 11.9% 12.6% 13.4% 12 14.4% 14.9% 15.5% 13 14.1% 14.8% 15.5% 14 10.7% 11.5% 12.3% 15 12.1% 12.9% 13.7% 16 8.8% 9.4% 10.0%
Weighted Statewide 12.7% 13.3% 13.8%
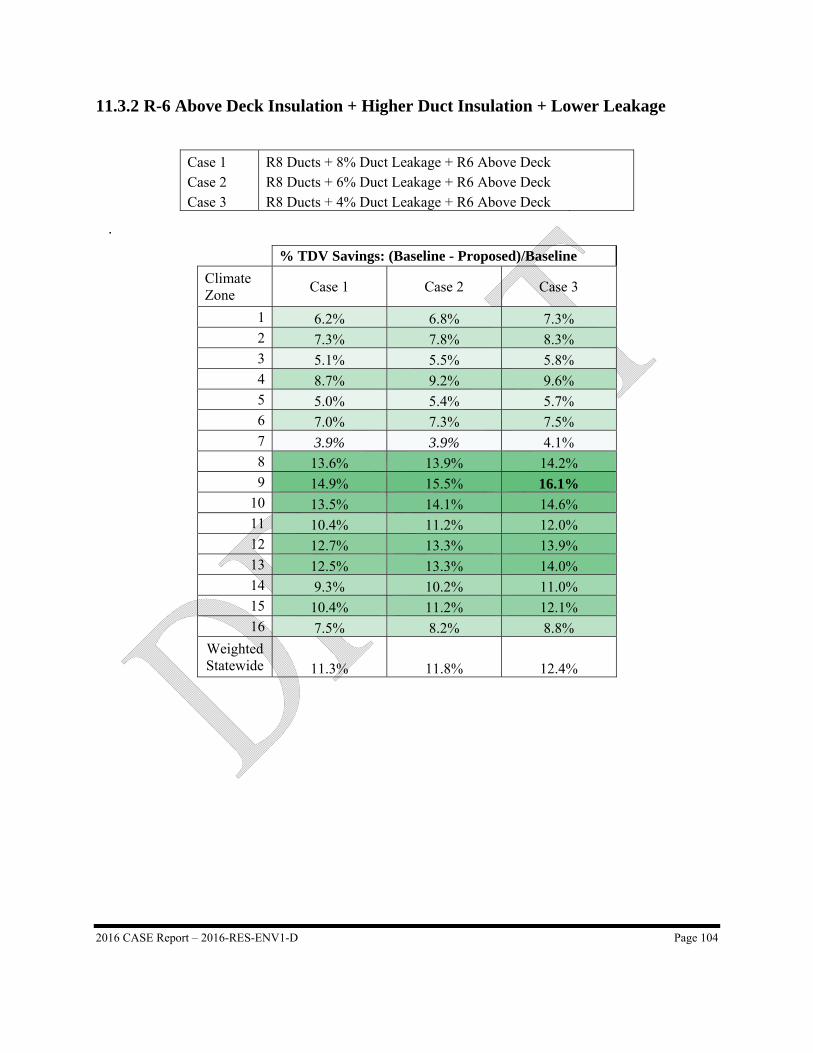
2016 CASE Report – 2016-RES-ENV1-D Page 104
11.3.2 R-6 Above Deck Insulation + Higher Duct Insulation + Lower Leakage
Case 1 R8 Ducts + 8% Duct Leakage + R6 Above Deck Case 2 R8 Ducts + 6% Duct Leakage + R6 Above Deck Case 3 R8 Ducts + 4% Duct Leakage + R6 Above Deck
.
% TDV Savings: (Baseline - Proposed)/Baseline
Climate Zone
Case 1 Case 2 Case 3
1 6.2% 6.8% 7.3% 2 7.3% 7.8% 8.3% 3 5.1% 5.5% 5.8% 4 8.7% 9.2% 9.6% 5 5.0% 5.4% 5.7% 6 7.0% 7.3% 7.5% 7 3.9% 3.9% 4.1% 8 13.6% 13.9% 14.2% 9 14.9% 15.5% 16.1%
10 13.5% 14.1% 14.6% 11 10.4% 11.2% 12.0% 12 12.7% 13.3% 13.9% 13 12.5% 13.3% 14.0% 14 9.3% 10.2% 11.0% 15 10.4% 11.2% 12.1% 16 7.5% 8.2% 8.8%
Weighted Statewide 11.3% 11.8% 12.4%
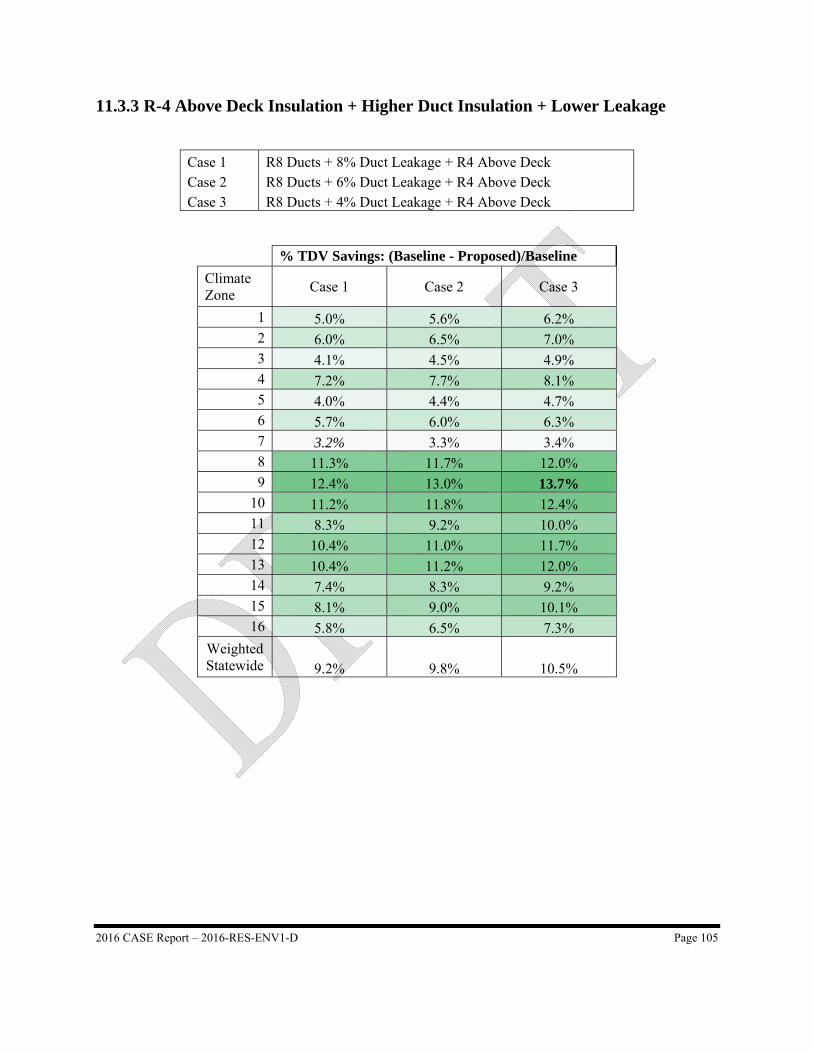
2016 CASE Report – 2016-RES-ENV1-D Page 105
11.3.3 R-4 Above Deck Insulation + Higher Duct Insulation + Lower Leakage
Case 1 R8 Ducts + 8% Duct Leakage + R4 Above Deck Case 2 R8 Ducts + 6% Duct Leakage + R4 Above Deck Case 3 R8 Ducts + 4% Duct Leakage + R4 Above Deck
% TDV Savings: (Baseline - Proposed)/Baseline
Climate Zone
Case 1 Case 2 Case 3
1 5.0% 5.6% 6.2% 2 6.0% 6.5% 7.0% 3 4.1% 4.5% 4.9% 4 7.2% 7.7% 8.1% 5 4.0% 4.4% 4.7% 6 5.7% 6.0% 6.3% 7 3.2% 3.3% 3.4% 8 11.3% 11.7% 12.0% 9 12.4% 13.0% 13.7%
10 11.2% 11.8% 12.4% 11 8.3% 9.2% 10.0% 12 10.4% 11.0% 11.7% 13 10.4% 11.2% 12.0% 14 7.4% 8.3% 9.2% 15 8.1% 9.0% 10.1% 16 5.8% 6.5% 7.3%
Weighted Statewide 9.2% 9.8% 10.5%
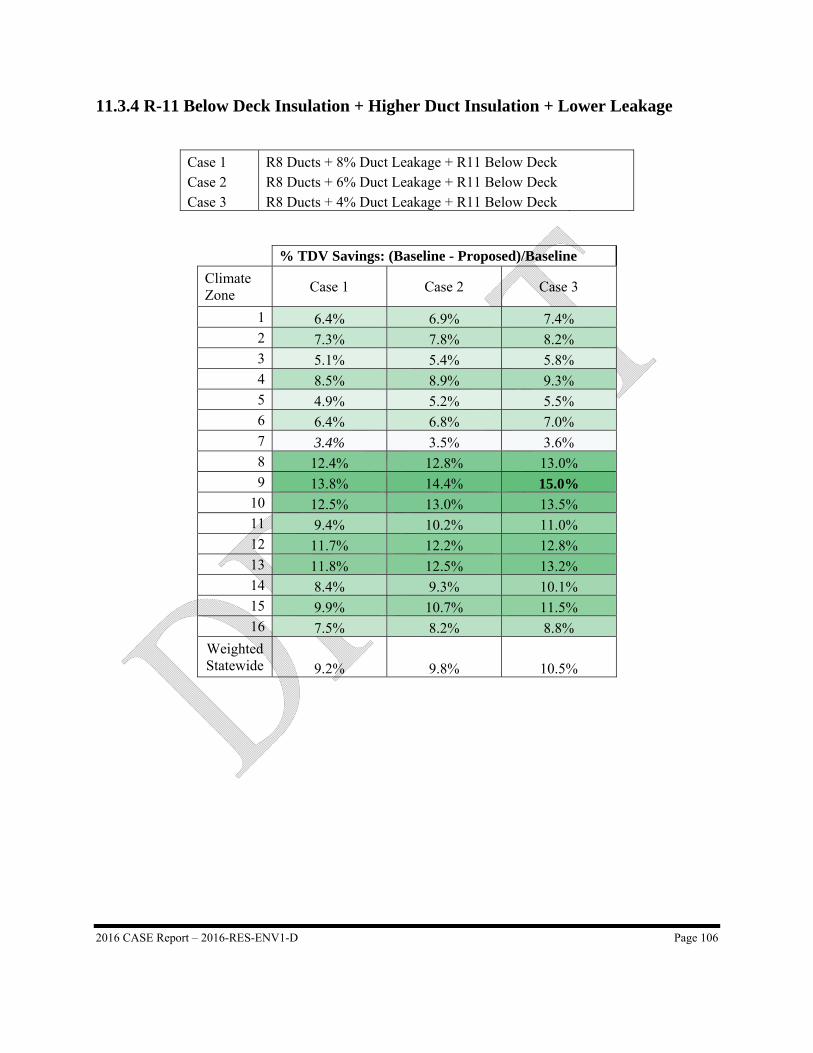
2016 CASE Report – 2016-RES-ENV1-D Page 106
11.3.4 R-11 Below Deck Insulation + Higher Duct Insulation + Lower Leakage
Case 1 R8 Ducts + 8% Duct Leakage + R11 Below Deck Case 2 R8 Ducts + 6% Duct Leakage + R11 Below Deck Case 3 R8 Ducts + 4% Duct Leakage + R11 Below Deck
% TDV Savings: (Baseline - Proposed)/Baseline
Climate Zone
Case 1 Case 2 Case 3
1 6.4% 6.9% 7.4% 2 7.3% 7.8% 8.2% 3 5.1% 5.4% 5.8% 4 8.5% 8.9% 9.3% 5 4.9% 5.2% 5.5% 6 6.4% 6.8% 7.0% 7 3.4% 3.5% 3.6% 8 12.4% 12.8% 13.0% 9 13.8% 14.4% 15.0%
10 12.5% 13.0% 13.5% 11 9.4% 10.2% 11.0% 12 11.7% 12.2% 12.8% 13 11.8% 12.5% 13.2% 14 8.4% 9.3% 10.1% 15 9.9% 10.7% 11.5% 16 7.5% 8.2% 8.8%
Weighted Statewide 9.2% 9.8% 10.5%
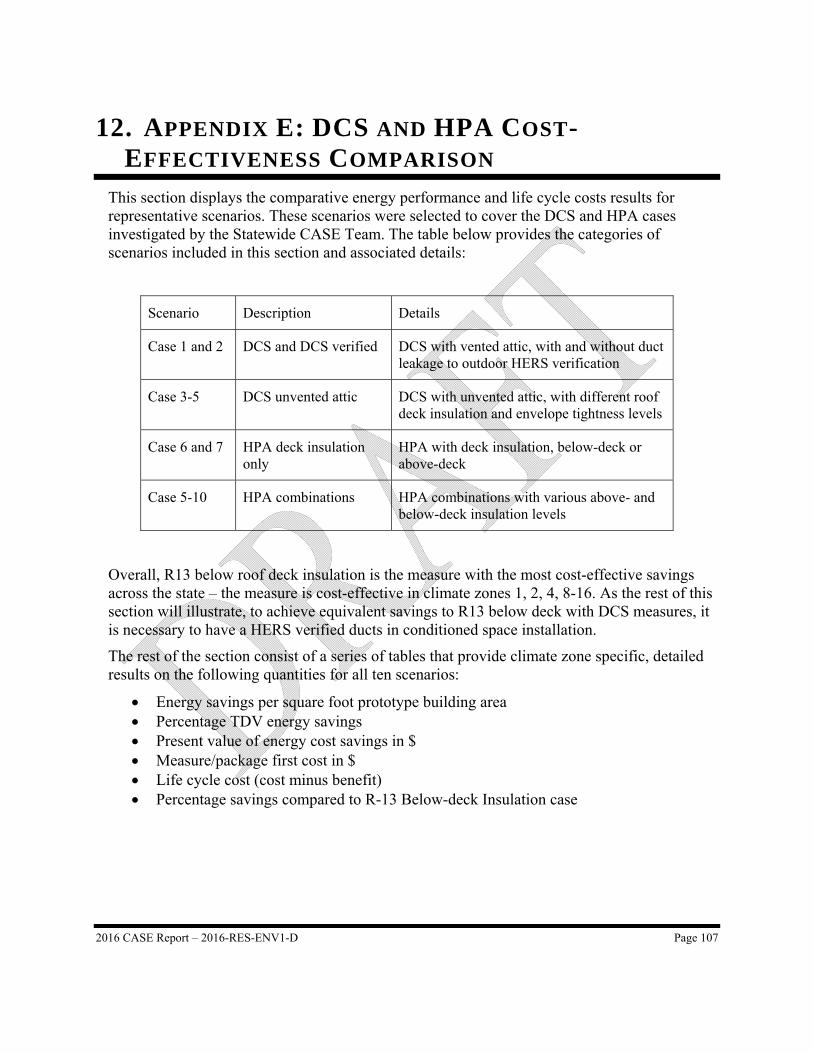
2016 CASE Report – 2016-RES-ENV1-D Page 107
12. APPENDIX E: DCS AND HPA COST-EFFECTIVENESS COMPARISON
This section displays the comparative energy performance and life cycle costs results for representative scenarios. These scenarios were selected to cover the DCS and HPA cases investigated by the Statewide CASE Team. The table below provides the categories of scenarios included in this section and associated details:
Scenario Description Details
Case 1 and 2 DCS and DCS verified DCS with vented attic, with and without duct leakage to outdoor HERS verification
Case 3-5 DCS unvented attic DCS with unvented attic, with different roof deck insulation and envelope tightness levels
Case 6 and 7 HPA deck insulation only
HPA with deck insulation, below-deck or above-deck
Case 5-10 HPA combinations HPA combinations with various above- and below-deck insulation levels
Overall, R13 below roof deck insulation is the measure with the most cost-effective savings across the state – the measure is cost-effective in climate zones 1, 2, 4, 8-16. As the rest of this section will illustrate, to achieve equivalent savings to R13 below deck with DCS measures, it is necessary to have a HERS verified ducts in conditioned space installation.
The rest of the section consist of a series of tables that provide climate zone specific, detailed results on the following quantities for all ten scenarios:
Energy savings per square foot prototype building area Percentage TDV energy savings Present value of energy cost savings in $ Measure/package first cost in $ Life cycle cost (cost minus benefit) Percentage savings compared to R-13 Below-deck Insulation case
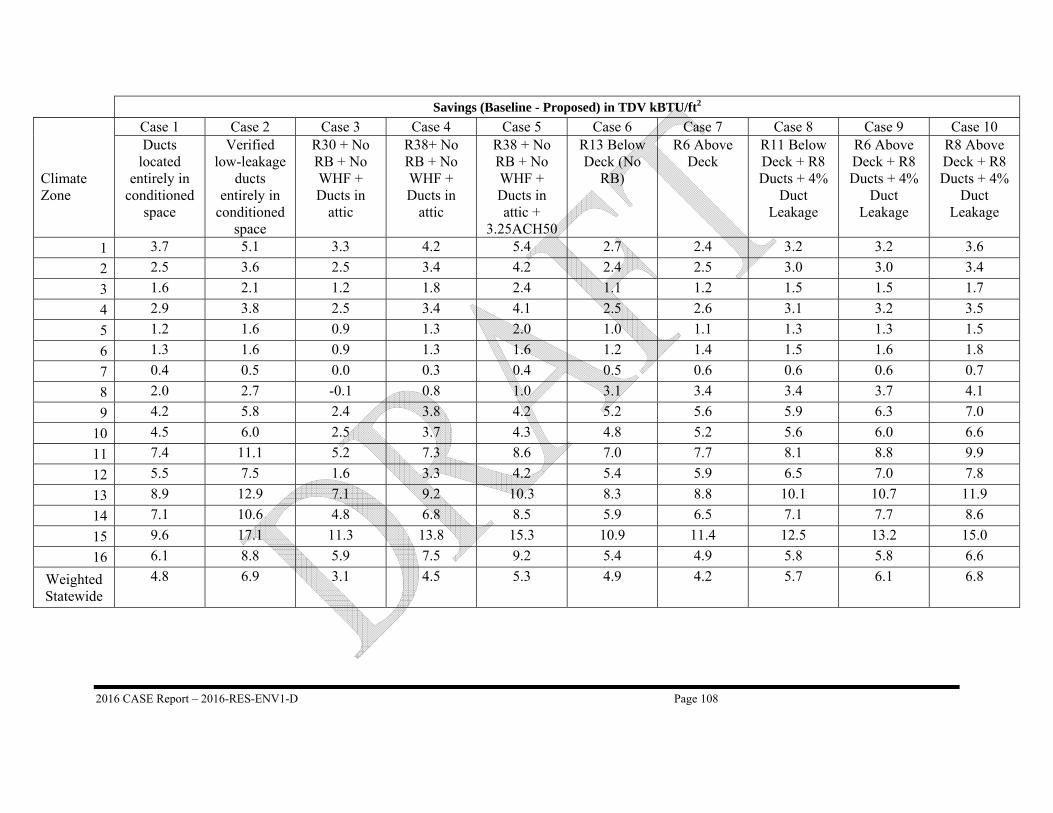
2016 CASE Report – 2016-RES-ENV1-D Page 108
Savings (Baseline - Proposed) in TDV kBTU/ft2
Case 1 Case 2 Case 3 Case 4 Case 5 Case 6 Case 7 Case 8 Case 9 Case 10
Climate Zone
Ducts located
entirely in conditioned
space
Verified low-leakage
ducts entirely in
conditioned space
R30 + No RB + No WHF + Ducts in
attic
R38+ No RB + No WHF + Ducts in
attic
R38 + No RB + No WHF + Ducts in attic +
3.25ACH50
R13 Below Deck (No
RB)
R6 Above Deck
R11 Below Deck + R8 Ducts + 4%
Duct Leakage
R6 Above Deck + R8 Ducts + 4%
Duct Leakage
R8 Above Deck + R8 Ducts + 4%
Duct Leakage
1 3.7 5.1 3.3 4.2 5.4 2.7 2.4 3.2 3.2 3.6
2 2.5 3.6 2.5 3.4 4.2 2.4 2.5 3.0 3.0 3.4
3 1.6 2.1 1.2 1.8 2.4 1.1 1.2 1.5 1.5 1.7
4 2.9 3.8 2.5 3.4 4.1 2.5 2.6 3.1 3.2 3.5
5 1.2 1.6 0.9 1.3 2.0 1.0 1.1 1.3 1.3 1.5
6 1.3 1.6 0.9 1.3 1.6 1.2 1.4 1.5 1.6 1.8
7 0.4 0.5 0.0 0.3 0.4 0.5 0.6 0.6 0.6 0.7
8 2.0 2.7 -0.1 0.8 1.0 3.1 3.4 3.4 3.7 4.1
9 4.2 5.8 2.4 3.8 4.2 5.2 5.6 5.9 6.3 7.0
10 4.5 6.0 2.5 3.7 4.3 4.8 5.2 5.6 6.0 6.6
11 7.4 11.1 5.2 7.3 8.6 7.0 7.7 8.1 8.8 9.9
12 5.5 7.5 1.6 3.3 4.2 5.4 5.9 6.5 7.0 7.8
13 8.9 12.9 7.1 9.2 10.3 8.3 8.8 10.1 10.7 11.9
14 7.1 10.6 4.8 6.8 8.5 5.9 6.5 7.1 7.7 8.6
15 9.6 17.1 11.3 13.8 15.3 10.9 11.4 12.5 13.2 15.0
16 6.1 8.8 5.9 7.5 9.2 5.4 4.9 5.8 5.8 6.6
Weighted Statewide
4.8 6.9 3.1 4.5 5.3 4.9 4.2 5.7 6.1 6.8
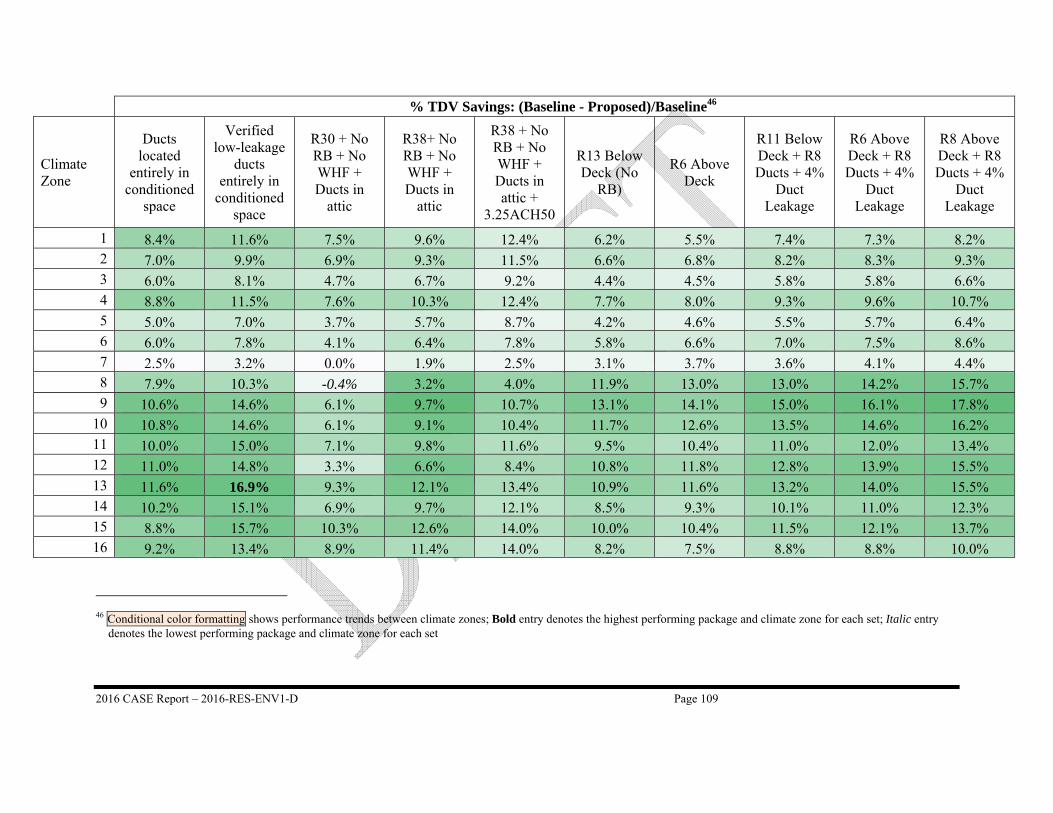
2016 CASE Report – 2016-RES-ENV1-D Page 109
% TDV Savings: (Baseline - Proposed)/Baseline46
Climate Zone
Ducts located
entirely in conditioned
space
Verified low-leakage
ducts entirely in
conditioned space
R30 + No RB + No WHF + Ducts in
attic
R38+ No RB + No WHF + Ducts in
attic
R38 + No RB + No WHF + Ducts in attic +
3.25ACH50
R13 Below Deck (No
RB)
R6 Above Deck
R11 Below Deck + R8 Ducts + 4%
Duct Leakage
R6 Above Deck + R8 Ducts + 4%
Duct Leakage
R8 Above Deck + R8 Ducts + 4%
Duct Leakage
1 8.4% 11.6% 7.5% 9.6% 12.4% 6.2% 5.5% 7.4% 7.3% 8.2% 2 7.0% 9.9% 6.9% 9.3% 11.5% 6.6% 6.8% 8.2% 8.3% 9.3% 3 6.0% 8.1% 4.7% 6.7% 9.2% 4.4% 4.5% 5.8% 5.8% 6.6% 4 8.8% 11.5% 7.6% 10.3% 12.4% 7.7% 8.0% 9.3% 9.6% 10.7% 5 5.0% 7.0% 3.7% 5.7% 8.7% 4.2% 4.6% 5.5% 5.7% 6.4% 6 6.0% 7.8% 4.1% 6.4% 7.8% 5.8% 6.6% 7.0% 7.5% 8.6% 7 2.5% 3.2% 0.0% 1.9% 2.5% 3.1% 3.7% 3.6% 4.1% 4.4% 8 7.9% 10.3% -0.4% 3.2% 4.0% 11.9% 13.0% 13.0% 14.2% 15.7% 9 10.6% 14.6% 6.1% 9.7% 10.7% 13.1% 14.1% 15.0% 16.1% 17.8%
10 10.8% 14.6% 6.1% 9.1% 10.4% 11.7% 12.6% 13.5% 14.6% 16.2% 11 10.0% 15.0% 7.1% 9.8% 11.6% 9.5% 10.4% 11.0% 12.0% 13.4% 12 11.0% 14.8% 3.3% 6.6% 8.4% 10.8% 11.8% 12.8% 13.9% 15.5% 13 11.6% 16.9% 9.3% 12.1% 13.4% 10.9% 11.6% 13.2% 14.0% 15.5% 14 10.2% 15.1% 6.9% 9.7% 12.1% 8.5% 9.3% 10.1% 11.0% 12.3% 15 8.8% 15.7% 10.3% 12.6% 14.0% 10.0% 10.4% 11.5% 12.1% 13.7% 16 9.2% 13.4% 8.9% 11.4% 14.0% 8.2% 7.5% 8.8% 8.8% 10.0%
46 Conditional color formatting shows performance trends between climate zones; Bold entry denotes the highest performing package and climate zone for each set; Italic entry
denotes the lowest performing package and climate zone for each set
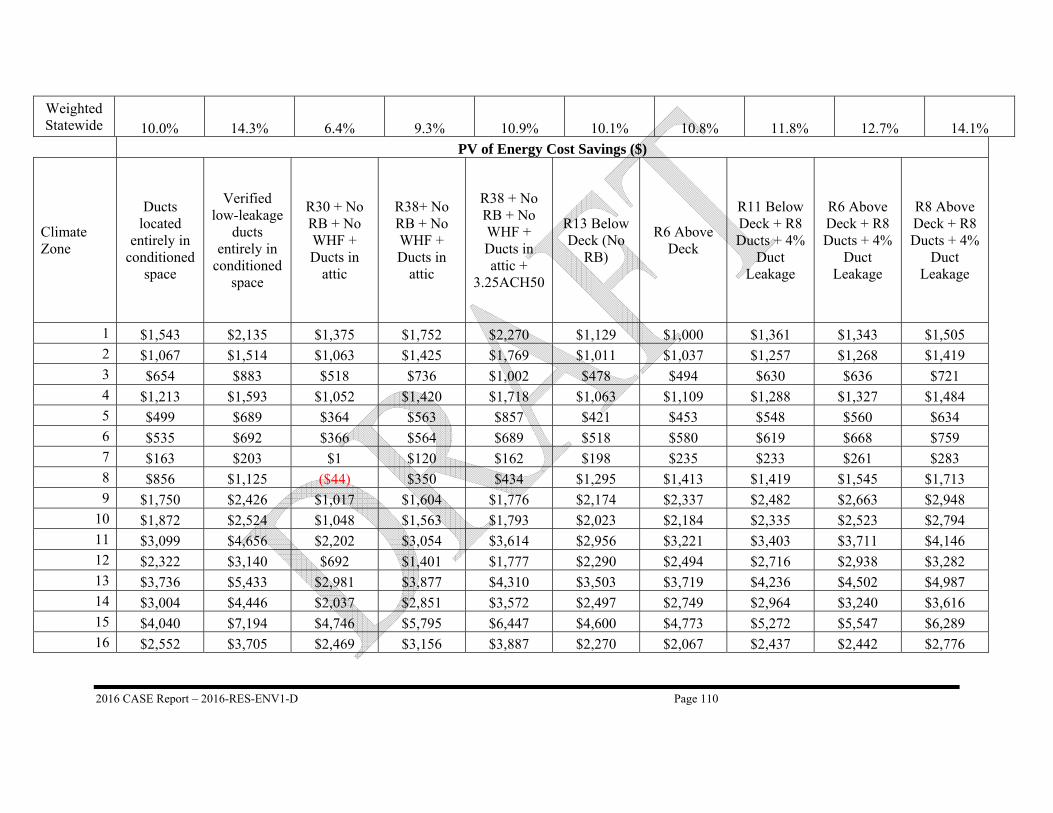
2016 CASE Report – 2016-RES-ENV1-D Page 110
Weighted Statewide 10.0% 14.3% 6.4% 9.3% 10.9% 10.1% 10.8% 11.8% 12.7% 14.1%
PV of Energy Cost Savings ($)
Climate Zone
Ducts located
entirely in conditioned
space
Verified low-leakage
ducts entirely in
conditioned space
R30 + No RB + No WHF + Ducts in
attic
R38+ No RB + No WHF + Ducts in
attic
R38 + No RB + No WHF + Ducts in attic +
3.25ACH50
R13 Below Deck (No
RB)
R6 Above Deck
R11 Below Deck + R8 Ducts + 4%
Duct Leakage
R6 Above Deck + R8 Ducts + 4%
Duct Leakage
R8 Above Deck + R8 Ducts + 4%
Duct Leakage
1 $1,543 $2,135 $1,375 $1,752 $2,270 $1,129 $1,000 $1,361 $1,343 $1,505 2 $1,067 $1,514 $1,063 $1,425 $1,769 $1,011 $1,037 $1,257 $1,268 $1,419 3 $654 $883 $518 $736 $1,002 $478 $494 $630 $636 $721 4 $1,213 $1,593 $1,052 $1,420 $1,718 $1,063 $1,109 $1,288 $1,327 $1,484 5 $499 $689 $364 $563 $857 $421 $453 $548 $560 $634 6 $535 $692 $366 $564 $689 $518 $580 $619 $668 $759 7 $163 $203 $1 $120 $162 $198 $235 $233 $261 $283 8 $856 $1,125 ($44) $350 $434 $1,295 $1,413 $1,419 $1,545 $1,713 9 $1,750 $2,426 $1,017 $1,604 $1,776 $2,174 $2,337 $2,482 $2,663 $2,948
10 $1,872 $2,524 $1,048 $1,563 $1,793 $2,023 $2,184 $2,335 $2,523 $2,794 11 $3,099 $4,656 $2,202 $3,054 $3,614 $2,956 $3,221 $3,403 $3,711 $4,146 12 $2,322 $3,140 $692 $1,401 $1,777 $2,290 $2,494 $2,716 $2,938 $3,282 13 $3,736 $5,433 $2,981 $3,877 $4,310 $3,503 $3,719 $4,236 $4,502 $4,987 14 $3,004 $4,446 $2,037 $2,851 $3,572 $2,497 $2,749 $2,964 $3,240 $3,616 15 $4,040 $7,194 $4,746 $5,795 $6,447 $4,600 $4,773 $5,272 $5,547 $6,289 16 $2,552 $3,705 $2,469 $3,156 $3,887 $2,270 $2,067 $2,437 $2,442 $2,776
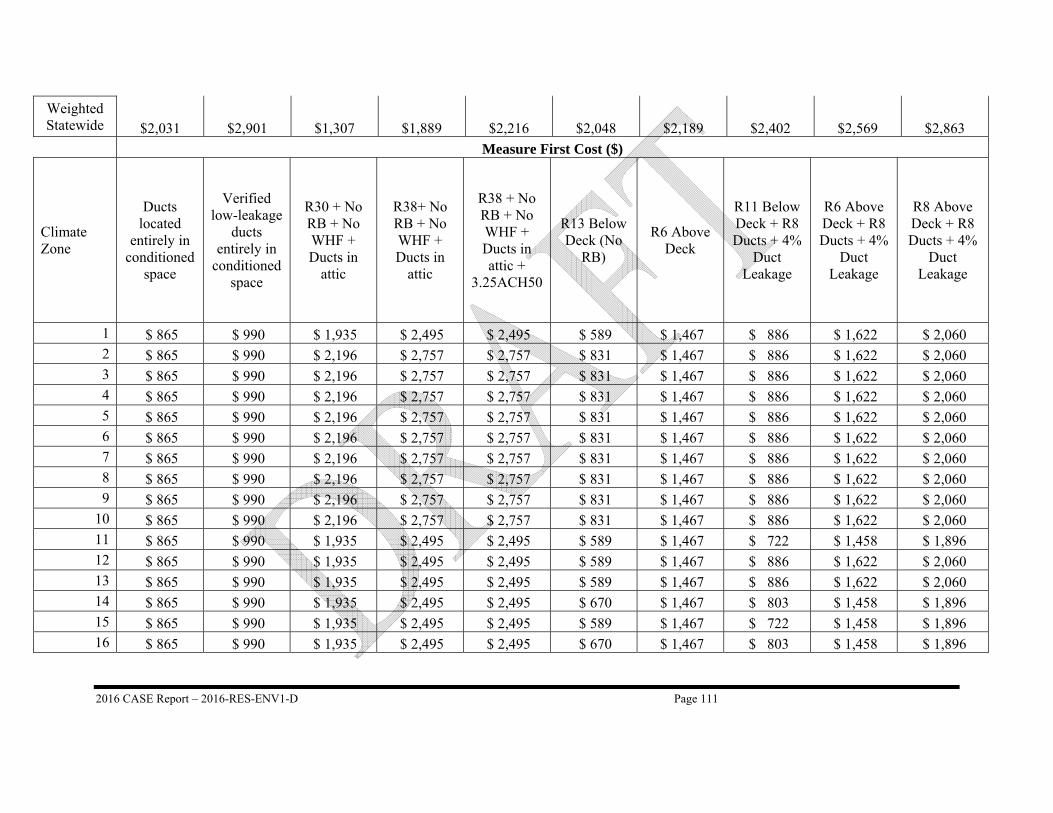
2016 CASE Report – 2016-RES-ENV1-D Page 111
Weighted Statewide $2,031 $2,901 $1,307 $1,889 $2,216 $2,048 $2,189 $2,402 $2,569 $2,863
Measure First Cost ($)
Climate Zone
Ducts located
entirely in conditioned
space
Verified low-leakage
ducts entirely in
conditioned space
R30 + No RB + No WHF + Ducts in
attic
R38+ No RB + No WHF + Ducts in
attic
R38 + No RB + No WHF + Ducts in attic +
3.25ACH50
R13 Below Deck (No
RB)
R6 Above Deck
R11 Below Deck + R8 Ducts + 4%
Duct Leakage
R6 Above Deck + R8 Ducts + 4%
Duct Leakage
R8 Above Deck + R8 Ducts + 4%
Duct Leakage
1 $ 865 $ 990 $ 1,935 $ 2,495 $ 2,495 $ 589 $ 1,467 $ 886 $ 1,622 $ 2,060 2 $ 865 $ 990 $ 2,196 $ 2,757 $ 2,757 $ 831 $ 1,467 $ 886 $ 1,622 $ 2,060 3 $ 865 $ 990 $ 2,196 $ 2,757 $ 2,757 $ 831 $ 1,467 $ 886 $ 1,622 $ 2,060 4 $ 865 $ 990 $ 2,196 $ 2,757 $ 2,757 $ 831 $ 1,467 $ 886 $ 1,622 $ 2,060 5 $ 865 $ 990 $ 2,196 $ 2,757 $ 2,757 $ 831 $ 1,467 $ 886 $ 1,622 $ 2,060 6 $ 865 $ 990 $ 2,196 $ 2,757 $ 2,757 $ 831 $ 1,467 $ 886 $ 1,622 $ 2,060 7 $ 865 $ 990 $ 2,196 $ 2,757 $ 2,757 $ 831 $ 1,467 $ 886 $ 1,622 $ 2,060 8 $ 865 $ 990 $ 2,196 $ 2,757 $ 2,757 $ 831 $ 1,467 $ 886 $ 1,622 $ 2,060 9 $ 865 $ 990 $ 2,196 $ 2,757 $ 2,757 $ 831 $ 1,467 $ 886 $ 1,622 $ 2,060
10 $ 865 $ 990 $ 2,196 $ 2,757 $ 2,757 $ 831 $ 1,467 $ 886 $ 1,622 $ 2,060 11 $ 865 $ 990 $ 1,935 $ 2,495 $ 2,495 $ 589 $ 1,467 $ 722 $ 1,458 $ 1,896 12 $ 865 $ 990 $ 1,935 $ 2,495 $ 2,495 $ 589 $ 1,467 $ 886 $ 1,622 $ 2,060 13 $ 865 $ 990 $ 1,935 $ 2,495 $ 2,495 $ 589 $ 1,467 $ 886 $ 1,622 $ 2,060 14 $ 865 $ 990 $ 1,935 $ 2,495 $ 2,495 $ 670 $ 1,467 $ 803 $ 1,458 $ 1,896 15 $ 865 $ 990 $ 1,935 $ 2,495 $ 2,495 $ 589 $ 1,467 $ 722 $ 1,458 $ 1,896 16 $ 865 $ 990 $ 1,935 $ 2,495 $ 2,495 $ 670 $ 1,467 $ 803 $ 1,458 $ 1,896
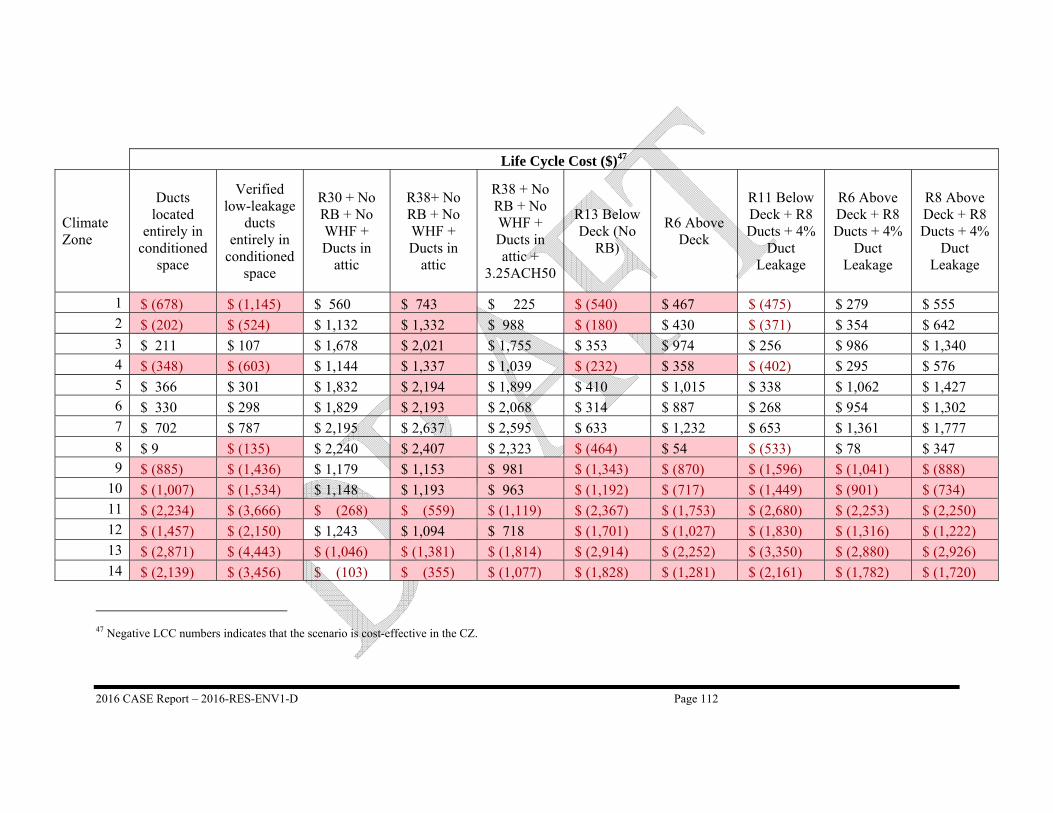
2016 CASE Report – 2016-RES-ENV1-D Page 112
Life Cycle Cost ($)47
Climate Zone
Ducts located
entirely in conditioned
space
Verified low-leakage
ducts entirely in
conditioned space
R30 + No RB + No WHF + Ducts in
attic
R38+ No RB + No WHF + Ducts in
attic
R38 + No RB + No WHF + Ducts in attic +
3.25ACH50
R13 Below Deck (No
RB)
R6 Above Deck
R11 Below Deck + R8 Ducts + 4%
Duct Leakage
R6 Above Deck + R8 Ducts + 4%
Duct Leakage
R8 Above Deck + R8 Ducts + 4%
Duct Leakage
1 $ (678) $ (1,145) $ 560 $ 743 $ 225 $ (540) $ 467 $ (475) $ 279 $ 555 2 $ (202) $ (524) $ 1,132 $ 1,332 $ 988 $ (180) $ 430 $ (371) $ 354 $ 642 3 $ 211 $ 107 $ 1,678 $ 2,021 $ 1,755 $ 353 $ 974 $ 256 $ 986 $ 1,340 4 $ (348) $ (603) $ 1,144 $ 1,337 $ 1,039 $ (232) $ 358 $ (402) $ 295 $ 576 5 $ 366 $ 301 $ 1,832 $ 2,194 $ 1,899 $ 410 $ 1,015 $ 338 $ 1,062 $ 1,427 6 $ 330 $ 298 $ 1,829 $ 2,193 $ 2,068 $ 314 $ 887 $ 268 $ 954 $ 1,302 7 $ 702 $ 787 $ 2,195 $ 2,637 $ 2,595 $ 633 $ 1,232 $ 653 $ 1,361 $ 1,777 8 $ 9 $ (135) $ 2,240 $ 2,407 $ 2,323 $ (464) $ 54 $ (533) $ 78 $ 347 9 $ (885) $ (1,436) $ 1,179 $ 1,153 $ 981 $ (1,343) $ (870) $ (1,596) $ (1,041) $ (888)
10 $ (1,007) $ (1,534) $ 1,148 $ 1,193 $ 963 $ (1,192) $ (717) $ (1,449) $ (901) $ (734) 11 $ (2,234) $ (3,666) $ (268) $ (559) $ (1,119) $ (2,367) $ (1,753) $ (2,680) $ (2,253) $ (2,250) 12 $ (1,457) $ (2,150) $ 1,243 $ 1,094 $ 718 $ (1,701) $ (1,027) $ (1,830) $ (1,316) $ (1,222) 13 $ (2,871) $ (4,443) $ (1,046) $ (1,381) $ (1,814) $ (2,914) $ (2,252) $ (3,350) $ (2,880) $ (2,926) 14 $ (2,139) $ (3,456) $ (103) $ (355) $ (1,077) $ (1,828) $ (1,281) $ (2,161) $ (1,782) $ (1,720)
47 Negative LCC numbers indicates that the scenario is cost-effective in the CZ.
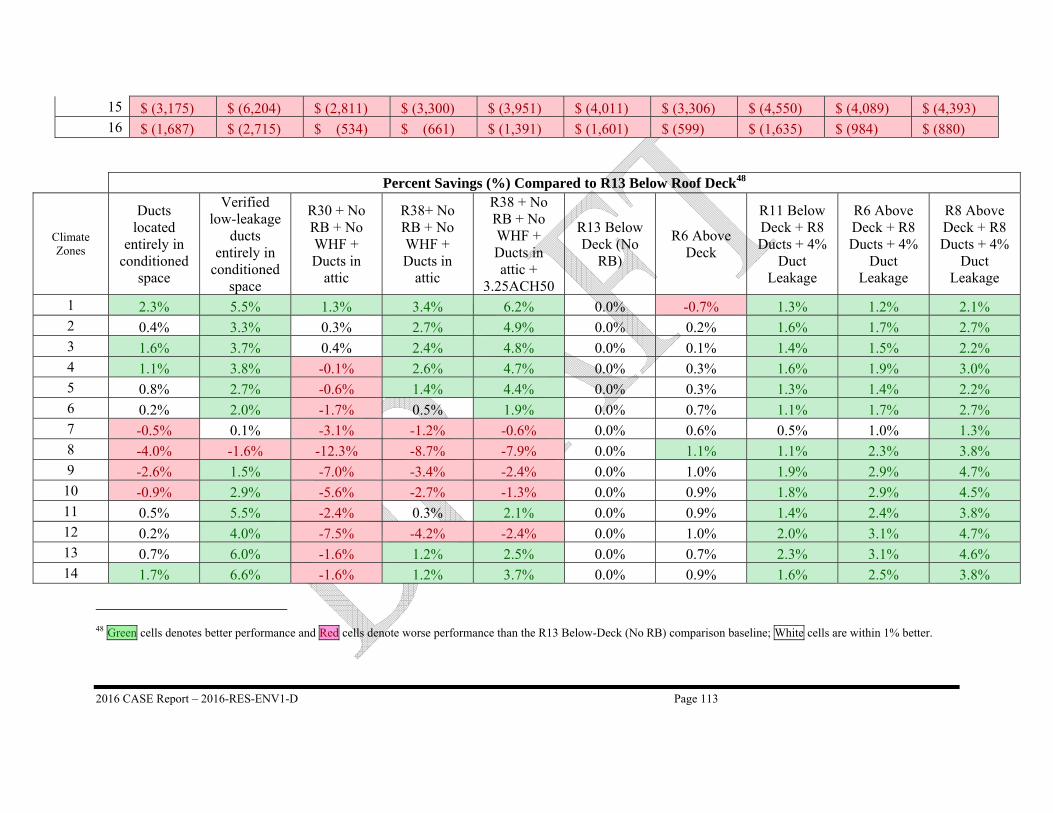
2016 CASE Report – 2016-RES-ENV1-D Page 113
15 $ (3,175) $ (6,204) $ (2,811) $ (3,300) $ (3,951) $ (4,011) $ (3,306) $ (4,550) $ (4,089) $ (4,393) 16 $ (1,687) $ (2,715) $ (534) $ (661) $ (1,391) $ (1,601) $ (599) $ (1,635) $ (984) $ (880)
Percent Savings (%) Compared to R13 Below Roof Deck48
Climate Zones
Ducts located
entirely in conditioned
space
Verified low-leakage
ducts entirely in
conditioned space
R30 + No RB + No WHF + Ducts in
attic
R38+ No RB + No WHF + Ducts in
attic
R38 + No RB + No WHF + Ducts in attic +
3.25ACH50
R13 Below Deck (No
RB)
R6 Above Deck
R11 Below Deck + R8 Ducts + 4%
Duct Leakage
R6 Above Deck + R8 Ducts + 4%
Duct Leakage
R8 Above Deck + R8 Ducts + 4%
Duct Leakage
1 2.3% 5.5% 1.3% 3.4% 6.2% 0.0% -0.7% 1.3% 1.2% 2.1% 2 0.4% 3.3% 0.3% 2.7% 4.9% 0.0% 0.2% 1.6% 1.7% 2.7% 3 1.6% 3.7% 0.4% 2.4% 4.8% 0.0% 0.1% 1.4% 1.5% 2.2% 4 1.1% 3.8% -0.1% 2.6% 4.7% 0.0% 0.3% 1.6% 1.9% 3.0% 5 0.8% 2.7% -0.6% 1.4% 4.4% 0.0% 0.3% 1.3% 1.4% 2.2% 6 0.2% 2.0% -1.7% 0.5% 1.9% 0.0% 0.7% 1.1% 1.7% 2.7% 7 -0.5% 0.1% -3.1% -1.2% -0.6% 0.0% 0.6% 0.5% 1.0% 1.3% 8 -4.0% -1.6% -12.3% -8.7% -7.9% 0.0% 1.1% 1.1% 2.3% 3.8% 9 -2.6% 1.5% -7.0% -3.4% -2.4% 0.0% 1.0% 1.9% 2.9% 4.7%
10 -0.9% 2.9% -5.6% -2.7% -1.3% 0.0% 0.9% 1.8% 2.9% 4.5% 11 0.5% 5.5% -2.4% 0.3% 2.1% 0.0% 0.9% 1.4% 2.4% 3.8% 12 0.2% 4.0% -7.5% -4.2% -2.4% 0.0% 1.0% 2.0% 3.1% 4.7% 13 0.7% 6.0% -1.6% 1.2% 2.5% 0.0% 0.7% 2.3% 3.1% 4.6% 14 1.7% 6.6% -1.6% 1.2% 3.7% 0.0% 0.9% 1.6% 2.5% 3.8%
48 Green cells denotes better performance and Red cells denote worse performance than the R13 Below-Deck (No RB) comparison baseline; White cells are within 1% better.
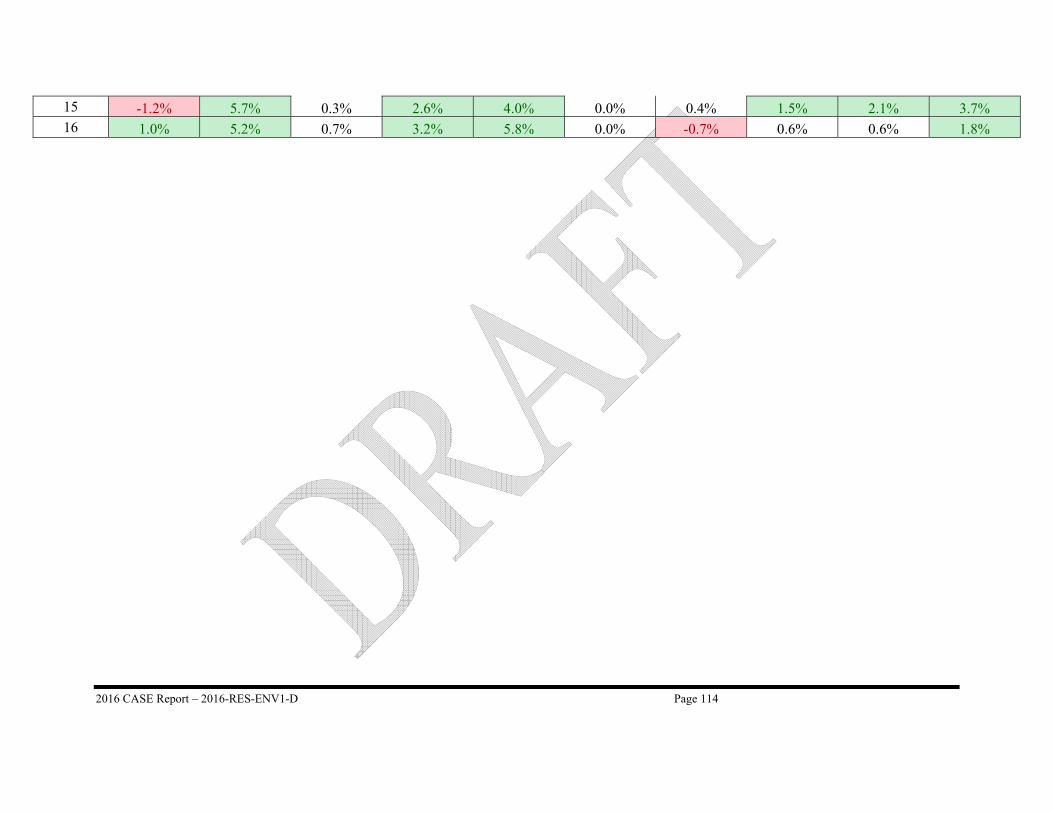
2016 CASE Report – 2016-RES-ENV1-D Page 114
15 -1.2% 5.7% 0.3% 2.6% 4.0% 0.0% 0.4% 1.5% 2.1% 3.7% 16 1.0% 5.2% 0.7% 3.2% 5.8% 0.0% -0.7% 0.6% 0.6% 1.8%
2016 CASE Report – 2016-RES-ENV1-D Page 115
13. APPENDIX F: ROOF COVERING AND ROOF
DECK INSULATION FIRE RATING
REQUIREMENTS During the stakeholder engagement process, stakeholders raised concerns and the Statewide CASE Team investigated the topic of whether and how having above deck insulation would affect the fire rating of roof covering products. This appendix describes the fire rating requirements for roof covering products, for roof deck insulation based on the Statewide CASE Team’s research, discussions with industry stakeholders and feedback from the California Fire Marshal Office.
13.1 Roof Covering Fire Rating Roof covering products are current rated to class A/B/C based on the ASTM E108 [NFPA 256, UL790] test. The test is a laboratory test which places a block of “burning brand” wooden block on top of the roof assembly to simulate the effect of a fire originating from outside the building. The rating for a particularly roof covering is specific to the slope of the roof and maximum insulation thickness (if applicable) are both factors that affect the fire performance of the roof assembly. According to industry feedback through the CASE process, roof covering manufacturers currently rate their products with the configuration of placing roof covering directly on the test roof deck (as opposed to adding an insulation layer).
Under current building code requirement, tile roof products are automatically rated Class A. Chapter 15 in the California Building Code (and International Building Code section 1505 for Fire Classification) specify that certain roofing materials are Class A without having to test to ASTEM E108. These materials include slate, clay, concrete roof tile, an exposed concrete roof deck, and ferrous and copper shingles.
13.2 Plastic Roof Deck Insulation Fire Rating Insulation products are subject to a different fire test from roof covering products. California Building Code (and International Building Code section 2603 for Foam Plastic Insulation) require foam plastic insulation to be tested to demonstrate flame spreads index of not more than 75 and a smoke-developed index of not more than 450 according to ASTM E84 [UL723]. The requirements are applicable to roof insulation products, including XPS/ polyiso/ polyurethane above‐deck insulation and SPF below‐deck insulation products. The Statewide CASE Team collected product literature to understand and verify how these insulation products currently demonstrate compliance the regulations. Product literatures for plastic foam insulation products from the following product categories and manufacturers/brands were reviewed, and all of them have publicly available ICC-ES (Evaluation Services) Evaluation Reports and disclose the flame spread and smoke-developed indices in product specification list.
2016 CASE Report – 2016-RES-ENV1-D Page 116
• Polystyrene: XPS brands Dow and Owens Corning; EPS brand InsulFoam. • Polyiso/Polyurethane: JM, GAF, Rmax and Firestone.
In summary, plastic roof deck insulation does not adhere to the same fire rating test as roof covering materials. However, the Statewide CASE Team did find one polyiso foam board products literature that claims to have tested their products to obtain Class A rating status. For this product, the maximum slope allowed were in the range of ¼:12 to 1:12, so it is essentially only for flat roofs (more common in commercial than residential application).
13.3 Impact of Above Deck Insulation on Roof Assembly Fire Rating
The Statewide CASE Team looked into the fire ratings issue and consulted with a representative in the California State Fire Marshall office (Kevin Reinertsen - Division Chief). Here are the key points from our discussions:
Roof covering (tiles, shingles) test (ASTM E108/UL790) that results in class A/B/C ratings are done with specific roof assemblies, and ratings are only valid when the installation is the same as the assembly as rated.
Q: “If roof covering is class A, and the rigid insulation is also rated satisfactorily (ASTM E84 for flame spread and smoke developed indices), does that imply the assembly satisfies fire rating requirement? “ (Fire rated + fire rated = fire rated?) Answer: One would think so, but this is not quite the case. In his opinion, the roof coverings need to be rated/certified again when you add above-deck insulation to reflect the change in assembly. Mr. Reinertsen said that these tests cost on the order of $20,000 for each assembly.
Q; “who will bear this cost?” Answer: Mr. Reinertsen thinks that roof manufacturers (and perhaps partnering with rigid foam manufacturers) would be the ones forking out for the tests, and some of them might even see it as a market advantage.
Mr. Reinertsen recommends for the Statewide CASE Team to make sure to reference the appropriate CBC in the Part 6 requirements, if we are proposing a decrease in roof assembly U factor that may get builders to consider installing rigid foam above deck.
Mr. Reinertsen also confirmed that insulation installed below roof deck would not trigger fire concerns.
The Statewide CASE Team also have discussions with industry stakeholder Rick Olson from the Tile Roofing Institute who confirmed these findings.
2016 CASE Report – 2016-RES-ENV1-D Page 117
13.4 Summary of Fire Tests ASTM E108 [NFPA 256, UL790], Fire Tests of Roof Coverings49
Combustibility is determined on all components of the roof assembly as a composite. The test includes three parts:
• Spread of flame • Intermittent flame • Burning brand
The spread of flame is the only test conducted on roof assemblies with concrete, steel or gypsum decks (non‐combustible), while all three tests are performed on assemblies incorporating combustible (wood, plank, plywood, or plastic foam) roof decks.
ASTM E84 [UL 723 or NFPA 255], Surface Burning Characteristics of Building Materials50
Often referred to as the “Steiner Tunnel Test,” E84 is a standard method to assess the spread of fire on the surface of a material. A sample about 20 inches wide and 25 feet long is installed on the ceiling of a horizontal test chamber. The material is exposed to a 4‐foot long gas flame at one end of the tunnel for a period of 10 minutes. Threat of flame front 2 progression on the material is compared to a standard (inorganic reinforced cement board) and calculations are made to produce a flame spread rating (a unit‐less number). Smoke from the fire in the tunnel is measured in the exhaust stack by using a light beam to evaluate smoke developed ratings.
Since E84 is a standard laboratory fire test on a single material, numerical ratings derived from E84 are not intended to reflect hazards presented by the test material under actual fire conditions.
13.5 Examples of ICC-ES Evaluation Reports The Statewide CASE Team reviewed a number of ICC-ES product evaluation reports to understand the fire rating requirements and results associated with roof deck insulation products. A few examples for the common insulation types are presented below to illustrate the type of information provided in these reports. The Statewide CASE Team accessed the reports presented below from ICC-ES’s website directly, under various sections under Division 07 00 00 for Thermal and Moisture Protection products.51
Polyiso Rigid Foam Example - ESR-339852
This report is for two similar polyiso rigid foams products with different facing materials. The front section of the report clearly points out the code version (year published) and sections for
49 http://www.astm.org/DATABASE.CART/HISTORICAL/E108‐00.htm 50 http://www.astm.org/Standards/E84.htm 51 http://www.icc-es.org/Reports/index.cfm?csi_id=302&view_details 52 http://www.icc-es.org/Reports/pdf_files/ESR-3398.pdf
2016 CASE Report – 2016-RES-ENV1-D Page 118
which the products were tested to be in compliance. The evaluation report provides details on product Descriptions (Section 3). The descriptions include product physical specifications, thermal resistance values from testing, air and vapor permeability levels from testing.
The report also offers associated Installation (Section 4) requirements for different product applications, such as for wall assemblies, crawl space and attic installations. Many of the installation instructions cite relevant International Residential Code sections and enable easy references to code requirements.
For this particularly product, the report provided installation details if the product was installed as a water-resistive barrier. Details included configuration and fastening method and proper treatment of joints and seams to achieve desired water-resistance properties. The report even listed example sheathing products (manufacturer, product type and corresponding ESR numbers) that may be used in conjunction to construct a water-resistance barrier.
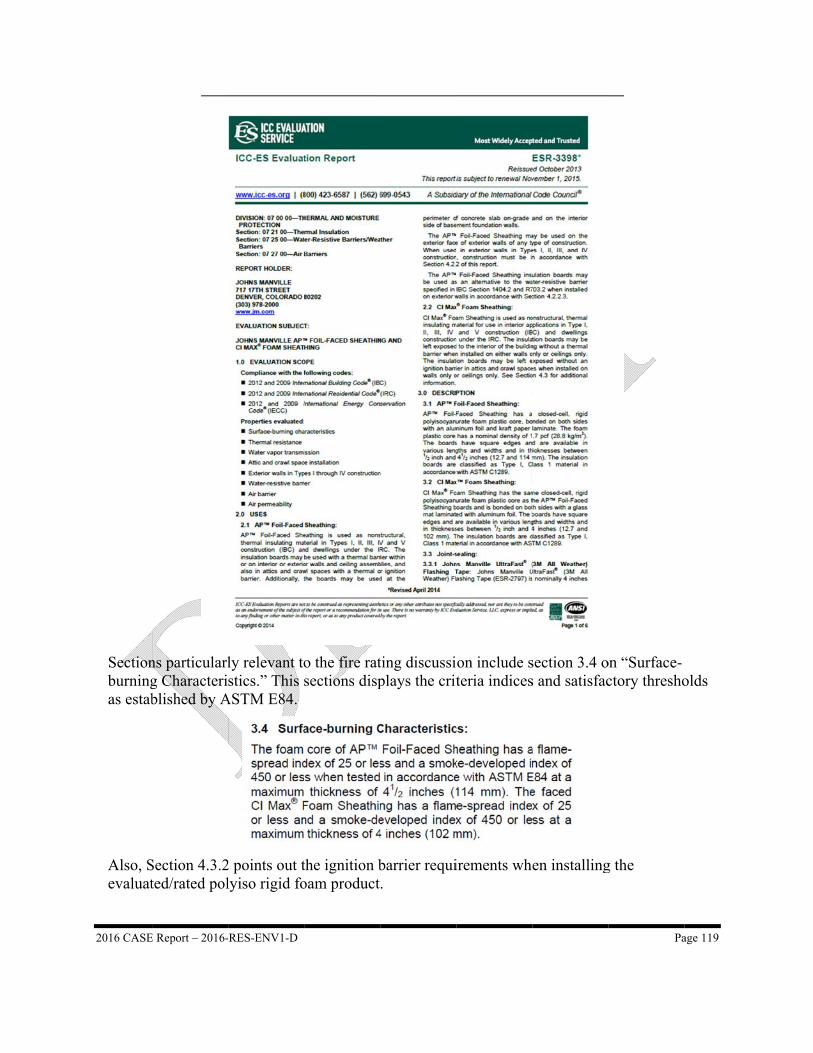
2016 CASE
Sectionburningas estab
Also, Sevaluat
E Report – 2016-
ns particularlg Characteriblished by A
Section 4.3.2ted/rated pol
-RES-ENV1-D
ly relevant tostics.” This
ASTM E84.
2 points out tlyiso rigid fo
o the fire ratsections disp
the ignition boam product
ting discussiplays the crit
barrier requi.
on include steria indices
irements whe
section 3.4 os and satisfac
en installing
Pa
on “Surface-ctory thresho
g the
age 119
olds
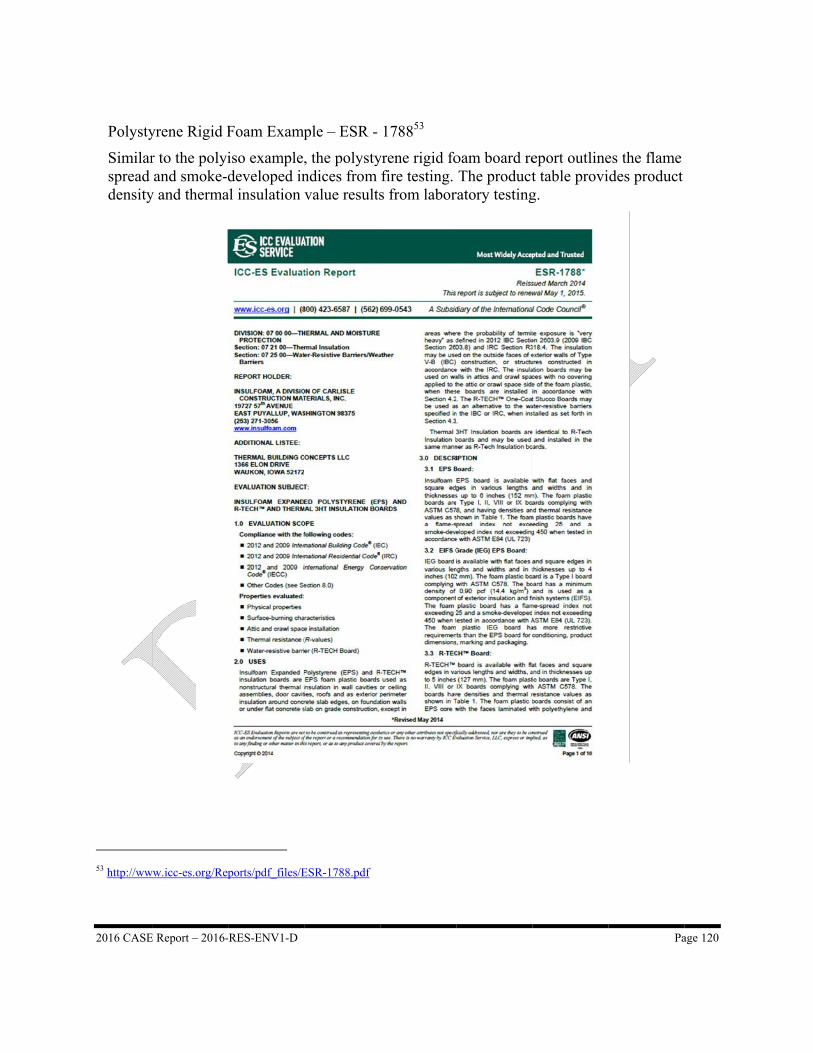
2016 CASE
Polysty
Similarspread density
53 http://ww
E Report – 2016-
yrene Rigid F
r to the polyiand smoke-d
y and therma
ww.icc-es.org/Rep
-RES-ENV1-D
Foam Examp
iso exampledeveloped in
al insulation
ports/pdf_files/E
ple – ESR -
, the polystyndices from value results
ESR-1788.pdf
178853
yrene rigid fofire testing. s from labor
oam board reThe product
ratory testing
eport outlinet table provig.
Pa
es the flame des product
age 120
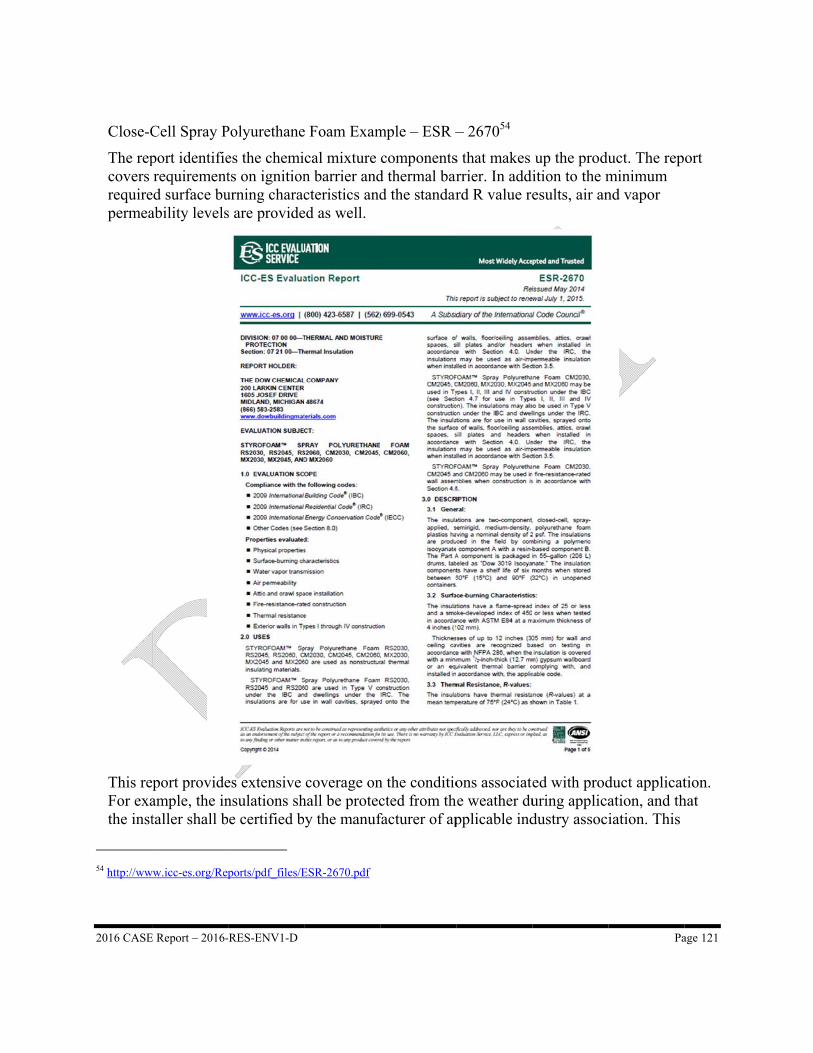
2016 CASE
Close-C
The repcovers requirepermea
This reFor exathe inst
54 http://ww
E Report – 2016-
Cell Spray P
port identifierequirement
ed surface buability levels
port provideample, the intaller shall b
ww.icc-es.org/Rep
-RES-ENV1-D
Polyurethane
es the chemits on ignitionurning characs are provide
es extensive nsulations she certified b
ports/pdf_files/E
e Foam Exam
cal mixture n barrier andcteristics and
ed as well.
coverage onhall be protecy the manuf
ESR-2670.pdf
mple – ESR –
componentsd thermal bard the standar
n the conditiocted from thfacturer of ap
– 267054
s that makes rrier. In addird R value re
ons associatehe weather dupplicable ind
up the produition to the mesults, air an
ed with produring applicadustry associ
Pa
uct. The repminimum nd vapor
duct applicatation, and thiation. This
age 121
ort
tion. hat

2016 CASE Report – 2016-RES-ENV1-D Page 122
echoes feedback the Statewide CASE Team received from a spray foam manufacturer representative on their continuous efforts to standardize and unify the installer qualification certifications via industry alliance and associations.
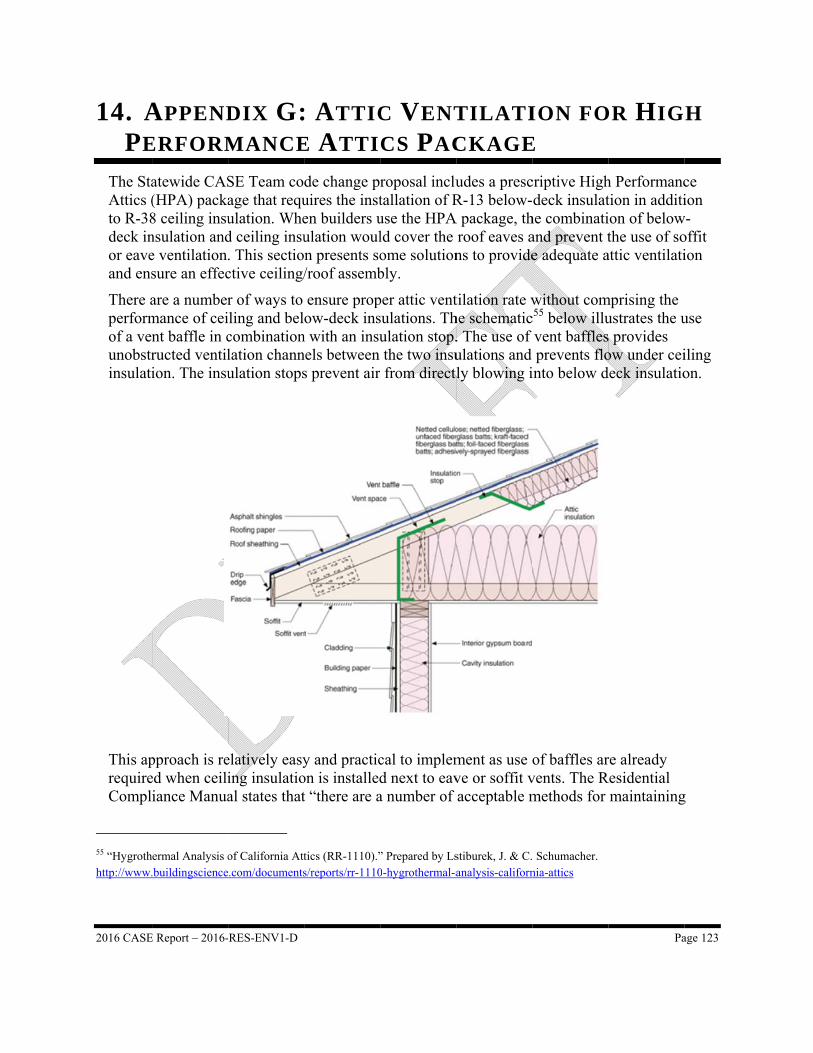
2016 CASE
14. APE
The StaAttics (to R-38deck inor eaveand ens
There aperformof a venunobstrinsulati
This aprequireCompl
55 “Hygrothhttp://www.
E Report – 2016-
APPEND
ERFORM
atewide CAS(HPA) packa8 ceiling insunsulation ande ventilationsure an effec
are a numbermance of ceint baffle in cructed ventilion. The insu
pproach is reed when ceiliiance Manua
ermal Analysis o.buildingscience
-RES-ENV1-D
DIX G:MANCE
SE Team coage that requulation. Whed ceiling insu. This sectioctive ceiling/
r of ways to ling and belcombinationlation channulation stops
elatively easying insulatioal states that
of California Att.com/documents
: ATTIC
E ATTI
de change pruires the insten builders uulation wouln presents so/roof assemb
ensure propow-deck ins
n with an insunels between s prevent air
y and practicon is installedt “there are a
tics (RR-1110).”s/reports/rr-1110
C VENT
CS PAC
roposal inclutallation of Ruse the HPAld cover the ome solutionbly.
per attic ventsulations. Thulation stop.the two insufrom directl
cal to implemd next to eava number of
” Prepared by Ls0-hygrothermal-a
TILATI
CKAGE
udes a prescR-13 below-
A package, throof eaves ans to provide
tilation rate whe schematic. The use of ulations and ly blowing i
ment as use ove or soffit vacceptable m
stiburek, J. & C.analysis-californ
ION FO
E criptive Highdeck insulat
he combinatiand prevent te adequate a
without comc55 below illu
vent bafflesprevents flo
into below d
of baffles arvents. The Rmethods for
Schumacher. nia-attics
Pa
OR HIG
h Performanction in additiion of belowthe use of so
attic ventilati
mprising the ustrates the us provides ow under ceideck insulatio
re already Residential
maintaining
age 123
H
ce ion
w-offit ion
use
iling on.
g
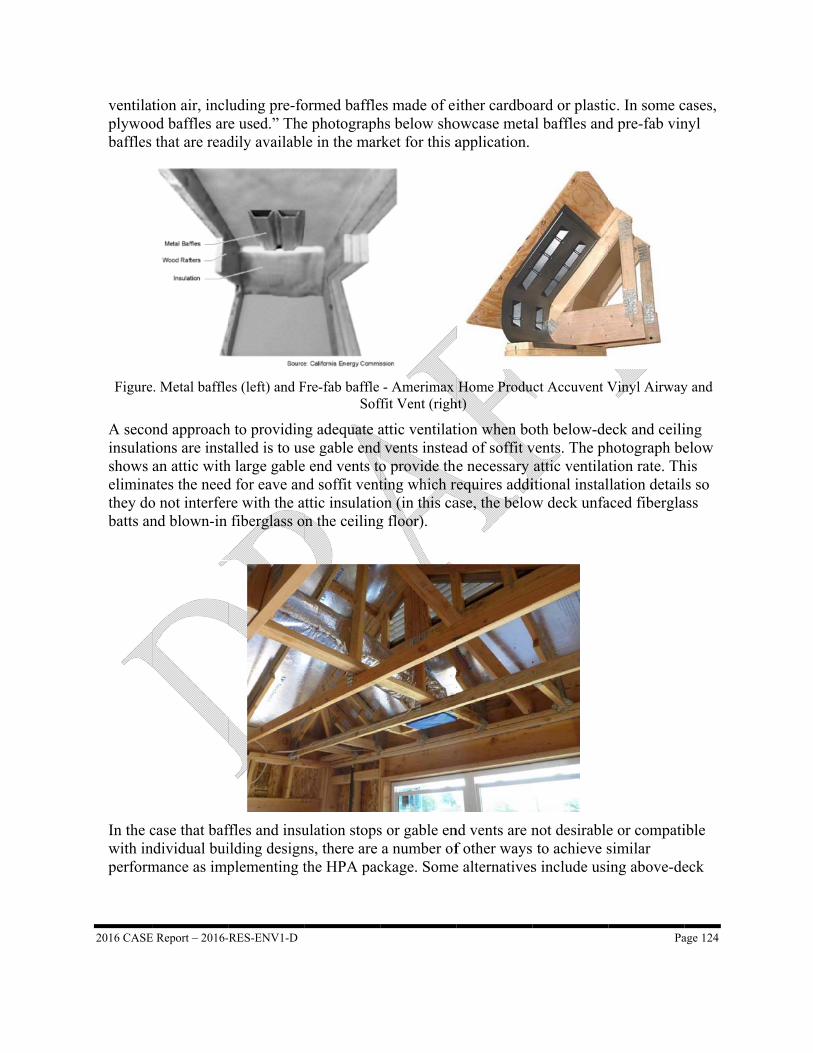
2016 CASE
ventilatplywoobaffles
Figure
A secoinsulatishows eliminathey dobatts an
In the cwith inperform
E Report – 2016-
tion air, inclod baffles arthat are read
e. Metal baffle
nd approachions are instan attic withates the needo not interfernd blown-in
case that bafndividual buimance as imp
-RES-ENV1-D
luding pre-foe used.” Thedily availabl
es (left) and F
h to providinalled is to us
h large gabled for eave anre with the afiberglass o
ffles and insuilding designplementing t
ormed bafflee photographle in the mar
Fre-fab baffle Sof
ng adequate ase gable ende end vents tond soffit ventattic insulatioon the ceiling
ulation stopsns, there are the HPA pac
es made of eihs below shorket for this a
- Amerimax
ffit Vent (righ
attic ventilatd vents insteao provide theting which ron (in this cag floor).
s or gable ena number of
ckage. Some
ither cardboowcase metaapplication.
Home Produht)
tion when boad of soffit ve necessary
requires addiase, the below
nd vents are nf other wayse alternatives
ard or plastial baffles and
uct Accuvent V
oth below-devents. The phattic ventilatitional instalw deck unfa
not desirable to achieve ss include usi
Pa
ic. In some cd pre-fab vin
Vinyl Airway
eck and ceilihotograph betion rate. Thllation detailaced fibergla
e or compatisimilar ing above-de
age 124
cases, nyl
y and
ing elow his ls so ass
ible
eck

2016 CASE Report – 2016-RES-ENV1-D Page 125
insulation or using cool roofs with higher reflectance level instead (of installing below-deck insulation).
2016 CASE Report – 2016-RES-ENV1-D Page 126
15. APPENDIX H: COST METHODOLOGY AND
RESULTS FOR OTHER DCS AND HPA MEASURES
INVESTIGATED The Statewide CASE Team performed building energy simulations and collected costs data associated with the DCS strategies and HPA measures laid out in Report Section 3. To keep the report succinct, only the results directly applicable to the proposed prescriptive requirements are included in subsequent report sections, Sections 4 and 5. This appendix displays the energy impacts and cost results from CASE efforts that are not already presented in Sections 4 and 5. The strategies included in this appendix include:
Ducts in Conditions Space (DCS)
Ducts entirely in conditioned space (without HERS performance verification)
High Performance Attics (HPA)
Duct Insulation Duct Leakage Roof Reflectance Raised Heel Truss Supply Duct Surface Area
15.1 Project-Level Construction Cost Results The following table shows the project level incremental costs for the HPA components beyond the HPA package recommended in the main body of the report for code adoption.
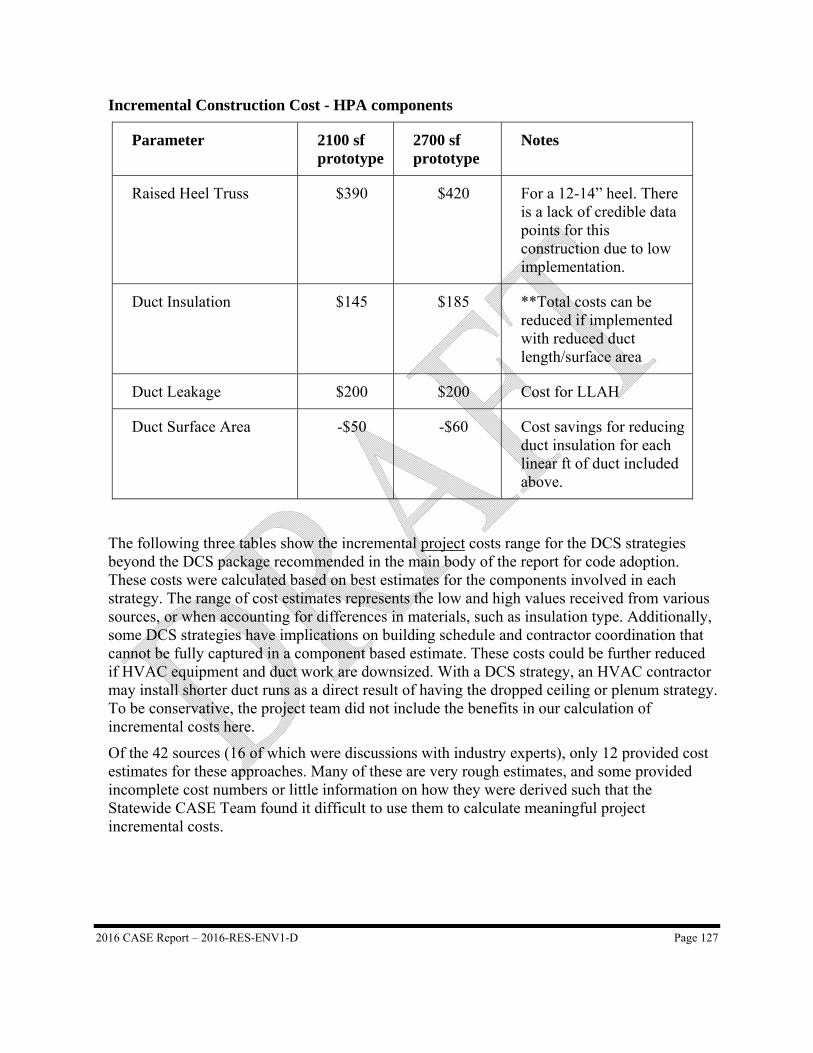
2016 CASE Report – 2016-RES-ENV1-D Page 127
Incremental Construction Cost - HPA components
Parameter 2100 sf prototype
2700 sf prototype
Notes
Raised Heel Truss $390 $420 For a 12-14” heel. There is a lack of credible data points for this construction due to low implementation.
Duct Insulation $145 $185 **Total costs can be reduced if implemented with reduced duct length/surface area
Duct Leakage $200 $200 Cost for LLAH
Duct Surface Area -$50 -$60 Cost savings for reducing duct insulation for each linear ft of duct included above.
The following three tables show the incremental project costs range for the DCS strategies beyond the DCS package recommended in the main body of the report for code adoption. These costs were calculated based on best estimates for the components involved in each strategy. The range of cost estimates represents the low and high values received from various sources, or when accounting for differences in materials, such as insulation type. Additionally, some DCS strategies have implications on building schedule and contractor coordination that cannot be fully captured in a component based estimate. These costs could be further reduced if HVAC equipment and duct work are downsized. With a DCS strategy, an HVAC contractor may install shorter duct runs as a direct result of having the dropped ceiling or plenum strategy. To be conservative, the project team did not include the benefits in our calculation of incremental costs here.
Of the 42 sources (16 of which were discussions with industry experts), only 12 provided cost estimates for these approaches. Many of these are very rough estimates, and some provided incomplete cost numbers or little information on how they were derived such that the Statewide CASE Team found it difficult to use them to calculate meaningful project incremental costs.
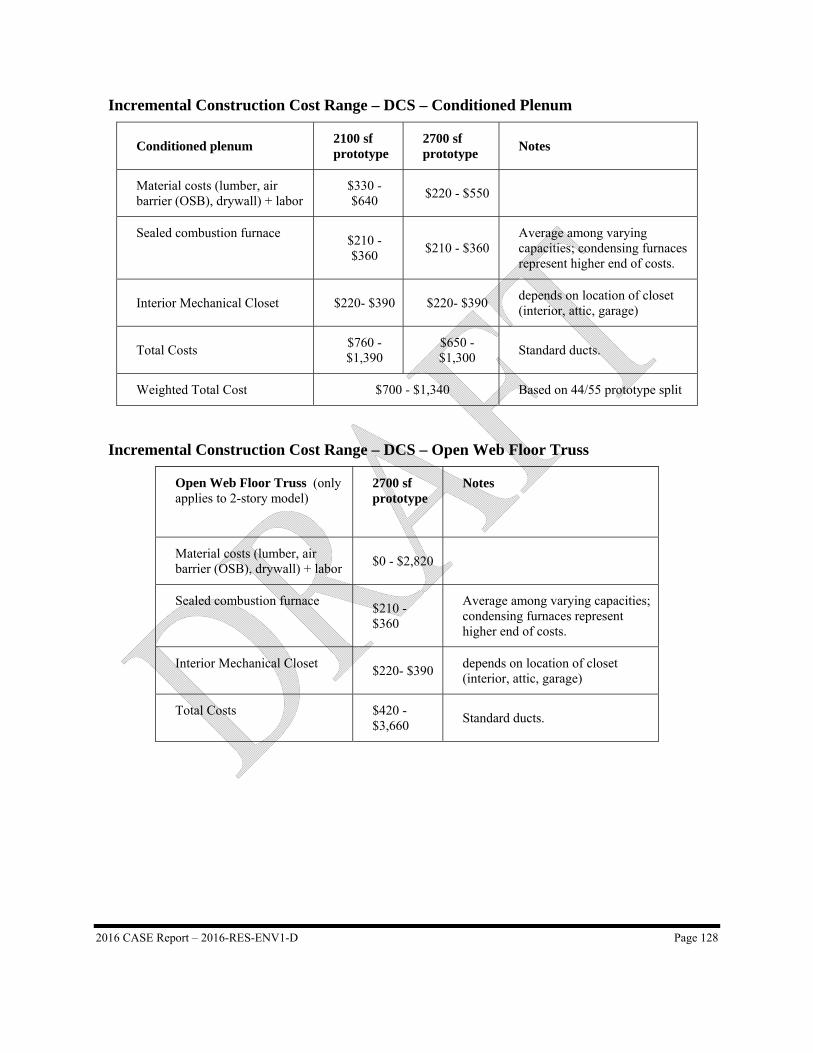
2016 CASE Report – 2016-RES-ENV1-D Page 128
Incremental Construction Cost Range – DCS – Conditioned Plenum
Conditioned plenum 2100 sf prototype
2700 sf prototype
Notes
Material costs (lumber, air barrier (OSB), drywall) + labor
$330 - $640
$220 - $550
Sealed combustion furnace $210 - $360
$210 - $360 Average among varying capacities; condensing furnaces represent higher end of costs.
Interior Mechanical Closet $220- $390 $220- $390 depends on location of closet (interior, attic, garage)
Total Costs $760 - $1,390
$650 - $1,300
Standard ducts.
Weighted Total Cost $700 - $1,340 Based on 44/55 prototype split
Incremental Construction Cost Range – DCS – Open Web Floor Truss
Open Web Floor Truss (only applies to 2-story model)
2700 sf prototype
Notes
Material costs (lumber, air barrier (OSB), drywall) + labor
$0 - $2,820
Sealed combustion furnace $210 - $360
Average among varying capacities; condensing furnaces represent higher end of costs.
Interior Mechanical Closet $220- $390
depends on location of closet (interior, attic, garage)
Total Costs $420 - $3,660
Standard ducts.
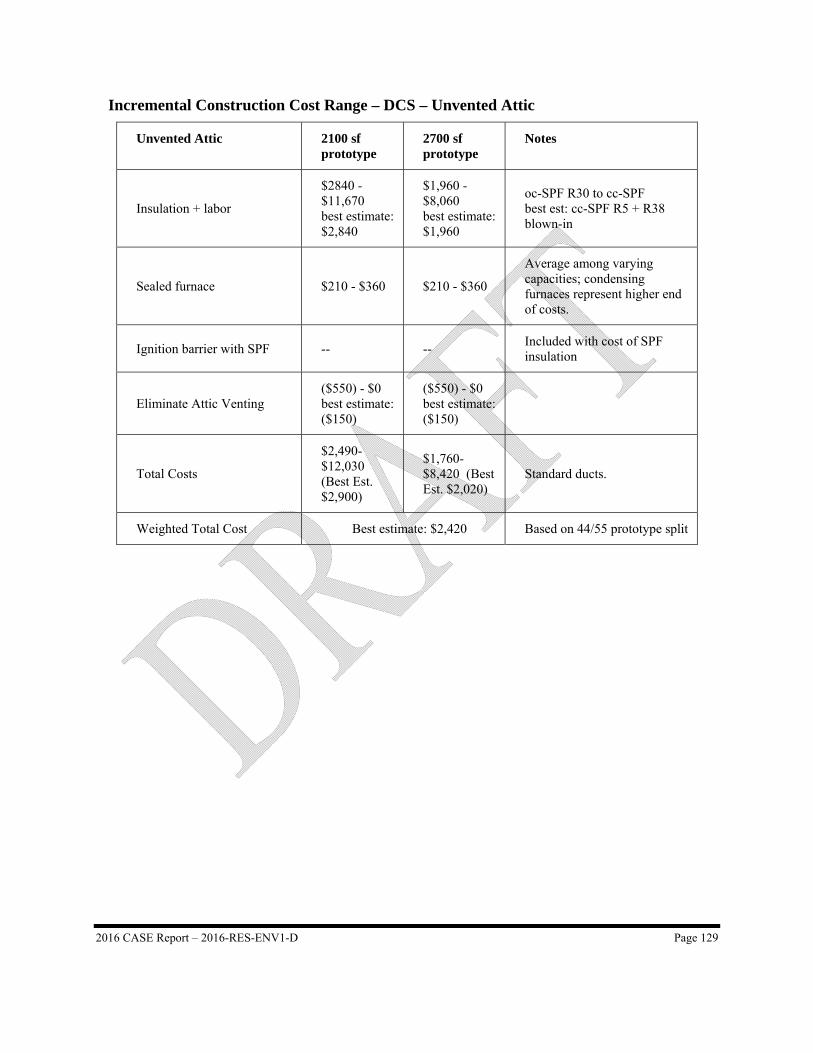
2016 CASE Report – 2016-RES-ENV1-D Page 129
Incremental Construction Cost Range – DCS – Unvented Attic
Unvented Attic 2100 sf prototype
2700 sf prototype
Notes
Insulation + labor
$2840 - $11,670 best estimate: $2,840
$1,960 - $8,060 best estimate: $1,960
oc-SPF R30 to cc-SPF best est: cc-SPF R5 + R38 blown-in
Sealed furnace $210 - $360 $210 - $360
Average among varying capacities; condensing furnaces represent higher end of costs.
Ignition barrier with SPF -- -- Included with cost of SPF insulation
Eliminate Attic Venting ($550) - $0 best estimate: ($150)
($550) - $0 best estimate: ($150)
Total Costs
$2,490- $12,030 (Best Est. $2,900)
$1,760- $8,420 (Best Est. $2,020)
Standard ducts.
Weighted Total Cost Best estimate: $2,420 Based on 44/55 prototype split
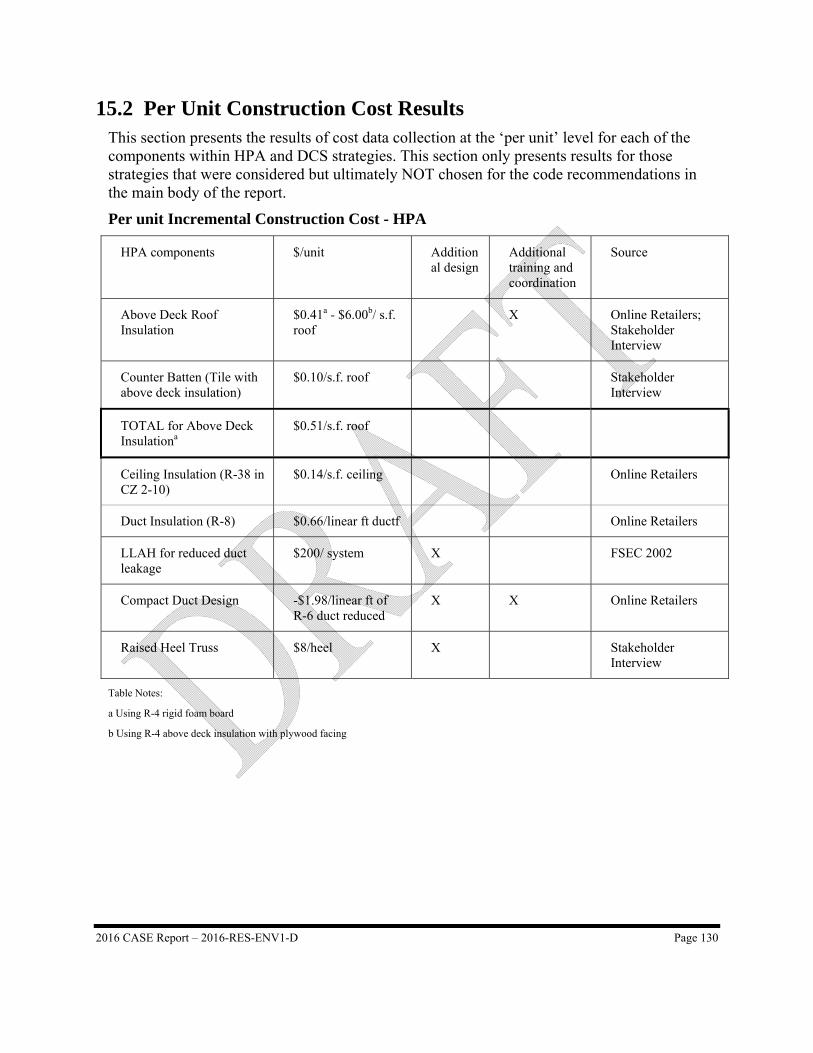
2016 CASE Report – 2016-RES-ENV1-D Page 130
15.2 Per Unit Construction Cost Results This section presents the results of cost data collection at the ‘per unit’ level for each of the components within HPA and DCS strategies. This section only presents results for those strategies that were considered but ultimately NOT chosen for the code recommendations in the main body of the report.
Per unit Incremental Construction Cost - HPA
HPA components $/unit Additional design
Additional training and coordination
Source
Above Deck Roof Insulation
$0.41a - $6.00b/ s.f. roof
X Online Retailers; Stakeholder Interview
Counter Batten (Tile with above deck insulation)
$0.10/s.f. roof Stakeholder Interview
TOTAL for Above Deck Insulationa
$0.51/s.f. roof
Ceiling Insulation (R-38 in CZ 2-10)
$0.14/s.f. ceiling Online Retailers
Duct Insulation (R-8) $0.66/linear ft ductf Online Retailers
LLAH for reduced duct leakage
$200/ system X FSEC 2002
Compact Duct Design -$1.98/linear ft of R-6 duct reduced
X X Online Retailers
Raised Heel Truss $8/heel X Stakeholder Interview
Table Notes:
a Using R-4 rigid foam board
b Using R-4 above deck insulation with plywood facing
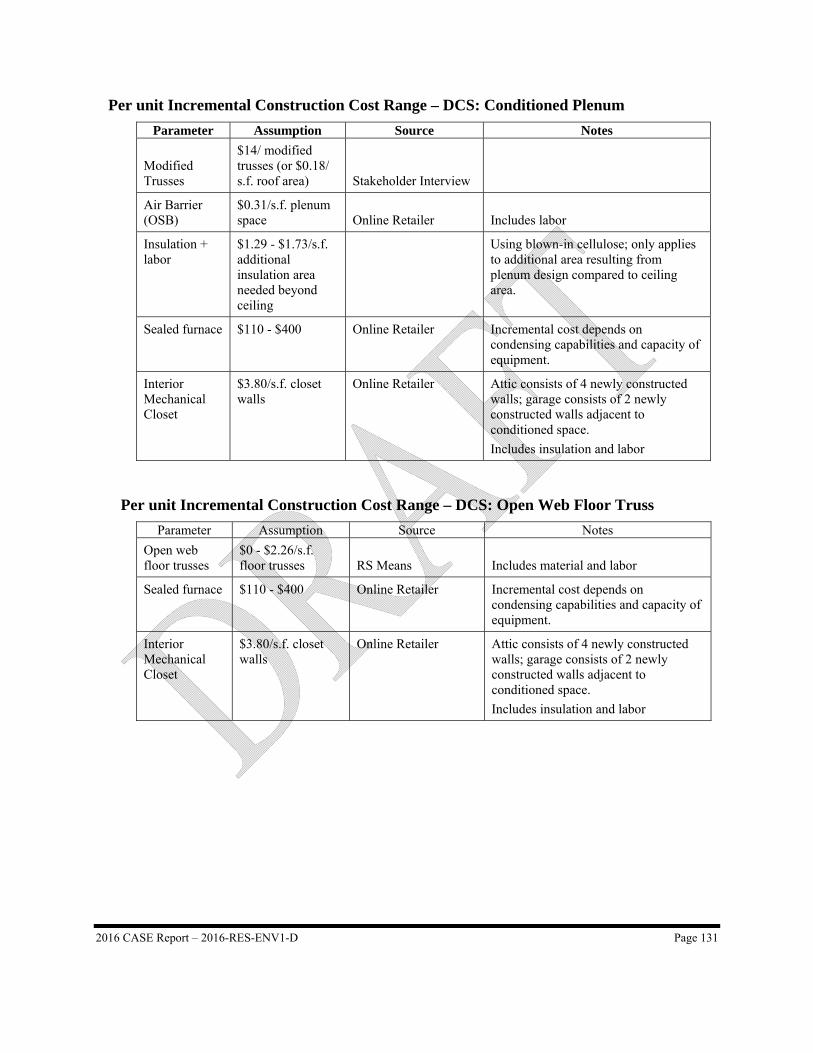
2016 CASE Report – 2016-RES-ENV1-D Page 131
Per unit Incremental Construction Cost Range – DCS: Conditioned Plenum
Parameter Assumption Source Notes
Modified Trusses
$14/ modified trusses (or $0.18/ s.f. roof area) Stakeholder Interview
Air Barrier (OSB)
$0.31/s.f. plenum space Online Retailer Includes labor
Insulation + labor
$1.29 - $1.73/s.f. additional insulation area needed beyond ceiling
Using blown-in cellulose; only applies to additional area resulting from plenum design compared to ceiling area.
Sealed furnace $110 - $400 Online Retailer Incremental cost depends on condensing capabilities and capacity of equipment.
Interior Mechanical Closet
$3.80/s.f. closet walls
Online Retailer Attic consists of 4 newly constructed walls; garage consists of 2 newly constructed walls adjacent to conditioned space.
Includes insulation and labor
Per unit Incremental Construction Cost Range – DCS: Open Web Floor Truss
Parameter Assumption Source Notes
Open web floor trusses
$0 - $2.26/s.f. floor trusses RS Means Includes material and labor
Sealed furnace $110 - $400 Online Retailer Incremental cost depends on condensing capabilities and capacity of equipment.
Interior Mechanical Closet
$3.80/s.f. closet walls
Online Retailer Attic consists of 4 newly constructed walls; garage consists of 2 newly constructed walls adjacent to conditioned space.
Includes insulation and labor

2016 CASE Report – 2016-RES-ENV1-D Page 132
Per unit Incremental Construction Cost Range – DCS: Unvented Attic
Parameter Assumption Source Notes
Insulation + labor
$1.76/s.f. area of ceiling + $3.49 additional roof area
First cost is incremental to what would have gone on ceiling area, second cost is for additional area resulting from placing insulation at roof.
Sealed furnace $110 - $400 Online Retailer Incremental cost depends on condensing capabilities and capacity of equipment.
Ignition barrier with SPF
$0.10 - $0.25/s.f. roof area
Manufacturer Quote
Eliminate Attic Venting
$3.14/linear ft soffit vent, $10/linear ft ridge vent OR $50/vent
$50/vent was provided as estimate in multiple discussions with industry experts.
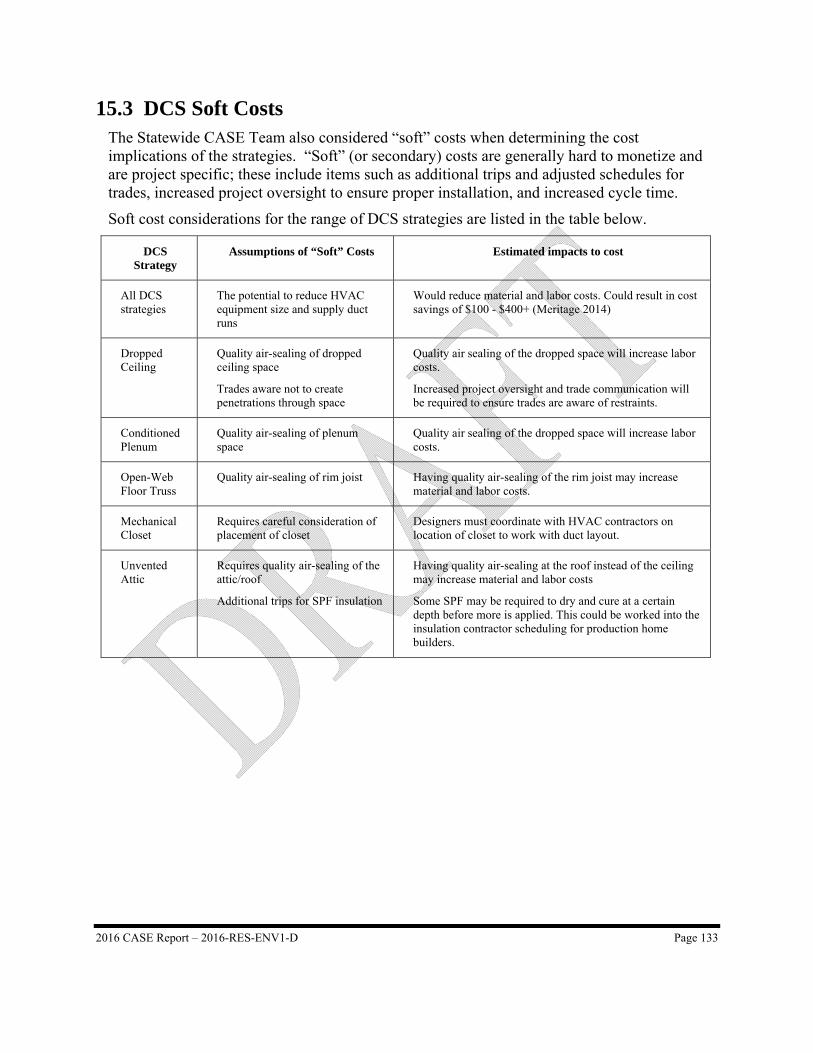
2016 CASE Report – 2016-RES-ENV1-D Page 133
15.3 DCS Soft Costs The Statewide CASE Team also considered “soft” costs when determining the cost implications of the strategies. “Soft” (or secondary) costs are generally hard to monetize and are project specific; these include items such as additional trips and adjusted schedules for trades, increased project oversight to ensure proper installation, and increased cycle time.
Soft cost considerations for the range of DCS strategies are listed in the table below.
DCS Strategy
Assumptions of “Soft” Costs Estimated impacts to cost
All DCS strategies
The potential to reduce HVAC equipment size and supply duct runs
Would reduce material and labor costs. Could result in cost savings of $100 - $400+ (Meritage 2014)
Dropped Ceiling
Quality air-sealing of dropped ceiling space
Trades aware not to create penetrations through space
Quality air sealing of the dropped space will increase labor costs.
Increased project oversight and trade communication will be required to ensure trades are aware of restraints.
Conditioned Plenum
Quality air-sealing of plenum space
Quality air sealing of the dropped space will increase labor costs.
Open-Web Floor Truss
Quality air-sealing of rim joist Having quality air-sealing of the rim joist may increase material and labor costs.
Mechanical Closet
Requires careful consideration of placement of closet
Designers must coordinate with HVAC contractors on location of closet to work with duct layout.
Unvented Attic
Requires quality air-sealing of the attic/roof
Additional trips for SPF insulation
Having quality air-sealing at the roof instead of the ceiling may increase material and labor costs
Some SPF may be required to dry and cure at a certain depth before more is applied. This could be worked into the insulation contractor scheduling for production home builders.