code blue - nypirg.org · code blue. acknowledgements. table of contents hospital compare....
TRANSCRIPT

NEW YORK HOSPITALS' POORQUALITY PERFORMANCE
CODE BLUE

Acknowledgements
Table ofContents
Hospital Compare

ExecutiveSummary
&
Summary ofFindings andConclusions

EXECUTIVE SUMMARY
In November 1999 the Institute of Medicine report, To Err is Human: Building a Safer Health System, was released. It documented a veritable epidemic of preventable deaths in United States hospitals. In September 2009, the director of the US Agency for Healthcare Research and Quality, wrote this about To Err Is Human: “Let me be clear: I am just as frustrated as my colleagues in the public and private sectors with our slow rate of progress in preventing and reducing medical errors.”1 Then in 2013 a widely covered study published in the Journal of Patient Safety reported that nearly 400,000 U.S. hospital patient deaths each year were preventable. The U.S. Department of Health and Human Services publishes an annual Medicare.gov/Hospital Compare, which reports the quality of the nation’s hospitals to the public.2 It gives each hospital one, two, three, four, or five quality stars, with one star-hospitals being the worst and five stars-hospitals the best. In 2019 New York hospitals reported together having only 2.18 quality stars out of the maximum 5.0 quality stars.3 New York overall had lower quality stars than all of the 49 other states.
SUMMARY OF FINDINGS I. New York State ranked poorly when compared to 16 other major urbanized states. In New York, 34 percent of hospitals were a quality one-star this year. In comparison, no hospital in Indiana had a quality one star and only one percent of hospitals in Ohio were in this category. Quality one-star hospitals made up four percent in Arizona, Michigan, Texas, Virginia and Washington State, seven percent in Massachusetts, nine percent in California and Pennsylvania, ten percent in Missouri, twelve percent in New Jersey, thirteen percent in Georgia and Maryland and twenty percent in Florida.4 All of these states had at least six million population and were at least 70 percent urbanized. II. New York hospitals were much more likely to be ranked by Medicare as “Below the national average” of quality measures than hospitals in the rest of the US The Medicare.gov/Hospital Compare National Average Comparison “shows how individual hospitals perform compared to all hospitals across the country for each of the seven groups or categories of quality measures that make up the Hospital Compare overall rating.”5 Each hospital is given a rating of “Same as the national average,” “Above the national average” or “Below the national average.” National Average Comparison is based on seven groups or categories of quality measures that make up the Hospital Compare overall rating. Four of these categories each represent 22 percent of the weight used in the calculations: x Safety of Care. Sixty-nine percent of New York City hospitals, 60 percent of Nassau-Suffolk-
Westchester counties’ hospitals and 41 percent of Upstate hospitals rated “Below the national average.”
x Readmission. Ninety-seven percent of New York City hospitals, 87 percent of Nassau-Suffolk-Westchester counties’ hospitals and 49 percent of Upstate hospitals were rated “Below the national average.”
2
x Patient Experience. Ninety-four percent of New York City hospitals 60 percent of the Nassau-Suffolk and Westchester counties’ hospitals and 60 percent of Upstate hospitals were “Below the national average.”
x Mortality. This is the only category in which New York hospitals ranked as well as other U.S. hospitals.
See Appendix H for the name of each hospital and its number of beds under “Below the national average,” “Same as the national average” or “Above the national average.” In the print version of this report, Appendix H is not included, given the amount of data. It is available on the online version. See Appendix G on Timeliness of Care and Effectiveness of Care. Each of these comprised 4 percent of the weight used in the calculations.6 III. New York City hospitals had a disproportionate number of one-star rankings when compared with other US major cities. When comparing all cities with a population of at least 300,000 in the northeastern and northcentral US: 66 percent of hospitals New York City, 44 percent in Chicago, 33 percent in Detroit, 25 percent in Pittsburgh, 21 percent in Philadelphia, and 8 percent in Baltimore had only one quality star. There were no one-star hospitals in Indianapolis, Boston, Cleveland, Cincinnati, or Columbus. When comparing all cities with a population of at least 750,000: 17 percent of hospitals in Jacksonville, 14 percent in Austin, 11 percent in San Francisco, 9 percent in San Antonia, 7 percent in Los Angeles, and 6 percent in Houston had one quality star. There were no one-star quality hospitals in Charlotte, Dallas, Fort Worth, Phoenix, San Diego, or Seattle.7 IV. New York City, the suburbs (Nassau-Suffolk-Westchester counties) and Upstate all had comparatively high percentages of low-quality hospitals. Seventy-eight percent of hospitals in New York City, 60 percent in the suburbs and 57 percent in Upstate had only one or two quality stars. V. Patients reported that New York hospitals provided worse treatment than hospitals surveyed in other states. Patients gave Medicare.gov/Hospital Care their own rankings of NY hospitals using one, two, three, four or five quality stars. In July 2019 patients gave only 2 percent of US hospitals a one-star compared to 11 percent of New York hospitals and patients gave 16 percent of US hospitals two-stars compared to 41 percent of New York hospitals. VI. The Medicare.gov/Hospital Compare findings are consistent with those of other hospital reviews. In Fall 2019 the nonprofit Leapfrog Hospital Safety Grade reported that only seven percent of New York hospitals received an “A” (out of an A, B, C, D or F) compared to 33 percent of US hospitals, and only four small states scored lower than New York. In 2019 IBM Watson Health “100 top-performing hospitals” did not include a New York hospital. Healthgrades reported in its 2019 “America’s 250 Best Hospitals” that

3
New York had seven of these hospitals, but California had 41 and there were 25 in Ohio, 14 in Virginia, 11 in Illinois, 10 in North Carolina and Florida, nine in Maryland, and eight in Arizona and in Michigan. Why do New York hospitals perform comparatively so much worse? In July 2019 Erica Mobley, director of Leapfrog Group, explained what she knew about New York’s hospital safety:
“The system as a whole didn’t seem to have emphasized safety. We’ve seen other states work together and look at what’s working well at other states and implement it. It just doesn’t seem to be happening in New York. It has to be front of mind every single day in a hospital.”8
SUMMARY OF CONCLUSIONS
This report does not dig deeper into the federal quality ranking system to analyze hospital care in New York, but its findings do raise questions for policymakers who are responsible for protecting hospital patients as well as the public who foots the bill for the additional costs resulting from poor quality care.
x Why did New York State hospitals rank so poorly? x What has the New York Department of Health done to respond to the national rankings that have
consistently found poor quality in state hospitals? x Should New York annually compile patient outcome data and ensure that all patients have access
to it? x What progress has New York State made in meeting its goal to reduce by half New York’s hospital
patients’ injuries and deaths, a promise made nearly 20 years ago? x Will state lawmakers – who have the oversight responsibility of the health care system – convene
public hearings to explore New York’s stunningly poor performance in the national quality of care rankings?
x Twenty-five years ago, New York established the nation’s most advanced system of examining hospital quality with its Risk-Adjusted Cardiac Bypass Mortality program. Why has so little been done to modernize and expand that approach to other procedures, as well as provide “real time” performance information to patients?
It is surprising given the quality rankings, that in recent years the New York State Department of Health has issued almost no fines against hospitals that caused or were likely to cause patient harm or death. In 2017, New York issued fines to only four hospitals for a total of just $12,000.9 In contrast, in 2017 the California Department of Health issued fines to 53 hospitals and many California hospitals were individually fined $50,000 or more.

DetailedFindings

4
DETAILED FINDINGS I. New York State ranked much worse when compared to 16 other major urbanized states. For New York and the 16 other major urbanized states, Table 1 shows the population, number of hospitals, and percentage of hospitals that received between one (lowest quality) or five (highest quality) stars, as reported by the Hospital Compare in October 2019.10 All these states had a population of at least six million and were at least 70 percent urban. Table 1 shows that New York hospitals were much more likely than hospitals in these 16 other states to receive one quality star and much less likely to receive five quality stars. In New York, 34 percent of the 140 Acute Care Hospitals had only one star.11 In contrast, 11 of the 16 other states had only 10 percent or less one-star hospitals. The most was 20 percent of hospitals in Florida followed by 13 percent of hospitals in Georgia, Illinois, and Maryland.
Table 1. Percentages of Acute Care Hospitals (ACH) in the states with populations of at least six million and at least 70% urbanization.12
Population, million Total number of hospitals 1 star 5 stars New York 19.8 140 34% 1% Arizona 7.2 50 4% 8%
California 39.4 279 9% 7% Florida 21.3 163 20% 5% Georgia 10.5 93 13% 4% Illinois 12.8 123 13% 8% Indiana 6.7 80 0% 15%
Maryland 6.0 45 13% 11% Massachusetts 6.0 53 7% 11%
Michigan 10.0 87 4% 10% Missouri 6.1 70 10% 8%
New Jersey 9.0 64 12% 9% Ohio 11.7 117 1% 15%
Pennsylvania 12.8 134 9% 8% Texas 28.7 244 4% 9%
Virginia 8.6 72 4% 12% Washington 7.5 46 4% 11%
For Acute Care Hospitals, Appendix B reports that at the one-star and two-star hospitals combined account for 65 percent of the New York hospitals compared to 9 percent of these hospitals in Indiana, 18 percent in Ohio, 19 percent in Michigan, 25 percent in Texas, 26 percent in Maryland and Virginia, 31 percent in Missouri, 34 percent in Arizona and Washington State, 35 percent in Massachusetts, Illinois and Pennsylvania, 37 percent in Georgia, 41 percent in California, 53 percent in New Jersey, and 56 percent in Florida.
Medicare.gov/Hospital Compare Hospital Compare is part of the Centers for Medicare & Medicaid Services (CMS). It reports on whether a hospital has a one, two, three, four, or five quality star rating. The number of stars is based on “overall hospital rating summaries” of between nine and 60 measures, with an average of 39 measures. These measures are in categories “across 7 areas of quality into a single star rating for each hospital” and, “The more stars, the better a hospital performed on the available quality measures. The most common overall hospital rating is 3 stars.” More detail on how starring works is contained in Appendix F.

5
In New York, only 9 percent of the hospitals had five or four stars compared to 56 percent of hospitals in Indiana, 50 percent in Ohio, 44 percent in Washington State and Michigan, 40 percent in Virginia, 39 percent in Texas, 32 percent in Massachusetts and Arizona, 31 percent Illinois and Maryland, 30 percent in Pennsylvania, 29 percent in Missouri, 28 percent in California, 27 percent of Georgia, 26 percent in New Jersey, and 22 percent of the hospitals in Florida. It should be noted that seven of the 15 four-star hospitals in New York were small, with fewer than 75 patients, and located Upstate. Appendix B shows the numbers of one, two, three, four, or five-star hospitals in 17 major states including New York. In each state, the “a” line reports the number of Acute Care Hospitals (ACH) and Critical Access Hospitals (CAH). Line “b” reports only the ACH numbers. CAH’s are not included because they are small, in rural areas, provide inpatient services on a limited basis, and are more likely to include only inpatient and no outpatient reports. Thus, Appendix B reported there were 149 New York quality star hospitals but only 140 hospitals when only Acute Care Hospitals were counted. All Critical Access Hospitals in New York are located Upstate. Hospital Compare also reported on all of the “Not Available (N/A)” hospitals but did not include them in a 1, 2, 3, 4, or 5 star rating system. For N/A hospitals, Appendix B line “c” reports the number of Acute Care Hospitals and Critical Access Hospitals and line “d” reports only the numbers of Acute Care Hospitals. Appendix A does not report the “Acute Care – Veterans Administration” hospitals, “Childrens (sic)” hospitals, “Psychiatrists,” and hospitals for which there are “too few measures or measure groups reported to calculate a star rating or measure group score.”13 Appendix C reports the number of beds at each of the 149 New York hospitals, the number of quality stars, and names the hospitals by one, two, three, four, or five stars.14

6
II. New York hospitals were much more likely to have Medicare.gov/Hospital Compare “Below the national average” of quality measures than hospitals in the rest of the US.
Hospital Compare reports that its National Average Comparison shows “how individual hospitals perform compared to all hospitals across the country for each of the seven groups or categories of quality measures that makes up the Hospital Compare overall rating.”15
A. New York hospitals overall have had comparatively low quality ratings on Patient Experience, Safety of Care, Readmission, and Timelessness of Care.
In Appendix H, the percentages in the four major categories for the 141 New York Acute Care hospitals that were reported in 2019 are also presented below. Hospital Compare reported them as “Below the national average,” “Same as the national average,” or “Above the national average” and Appendix H reports the names of each of the hospitals and its numbers of beds. In the print version of this report, Appendix H is not included, given the amount of data. It is available on the online version. Safety of Care Sixty-nine percent of New York City hospitals, 60 percent of Nassau-Suffolk-Westchester hospitals, and 41 percent of Upstate hospitals are rated “Below the national average.” Fourteen percent of New York City hospitals, 17 percent of Nassau-Suffolk-Westchester hospitals, and 28 percent of Upstate hospitals are rated “Same as national average.” Seventeen percent of New York City hospitals, 17 percent of Nassau-Suffolk-Westchester hospitals, and 28 percent of Upstate hospitals have an “Above the national average” rating. Readmission Ninety-seven percentage of New York City hospitals, 87 percent of Nassau-Suffolk-Westchester hospitals, and 49 percent of Upstate hospitals were “Below the national average.” No New York City hospitals, seven percent of Nassau-Suffolk-Westchester hospitals and 21 percent of Upstate hospitals were “Same as the national average.” Three percent of New York City hospitals,16 seven percent of Nassau-Suffolk-Westchester hospitals, and 29 percent of Upstate hospitals were “Above the national average.” Patient Experience Ninety-four percentage of New York City hospitals, 60 percent of Nassau-Suffolk-Westchester hospitals and 60 percent of Upstate hospitals were “Below the national average.” 17 Three percentage of New York City hospitals, 20 percent of Nassau-Suffolk-Westchester hospitals, and 30 percent of Upstate hospitals were “Same of the national average.” Three percentage of New York City hospitals, 20 percent of Nassau-Suffolk-Westchester hospitals, and 10 percent of Upstate hospitals were “Above the national average.” Mortality This is the only major category in which New York hospitals ranked comparatively well against hospitals elsewhere in the U.S. Six percentage of New York City hospitals, 3 percent of Nassau-Suffolk-Westchester hospitals, and 15 percent of Upstate hospitals were “Below the national average.” Fifty-nine percent of New York City, 60 percent of Nassau-Suffolk-Westchester hospitals, and 74 percent of Upstate hospitals were “Same as national average.” Thirty-five percentage of New York City hospitals, 37 percent of Nassau-Suffolk-Westchester hospitals, and 11 percent of Upstate hospitals were “Above the national average.”

7
For Timeliness of Care, 100 percent of the New York City hospitals, 90 percent of the Nassau-Suffolk-Westchester county hospitals, and 53 percent of Upstate hospitals were “Below the national average.” For Effectiveness of Care, 30 percent of New York City hospitals, three percent of the Nassau-Suffolk-Westchester county hospitals, and nine percent of Upstate hospitals were “Below the national average”. (For Effectiveness of Care, no hospitals in New York City or the Nassau-Suffolk-Westchester county hospitals and only two Upstate hospitals were “Above the national average.”) See Appendix D for numbers of beds and their total percentages. Because Efficient Use of Medical Imaging did not include 41 of the New York hospitals, too few hospitals were disclosed to report it on Appendix D.18 Appendix E reports the percentages of hospital beds and the names of each hospital that were “Below the national average,” “Same as national average”, or “Above the national average.”
B. Thirty-seven New York hospitals each had a “Below the national average” ranking in at least three of the four major categories.
New York City Eighteen of the 36 New York City hospitals had at least three “Below the national average” rankings in four major categories. These were: x Bellevue Hospital Center, Brookdale Hospital Medical Center, Brooklyn Hospital Center at Downtown
Campus, Coney Island Hospital, Elmhurst Hospital Center, Flushing Hospital Medical Center, Interfaith Medical Center, Jacobi Medical Center, Jamaica Hospital Medical Center, Kings County Medical Center, Lincoln Medical & Mental Health Center, Metropolitan Hospital Center, Richmond University Medical Center, St. Barnabas Hospital, Staten Island University Hospital, University Hospital of Brooklyn (Downstate), and Wyckoff Heights Medical Center.
x St. John’s Episcopal at South Shore had all the four major stars. Suburbs (Nassau, Suffolk and Westchester counties) Eight of the 30 hospitals had at least three “Below the national average” rankings in the four major measures. x Good Samaritan Hospital Medical Center, Mercy Medical Center, New York-Presbyterian Hospital
(Bronxville), St. Catherine of Siena Hospital, St. Joseph Hospital (Bethpage), St. Joseph’s Medical Center (Yonkers), and Westchester Medical Center.
x Nassau University Medical Center received “Below the national average” for all four of the major categories.
Upstate Eleven of 74 (ACH) hospitals had at least three “Below the national average” rankings in the four major categories. x Arnot Ogden Medical Center, Catskill Regional Medical Center, Columbia Memorial Hospital, Cortland
Regional Medical Center, Eastern Niagara Hospital, Geneva General Hospital, Good Samaritan Hospital of Suffern, Healthalliance Hospital Broadway Campus, Mary Imogene Basset Hospital, and Vassar Brothers Medical Center.
x Kaleida Health received “Below the national average” rankings in all four of the major categories.

8
III. New York City hospitals had a disproportionately high number of one-star ranking when compared with other US major cities. The number of hospital quality stars in the 17 states are shown in Table 1. The number of ACH hospitals in the major cities in these states are shown in Tables 2A and 2B. Table 2A reports on the eight major northern and eastern states’ cities of at least 300,000 in population. Table 2B reports on the cities in six states that have city populations of at least 750,000. Table 2A reports that New York City had 24 one-star hospitals and only one five-star hospital. In contrast, Boston, Cleveland, Columbus, Cincinnati, and Indianapolis had no one-star quality hospitals. Boston had three five-star hospitals and Cincinnati had two five-star hospitals while New York had only one five-star (the Hospital for Special Surgery). Although Chicago had 11 one-star hospitals, it also had one five, two four, and six three-star hospitals. Philadelphia had three one-star hospitals but also had one five-star, two four-star and three three-star hospitals.
Table 2A. Number of hospital stars at hospitals in New York and nine other large states in the northeastern and central US City population of at least
300,000 (2019) 19
# of 5-star
hospitals
# of 4-star
hospitals
# of 3-star
hospitals
# of 2- star
hospitals
# of 1- star
hospitals
1-stars/ % of all hospitals
5-stars/ % of all
hospitals New York New York City 8,601,186 1 1 5 5 24 24/66% 1/3%
Illinois Chicago* 2,679,044 1 2 6 5 11 11/44% 1/4% Indiana Indianapolis 863,771 1 3 2 1 0 0/0% 1/14%
Maryland Baltimore 594,450 2 1 6 2 1 1/8% 2/17% Michigan Detroit 662,172 0 0 0 4 2 2/33% 0/0%
Massachusetts Boston 694,781 3 1 1 3 0 0/0% 3/37% Ohio Cleveland
Cincinnati Columbus
379,800 301,301 890,228
1 2 0
2 4 2
1 1 1
1 1 2
0 0 0
0/0% 0/0% 0/0%
1/20% 2/25% 0/0%
Pennsylvania Philadelphia Pittsburgh
1,576,596302,908
1 1
2 1
3 3
5 1
3 2
3/21% 2/25%
3/21% 2/25%
*Provident Hospital of Chicago is not reported.
Table 2B reports that Phoenix, Charlotte, Dallas, Fort Worth, San Diego, and Seattle had no one-star hospitals and at least one five-star hospital each.
Table 2B. Number of hospital stars in cities with at least 750,000 population. City population of at least
750,000 (2019) 20 # of
5-star hospitals
# of 4-star
hospitals
# of 3-star
hospitals
# of 2- star
hospitals
# of 1- star
hospital
1 -star/ % of all
hospitals
5-stars/ % of all
hospitals California Los Angeles*
San Diego San Jose
San Francisco
4,057,841 1,453, 755 1,033, 519
897,536
1 1 0 1
4 3 0 2
4 0 1 3
5 1 1 2
1 0 3 1
1/7% 0/0%
3/60% 1/11%
1/7% 1/20% 0/0%
1/11% Arizona Phoenix 1,711,356 1 1 4 4 0 0/0% 1/10% Florida Jacksonville 920,984 0 2 1 2 1 1/17% 0/0%
North Carolina Charlotte 889,019 0 0 4 0 0 0/0% 0/0% Texas** Houston
San Antonio Dallas Austin
Fort Worth
2,359, 480 1,565, 929 1,379,735 1,001,104 913,939
2 2 1 2 1
4 4 4 4 2
3 3 4 0 1
6 1 2 0 3
1 1 0 1 0
1/6% 1/9% 0/0%
1/14% 0/0%
2/12% 2/18% 1/9%
2/28% 1/14%
Washington Seattle 766,893 1 4 1 0 0 0/0% 1/17% *Laguna Honda Hospital and Rehabilitation is N/A because it had too few measures or measure group. **These Texas hospitals are N/A because they have too few measures or measure groups. Houston: First Texas Hospital and Providence Hospital of North Houston LLC. San Antonio: Cumberland of Surgical Hospital (CUF), Foundation Surgical Hospital of San Antonio, Methodist Ambulatory Surgery Hospital NW, South Texas Surgical Hospital NW, South Texas Spine and Surgical Hospital. Dallas: Baylor Medical Uptown, Pine Creek Medical Center LLP, Texas Institute for Surgery at Presbyterian Hospital. Austin: Arise Austin Medical Center, Northwest Hills Surgical Hospital, Seton Southwest Hospital. Fort Worth: Baylor Surgical Hospital, USMD Hospital at Fort Worth LLP, Wise Health System.

9
IV. New York City, the suburbs (Nassau-Suffolk-Westchester counties) and Upstate all had comparatively high percentages of low ranked hospitals.
Appendix B reports that New York had 149 hospitals, with 48 hospitals with one star, 45 with two stars, 40 with three stars, 15 with four stars, and one hospital with five stars. Table 3 shows numbers and percentages of the 149 New York State hospitals broken into three regions: New York City, the three suburbs (Westchester, Nassau, Suffolk counties), and Upstate. Table 3 shows that 67 percent of New York City hospitals, 30 percent of the three suburban area hospitals, and 18 percent of Upstate hospitals had only one star. One-star and two-stars together totaled 78 percent of hospitals in New York City, 60 percent of hospitals in the three suburban areas, and 57 percent of Upstate hospitals. Looking at their hospital beds, 66 percent were in New York City, 65 percent were in the three suburban areas and 73 percent were Upstate. Virtually two-thirds of New York’s hospitals had merely one or two stars.
Table 3. Number of hospitals and percentages, number of hospital beds and percentage New York City, 36 hospitals Suburbs, 30 hospitals Upstate, 83 hospitals
Number and % of hospitals
Number and % of hospital
beds
Number and % of 30 hospitals
Number and % of hospital
beds
Number and % of hospitals
Number and % of hospital
beds One-star 24/67% 11,433/56% 9/30% 2,958/28% 15/18% 4,339/26% Two stars 4/11% 1,989/10% 9/30% 3,948/37% 32/39% 7,894/47%
Three stars 6/17% 5,326/27% 10/33% 3,056/29% 24/29% 3,530/21% Four stars 1/3% 1,294/6% 2/7% 602/6% 12/14% 985/6% Five stars 1/0% 215/1% 0/0% 0/0% 0/0% 0%
Appendix C provides the names of each hospital and their numbers of beds listed by its number of
stars.
New York City: Most hospitals and their beds received only one star. (36 hospitals with 20,256 beds in total)
In New York City, 24 of the 36 hospitals had only one star. These account for 56 percent of the City’s hospital beds. Four hospitals had two stars. These accounted for 10 percent of the City’s hospital beds. There were six hospitals, with three stars that accounted for 27 percent of New York City hospital beds. Only one New York City hospital, NYU Hospitals Center, had four stars, and it accounted for 6 percent of the City’s beds. New York’s only five-star hospital was the Hospital for Special Surgery, a specialized hospital that accounted for less than 1 percent of the City’s hospital beds.
By county: o Five of the six Queens hospitals had one star and one of the Queens hospitals had two stars; o Five of the six Bronx hospitals had only one star and the sixth hospital had two stars; o In Brooklyn, ten out of 12 hospitals had only one star and the other two hospitals each had three
stars21; o Both Staten Island hospitals had only one star; o Of ten hospitals in Manhattan, two hospitals had one star, two hospitals had two stars, four
hospitals had three stars, one hospital had four stars, and one hospital had five stars.

10
Ten of the 11 hospitals from New York City Health + Hospitals had only one star. These all are safety net hospitals that traditionally serve the underserved.
Suburban hospitals: Westchester, Nassau and Suffolk counties. More than one quarter of the hospital beds are in one-star hospitals.
(30 hospitals with 10,564 beds in total) Nine of the 30 suburban hospitals had only one quality star. Their 2,958 beds accounted for 28 percent of the combined Westchester, Nassau, and Suffolk hospital beds. Among these were two especially large hospitals: Westchester Medical Center (652 beds) and Nassau University Medical Center (530 beds). Another nine hospitals had two quality stars. Their total 3,948 beds accounted for 37 percent of suburban hospital beds, including Long Island Jewish Medical Center, which had 1,025 beds. There were ten hospitals with three quality stars. Their 3,056 beds accounted for 29 percent of the suburban beds. Their two largest hospitals were University Hospital-Stony Brook (603 beds) and Winthrop-University Medical Center (591 beds). Only two hospitals had four quality stars: Phelps Memorial Hospital (238 beds) and St. Francis Hospital (364 beds). These two hospitals accounted for 6 percent of suburban hospital beds. There were no five-star quality hospitals in any of these counties.
Upstate: One-star hospitals were located as far west as Jamestown and as far south as Suffern. (75 Acute Care Hospitals, nine Critical Access Hospitals, with 16,661 ACH and
218 CAH hospital beds in total.) Fifteen Upstate hospitals had one quality star each. Their 4,399 beds accounted 26 percent of all upstate hospital beds. Two of their hospitals were among the largest in Upstate: Kaleida Health (788 beds22) and Albany Medical Center Hospital (734 hospitals). Thirty-two Upstate hospitals had two quality stars. Their 7,894 beds accounted for 47 percent of all upstate beds. Their two largest hospitals were Strong Memorial Hospital (838 beds) and Erie County Medical Center (583 beds). Twenty-four hospitals had three quality stars, including Glens Falls Hospital, which had 410 beds, the most of any among these. Their 3,530 beds accounted for 21 percent of all upstate beds. Thirteen hospitals had four quality stars. Their 985 beds accounted for 6 percent of all Upstate beds. Upstate had no five-star quality hospitals. Seven (47 percent) of the 15 four-star hospitals in New York State were small, each with fewer than 75 beds. These hospitals had a total of 1,021 beds, which were 2 percent of all hospital beds in the state. Table 4A shows the number of hospitals in the nine most populated New York State cities north of Westchester County. As this table shows, these cities had no five-star hospitals and only one four-star hospital. In contrast, these cities had 11 two-star hospitals and seven one-star hospitals.

11
Table 4B shows the number of beds at 22 upstate city hospitals. Hospitals with one or two stars have a total of 8,033 beds, which are 90% of the beds in these nine cities.
Table 4A. Numbers of stars in the nine largest Upstate cities.23 Popula-
tion # of
5-star hospitals
# of 4-star hospitals
# of 3-star
hospitals
# of 2- star
hospitals
# of 1- star
hospitals
1 and 2-stars/ % of all city’s
hospitals
4 and 5-stars/% of all
hospitals Buffalo 252,555 0 0 0 2 2 4/100% 0/0%
Rochester 206,318 0 0 1 3 0 4/75% 0/0% Syracuse 141,353 0 0 0 3 0 3/100% 0/0% Albany 97,640 0 1 0 1 1 2/66% 1/33%
Schenectady 63,536 0 0 0 1 0 1/100% 0/0% Utica 59,608 0 0 0 1 1 2/100% 0/0% Troy 49,189 0 0 1 0 1 1/50% 0/0%
Niagara Falls 47,864 0 0 0 0 1 1/100% 0/0% Binghamton 45,179 0 0 1 0 1 1/50% 0/0%
TOTAL 963,242 0 1 3 11 7 19/86% 1/5%
Table 4B. Upstate cities by numbers of hospital beds in each star. Popula-
tion # of
5-star hospital
beds
# of 4-star hospital
beds
# of 3-star
hospital beds
# of 2- star
hospital beds
# of 1- star
hospital beds
# of 1 and 2-stars/
% of all city’s hospitals
# of 4 and 5-stars/% of all upstate city
hospitals Buffalo 252,555 0 0 0 873 1,175 2,050/100% 0/0%
Rochester 206,318 0 0 261 1,677 0 1,677/100% 0/0% Syracuse 141,353 0 0 0 1,328 0 1,328/100% 0/0% Albany 97,640 0 165 0 442 716 1,158/88% 165/12%
Schenectady 63,536 0 0 0 368 0 368/100% 0/0% Utica 59,608 0 0 0 370 201 571/100% 0/0% Troy 49,189 0 0 186 0 212 212/100% 0/0%
Niagara Falls 47,864 0 0 0 0 171 171/100% 0/% Binghamton 45,179 0 0 242 0 500 500/100% 0/0%
TOTAL 963,242 0 165 689 5,058 2,975 8,033/90% 165/2%

12
V. Patients reported that New York hospitals provided worse treatment than hospitals surveyed in other states.
Table 5 shows hospital patient experiences as reported by CMS (Centers for Medicare & Medicaid Services) Hospital Consumer Assessment of Healthcare Providers and Systems (HCAHPS) in April, July and October 2018 and in February and July 2019.24 The CMS ranked the hospitals between one and five stars, with their lowest ranked hospitals having one star and the best quality hospitals having five stars. HCAHPS based the rankings on 27 different patient items.25 CMS surveyed patients by mail or telephone.26 Table 5 shows that in July 2019 only 15% of New York patients gave their hospitals five or four stars. Only one of these hospitals, Hospital for Special Surgery, received five stars. In comparison, 37 percent of all US patients gave their hospitals five or four stars. A total of 52 percent of New York patients gave state hospitals only one or two stars compared to 18 percent of all US patients.
Table 5. Numbers and percentages of hospitals on CMS Hospital Consumer Assessment of Healthcare Providers and Systems (HCAHPS)
1 star 2 stars 3 stars 4 stars 5 stars # of hospitals* US April 2018 59/2% 495/14% 1,522/44% 1,177/34% 213/6% 3,466
July 2018 69/2% 508/15% 1,556/45% 1,114/32% 212/6% 3,459 October 2018 82/2% 498/14% 1,738/49% 1,026/29% 224/6% 3,568 February 2019 66/2% 545/15% 1,601/45% 1,117/31% 230/6% 3,559
July 2019 77/2% 577/16% 1,556/44% 1,102/31% 205/6% 3,517 New York
April 2018 15/10% 54/37% 58/39% 20/14% 0/0% 147 July 2018 15/10% 55/38% 57/39% 18/12% 1/1% 146
October 2018 18/12% 55/37% 59/39% 17/11 1/1% 150 February 2019 16/11% 55/36% 62/41% 11/11% 1/1% 151
July 2019 17/11% 60/41% 50/34% 20/14% 1/1% 148 *Not including N/A hospitals
Table 6 compares hospitals with one star and five-star HCAHPS ratings by consumers in New York with 49 other states in July 2019: x In the US overall, 2 percent of the hospitals had only one star. In New York and Nevada 11 percent of
hospitals had one star followed by 8 percent of hospitals in California, 6 percent in Florida, 5 percent in Illinois and New Jersey, 4 percent in Maryland, 2 percent in Georgia and Oklahoma and 1 percent in Michigan, Missouri, New Mexico, Pennsylvania and Tennessee. There were no one star hospitals in the 37 other states.27
x New York had 17 of the nation’s 77 one-star hospitals. Nevada had three of the US total. New York had 60 of the US total of 577 two-star hospitals. Nevada had 11.
x One and two star rating combined accounted for 18 percent of US hospitals compared to 52 percent of hospitals in New York.
x In the US overall, 6 percent of 3,517 hospitals had five stars. Of 148 New York hospitals, only one had five-stars. Looking at all other states, the five-star hospitals were 32 percent of hospitals in South Dakota, 24 percent in Louisiana, 21 percent in Wisconsin, 16 percent in Minnesota, 13 percent in Maine, 11 percent in Idaho, Iowa, and Oklahoma, 10 percent in Kansas, 9 percent in North Dakota, 8 percent in Illinois and Texas, 7 percent in Indiana, North Carolina, and Ohio, 6 percent in Alabama, Arkansas, Arizona, and Pennsylvania, 5 percent in Michigan and Washington State, 4 percent in Colorado, 3 percent in Kentucky and Utah, 2 percent in California, Florida, Mississippi, and Tennessee, and 1 percent in Missouri as well as New York. There were no five star hospitals in 19 other states.28
x Combined, four and five stars were 37 percent of US hospitals compared to 12 percent of New York’s.

13
Table 6. Numbers and percentages of HCAHPS stars in all states, July 2019* 1 star 2 stars 3 stars 4 stars 5 stars Number of all
hospitals* Population,
$ million New York 17/11% 60/41% 50/34% 20/14% 1/1% 148 19.5
United States 77/2% 577/16% 1,556/44% 1,102/31% 205/6% 3,517 328.6 Alabama 0/0% 8/11% 36/51% 22/31% 4/6% 70 4.9
Alaska 0/0% 1/10% 6/60% 3/30% 0/0% 10 0.7 Arizona 0/0% 19/30% 32/50% 9/14% 4/6% 64 7.2
Arkansas 0/0% 5/10% 27/53% 16/31% 3/6% 51 3.0 California 23/8% 102/34% 137/46% 34/11% 5/2% 301 39.6 Colorado 0/0% 0/0% 23/43% 29/54% 2/4% 54 5.7
Connecticut 0/0% 4/14% 15/54% 9/32% 0/0% 28 3.6 Delaware 0/0% 0/0% 6/86% 1/14% 0/0% 7 1.0
Florida 10/6% 72/42% 63/37% 22/13% 3/2% 170 21.3 Georgia 2/2% 21/23% 47/51% 23/25% 0/0% 93 10.5 Hawaii 0/0% 2/17% 6/50% 4/33% 0/0% 12 1.4 Idaho 0/0% 0/0% 10/37% 14/52% 3/11% 27 1.7 Illinois 8/5% 17/12% 60/41% 50/34% 12/8% 147 12.7 Indiana 0/0% 7/7% 43/42% 45/44% 7/7% 102 6.7
Iowa 0/0% 3/5% 21/34% 31/50% 7/11% 62 3.2 Kansas 0/0% 2/3% 22/37% 29/49% 6/10% 59 2.9
Kentucky 0/0% 7/10% 40/57% 21/30% 2/3% 70 4.5 Louisiana 0/0% 3/4% 35/44% 23/29% 19/24% 80 4.7
Maine 0/0% 0/0% 8/27% 18/60% 4/13% 30 1.3 Maryland 2/4% 16/36% 25/56% 2/4% 0/0% 45 6.0
Massachusetts 0/0% 5/9% 36/64% 15/27% 0/0% 56 6.9 Michigan 1/1% 16/14% 37/33% 53/47% 6/5% 113 10.0
Minnesota 0/0% 1/1% 21/26% 47/57% 13/16% 82 5.6 Mississippi 0/0% 9/18% 24/49% 15/31% 1/2% 49 3.0
Missouri 1/1% 7/8% 49/57% 28/33% 1/1% 86 6.1 Montana 0/0% 2/8% 8/32% 15/60% 0/0% 25 1.1 Nebraska 0/0% 0/0% 12/28% 17/40% 14/33% 43 1.9 Nevada 3/11% 11/39% 12/43% 2/7% 0/0% 28 3.0
New Hampshire 0/0% 0/0% 9/36% 13/54% 0/0% 24 1.4 New Jersey29 3/5% 26/41% 30/47% 5/8% 0/0% 64 8.9 New Mexico 1/3% 9/30% 15/50% 5/17% 0/0% 30 2.1
North Carolina 0/0% 9/10% 55/59% 23/24% 7/7% 94 10.3 North Dakota 0/0% 2/18% 5/45% 3/27% 1/9% 11 0.8
Ohio 0/0% 14/10% 66/46% 54/38% 10/7% 144 11.7 Oklahoma 1/2% 9/14% 18/28% 29/45% 7/11% 64 3.9
Oregon 0/0% 2/4% 12/24% 36/72% 0/0% 50 4.2 Pennsylvania 1/1% 22/14% 77/50% 44/29% 9/6% 153 12.8 Rhode Island 0/0% 1/9% 6/55% 4/36% 0/0% 11 1.1
South Carolina 0/0% 6/11% 24/44% 24/44% 0/0% 54 5.1 South Dakota 0/0% 0/0% 5/26% 8/42% 6/32% 19 0.9
Tennessee 1/1% 6/7% 48/59% 24/30% 2/2% 81 6.8 Texas 1/0% 35/14% 130/50% 71/28% 21/8% 258 28.7 Utah 0/0% 2/6% 14/40% 18/51% 1/3% 35 3.2
Vermont 0/0% 0/0% 3/21% 11/79% 0/0% 14 0.6 Virginia 0/0% 10/13% 46/59% 22/28% 0/0% 78 8.5
Washington 0/0% 13/20% 33/52% 15/23% 3/5% 64 7.5 West Virginia 0/0% 7/19% 16/44% 13/36% 0/0% 36 1.8
Wisconsin 0/0% 0/0% 24/24% 54/55% 21/21% 99 5.8 Wyoming 0/0% 0/0% 4/31% 9/69% 0/0% 13 0.6
*Not included N/A hospitals

14
According to Definitive Healthcare in May 2019, “25 hospitals with the worst HCAHPS scores (1 star)” included five hospitals in New York: NYC Heath & Hospitals – Lincoln, Flushing Hospital Medical Center, St. John’s Episcopal Hospital at South Shore, Wyckoff Heights Medical Center, and Maimonides Medical Center. These five hospitals accounted for 36 percent of the 25 worst US HCAHPS scores. California had eight hospitals among those with the worst HCAHPS but they accounted for only 22 percent of the worst hospital discharges. New York hospitals were not listed among the “25 with the best HCACPS scores (5 stars).”30 VI. The Medicare.gov/Hospital Compare findings are consistent with those of other hospital reviews
Hospital Compare, Leapfrog Hospital Safety Grade, Healthgrades and IBM Watson Health found that hospitals in New York were substantially worse in quality and performance than in the U.S. overall.
Leapfrog Hospital Safety Grade
The Leapfrog Hospital Safety Grade produced for U.S. hospitals for Spring 201931“a single, consumer-friendly composite score that is published as an A, B, C, D, or F letter grade.” The Leapfrog grade was based on “Error, Injuries, Accidents, Inflections,” for general acute care hospitals,” and more specifically on 28 measures of patient safety.32 Leapfrog’s website explained that it is “an independent, national not-for-profit organization founded more than a decade ago by the nation’s leading employers and private health care experts.”33
In Fall 2019, Leapfrog Hospital Safety Grade reported that New York was only the 47th best among the US states and District of Columbia for percent of hospitals with an “A” grade. Only North Dakota, Alaska, Wyoming, and West Virginia hospitals had lower shares of “A” grades. In New York, only 7% of hospitals received an “A” compared to 33% of hospitals in the nation. In contrast, 20% of New York hospitals had a “D” grade compared to 8% in the nation and 60% of New York hospitals received a “C” compared to 34% in the nation.34 Based on their percentages of “A” hospitals, the 17 largest urbanized states were, from their highest to lowest percentages: Virginia (56%), Pennsylvania (55%), New Jersey (45%), Illinois (43%), Massachusetts (42%), Michigan (41%), Ohio (39%), Texas (38%), Florida (37%), California (35%), Washington (33%), Missouri (28%), Georgia (26%), Arizona (26%), Maryland (23%), Indiana (17%), and in New York a mere 7%. Based on their percentages of “D” hospitals, the 17 largest urbanized states were, from their lowest to highest percentages: Massachusetts (0%), Arizona and Indiana (2%), Virginia, New Jersey and Texas (3%), Illinois, Ohio and Washington State (4%), Georgia (5%), Pennsylvania (6%); California (8%), Florida, Maryland and Michigan (9%), Missouri (12%). and in New York a very substantially large 20% of its hospitals. Among these 17 states were two “F” hospitals in California and three “F” hospitals in Texas.

15
Healthgrades In 2019 only seven of the “America’s 250 Best Hospitals” were in New York. In contrast, California had 41 “Best Hospitals” and there were 24 in Ohio, 15 in Pennsylvania, 14 in Virginia, 11 in Illinois, 10 in North Carolina and Florida, nine in Maryland, and eight in Arizona and Michigan.35
IBM Watson Health36
In March 2019 IBM Watson Health issued its “100 top-performing hospitals." None of these hospitals were in New York. These hospitals had "achieved better risk-adjusted outcomes" but these hospitals also were "both a lower cost per patient and higher margin than peer group hospitals..."37 IBM Watson Health explained that the results were based on these categories and category weights: inpatient/clinical outcomes (30 percent), extended outcomes (20 percent), operational efficiency (30 percent), financial health (10 percent), and patient experience (10 percent).38
U.S. News & World Report Best Hospitals
Advisory Board explained that the Best Hospital Rankings “computes a score in each of 16 specialties” and uses them to “rank hospitals within each of the 16 specialties, and then these rankings are averaged to form an overall hospital ranking. Twelve of the 16 specialty rankings are calculated using quality metrics organized into the categories.”39 x The study found that hospitals are not focused on the quality of care that affects most hospital
patients. According to two experts on hospital quality, U.S. News “places much more weight on hospitals’ performance in specialties or complex medical procedures than on care for chronically ill patients, the population that makes up the bulk of hospitalizations.” And “in fact, of the 448 possible points a hospital can receive for its `Honor Roll’ score, 340 come from specialty scores, which only rank outcomes for `challenging or critical’ procedures. “40 The 2019-20 Best Hospitals listed three New York hospitals among the 20 Best Hospitals in the U.S.: New York-Presbyterian Hospital (#5), NYU Langone (#9) and Mount Sinai Hospital (#14). However, these findings were based largely on areas such as neurology and neurosurgery and not in critical areas such as readmissions and safety of care.
x The specialties U.S. News relied on were based 27.5% on “Expert opinion.” U.S. News explained this as follows, “Surveyed physicians are asked to name up to five hospitals they consider the best for difficult cases in their specialty.” The two experts on hospital quality cited criticize “Expert opinion” because it “turns the ranking into popularity contest.”41 “Patient safety” was counted for only five percent of the specialties.

DetailedConclusions

16
DETAILED CONCLUSIONS
New York Hospitals’ Quality of Care Ranked Much Worse than US Hospitals Overall. They Must Be Improved.
In 2019 Hospital Compare reported that New York had the lowest quality hospitals in the nation. As explained above, Leapfrog Hospital Safety Grades found for Fall 2019 that hospitals performed overall much worse in New York than nationally, this year IBM Watson Health’s “100 top-performing hospitals” did not include a single hospital in New York, and although Healthgrades named seven New York hospitals among their “America’s 250 Best Hospitals,” California accounted for 21 of these hospitals and some of the other major states better than New York included Illinois, Massachusetts, Michigan, Minnesota, Ohio, and Pennsylvania. This report’s Executive Summary asks basic questions about the quality and safety of New York’s hospitals that need to be examined: x Why did New York State hospitals rank so poorly? This report shows that New York has very poor
hospital rankings overall. x What has the New York Department of Health done to respond to the national rankings that have
consistently found poor quality in state hospitals? x Should New York annually compile patient outcome data and ensure that all patients have access
to it? x What progress has New York State made in meeting its goal to reduce by half New York’s hospital
patients’ injuries and deaths, a promise made nearly 20 years ago? x Will state lawmakers – who have the oversight responsibility of the health care system – convene
public hearings to explore New York’s stunningly poor performance in the national quality of care rankings?
x Twenty-five years ago, New York established the nation’s most advanced system of examining hospital quality with its Risk-Adjusted Cardiac Bypass Mortality program. Why has so little been done to modernize and expand that approach to other procedures, as well as provide “real time” performance information to patients?
It is clear that New York hospitals have failed to take enough steps to improve their safety. As Erica Mobley, director of Leapfrog Group operations recently pointed out:
[New York’s] system as a whole didn’t seem to have emphasized safety. We’ve seen other states work together and look at what’s working well at other states and implement it. It just doesn’t seem to be happening in New York. It has to be front of mind every single day in a hospital. We’ve seen hospitals continually get A’s: They are embedding safety in their quality.42
And Bill Hammond, director of health policy at Empire Center for Public Policy, wrote regarding New York that, “Other states have teaching hospitals and low-income neighborhoods. It doesn’t explain how we compare as a state.”43 Another way to improve hospitals would be for the New York State Department of Health to impose substantial penalties on hospitals that caused or were likely to cause patient harm or death. The Department of Health reports that Section 12 of New York’s Public Heath Law “allows the Department of

17
Health to assess fines against hospitals that have been cited for noncompliance with state regulations that resulted in harm to patients, represents substandard quality of care, or placed patients at immediate risk for harm.” However, New York rarely imposes financial penalties on hospitals, despite having the highest percentages of one or two -quality star ratings of all 50 states. Between December 1, 2015 and November 30, 2018, NYSDOH reported only nine Hospital Enforcement Actions with a total of $56,000 penalties in 2016, ten Hospital Enforcement Actions with a total of $48,000 in penalties for 2017 and merely $14,000 in penalties during 2018.44 This lack of action is at odds with the poor performance rankings found in the Hospital Compare program. The state’s lack of penalties is stark when be compared with California. In 2017 the California Department of Public Health issued Hospital Administrative Penalties against 53 hospitals.45 In alphabetic order, the California public website penalties went from $47,025 to the ACMC Anaheim Medical Center to $50,000 to the White Memorial Medical Center. In 2017, New York Hospital Enforcement Penalties listed a total of only $48,000.46 California also issues a Summary Statement of Deficiencies, with full explanations of what went wrong to a hospital’s patients,47 and issues its Provider’s Plan of Correction, which fully explains each of the corrective actions the hospital subsequently took. New York’s public website reports no such information. Yet in New York, 34 percent of hospitals had a one-star quality rating compared to just nine percent of California hospitals. Los Angeles and San Francisco each had only one one-star hospital and San Diego had none compared to 24 one-star hospitals in New York City.

18
ENDNOTES
1 Carolyn Clancy, MD, “Patient Safety: One Decade after To Err Is Human,” Patient Safety & Quality Healthcare, September/October 2009. In addition, in 2010 the New England Journal of Medicine stated that at U.S. hospitals there was “little evidence of widespread improvement.” See: https://www.nejm.org/doi/full/10.1056/NEJMsa1004404 2 According to Data.Medicare.gov, “Hospital Compare data was last updated on October 30, 2019.” See: https://data.medicare.gov/data/hospital-compare 3 Bill Hammond, “NY hospital grades sink lower,” Empire Center, NYTorch, March 1, 2019. District of Columbia ranked 51st. Empire Center previously studied this in November 2017 and at that time reported that the five stars were on averages 2.32 of the 5.0 maximum, higher than the 2.18 in 2019. 4 Op. cit. See: https://data.medicare.gov/data/hospital-compare 5 See: https://www.medicare.gov/hospitalcompare/details.html?msrCd=prnt9grp1&ID=330088 6 Four percent of the weight used in the calculations are also used on Efficient Use of Medical Imaging. However, 41 New York hospitals did not report it. 7 Unlike these cities, 60 percent of San Jose hospitals had one-star. 8 See p 4: https://www.cityandstateny.com/articles/policy/health-care/why-new-york-hospitals-have-terrible-federal-rankings.html 9 2017 fines because in September 2019 New York hospitals were available only to November 30, 2018. 10 See: https://data.medicare.gov/data/hospital-compare. 11 Hospitals are overwhelmingly Acute Care Hospitals (ACH). According to CMS, ACH is “A hospital that provides inpatient medical care and other related services for surgery, acute medical conditions or injuries (usually for a short-term illness or condition).” Critical Access Hospitals (CAH) are, “A small facility that provides outpatient services, as well as inpatient services on a limited basis, to people in rural areas”. See: https://www.medicare.gov/hospitalcompare/Resources/Glossary.html 12 Source of these 2010 urban percentages by state: Wendell Cox, America’s Most Urban States, Newgeography.com, March 8, 2016. Urban populations percentages at the 17 states: Arizona 89.8%, California 95.0%, Florida 91.2%, Georgia 75.1%, Illinois 88.5%, Indiana 72.4%, Maryland 87.2%, Massachusetts 92.0%, Michigan 74.6%, Missouri 70.4%, New Jersey 94.7%, New York 87.9%, Ohio 77.9%, Pennsylvania 76.7%, Texas 84.7%, Virginia 75.5%, Washington 84.9%. 13 Too few measures or groups are reported by the Medicare.gov/Hospital Compare Footnote 16. See: https://www.medicare.gov/hospitalcompare/data/Footnotes.html 14 Hospitals for which more than one of the seven national comparison categories are “Not Available.” See: https://www.advisory.com/research/revenue-cycle-advancement-center/at-the-margins/2018/01/new-cms-overall-star-ratings 15 See: Medicare.com/Hospital Compare, then for each hospital click on “View rating details.” For example, view Albany Medical Center Hospital at https://www.medicare.gov/hospitalcompare/details.html?msrCd=prnt9grp1&ID=330013 16 It totals 35, not 36 hospitals, because Hospital for Special Surgery was N/A on Readmissions. 17 It totals 71, not 75 hospitals, because Cobleskill Regional Hospital, Ira Davenport Memorial Hospital, St. Joseph’s Hospital (Elmira) and St. Mary’s Hospital (Troy) were N/A. 18 Effectiveness Use of Medical Imaging includes: “Outpatient with low-back paid who had an MRI without trying recommended treatments first, such as physical therapy; Outpatient CT scans of the abdomen that were “combination” (double) scans; Outpatient CT scans of the chest that were “combination” low-risk outpatient surgery; Outpatients who got cardiac imaging stress tests before low-risk outpatient surgery; Outpatients with brain CT scans who got a sinus CT scan at the same time.”
19
19 See: http://worldpopulationreview.com/us-cities/ 20 Ibid. 21 NYU Center received a full-asset merger with Lutheran Medical. It is now NYU Langone Hospital-Brooklyn. The CMS Hospital Compare does not report these hospitals separately. See: https://www.crainsnewyork.com/article/20150721/HEALTH_CARE/150729959/nyu-langone-moves-ahead-with-lutheran-medical-center-merger 22 Buffalo General Hospital (457 beds), De Graff Memorial (66 beds) and Millard Fillmore Suburban Hospital (265 beds). 23 See: http://worldpopulationreview.com/states/new-york-population/cities/ 24 Source of HCAHPS ratings for all four of these periods in Tables 6, 7 is www.hcahpsonline.org, Distribution of HCAHPS Summary Star Ratings by State. 25 CMS reported: “The HCAHPS Survey is composed of 27 items: 18 substantive items that encompass critical aspects of the hospital experience (communication with doctors, communication with nurses, responsiveness of hospital staff, cleanliness of the hospital environment, quietness of the hospital environment, pain management, communication about medicines, discharge information, overall rating of hospital, and recommendation of hospital); four items to skip patients to appropriate questions; three items to adjust for the mix of patients across hospitals; and two items to support congressionally-mandated reports. See: https://www.cms.gov/Medicare/Quality-Initiatives-Patient-Assessment-Instruments/HospitalQualityInits/Downloads/HospitalHCAHPSFactSheet201007.pdf 26 See the full explanation of how patients were communicated: https://www.hcahpsonline.org/en/survey-instruments/ 27 The 37 states were: Alaska, Alabama, Arkansas, Arizona, Colorado, Connecticut, Delaware, Hawaii, Iowa, Idaho, Indiana, Kansas, Kentucky, Louisiana, Massachusetts, Maine, Minnesota, Mississippi, Montana, North Carolina, North Dakota, Nebraska, New Hampshire, Ohio, Oregon, Rhode Island, South Carolina, South Dakota, Texas, Utah, Virginia, Vermont, Washington, Wisconsin, West Virginia and Wyoming. 28 Arkansas, Connecticut, Delaware, Georgia, Hawaii, Massachusetts, Maryland, Montana, New Hampshire, New Jersey, New Mexico, Nevada, Oregon, Rhode Island, South Carolina, Virginia, Vermont, West Virginia and Wyoming. 29 Similar to New York, New Jersey had relatively few four or five-star hospitals. New York had proportionately many more one-stars than New Jersey but both states had substantially large numbers of two-star hospitals. It is also notable that the amount paid per capita medical malpractice lawsuit in 2018 were very similar in New York and New Jersey: New York, $31.10 per person, and in New Jersey, $29.20 per person. See: https://www.diederichhealthcare.com/the-standard/2018-medical-malpractice-payout-analysis/ 30 Tory Waldron, “25 Hospitals with the Best and the Worse HCAHPS Scores,” Definitive Healthcare, May 16, 2019. Definitive Healthcare explained that it “provides users with an in-depth look into healthcare organization's HCAHPS scores and how they compare to state and national averages.” See: https://blog.definitivehc.com/hcahps-scores-by-hospital 31 Leapfrog Hospital Safety Grade, Spring 2019 listed by each state and the District of Columbia. 32 More specifically, Leapfrog explained that: “The Safety Grade includes data that patient safety experts use to compare hospitals. Publicly available data from the Centers for Medicare & Medicaid Services (CMS), the Leapfrog Hospital Survey, and secondary data sources such as the American Hospital Association’s Annual Survey and IT Supplement are weighted and then combined to produce a single, consumer-friendly composite score that is published as an A, B, C, D or F letter grade.” Also, “The Leapfrog Hospital Safety Grade methodology has been peer reviewed and published in the Journal of Patient Safety.” 33 See: https://www.hospitalsafetygrade.org/about-us/about-the-leapfrog-group 34 For the Leapfrog Hospital Safety Grade methodology, See: https://www.hospitalsafetygrade.org/media/file/HSG_TownHallCall_09242019.pdf

20
35 See: https://www.healthgrades.com/quality/americas-best-hospitals-for-2019 and https://www.healthgrades.com/quality/2019-methodology-mortality-and-complications-outcomes In New York, only Rochester General Hospital and Vassar Brothers Medical Center received a “Gold,” showing they were in the “America’s 50 Best Hospitals.” 36 Previously known as the Truven Health Top 100 Hospitals. 37 See: https://newsroom.ibm.com/2019-03-04-IBM-Watson-Health-Announces-100-Top-Hospitals 38 See: https://www.advisory.com/-/media/Advisory-com/Research/PEC/Resources/2017/Watson_2018_Final.pdf 39 These were: Cancer; Cardiology & Heart Surgery; Diabetes and Endocrinology; Ear, Nose & Throat; Gastroenterology & Gastrointestinal Surgery; Geriatrics; Gynecology; Nephrology; Neurology & Neurosurgery; Orthopedics; Pulmonology; and Urology. Another four specialty scores and ranks are entirely based on reputation: Ophthalmology, Psychiatry, Rehabilitation, and Rheumatology. See: https://www.advisory.com/daily-briefing/2018/04/12/hospital-rankings Advisory Board writes on its website that, “For more than 35 years, we've helped executives work smarter and faster by providing clarity on health care's most pressing issues—and strategies for addressing them. With a team of 350 health care professionals and a network of 4,400+ member health care organizations, we’re able to harness the industry’s most successful, progressive ideas and share those best practices with you, along with the guidance, tools, and implementation resources you'll need to take action.” 40 As reported in “Just how accurate are the US News 'Best Hospitals' rankings?,” Advisory Board, October 3, 2017. See: https://www.advisory.com/daily-briefing/2017/10/03/best-hospitals-critique 41 Ibid. 42 July 1, 2019, See: https://www.cityandstateny.com/articles/policy/health-care/why-new-york-hospitals-have-terrible-federal-rankings.html 43 Ibid. 44 See: https://profiles.health.ny.gov/hospital/enforcement_search New York’s hospital fines on only a small handful of hospitals by year currently available on NYSDOH’s website were: 2016: Erie County Medical Center ($14,000), Long Island Jewish Medical Center ($4,000), Mount Sinai Hospital ($2,000), Niagara Falls Memorial Hospital ($2,000), Northern Westchester Hospital ($10,000), Plainview Hospital ($4,000), St. Charles Hospital ($6,000), St. Joseph’s Medical Center-Yonkers ($12,000), St. Peter’s Hospital ($2,000). 2017: Erie County Medical Center ($2,000), Good Samaritan Hospital Medical Center-West Islip ($2,000), Jacobi Medical Center ($2,000), Kings County Hospital Center ($2,000), Lenox Hill Hospital ($10,000), Montefiore Medical Center-Jack C Weiler ($2,000), Montefiore Medical Center-Henry & Lucy Moses ($2,000), Montefiore Mount Vernon Hospital ($2,000), New York-Presbyterian-Queens ($2,000), St John’s Episcopal-South Shore ($2,000), University Hospital-Stony Brook ($2,000). 2018: Elmhurst Hospital ($2,000), Massena Memorial Hospital ($300), $10,000 (Strong Memorial Hospital), St. Barnabas Hospital ($2,000). Review of 2002 to 2009 hospitals found that fines were higher than in 2016 to 2018 (except in 2008), although their fines were low compared to California’s hospital penalties. The New York total annual fines and numbers of hospitals were: 2009: $258,000, 8; 2008: $30,000, 5; 2007: $354,000, 19; 2006: $211,000, 16; 2005: $154,000, 14; 2004, $255,000, 16; 2003, $307,000, 20; 2002, $224,000, 14. Source: Hospital profile data available at the DOH website. 45 See: https://www.cdph.ca.gov/Programs/CHCQ/LCP/Pages/Hospital-Administrative-Penalties-by-Year.aspx#2017 46 2017, not 2018 fines, are shown https://www.hospitalsafetygrade.org/your-hospitals-safety-grade/LivesLost because as this report was being written New York State showed the most recent as of November 30, 2018. 47 For example, at one of the penalized hospitals: “Based on interview and record review, the hospital’s professional nursing staff failed to accurately assess Patient 1 for fall risk, implement a plan of care to prevent falls, and advocate for safety of Patient 1 when multiple factors including medications increased the risk for failing in Patient 1. As a result, Patient 1 fell during the night of the night… sustaining fractures of the right leg, the skull and a multiple abrasions/bruising on various parts…”

Appendices

Appendix A Page 1
APPENDIX A The seven major hospital categories
From Hospital Compare, as part of the Centers for Medical & Medicaid Services, each of the first four major quality categories below has 22 percent weight. The three following major quality categories each has four percent weight.1
Safety of Care (8 measures)
x Central-line associated bloodstream Infections (CLABSI)
x Catheter-associated urinary tract infections (CAUTI)
x Surgical site infections from colon surgery
x Surgical site infections from abdominal hysterectomy
x Methicillin-resistant Staphylococcus Aureus (MRSA) Blood Laboratory-identified Events (Bloodstream
infections)
x Clostridium difficile (C. diff) Laboratory-identified Events (Intestinal infections)
x Rate of complications for hip/knee replacement patients
x Serious complications
Readmission (9 measures)
x Hospital return days for heart attack patients
x Rate of unplanned readmission for coronary artery bypass graft (CABG) surgery patients
x Rate of unplanned readmissions for chronic obstructive pulmonary disease (COPD) patients
x Hospital return days for heart failure patients
x Rate of unplanned readmission after hip/knee surgery
x Hospital return days for pneumonia patients
x Rate of unplanned readmission for stroke patients
x Rate of unplanned readmission after discharge from hospital (hospital-wide)
x Rate of unplanned hospital visits after an outpatient colonoscopy
Medicare.gov/Hospital Compare explains how Readmission is very serious to patients:
“Patients who are admitted to the hospital for treatment of medical problems
sometimes get other serious injuries, complications, or conditions, and may
even die. Some patients may experience problems soon after they are
discharged and need to be admitted to the hospital again. These events can
often be prevented if hospitals follow best practices for treating patients.”
Patient Expression (10 measures)
x Patients who reported that their nurses communicated well
x Patients who reported that their doctors communicated well
x Patients who reported that they received help as soon as they wanted
x Patients who reported that staff explained about medicines before giving it to them

Appendix A Page 2
x Patients who reported that their room and bathroom were clean
x Patients who reported that the area around their room was quiet at night
x Patients who reported that they were given information about that to do during their recovery at home
x Patients who understood their care when they left the hospital
x Patients who gave their hospital a rating on a scale from 0 (lowest) to 10 (highest)
x Patients who would recommend the hospital to their friends and family
Mortality (7 measures)
x Death rate for heart attack patients
x Death rate for coronary artery bypass graft (CABG) surgery patients
x Death rate for chronic obstructive pulmonary disease (COPD) patients
x Death rate for heart failure patients
x Death rate for pneumonia patients
x Death rate for stroke patients
x Death among patients with serious treatable complications after surgery
Effectiveness of Care (11 measures)
x Patients assessed and given influence vaccination
x Healthcare workers given influenza vaccination
x Outpatients with chest pain or possible heart attack who received aspirin within 24 hours or arrival or
before transferring from the emergency department
x Percentage of patients who left the emergency department before being seen
x Percentage of patients who came to emergency department with stroke symptoms who received brain
scan results within 45 minutes of arrival
x Percentage of patients receiving appropriate recommendation for follow-up screening colonoscopy
x Percentage of patients with history of polyps receiving follow-up colonoscopy in the appropriate
timeframe
x Percent of mothers whose deliveries were scheduled too early (1-2 weeks early) when a scheduled
delivery was not medically necessary
x Patients who developed a blood clot while in the hospital who did not get treatment that could have
prevented it
x Percentage of patients receiving appropriate radiation therapy for cancer that has spread to the bone
Timeliness of Care (9 measures)
x Average (median) time patients spent in the emergency department, before they were admitted to the
hospital as an inpatient
x Average (median) time patients spent in the emergency department, after the doctor decided to admit
them as an inpatient before leaving the emergency department for their inpatient room
x Average (median) number of minutes before outpatients with chest paid or possible heart attack got
drugs to break up blood clots
x Outpatients with chest pain or possible heart attack who got drugs to break up blood clots within 30
minutes of arrival
x Average (median) number of minutes before outpatients with chest pain or possible heart attack who
needed specialized care were transferred to another hospital

Appendix A Page 3
x Average (median) number of minutes before outpatients with chest pain or possible heart attack got an
ECG
x Average (median) time patients spent in the emergency department before leaving from the visit
x Average (median) time patients spent in the emergency department before they were seen by a
healthcare professional
x Average (median) time patients who came in the emergency department with broken bones had to wait
before getting pain medication Efficient Use of Medical Imaging This is not listed because 41 New York hospitals were not reported.
More background information on Mortality and Safety of Care is provided in “Complications & deaths” and more information on Readmission is at “Unplanned hospital visits” at Medicare.gov/Hospital Compare.2
1 Medicare.gov/Hospital Compare: Measures included by categories. See: https://www.medicare.gov/hospitalcompare/Data/Hospital-overall-ratings-calculation.html 2 See: https://www.medicare.gov/hospitalcompare/Data/Measures.html and https://www.medicare.gov/hospitalcompare/Data/RCD-Overview.html

Appendix B Page 1
APPENDIX B
Number of and percentages of five, four, three, two and one-star quality hospitals as of July 30, 2019 Acute Care Hospitals and Critical Access Hospitals are in a column “a” and their N/A hospitals are in column “c”. Hospital Acute Hospitals and no Critical Access Hospitals are in column “b” and their N/A hospitals are in column “d”.
Urban population at these states is at least 70% of total state population. Not included: “Acute Care – Veterans Administration,” “Acute Care – Department of Defense”, “Childrens” hospitals and
“Psychiatric” facilities.
Million pop-
ulation1
Total # of hospitals, non-N/A
Five stars
Four stars
Three stars
Two stars
One star
# of N/A hospitals/
# of only ACH N/A hospitals.
New York 19.8 a) 1492 b) 140
1/1% 1/1%
15/10% 11/8%
40/27% 37/26%
45/30% 43/31%
48/32% 48/34%
c) 183 d) 9
Arizona 7.2 a) 55 b) 50
4/7% 4/8%
14/25% 12/24%
19/35% 17/34%
16/29% 15/30%
2/4% 2/4%
c) 19 d) 10
California 39.4 a) 296 b) 279
21/7% 21/7%
62/21% 58/21%
93/31% 86/31%
96/32% 90/32%
24/8% 24/9%
c) 33 d)16
Florida 21.3 a) 169 b) 163
9/5% 8/5%
28/17% 27/17%
40/24% 38/23%
60/35% 58/36%
32/19% 32/20%
c) 10 d) 4
Georgia 10.5 a) 108 b) 93
5/5% 4/4%
26/27% 21/23%
42/38% 34/37%
23/25% 22/24%
12/11% 12/13%
c) 15 d) 7
Illinois 12.8 a) 163 b) 123
12/7% 10/8%
49/30% 29/23%
55/34% 41/33%
31/19% 27/22%
16/10% 16/13%
c) 13 d) 2
Indiana 6.7 a) 110 b) 80
13/12% 12/15%
51/46% 33/41%
36/33% 28/35%
10/9%% 7/9%
0/0% 0/0%
c) 10 d) 5
Maryland* 6.0 a) 45 5/11% 9/20% 19/42% 6/13% 6/13% c) 2 Massachusetts 6.0 a) 56
b) 53 7/12% 6/11%
11/20% 11/21%
19/34% 17/32%
15/27% 15/28%
4/7% 4/7%
c) 2 d) 2
Michigan 10.0 a) 116 b) 87
11/9% 9/10%
51/44% 30/34%
37/32% 31/36%
13/11% 13/15%
4/3% 4/4%
c) 14 d) 7
Missouri 6.1 a) 89 b) 70
6/7% 6/8%
23/26% 15/21%
36/40% 27/38%
17/19% 15/21%
7/8% 7/10%
c) 11 d) 1
New Jersey* 9.0 a) 64 6/9% 10/17% 14/22% 26/41% 8/12% c) 0 Ohio 11.7 a) 145
b) 117 20/14% 17/15%
52/36% 41/35%
50/34% 37/32%
21/14% 20/17%
2/1% 2/1%
c) 14 d) 9
Pennsylvania 12.8 a) 148 b) 134
11/7% 11/8%
36/24% 30/22%
52/35% 46/34%
36/24% 35/26%
13/9% 12/9%
c) 15 d) 14
Texas 28.7 a) 264 b) 244
23/9% 23/9%
84/32% 74/30%
95/36% 86/35%
52/20% 51/21%
10/4% 10/4%
c) 125** d) 60
Virginia 8.6 a) 77 b) 72
9/12% 9/12%
24/31% 20/28%
24/31% 24/33%
17/22% 16/22%
3/4% 3/4%
c) 2 d) 2
Washington 7.5 a) 68 b) 46
6/9% 5/11%
19/28% 15/33%
24/35% 10/22%
17/25% 14/30%
2/3% 2/4%
c) 20 d) 3
*These two states have no Critical Access Hospitals. **57 of these are “Psychiatric”. Hospital Compare defines these hospitals as follows: “A specialty facility that primarily provides inpatient psychiatric services for the diagnosis and treatment of mental illness on a 24-hour basis, by or under the supervision of a physician.”
1 Source: http://worldpopulationreview.com/states/ 2 Nine New York Critical Access Hospitals that have at least two stars: Community Memorial Hospital (4 stars, 25 beds), Delaware Valley Hospital (4 stars, 25 beds), Elizabeth Community Hospital (2 stars, 25 beds), Ellenville Regional Hospital (3 stars, 25 beds), Gouverneur Hospital (2 stars, 25 beds), Lewis County General Hospital (3 stars, 35 beds), Little Falls Hospital (4 stars, 25 beds),

Appendix B Page 2
O’Connor Hospital (4 stars, 23 beds), Soldier-Sailors Memorial Hospital (3 stars, 35 beds). None of these hospitals has only one star. 3 Hospital Compare reports these hospitals as “Not available” and hospitals with no Emergency Services are indicated as “No ES).” Nine Acute Care Hospitals (ACH): Burden Care Center (no ES), Healthalliance Hospital Mary’s Avenue Campus, Helen Hayes Hospital (no ES), Monroe Community Hospital (no ES), NY Eye and Ear Infinity, Sunnyview Hospital (no ES), Rockefeller University Hospital (no ES), Tri-Town Regional Healthcare and Westfield Memorial Hospital. Nine Critical Access Hospitals (CAH): Carthage Area Hospital, Catskill Regional Medical Center – G Hermann Site (no ES), Cobleskill Regional Hospital, Cuba Memorial Hospital (no ES), Clifton Fine Hospital, River Hospital, Margaretville Memorial Hospital, Schuyler Hospital, Medina Memorial Hospital.

Appendix C Page 1
APPENDIX C
Upstate # of hospitals
% of Upstate hospitals # of beds
% of upstate hospital beds
One-star hospitals 15 18% 4339 26% Two-star hospitals 32 38% 7894 47% Three-star hospitals 24 28% 3530 21% Four-star hospitals 12 15% 985 6%
Five-star hospitals 0 0% 0 0%
TOTAL UPSTATE HOSPITALS 83 16748
Nassau-Suffolk-Westchester # of hospitals
% of suburb hospitals # of beds
% of suburban
hospital beds
One-star hospitals 9 30% 2958 28% Two-star hospitals 9 30% 3948 37%
Three-star hospitals 10 33% 3056 29%
Four-star hospitals 2 7% 602 6%
Five-star hospitals 0 0% 0 0% TOTAL SUBURB HOSPITALS AND BEDS 30 10564
New York City # of hospitals
% of NYC hospitals # of beds
% of NYC hospital beds
One-star hospitals 24 67% 11433 56% Two-star hospitals 4 14% 1989 10% Three-star hospitals 6 14% 5326 27% Four-star hospitals 1 3% 1294 6%
Five-star hospitals 1 0% 214 1%
TOTAL NYC HOSPITALS AND BEDS 36 20256
TOTAL New York State # of
hospitals % of NYS hospitals # of beds
% of total hospital beds
One-star hospitals 48 32% 18730 39%
Two-star hospitals 45 30% 13831 29% Three-star hospitals 40 27% 11912 25% Four-star hospitals 15 11% 2881 6% Five-star hospitals 1 0% 214 0%
TOTAL NYS HOSPITALS AND BEDS 149 47568

UPSTATE Beds Beds as % of stars County One-star hospitals (15) Albany Medical Center Hospital 716 Albany Alice Hyde Medical Center 76 Franklin Auburn Community Hospital 99 Cayuga Eastern Niagara Hospital 136 Niagara Geneva General Hospital 132 Ontario Good Samaritan Hospital (Suffern) 286 Rockland HealthAlliance Hospital-Broadway (Kingston) 150 Ulster Kaleida Health 788 Erie Mary Imogene Bassett Hospital (Cooperstown) 180 Otsego Mercy Hospital of Buffalo 387 Erie Niagara Falls Medical 171 Niagara Samaritan Hospital (Troy) 212 Rensselaer St. Elizabeth Medical Center (Utica) 201 Oneida United Health Services (Johnson City) 500 Broome Vassar Brothers Center 365 Dutchess 4399 4399 26% Kaleida includes Buffalo General Hospital (457), DeGraff Memorial (66), Millard Fillmore Suburban (265)
United Health Services includes UHS Binghamton General Hosp and Wilson Medical Center
Two-star hospitals (32) Beds Beds as % of stars County Arnot Ogden Medical Center (Elmira) 266 Chemung Brooks Memorial Hospital-TLC 65 Chautauqua Bertrand Chaffee Hospital (Springville) 24 Erie Catskill Regional Medical Center 154 Sullivan Cayuga Medical Center at Ithaca 212 Tompkins Clifton Springs Hospital 154 Ontario Columbia Memorial Hospital (Hudson) 192 Columbia Crouse Memorial Hospital (Syracuse) 465 Onondaga Elizabeth Community Hospital *25 Essex Ellis Hospital 368 Schenectady Erie County Medical Center 583 Erie Faxton-St Luke's Hosp (Utica) 370 Oneida FF Thompson Hosp 113 Ontario Gouverneur Hospital *25 St Lawrence Jones Memorial Hospital 70 Allegany Massena Memorial Hospital 50 St Lawrence Newark-Wayne Community Hospital 120 Wayne Nicholas H Noyes Memorial Hospital (Dansville) 67 Livingston Nyack Hospital 375 Rockland

Appendix C Page 3
Putnam Hospital Center 164 Putnam
Rochester General Hospital 528 Monroe
St. Anthony Community Hosp 60 Orange St Joseph's Hospital (Syracuse) 454 Onondaga St. Peter's Hospital, Albany 442 Albany Sisters of Charity Hospital (Buffalo) 290 Erie
St Luke-Cornwall Hospital 242 Orange
St Mary's Hospital at Amsterdam 120 Montgomery
Strong Memorial Hospital (Rochester) 838 Monroe United Memorial Med Center (Batavia) 111 Genesee Unity Hospital of Rochester 311 Monroe University Hospital-SUNY (Syracuse) 409 Onondaga
UPMC Chautauqua WCA 277 Chautauqua
7894 7894 47%
Three-star hospitals (24 hospitals) Beds Beds as % of stars County
Aurelia Osborn Fox Memorial Center 53 Otsego Canton-Potsdam Hospital 94 St Lawrence
Champlain Valley Hospital (Plattsburg) 300 Clinton
Chenango Memorial Hospital (Norwich) 58 Chenango
Claxton-Hepburn Medical Center 130 St Lawrence Cortland Memorial Regional Center 162 Cortland Ellenville Regional Hospital *25 Ulster Glens Falls Hospital 410 Warren
Highland Hospital (Rochester) 261 Monroe
Ira Davenport Memorial Hospital 35 Steuben
Lewis County General Hospital *35 Lewis Mount St Mary's Hospital ( Lewiston) 175 Niagara Olean General Hospital 186 Cattaraugus Oneida Healthcare 101 Oneida
Orange Regional Medical Center 383 Orange
Oswego Hospital 132 Oswego
Our Lady of Lourdes Memorial (Binghamton) 242 Broome Rome Memorial Hospital 130 Oneida Samaritan Hospital (Watertown) 290 Jefferson Soldiers and Sailors Memorial *35 Yates
St James Mercy Hosp (Hornell) 15 Steuben
St Joseph's Hospital (Elmira) 125 Chemung
St Mary's Hospital (Troy) 186 Rensselaer Wyoming County Hospital 62 Wyoming 3530 3530 21%

Appendix C Page 4
Four-star hospitals (12 hospitals) Beds Beds as % of stars County
Adirondack Medical Center 95 Essex Albany Memorial Hospital 165 Albany Bon Secours Community Hospital 122 Orange Community Memorial Hospital - Hamilton *25 Madison
Corning Hospital 65 Steuben
Delaware Valley Hospital 25 Delaware
Kenmore Mercy Hospital - Buffalo 184 Erie
Little Falls Hospital *25 Herkimer Nathan Littauer Hospital (Gloversville) 74 Fulton Northern Dutchess Hospital 84 Dutchess
O'Connor Hospital *23 Delaware
Saratoga Hospital 171 Saratoga
985 985 6%
Five-star hospitals (0) None 0 0 0%
TOTAL BEDS 16748 TOTAL HOSPITALS 83
*These are a Critical Access Hospital
"Not Available" (10 hospitals, and whether it has no ER) Carthage Area Hospital, CAH 35 Clifton Fine Hospital, CAH 20 Cuba Memorial Hospital, CAH, no ER 6 HealthAlliance Hospital Mary's Avenue Campus, ACH 150
Margaretville Memorial Hospital, CAH 15
Medina Memorial Hospital, CAH 39
Monroe County Hospital, ACH, no ER 39
River Hospital, CAH 15 Schuyler Hospital, CAH 25
Westfield Memorial Hospital, ACH 4

Appendix C Page 5
NEW YORK CITY Beds Beds as % of stars
One-star hospitals (24)
Bellevue Medical Center 912
Brookdale Hospital Center 530
Brooklyn Hospital Medical Center 464
Coney Island Hospital 371
Elmhurst Medical Center 545
Flushing Hospital Medical Center 299
Harlem Hospital Center 282
Interfaith Medical Center 287
Jacobi Medical Center 457
Jamaica Hospital Center 408
Kings County Medical Center 639
Kingsbrook Jewish Medical Center 303
Lincoln Medical & Mental Health 362 Maimonides Medical Center 711
Montefiore Medical Center* 1558 North Central Bronx Hospital 213
Queens Hospital Center 269
Richmond University Medical 448
Staten Island University Hospital** 666
St. Barnabas Hospital 422
St. John's Episcopal Hospital 257
University Hospital-Brooklyn 342
Wyckoff Heights Medical Center 324
Woodhull Medical and Mental 364
11433 11433 56%
*Includes Henry & Lucy Moses, Jack D Weiler Centers and Montefiore Wakefield Hospital
**Includes St. University North (472) and South (194)
Two-star hospitals (4)
Bronx-Lebanon Medical Center* 415
Metropolitan Hospital Center 338 Mount Sinai Beth Israel 701
New York-Presbyterian/Queens 535
1989 1989 10%
*Concourse Center only Three-star hospitals (6) Lenox Hill Hospital 632

Appendix C Page 6
Mt Sinai Hospital 1134
Mount Sinai West 495
New York Community Hospital-Brooklyn 212 New York-Presbyterian Hospital* 2262
New York Methodist Hospital 591 5326 5326 27%
*Includes the Lower Manhattan, Columbia Presbyterian-Weill Cornell and Allen Hospitals
Four-star hospitals (1) NYU Hospitals Centers* 1294 1294 6% *Lutheran Med Ctr was renamed NYU Langone Hospital-Brooklyn. Its 450 beds are included.
Five-star hospitals (1) Hospital for Special Surgery 214 214 1%
TOTAL BEDS 20256 TOTAL HOSPITALS 36
NASSAU, SUFFOLK, WESTCHESTER Beds Beds as % of stars
One-star hospitals (9) Good Samaritan Hospital - West Islip 437 Long Island Community Hospital (Brookhaven Memorial Hospital) 306 Mercy Medical Center 375
Montefiore - Mount Vernon Hospital 121
Nassau University Medical Center 530
Peconic Bay Medical Center 140
St Joseph Hospital - Bethpage 203 St Joseph's-Yonkers 194 Westchester Medical Center 652
2958 2958 28%
Two-star hospitals (9)
Glen Cove Hospital 247 Long Island Jewish Medical Center* 1,025 Montefiore - New Rochelle Hospital 223 New York-Presbyterian Hosp (Lawrence Hospital)*** 288 North Shore University 738 St John's Riverside Hospital** 366 Southside Hospital 300

Appendix C Page 7
South Nassau Hospital 455
St Catherine of Siena Hosp 306
3948 3948 37%
*Franklin Hospital was reported for 2016 but not for 2017.
It now is Long Island Jewish Valley Stream, 900 Franklin Avenue.
**Including Dobbs Ferry SJRH
Three-star hospitals (10)
Eastern Long Island Hospital 90 Huntington Hospital 408 John T Mather Mem Hospital 248 NY Presbyterian Hosp -- Hudson Valley Hospital 128 Northern Westchester Hospital 245 Plainview Hospital 204 St Charles Hospital - Port Jefferson 243
University Hospital - Stony Brook* 603
White Plains Hospital 296
Winthrop-University Medical Center (NYU) 591 3056 3056 29%
*Includes 125 beds from Southampton Hospital
Four-star hospitals (2)
Phelps Memorial Hospital 238
St Francis Hospital - Roslyn 364
602 602 6%
Five-star hospitals (0) None 0 0
TOTAL BEDS 10564
TOTAL HOSPITALS 30

APPENDIX D
Effectiveness of Care and Timelessness of Care: National Average Comparison numbers and percentages of “Below,” “Same” or “Above” hospitals’ beds
Two of the three New York categories in which each category has 4% of the weight used on these calculations.* Numbers of beds and their total percentages. New York
State New York
City (36 hospitals)
Nassau-Suffolk-
Westchester (30 hospitals)
Upstate (76 ACH
hospitals)
Effectiveness of Care Below the national average 7,796/16% 3,850/19% 1,025/10% 2,921/17% Same as the national average 38,140/80% 15,112/75% 9,539/90% 13,489/80% Above the national average 1,707/4% 1,294/6% 0/0% 413/2% NA 0 0 0 0 Timelessness of Care Below the national average 42,311/89% 20,042/100% 9,933/94% 12,336/73% Same as the national average 4,437/94% 0/0% 631/6% 3,806/23% Above the national average 681/1% 0/0% 0/0% 681/4% NA 214 214 0 0
*The third category, Efficient Use of Medical Care, is not reported here because 41 of the total 150 New York hospitals did not report it.

Appendix E Page 1
APPENDIX E Safety of Care, Readmission, Patient Expression and Mortality: National Average Comparison numbers
and percentages of its “Below” “Same” or “Above” hospital beds Hospital scores are determined from Safety of Care, Readmission, Patient Expression and Mortality, each of which has 22 percent of the weight used on these calculations. (See Section A below) Hospitals are also determined from Effectiveness of Care, Timelessness of Care and Efficient Use of Medical Imaging, each of which has four percent of the weight used on these calculations. (See Section B below). Safety of Care Seventy-seven percent of New York City hospital beds, 72 percent of Nassau-Suffolk-Westchester hospital beds and 47 percent of Upstate hospital beds were “Below the national average.” Seven percent of New York City hospital beds, 17 percent of Nassau-Suffolk-Westchester hospital beds and 28 percent of Upstate hospital beds were “Same as the national average.” Fifteen percent of New York City beds, 12 percent of the Nassau-Suffolk-Westchester hospital beds and 25 percent of Upstate hospital beds were “Above the national average.” Readmission Ninety-seven percentage of New York City hospital beds, 91 percent of Nassau-Suffolk-Westchester hospital beds and 57 percent of Upstate hospital beds were “Below the national average.” None of the New York City hospital beds, 6 percent of Nassau-Suffolk-Westchester hospital beds and 17 percent of Upstate hospital beds were “Same as the national average.” Three percentage of New York City hospital beds, three percent of Nassau-Suffolk-Westchester hospital beds and 26 percent of Upstate hospital beds were “Above the national average.” Patient Expression Percentages by number of hospital beds. Eighty-eight percentage of New York City hospital beds, 66 percent of Nassau-Suffolk-Westchester hospital beds and 64 percent of Upstate hospital beds were “Below the national average.” Eleven percentage of the New York City hospital beds, 19 percent of Nassau-Suffolk-Westchester hospital beds and 31 percent of Upstate hospital beds were “Same as the national average.” One percent of New York City hospital beds, 14 percent of Nassau-Suffolk-Westchester hospital beds and four percent of Upstate hospital beds were “Above the national average.” Mortality Three percentage of hospital beds in New York City, 6 percent of Nassau-Suffolk-Westchester hospital beds and 19 percent of Upstate hospital beds were “Below the national average.” Forty-four percentage of New York City hospital beds, 47 percent of Nassau-Suffolk-Westchester hospital beds and 64 percent of Upstate hospital beds were “Same as the national average.” Fifty-three percentage of New York City hospital beds, 48 percent of Nassau-Suffolk-Westchester hospital beds and 16 percent of Upstate hospital beds were “Above the national average.”

Appendix E Page 2
*Medicare.gov/Hospital Compare includes nine small CAH hospitals when providing the hospital with a quality star: Community Memorial Hospital, Delaware Valley Hospital, Elizabeth Community Hospital, Ellenville Regional Hospital, Gouverneur Hospital, Lewis County General Hospital, Little Falls Hospital, O’Connor Hospital and Soldiers and Sailors Memorial Hospital.
1 Medicare.gov/Hospital Compare was not including these N/A hospitals because: “There are too few measures or measure groups reported to calculate a star rating or measure group score”: Clifton Fine Hospital, Cuba Memorial Hospital, HealthAlliance Hospital Mary’s Avenue Campus, Helen Hayes Hospital, Margaretville Memorial Hospital, Medina Memorial Hospital, Monroe Community Hospital, Moses-Ludington Hospital, NY Eye & Ear Infirmary, River Hospital, Inc., Schuyler Hospital, Sunnyview Hospital, Westfield Memorial Hospital. Medicare.gov/Hospital Compare also does not include 11 hospitals for “Overall star ratings are not calculated for Veterans Health Administration or Department of Defense,” four hospitals for “Data are shown only for hospitals that participate in Inpatient Quality Reporting (IQR) and Outpatient Quality Reporting (OQR) program,” and one hospital for which “Data suppressed by CMS for one or more quarters.” 2 Hospital for Special Surgery was N/A for “Mortality” and “Patient Experience.” North Central Bronx Hospital was N/A for Mortality. 3 Eastern Long Island Hospital and Montefiore Mount Vernon Hospital were N/A for “Safety of Care.” 4 Albany Memorial Hospital, Bertrand Chaffee Hospital, Clifton Springs Hospital and Clinic, Cobleskill Regional Hospital, Ira Davenport Memorial Hospital, Jones Memorial Hospital, Massena Memorial Hospital, Rome Memorial Hospital, St. James Mercy Hospital, St. Joseph’s Hospital, St. Mary’s Hospital (Troy) and Wyoming County Community Hospital were N/A for “Safety of Care.” Cobleskill Regional Hospital, Ira Davenport Memorial Hospital, St. Mary’s Hospital (Troy) and St Joseph’s Hospital, St. Mary’s Hospital (Troy) were N/A for “Patient Experience.”
Table, Appendix E. National Average Comparison a) Numbers and percentages of hospital beds in 76 Acute Care Hospitals (ACH) b) Numbers of hospital beds in nine Critical Access Hospitals (CAH)
a) Acute Care Hospitals (1) b) CAH* New York
State New York
City (2) Nassau-Suffolk-
Westchester (3)
Upstate (4)
NYS
Safety of Care
Below the national average 30,520/66% 15,670/77% 7,405/72% 3,456/47% 0 Same as the national average 7,681/17% 1,536/8% 1,740/17% 4,405/28% 0 Above the national average 8,175/18% 3,061/15% 1,208/12% 3,906/25% 0 NA 1,506 0 211 1,056 239
Readmission Below the national average 38,778/82% 19,481/97% 9,668/91% 9,604/57% 25 Same as the national average 3,678/7% 0/0% 602/6% 2,862/17% 214 Above the national average 5,283/11% 632/3% 294/3% 4,357/27% 0 NA 214 214 0 0 0
Patient Experience
Below the national average 35,361/75% 17,780/88% 7,006/63% 10,575/64% 0 Same as the national average 9,481/20% 2,262/11% 2,034/19% 5,125/31% 60 Above the national average 2,553/5% 214/1% 1,524/14% 737/4% 81 NA 386 0 0 386 98
Mortality Below the national average 4,421/9% 665/3% 530/6% 3,226/19% 0 Same as the national average 24,620/52% 8,736/44% 4,936/47% 10,734/64% 214 Above the national average 18,265/39% 10,428/53% 5,098/48% 2,739/16% 0 NA 552 427 0 125 25

Appendix F Page 1
APPENDIX F
How hospitals with one to five quality stars were determined. Hospital Compare is part of the Centers for Medicare & Medicaid Services (CMS).1 It reports on whether a hospital has a one, two, three, four or five quality stars. The number of stars is based on “overall hospital rating summarizes” of between nine and 60 measures, with an average of 39 measures. These measures are in categories “across 7 areas of quality into a single star rating for each hospital”2 and, “The more stars, the better a hospital performed on the available quality measures. The most common overall hospital rating is 3 stars.”3 QualityNet reports that the Hospital Compare is “a website designed for consumers to use along with their healthcare provider to make decisions where to receive care.”4 The seven quality star categories are: Mortality, Safety of Care, Readmission, Patient Experience, Effectiveness of Care, Timelessness of Care, and Efficient Use of Medical Imaging. 5 Hospital scores are determined mostly from the first four of these categories, each of which has 22 percent of the weight used on these calculations: Mortality, Safety of Care, Readmission, and Patient Experience. Performance is based less on the three other categories, each of which has 4 percent of the weight: Effectiveness of Care, Timelessness of Care, and Efficient Use of Medical Imaging.6 CMS reported that in December 2017 there were significant improvements in how Hospital Quality Star Ratings were determined: “Overall these methodology enhancements yield a broader Star Rating distribution, increase reliability, and improve the stability of hospital estimates.”7 Centers for Medicare & Medicaid plans to revise the quality measurement methodology of Overall Hospital Quality Star Ratings in 2021. In August 2019 CMS reported, “In the interim, CMS will next refresh the Star Ratings using the current methodology in early 2020, ensuring patients have timely access to the most up-to-date hospital quality information while a new methodology is being finalized.”8
1 According to Medicare.gov/Hospital Compare it “uses a variety of tools to help hospitals improve the quality of care they deliver. The aim is to help improve hospitals’ quality of care through easy to understand data on hospital performance…” See also: https://www.medicare.gov/hospitalcompare/Data/About.html%20Medicare.gov/Hospital%20Compare/ 2 Medicare.gov/Hospital Compare explained that a hospital summary score is calculated “by taking the weighted average of these [seven] group scores. If a hospital is missing a measure category or group, the weights are redistributed amongst the qualifying measure categories or groups.” See: https://www.medicare.gov/hospitalcompare/Data/Hospital-overall-ratings-calculation.html 3 See: Medicare.gov/Hospital Compare, Hospital Compare overall hospital rating, https://www.medicare.gov/hospitalcompare/Data/Data-Updated.html# 4 In August 2017 Becker’s Healthcare reported, “CMS: Hospitals to submit meaningful use data via QualityNet in 2018.” See: https://www.beckershospitalreview.com/healthcare-information-technology/cms-hospitals-to-submit-meaningful-use-data-via-qualitynet-in-2018.html For a October 2018 update, See: https://www.cms.gov/Regulations-and-\Guidance/Legislation/EHRIncentivePrograms/Downloads/EHRHospital_TransitionOverviewFact-Sheet_20171101.pdf

Appendix F Page 2
In October 2017 QualityNet released “QualityNet Secure Portal Enrollment and Login User Guide for Eligible Hospitals and Critical Access Hospitals Attesting to the Centers for Medicare & Medicaid Services for the Electronic Health Record Incentive Program.” See: https://www.cms.gov/Regulations-and-Guidance/Legislation/EHRIncentivePrograms/Downloads/QualityNetUserGuide.pdf 5 An explanation of this process was summarized by Deloitte Center for Health Solutions on page 3 in 2017 in “There’s more than one way to become a 5-star hospital.” According to Deloitte: “The score is calculated using a five-step process, which involves standardizing individual quality measures, grouping them into seven categories, calculating scores for each individual category, and then using a summary score to calculate the final star rating.” 6 Hospital Compare explains that for each hospital, “a hospital summary score is calculated by taking the weighted average of the hospital’s scores for each measure group or category” and that their table “shows the weight applied to each measure category. The hospital summary score is then used to calculate the overall rating.” See: https://www.medicare.gov/hospitalcompare/Data/Hospital-overall-ratings-calculation.html Hospital Compare obtains its hospital information from the Hospital Inpatient Quality Reporting (IQR) Program Overview6 and the Hospital Outpatient Quality Reporting (OQR) Program. See: https://www.qualitynet.org/dcs/ContentServer?c=Page&pagename=QnetPublic%2FPage%2FQnetTier2&cid=1191255879384 In addition, “Some of the measures used to calculate the overall hospital rating are based only on data from Medicare patients and some are based on data from all patients.” If one or more of the categories is missing, its weight is included in the other categories. 7 Star Methodology Enhancement for December 2017 Public Release, and CMS Methodology Enhancements for December 2017 Public Reporting – December 2017 Release. See: https://www.qualitynet.org/dcs/ContentServer?c=Page&pagename=QnetPublic%2FPage%2FQnetTier3&cid=1228775957165
8 CMS.gov Newsroom: “CMS Announces Upcoming Enhancement of Overall Hospital Quality Star Ratings,” August 19, 2019.

APPENDIX G
Timelessness of Care and Effectiveness of Care: total numbers of hospitals and their percent “Below the national averages,” “Same as the national average,” or “Above the national average” National Average Comparison is based on the following three groups or categories of quality measures that make up the Hospital Compare overall rating. Each is worth up to four percent of the weight used in their calculations. In 2019: x On Timeliness of Care, 100 percent of the New York City hospitals, 90 percent of the suburban
hospitals and 53 percent of Upstate hospitals were “Below the national average.” None of the New York City, 10 percent of Nassau-Suffolk-Westchester hospitals and 36 percent of Upstate hospitals were “Same as the national average,” None of the New York City hospitals, none of Nassau-Suffolk-Westchester hospitals and 11 percent of Upstate hospitals have an “Above the national average.”
x On Effectiveness of Care, 25 percent of New York City hospitals, three percent of the Nassau-
Suffolk-Westchester hospitals and nine percent of Upstate hospitals were “Below the national average.” Seventy-two percent of the New York City hospitals, 97 percent of Nassau-Suffolk-Westchester hospitals and 88 percent of Upstate hospitals were “Same as the national average.” Three percent of New York City hospitals, none of the Nassau-Suffolk-Westchester hospitals and three percent of Upstate hospitals were “Above the national average.”
Efficient Use of Medical Imaging is not included in Appendix G because 41 of the 149 New York hospitals were not reported.

Appendix H Page 1
APPENDIX H, Hospitals and beds by Below, Same or Above National Averages SAFETY OF CARE
New York City Below the national care (25 hospitals) Beds Bellevue Medical Center 912 Brookdale Hospital Center 530 Brooklyn Hospital Medical Center 464 Coney Island Hospital 371 Elmhurst Medical Center 545 Flushing Hospital Medical Center 299 Interfaith Medical Center 287 Jacobi Medical Center 457 Kings County Medical Center 639 Kingsbrook Jewish Medical Center 303 Lenox Hill Hospital 632 Lincoln Medical & Mental Health 362 Maimonides Medical Center 711 Metropolitan Hospital Center 338 Montefiore Medical Center 1558 Mount Sinai Beth Israel 701 New York-Presbyterian Hospital 2262 New York-Presbyterian/Queens 535 NYU Hospitals Centers 1294 Richmond University Medical 448 St. Barnabas Hospital 422 St. John's Episcopal Hospital 257 Staten Island University Hospital 666 University Hospital-Brooklyn 342 Wyckoff Heights Medical Center 324 TOTAL AND PERCENT NYC 15659 15659 77%
Same as national average (5 hospitals) Harlem Hospital Center 282 Jamaica Hospital Center 408 North Central Bronx Hospital 213 Queens Hospital Center 269 Woodhull Medical and Mental 364 TOTAL AND PERCENT NYC 1536 1536 7%
Above the national average (6 hospitals) Bronx-Lebanon Medical Center 415

Appendix H Page 2
Hospital for Special Surgery 214 Mt Sinai Hospital 1134 Mount Sinai West 495 New York Community Hospital-Brooklyn 212 New York Methodist Hospital 591 TOTAL AND PERCENT NYC 3061 3061 15%
TOTAL BEDS 20256
TOTAL HOSPITALS 36
APPENDIX H, Hospitals and beds by Below, Same or Above National Averages SAFETY of CARE
Nassau-Suffolk-Westchester Counties Below the national average (18 hospitals) Beds Good Samaritan Hospital (West Islip) 437 Huntington Hospital 408 Long Island Community Hospital (Brookhaven Mem Hosp) 306 Long Island Jewish Medical Center 1,025 Mercy Medical Center 375 Nassau University Medical Center 530 New York-Presbyterian Hosp (Lawrence Hospital) 288 North Shore University 738 Northern Westchester Hospital 245 Winthrop-University Medical Center (NYU) 591 Plainview Hospital 204 St Catherine of Siena Hosp 306 St Charles Hospital - Port Jefferson 243 St Francis Hospital - Roslyn 364 St Joseph Hospital - Bethpage 203 St Joseph's (Yonkers) 194 Westchester Medical Center 652 White Plains Hospital 296 TOTAL GNYC SUBURBS 7405 7405 72%
Same as the national (5 hospitals) John T Mather Mem Hospital 248 Montefiore - New Rochelle Hospital 223 Southside Hospital 300 St John's Riverside Hospital 366 University Hospital - Stony Brook 603 TOTAL GNYC SUBURBS 1740 1740 17%

Appendix H Page 3
Above the national average (5 hospitals) Glen Cove Hospital 247 NY Presbyterian Hosp -- Hudson Valley Hospital 128 Peconic Bay Medical Center 140 Phelps Memorial Hospital 238 South Nassau Hospital 455 TOTAL GNYC SUBURBS 1208 1208 12%
TOTAL BEDS 10353
TOTAL HOSPITALS 28
N/A Montefiore - Mount Vernon Hospital 121 Eastern Long Island Hospital 90
APPENDIX H, Hospitals and beds by Below, Same or Above National Averages SAFETY OF CARE
Upstate Below the national average (26 hospitals) Beds Alice Hyde Medical Center 76 Arnot Ogden Medical Center (Elmira) 266 Catskill Regional Medical Center 154 Columbia Memorial Hospital (Hudson) 192 Cortland Memorial Regional Center 162 Eastern Niagara Hospital 136 Ellis Hospital (Schenectady) 368 Geneva General Hospital 132 Good Samaritan Hospital (Suffern) 286 HealthAlliance Hospital-Broadway (Kingston) 150 Highland Hospital (Rochester) 261 Kaleida Health 788 Mary Imogene Bassett Hospital (Cooperstown) 180 Mercy Hospital of Buffalo 387 Newark-Wayne Community Hospital 120 Nicholas H Noyes Memorial Hospital (Danville) 67 Putnam Hospital Center 164 Rochester General Hospital 528 Samaritan Hospital (Troy) 212 St. Anthony Community Hospital 60 St. Elizabeth Medical Center (Utica) 201 St Joseph's Hospital (Syracuse) 454

Appendix H Page 4
Strong Memorial Hospital (Rochester) 838 United Health Services (Johnson City) 500 University Hospital-SUNY (Syracuse) 409 Vassar Brothers Center 365 TOTAL AND PERCENT UPSTATE 7456 7456 47%
Same as the national average (18 hospitals) Albany Medical Center Hospital 716 Aurelia Osborn Fox Memorial Center 53 Brooks Memorial Hospital-TLC 65 Champlain Valley Hospital (Plattsburg) 300 Chenango Memorial Hospital (Norwich) 58 Crouse Memorial Hospital (Syracuse) 465 FF Thompson Hosp 113 Faxton-St Luke's Hosp (Utica) 370 Mount St Mary's Hospital (Lewiston) 175 Nathan Littauer Hospital (Gloversville) 74 Niagara Falls Medical 171 Nyack Hospital 375 Oneida Healthcare 101 Oswego Hospital 132 Our Lady of Lourdes Memorial (Binghamton) 242 St Luke-Cornwall Hospital 242 St. Peter's Hospital (Albany) 442 Unity Hospital of Rochester 311 TOTAL AND PERCENT UPSTATE 4405 4405 28%
Above the national average (19 hospitals) Adirondack Medical Center 95 Auburn Community Hospital 99 Bon Secours Community Hospital 122 Canton-Potsdam Hospital 94 Cayuga Medical Center at Ithaca 212 Claxton-Hepburn Med Center 130 Corning Hospital 65 Erie County Medical Center 583 Glens Falls Hospital 410 Kenmore Mercy Hospital (Buffalo) 184 Northern Dutchess Hospital 84 Olean General Hospital 186 Orange Regional Med Center 383

Appendix H Page 5
Samaritan Hospital (Watertown) 290 Saratoga Hospital 171 Sisters of Charity Hospital (Buffalo) 290 St Mary's Hospital at Amsterdam 120 UPMC Chautaqua WCA 277 United Memorial Med Center (Batavia) 111 TOTAL AND PERCENT UPSTATE 3906 3906 25%
TOTAL BEDS 15767
TOTAL HOSPITALS 63 N/A Albany Memorial Hospital 165 Bertrand Chaffee General 24 Clifton Springs Hospital 154 Cobleskill Regional Hospital 40 Ira Davenport Memorial Hospital 35 Jones Memorial Hospital 70 Massena Memorial Hospital 50 Rome Memorial Hospital 130 St James Mercy Hosp - Hornell 15 St Joseph's Hospital-Elmira 125 St Mary's Hospital -Troy 186 Wyoming County Hospital 62

Appendix H Page 6
APPENDIX H, Hospitals and beds by Below, Same or Above National Averages READMISSION
New York City Below the national average (34 hospitals) Beds Bellevue Medical Center 912 Bronx-Lebanon Medical Center 415 Brookdale Hospital Center 530 Brooklyn Hospital Medical Center 464 Coney Island Hospital 371 Elmhurst Medical Center 545 Flushing Hospital Medical Center 299 Harlem Hospital Center 282 Interfaith Medical Center 287 Jacobi Medical Center 457 Jamaica Hospital Center 408 Kings County Medical Center 639 Kingsbrook Jewish Medical Center 303 Lincoln Medical & Mental Health 362 Maimonides Medical Center 711 Metropolitan Hospital Center 338 Montefiore Medical Center* 1558 Mount Sinai Beth Israel 701 Mt Sinai Hospital 1134 Mount Sinai West 495 New York Community Hospital-Brooklyn 212 New York Methodist Hospital 591 New York-Presbyterian Hospital 2262 New York-Presbyterian/Queens 535 North Central Bronx Hospital 213 NYU Hospitals Centers 1294 Queens Hospital Center 269 Richmond University Medical 448 St. Barnabas Hospital 422 St. John's Episcopal Hospital 257 Staten Island University Hospital 666 University Hospital-Brooklyn 342 Woodhull Medical and Mental 364 Wyckoff Heights Medical Center 324 TOTAL AND PERCENT NYC 19410 19410 97%
Same as the national average

Appendix H Page 7
None 0 0
Above the national average (1 hospital) Lenox Hill Hospital 632 632 3%
TOTAL BEDS 20042
TOTAL HOSPITALS 35 N/A Hospital for Special Surgery
APPENDIX H, Hospitals and beds by Below, Same or Above National Averages READMISSION
Nassau-Suffolk-Westchester counties Below the national average (26 hospitals) Beds Glen Cove Hospital 247 Good Samaritan Hospital (West Islip) 437 Huntington Hospital 408 John T Mather Memorial Hospital 248 Long Island Community Hospital (Brookhaven Memorial Hospital) 306 Long Island Jewish Medical Center 1,025 Mercy Medical Center 375 Montefiore - Mount Vernon Hospital 121 Montefiore - New Rochelle Hospital 223 Nassau University Medical Center 530 New York-Presbyterian Hosp (Lawrence Hospital) 288 NY Presbyterian Hosp -- Hudson Valley Hospital 128 North Shore University 738 Northern Westchester Hospital 245 Winthrop-University Medical Center (NYU) 591 Peconic Bay Medical Center 140 South Nassau Hospital 455 Southside Hospital 300 St Catherine of Siena Hosp 306 St Charles Hospital (Port Jefferson) 243 St John's Riverside Hospital 366 St Joseph Hospital (Bethpage) 203 St Joseph's (Yonkers) 194 University Hospital - Stony Brook 603 Westchester Medical Center 652 White Plains Hospital 296 TOTAL AND PERCENT GNYC SUBURBS 9668 9668 91%

Appendix H Page 8
Same as the national average (2 hospitals) Phelps Memorial Hospital 238 St Francis Hospital (Roslyn) 364 TOTAL AND PERCENT GNYC SUBURBS 602 602 6%
Above the national average (2 hospitals) Eastern Long Island Hospital 90 Plainview Hospital 204 TOTAL AND PERCENT GNYC SUBURBS 294 294 3%
TOTAL BEDS 10564
TOTAL HOSPITALS 30
APPENDIX H, Hospitals and beds by Below, Same or Above National Averages READMISSION
Upstate Below the national average (37 hospitals) Beds Albany Medical Center Hospital 716 Arnot Ogden Medical Center (Elmira) 266 Auburn Community Hospital 99 Bertrand Chaffee General 24 Canton-Potsdam Hospital 94 Catskill Regional Medical Center 154 Champlain Valley Hospital (Plattsburg) 300 Claxton-Hepburn Med Center 130 Columbia Memorial Hospital (Hudson) 192 Cortland Memorial Regional Center 162 Crouse Memorial Hospital - Syracuse 465 Eastern Niagara Hospital 136 FF Thompson Hosp 113 Geneva General Hospital 132 Good Samaritan Hospital - Suffern 286 HealthAlliance Hospital-Broadway (Kingston) 150 Kaleida Health 788 Mary Imogene Bassett Hospital, Cooperstown 180 Massena Memorial Hospital 50 Mount St Mary's Hospital - Lewiston 175 Newark-Wayne Community Hospital 120 Niagara Falls Medical 171 Nicholas H Noyes Memorial Hoso - Danville 67

Appendix H Page 9
Nyack Hospital 375 Orange Regional Med Center 383 Putnam Hospital Center 164 Rochester General Hospital 528 Sisters of Charity Hospital-Buffalo 290 St. Anthony Community Hosp 60 St Joseph's Hospital -Syracuse 454 St Luke-Cornwall Hosp 242 St Mary's Hospital at Amsterdam 120 St. Peter's Hospital, Albany 442 Strong Memorial Hospital (Rochester) 838 Unity Hospital of Rochester 311 Vassar Brothers Center 365 Wyoming County Hospital 62 TOTAL AND PERCENT UPSTATE 9604 9604 57%
Same as the national average (16 hospitals) Adirondack Medical Center 95 Alice Hyde Med Center 76 Brooks Memorial Hospital-TLC 65 Cayuga Medical Center at Ithaca 212 Clifton Springs Hospital 154 Cobleskill Regional Hospital 40 Corning Hospital 65 Erie County Medical Center 583 Faxton-St Luke's Hosp (Utica) 370 Highland Hospital (Rochester) 261 Ira Davenport Memorial Hospital 35 Jones Memorial Hospital 70 Rome Memorial Hospital 130 St Mary's Hospital (Troy) 186 United Memorial Med Center (Batavia) 111 University Hospital-SUNY (Syracuse) 409 TOTAL AND PERCENT UPSTATE 2862 2862 17%
Above the national average (22 hospitals) Albany Memorial Hospital 165 Aurelia Osborn Fox Memorial Center 53 Bon Secours Community Hospital 122 Chenango Memorial Hospital - Norwich 58 Ellis Hospital (Schenectady) 368

Appendix H Page 10
Glens Falls Hospital 410 Kenmore Mercy Hospital (Buffalo) 184 Mercy Hospital of Buffalo 387 Nathan Littauer Hospital (Gloversville) 74 Northern Dutchess Hospital 84 Oneida Healthcare 101 Olean General Hospital 186 Oswego Hospital 132 Our Lady of Lourdes Memorial (Binghamton) 242 Samaritan Hospital (Troy) 212 Samaritan Hospital (Watertown) 290 Saratoga Hospital 171 St. Elizabeth Medical Ctr (Utica) 201 St James Mercy Hosp (Hornell) 15 St Joseph's Hospital (Elmira) 125 United Health Services (Johnson City) 500 UPMC Chautaqua WCA 277 TOTAL AND PERCENT UPSTATE 4357 4357 26%
TOTAL BEDS 16823
TOTAL HOSPITALS 75
APPENDIX H, Hospitals and beds by Below, Same or Above National Averages EFFECTIVENESS OF CARE
New York City Below the national average (9 hospitals) Beds Brookdale Hospital Center 530 Coney Island Hospital 371 Jacobi Medical Center 457 Jamaica Hospital Center 408 Kings County Medical Center 639 Lincoln Medical & Mental Health 362 North Central Bronx Hospital 213 Richmond University Medical 448 St. Barnabas Hospital 422 TOTAL AND PERCENT OF NYC 3850 3850 19%
Same as the national average (26 hospitals) Bellevue Medical Center 912 Bronx-Lebanon Medical Center 415

Appendix H Page 11
Brooklyn Hospital Medical Center 464 Elmhurst Medical Center 545 Flushing Hospital Medical Center 299 Harlem Hospital Center 282 Hospital for Special Surgery 214 Interfaith Medical Center 287 Kingsbrook Jewish Medical Center 303 Lenox Hill Hospital 632 Maimonides Medical Center 711 Metropolitan Hospital Center 338 Montefiore Medical Center* 1558 Mount Sinai Beth Israel 701 Mt Sinai Hospital 1,134 Mount Sinai West 495 New York Community Hospital-Brooklyn 212 New York Methodist Hospital 591 New York-Presbyterian Hospital 2262 New York-Presbyterian/Queens 535 Queens Hospital Center 269 St. John's Episcopal Hospital 257 Staten Island University Hospital 666 University Hospital-Brooklyn 342 Woodhull Medical and Mental 364 Wyckoff Heights Medical Center 324 TOTAL AND PERCENT OF NYC 15112 15112 75%
Above the national average (1 hospital) NYU Hospitals Centers 1,294 1294 6%
TOTAL BEDS 20256
TOTAL HOSPITALS 36
APPENDIX H, Hospitals and beds by Below, Same or Above National Averages EFFECTIVENESS OF CARE Nassau-Suffolk-Westchester
Below the national average (1 hospital) Beds Long Island Jewish Medical Center 1025 1025 10%
Same as the national average (29 hospitals) Eastern Long Island Hospital 90 Glen Cove Hospital 247

Appendix H Page 12
Good Samaritan Hospital (West Islip) 437 Huntington Hospital 408 John T Mather Mem Hospital 248 Long Island Community Hospital (Brookhaven Memorial Hospital) 306 Mercy Medical Center 375 Montefiore - Mount Vernon Hospital 121 Montefiore - New Rochelle Hospital 223 Nassau University Medical Center 530 New York-Presbyterian Hosp (Lawrence Hospital) 288 NY Presbyterian Hosp -- Hudson Valley Hospital 128 North Shore University 738 Northern Westchester Hospital 245 Winthrop-University Medical Center (NYU) 591 Peconic Bay Medical Center 140 Phelps Memorial Hospital 238 Plainview Hospital 204 South Nassau Hospital 455 Southside Hospital 300 St Catherine of Siena Hospital 306 St Charles Hospital ( Port Jefferson) 243 St Francis Hospital (Roslyn) 364 St John's Riverside 366 St Joseph Hospital - Bethpage 203 St Joseph's Medical Center 194 University Hospital - Stony Brook 603 Westchester Medical Center 652 White Plains Hospital 296 TOTAL AND PERCENT OF BEDS GNY SUBURBS 9539 9539 90%
Above the national average None 0 0 0%
TOTAL BEDS 10564
TOTAL HOSPITALS 30

Appendix H Page 13
APPENDIX H, Hospitals and beds by Below, Same or Above National Averages EFFECTIVENESS OF CARE
Upstate Below the national average (7 hospitals) Beds Albany Medical Center Hospital 716 Canton-Potsdam Hospital 94 Cayuga Medical Center at Ithaca 212 Erie County Medical Center 583 St. Elizabeth Medical Ctr (Utica) 201 Strong Memorial Hospital (Rochester) 838 UPMC Chautaqua WCA 277 TOTAL AND PERCENT UPSTATE 2921 2921 17%
Same as the national average (66 hospitals) Adirondack Medical Center 95 Albany Memorial Hospital 165 Alice Hyde Medical Center 76 Arnot Ogden Medical Center (Elmira) 266 Auburn Community Hospital 99 Aurelia Osborn Fox Memorial Center 53 Bertrand Chaffee General 24 Bon Secours Community Hospital 122 Brooks Memorial Hospital-TLC 65 Catskill Regional Medical Center 154 Champlain Valley Hospital (Plattsburg) 300 Chenango Memorial Hospital (Norwich) 58 Claxton-Hepburn Med Center 130 Clifton Springs Hospital 154 Cobleskill Regional Hospital 40 Columbia Memorial Hospital (Hudson) 192 Corning Hospital 65 Cortland Memorial Regional Center 162 Crouse Memorial Hospital (Syracuse) 465 Eastern Niagara Hospital 136 Ellis Hospital (Schenectady) 368 FF Thompson Hosp 113 Faxton-St Luke's Hosp (Utica) 370 Geneva General Hospital 132 Glens Falls Hospital 410 Good Samaritan Hospital (Suffern) 286

Appendix H Page 14
HealthAlliance Hospital-Broadway (Kingston) 150 Highland Hospital (Rochester) 261 Ira Davenport Memorial Hospital 35 Jones Memorial Hospital 70 Kaleida Health 788 Kenmore Mercy Hospital (Buffalo) 184 Mary Imogene Bassett Hospital (Cooperstown) 180 Massena Memorial Hospital 50 Mercy Hospital of Buffalo 387 Mount St Mary's Hospital (Lewiston) 175 Nathan Littauer Hospital (Gloversville) 74 Newark-Wayne Community Hospital 120 Niagara Falls Medical 171 Nicholas H Noyes Memorial Hospial (Danville) 67 Northern Dutchess Hospital 84 Nyack Hospital 375 Oneida Healthcare 101 Olean General Hospital 186 Orange Regional Medical Center 383 Oswego Hospital 132 Our Lady of Lourdes Memorial (Binghamton) 242 Putnam Hospital Center 164 Rochester General Hospital 528 Rome Memorial Hospital 130 Samaritan Hospital (Troy) 212 Samaritan Hospital (Watertown) 290 Sisters of Charity Hospital (Buffalo) 290 St. Anthony Community Hospital 60 St James Mercy Hospital (Hornell) 15 St Joseph's Hospital (Syracuse) 454 St Joseph's Hospital (Elmira) 125 St Mary's Hospital (Troy) 186 St Mary's Hospital at Amsterdam 120 St. Peter's Hospital (Albany) 442 United Health Services (Johnson City) 500 United Memorial Med Center (Batavia) 111 Unity Hospital of Rochester 311 University Hospital-SUNY (Syracuse) 409 Vassar Brothers Center 365 Wyoming County Hospital 62 TOTAL AND PERCENT UPSTATE 13489 13489 80%

Appendix H Page 15
Above the national average (2 hospitals) Saratoga Hospital 171 St Luke-Cornwall Hospital 242 TOTAL AND PERCENT UPSTATE 413 413 2%
TOTAL BEDS 16823
TOTAL HOSPITALS 75
APPENDIX H, Hospitals and beds by Below, Same or Above National Averages TIMELINESS OF CARE
New York City Below the national average (35 hospitals) Beds Bellevue Medical Center 912 Bronx-Lebanon Medical Center 415 Brookdale Hospital Center 530 Brooklyn Hospital Medical Center 464 Coney Island Hospital 371 Elmhurst Medical Center 545 Flushing Hospital Medical Center 299 Harlem Hospital Center 282 Interfaith Medical Center 287 Jacobi Medical Center 457 Jamaica Hospital Center 408 Kings County Medical Center 639 Kingsbrook Jewish Medical Center 303 Lincoln Medical & Mental Health 362 Maimonides Medical Center 711 Metropolitan Hospital Center 338 Montefiore Medical Center 1558 Lenox Hill Hospital 632 Mount Sinai Beth Israel 701 Mt Sinai Hospital 1,134 Mount Sinai West 495 New York Community Hospital-Brooklyn 212 New York Methodist Hospital 591 New York-Presbyterian Hospital 2262 New York-Presbyterian/Queens 535 North Central Bronx Hospital 213 NYU Hospitals Centers 1,294

Appendix H Page 16
Queens Hospital Center 269 Richmond University Medical 448 St. Barnabas Hospital 422 St. John's Episcopal Hospital 257 Staten Island University Hospital 666 University Hospital-Brooklyn 342 Woodhull Medical and Mental 364 Wyckoff Heights Medical Center 324 TOTAL AND PERCENT NYC BEDS 20042 20042 100%
Same as the national average None 0 0
Above the national average None 0 0
TOTAL BEDS 20042 100%
TOTAL HOSPITALS 35 N/A Hospital for Special Surgery 214
APPENDIX H, Hospitals and beds by Below, Same or Above National Averages TIMELINESS OF CARE
Nassau-Suffolk-Westchester Below the national average (27 hospitals) Beds Glen Cove Hospital 247 Good Samaritan Hospital - West Islip 437 Huntington Hospital 408 John T Mather Mem Hospital 248 Long Island Community Hospital (Brookhaven Memorial Hospital) 306 Long Island Jewish Medical Center 1,025 Mercy Medical Center 375 Montefiore - Mount Vernon Hospital 121 Montefiore - New Rochelle Hospital 223 Nassau University Medical Center 530 New York-Presbyterian Hosp (Lawrence Hospital) 288 NY Presbyterian Hosp -- Hudson Valley Hospital 128 North Shore University 738 Winthrop-University Medical Center (NYU) 591 Peconic Bay Medical Center 140 Phelps Memorial Hospital 238

Appendix H Page 17
Plainview Hospital 204 South Nassau Hospital 455 Southside Hospital 300 St Catherine of Siena Hosp 306 St Charles Hospital (Port Jefferson) 243 St Francis Hospital (Roslyn) 364 St John's Riverside Hospital 366 St Joseph Hospital (Bethpage) 203 St Joseph's Medical Center 194 University Hospital - Stony Brook 603 Westchester Medical Center 652 TOTAL AND PERCENT GNYC SUBURBS 9933 9933 94%
Same as the national average (3 hospitals) Eastern Long Island Hospital 90 Northern Westchester Hospital 245 White Plains Hospital 296 TOTAL AND PERCENT GNYC SUBURBS 631 631 6%
Above the national average None 0 0
TOTAL BEDS 10564
APPENDIX H, Hospitals and beds by Below, Same or Above National Averages
TIMELINESS OF CARE Upstate
Below the national average (40 hospitals) Beds Albany Medical Center Hospital 716 Arnot Ogden Medical Center (Elmira) 266 Auburn Community Hospital 99 Aurelia Osborn Fox Memorial Center 53 Canton-Potsdam Hospital 94 Catskill Regional Medical Center 154 Cayuga Medical Center at Ithaca 212 Champlain Valley Hospital (Plattsburg) 300 Columbia Memorial Hospital (Hudson) 192 Cortland Memorial Regional Center 162 Crouse Memorial Hospital (Syracuse) 465 Ellis Hospital 368 Erie County Medical Center 583

Appendix H Page 18
FF Thompson Hosp 113 Geneva General Hospital 132 Glens Falls Hospital 410 Good Samaritan Hospital (Suffern) 286 HealthAlliance Hospital-Broadway (Kingston) 150 Highland Hospital - Rochester 261 Kaleida Health 788 Kenmore Mercy Hospital - Buffalo 184 Mercy Hospital of Buffalo 387 Nyack Hospital 375 Olean General Hospital 186 Orange Regional Med Center 383 Oswego Hospital 132 Samaritan Hospital (Troy) 212 Samaritan Hospital (Watertown) 290 Saratoga Hospital 171 Sisters of Charity Hospital (Buffalo) 290 St. Elizabeth Medical Ctr (Utica) 201 St Joseph's Hospital (Syracuse) 454 St Joseph's Hospital (Elmira) 125 St. Peter's Hospital (Albany) 442 Strong Memorial Hospital (Rochester) 838 United Health Services (Johnson City) 500 Unity Hospital of Rochester 311 University Hospital-SUNY (Syracuse) 409 UPMC Chautaqua WCA 277 Vassar Brothers Center 365 TOTAL AND PERCENT OF UPSTATE 12336 12336 73%
Same as the national average (27 hospitals) Adirondack Medical Center 95 Albany Memorial Hospital 165 Brooks Memorial Hospital-TLC 65 Chenango Memorial Hospital (Norwich) 58 Claxton-Hepburn Med Center 130 Clifton Springs Hospital 154 Corning Hospital 65 Eastern Niagara Hospital 136 Faxton-St Luke's Hosp (Utica) 370 Ira Davenport Memorial Hospital 35 Jones Memorial Hospital 70

Appendix H Page 19
Mary Imogene Bassett Hospital (Cooperstown) 180 Massena Memorial Hospital 50 Mount St Mary's Hospital (Lewiston) 175 Nathan Littauer Hospital (Gloversville) 74 Newark-Wayne Community Hospital 120 Niagara Falls Medical 171 Nicholas H Noyes Memorial Hospital (Danville) 67 Oneida Healthcare 101 Our Lady of Lourdes Memorial (Binghamton) 242 Rochester General Hospital 528 Rome Memorial Hospital 130 St James Mercy Hospital (Hornell) 15 St Luke-Cornwall Hospital 242 St Mary's Hospital -Troy 186 St Mary's Hospital at Amsterdam 120 Wyoming County Hospital 62 TOTAL AND PERCENT OF UPSTATE 3806 3806 23%
Above the national average (8 hospitals) Alice Hyde Medical Center 76 Bertrand Chaffee General 24 Bon Secours Community Hospital 122 Cobleskill Regional Hospital 40 Northern Dutchess Hospital 84 Putnam Hospital Center 164 St. Anthony Community Hospital 60 United Memorial Med Center - Batavia 111 TOTAL AND PERCENT OF UPSTATE 681 681 4%
TOTAL BEDS 16823
TOTAL HOSPITALS 75
APPENDIX H, Hospitals and beds by Below, Same or Above National Averages PATIENT EXPERIENCE
New York City Below the national average (34 hospitals) Beds Bellevue Medical Center 912 Bronx-Lebanon Medical Center 415 Brookdale Hospital Center 530 Brooklyn Hospital Medical Center 464

Appendix H Page 20
Coney Island Hospital 371 Elmhurst Medical Center 545 Flushing Hospital Medical Center 299 Harlem Hospital Center 282 Interfaith Medical Center 287 Jacobi Medical Center 457 Jamaica Hospital Center 408 Kings County Medical Center 639 Kingsbrook Jewish Medical Center 303 Lenox Hill Hospital 632 Lincoln Medical & Mental Health 362 Maimonides Medical Center 711 Metropolitan Hospital Center 338 Montefiore Medical Center 1558 Mount Sinai Beth Israel 701 Mt Sinai Hospital 1,134 Mount Sinai West 495 New York Community Hospital-Brooklyn 212 New York Methodist Hospital 591 New York-Presbyterian/Queens 535 North Central Bronx Hospital 213 NYU Hospitals Centers 1294 Queens Hospital Center 269 Richmond University Medical 448 St. Barnabas Hospital 422 St. John's Episcopal Hospital 257 Staten Island University Hospital 666 University Hospital-Brooklyn 342 Woodhull Medical and Mental 364 Wyckoff Heights Medical Center 324 TOTAL AND PERCENT NYC 17780 17780 88%
Same as the national average (1 hospital) New York-Presbyterian Hospital 2262 2262 11%
Above the national average (1 hospital) Hospital for Special Surgery 214 214 1%
TOTAL BEDS 20256
TOTAL HOSPITALS 36

Appendix H Page 21
APPENDIX H, Hospitals and beds by Below, Same or Above National Averages PATIENT EXPERIENCE
Nassau-Suffolk-Westchester counties Below the national average (18 hospitals) Beds Glen Cove Hospital 247 Good Samaritan Hospital (West Islip) 437 Long Island Community Hospital (Brookhaven Memorial Hospital) 306 Long Island Jewish Medical Center 1,025 Mercy Medical Center 375 Montefiore - Mount Vernon Hospital 121 Montefiore - New Rochelle Hospital 223 Nassau University Medical Center 530 New York-Presbyterian Hosp (Lawrence Hospital) 288 Winthrop-University Medical Center (NYU) 591 Peconic Bay Medical Center 140 Plainview Hospital 204 South Nassau Hospital 455 Southside Hospital 300 St Catherine of Siena Hosp 306 St Joseph Hospital (Bethpage) 203 University Hospital - Stony Brook 603 Westchester Medical Center 652 TOTAL AND PERCENT GNYC SUBURBS 7006 7006 66%
Same as the national average (6 hospitals) Eastern Long Island Hospital 90 Huntington Hospital 408 North Shore University 738 Phelps Memorial Hospital 238 St John's Riverside Hospital 366 St Joseph's (Yonkers) 194 TOTAL AND PERCENT GNYC SUBURBS 2034 2014 19%
Above the national average (6 hospitals) John T Mather Mem Hospital 248 NY Presbyterian Hosp -- Hudson Valley Hospital 128 Northern Westchester Hospital 245 St Charles Hospital (Port Jefferson) 243 St Francis Hospital (Roslyn) 364 White Plains Hospital 296
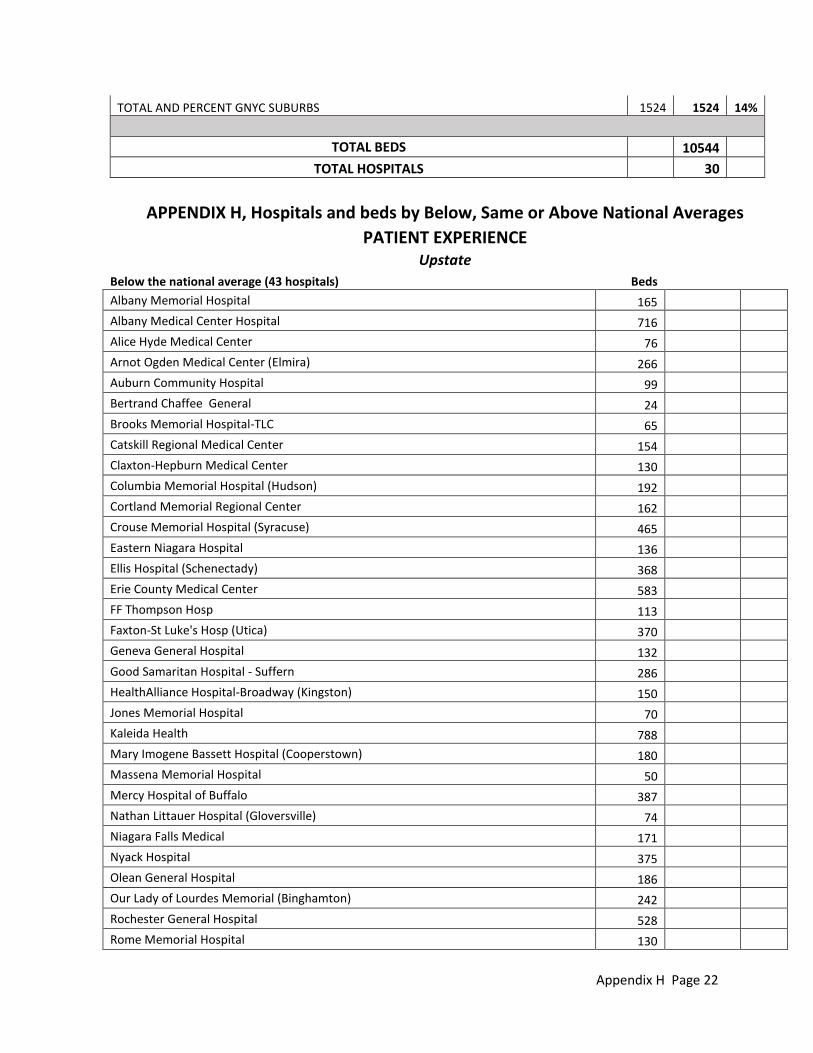
Appendix H Page 22
TOTAL AND PERCENT GNYC SUBURBS 1524 1524 14%
TOTAL BEDS 10544 TOTAL HOSPITALS 30
APPENDIX H, Hospitals and beds by Below, Same or Above National Averages
PATIENT EXPERIENCE Upstate
Below the national average (43 hospitals) Beds Albany Memorial Hospital 165 Albany Medical Center Hospital 716 Alice Hyde Medical Center 76 Arnot Ogden Medical Center (Elmira) 266 Auburn Community Hospital 99 Bertrand Chaffee General 24 Brooks Memorial Hospital-TLC 65 Catskill Regional Medical Center 154 Claxton-Hepburn Medical Center 130 Columbia Memorial Hospital (Hudson) 192 Cortland Memorial Regional Center 162 Crouse Memorial Hospital (Syracuse) 465 Eastern Niagara Hospital 136 Ellis Hospital (Schenectady) 368 Erie County Medical Center 583 FF Thompson Hosp 113 Faxton-St Luke's Hosp (Utica) 370 Geneva General Hospital 132 Good Samaritan Hospital - Suffern 286 HealthAlliance Hospital-Broadway (Kingston) 150 Jones Memorial Hospital 70 Kaleida Health 788 Mary Imogene Bassett Hospital (Cooperstown) 180 Massena Memorial Hospital 50 Mercy Hospital of Buffalo 387 Nathan Littauer Hospital (Gloversville) 74 Niagara Falls Medical 171 Nyack Hospital 375 Olean General Hospital 186 Our Lady of Lourdes Memorial (Binghamton) 242 Rochester General Hospital 528 Rome Memorial Hospital 130

Appendix H Page 23
Samaritan Hospital (Troy) 212 Samaritan Hospital (Watertown) 290 St. Elizabeth Medical Ctr (Utica) 201 St James Mercy Hospital (Hornell) 15 St Luke-Cornwall Hospital 242 St Mary's Hospital at Amsterdam 120 United Health Services - Johnson City 500 United Memorial Med Center - Batavia 111 University Hospital-SUNY (Syracuse) 409 UPMC Chautaqua WCA 277 Vassar Brothers Center 365 TOTAL AND PERCENT UPSTATE 10575 10575 64%
Same as the national average (21 hospitals) Aurelia Osborn Fox Memorial Center 53 Bon Secours Community Hospital 122 Canton-Potsdam Hospital 94 Cayuga Medical Center at Ithaca 212 Champlain Valley Hospital (Plattsburg) 300 Chenango Memorial Hospital (Norwich) 58 Clifton Springs Hospital 154 Corning Hospital 65 Glens Falls Hospital 410 Highland Hospital (Rochester) 261 Kenmore Mercy Hospital (Buffalo) 184 Mount St Mary's Hospital (Lewiston) 175 Newark-Wayne Community Hospital 120 Nicholas H Noyes Memorial Hospital (Danville) 67 Orange Regional MedicalCenter 383 Oswego Hospital 132 Sisters of Charity Hospital (Buffalo) 290 St Joseph's Hospital (Syracuse) 454 St. Peter's Hospital (Albany) 442 Strong Memorial Hospital (Rochester) 838 Unity Hospital of Rochester 311 TOTAL AND PERCENT UPSTATE 5125 5125 31%
Above the national average (7 hospitals) Adirondack Medical Center 95 Northern Dutchess Hospital 84 Oneida Healthcare 101

Appendix H Page 24
Putnam Hospital Center 164 Saratoga Hospital 171 St. Anthony Community Hosp 60 Wyoming County Hospital 62 TOTAL AND PERCENT UPSTATE 737 737 4%
TOTAL BEDS 16437 TOTAL HOSPITALS 71
N/A Cobleskill Regional Hospital 40 Ira Davenport Memorial Hospital 35 St Joseph's Hospital-Elmira 125 St Mary's Hospital -Troy 186
APPENDIX H, Hospitals and beds by Below, Same or Above National Averages
MORTALITY New York City
Below the national average (2 hospitals) Beds Jamaica Hospital Center 408 St. John's Episcopal Hospital 257 TOTAL AND PERCENT NYC 665 665 3%
Same as the national average (20 hospitals) Bellevue Medical Center 912 Bronx-Lebanon Medical Center* 415 Brookdale Hospital Center 530 Brooklyn Hospital Medical Center 464 Coney Island Hospital 371 Elmhurst Medical Center 545 Flushing Hospital Medical Center 299 Harlem Hospital Center 282 Interfaith Medical Center 287 Jacobi Medical Center 457 Kings County Medical Center 639 Lincoln Medical & Mental Health 362 Metropolitan Hospital Center 338 Queens Hospital Center 269 Richmond University Medical 448 St. Barnabas Hospital 422 Staten Island University Hospital 666 University Hospital-Brooklyn 342

Appendix H Page 25
Woodhull Medical and Mental 364 Wyckoff Heights Medical Center 324 TOTAL AND PERCENT NYC 8736 8736 44%
Above the national average (12 hospitals) Kingsbrook Jewish Medical Center 303 Lenox Hill Hospital 632 Maimonides Medical Center 711 Montefiore Medical Center 1558 Mount Sinai Beth Israel 701 Mt Sinai Hospital 1,134 Mount Sinai West 495 New York Community Hospital-Brooklyn 212 New York Methodist Hospital 591 New York-Presbyterian Hospital 2262 New York-Presbyterian/Queens 535 NYU Hospitals Centers 1294 TOTAL AND PERCENT NYC 10428 10428 53%
TOTAL BEDS 19829
TOTAL HOSPITALS 34 N/A Hospital for Special Surgery 214 North Central Bronx Hospital 213
APPENDIX H, Hospitals and beds by Below, Same or Above National Averages MORTALITY
Nassau-Suffolk-Westchester Below the national average (1 hospital) Beds Nassau University Medical Center 530 TOTAL AND PERCENT GNYC SUBURBS 530 530 6%
Same as the national average (18 hospitals) Eastern Long Island Hospital 90 Glen Cove Hospital 247 Good Samaritan Hospital - West Islip 437 Mercy Medical Center 375 Montefiore - Mount Vernon Hospital 121 Montefiore - New Rochelle Hospital 223 New York-Presbyterian Hosp (Lawrence Hospital) 288 NY Presbyterian Hosp -- Hudson Valley Hospital 128 Peconic Bay Medical Center 140

Appendix H Page 26
Phelps Memorial Hospital 238 South Nassau Hospital 455 Southside Hospital 300 St Catherine of Siena Hosp 306 St Charles Hospital - Port Jefferson 243 St Joseph Hospital - Bethpage 203 St Joseph's-Yonkers 194 Westchester Medical Center 652 White Plains Hospital 296 TOTAL AND PERCENT GNYC SUBURBS 4936 4936 47%
Above the national average (11 hospitals) Huntington Hospital 408 John T Mather Memorial Hospital 248 Long Island Community Hospital (Brookhaven Mem Hosp) 306 Long Island Jewish Medical Center 1,025 North Shore University 738 Northern Westchester Hospital 245 Winthrop-University Medical Center (NYU) 591 Plainview Hospital 204 St Francis Hospital (Roslyn) 364 St John's Riverside Hospital 366 University Hospital - Stony Brook 603 TOTAL AND PERCENT GNYC SUBURBS 5098 5098 48%
TOTAL BEDS 10564
TOTAL HOSPITALS 30
APPENDIX H, Hospitals and beds by Below, Same or Above National Averages MORTALITY
Upstate Below the national average (11 hospitals) Beds Cayuga Medical Center at Ithaca 212 Eastern Niagara Hospital 136 Faxton-St Luke's Hosp (Utica) 370 Geneva General Hospital 132 Glens Falls Hospital 410 Jones Memorial Hospital 70 Kaleida Health 788 Mercy Hospital of Buffalo 387

Appendix H Page 27
Oneida Healthcare 101 St Mary's Hospital at Amsterdam 120 United Health Services - Johnson City 500 TOTAL AND PERCENT UPSTATE 3226 3226 19%
Same as the national average (55 hospitals) Adirondack Medical Center 95 Albany Memorial Hospital 165 Albany Medical Center Hospital 716 Alice Hyde Med Center 76 Arnot Ogden Medical Center (Elmira) 266 Auburn Community Hospital 99 Aurelia Osborn Fox Memorial Center 53 Bertrand Chaffee General 24 Bon Secours Community Hospital 122 Brooks Memorial Hospital-TLC 65 Catskill Regional Medical Center 154 Chenango Memorial Hospital (Norwich) 58 Claxton-Hepburn Medical Center 130 Clifton Springs Hospital 154 Cobleskill Regional Hospital 40 Columbia Memorial Hospital (Hudson) 192 Corning Hospital 65 Crouse Memorial Hospital (Syracuse) 465 Ellis Hospital (Schenectady) 368 Erie County Medical Center 583 FF Thompson Hospital 113 Good Samaritan Hospital (Suffern) 286 HealthAlliance Hospital-Broadway (Kingston) 150 Highland Hospital (Rochester) 261 Ira Davenport Memorial Hospital 35 Kenmore Mercy Hospital (Buffalo) 184 Mary Imogene Bassett Hospital (Cooperstown) 180 Massena Memorial Hospital 50 Mount St Mary's Hospital (Lewiston) 175 Nathan Littauer Hospital (Gloversville) 74 Newark-Wayne Community Hospital 120 Niagara Falls Medical 171 Nicholas H Noyes Memorial Hospital (Danville) 67 Northern Dutchess Hospital 84 Olean General Hospital 186

Appendix H Page 28
Oswego Hospital 132 Our Lady of Lourdes Memorial (Binghamton) 242 Putnam Hospital Center 164 Rome Memorial Hospital 130 Samaritan Hospital (Troy) 212 Samaritan Hospital (Watertown) 290 Saratoga Hospital 171 Sisters of Charity Hospital (Buffalo) 290 St. Anthony Community Hospital 60 St. Elizabeth Medical Center (Utica) 201 St James Mercy Hosp (Hornell) 15 St Luke-Cornwall Hospital 242 St Mary's Hospital (Troy) 186 Strong Memorial Hospital (Rochester) 838 United Memorial Med Center (Batavia) 111 Unity Hospital of Rochester 311 University Hospital-SUNY (Syracuse) 409 UPMC Chautaqua WCA 277 Vassar Brothers Center 365 Wyoming County Hospital 62 TOTAL AND PERCENT UPSTATE 10734 10734 64%
Above the national average (8 hospitals) Canton-Potsdam Hospital 94 Champlain Valley Hospital (Plattsburg) 300 Cortland Memorial Regional Center 162 Nyack Hospital 375 Orange Regional Medical Center 383 Rochester General Hospital 528 St Joseph's Hospital (Syracuse) 454 St. Peter's Hospital (Albany) 442 TOTAL AND PERCENT UPSTATE 2738 2738 16%
TOTAL BEDS 16698
TOTAL HOSPITALS 74 N/A St Joseph's Hospital (Elmira)

CODE BLUENEW YORK HOSPITALS' POOR QUALITY
PERFORMANCE