coastal protection - welcome to nyc.gov | city of new york · 2013-08-29coastal protection -...
TRANSCRIPT
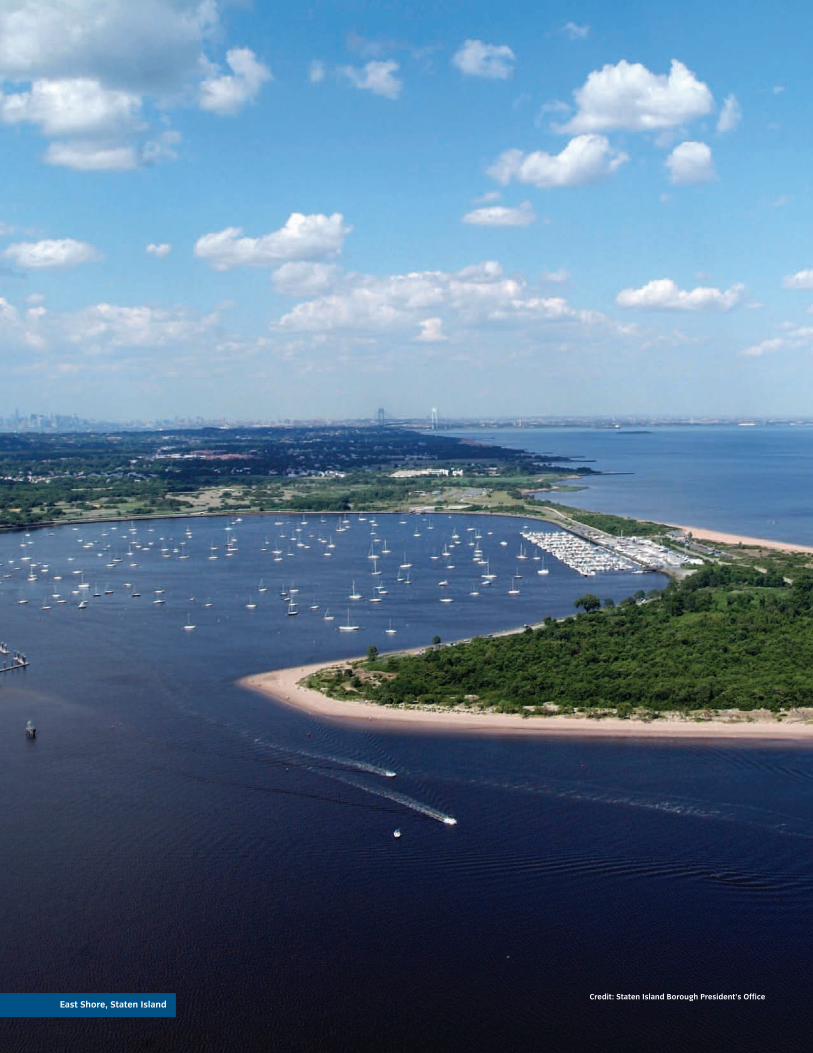
East Shore, Staten Island
Credit: to follow
East Shore, Staten IslandCredit: Staten Island Borough President’s Office
CHAPTER 3 | COASTAL PROTECTION 38
Coastal Protection

A STRONGER, MORE RESILIENT NEW YORK39
Historic wetlands from “Nature’s Estuary: The Historic Tidelands of New York New Jersey Estuary” Regional Plan A ssociation, 2003. Historic data compiled by George Colbert and Guenter Vollath from 19th century U.S. Geological Survey, U.S. Coast and Geodetic Survey, New Jersey Geological Survey and the Ratzer Survey of 1776-1777.
Historic Natural Features
New York City’s Coastline: Then and Now
CHAPTER 3 | COASTAL PROTECTION 40
When Henry Hudson sailed into what isnow known as New York Harbor in 1609,the coastline he encountered was a won-drous place. Archipelagos of small islands dot-ted near-shore waters. Wetlands and oysterbeds stretched for miles. Sloping beaches laydazzling under the sun. The harbor coastlineprovided abundant food sources and naturalprotection from storms. It would prove essen-tial to the survival and growth of the early set-tlement of New Amsterdam. (See map: NewYork City’s Coastline: Then and Now)
This coastline is just as essential to New YorkCity’s survival and growth today.
Not surprisingly, New York City’s coastline—which stretches a total of 520 miles and islonger than the coastlines of Miami, Boston, LosAngeles, and San Francisco combined—haschanged dramatically since the 17th century.The inhabitants of New York City have altered itsvery topography in many ways, dredging water-ways to ease the way for shipping, constructingpiers and bulkheads, and even using fill to re-shape the shoreline's contours. While some ofthe historic natural features that once protectedwhat is today New York City have been lost inthe process, the changes that were made haveenabled commerce and industry to flourish,neighborhoods to thrive, and infrastructure toperform critical functions.
Notwithstanding the important role played bythe city’s waterfront through most of its history,during the last decades of the 20th century,large sections of the coastline fell into disuseand disrepair. In recent years, however, the cityhas begun to reconnect with this critical asset. These new connections have taken many forms, from investments in the working waterfront to new housing, parks, and ferrylandings. As much as this renewed embrace ofwhat Mayor Bloomberg has referred to as the"sixth borough" has benefitted its citizenry,New York’s reengagement with its coastline has also occurred out of necessity—as the cityhas sought to meet the needs of a growing population and expanding economy.
However, even as the city has reconnected withits waterfront, New Yorkers have known thatproximity to the water brings with it certainchallenges, especially as global climate changeadvances—a threat discussed in detail inPlaNYC, the City’s sustainability plan, in 2007.Thus, in 2011, building on PlaNYC, the City released Vision 2020: The New York City Comprehensive Waterfront Plan, the center-piece of an effort known as the Waterfront Vision and Enhancement Strategy, or WAVES.This effort set forth broad goals for the shore-line of New York City, including, of course, increased climate resiliency. To this end, the
report’s accompanying WAVES Action Agendaput forth specific initiatives that already havehelped to create a waterfront that is more productive and better prepared for the future.
In October 2012, with the arrival of Sandy, thecase for increased climate resiliency—even beyond the initiatives set forth in the WAVESAction Agenda—was forcefully made to all NewYorkers. The storm scoured beaches along NewYork City’s ocean-facing coastline, damagingbuildings and infrastructure, flooding neighbor-hoods, causing dangerous erosion, and mostseriously, killing 43 New Yorkers. Areas alongthe Hudson and East Rivers and the other wa-terways in the Upper Bay, meanwhile, experi-enced record-setting flooding, along withdamage and destruction to building systems,business inventory, and personal property.
As the impacts of climate change accelerate overtime, more damage, more flooding, and moreerosion are likely in New York, with sea levels continuing to rise and more of the most intensestorms expected. In response to these challenges, the City believes that it must bulk upits defenses, improving the coastline with protec-tive measures. This will not eliminate all floodingfrom all conceivable storms—an impossiblegoal—but mitigate the effects of sea level risewhere the risk is greatest and reduce the effectsof storm waves and storm flooding significantly.
Reaching these resiliency goals—and protectingall of the waterfront assets along the coastlinemore effectively—requires a deliberate and coordinated approach. This chapter seeks toachieve this goal, presenting the City’s new,comprehensive coastal protection plan.
The plan articulates a full menu of proposedcoastal protection measures tailored to the specific geomorphology of (described below) andrisks facing neighborhoods that are most exposed.These measures, though complementary, also canbe implemented independently over time, basedon available funding and relative priority. Thoughultimately the city will be best served by imple-menting the entire suite of options, this report setsforth an initial set of projects that targets areas thathave particularly large concentrations of busi-nesses or residents (or both), areas that house crit-ical infrastructure, and areas that shelter especiallyvulnerablepopulations. Though these projects stillcome at significant cost, they have been scaled insuch a way that the City believes that they not onlycan but should get under way immediately.
Of course, the City cannot implement thesenew coastal protection measures alone. Imple-menting them will require partnerships with theFederal government, likely through the USArmy Corps of Engineers (USACE), and otherregional stakeholders and governmental
entities. To make these new coastal measuresas effective as possible, the City itself also willhave to improve the way that it administers theshoreline that it controls, ensuring better man-agement, design, and operation of its coastalassets—something that this chapter also ad-dresses. Finally, this chapter also will call on thevarious regulatory bodies with responsibility forpermitting along the waterfront in New YorkCity—from the City, to the State, to the Federalgovernment—to work together to clarify, sim-plify, and simultaneously make more effectivethe process of permitting, both in general andfor critical flood-protection projects.
Over the centuries, the coastline of New YorkCity has been a sparkling natural resource, asetting for commerce and industry, and a placefor housing and recreation. Going forward, italso can reprise a role that it played ably in theearly days of New Amsterdam and before.Namely, to provide protection to the peopleliving along and behind this coastline.
The New York City Coastline
The city’s 520-mile coastline—bordering theocean, as well as rivers, bays, and inlets—isboth diverse and complex. To understand thiscoastline, it is critical to understand its geomor-phology—or the combination of its naturallandforms, underlying geological conditions,and built condition. The geomorphology oftoday's city is largely the result of a colossal gla-cier that moved over what is now New York City over 20,000 years ago, combined with thecoastal modifications that inhabitants havemade in more recent times. This complexity is,in turn, amplified not just in the diverse usesand multiple property owners found today allalong the water’s edge across the city, but alsoby the many regulators with responsibility forthe coastline's protection.
The Geomorphology of the New York City CoastlineNew York City’s southernmost waterfrontareas—the Rockaway Peninsula, the Coney Is-land peninsula, and the East and South Shoresof Staten Island—generally are characterizedby gently sloping sandy beaches with some nat-ural and built dunes, as well as discrete areascontaining elevated bluffs. In places, groins(rock and timber structures perpendicular tobeaches) and other reinforced structures havebeen installed to protect these beaches. Communities in these areas typically are lessdensely populated than other parts of New YorkCity, though they also tend to be much moredensely populated than other coastal areasalong the eastern seaboard.
A STRONGER, MORE RESILIENT NEW YORK41
Within Jamaica Bay, one of the region’s mostimportant and largest natural features, thereare many natural edges and marsh islands,some newly reconstituted. Here, portions ofthe shoreline have been filled in and hardenedwith bulkheads (vertical retaining walls) andrevetments (shoreline protection constructedwith armor stone). Many of the areas surround-ing Jamaica Bay are particularly low-lying, a re-sult of the glacial outwash plains that wereformed at the end of the last Ice Age. Along andwithin Jamaica Bay and its tributaries, there area wide array of neighborhoods, as well as several elements of critical city infrastructure,including transportation assets such as John F.Kennedy (JFK) Airport, marine terminals, andwastewater treatment plants.
Further north and within the Upper Bay—theareas along the Hudson and East River shorelines of Manhattan, Brooklyn, and Queens,as well as on the North Shore of Staten Island—the topography historically rose quickly togreater elevations along the coast. However, significant use of landfill to extend the coastlineand the filling and development of former marsh-land have altered the waterfront significantlyover the past three centuries, with large areasalong these coasts now lying at or near the waterlevel. Examples of these low-lying areas includethe southern parts of Manhattan, East Harlem,Red Hook, and the areas adjacent to theGowanus Canal and Newtown Creek in Brooklynand Queens. Generally, in these areas, coastaledges have been hardened extensively over timewith bulkheads, revetments, and piers supportingmaritime, industrial, commercial, residential, andtransportation uses.
In the northernmost waterfront areas of thecity, the shorelines are quite varied. Some partsare naturally rocky, such as along City Islandand Eastchester Bay. Other areas, by contrast,including Orchard Beach, have more gentlysloping, sandy edges, some of which are man-made. Along the northern Queens waterfrontas well as along large sections of the Harlemand Hudson Rivers in northern Manhattan andthe Bronx, the topography is generally quitesteep with high bluffs in some neighborhoods.Along parts of the east and south Bronx water-front, meanwhile, land tends to slope moregently up from the water’s edge. A variety offilled land and hardened edges, such as bulk-heads and revetments, have been put in placethroughout the area over time, with some natural areas reintroduced and restored, suchas at Alley Creek in Queens. The land uses in thecity's northern waterfront areas are quite diverse, ranging from key infrastructure such asLaGuardia Airport and the multiple powerplants in Astoria, Queens, to the Hunts PointFood Distribution Center in the Bronx, to single-
family homes on City Island and large, multi-family developments such as Co-Op City in thenortheast Bronx.
Generally, New York City’s coastline does nothave purpose-built coastal defenses; many ofthe features that serve this function do so coin-cidentally, rather than by design. For example,recreational beaches—nourished (i.e., pro-vided with additional sand to supplement andreplace sand lost to erosion) and expandedover time in a partnership between the Depart-ment of Parks & Recreation (DPR) and theUSACE—generally have been engineered withrecreational goals in mind, though they alsoprovide important protection for adjacentneighborhoods. The city’s remaining wetlandsand natural areas, which, until recently, oftenwere viewed as underutilized property thatcould be filled and developed, also play an im-portant protective role, serving to bufferinland areas. Meanwhile, though the coastlineis dotted with many of the city's most belovedparks, it is only in recent years that the designsof these recreational areas, such as at BrooklynBridge Park and Governors Island, have deliberately incorporated discrete resiliencymeasures that could provide a model for otherparks. Finally, the city’s ubiquitous bulkheadsalso play a role in defending the city from harm,not only holding the land behind them inplace—their intended purpose—but alsobreaking waves during storms.
Because of the uncoordinated fashion in whichthey were constructed over time, however,these various features, even where they doserve a defensive purpose, lack the robustness,comprehensiveness, and adaptability that thenew era of climate change demands.
Regulatory Framework for the CoastlineOver a dozen City, State, and Federal agenciesplay a role in regulating New York City's waterfront and many waterways. In somecases, efforts by these agencies are not completely aligned. This lack of unified and coordinated regulatory oversight can lead todelayed and unpredictable waterfront activity,complicating the achievement of importantpublic goals, including coastal resiliency.
On the City level, one organization with an im-portant regulatory role is the City Planning Commission, which enacts zoning, reviews landuse, and is the local administrator of the Water-front Revitalization Program, a State program required under the Coastal Zone ManagementAct. The Department of Small Business Services(SBS), meanwhile, oversees waterfront construc-tion activity through its dockmaster and waterfront permit units.
At the State level, a key role is played by the NewYork State Department of State, which monitorsconsistency of Federal actions against the Stateand City Coastal Management Program policies.
Previous Coastal Protection Studies of New York CityAlthough this report contains the City’s first comprehensive coastal protection plan, many studies conducted in partnership with the US Army Corps of Engineers (USACE) andthe State over the years have addressed the need for coastal protections. Some studies—such as those for the Rockaway Peninsula (initially authorized in 1965), Coney Island (1986),and Orchard Beach (1992)—led to beach nourishment projects that included popular recre-ational components. Other studies that were focused more directly on flood protection, suchas the Hurricane and Storm Damage Reduction Project for the South Shore of Staten Island, authorized in 1993, were left uncompleted due to a lack of funding and consensus and haveonly recently been relaunched and fully funded.
By contrast, a study of Plumb Beach, Brooklyn is a notable success story. The study recommended a reconstituted beach, which was completed in 2012, just days before Sandy,providing significant protection to the Belt Parkway during the storm.
Another important study is the Hudson-Raritan Estuary Comprehensive Restoration Plan. Thisplan was released in May 2009 by the USACE and the Port Authority of New York & New Jersey,in partnership with the New York New Jersey Harbor Estuary Program. The plan is targeted atimproving 11 ecosystem types within the estuary. Though the plan does not focus on floodprotection, there is now an opportunity to leverage its findings to achieve ecosystem andflood protection benefits in the areas adjacent to the relevant ecosystems.
Notwithstanding all of the foregoing, a comprehensive flood protection study for the UpperNew York Bay, one of the most densely populated and economically important waterways inthe world, has never even been undertaken—let alone completed. The opportunity presentedby the USACE’s North Atlantic Coast Comprehensive Study, which was authorized by Congressin January 2013 and will evaluate flood risks of vulnerable coastal populations in areas affectedby Sandy, must not be wasted.
CHAPTER 3 | COASTAL PROTECTION 42
At the same time, the State Department of Environmental Conservation regulates in-wateractivities, wetlands, and other coastal uses byissuing permits, including water quality certifi-cations, and enforces the Coastal Erosion Haz-ard Area, pursuant to which the State regulates,and generally seeks to discourage, the con-struction of hardened structures in areas of higherosion risk like beaches.
Finally, the Federal government’s regulatoryreach is distributed among many agencies, withthe USACE, which has broad authority over thewaters of the United States, typically serving asthe coordinating body for many Federal agencies,including the US Fish and Wildlife Service and theEnvironmental Protection Agency. Among theUSACE's responsibilities in New York Harbor areregulating its navigable waterways, implementinglocal public works projects, and protecting againstflood risks, all as authorized by Congress. The USCoast Guard also plays a vital role in New YorkHarbor, regulating vessel traffic and coordinatingother waterway activities.
Prior to Sandy, the City had partnered with theUSACE and the State on several studies to eval-uate protections for vulnerable communities inNew York City. These studies typically were initiated following major storms, and some ledto important projects that have been completedor are underway. In other cases, though, studieslanguished due to a lack of consensus on solu-tions. Moreover, despite the existence of manyvulnerable and densely populated coastal areasin New York City, no comprehensive flood protection studies have ever been undertakenfor the Manhattan, Brooklyn, Queens, and Bronxriverfronts, or for other areas of the Upper Bay.(See sidebar: Previous Coastal Protection Studies of New York City)
Until recently, the types of storms that haveprompted studies on coastal protections haveoccurred infrequently. As a result, followingthese storms, interest in protection tended towane, with impacted coastal communitiesoften unable to secure the requisite fundingneeded to move forward with more effectiveprotection measures. Sandy, however, has focused renewed attention on the need forsuch measures in New York City and broughtinto better focus the risks that extreme weatherposes for the coast.
What Happened During Sandy
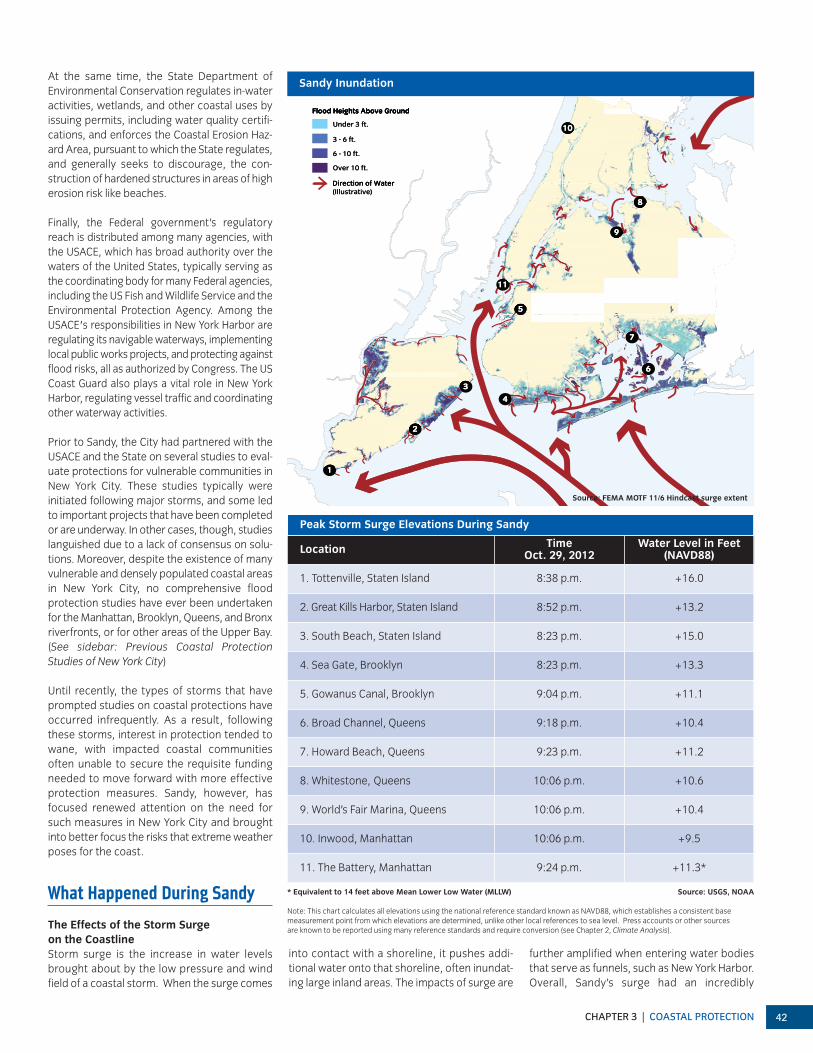
The Effects of the Storm Surge on the CoastlineStorm surge is the increase in water levelsbrought about by the low pressure and windfield of a coastal storm. When the surge comes
into contact with a shoreline, it pushes addi-tional water onto that shoreline, often inundat-ing large inland areas. The impacts of surge are
further amplified when entering water bodiesthat serve as funnels, such as New York Harbor.Overall, Sandy’s surge had an incredibly
Under 3 ft.
3 - 6 ft.
6 - 10 ft.
Over 10 ft.
Flood Heights Above Ground
1
2
3
4
5
6
7
8
9
11
10
Direction of Water(Illustrative)
Flood Heights Above GroundFlood Heights Above Ground
3 - 6 ft.
Under 3 ft.
Flood Heights Above Ground
Over 10 ft.
6 - 10 ft.
Flood Heights Above Ground
10
(Illustrative)Direction of WaterDirection of Water
8
9
5
11
6
7
2
3
4
1
Sandy Inundation
Location Time Oct. 29, 2012
Water Level in Feet(NAVD88)
1. Tottenville, Staten Island 8:38 p.m. +16.0
2. Great Kills Harbor, Staten Island 8:52 p.m. +13.2
3. South Beach, Staten Island 8:23 p.m. +15.0
4. Sea Gate, Brooklyn 8:23 p.m. +13.3
5. Gowanus Canal, Brooklyn 9:04 p.m. +11.1
6. Broad Channel, Queens 9:18 p.m. +10.4
7. Howard Beach, Queens 9:23 p.m. +11.2
8. Whitestone, Queens 10:06 p.m. +10.6
9. World’s Fair Marina, Queens 10:06 p.m. +10.4
10. Inwood, Manhattan 10:06 p.m. +9.5
11. The Battery, Manhattan 9:24 p.m. +11.3*
Peak Storm Surge Elevations During Sandy
Source: FEMA MOTF 11/6 Hindcast surge extent
* Equivalent to 14 feet above Mean Lower Low Water (MLLW) Source: USGS, NOAA
Note: This chart calculates all elevations using the national reference standard known as NAVD88, which establishes a consistent base measurement point from which elevations are determined, unlike other local references to sea level. Press accounts or other sources are known to be reported using many reference standards and require conversion (see Chapter 2, Climate Analysis).
A STRONGER, MORE RESILIENT NEW YORK43
destructive impact on the coastline of NewYork City, though different sections of thecoastline experienced the storm differentlyand with different consequences. (See map:Sandy Inundation)
Generally, Sandy's coastal inundation took oneof three forms. First, floodwaters came directlyfrom the ocean, as water surged over beachesand bulkheads, flooding neighborhoods andcritical infrastructure such as tunnels. Extremewater levels were seen citywide as the stormpeaked in the evening of October 29, 2012. (See chart: Peak Storm Surge Elevations During Sandy)
In many cases, in ocean-facing areas such asSouthern Brooklyn, South Queens, and the Eastand South Shores of Staten Island, from SouthBeach to Tottenville, the surge brought with itnot just large volumes of water but also powerful waves that wreaked havoc on buildingsand infrastructure alike. Record ocean waves of over 30 feet were measured in the oceansoutheast of the Rockaway Peninsula.
Another impact of the wave action along thecity's ocean-facing coastline was massivebeach erosion. In fact, estimates indicate that
up to 3 million cubic yards of sand, and maybemore, were lost citywide, with the RockawayPeninsula alone losing about 1.5 million cubicyards of sand (a volume larger than the EmpireState Building) and additional losses occurringin Coney Island, Orchard Beach, and the Eastand South Shores of Staten Island.
The second way Sandy's surge impacted thecity was via less direct routes. In these cases,the city's many bays, inlets, and creeks func-tioned as “backdoor” channels, funneling oceanwaters inland. For example, much of the flood-ing in Southern Brooklyn came not only over thearea’s beaches, but also via Coney Island Creekand Sheepshead Bay. Likewise, floodwatersfrom Jamaica Bay contributed to the inundationof the Rockaway Peninsula, where, as area resi-dents explained, "the ocean met the bay." New-town Creek, meanwhile, overflowed its banks,flooding Maspeth, Greenpoint, East Williams-burg, and Bushwick. Similarly, the GowanusCanal overflowed its banks, flooding Red Hookand other adjacent neighborhoods.
The third way Sandy's surge impacted NewYork City was by overtopping the city’s exten-sive shoreline drainage infrastructure, and insome cases infiltrating the roadway drainage
and sewer system through catch basins, man-holes, and storm drains in the streets, especiallyin low-lying areas such as in Midland Beach,Staten Island. This network of pipes and otherfeatures is designed to drain rainwater awayfrom land and into the area's waterways and isnot designed to protect against storm surge.Additionally, several tide gates and floodgates(devices that prevent water from flowing back-wards through the drainage system)—includingat Oakwood Beach, Staten Island—were damaged during the storm, while others, including at Flushing Meadows Corona Park, lostpower and had to be operated manually duringSandy, amid the overwhelming volume of waterthat they were being asked to handle.
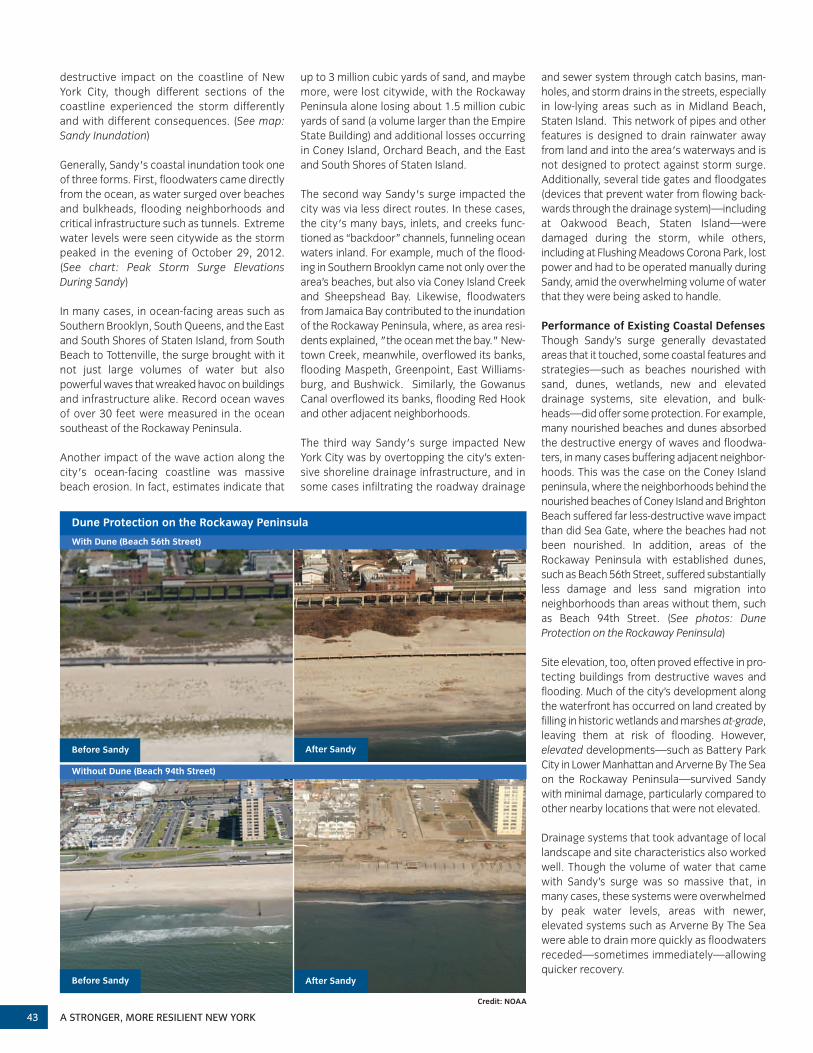
Performance of Existing Coastal DefensesThough Sandy’s surge generally devastatedareas that it touched, some coastal features andstrategies—such as beaches nourished withsand, dunes, wetlands, new and elevateddrainage systems, site elevation, and bulk-heads—did offer some protection. For example,many nourished beaches and dunes absorbedthe destructive energy of waves and floodwa-ters, in many cases buffering adjacent neighbor-hoods. This was the case on the Coney Islandpeninsula, where the neighborhoods behind thenourished beaches of Coney Island and BrightonBeach suffered far less-destructive wave impactthan did Sea Gate, where the beaches had notbeen nourished. In addition, areas of the Rockaway Peninsula with established dunes,such as Beach 56th Street, suffered substantiallyless damage and less sand migration into neighborhoods than areas without them, suchas Beach 94th Street. (See photos: Dune Protection on the Rockaway Peninsula)
Site elevation, too, often proved effective in pro-tecting buildings from destructive waves andflooding. Much of the city’s development alongthe waterfront has occurred on land created byfilling in historic wetlands and marshes at-grade,leaving them at risk of flooding. However, elevated developments—such as Battery ParkCity in Lower Manhattan and Arverne By The Seaon the Rockaway Peninsula—survived Sandywith minimal damage, particularly compared toother nearby locations that were not elevated.
Drainage systems that took advantage of locallandscape and site characteristics also workedwell. Though the volume of water that camewith Sandy’s surge was so massive that, inmany cases, these systems were overwhelmedby peak water levels, areas with newer, elevated systems such as Arverne By The Seawere able to drain more quickly as floodwatersreceded—sometimes immediately—allowingquicker recovery.
Before Sandy After Sandy
Before Sandy After Sandy
With Dune (Beach 56th Street)
Without Dune (Beach 94th Street)
Credit: NOAA
Dune Protection on the Rockaway Peninsula
CHAPTER 3 | COASTAL PROTECTION 44
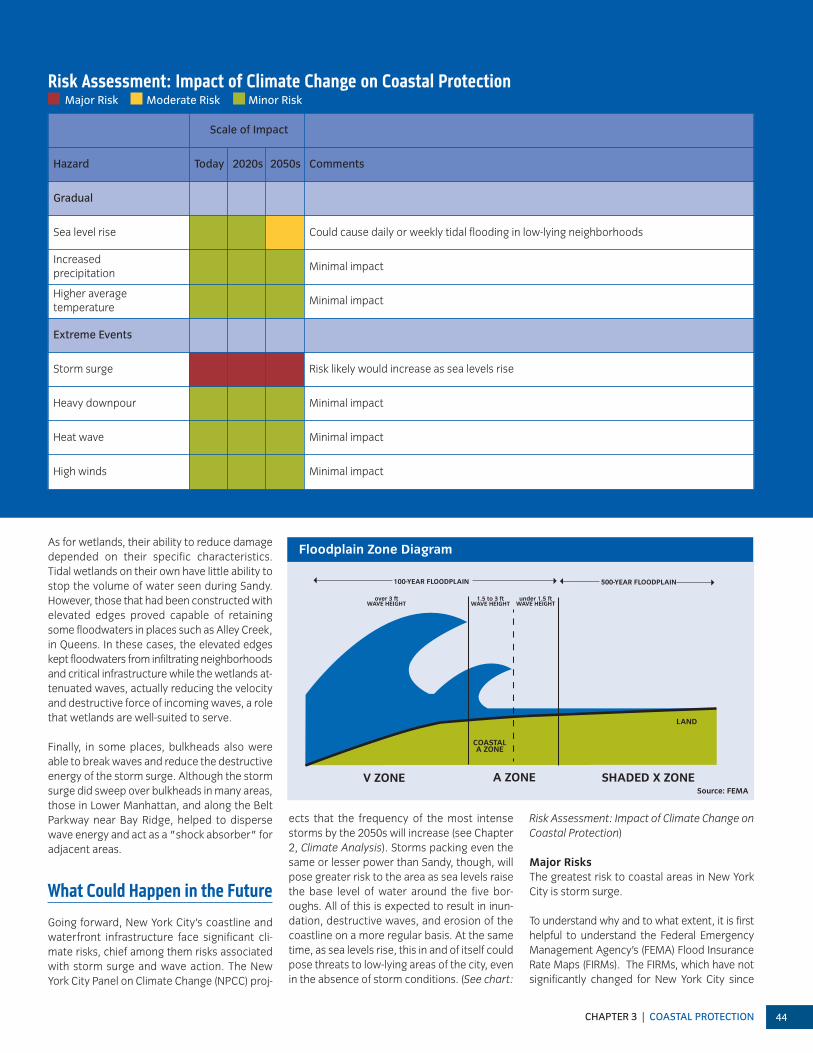
Risk Assessment: Impact of Climate Change on Coastal ProtectionMajor Risk Moderate Risk Minor Risk
Scale of Impact
Hazard Today 2020s 2050s Comments
Gradual
Sea level rise Could cause daily or weekly tidal flooding in low-lying neighborhoods
Increased precipitation
Minimal impact
Higher average temperature
Minimal impact
Extreme Events
Storm surge Risk likely would increase as sea levels rise
Heavy downpour Minimal impact
Heat wave Minimal impact
High winds Minimal impact
As for wetlands, their ability to reduce damagedepended on their specific characteristics.Tidal wetlands on their own have little ability tostop the volume of water seen during Sandy.However, those that had been constructed with elevated edges proved capable of retainingsome floodwaters in places such as Alley Creek,in Queens. In these cases, the elevated edgeskept floodwaters from infiltrating neighborhoodsand critical infrastructure while the wetlands at-tenuated waves, actually reducing the velocityand destructive force of incoming waves, a rolethat wetlands are well-suited to serve.
Finally, in some places, bulkheads also wereable to break waves and reduce the destructiveenergy of the storm surge. Although the stormsurge did sweep over bulkheads in many areas,those in Lower Manhattan, and along the BeltParkway near Bay Ridge, helped to dispersewave energy and act as a "shock absorber" foradjacent areas.
What Could Happen in the Future
Going forward, New York City’s coastline andwaterfront infrastructure face significant cli-mate risks, chief among them risks associatedwith storm surge and wave action. The NewYork City Panel on Climate Change (NPCC) proj-
ects that the frequency of the most intensestorms by the 2050s will increase (see Chapter2, Climate Analysis). Storms packing even thesame or lesser power than Sandy, though, willpose greater risk to the area as sea levels raisethe base level of water around the five bor-oughs. All of this is expected to result in inun-dation, destructive waves, and erosion of thecoastline on a more regular basis. At the sametime, as sea levels rise, this in and of itself couldpose threats to low-lying areas of the city, evenin the absence of storm conditions. (See chart:
Risk Assessment: Impact of Climate Change onCoastal Protection)
Major RisksThe greatest risk to coastal areas in New YorkCity is storm surge.
To understand why and to what extent, it is firsthelpful to understand the Federal EmergencyManagement Agency’s (FEMA) Flood InsuranceRate Maps (FIRMs). The FIRMs, which have notsignificantly changed for New York City since
V ZONE A ZONE SHADED X ZONE
over 3 ftWAVE HEIGHT
1.5 to 3 ftWAVE HEIGHT
under 1.5 ftWAVE HEIGHT
COASTALA ZONE
100-YEAR FLOODPLAIN 500-YEAR FLOODPLAIN
LAND
Floodplain Zone Diagram
Source: FEMA
A STRONGER, MORE RESILIENT NEW YORK45
1983, represent the Federal government’s assess-ment of coastal flood risk. They serve multiplepurposes, including helping to determine premi-ums under the National Flood Insurance Program(NFIP) and triggering certain flood insurance re-quirements on Federally backed mortgages (SeeChapter 5, Insurance). These maps divide coastalareas into several zones of vulnerability:
• A Zones: the 100-year floodplain—an areathat has a 1 percent or greater chance offlooding in any given year;
• V Zones: the portion of the 100-year flood-plain subject to high-velocity wave action (de-fined as a 3 foot or greater breaking wave);
• Coastal A Zones: the portion of the 100-yearfloodplain subject to breaking waves between1.5 and 3 feet; and
• Shaded X Zones: the 500-year floodplain—an area that has a 0.2 percent or greaterchance of flooding in any given year. (Seegraphic: Floodplain Zone Diagram)
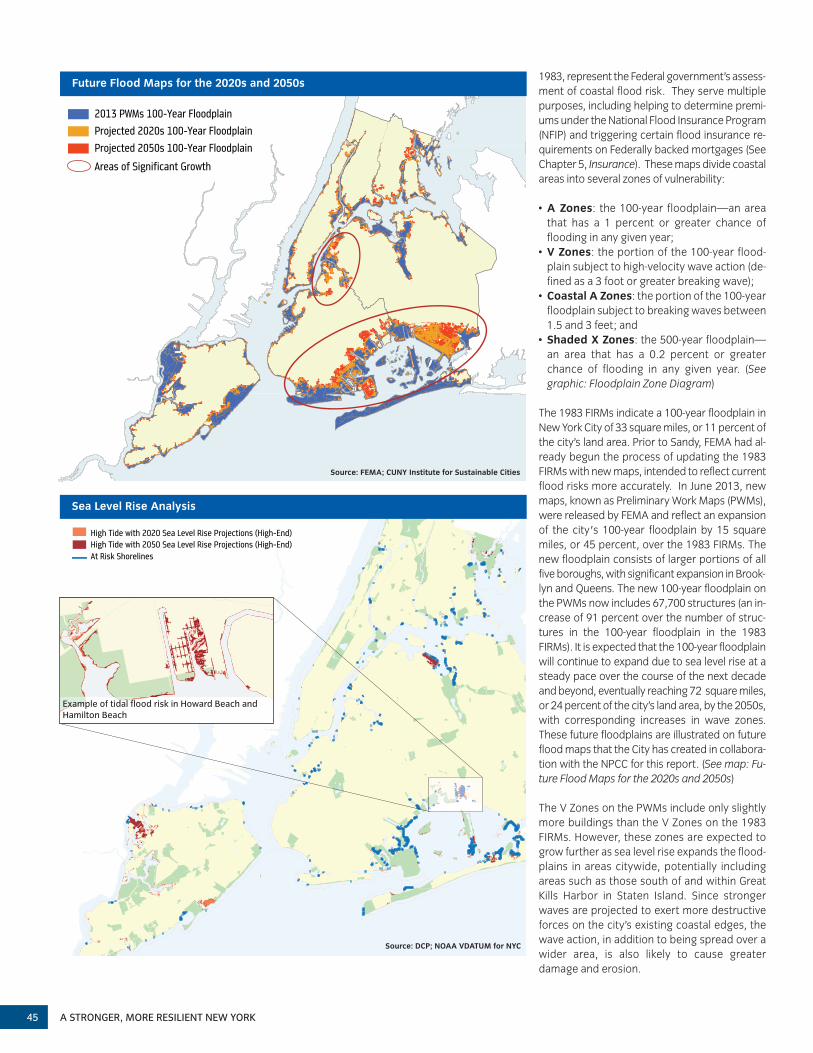
The 1983 FIRMs indicate a 100-year floodplain inNew York City of 33 square miles, or 11 percent ofthe city’s land area. Prior to Sandy, FEMA had al-ready begun the process of updating the 1983FIRMs with new maps, intended to reflect currentflood risks more accurately. In June 2013, newmaps, known as Preliminary Work Maps (PWMs),were released by FEMA and reflect an expansionof the city's 100-year floodplain by 15 squaremiles, or 45 percent, over the 1983 FIRMs. Thenew floodplain consists of larger portions of allfive boroughs, with significant expansion in Brook-lyn and Queens. The new 100-year floodplain onthe PWMs now includes 67,700 structures (an in-crease of 91 percent over the number of struc-tures in the 100-year floodplain in the 1983FIRMs). It is expected that the 100-year floodplainwill continue to expand due to sea level rise at asteady pace over the course of the next decadeand beyond, eventually reaching 72 square miles,or 24 percent of the city’s land area, by the 2050s,with corresponding increases in wave zones.These future floodplains are illustrated on futureflood maps that the City has created in collabora-tion with the NPCC for this report. (See map: Fu-ture Flood Maps for the 2020s and 2050s)
The V Zones on the PWMs include only slightlymore buildings than the V Zones on the 1983FIRMs. However, these zones are expected togrow further as sea level rise expands the flood-plains in areas citywide, potentially includingareas such as those south of and within GreatKills Harbor in Staten Island. Since strongerwaves are projected to exert more destructiveforces on the city’s existing coastal edges, thewave action, in addition to being spread over awider area, is also likely to cause greater damage and erosion.
High Tide with 2050 Sea Level Rise Projections (High-End)At Risk Shorelines
High Tide with 2020 Sea Level Rise Projections (High-End)
Sea Level Rise Analysis
2013 PWMs 100-Year Floodplain
Projected 2020s 100-Year Floodplain
Projected 2050s 100-Year Floodplain
Areas of Significant Growth
Future Flood Maps for the 2020s and 2050s
Source: DCP; NOAA VDATUM for NYC
Source: FEMA; CUNY Institute for Sustainable Cities
Example of tidal flood risk in Howard Beach andHamilton Beach
CHAPTER 3 | COASTAL PROTECTION 46
The foregoing risks of flooding and wave actioncan be found in many parts of the five boroughs,but are most acute in certain coastal areas ofNew York City, as indicated in a comprehensiveanalysis of the coastline that the City undertookas part of the planning for this report. These es-pecially vulnerable areas include exposed neigh-borhoods of the Rockaway Peninsula, the ConeyIsland peninsula, and the East Shore of StatenIsland, which share a common geologic heritageand therefore a common flood profile. A similarprofile is found in several Upper Bay neighbor-hoods, including Red Hook, East Harlem, LowerManhattan, the Lower East Side, and the com-munities adjacent to Newtown Creek and theGowanus Canal. Flooding is expected to pose asignificant risk in these areas through the 2050sas sea levels rise. (See sidebar: Analysis ofCoastal Vulnerabilities and Resiliency Measures)
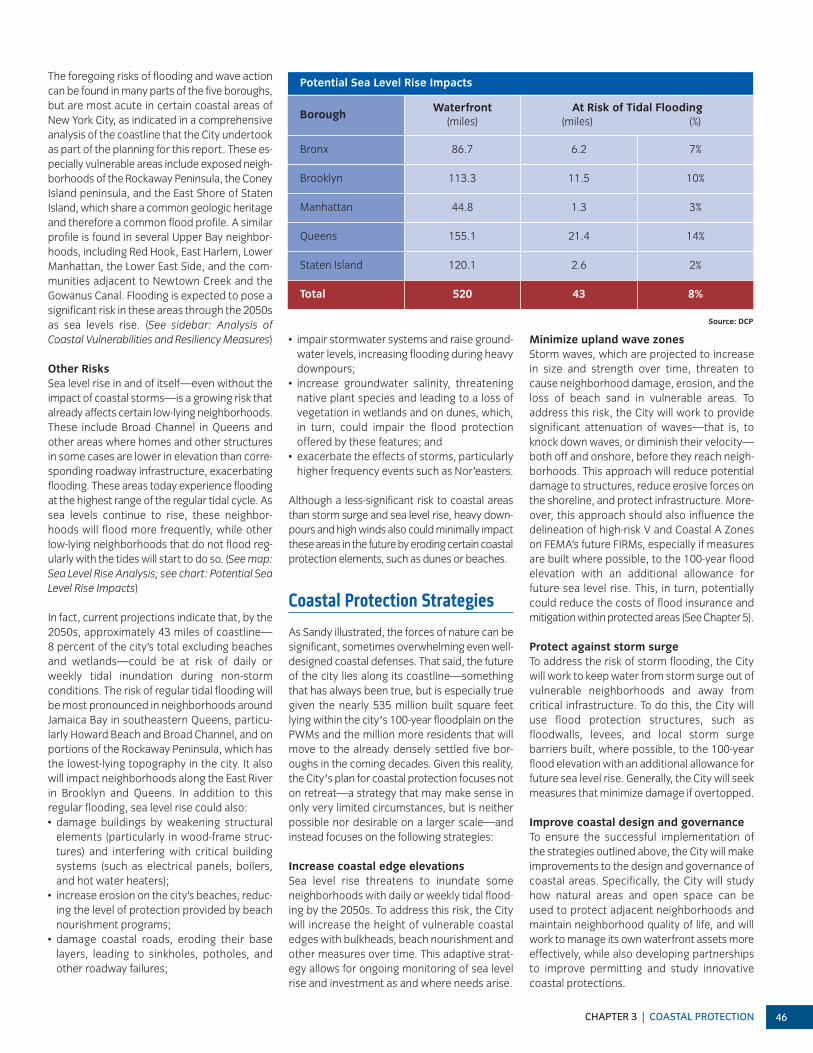
Other RisksSea level rise in and of itself—even without theimpact of coastal storms—is a growing risk thatalready affects certain low-lying neighborhoods.These include Broad Channel in Queens andother areas where homes and other structuresin some cases are lower in elevation than corre-sponding roadway infrastructure, exacerbatingflooding. These areas today experience floodingat the highest range of the regular tidal cycle. Assea levels continue to rise, these neighbor-hoods will flood more frequently, while otherlow-lying neighborhoods that do not flood reg-ularly with the tides will start to do so. (See map:Sea Level Rise Analysis; see chart: Potential SeaLevel Rise Impacts)
In fact, current projections indicate that, by the2050s, approximately 43 miles of coastline—8 percent of the city’s total excluding beachesand wetlands—could be at risk of daily orweekly tidal inundation during non-storm conditions. The risk of regular tidal flooding willbe most pronounced in neighborhoods aroundJamaica Bay in southeastern Queens, particu-larly Howard Beach and Broad Channel, and onportions of the Rockaway Peninsula, which hasthe lowest-lying topography in the city. It alsowill impact neighborhoods along the East Riverin Brooklyn and Queens. In addition to this regular flooding, sea level rise could also:• damage buildings by weakening structural elements (particularly in wood-frame struc-tures) and interfering with critical buildingsystems (such as electrical panels, boilers,and hot water heaters);
• increase erosion on the city’s beaches, reduc-ing the level of protection provided by beachnourishment programs;
• damage coastal roads, eroding their base layers, leading to sinkholes, potholes, andother roadway failures;
• impair stormwater systems and raise ground-water levels, increasing flooding during heavydownpours;
• increase groundwater salinity, threatening native plant species and leading to a loss ofvegetation in wetlands and on dunes, which,in turn, could impair the flood protection offered by these features; and
• exacerbate the effects of storms, particularlyhigher frequency events such as Nor’easters.
Although a less-significant risk to coastal areasthan storm surge and sea level rise, heavy down-pours and high winds also could minimally impactthese areas in the future by eroding certain coastalprotection elements, such as dunes or beaches.
Coastal Protection Strategies
As Sandy illustrated, the forces of nature can besignificant, sometimes overwhelming even well-designed coastal defenses. That said, the futureof the city lies along its coastline—somethingthat has always been true, but is especially truegiven the nearly 535 million built square feetlying within the city's 100-year floodplain on thePWMs and the million more residents that willmove to the already densely settled five bor-oughs in the coming decades. Given this reality,the City's plan for coastal protection focuses noton retreat—a strategy that may make sense inonly very limited circumstances, but is neitherpossible nor desirable on a larger scale—and instead focuses on the following strategies:
Increase coastal edge elevations Sea level rise threatens to inundate someneighborhoods with daily or weekly tidal flood-ing by the 2050s. To address this risk, the Citywill increase the height of vulnerable coastaledges with bulkheads, beach nourishment andother measures over time. This adaptive strat-egy allows for ongoing monitoring of sea levelrise and investment as and where needs arise.
Minimize upland wave zonesStorm waves, which are projected to increasein size and strength over time, threaten tocause neighborhood damage, erosion, and theloss of beach sand in vulnerable areas. To address this risk, the City will work to providesignificant attenuation of waves—that is, toknock down waves, or diminish their velocity—both off and onshore, before they reach neigh-borhoods. This approach will reduce potentialdamage to structures, reduce erosive forces onthe shoreline, and protect infrastructure. More-over, this approach should also influence thedelineation of high-risk V and Coastal A Zoneson FEMA’s future FIRMs, especially if measuresare built where possible, to the 100-year floodelevation with an additional allowance for future sea level rise. This, in turn, potentiallycould reduce the costs of flood insurance andmitigation within protected areas (See Chapter 5).
Protect against storm surgeTo address the risk of storm flooding, the Citywill work to keep water from storm surge out ofvulnerable neighborhoods and away from critical infrastructure. To do this, the City willuse flood protection structures, such as floodwalls, levees, and local storm surge barriers built, where possible, to the 100-yearflood elevation with an additional allowance forfuture sea level rise. Generally, the City will seekmeasures that minimize damage if overtopped.
Improve coastal design and governanceTo ensure the successful implementation ofthe strategies outlined above, the City will make improvements to the design and governance ofcoastal areas. Specifically, the City will studyhow natural areas and open space can be used to protect adjacent neighborhoods andmaintain neighborhood quality of life, and willwork to manage its own waterfront assets moreeffectively, while also developing partnershipsto improve permitting and study innovativecoastal protections.
BoroughWaterfront
(miles)At Risk of Tidal Flooding
(miles) (%)
Bronx 86.7 6.2 7%
Brooklyn 113.3 11.5 10%
Manhattan 44.8 1.3 3%
Queens 155.1 21.4 14%
Staten Island 120.1 2.6 2%
Total 520 43 8%
Potential Sea Level Rise Impacts
Source: DCP
A STRONGER, MORE RESILIENT NEW YORK47
Analysis of Coastal Vulnerabilities and
Resiliency MeasuresThe City’s proposals for coastal protectionmeasures are based on a multi-faceted analysis.This analysis considered factors ranging fromthe nature and likelihood of coastal hazards(such as destructive waves or flooding), to thepossible impact of these hazards on the built environment and critical infrastructure, to the likely effectiveness of certain protectivemeasures. The City also considered whether an area included high concentrations of particularly vulnerable populations, such as theelderly or those with disabilities, that would beat greater risk during a storm event.
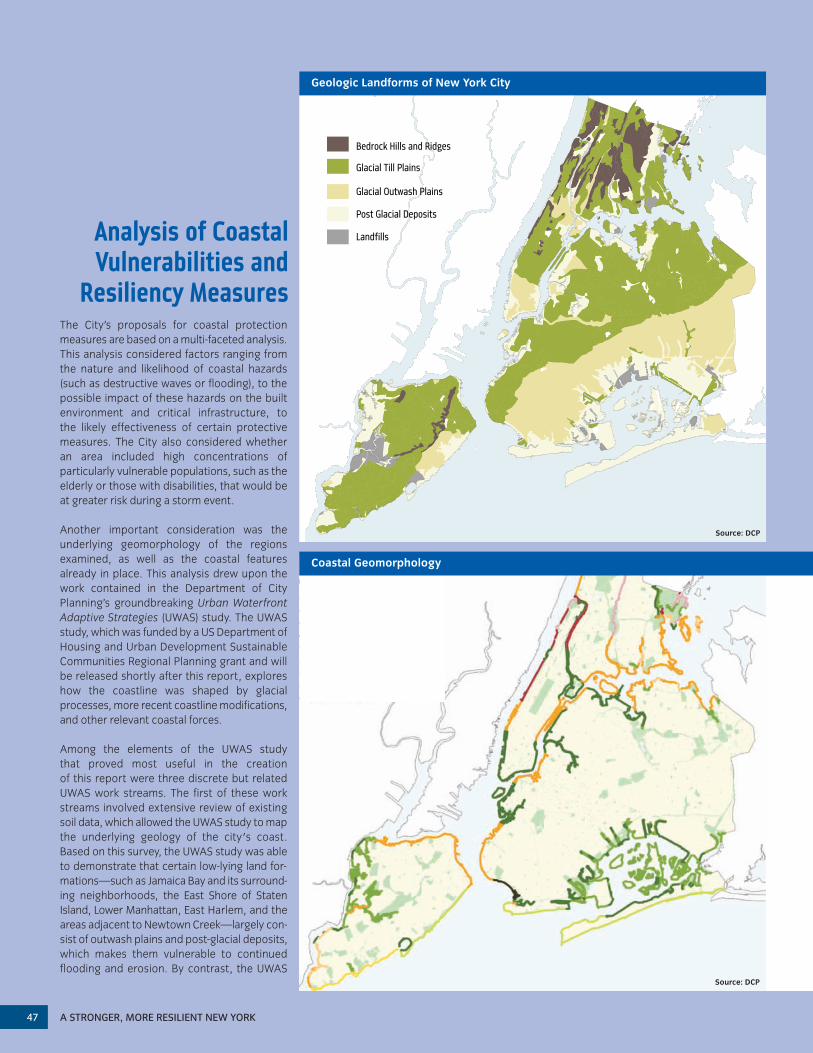
Another important consideration was the underlying geomorphology of the regions examined, as well as the coastal features already in place. This analysis drew upon the work contained in the Department of City Planning’s groundbreaking Urban WaterfrontAdaptive Strategies (UWAS) study. The UWASstudy, which was funded by a US Department ofHousing and Urban Development SustainableCommunities Regional Planning grant and willbe released shortly after this report, exploreshow the coastline was shaped by glacialprocesses, more recent coastline modifications,and other relevant coastal forces.
Among the elements of the UWAS study that proved most useful in the creation of this report were three discrete but relatedUWAS work streams. The first of these workstreams involved extensive review of existingsoil data, which allowed the UWAS study to mapthe underlying geology of the city's coast.Based on this survey, the UWAS study was ableto demonstrate that certain low-lying land for-mations—such as Jamaica Bay and its surround-ing neighborhoods, the East Shore of StatenIsland, Lower Manhattan, East Harlem, and theareas adjacent to Newtown Creek—largely con-sist of outwash plains and post-glacial deposits,which makes them vulnerable to continuedflooding and erosion. By contrast, the UWAS
Source: DCP
Glacial Till Plains
Bedrock Hills and Ridges
Post Glacial Deposits
Landfills
Glacial Outwash Plains
Source: DCP
Geologic Landforms of New York City
Coastal Geomorphology
CHAPTER 3 | COASTAL PROTECTION 48
study also demonstrated that other areas con-sisting of harder soils and rock at steeper slopesare much less susceptible to flood hazards. Notsurprisingly, during Sandy, the inundation areaclosely matched the lowest-lying areas with thesoftest soils. (See map: Geologic Landforms ofNew York City)
Additionally, the UWAS study evaluated the distance over which waves could develop dueto the affects of wind (“fetch”) to evaluate eacharea’s susceptibility to wind-driven wave action.
A second important work stream of the UWASstudy involved an examination of the entirety ofthe city’s shoreline using aerial photographyand other data sources to determine whethersections were reinforced with coastal structures—such as revetments, bulkheads, orpiers—or were in a more natural state, with either rocky, sandy, or marshy edges. This workwas particularly relevant to this report, giventhat areas that are not reinforced or vegetatedtend to be more vulnerable to erosion (exceptin ocean-facing areas prone to wave action,where structures may actually increase erosionand interrupt natural sediment transportprocesses). This, together with the aforemen-tioned study of the city's underlying geology, allowed the UWAS study to create a unique and useful map dividing the city’s coastline intonine discrete geomorphology types. (See map:Coastal Geomorphology)
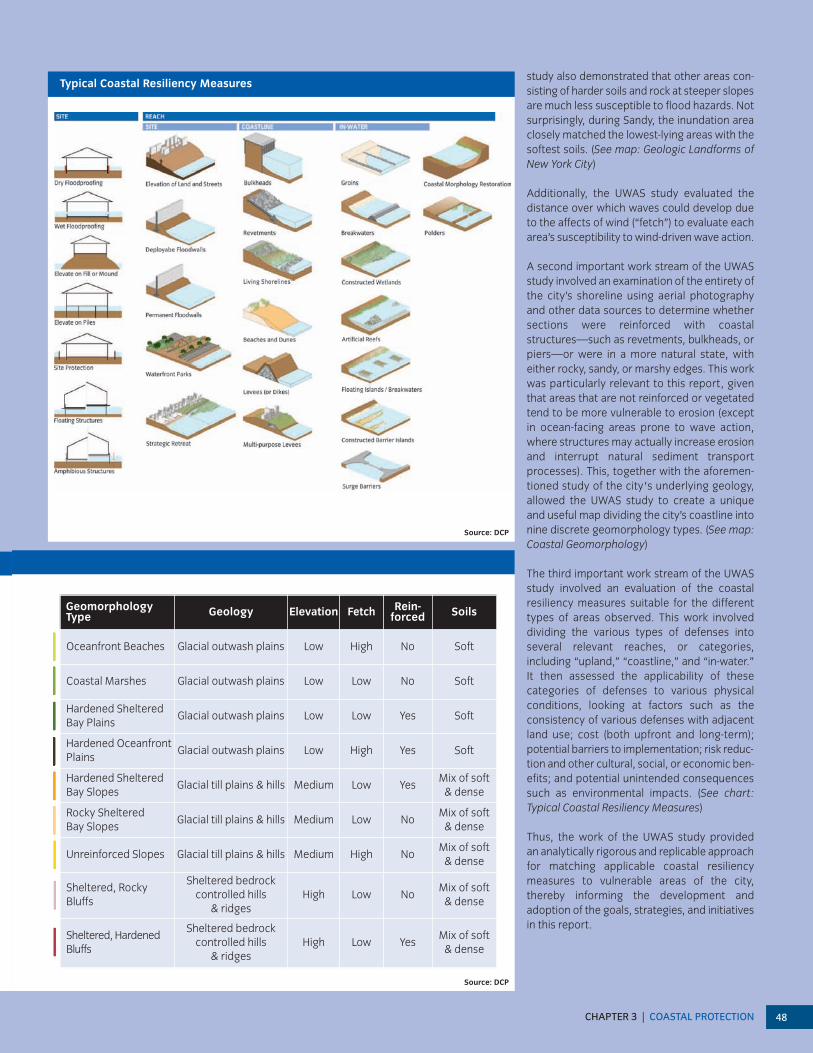
The third important work stream of the UWAS study involved an evaluation of the coastalresiliency measures suitable for the differenttypes of areas observed. This work involved dividing the various types of defenses into several relevant reaches, or categories, including “upland,” “coastline,” and “in-water.” It then assessed the applicability of these categories of defenses to various physicalconditions, looking at factors such as the consistency of various defenses with adjacentland use; cost (both upfront and long-term);potential barriers to implementation; risk reduc-tion and other cultural, social, or economic ben-efits; and potential unintended consequencessuch as environmental impacts. (See chart: Typical Coastal Resiliency Measures)
Thus, the work of the UWAS study provided an analytically rigorous and replicable approachfor matching applicable coastal resiliency measures to vulnerable areas of the city,thereby informing the development and adoption of the goals, strategies, and initiativesin this report.
GeomorphologyType Geology Elevation Fetch Rein-
forced Soils
Oceanfront Beaches Glacial outwash plains Low High No Soft
Coastal Marshes Glacial outwash plains Low Low No Soft
Hardened Sheltered Bay Plains
Glacial outwash plains Low Low Yes Soft
Hardened OceanfrontPlains
Glacial outwash plains Low High Yes Soft
Hardened Sheltered Bay Slopes
Glacial till plains & hills Medium Low YesMix of soft & dense
Rocky Sheltered Bay Slopes
Glacial till plains & hills Medium Low NoMix of soft & dense
Unreinforced Slopes Glacial till plains & hills Medium High NoMix of soft & dense
Sheltered, RockyBluffs
Sheltered bedrock controlled hills
& ridgesHigh Low No
Mix of soft & dense
Sheltered, HardenedBluffs
Sheltered bedrock controlled hills
& ridgesHigh Low Yes
Mix of soft & dense
Typical Coastal Resiliency Measures
Source: DCP
Source: DCP
A STRONGER, MORE RESILIENT NEW YORK49
Harborwide Storm Surge Barriers
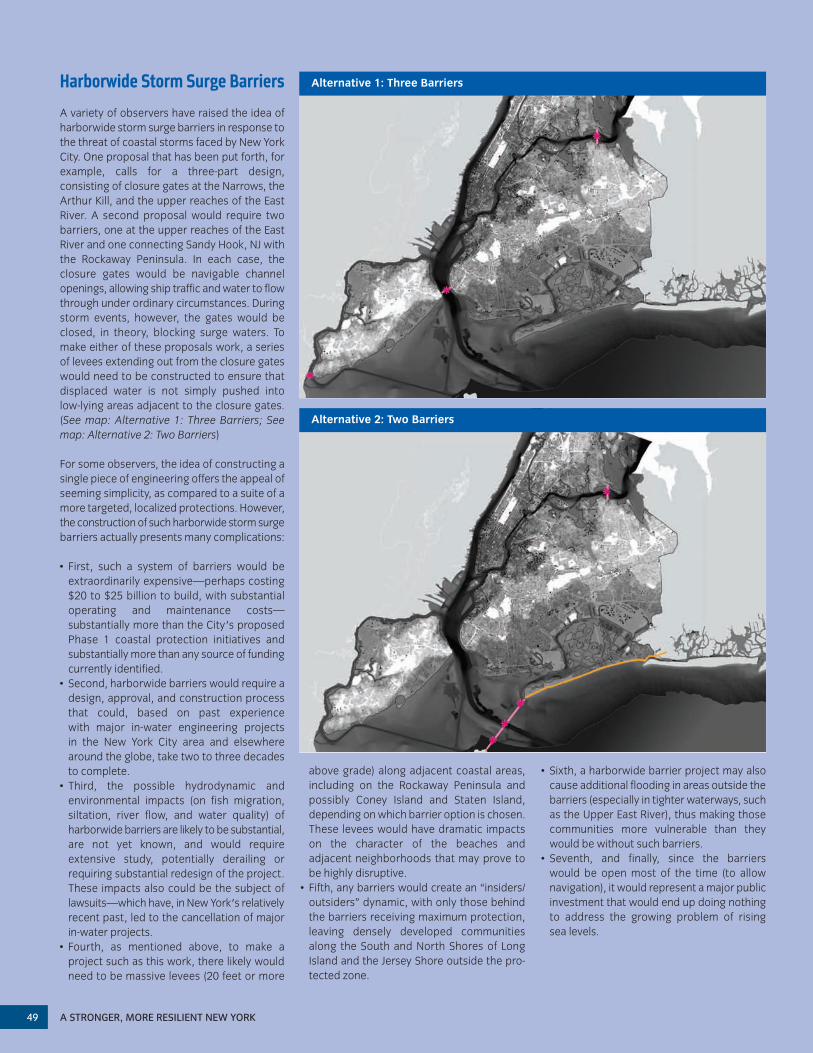
A variety of observers have raised the idea ofharborwide storm surge barriers in response tothe threat of coastal storms faced by New YorkCity. One proposal that has been put forth, forexample, calls for a three-part design, consisting of closure gates at the Narrows, theArthur Kill, and the upper reaches of the EastRiver. A second proposal would require twobarriers, one at the upper reaches of the EastRiver and one connecting Sandy Hook, NJ withthe Rockaway Peninsula. In each case, the closure gates would be navigable channelopenings, allowing ship traffic and water to flowthrough under ordinary circumstances. Duringstorm events, however, the gates would beclosed, in theory, blocking surge waters. Tomake either of these proposals work, a seriesof levees extending out from the closure gateswould need to be constructed to ensure thatdisplaced water is not simply pushed into low-lying areas adjacent to the closure gates.(See map: Alternative 1: Three Barriers; Seemap: Alternative 2: Two Barriers)
For some observers, the idea of constructing asingle piece of engineering offers the appeal ofseeming simplicity, as compared to a suite of amore targeted, localized protections. However,the construction of such harborwide storm surgebarriers actually presents many complications:
• First, such a system of barriers would be extraordinarily expensive—perhaps costing$20 to $25 billion to build, with substantial operating and maintenance costs—substantially more than the City's proposedPhase 1 coastal protection initiatives and substantially more than any source of fundingcurrently identified.
• Second, harborwide barriers would require adesign, approval, and construction processthat could, based on past experience with major in-water engineering projects in the New York City area and elsewhere around the globe, take two to three decadesto complete.
• Third, the possible hydrodynamic and environmental impacts (on fish migration, siltation, river flow, and water quality) of harborwide barriers are likely to be substantial,are not yet known, and would require extensive study, potentially derailing or requiring substantial redesign of the project.These impacts also could be the subject oflawsuits—which have, in New York's relativelyrecent past, led to the cancellation of majorin-water projects.
• Fourth, as mentioned above, to make a project such as this work, there likely wouldneed to be massive levees (20 feet or more
above grade) along adjacent coastal areas,including on the Rockaway Peninsula and possibly Coney Island and Staten Island, depending on which barrier option is chosen.These levees would have dramatic impacts on the character of the beaches and adjacent neighborhoods that may prove to be highly disruptive.
• Fifth, any barriers would create an “insiders/outsiders” dynamic, with only those behindthe barriers receiving maximum protection,leaving densely developed communitiesalong the South and North Shores of Long Island and the Jersey Shore outside the pro-tected zone.
• Sixth, a harborwide barrier project may alsocause additional flooding in areas outside thebarriers (especially in tighter waterways, suchas the Upper East River), thus making thosecommunities more vulnerable than theywould be without such barriers.
• Seventh, and finally, since the barriers would be open most of the time (to allow navigation), it would represent a major publicinvestment that would end up doing nothingto address the growing problem of rising sea levels.
Alternative 2: Two Barriers
Alternative 1: Three Barriers
CHAPTER 3 | COASTAL PROTECTION 50
Comprehensive Coastal Protection Plan
In theory, one way to achieve the City's goalsfor its coastline may be the construction ofmassive protective infrastructure, such as harborwide storm surge barriers at the entrances to New York Harbor. As attractive asthe concept of a single "silver bullet" solutionmay be, though, a closer examination of thisstrategy strongly suggests that relying on sucha solution would pose significant risks to thecity that far outweigh its theoretical benefits.(See sidebar: Harborwide Storm Surge Barriers)
Given this, the City believes that the right ap-proach to coastal protection is an integratedsystem of discrete coastal projects, that to-gether would constitute the elements of a mul-tilayered approach also involving resiliencymeasures for buildings and protections for crit-ical infrastructure. The advantage of this ap-proach is three-fold. First, it diversifies the city'sexposure to given technologies, reducing thechance of devastating failure, as occurred inNew Orleans during Katrina, when the city'smain defensive system, its levees, failed, leav-ing many parts of the city completely unpro-tected. Second, the City's proposed approachalso has the advantage of being scalable toavailable resources, rather than requiring all re-sources to be secured before anything movesforward. Finally, certain elements of the City'splan can begin almost immediately, makingNew Yorkers safer today, rather than waitingyears or perhaps even decades for a solutionthat may never be completed.
Therefore, to achieve its ambitious goals, theCity is proposing a broad range of coastal pro-tection measures. This breadth reflects the factthat different coastal areas in the city face dif-ferent risks and therefore require protectionthat is specifically tailored to their needs.
Some of the proposed measures mimic existingcoastal features that performed well duringSandy. Others have been proven to be successful elsewhere. Where possible, the Cityhas derived inspiration from the historic naturalfeatures that once protected the coastlinethroughout the city. Elsewhere, both traditionaland newly developed technologies have been considered.
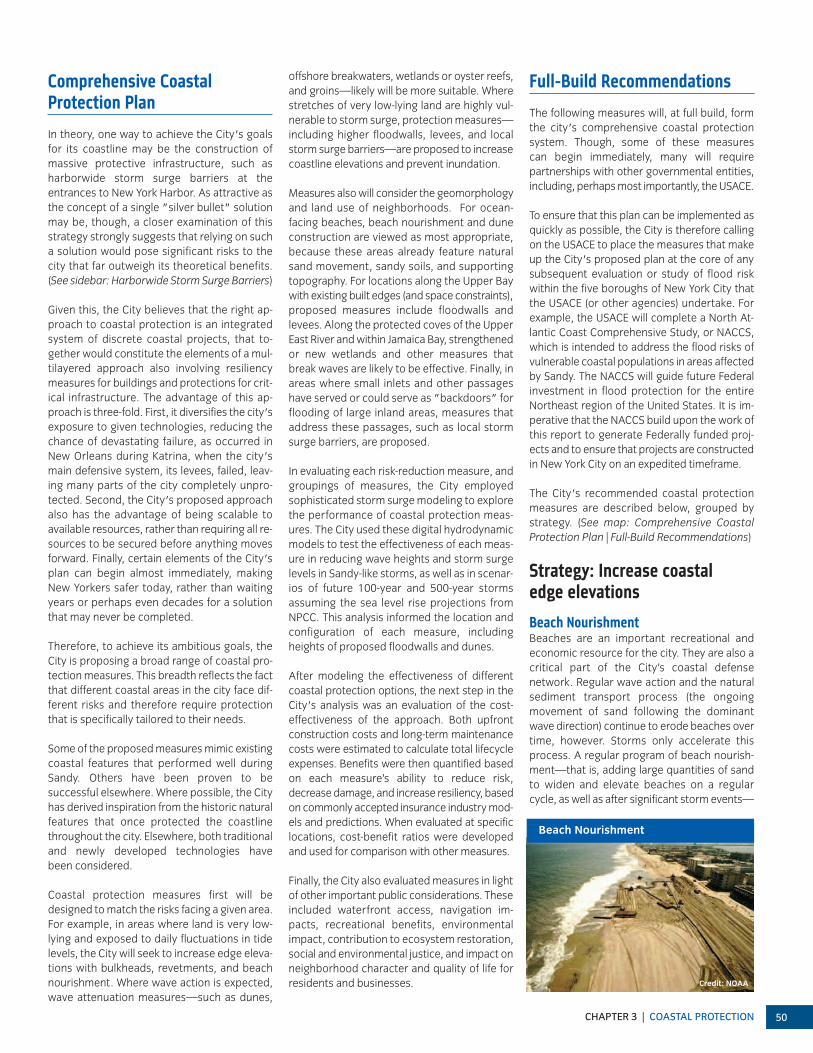
Coastal protection measures first will be designed to match the risks facing a given area.For example, in areas where land is very low-lying and exposed to daily fluctuations in tidelevels, the City will seek to increase edge eleva-tions with bulkheads, revetments, and beachnourishment. Where wave action is expected,wave attenuation measures—such as dunes,
offshore breakwaters, wetlands or oyster reefs,and groins—likely will be more suitable. Wherestretches of very low-lying land are highly vul-nerable to storm surge, protection measures—including higher floodwalls, levees, and localstorm surge barriers—are proposed to increasecoastline elevations and prevent inundation.
Measures also will consider the geomorphologyand land use of neighborhoods. For ocean-facing beaches, beach nourishment and duneconstruction are viewed as most appropriate,because these areas already feature naturalsand movement, sandy soils, and supportingtopography. For locations along the Upper Baywith existing built edges (and space constraints),proposed measures include floodwalls and levees. Along the protected coves of the UpperEast River and within Jamaica Bay, strengthenedor new wetlands and other measures thatbreak waves are likely to be effective. Finally, inareas where small inlets and other passageshave served or could serve as "backdoors" forflooding of large inland areas, measures thataddress these passages, such as local stormsurge barriers, are proposed.
In evaluating each risk-reduction measure, andgroupings of measures, the City employed sophisticated storm surge modeling to explorethe performance of coastal protection meas-ures. The City used these digital hydrodynamicmodels to test the effectiveness of each meas-ure in reducing wave heights and storm surgelevels in Sandy-like storms, as well as in scenar-ios of future 100-year and 500-year storms assuming the sea level rise projections fromNPCC. This analysis informed the location andconfiguration of each measure, includingheights of proposed floodwalls and dunes.
After modeling the effectiveness of differentcoastal protection options, the next step in theCity's analysis was an evaluation of the cost-effectiveness of the approach. Both upfront construction costs and long-term maintenancecosts were estimated to calculate total lifecycleexpenses. Benefits were then quantified basedon each measure’s ability to reduce risk, decrease damage, and increase resiliency, basedon commonly accepted insurance industry mod-els and predictions. When evaluated at specificlocations, cost-benefit ratios were developedand used for comparison with other measures.
Finally, the City also evaluated measures in lightof other important public considerations. Theseincluded waterfront access, navigation im-pacts, recreational benefits, environmental impact, contribution to ecosystem restoration,social and environmental justice, and impact onneighborhood character and quality of life forresidents and businesses.
Full-Build Recommendations
The following measures will, at full build, formthe city's comprehensive coastal protection system. Though, some of these measures can begin immediately, many will require partnerships with other governmental entities,including, perhaps most importantly, the USACE.
To ensure that this plan can be implemented asquickly as possible, the City is therefore callingon the USACE to place the measures that makeup the City's proposed plan at the core of anysubsequent evaluation or study of flood riskwithin the five boroughs of New York City thatthe USACE (or other agencies) undertake. Forexample, the USACE will complete a North At-lantic Coast Comprehensive Study, or NACCS,which is intended to address the flood risks ofvulnerable coastal populations in areas affectedby Sandy. The NACCS will guide future Federalinvestment in flood protection for the entireNortheast region of the United States. It is im-perative that the NACCS build upon the work ofthis report to generate Federally funded proj-ects and to ensure that projects are constructedin New York City on an expedited timeframe.
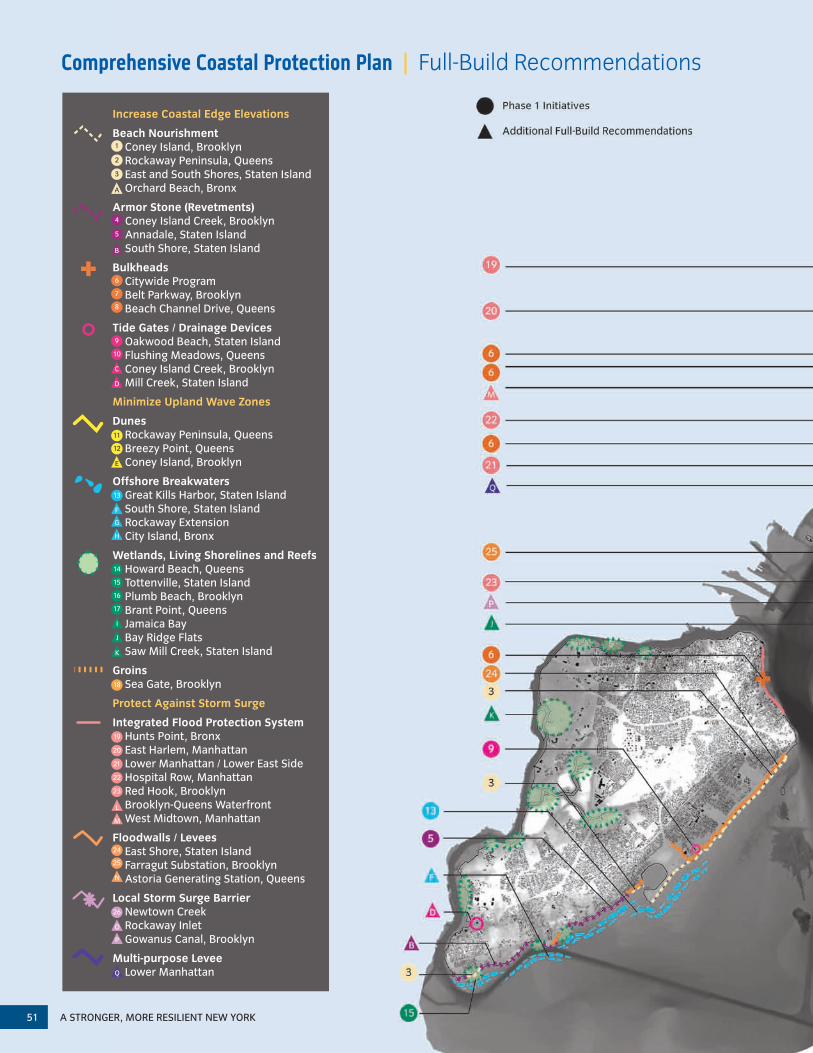
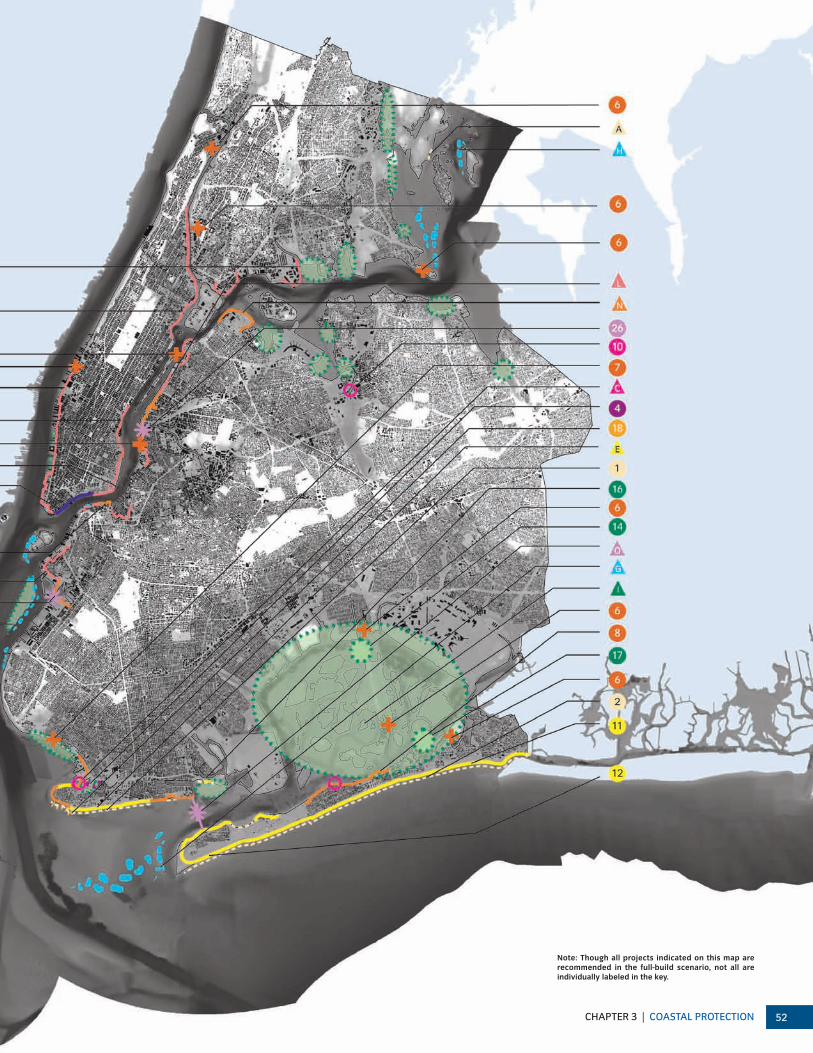
The City's recommended coastal protectionmeasures are described below, grouped bystrategy. (See map: Comprehensive CoastalProtection Plan | Full-Build Recommendations)
Strategy: Increase coastal edge elevations
Beach NourishmentBeaches are an important recreational and economic resource for the city. They are also acritical part of the City’s coastal defense network. Regular wave action and the naturalsediment transport process (the ongoing movement of sand following the dominantwave direction) continue to erode beaches overtime, however. Storms only accelerate thisprocess. A regular program of beach nourish-ment—that is, adding large quantities of sandto widen and elevate beaches on a regularcycle, as well as after significant storm events—
Beach Nourishment
Credit: NOAA
A STRONGER, MORE RESILIENT NEW YORK51
Increase Coastal Edge Elevations
Beach Nourishment Coney Island, Brooklyn Rockaway Peninsula, Queens East and South Shores, Staten Island Orchard Beach, Bronx
Armor Stone (Revetments) Coney Island Creek, Brooklyn Annadale, Staten Island South Shore, Staten Island
Bulkheads Citywide Program Belt Parkway, Brooklyn Beach Channel Drive, Queens
Tide Gates / Drainage Devices Oakwood Beach, Staten Island Flushing Meadows, Queens Coney Island Creek, Brooklyn Mill Creek, Staten Island
Minimize Upland Wave Zones
Dunes Rockaway Peninsula, Queens Breezy Point, Queens Coney Island, Brooklyn
Offshore Breakwaters Great Kills Harbor, Staten Island South Shore, Staten Island Rockaway Extension City Island, Bronx
Wetlands, Living Shorelines and Reefs Howard Beach, Queens Tottenville, Staten Island Plumb Beach, Brooklyn Brant Point, Queens Jamaica Bay Bay Ridge Flats Saw Mill Creek, Staten Island
Groins Sea Gate, Brooklyn
Protect Against Storm Surge
Integrated Flood Protection System Hunts Point, Bronx East Harlem, Manhattan Lower Manhattan / Lower East Side Hospital Row, Manhattan Red Hook, Brooklyn Brooklyn-Queens Waterfront West Midtown, Manhattan
Floodwalls / Levees East Shore, Staten Island Farragut Substation, Brooklyn Astoria Generating Station, Queens
Local Storm Surge Barrier Newtown Creek Rockaway Inlet Gowanus Canal, Brooklyn
Multi-purpose Levee Lower Manhattan
1
2
3
4
5
6
7
8
9
10
11
13
14
15
16
17
18
19
20
21
22
23
24
25
12
A
B
C
D
E
F
G
H
I
J
K
L
M
N
26
O
P
Q
Comprehensive Coastal Protection Plan | Full-Build Recommendations
CHAPTER 3 | COASTAL PROTECTION 52
Note: Though all projects indicated on this map arerecommended in the full-build scenario, not all are individually labeled in the key.
A STRONGER, MORE RESILIENT NEW YORK53
is critical to ensuring that city beaches continueto serve their vital coastal protection role.
Selected Locations: Rockaway Peninsula;Coney Island peninsula; East Shore and SouthShore of Staten Island; and Orchard Beach inthe Bronx. (See photo: Beach Nourishment)
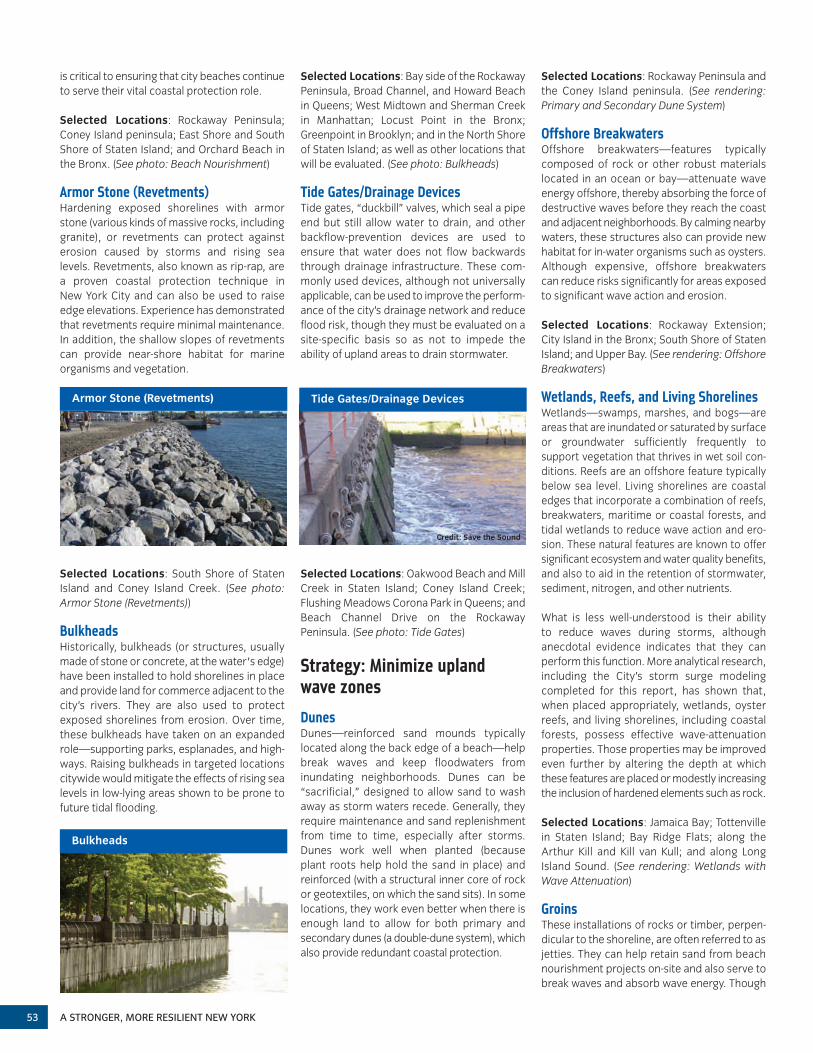
Armor Stone (Revetments)Hardening exposed shorelines with armorstone (various kinds of massive rocks, includinggranite), or revetments can protect against erosion caused by storms and rising sea levels. Revetments, also known as rip-rap, are a proven coastal protection technique in New York City and can also be used to raiseedge elevations. Experience has demonstratedthat revetments require minimal maintenance.In addition, the shallow slopes of revetmentscan provide near-shore habitat for marine organisms and vegetation.
Selected Locations: South Shore of Staten Island and Coney Island Creek. (See photo:Armor Stone (Revetments))
BulkheadsHistorically, bulkheads (or structures, usuallymade of stone or concrete, at the water's edge)have been installed to hold shorelines in placeand provide land for commerce adjacent to thecity’s rivers. They are also used to protect exposed shorelines from erosion. Over time,these bulkheads have taken on an expandedrole—supporting parks, esplanades, and high-ways. Raising bulkheads in targeted locationscitywide would mitigate the effects of rising sealevels in low-lying areas shown to be prone tofuture tidal flooding.
Selected Locations: Bay side of the RockawayPeninsula, Broad Channel, and Howard Beachin Queens; West Midtown and Sherman Creekin Manhattan; Locust Point in the Bronx;Greenpoint in Brooklyn; and in the North Shoreof Staten Island; as well as other locations thatwill be evaluated. (See photo: Bulkheads)
Tide Gates/Drainage Devices Tide gates, “duckbill” valves, which seal a pipeend but still allow water to drain, and otherbackflow-prevention devices are used to ensure that water does not flow backwardsthrough drainage infrastructure. These com-monly used devices, although not universallyapplicable, can be used to improve the perform-ance of the city’s drainage network and reduceflood risk, though they must be evaluated on asite-specific basis so as not to impede the ability of upland areas to drain stormwater.
Selected Locations: Oakwood Beach and MillCreek in Staten Island; Coney Island Creek;Flushing Meadows Corona Park in Queens; andBeach Channel Drive on the Rockaway Peninsula. (See photo: Tide Gates)
Strategy: Minimize upland wave zones
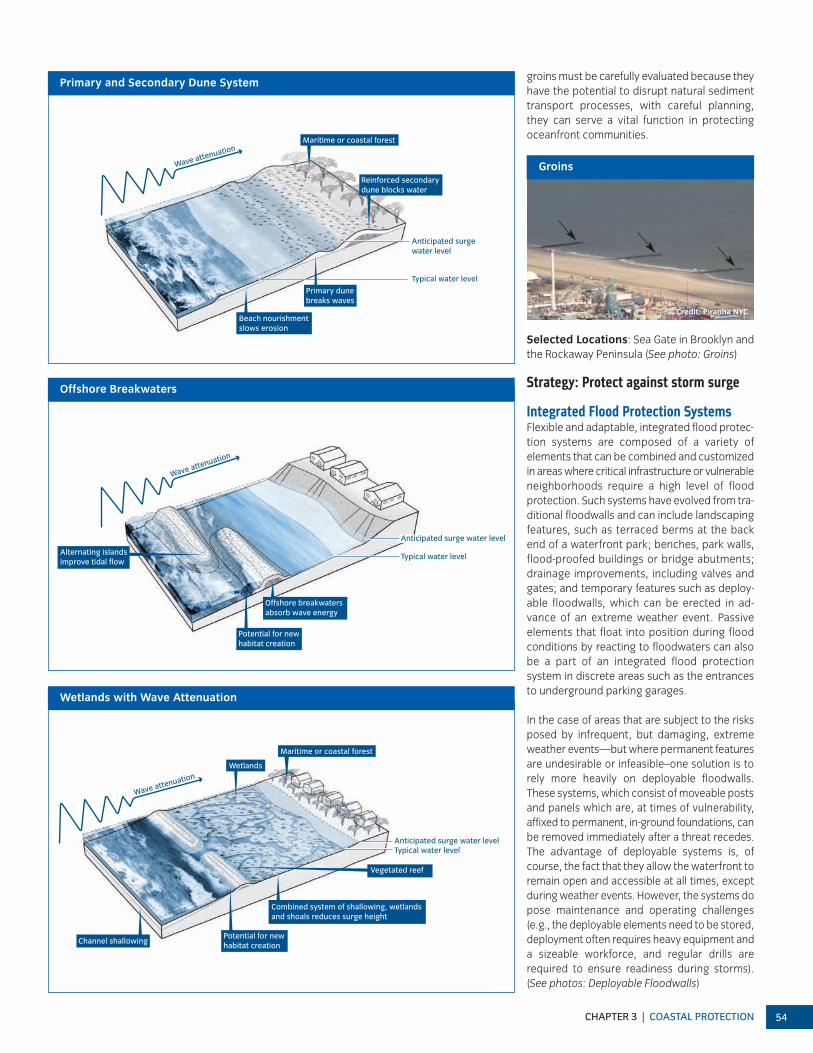
DunesDunes—reinforced sand mounds typically located along the back edge of a beach—helpbreak waves and keep floodwaters from inundating neighborhoods. Dunes can be “sacrificial,” designed to allow sand to washaway as storm waters recede. Generally, theyrequire maintenance and sand replenishmentfrom time to time, especially after storms.Dunes work well when planted (because plant roots help hold the sand in place) and reinforced (with a structural inner core of rockor geotextiles, on which the sand sits). In somelocations, they work even better when there isenough land to allow for both primary and secondary dunes (a double-dune system), whichalso provide redundant coastal protection.
Selected Locations: Rockaway Peninsula andthe Coney Island peninsula. (See rendering:Primary and Secondary Dune System)
Offshore BreakwatersOffshore breakwaters—features typically composed of rock or other robust materials located in an ocean or bay—attenuate waveenergy offshore, thereby absorbing the force ofdestructive waves before they reach the coastand adjacent neighborhoods. By calming nearbywaters, these structures also can provide newhabitat for in-water organisms such as oysters.Although expensive, offshore breakwaters can reduce risks significantly for areas exposedto significant wave action and erosion.
Selected Locations: Rockaway Extension; City Island in the Bronx; South Shore of StatenIsland; and Upper Bay. (See rendering: OffshoreBreakwaters)
Wetlands, Reefs, and Living ShorelinesWetlands—swamps, marshes, and bogs—areareas that are inundated or saturated by surfaceor groundwater sufficiently frequently to support vegetation that thrives in wet soil con-ditions. Reefs are an offshore feature typicallybelow sea level. Living shorelines are coastaledges that incorporate a combination of reefs,breakwaters, maritime or coastal forests, andtidal wetlands to reduce wave action and ero-sion. These natural features are known to offersignificant ecosystem and water quality benefits,and also to aid in the retention of stormwater,sediment, nitrogen, and other nutrients.
What is less well-understood is their ability to reduce waves during storms, although anecdotal evidence indicates that they can perform this function. More analytical research,including the City’s storm surge modeling completed for this report, has shown that,when placed appropriately, wetlands, oysterreefs, and living shorelines, including coastalforests, possess effective wave-attenuationproperties. Those properties may be improvedeven further by altering the depth at whichthese features are placed or modestly increasingthe inclusion of hardened elements such as rock.
Selected Locations: Jamaica Bay; Tottenvillein Staten Island; Bay Ridge Flats; along theArthur Kill and Kill van Kull; and along Long Island Sound. (See rendering: Wetlands withWave Attenuation)
GroinsThese installations of rocks or timber, perpen-dicular to the shoreline, are often referred to asjetties. They can help retain sand from beachnourishment projects on-site and also serve tobreak waves and absorb wave energy. Though
Tide Gates/Drainage Devices
Bulkheads
Armor Stone (Revetments)
Credit: Save the Sound
groins must be carefully evaluated because theyhave the potential to disrupt natural sedimenttransport processes, with careful planning, they can serve a vital function in protecting oceanfront communities.
Selected Locations: Sea Gate in Brooklyn andthe Rockaway Peninsula (See photo: Groins)
Strategy: Protect against storm surge
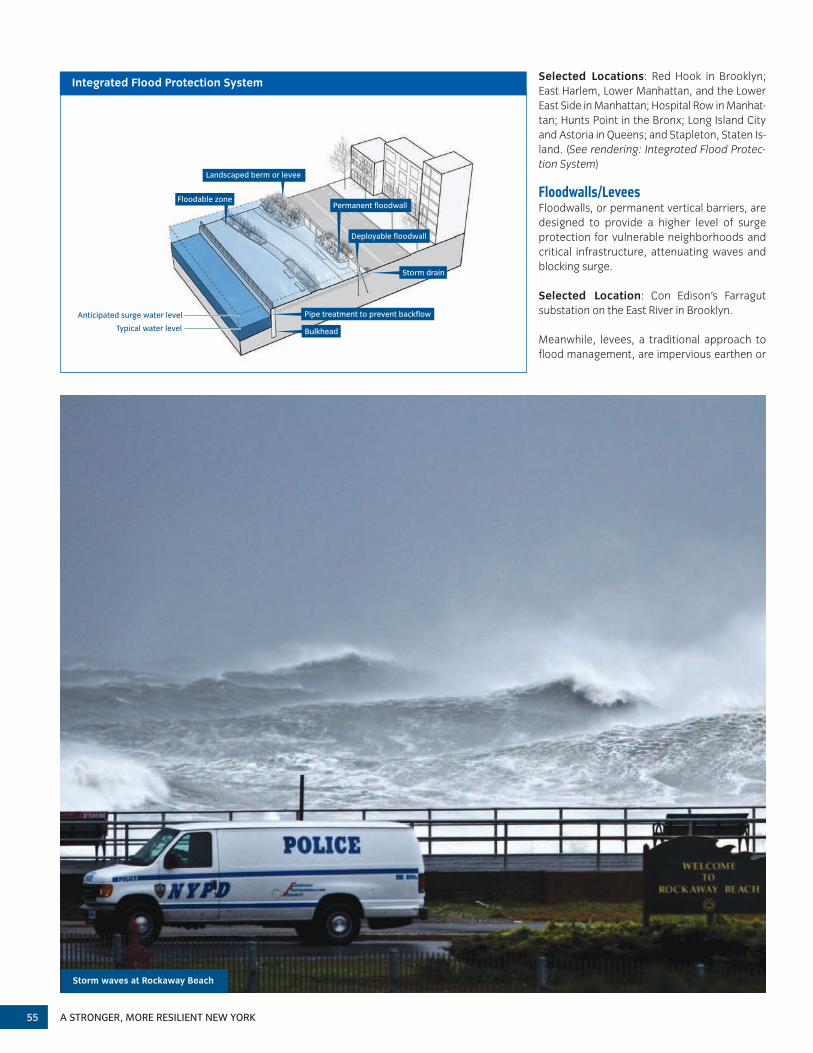
Integrated Flood Protection SystemsFlexible and adaptable, integrated flood protec-tion systems are composed of a variety of elements that can be combined and customizedin areas where critical infrastructure or vulnerableneighborhoods require a high level of flood protection. Such systems have evolved from tra-ditional floodwalls and can include landscapingfeatures, such as terraced berms at the backend of a waterfront park; benches, park walls,flood-proofed buildings or bridge abutments;drainage improvements, including valves andgates; and temporary features such as deploy-able floodwalls, which can be erected in ad-vance of an extreme weather event. Passiveelements that float into position during floodconditions by reacting to floodwaters can alsobe a part of an integrated flood protection system in discrete areas such as the entrancesto underground parking garages.
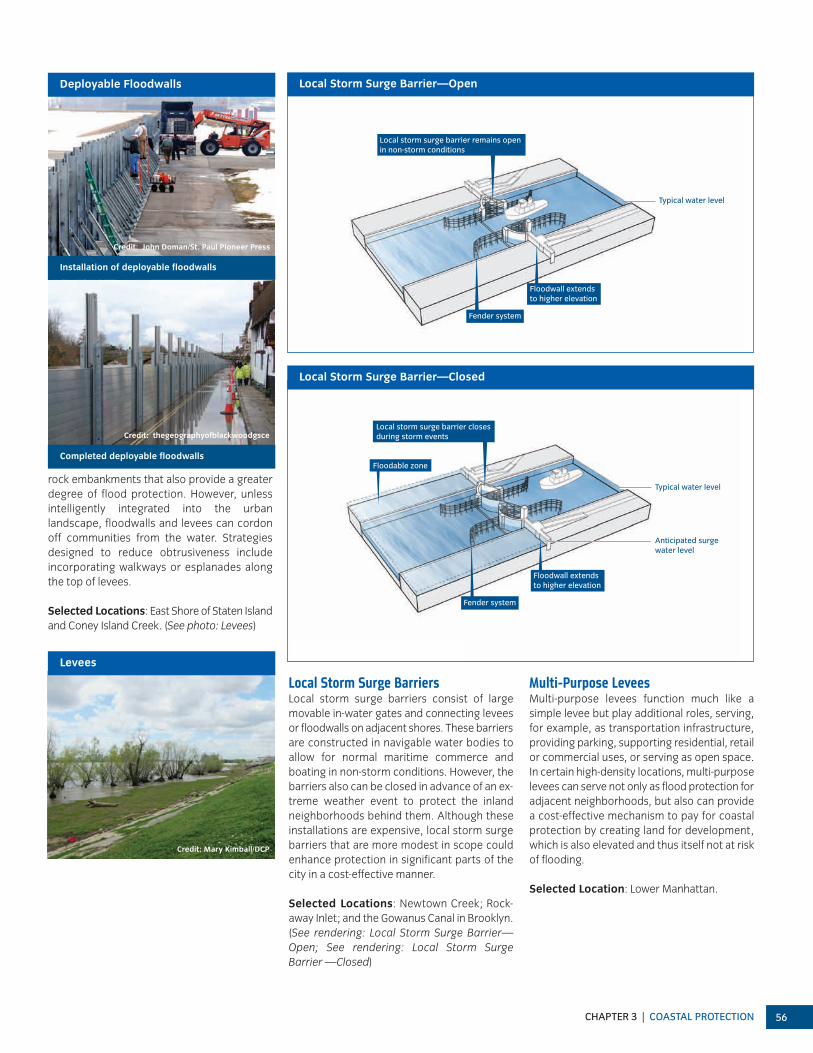
In the case of areas that are subject to the risksposed by infrequent, but damaging, extremeweather events—but where permanent featuresare undesirable or infeasible–one solution is torely more heavily on deployable floodwalls.These systems, which consist of moveable postsand panels which are, at times of vulnerability, affixed to permanent, in-ground foundations, canbe removed immediately after a threat recedes.The advantage of deployable systems is, ofcourse, the fact that they allow the waterfront toremain open and accessible at all times, exceptduring weather events. However, the systems dopose maintenance and operating challenges(e.g., the deployable elements need to be stored,deployment often requires heavy equipment anda sizeable workforce, and regular drills are required to ensure readiness during storms).(See photos: Deployable Floodwalls)
CHAPTER 3 | COASTAL PROTECTION 54
Reinforced secondarydune blocks water
Beach nourishment slows erosion
Maritime or coastal forest
P
Typical water level
Anticipated surge water level
Wave attenuation
Primary dune breaks waves
Typical water level
Wave attenuation
Offshore breakwatersabsorb wave energy
Potential for new habitat creation
Alternating islandsimprove tidal flow
Anticipated surge water level
Wetlands
Vegetated reef
Combined system of shallowing, wetlands and shoals reduces surge height
Potential for new habitat creation
Channel shallowing
Maritime or coastal forest
Typical water levelAnticipated surge water level
Wave attenuation
Primary and Secondary Dune System
Offshore Breakwaters
Wetlands with Wave Attenuation
Groins
Credit: Piranha NYC
A STRONGER, MORE RESILIENT NEW YORK55
Storm waves at Rockaway Beach
Selected Locations: Red Hook in Brooklyn;East Harlem, Lower Manhattan, and the LowerEast Side in Manhattan; Hospital Row in Manhat-tan; Hunts Point in the Bronx; Long Island Cityand Astoria in Queens; and Stapleton, Staten Is-land. (See rendering: Integrated Flood Protec-tion System)
Floodwalls/LeveesFloodwalls, or permanent vertical barriers, aredesigned to provide a higher level of surge protection for vulnerable neighborhoods andcritical infrastructure, attenuating waves andblocking surge.
Selected Location: Con Edison’s Farragut substation on the East River in Brooklyn.
Meanwhile, levees, a traditional approach toflood management, are impervious earthen or
Landscaped berm or levee
Deployable floodwall
Permanent floodwallFloodable zone
Pipe treatment to prevent backflow
Bulkhead
Storm drain
Typical water level
Anticipated surge water level
Integrated Flood Protection System
rock embankments that also provide a greaterdegree of flood protection. However, unless intelligently integrated into the urban landscape, floodwalls and levees can cordonoff communities from the water. Strategies designed to reduce obtrusiveness include incorporating walkways or esplanades alongthe top of levees.
Selected Locations: East Shore of Staten Islandand Coney Island Creek. (See photo: Levees)
Local Storm Surge BarriersLocal storm surge barriers consist of large movable in-water gates and connecting leveesor floodwalls on adjacent shores. These barriersare constructed in navigable water bodies toallow for normal maritime commerce and boating in non-storm conditions. However, thebarriers also can be closed in advance of an ex-treme weather event to protect the inlandneighborhoods behind them. Although theseinstallations are expensive, local storm surgebarriers that are more modest in scope couldenhance protection in significant parts of thecity in a cost-effective manner.
Selected Locations: Newtown Creek; Rock-away Inlet; and the Gowanus Canal in Brooklyn.(See rendering: Local Storm Surge Barrier—Open; See rendering: Local Storm Surge Barrier —Closed)
Multi-Purpose LeveesMulti-purpose levees function much like a simple levee but play additional roles, serving,for example, as transportation infrastructure,providing parking, supporting residential, retailor commercial uses, or serving as open space.In certain high-density locations, multi-purposelevees can serve not only as flood protection foradjacent neighborhoods, but also can providea cost-effective mechanism to pay for coastalprotection by creating land for development,which is also elevated and thus itself not at riskof flooding.
Selected Location: Lower Manhattan.
CHAPTER 3 | COASTAL PROTECTION 56
Fender system
Floodable zone
Floodwall extendsto higher elevation
Local storm surge barrier closes during storm events
LOCAL STORM SURGE BARRIER
Typical water level
Anticipated surge water level
Fender system
Floodwall extendsto higher elevation
Local storm surge barrier remains open in non-storm conditions
Typical water level
Local Storm Surge Barrier—OpenDeployable Floodwalls
Levees
Credit: Mary Kimball/DCP
Credit: John Doman/St. Paul Pioneer Press
Installation of deployable floodwalls
Completed deployable floodwalls
Local Storm Surge Barrier—Closed
Credit: thegeographyofblackwoodgsce
PHASE 1 INITIATIVES
A STRONGER, MORE RESILIENT NEW YORK57
While the City's comprehensive plan for coastal protection includes all of the tactics described above and shown on the Full-BuildRecommendations map, implementation of allof these tactics simultaneously would be an expensive proposition. Furthermore, in manycases, it may make sense to monitor the actualrising sea levels before making some of theaforementioned investments where associatedrisks may not be felt for several decades.
However, the risks faced today coupled with theexpected increase in these risks in the yearsahead, do not give the City the luxury of defer-ring investment indefinitely. Thus, while the re-sources available to the City today may belimited, it is incumbent upon—and possiblefor—the City to think ambitiously and makesubstantial improvements in its existing coastaldefenses in the near-term.
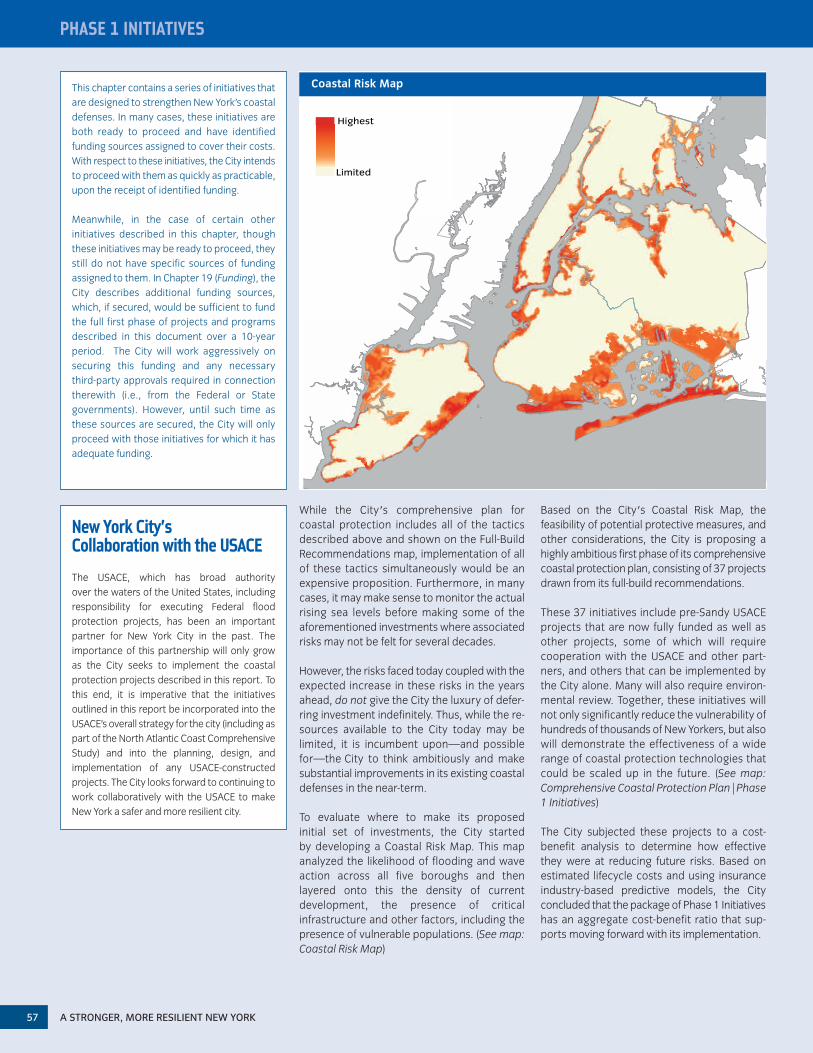
To evaluate where to make its proposed initial set of investments, the City started by developing a Coastal Risk Map. This map analyzed the likelihood of flooding and wave action across all five boroughs and then layered onto this the density of current development, the presence of critical infrastructure and other factors, including thepresence of vulnerable populations. (See map:Coastal Risk Map)
Based on the City's Coastal Risk Map, the feasibility of potential protective measures, andother considerations, the City is proposing ahighly ambitious first phase of its comprehensivecoastal protection plan, consisting of 37 projectsdrawn from its full-build recommendations.
These 37 initiatives include pre-Sandy USACEprojects that are now fully funded as well asother projects, some of which will require cooperation with the USACE and other part-ners, and others that can be implemented bythe City alone. Many will also require environ-mental review. Together, these initiatives willnot only significantly reduce the vulnerability ofhundreds of thousands of New Yorkers, but alsowill demonstrate the effectiveness of a widerange of coastal protection technologies thatcould be scaled up in the future. (See map:Comprehensive Coastal Protection Plan | Phase1 Initiatives)
The City subjected these projects to a cost-benefit analysis to determine how effective they were at reducing future risks. Based on estimated lifecycle costs and using insurance industry-based predictive models, the City concluded that the package of Phase 1 Initiativeshas an aggregate cost-benefit ratio that sup-ports moving forward with its implementation.
Highest
Limited
Coastal Risk MapThis chapter contains a series of initiatives thatare designed to strengthen New York’s coastaldefenses. In many cases, these initiatives areboth ready to proceed and have identifiedfunding sources assigned to cover their costs.With respect to these initiatives, the City intendsto proceed with them as quickly as practicable,upon the receipt of identified funding.
Meanwhile, in the case of certain other initiatives described in this chapter, thoughthese initiatives may be ready to proceed, theystill do not have specific sources of funding assigned to them. In Chapter 19 (Funding), theCity describes additional funding sources,which, if secured, would be sufficient to fundthe full first phase of projects and programs described in this document over a 10-year period. The City will work aggressively on securing this funding and any necessary third-party approvals required in connectiontherewith (i.e., from the Federal or State governments). However, until such time asthese sources are secured, the City will onlyproceed with those initiatives for which it hasadequate funding.
New York City’s Collaboration with the USACE
The USACE, which has broad authority over the waters of the United States, including responsibility for executing Federal flood protection projects, has been an important partner for New York City in the past. The importance of this partnership will only grow as the City seeks to implement the coastal protection projects described in this report. Tothis end, it is imperative that the initiatives outlined in this report be incorporated into theUSACE’s overall strategy for the city (including aspart of the North Atlantic Coast ComprehensiveStudy) and into the planning, design, and implementation of any USACE-constructed projects. The City looks forward to continuing towork collaboratively with the USACE to makeNew York a safer and more resilient city.
CHAPTER 3 | COASTAL PROTECTION 58
Strategy: Increase coastal edge elevations
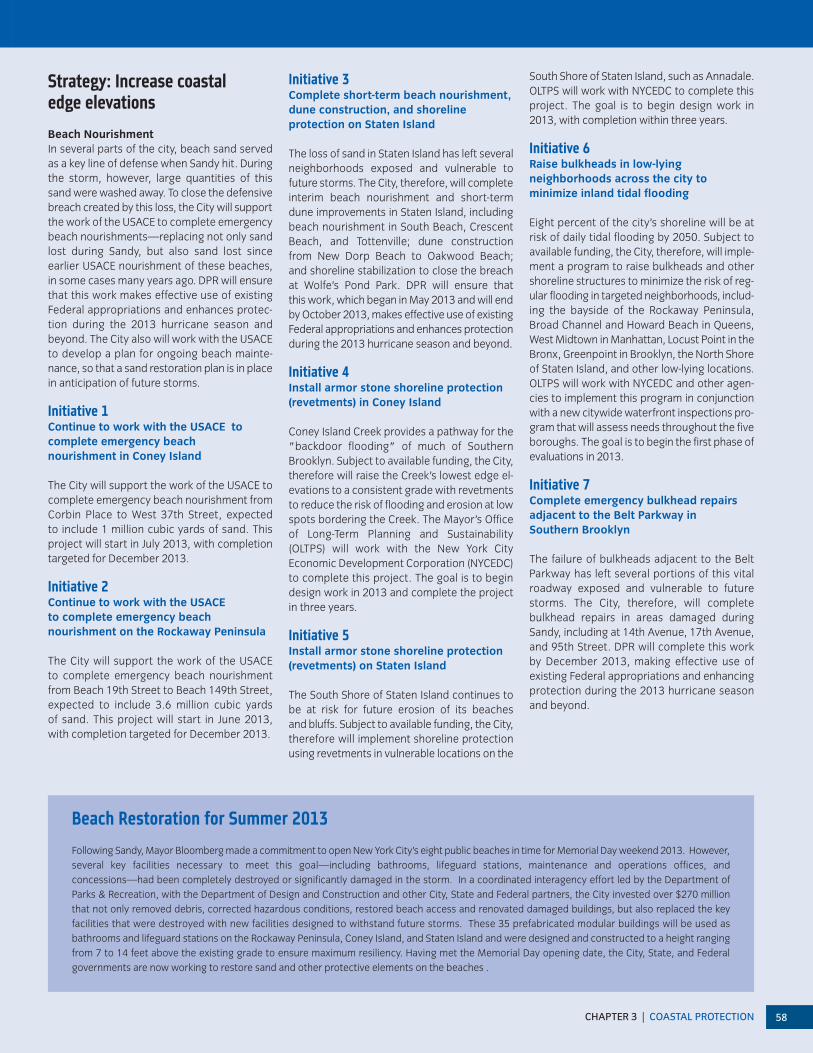
Beach NourishmentIn several parts of the city, beach sand servedas a key line of defense when Sandy hit. Duringthe storm, however, large quantities of thissand were washed away. To close the defensivebreach created by this loss, the City will supportthe work of the USACE to complete emergencybeach nourishments—replacing not only sandlost during Sandy, but also sand lost since earlier USACE nourishment of these beaches,in some cases many years ago. DPR will ensurethat this work makes effective use of existingFederal appropriations and enhances protec-tion during the 2013 hurricane season and beyond. The City also will work with the USACEto develop a plan for ongoing beach mainte-nance, so that a sand restoration plan is in placein anticipation of future storms.
Initiative 1Continue to work with the USACE to complete emergency beach nourishment in Coney Island
The City will support the work of the USACE tocomplete emergency beach nourishment fromCorbin Place to West 37th Street, expected to include 1 million cubic yards of sand. Thisproject will start in July 2013, with completiontargeted for December 2013.
Initiative 2Continue to work with the USACE to complete emergency beach nourishment on the Rockaway Peninsula
The City will support the work of the USACE to complete emergency beach nourishmentfrom Beach 19th Street to Beach 149th Street,expected to include 3.6 million cubic yards of sand. This project will start in June 2013, with completion targeted for December 2013.
Initiative 3Complete short-term beach nourishment,dune construction, and shoreline protection on Staten Island
The loss of sand in Staten Island has left severalneighborhoods exposed and vulnerable to future storms. The City, therefore, will completeinterim beach nourishment and short-termdune improvements in Staten Island, includingbeach nourishment in South Beach, CrescentBeach, and Tottenville; dune construction from New Dorp Beach to Oakwood Beach; and shoreline stabilization to close the breachat Wolfe’s Pond Park. DPR will ensure that this work, which began in May 2013 and will endby October 2013, makes effective use of existingFederal appropriations and enhances protectionduring the 2013 hurricane season and beyond.
Initiative 4Install armor stone shoreline protection(revetments) in Coney Island
Coney Island Creek provides a pathway for the"backdoor flooding" of much of SouthernBrooklyn. Subject to available funding, the City,therefore will raise the Creek’s lowest edge el-evations to a consistent grade with revetmentsto reduce the risk of flooding and erosion at lowspots bordering the Creek. The Mayor’s Officeof Long-Term Planning and Sustainability(OLTPS) will work with the New York City Economic Development Corporation (NYCEDC)to complete this project. The goal is to begindesign work in 2013 and complete the projectin three years.
Initiative 5Install armor stone shoreline protection(revetments) on Staten Island
The South Shore of Staten Island continues tobe at risk for future erosion of its beaches and bluffs. Subject to available funding, the City,therefore will implement shoreline protectionusing revetments in vulnerable locations on the
South Shore of Staten Island, such as Annadale.OLTPS will work with NYCEDC to complete thisproject. The goal is to begin design work in2013, with completion within three years.
Initiative 6Raise bulkheads in low-lyingneighborhoods across the city to minimize inland tidal flooding
Eight percent of the city’s shoreline will be atrisk of daily tidal flooding by 2050. Subject toavailable funding, the City, therefore, will imple-ment a program to raise bulkheads and othershoreline structures to minimize the risk of reg-ular flooding in targeted neighborhoods, includ-ing the bayside of the Rockaway Peninsula,Broad Channel and Howard Beach in Queens,West Midtown in Manhattan, Locust Point in theBronx, Greenpoint in Brooklyn, the North Shoreof Staten Island, and other low-lying locations.OLTPS will work with NYCEDC and other agen-cies to implement this program in conjunctionwith a new citywide waterfront inspections pro-gram that will assess needs throughout the fiveboroughs. The goal is to begin the first phase ofevaluations in 2013.
Initiative 7Complete emergency bulkhead repairsadjacent to the Belt Parkway in Southern Brooklyn
The failure of bulkheads adjacent to the BeltParkway has left several portions of this vitalroadway exposed and vulnerable to futurestorms. The City, therefore, will complete bulkhead repairs in areas damaged duringSandy, including at 14th Avenue, 17th Avenue,and 95th Street. DPR will complete this work by December 2013, making effective use of existing Federal appropriations and enhancingprotection during the 2013 hurricane seasonand beyond.
Beach Restoration for Summer 2013
Following Sandy, Mayor Bloomberg made a commitment to open New York City’s eight public beaches in time for Memorial Day weekend 2013. However,several key facilities necessary to meet this goal—including bathrooms, lifeguard stations, maintenance and operations offices, and concessions—had been completely destroyed or significantly damaged in the storm. In a coordinated interagency effort led by the Department ofParks & Recreation, with the Department of Design and Construction and other City, State and Federal partners, the City invested over $270 millionthat not only removed debris, corrected hazardous conditions, restored beach access and renovated damaged buildings, but also replaced the key facilities that were destroyed with new facilities designed to withstand future storms. These 35 prefabricated modular buildings will be used as bathrooms and lifeguard stations on the Rockaway Peninsula, Coney Island, and Staten Island and were designed and constructed to a height rangingfrom 7 to 14 feet above the existing grade to ensure maximum resiliency. Having met the Memorial Day opening date, the City, State, and Federal governments are now working to restore sand and other protective elements on the beaches .
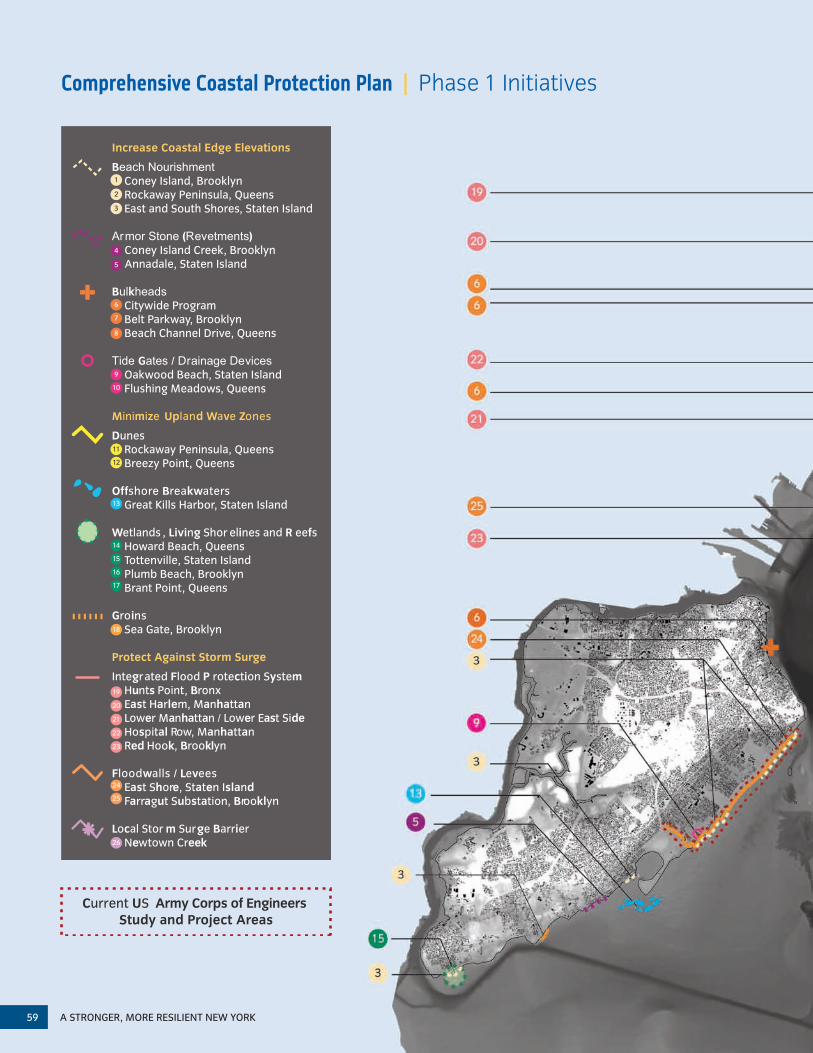
A STRONGER, MORE RESILIENT NEW YORK59
Increase Coastal Edge Elevations
Beach Nourishment Coney Island, Brooklyn Rockaway Peninsula, Queens East and South Shores, Staten Island
Armor Stone (Revetments) Coney Island Creek, Brooklyn Annadale, Staten Island
Bulkheads Citywide Program Belt Parkway, Brooklyn Beach Channel Drive, Queens
Tide Gates / Drainage Devices Oakwood Beach, Staten Island Flushing Meadows, Queens
Minimize Upland Wave Zones
Dunes Rockaway Peninsula, Queens Breezy Point, Queens
Offshore Breakwaters Great Kills Harbor, Staten Island
Wetlands , Living Shor elines and R eefs Howard Beach, Queens Tottenville, Staten Island Plumb Beach, Brooklyn Brant Point, Queens
Groins Sea Gate, Brooklyn
Protect Against Storm Surge
Integrated Flood P rotection System Hunts Point, Bronx East Harlem, Manhattan Lower Manhattan / Lower East Side Hospital Row, Manhattan Red Hook, Brooklyn
Floodwalls / Levees East Shore, Staten Island Farragut Substation, Brooklyn
Local Stor m Surge Barrier Newtown Creek
1
2
3
4
5
6
7
8
9
10
11
13
14
15
16
17
18
19
20
21
22
23
24
25
12
26
Current US Army Corps of Engineers Study and Project Areas
Comprehensive Coastal Protection Plan | Phase 1 Initiatives
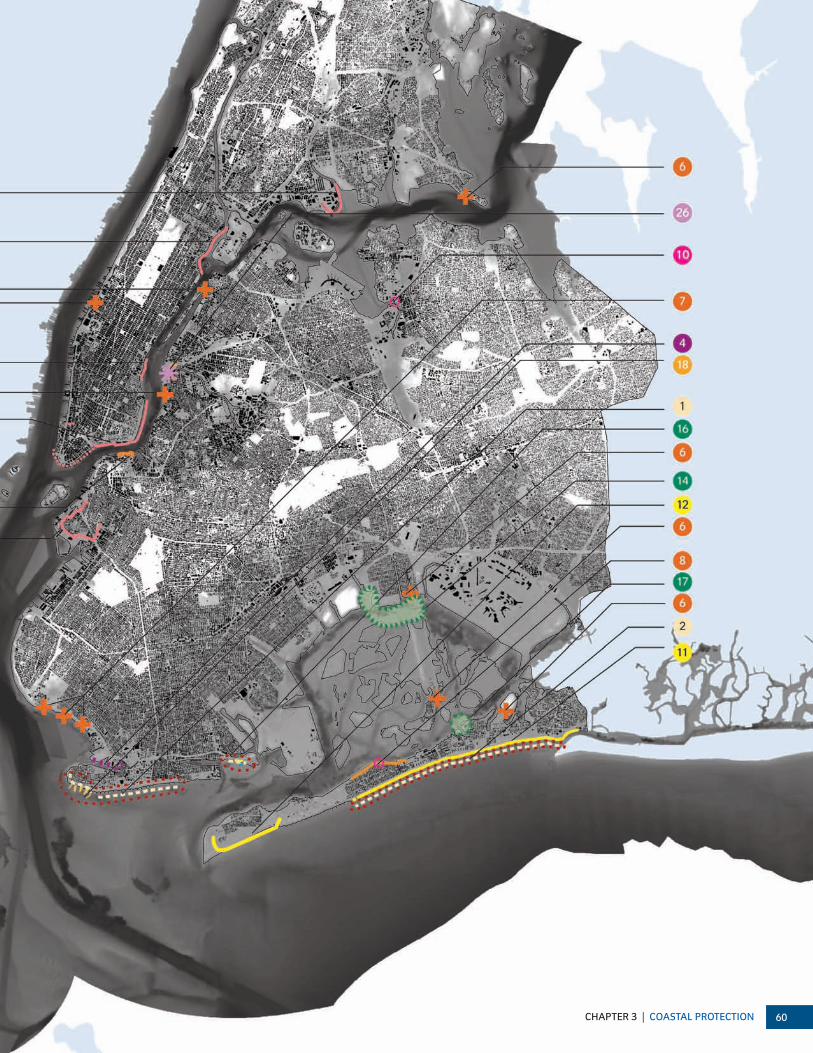
CHAPTER 3 | COASTAL PROTECTION 60
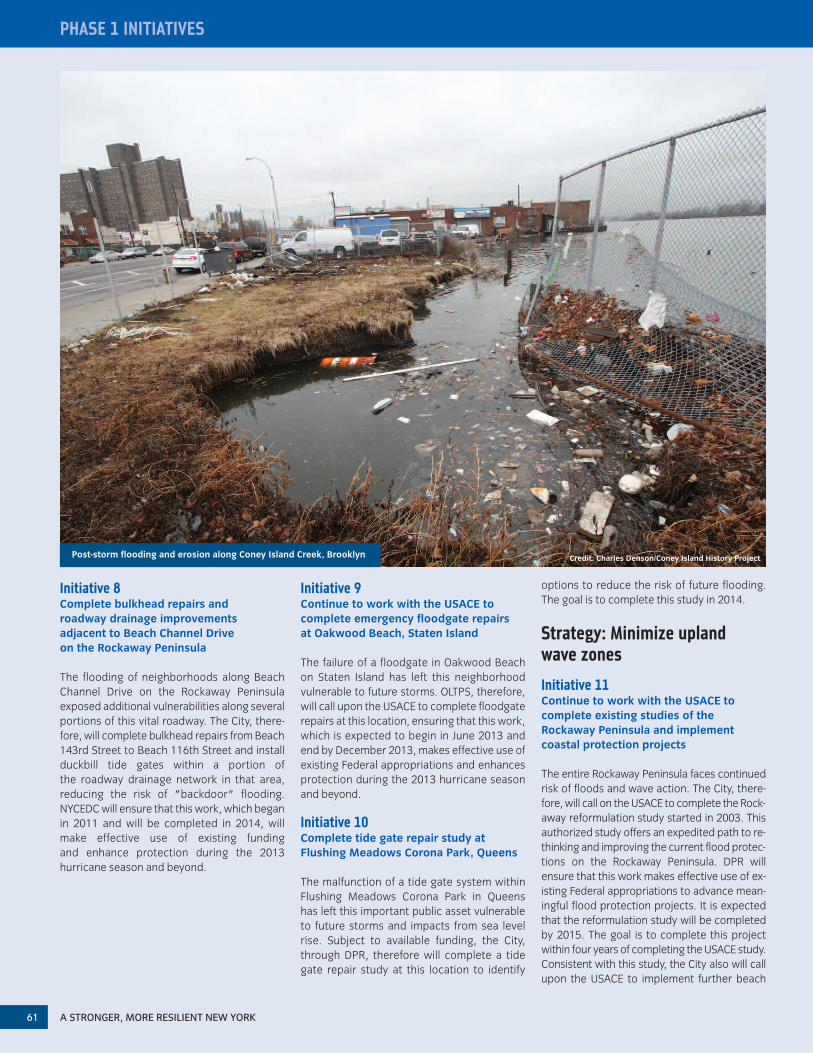
PHASE 1 INITIATIVES
A STRONGER, MORE RESILIENT NEW YORK61
Initiative 8Complete bulkhead repairs and roadway drainage improvements adjacent to Beach Channel Drive on the Rockaway Peninsula
The flooding of neighborhoods along BeachChannel Drive on the Rockaway Peninsula exposed additional vulnerabilities along severalportions of this vital roadway. The City, there-fore, will complete bulkhead repairs from Beach143rd Street to Beach 116th Street and installduckbill tide gates within a portion of the roadway drainage network in that area,reducing the risk of "backdoor" flooding.NYCEDC will ensure that this work, which beganin 2011 and will be completed in 2014, will make effective use of existing funding and enhance protection during the 2013hurricane season and beyond.
Initiative 9Continue to work with the USACE to complete emergency floodgate repairs at Oakwood Beach, Staten Island
The failure of a floodgate in Oakwood Beach on Staten Island has left this neighborhoodvulnerable to future storms. OLTPS, therefore,will call upon the USACE to complete floodgaterepairs at this location, ensuring that this work,which is expected to begin in June 2013 andend by December 2013, makes effective use ofexisting Federal appropriations and enhancesprotection during the 2013 hurricane seasonand beyond.
Initiative 10 Complete tide gate repair study at Flushing Meadows Corona Park, Queens
The malfunction of a tide gate system withinFlushing Meadows Corona Park in Queens has left this important public asset vulnerableto future storms and impacts from sea levelrise. Subject to available funding, the City,through DPR, therefore will complete a tidegate repair study at this location to identify
options to reduce the risk of future flooding.The goal is to complete this study in 2014.
Strategy: Minimize upland wave zones
Initiative 11Continue to work with the USACE tocomplete existing studies of the Rockaway Peninsula and implementcoastal protection projects
The entire Rockaway Peninsula faces continuedrisk of floods and wave action. The City, there-fore, will call on the USACE to complete the Rock-away reformulation study started in 2003. Thisauthorized study offers an expedited path to re-thinking and improving the current flood protec-tions on the Rockaway Peninsula. DPR willensure that this work makes effective use of ex-isting Federal appropriations to advance mean-ingful flood protection projects. It is expectedthat the reformulation study will be completedby 2015. The goal is to complete this projectwithin four years of completing the USACE study.Consistent with this study, the City also will callupon the USACE to implement further beach
Credit: Charles Denson/Coney Island History ProjectPost-storm flooding and erosion along Coney Island Creek, Brooklyn
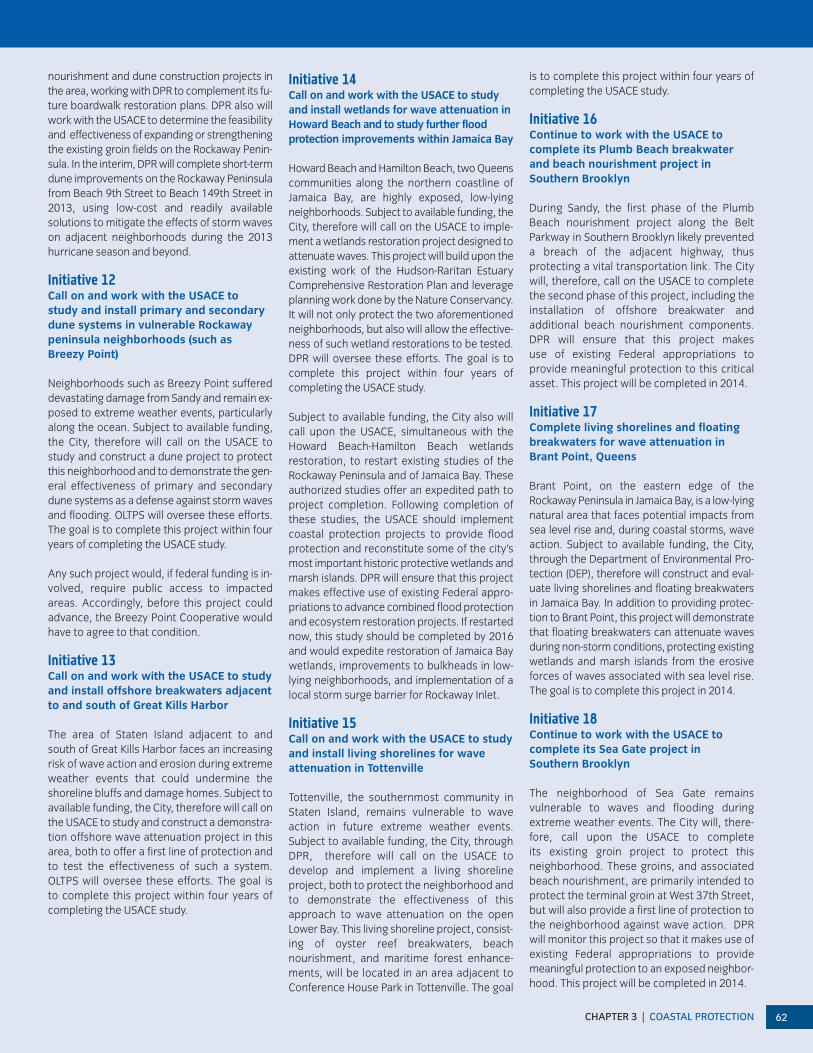
CHAPTER 3 | COASTAL PROTECTION 62
nourishment and dune construction projects inthe area, working with DPR to complement its fu-ture boardwalk restoration plans. DPR also willwork with the USACE to determine the feasibilityand effectiveness of expanding or strengtheningthe existing groin fields on the Rockaway Penin-sula. In the interim, DPR will complete short-termdune improvements on the Rockaway Peninsulafrom Beach 9th Street to Beach 149th Street in2013, using low-cost and readily available solutions to mitigate the effects of storm waveson adjacent neighborhoods during the 2013 hurricane season and beyond.
Initiative 12Call on and work with the USACE to study and install primary and secondarydune systems in vulnerable Rockaway peninsula neighborhoods (such as Breezy Point)
Neighborhoods such as Breezy Point suffereddevastating damage from Sandy and remain ex-posed to extreme weather events, particularlyalong the ocean. Subject to available funding,the City, therefore will call on the USACE tostudy and construct a dune project to protectthis neighborhood and to demonstrate the gen-eral effectiveness of primary and secondarydune systems as a defense against storm wavesand flooding. OLTPS will oversee these efforts.The goal is to complete this project within fouryears of completing the USACE study.
Any such project would, if federal funding is in-volved, require public access to impactedareas. Accordingly, before this project could advance, the Breezy Point Cooperative wouldhave to agree to that condition.
Initiative 13 Call on and work with the USACE to studyand install offshore breakwaters adjacentto and south of Great Kills Harbor
The area of Staten Island adjacent to and south of Great Kills Harbor faces an increasingrisk of wave action and erosion during extremeweather events that could undermine theshoreline bluffs and damage homes. Subject toavailable funding, the City, therefore will call onthe USACE to study and construct a demonstra-tion offshore wave attenuation project in thisarea, both to offer a first line of protection andto test the effectiveness of such a system.OLTPS will oversee these efforts. The goal isto complete this project within four years ofcompleting the USACE study.
Initiative 14 Call on and work with the USACE to studyand install wetlands for wave attenuation inHoward Beach and to study further flood protection improvements within Jamaica Bay
Howard Beach and Hamilton Beach, two Queenscommunities along the northern coastline of Jamaica Bay, are highly exposed, low-lying neighborhoods. Subject to available funding, theCity, therefore will call on the USACE to imple-ment a wetlands restoration project designed toattenuate waves. This project will build upon theexisting work of the Hudson-Raritan EstuaryComprehensive Restoration Plan and leverageplanning work done by the Nature Conservancy.It will not only protect the two aforementioned neighborhoods, but also will allow the effective-ness of such wetland restorations to be tested.DPR will oversee these efforts. The goal is tocomplete this project within four years of completing the USACE study.
Subject to available funding, the City also willcall upon the USACE, simultaneous with theHoward Beach-Hamilton Beach wetlandsrestoration, to restart existing studies of theRockaway Peninsula and of Jamaica Bay. Theseauthorized studies offer an expedited path toproject completion. Following completion ofthese studies, the USACE should implementcoastal protection projects to provide flood protection and reconstitute some of the city’smost important historic protective wetlands andmarsh islands. DPR will ensure that this projectmakes effective use of existing Federal appro-priations to advance combined flood protectionand ecosystem restoration projects. If restartednow, this study should be completed by 2016and would expedite restoration of Jamaica Baywetlands, improvements to bulkheads in low-lying neighborhoods, and implementation of alocal storm surge barrier for Rockaway Inlet.
Initiative 15Call on and work with the USACE to studyand install living shorelines for wave attenuation in Tottenville
Tottenville, the southernmost community inStaten Island, remains vulnerable to wave action in future extreme weather events. Subject to available funding, the City, throughDPR, therefore will call on the USACE to develop and implement a living shoreline project, both to protect the neighborhood andto demonstrate the effectiveness of this approach to wave attenuation on the openLower Bay. This living shoreline project, consist-ing of oyster reef breakwaters, beach nourishment, and maritime forest enhance-ments, will be located in an area adjacent toConference House Park in Tottenville. The goal
is to complete this project within four years ofcompleting the USACE study.
Initiative 16Continue to work with the USACE to complete its Plumb Beach breakwaterand beach nourishment project in Southern Brooklyn
During Sandy, the first phase of the PlumbBeach nourishment project along the Belt Parkway in Southern Brooklyn likely preventeda breach of the adjacent highway, thus protecting a vital transportation link. The Citywill, therefore, call on the USACE to completethe second phase of this project, including theinstallation of offshore breakwater and additional beach nourishment components.DPR will ensure that this project makes use of existing Federal appropriations to provide meaningful protection to this criticalasset. This project will be completed in 2014.
Initiative 17Complete living shorelines and floatingbreakwaters for wave attenuation inBrant Point, Queens
Brant Point, on the eastern edge of the Rockaway Peninsula in Jamaica Bay, is a low-lyingnatural area that faces potential impacts fromsea level rise and, during coastal storms, waveaction. Subject to available funding, the City,through the Department of Environmental Pro-tection (DEP), therefore will construct and eval-uate living shorelines and floating breakwatersin Jamaica Bay. In addition to providing protec-tion to Brant Point, this project will demonstratethat floating breakwaters can attenuate wavesduring non-storm conditions, protecting existingwetlands and marsh islands from the erosiveforces of waves associated with sea level rise.The goal is to complete this project in 2014.
Initiative 18Continue to work with the USACE to complete its Sea Gate project in Southern Brooklyn
The neighborhood of Sea Gate remains vulnerable to waves and flooding during extreme weather events. The City will, there-fore, call upon the USACE to complete its existing groin project to protect this neighborhood. These groins, and associatedbeach nourishment, are primarily intended toprotect the terminal groin at West 37th Street,but will also provide a first line of protection tothe neighborhood against wave action. DPRwill monitor this project so that it makes use ofexisting Federal appropriations to providemeaningful protection to an exposed neighbor-hood. This project will be completed in 2014.
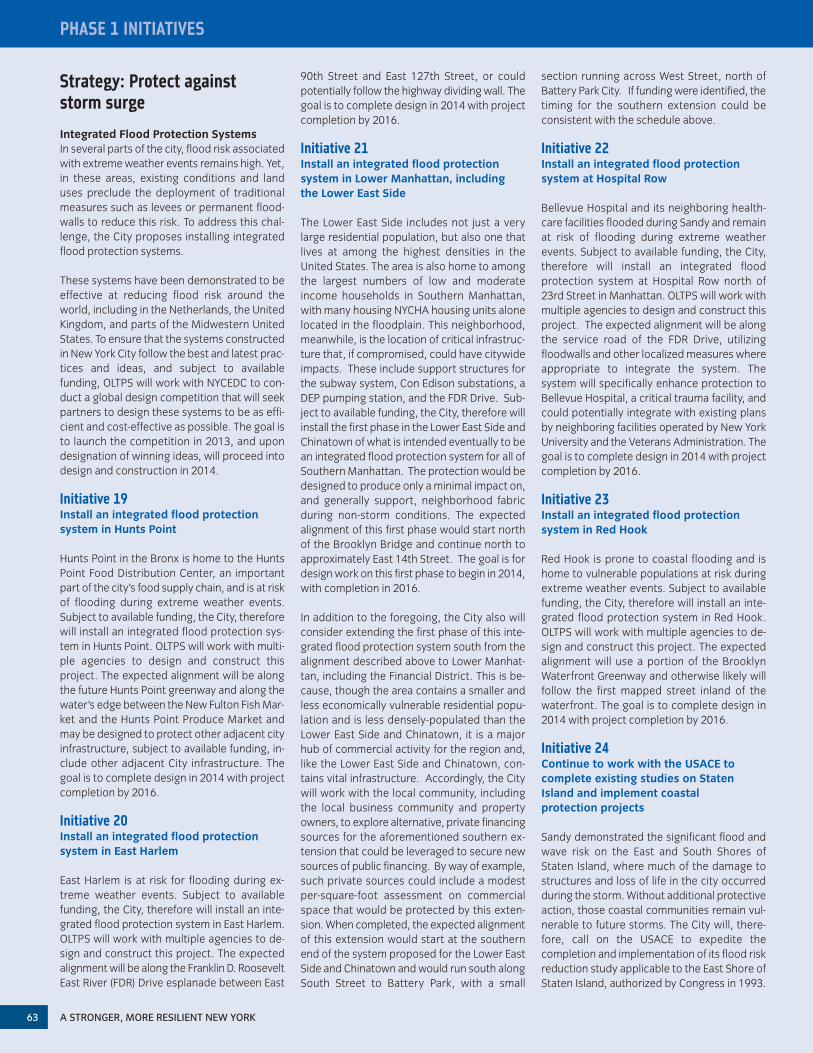
PHASE 1 INITIATIVES
Strategy: Protect against storm surg e
Integrated Flood Protection SystemsIn several parts of the city, flood risk associatedwith extreme weather events remains high. Yet,in these areas, existing conditions and landuses preclude the deployment of traditionalmeasures such as levees or permanent flood-walls to reduce this risk. To address this chal-lenge, the City proposes installing integratedflood protection systems.
These systems have been demonstrated to beeffective at reducing flood risk around theworld, including in the Netherlands, the UnitedKingdom, and parts of the Midwestern UnitedStates. To ensure that the systems constructedin New York City follow the best and latest prac-tices and ideas, and subject to available funding, OLTPS will work with NYCEDC to con-duct a global design competition that will seekpartners to design these systems to be as effi-cient and cost-effective as possible. The goal isto launch the competition in 2013, and upon designation of winning ideas, will proceed intodesign and construction in 2014.
Initiative 19Install an integrated flood protection system in Hunts Point
Hunts Point in the Bronx is home to the HuntsPoint Food Distribution Center, an importantpart of the city’s food supply chain, and is at riskof flooding during extreme weather events.Subject to available funding, the City, thereforewill install an integrated flood protection sys-tem in Hunts Point. OLTPS will work with multi-ple agencies to design and construct thisproject. The expected alignment will be alongthe future Hunts Point greenway and along thewater’s edge between the New Fulton Fish Mar-ket and the Hunts Point Produce Market andmay be designed to protect other adjacent cityinfrastructure, subject to available funding, in-clude other adjacent City infrastructure. Thegoal is to complete design in 2014 with projectcompletion by 2016.
Initiative 20Install an integrated flood protection system in East Harlem
East Harlem is at risk for flooding during ex-treme weather events. Subject to availablefunding, the City, therefore will install an inte-grated flood protection system in East Harlem.OLTPS will work with multiple agencies to de-sign and construct this project. The expectedalignment will be along the Franklin D. RooseveltEast River (FDR) Drive esplanade between East
90th Street and East 127th Street, or could potentially follow the highway dividing wall. Thegoal is to complete design in 2014 with projectcompletion by 2016.
Initiative 21Install an integrated flood protection system in Lower Manhattan, including the Lower East Side
The Lower East Side includes not just a verylarge residential population, but also one thatlives at among the highest densities in theUnited States. The area is also home to amongthe largest numbers of low and moderate income households in Southern Manhattan,with many housing NYCHA housing units alonelocated in the floodplain. This neighborhood,meanwhile, is the location of critical infrastruc-ture that, if compromised, could have citywideimpacts. These include support structures forthe subway system, Con Edison substations, aDEP pumping station, and the FDR Drive. Sub-ject to available funding, the City, therefore willinstall the first phase in the Lower East Side andChinatown of what is intended eventually to bean integrated flood protection system for all ofSouthern Manhattan. The protection would bedesigned to produce only a minimal impact on,and generally support, neighborhood fabricduring non-storm conditions. The expectedalignment of this first phase would start northof the Brooklyn Bridge and continue north toapproximately East 14th Street. The goal is fordesign work on this first phase to begin in 2014,with completion in 2016.
In addition to the foregoing, the City also willconsider extending the first phase of this inte-grated flood protection system south from thealignment described above to Lower Manhat-tan, including the Financial District. This is be-cause, though the area contains a smaller andless economically vulnerable residential popu-lation and is less densely-populated than theLower East Side and Chinatown, it is a majorhub of commercial activity for the region and,like the Lower East Side and Chinatown, con-tains vital infrastructure. Accordingly, the Citywill work with the local community, includingthe local business community and propertyowners, to explore alternative, private financingsources for the aforementioned southern ex-tension that could be leveraged to secure newsources of public financing. By way of example,such private sources could include a modestper-square-foot assessment on commercialspace that would be protected by this exten-sion. When completed, the expected alignmentof this extension would start at the southernend of the system proposed for the Lower EastSide and Chinatown and would run south alongSouth Street to Battery Park, with a small
section running across West Street, north ofBattery Park City. If funding were identified, thetiming for the southern extension could be consistent with the schedule above.
Initiative 22Install an integrated flood protectionsystem at Hospital Row
Bellevue Hospital and its neighboring health-care facilities flooded during Sandy and remainat risk of flooding during extreme weatherevents. Subject to available funding, the City,therefore will install an integrated flood protection system at Hospital Row north of23rd Street in Manhattan. OLTPS will work withmultiple agencies to design and construct thisproject. The expected alignment will be alongthe service road of the FDR Drive, utilizing floodwalls and other localized measures whereappropriate to integrate the system. The system will specifically enhance protection toBellevue Hospital, a critical trauma facility, andcould potentially integrate with existing plansby neighboring facilities operated by New YorkUniversity and the Veterans Administration. Thegoal is to complete design in 2014 with projectcompletion by 2016.
Initiative 23Install an integrated flood protection system in Red Hook
Red Hook is prone to coastal flooding and ishome to vulnerable populations at risk duringextreme weather events. Subject to availablefunding, the City, therefore will install an inte-grated flood protection system in Red Hook.OLTPS will work with multiple agencies to de-sign and construct this project. The expectedalignment will use a portion of the Brooklyn Waterfront Greenway and otherwise likely willfollow the first mapped street inland of thewaterfront. The goal is to complete design in2014 with project completion by 2016.
Initiative 24Continue to work with the USACE to complete existing studies on Staten Island and implement coastal protection projects
Sandy demonstrated the significant flood andwave risk on the East and South Shores ofStaten Island, where much of the damage tostructures and loss of life in the city occurredduring the storm. Without additional protectiveaction, those coastal communities remain vul-nerable to future storms. The City will, there-fore, call on the USACE to expedite thecompletion and implementation of its flood riskreduction study applicable to the East Shore ofStaten Island, authorized by Congress in 1993.
A STRONGER, MORE RESILIENT NEW YORK63
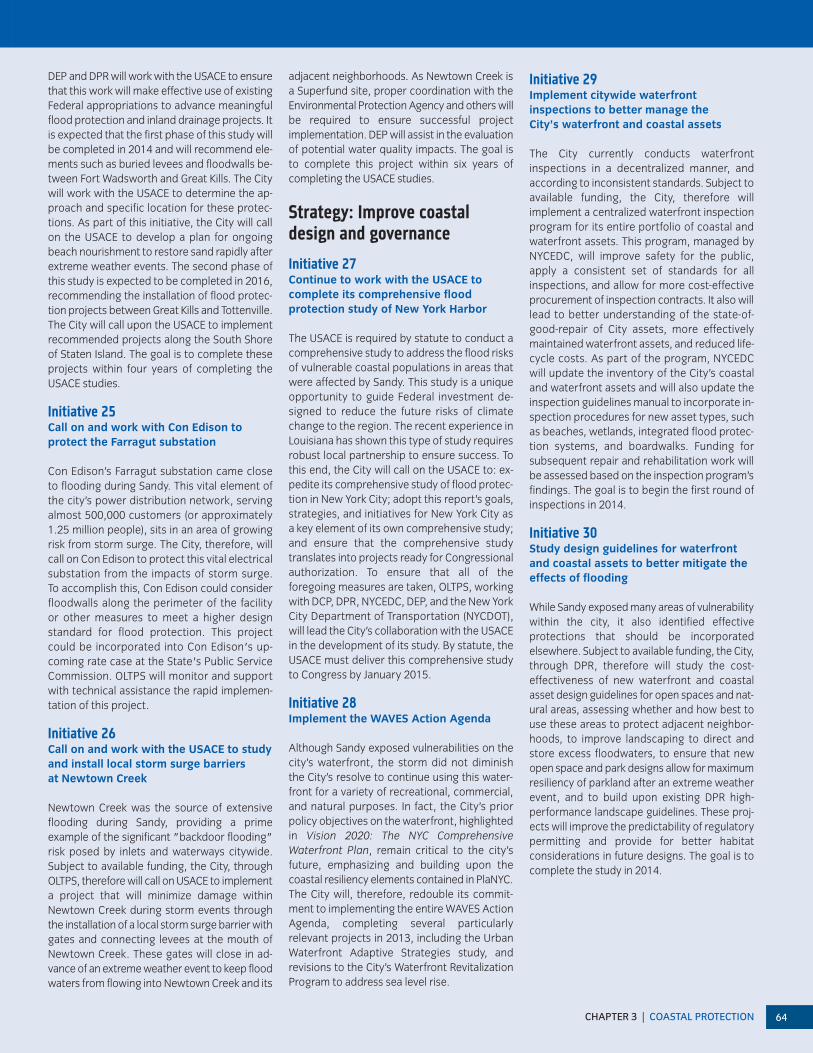
DEP and DPR will work with the USACE to ensurethat this work will make effective use of existingFederal appropriations to advance meaningfulflood protection and inland drainage projects. Itis expected that the first phase of this study willbe completed in 2014 and will recommend ele-ments such as buried levees and floodwalls be-tween Fort Wadsworth and Great Kills. The Citywill work with the USACE to determine the ap-proach and specific location for these protec-tions. As part of this initiative, the City will callon the USACE to develop a plan for ongoingbeach nourishment to restore sand rapidly afterextreme weather events. The second phase ofthis study is expected to be completed in 2016,recommending the installation of flood protec-tion projects between Great Kills and Tottenville.The City will call upon the USACE to implementrecommended projects along the South Shoreof Staten Island. The goal is to complete theseprojects within four years of completing theUSACE studies.
Initiative 25Call on and work with Con Edison to protect the Farragut substation
Con Edison’s Farragut substation came closeto flooding during Sandy. This vital element ofthe city’s power distribution network, servingalmost 500,000 customers (or approximately1.25 million people), sits in an area of growingrisk from storm surge. The City, therefore, willcall on Con Edison to protect this vital electricalsubstation from the impacts of storm surge. To accomplish this, Con Edison could considerfloodwalls along the perimeter of the facility or other measures to meet a higher design standard for flood protection. This projectcould be incorporated into Con Edison's up-coming rate case at the State's Public ServiceCommission. OLTPS will monitor and supportwith technical assistance the rapid implemen-tation of this project.
Initiative 26Call on and work with the USACE to studyand install local storm surge barriers at Newtown Creek
Newtown Creek was the source of extensiveflooding during Sandy, providing a prime example of the significant "backdoor flooding"risk posed by inlets and waterways citywide.Subject to available funding, the City, throughOLTPS, therefore will call on USACE to implementa project that will minimize damage within Newtown Creek during storm events throughthe installation of a local storm surge barrier withgates and connecting levees at the mouth ofNewtown Creek. These gates will close in ad-vance of an extreme weather event to keep floodwaters from flowing into Newtown Creek and its
adjacent neighborhoods. As Newtown Creek isa Superfund site, proper coordination with theEnvironmental Protection Agency and others willbe required to ensure successful project implementation. DEP will assist in the evaluationof potential water quality impacts. The goal isto complete this project within six years of completing the USACE studies.
Strategy: Improve coastal design and governance
Initiative 27Continue to work with the USACE to complete its comprehensive flood protection study of New York Harbor
The USACE is required by statute to conduct acomprehensive study to address the flood risksof vulnerable coastal populations in areas thatwere affected by Sandy. This study is a uniqueopportunity to guide Federal investment de-signed to reduce the future risks of climatechange to the region. The recent experience inLouisiana has shown this type of study requiresrobust local partnership to ensure success. Tothis end, the City will call on the USACE to: ex-pedite its comprehensive study of flood protec-tion in New York City; adopt this report’s goals,strategies, and initiatives for New York City as a key element of its own comprehensive study;and ensure that the comprehensive studytranslates into projects ready for Congressionalauthorization. To ensure that all of the foregoing measures are taken, OLTPS, workingwith DCP, DPR, NYCEDC, DEP, and the New YorkCity Department of Transportation (NYCDOT),will lead the City’s collaboration with the USACEin the development of its study. By statute, theUSACE must deliver this comprehensive studyto Congress by January 2015.
Initiative 28Implement the WAVES Action Agenda
Although Sandy exposed vulnerabilities on thecity’s waterfront, the storm did not diminish the City’s resolve to continue using this water-front for a variety of recreational, commercial,and natural purposes. In fact, the City’s prior policy objectives on the waterfront, highlightedin Vision 2020: The NYC Comprehensive Waterfront Plan, remain critical to the city’sfuture, emphasizing and building upon thecoastal resiliency elements contained in PlaNYC.The City will, therefore, redouble its commit-ment to implementing the entire WAVES ActionAgenda, completing several particularly relevant projects in 2013, including the UrbanWaterfront Adaptive Strategies study, and revisions to the City’s Waterfront RevitalizationProgram to address sea level rise.
Initiative 29Implement citywide waterfront inspections to better manage the City’s waterfront and coastal assets
The City currently conducts waterfront inspections in a decentralized manner, and according to inconsistent standards. Subject toavailable funding, the City, therefore will implement a centralized waterfront inspectionprogram for its entire portfolio of coastal andwaterfront assets. This program, managed byNYCEDC, will improve safety for the public,apply a consistent set of standards for all inspections, and allow for more cost-effectiveprocurement of inspection contracts. It also willlead to better understanding of the state-of-good-repair of City assets, more effectivelymaintained waterfront assets, and reduced life-cycle costs. As part of the program, NYCEDCwill update the inventory of the City’s coastaland waterfront assets and will also update theinspection guidelines manual to incorporate in-spection procedures for new asset types, suchas beaches, wetlands, integrated flood protec-tion systems, and boardwalks. Funding for subsequent repair and rehabilitation work willbe assessed based on the inspection program’sfindings. The goal is to begin the first round ofinspections in 2014.
Initiative 30Study design guidelines for waterfrontand coastal assets to better mitigate theeffects of flooding
While Sandy exposed many areas of vulnerabilitywithin the city, it also identified effective protections that should be incorporated elsewhere. Subject to available funding, the City,through DPR, therefore will study the cost-effectiveness of new waterfront and coastalasset design guidelines for open spaces and nat-ural areas, assessing whether and how best touse these areas to protect adjacent neighbor-hoods, to improve landscaping to direct andstore excess floodwaters, to ensure that newopen space and park designs allow for maximumresiliency of parkland after an extreme weatherevent, and to build upon existing DPR high-performance landscape guidelines. These proj-ects will improve the predictability of regulatorypermitting and provide for better habitat considerations in future designs. The goal is tocomplete the study in 2014.
CHAPTER 3 | COASTAL PROTECTION 64
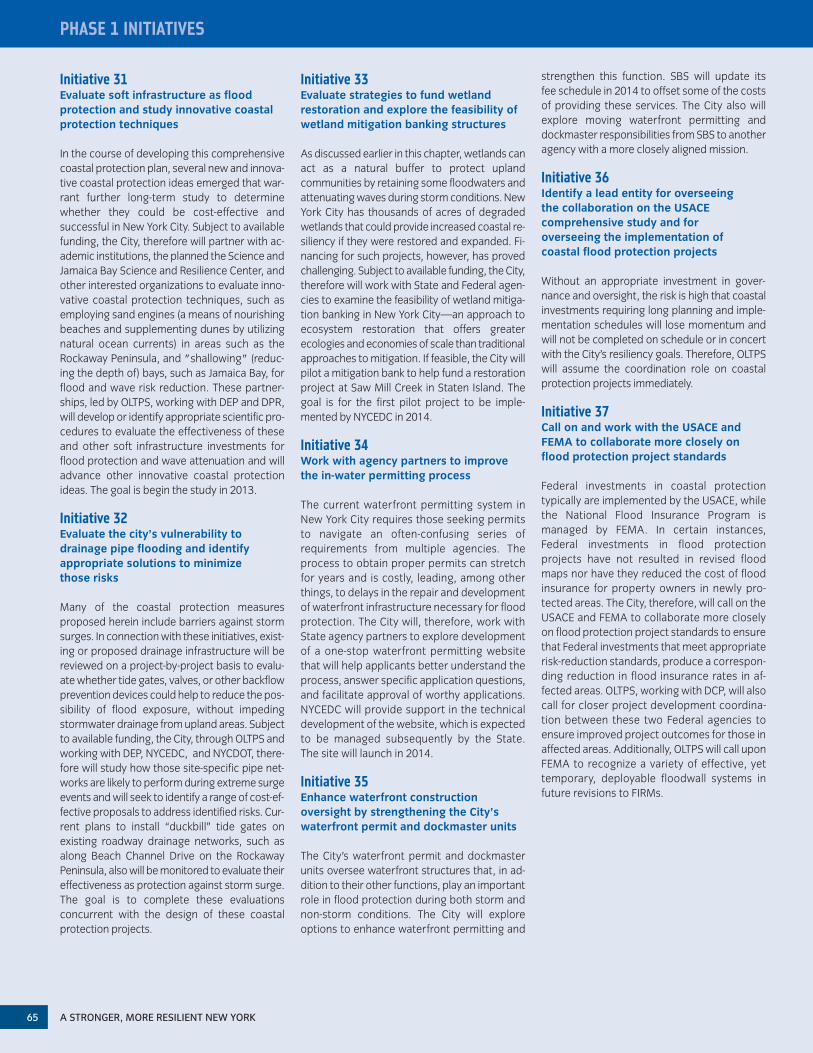
PHASE 1 INITIATIVES
Initiative 31Evaluate soft infrastructure as flood protection and study innovative coastalprotection techniques
In the course of developing this comprehensivecoastal protection plan, several new and innova-tive coastal protection ideas emerged that war-rant further long-term study to determinewhether they could be cost-effective and successful in New York City. Subject to availablefunding, the City, therefore will partner with ac-ademic institutions, the planned the Science andJamaica Bay Science and Resilience Center, andother interested organizations to evaluate inno-vative coastal protection techniques, such asemploying sand engines (a means of nourishingbeaches and supplementing dunes by utilizingnatural ocean currents) in areas such as theRockaway Peninsula, and "shallowing" (reduc-ing the depth of) bays, such as Jamaica Bay, forflood and wave risk reduction. These partner-ships, led by OLTPS, working with DEP and DPR,will develop or identify appropriate scientific pro-cedures to evaluate the effectiveness of theseand other soft infrastructure investments forflood protection and wave attenuation and willadvance other innovative coastal protectionideas. The goal is begin the study in 2013.
Initiative 32Evaluate the city’s vulnerability todrainage pipe flooding and identify appropriate solutions to minimize those risks
Many of the coastal protection measures proposed herein include barriers against stormsurges. In connection with these initiatives, exist-ing or proposed drainage infrastructure will bereviewed on a project-by-project basis to evalu-ate whether tide gates, valves, or other backflowprevention devices could help to reduce the pos-sibility of flood exposure, without impedingstormwater drainage from upland areas. Subjectto available funding, the City, through OLTPS andworking with DEP, NYCEDC, and NYCDOT, there-fore will study how those site-specific pipe net-works are likely to perform during extreme surgeevents and will seek to identify a range of cost-ef-fective proposals to address identified risks. Cur-rent plans to install “duckbill” tide gates onexisting roadway drainage networks, such asalong Beach Channel Drive on the RockawayPeninsula, also will be monitored to evaluate theireffectiveness as protection against storm surge.The goal is to complete these evaluations concurrent with the design of these coastal protection projects.
Initiative 33Evaluate strategies to fund wetlandrestoration and explore the feasibility ofwetland mitigation banking structures
As discussed earlier in this chapter, wetlands canact as a natural buffer to protect upland communities by retaining some floodwaters andattenuating waves during storm conditions. NewYork City has thousands of acres of degradedwetlands that could provide increased coastal re-siliency if they were restored and expanded. Fi-nancing for such projects, however, has provedchallenging. Subject to available funding, the City,therefore will work with State and Federal agen-cies to examine the feasibility of wetland mitiga-tion banking in New York City—an approach toecosystem restoration that offers greater ecologies and economies of scale than traditionalapproaches to mitigation. If feasible, the City willpilot a mitigation bank to help fund a restorationproject at Saw Mill Creek in Staten Island. Thegoal is for the first pilot project to be imple-mented by NYCEDC in 2014.
Initiative 34Work with agency partners to improvethe in-water permitting process
The current waterfront permitting system inNew York City requires those seeking permitsto navigate an often-confusing series of requirements from multiple agencies. Theprocess to obtain proper permits can stretchfor years and is costly, leading, among otherthings, to delays in the repair and developmentof waterfront infrastructure necessary for floodprotection. The City will, therefore, work withState agency partners to explore developmentof a one-stop waterfront permitting websitethat will help applicants better understand theprocess, answer specific application questions,and facilitate approval of worthy applications.NYCEDC will provide support in the technicaldevelopment of the website, which is expectedto be managed subsequently by the State. The site will launch in 2014.
Initiative 35Enhance waterfront construction oversight by strengthening the City’s waterfront permit and dockmaster units
The City’s waterfront permit and dockmasterunits oversee waterfront structures that, in ad-dition to their other functions, play an importantrole in flood protection during both storm andnon-storm conditions. The City will explore options to enhance waterfront permitting and
strengthen this function. SBS will update its fee schedule in 2014 to offset some of the costsof providing these services. The City also will explore moving waterfront permitting and dockmaster responsibilities from SBS to anotheragency with a more closely aligned mission.
Initiative 36Identify a lead entity for overseeing the collaboration on the USACE comprehensive study and for overseeing the implementation of coastal flood protection projects
Without an appropriate investment in gover-nance and oversight, the risk is high that coastalinvestments requiring long planning and imple-mentation schedules will lose momentum andwill not be completed on schedule or in concertwith the City’s resiliency goals. Therefore, OLTPSwill assume the coordination role on coastal protection projects immediately.
Initiative 37Call on and work with the USACE andFEMA to collaborate more closely onflood protection project standards
Federal investments in coastal protection typically are implemented by the USACE, whilethe National Flood Insurance Program is managed by FEMA. In certain instances, Federal investments in flood protection projects have not resulted in revised floodmaps nor have they reduced the cost of floodinsurance for property owners in newly pro-tected areas. The City, therefore, will call on theUSACE and FEMA to collaborate more closelyon flood protection project standards to ensurethat Federal investments that meet appropriaterisk-reduction standards, produce a correspon-ding reduction in flood insurance rates in af-fected areas. OLTPS, working with DCP, will alsocall for closer project development coordina-tion between these two Federal agencies to ensure improved project outcomes for those inaffected areas. Additionally, OLTPS will call uponFEMA to recognize a variety of effective, yettemporary, deployable floodwall systems in future revisions to FIRMs.
A STRONGER, MORE RESILIENT NEW YORK65
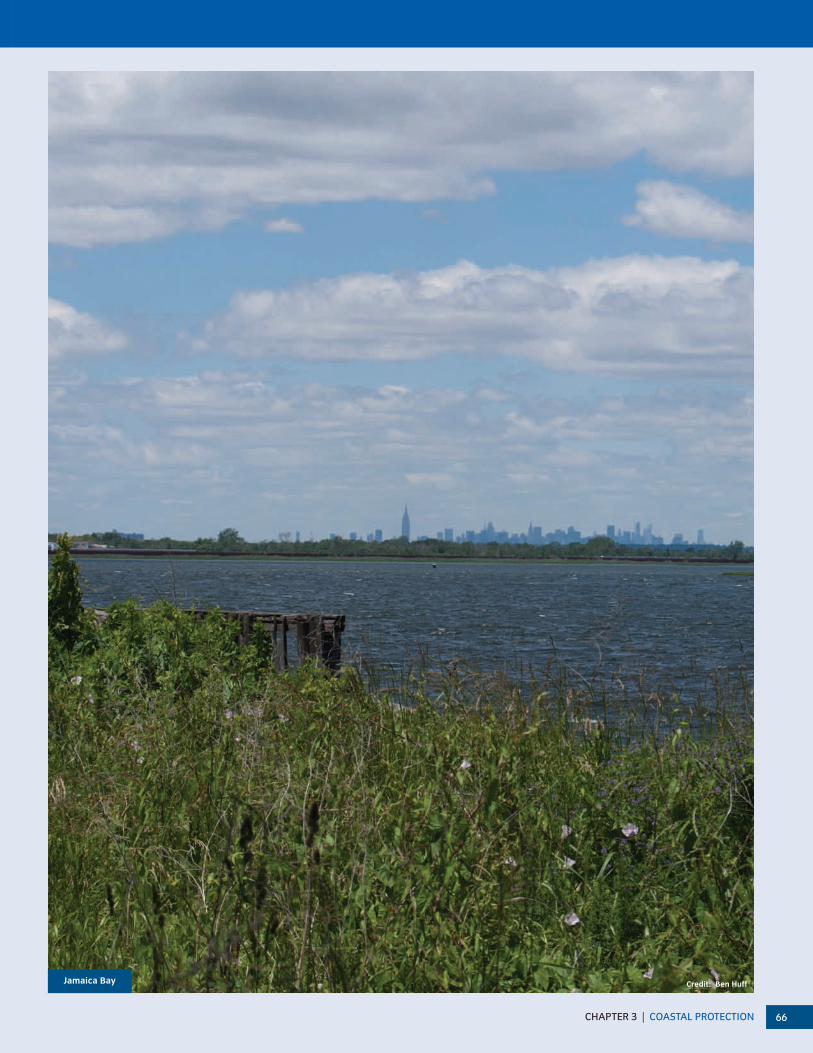
CHAPTER 3 | COASTAL PROTECTION 66
Credit: Ben HuffJamaica Bay