coastal household adaptation cost requirements to sea level rise impacts
TRANSCRIPT
ORIGINAL ARTICLE
Coastal household adaptation cost requirementsto sea level rise impacts
Amornpun Kulpraneet
Received: 10 November 2011 /Accepted: 24 January 2012 /Published online: 4 April 2012# Springer Science+Business Media B.V. 2012
Abstract This study assessed the autonomous adaptation cost requirements of coastalhouseholds to sea level rise impacts at a level to accommodate and protect (excludingretreat). The study examined six vulnerable villages, including both urbanized and fisherycommunities, located in the Gulf of Thailand. Half of them were near the shore, and theother half were further inland. In initiating the study, to assess actual adaptation costs,common household adaptative measures were first identified; then, using a questionnaire tocollect associated costs data, interviews were conducted with individual households. Topredict future adaptation costs, the study applied the budgeting for recurrent costs ofinvestment and the future value of an equal annual expenditures payment. Adaptation costswere classified into capital and operating expenditures. Then a statistical comparison wascompleted of the mean differences in costs between the villages. The study results indicatethat the impacted households primarily spent their money for capital expenditures related tohome and farming environments. Operating expenditures are not a concern for them. Theexpected future adaptation costs adjusted with inflation throughout the next 30 years will befive times that of the present costs. This will require households to plan their savings verycarefully. Whereas the adaptation costs of urbanized villages are clearly higher than those offishery villages, there is no significant difference in the costs between near shore and next-to-shore villages. Information regarding adaptation costs at the household level is extremelyrare. Knowing the requisite amount for the adaptation costs will be of added benefit to policymakers preparing for future assistance programs.
Keywords Sea level rise impacts . Coastal household . Autonomous adaptation . Adaptationcosts . Capital expenditures . Operating expenditures
Mitig Adapt Strateg Glob Change (2013) 18:285–302DOI 10.1007/s11027-012-9363-9
A. Kulpraneet (*)Faculty of Environment and Resource Studies, Mahidol University,999 Phuttamonthon 4 Road, Salaya, Nakhon Pathom 73170, Thailande-mail: [email protected]
1 Introduction
Sea level rise is one of the most serious impacts induced by global climate change to coasts.People living along the coasts need to adapt their livelihoods with the increasing costs.Information related to adaptation costs to sea level rise is far from adequate in terms of bothbeing outdated and the category requirements (Parry et al. 2009a). Although most studiesrelated to the adaptation costs to sea level rise have focused on planned adaptations and beenconducted on the basis of models and approaches originally designed for the market-basedeconomy of industrialized countries (developed countries), the same models are generallyapplied to developing countries when studying their adaptation costs (Margulis et al. 2009).The models typically assess adaptation costs based on building dikes, beach nourishment, andport upgrades. Such adaptive measures undoubtedly require financial support from respectivegovernment authorities. An example utilizing such models was the additional global invest-ment, of 11 billion USD, toward the coastal zone for a planned adaptation to a sea level riseneeded in 2030, as assessed by United Nations Framework Convention on Climate Change(2007). Developing countries would need about half of the required investment. For theautonomous adaptations at the sectoral level to sea level rise impacts, there are few studieson the associated cost requirements or the appropriate cost assessment methodologies.
This study assessed the autonomous adaptation cost requirements of the household sector atthe level of accommodate and protect (excluding retreat). The studied sites included sixvulnerable coastal villages located in the Gulf of Thailand, the most impacted area by sea levelrise in Thailand and one of the most impacted in Southeast Asia (Umitsu 2000). Half of thevillages under investigationwere near-shore villages, and the other half were further inland (nextto the near-shore, approximate 1,000 m from shore). Previous studies provided the requisiteresearch and data needed to review and identify common household adaptative measures used toaccommodate to and protect from the impacts of a rise in sea level. Using questionnaires, themethod typically used in collecting data at the household level in developing countries (UnitedNation 2005), in personal interviews, informants provided detailed information aboutboth their past household adaptation costs and expenditures and their expected futureadaptation costs for those adaptive measures. Focusing on direct costs, this studyclassified household adaptation costs into two types: capital expenditures and operatingexpenditures. Combined with the study results of the required adaptation costs, inflationand the average useful life of physical adaptive measures, given that the degree of sealevel rise impacts is maintained, the study forecasts the autonomous adaptation costrequirements of the studied areas for the next 30 years.
The assessed autonomous adaptation costs served as references for: a) the required costsfor which impacted households should plan their self-financial resources to cope with; b)testing the effectiveness of designed microfinance by comparing with the amount of saving(willingness to save) obtained. In addition, knowing the amount of costs required forautonomous adaptations of households will be of additional benefit to policy makers inpreparing for future assistance programs. Such assistance is perhaps more practical with lesstime and costs needed for their implementation in comparison with the large investmentcosts of planned adaptations.
2 Reviews of sea level rise, adaptations, and adaptation costs assessment
Many aspects of climate change are currently impacting coastal areas. However, because ofthe continued increase in sea level from polar glacier melting and sea thermal expansion, the
286 Mitig Adapt Strateg Glob Change (2013) 18:285–302
impact of sea level rise is considered one of the most serious current threats. Potentialimpacts will include both socio-economic and biogeophysical sectors in the results ofincreasing flood frequency, inundation, coastal erosion, rising of water table, and saltwaterintrusion (Nicholls 2003; Klein and Nicholls 1999). The damage from those impacts can befurther categorized into direct and indirect (Messner and Meyer 2005). Direct damage includesall varieties of harm that relate to the immediate physical contact of water to humans, property,and the environment. Indirect occurs as a further consequence of the disruption of economic andsocial activities. However, the actual degree of damages from sea level rise to a specific coastdepends on the adaptability of the affected socio-economic and ecological systems, as well astheir potential for harm by a hazardous event (Cutter 1996). Scientific knowledge about theassociated increase in sea level is considerable. Although the results varied, a number of studies(Hoffman et al. 1983; Smith and Tirpak 1990; Wigley and Raper 1992; and Meehl et al. 2007)were conducted. However, the variations in sea level are normally measured in two ways.Eustatic sea level represents the level of the ocean independent of landmovements. Relative sealevel is measured relative to the local land surface. Most researchers focus on relative sea levelchange (Carter and La Rovere 2001).
Differentiation in the adaptations to climate change influences include: (i) adaptation thateconomic agents will undertake on their own in the absence of government policies orprograms, and (ii) actions that a government undertakes (Sathaye and Christensen 1998). Fromanother perspective, the classification of adaptations can include two main categories: auton-omous and planned (Schneider and Sarukhan 2001). Autonomous adaptation takes place inreactive response to climatic stimuli without directed intervention by a public agency. Plannedadaptation is anticipatory, policy related, and actions undertaken before influences are apparent.In a perfect world, with no market failures, autonomous adaptation is the best way to adapt toclimate change and public involvement will be unnecessary (Malik et al. 2010). However, dueto constraints with respect to information and resources, autonomous adaptation alone may notbe optimal. Adaptations require the synergy of plans, actions, and adjustments at every levelstarting at the individual level and going on to the community, national, and international levels.Focusing on sea level rises, adaptation measures at the national and regional levels includeprotection of economic infrastructure, protection of coast and marine ecosystems, coastal zonemanagement, development of related legislations, research, and enhancing public awareness.At the household level, Resurreccion et al. (2008) documents current practices to adapt to sealevel rise, particularly for developing countries in Southeast Asia. Among other, those practicesinclude reinforcing house structure, increasing food stock, changing to flood resistant cropvarieties, construction of small protective structures, and obtaining financial assistance fromgovernment and social networks. Future adaptations required for the coastal communities insuch regions need to support improved livelihood initiatives by assessing the existing andhistorical coping strategies, exchange knowledge between different communities, and sharebest practices throughout the region (USAID 2010).
Assessing the costs and benefits of adaptation options forms an important part ofadaptation planning since it can: a) identify the scale of the adaptation issue and raiseawareness; and b) provide sufficient information to allow decision makers to choose theproper adaptation options (UNFCCC 2010). The economic perspective of Sathaye andChristensen is that economic efficiency (cost and benefit analysis) provides the basis forthe optimal adaptation in which the costs for adaptation are less than the adaptation benefits.The basis for the estimation of adaptation costs is the value of the real resources societygives up (opportunity costs) to create adaptation benefits; whereas, adaptation benefits arethe value of the climate change damages avoided by adaptation. Net adaptation benefits arethe value of adaptation benefits minus adaptation costs (Callaway et al. 1998). Since the
Mitig Adapt Strateg Glob Change (2013) 18:285–302 287
actual costs of adaptation will occur at different times in the future, economic costs areconverted to ‘present values’ using a discount rate (Karakaya 2007). There are variouschoices of discount rate for climate change policy: social discount rate (Stern et al. 2006),market rate, and the rate that people actually pay for day-to-day decisions (IPCC 1996 citedin Markandya et al. 1998). The former leads to a relatively lower rate. The arguments foreither approach are unlikely to be resolved. As such, the adaptation costs calculated at morethan one rate should provide policymakers some guidance regarding sensitivity analysis.Although several studies have reported the costs of adaptation, they most likely are under-estimations due to a lack of many aspects of consideration, for example sector coverage,residual damages, and ecology (Parry et al. 2009b). It is important to enhance future studiesto be based upon case studies that cover a wide range of places and sectors, support top-down analyses, and thus provide a choice range for preparedness to pay.
Focusing on sea level rise, the required adaptations will be based on the local value of therelative sea level rise rate: the net combination of levels of sea rise and land subsidence(Hillen et al. 2010). The levels of adaptation, including the required costs, therefore varyaccording to the different areas and sea level rise scenarios. Wealthy, densely populatedcountries, and areas of high economic value, such as harbors and cities, are more highlyprotected than others are, and result in higher adaptation costs (Fankhauser 1995, cited inDore and Burton 2000). According to Dore and Burton, for the cost assessment methodol-ogies, the consistent methodologies for estimating adaptation costs at the micro level do notexist. However, what does exist are methodologies at the macro scale regarding climatechange. One example related to the sea level rise impacts at the global scale, from the reviewof Parry et al. (2009b), was the estimation of UNFCCC for the adaptation costs required forcoastal zone for developed and developing countries. The estimation was based on ‘hold theshore line’ with traditional coastal engineering responses (e.g., dykes and beach nourish-ment). Another example was the recent study of Nicholls et al. (2010), who used theDynamic Interactive Vulnerability Assessment (DIVA) model to compare the global adaptationcosts for coastal areas to climate change over three main protection responses, sea dikes, beachnourishment, and port upgrade. However, there are few studies at the household (micro) levelfor assessing the adaptation cost requirements to sea level rise impacts. Jarungrattanapong andManasboonphempool (2007) estimated the costs for household adaptation due to coastalerosion/flooding at Bang Khun Thian District, Bangkok, Thailand. Hideyuki (2004) assessedthe costs of household adaptations to sea level rises in Indonesian coastal cities using factors ofthe amount of material used per house and per area, along with workdays that would be lost.Although from different target respondents (house owners and housing construction compa-nies), in both cases, field interview survey methods were used by asking the market price.
3 Study area and study sites
The areas under study are vulnerable coastal Tambons (a Tambon is a territory governed asan administrative or political unit of a province in Thailand) located in the Gulf of Thailand.The Gulf of Thailand covers roughly 320,000 km² and is relatively shallow (mean depth is45 m, and the maximum depth is 80 m). This makes for a slow water exchange, and thestrong water inflow from the rivers makes the Gulf low in salinity and rich in sediments(Burnetta et al. 2007). The decrease in sediment yield, natural land subsidence, sea level rise,and the impacts from waves and storms, all combined to cause the coastal problems in theGulf of Thailand. Following the estimation of Jarupongsakul (2006), the sea level in theUpper Gulf of Thailand will rise 10–100 cm in the year 2050. An annual relative sea level
288 Mitig Adapt Strateg Glob Change (2013) 18:285–302
rise of 1 cm in some areas of the Gulf of Thailand will result in an apparent coastal retreat of5 m per year (Winterwerp et al. 2005; Ittaro 2001, cited in Jarungrattanapong and Mana-sboonphempool 2007).
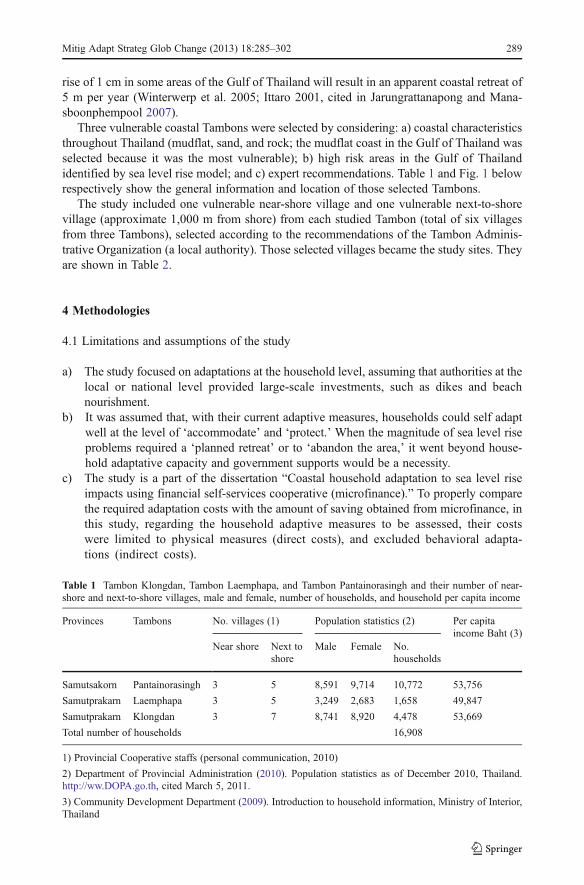
Three vulnerable coastal Tambons were selected by considering: a) coastal characteristicsthroughout Thailand (mudflat, sand, and rock; the mudflat coast in the Gulf of Thailand wasselected because it was the most vulnerable); b) high risk areas in the Gulf of Thailandidentified by sea level rise model; and c) expert recommendations. Table 1 and Fig. 1 belowrespectively show the general information and location of those selected Tambons.
The study included one vulnerable near-shore village and one vulnerable next-to-shorevillage (approximate 1,000 m from shore) from each studied Tambon (total of six villagesfrom three Tambons), selected according to the recommendations of the Tambon Adminis-trative Organization (a local authority). Those selected villages became the study sites. Theyare shown in Table 2.
4 Methodologies
4.1 Limitations and assumptions of the study
a) The study focused on adaptations at the household level, assuming that authorities at thelocal or national level provided large-scale investments, such as dikes and beachnourishment.
b) It was assumed that, with their current adaptive measures, households could self adaptwell at the level of ‘accommodate’ and ‘protect.’ When the magnitude of sea level riseproblems required a ‘planned retreat’ or to ‘abandon the area,’ it went beyond house-hold adaptative capacity and government supports would be a necessity.
c) The study is a part of the dissertation “Coastal household adaptation to sea level riseimpacts using financial self-services cooperative (microfinance).” To properly comparethe required adaptation costs with the amount of saving obtained from microfinance, inthis study, regarding the household adaptive measures to be assessed, their costswere limited to physical measures (direct costs), and excluded behavioral adapta-tions (indirect costs).
Table 1 Tambon Klongdan, Tambon Laemphapa, and Tambon Pantainorasingh and their number of near-shore and next-to-shore villages, male and female, number of households, and household per capita income
Provinces Tambons No. villages (1) Population statistics (2) Per capitaincome Baht (3)
Near shore Next toshore
Male Female No.households
Samutsakorn Pantainorasingh 3 5 8,591 9,714 10,772 53,756
Samutprakarn Laemphapa 3 5 3,249 2,683 1,658 49,847
Samutprakarn Klongdan 3 7 8,741 8,920 4,478 53,669
Total number of households 16,908
1) Provincial Cooperative staffs (personal communication, 2010)
2) Department of Provincial Administration (2010). Population statistics as of December 2010, Thailand.http://ww.DOPA.go.th, cited March 5, 2011.
3) Community Development Department (2009). Introduction to household information, Ministry of Interior,Thailand
Mitig Adapt Strateg Glob Change (2013) 18:285–302 289
d) The estimation of future adaptation cost requirements was conducted on the assumptionthat the degree of sea level rise impacts was maintained. Accordingly, the requiredfuture costs would largely depend on the number of reinvestments of current adaptivemeasures due to their useful life.
e) The results of the assessed costs were presented in Thai Baht (Thailand local currency) toreflect local requirements. However, for currency references, the exchange rate of ThaiBaht to the U.S. Dollar ranged between 30 and 32 Bath per USD during the year 2011.
4.2 Sample size and sampling method
Following the Yamane (1973) formula: n ¼ N= 1þ Ne2ð Þ, whereby n 0 sample size re-quired, N 0 population size, and e 0 allowable margin of error; given the allowable marginof error at 0.05, the minimum sample size required for this study is 391 households torepresent the total number of households at 16,908 of the studied Tambons. The study used asample size of 400, allocated equally to every selected village (65–67 households per villagefor six villages).
Fig. 1 Inundation areas of the Gulf of Thailand for the scenario’s 2 m sea level rise and the studied Tambons.Source: Climate Change Information Center, Department of Science and Technology (2009) Inundation areasof the Gulf of Thailand for scenario 2 m sea level rise. Chulalongkorn University, Bangkok
Table 2 Six studied villages
Tambons Study sites (Villages)
Near-shore Next-to-shore
Pantainorasingh Sahakorn Sandab
Laemphapa Kunsamutrchin Klongsuan
Klongdan Srilong Klong-Nang-Hong (K-N-H)
290 Mitig Adapt Strateg Glob Change (2013) 18:285–302
In selecting the household sampling unit, the study used a simple random samplingmethod (randomly selected the assigned running number households) since the targetpopulation in each studied village was in the homogenous group; had lived in same area,and generally had the same occupation. Inclusion criterion included participants who werehousehold leaders or household members who mainly had generated income for theirhouseholds for at least the last 6 months. Exclusion criteria excluded participants who wereunable to provide good information such as persons over 80 years of age, or who had notbeen living continuously in the surveyed house over the last 12 months.
4.3 Survey of past autonomous adaptation costs and the test of the difference of means
The available household autonomous adaptive measures (Asian Development Bank 2009; Scottand Sujata 2001; and Smit and Pilifosova 2001) were identified and combined to cover theadaptations of coastal socio-economic sectors to sea level rise impacts. For costing purposes,classification of such adaptive measures included: a) capital expenditure items, and b) operatingexpenditure items. Personal interviews, which included asking for the amounts of the costs spentfor each adaptive measure over the past 5 years, were conducted using fill-in questionnaires withthe sample units. An analysis of variance and two-sample t tests were used to respectively testthe difference of mean adaptation costs of all villages and between two villages.
4.4 Assessment of future autonomous adaptation costs
For the short-term period, the study used a questionnaire asking informants their anticipatedrequired future household autonomous adaptation costs for the next 5 years. To assess futureadaptation cost requirements in the longer term, the results from the survey of past autonomousadaptation costs were extrapolated to obtain the future amounts required for the next 30 years.Given that similar adaptive measures were currently being used by households that could copewith whatever the degree of sea level rise impacts would be in the future, the budgeting for therecurrent costs of investment and future value of an equal annual expenditures payment(Brigham and Gapenski 1991) were applied respectively to capital and operating expenditureitems. The following factors all received consideration when estimating the future cost require-ments: a) investment costs for adaptive measures, b) useful life of adaptive measures, c)maintenance costs, and d) inflation. The following equations were used:
Capital expenditure items:
Summation of � Present costs of adaptive measuresð Þ� 1þ r %ð Þ Useful life of adaptive measureð Þ � ið Þ ð1Þ
Operating expenditures items:
¼ Future value of an equal annual payment
¼ Present value of annual operating expendituresð Þ � 1þ r%ð Þ30 � 1� �
=r %� ð2Þ
r % expected inflationi 1, 2, 3,..X; X 0 round-down maximum number of times reinvest or refurbishthe adaptive measures over the next 30 years (round-down of 30 years/ usefullife of adaptive measure)
Mitig Adapt Strateg Glob Change (2013) 18:285–302 291
5 The survey results
Tables 3, 4, 5 and 6
6 Discussion
Six villages from three Tambons were studied. One ‘near-shore’ and one ‘next-to-shore’village selected from each studied Tambon were comparatively analyzed with the intent tosee, if any, the differences in the degree of impacts from the degree of adaptations (costs)taken for, and the level of preparedness to the sea level rise. The ‘near-shore’ villages areSahakorn, Kunsamutrchin, and Srilong; the ‘next-to-shore’ villages are Sandab, Klongsuan,and Klong-Nang-Hong for Tambons Pantainorasingh, Laemphapa, and Klongdan respec-tively. The villages in Tambon Pantainorasingh (Sahakorn and Sandab) and Tambon Laem-phapa (Kunsamutrchin and Klongsuan) are fishery coastal communities. Although houses inthose villages are predominantly made of wood, they use some amount of concrete andmetal as well. Good relationships and collaborative efforts among members of the villagesare noticeably evident. Most members earn their living by fishery or aquaculture, and have alower income average compared with villagers in Tambon Klongdan. More modernized, thevillages in Tambon Klongdan (Srilong and Klong-Nang-Hong) are located near industrial-ized areas. This is due to the process of urbanization (Singh 1987; Sharma and Maithani1998; cited in Basyal and Khanal 2001). Members in these villages earn their living servingas employees such as a laborer, in merchandising, and in making and selling dried salteddamselfish. They have sufficient income to build better quality houses. However, as withtypical urbanized communities, the relationships and cooperation among members of suchcommunities are less.
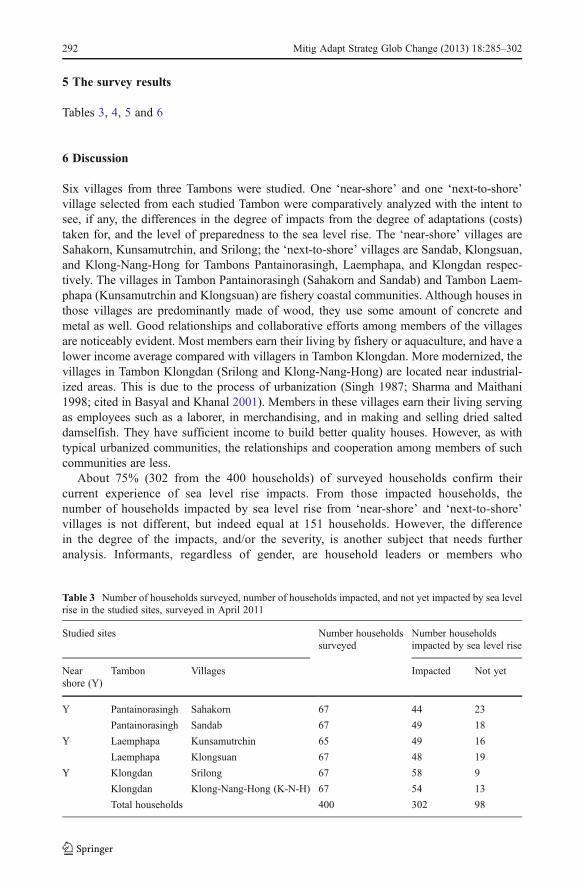
About 75% (302 from the 400 households) of surveyed households confirm theircurrent experience of sea level rise impacts. From those impacted households, thenumber of households impacted by sea level rise from ‘near-shore’ and ‘next-to-shore’villages is not different, but indeed equal at 151 households. However, the differencein the degree of the impacts, and/or the severity, is another subject that needs furtheranalysis. Informants, regardless of gender, are household leaders or members who
Table 3 Number of households surveyed, number of households impacted, and not yet impacted by sea levelrise in the studied sites, surveyed in April 2011
Studied sites Number householdssurveyed
Number householdsimpacted by sea level rise
Nearshore (Y)
Tambon Villages Impacted Not yet
Y Pantainorasingh Sahakorn 67 44 23
Pantainorasingh Sandab 67 49 18
Y Laemphapa Kunsamutrchin 65 49 16
Laemphapa Klongsuan 67 48 19
Y Klongdan Srilong 67 58 9
Klongdan Klong-Nang-Hong (K-N-H) 67 54 13
Total households 400 302 98
292 Mitig Adapt Strateg Glob Change (2013) 18:285–302
Tab
le4
Num
berof
households
appliedadaptiv
emeasures(capitalexpenditu
reitems),and
averageinvestmentcostsof
adaptiv
emeasuresduring
thepast5years(2006–
2010),
from
the40
0ho
useholds
surveyed
inthestud
iedsites
Villages
Num
berhouseholds
appliedadaptiv
emeasures—
capitalexpenditu
reitems(N
o.)andaverageinvestmentcostsof
adaptiv
emeasures(ThaiBaht)during
the
years20
06–201
0
Fresh
water
storage
Barrier-farmingprotectio
nHouse
renovate
(1)
Landim
prov
eBarrier-house
protectio
nOthers(2)
Overall
No.
Baht
No.
Baht
No.
Baht
No.
Baht
No.
Baht
No.
Baht
No.
Baht
Sahakorn
41,250
1137
,091
1650
,467
3129
,826
425
,000
14,700
6733
,579
Sandab
–3
35,500
1438
,943
1213
,909
912
,222
28,000
4023
,615
Kunsamutrchin
–8
27,813
2748
,778
109,30
05
31,500
–50
35,800
Klong
suan
22,500
–17
38,265
189,77
81
4,000
–38
21,987
Srilong
–1
1,000
31116,12
97
51,429
110
,000
–40
99,275
K-N
-H–
120
0,00
041
162,19
56
69,167
–1
1,000
4914
8,28
6
Overall
61,667
2439
,083
146
92,946
8425
,423
2019
,075
45,425
284
60,059
(1)Tw
odata
relatedto
new
housebuild
ing,
‘retreat,’that
costsover
1,000,000THB
areedited/replaced
toconsider
theadaptio
ncost
requirem
entfor‘accom
mod
ation’
and
‘protect’on
ly.The
valueused
toreplaceisthemaxim
umadaptatio
ncostsof
theho
useholdin
thesamecommunity
that
uses
accommod
ateor
protect
(2)Others:Sahakorn—
improved
watersupplyandelectricalsystem
;Sandab—
boug
htwoo
denshelf,refurbishedshrimppo
nd;and
Klong
-Nang-Hong—
repaired
woo
denbridge
toho
me
Mitig Adapt Strateg Glob Change (2013) 18:285–302 293
have primarily generated income for such households. Most of them have resided inthe study sites or over 10 years. Family members privately own all of the houses inwhich they are dwelling (none are rental).
Table 5 Number of households that applied adaptive measures (operating expenditure items), and averageannual costs of adaptive measures over the past 5 years (2006–2010), from the 400 households surveyed in thestudied sites
Villages Number households applied adaptive measures—operating expenditure items (No.) andaverage annual costs of adaptive measures (Baht) during year 2006–2010
Buy moredrinkingwater (1)
Changefertilizer/Soilmaintenance
Medicalexpenses (waterborne disease)
Householdappliances/miscellaneous
Maintenancephysicaladaptivemeasures
Overall
No. Baht No. Baht No. Baht No. Baht No. Baht No. Baht
Sahakorn 6 1,298 2 1,750 1 1,600 8 2,153 2 10,750 19 2,716
Sandab 5 1,532 – 3 533 5 1,600 – 13 1,328
Kunsamutrchin 2 2,200 – – 2 1,550 2 3,500 6 2,417
Klongsuan – – – 1 2,000 4 3,250 5 3,000
Srilong – – – – – –
K-N-H – – 1 1,000 – – 1 1,000
Overall 13 1,527 2 1,750 5 840 16 1,895 8 5,188 44 2,258
Table 6 Numbers of households requiring future adaptation costs, estimated future household adaptation costrequirements, and the percentage of usage purposes within the next 5 years (2015), from the 400 householdssurveyed in the studied sites
Villages No. householdsresponded to futurecosts requirement
Estimated future household adaptation cost requirements within thenext 5 years (2015)
Averageamount perhousehold(Baht) (1)
Usage purposes (%) Totalusagepurpose(%)
Notrequired
Required Buildwaterbarrier
Renovatehouse
Improveland
Buy/changenewcrops
Others(2)
Sahakorn 14 53 33,020 25% 27% 40% 1% 7% 100%
Sandab 20 47 26,633 23% 35% 35% 0% 6% 100%
Kunsamutrchin 21 44 17,738 21% 45% 21% 2% 11% 100%
Klongsuan 41 26 18,080 9% 41% 50% 0% 0% 100%
Srilong 34 33 102,727 5% 82% 11% 0% 3% 100%
K-N-H 21 46 143,163 0% 88% 8% 0% 4% 100%
Total 151 249 57,140 15% 51% 28% 1% 6% 100%
(1) Five data related to new house building, ‘retreat,’ that costs over 1,000,000 THB are edited/replaced toconsider adaption cost requirement for the ‘accommodation’ and ‘protect’ only. The value used to replace isthe maximum adaptation costs of household in the same community that uses accommodate or protect
(2) Others include house relocation, growing mangrove, buy various home appliances, and refurbish shrimppond
294 Mitig Adapt Strateg Glob Change (2013) 18:285–302
6.1 ‘Capital expenditure’ autonomous adaptation costs: Past experiences of coastalhouseholds during 2006–2010
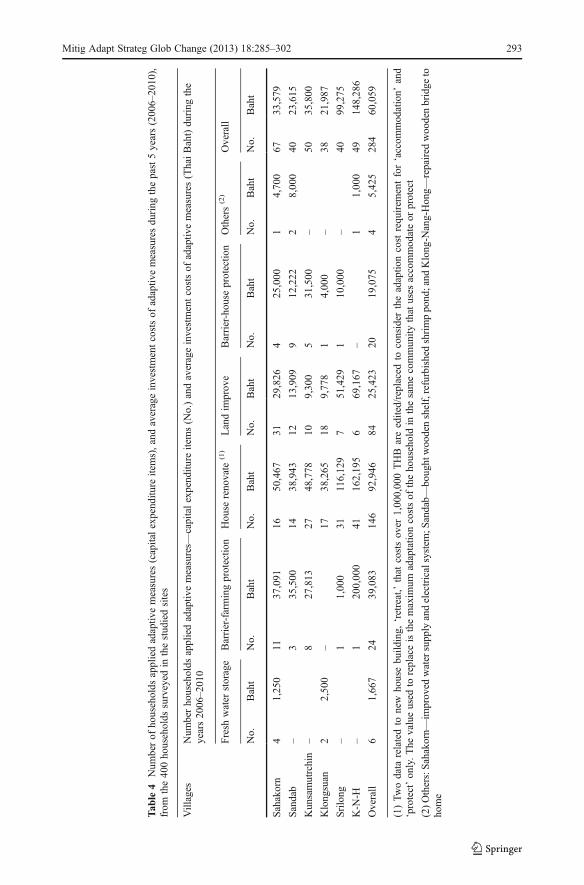
To adapt to sea level rise impacts during the past 5 years (2006–2010), the autonomousadaptive measures that impacted and surveyed coastal households mainly applied were inrenovating their houses, and improving lands, followed by building physical barriers fortheir accommodation and farms. There were few adaptive measures taken that related toincreasing water storage tanks or the improvement of water and electrical utility systems.Some households applied more than one measure. These types of adaptive measure areconsidered capital expenditure items since they are physical assets with a useful life of morethan 1 year, or the rehabilitated existing physical assets to extend the useful life (Jacobs2009). Such adaptive measures can well cover household adaptations to sea level riseimpacts at the level of ‘accommodate’ and ‘protect’ (exclude ‘retreat’). For the past 5 years,the major adaptation cost undoubtedly was for house renovation, with the average cost perhousehold at 92,946 baht. However, the costs for other mentioned adaptive measures werealso significant as their average range was between 20,000 and 40,000 baht per household.
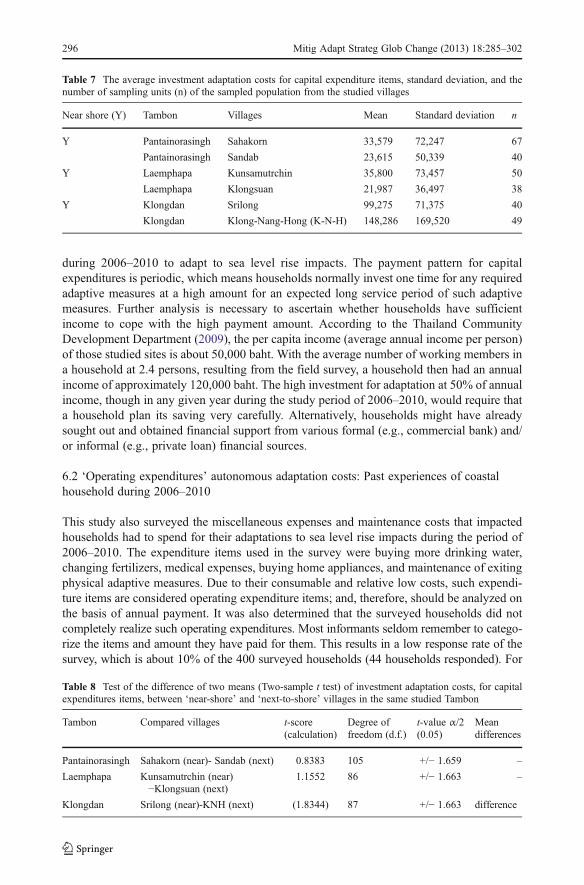
In analyzing the amount of autonomous adaptation costs required between communities,it was clear that the impacted households of ‘near-shore’ villages paid for higher adaptationcosts than ‘next-to-shore’ villages. For Tambon Pantainorasingh, a household in Sahakornand Sandab villages paid for all autonomous adaptive measures averaging 33,579 and23,615 baht, whereas for Tambon Laemphapa, households in Kunsamutrchin and Klongsuanvillages paid an average of 35,800 and 21,987 baht respectively. However, there is anexception for the villages in Tambon Klongdan. A household in the Srilong village (‘near-shore’) paid for adaptation costs averaging 99,275 baht, which was lower than that for theKlong-Nang-Hong village (‘next to shore’), whose household paid an average of 148,216baht. This is largely from house renovation costs. One assumption is that Klong-Nang-Hongvillage has been more urbanized. Houses in such a village are made of better quality materialsresulting in higher costs for renovation. Apparently, the study results show that the impactedhouseholds in urbanized coastal communities (Srilong and Klong-Nang-Hong villages) pay forhigher autonomous adaption costs for ‘capital expenditure items’ than households in fisherycoastal communities (Sahakorn, Sandab, Kunsamutrchin, and Klongsuan).
The two-sample t tests and the analysis of variance were performed to test whether therewere differences in means of adaptation costs between villages. With the probability of 2tails tests, the calculated t-scores were compared with the critical values at α/200.05 for the tdistribution following various degrees of freedom (d.f.). The results show that there are nosignificant differences between the means of adaptation costs between ‘near-shore’ and‘next-to- shore’ villages in the same fishery coastal communities (villages in TambonPantainorasingh and Tambon Laemphapa), except in the urbanized one (Tambon Klongdan).In addition, comparing between Tambons, there are no differences of means between ‘near-shore’ and ‘near-shore,’ and ‘next-to-shore’ and ‘next-to-shore’ villages in the fisherycoastal communities, except the urbanized one. For the analysis of variance, it was used tocompare the means of the village groups (more than two villages), in this case, a group offishery villages (villages in Tambon Pantainorasingh and Tambon Laemphapa) and a groupof all villages (villages in all Tambons). At the α00.05, with the results of the F test and pvalue, it is found that the compared means of fishery villages are equal. However, whencomparing all villages, inclusive of urbanized, their means are not equal. The statistical dataand calculations are shown in Tables 7, 8, 9 and 10 below.
Considering all studied sites and the sampled population, an impacted coastal householdpaid for capital expenditure items, as the autonomous adaptations, averaged 60,059 baht
Mitig Adapt Strateg Glob Change (2013) 18:285–302 295
during 2006–2010 to adapt to sea level rise impacts. The payment pattern for capitalexpenditures is periodic, which means households normally invest one time for any requiredadaptive measures at a high amount for an expected long service period of such adaptivemeasures. Further analysis is necessary to ascertain whether households have sufficientincome to cope with the high payment amount. According to the Thailand CommunityDevelopment Department (2009), the per capita income (average annual income per person)of those studied sites is about 50,000 baht. With the average number of working members ina household at 2.4 persons, resulting from the field survey, a household then had an annualincome of approximately 120,000 baht. The high investment for adaptation at 50% of annualincome, though in any given year during the study period of 2006–2010, would require thata household plan its saving very carefully. Alternatively, households might have alreadysought out and obtained financial support from various formal (e.g., commercial bank) and/or informal (e.g., private loan) financial sources.
6.2 ‘Operating expenditures’ autonomous adaptation costs: Past experiences of coastalhousehold during 2006–2010
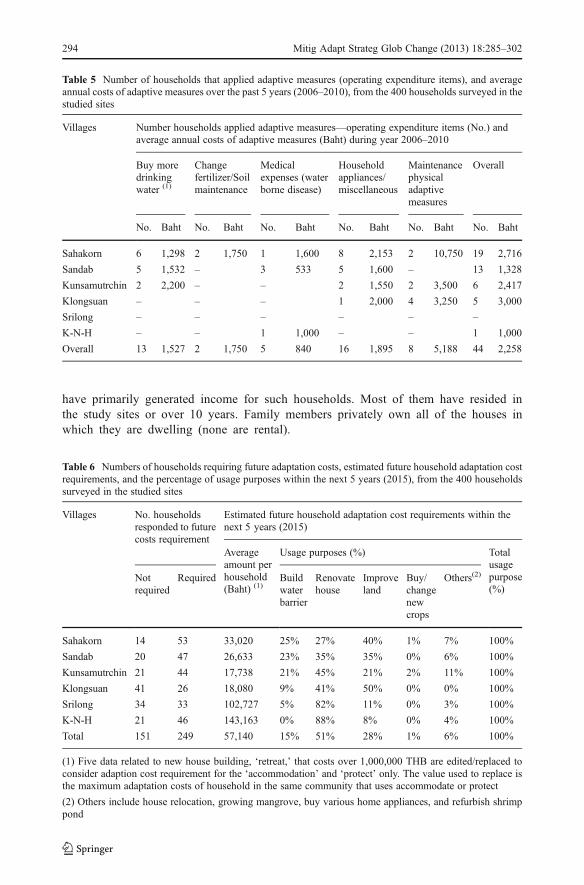
This study also surveyed the miscellaneous expenses and maintenance costs that impactedhouseholds had to spend for their adaptations to sea level rise impacts during the period of2006–2010. The expenditure items used in the survey were buying more drinking water,changing fertilizers, medical expenses, buying home appliances, and maintenance of exitingphysical adaptive measures. Due to their consumable and relative low costs, such expendi-ture items are considered operating expenditure items; and, therefore, should be analyzed onthe basis of annual payment. It was also determined that the surveyed households did notcompletely realize such operating expenditures. Most informants seldom remember to catego-rize the items and amount they have paid for them. This results in a low response rate of thesurvey, which is about 10% of the 400 surveyed households (44 households responded). For
Table 7 The average investment adaptation costs for capital expenditure items, standard deviation, and thenumber of sampling units (n) of the sampled population from the studied villages
Near shore (Y) Tambon Villages Mean Standard deviation n
Y Pantainorasingh Sahakorn 33,579 72,247 67
Pantainorasingh Sandab 23,615 50,339 40
Y Laemphapa Kunsamutrchin 35,800 73,457 50
Laemphapa Klongsuan 21,987 36,497 38
Y Klongdan Srilong 99,275 71,375 40
Klongdan Klong-Nang-Hong (K-N-H) 148,286 169,520 49
Table 8 Test of the difference of two means (Two-sample t test) of investment adaptation costs, for capitalexpenditures items, between ‘near-shore’ and ‘next-to-shore’ villages in the same studied Tambon
Tambon Compared villages t-score(calculation)
Degree offreedom (d.f.)
t-value α/2(0.05)
Meandifferences
Pantainorasingh Sahakorn (near)- Sandab (next) 0.8383 105 +/− 1.659 –
Laemphapa Kunsamutrchin (near)−Klongsuan (next)
1.1552 86 +/− 1.663 –
Klongdan Srilong (near)-KNH (next) (1.8344) 87 +/− 1.663 difference
296 Mitig Adapt Strateg Glob Change (2013) 18:285–302
some items, informants provided their purchasing records once during the past 5 years, such asfor home appliances. The costs of such items were then allocated equally to the annualexpenditures. Due to the limited and fragmented data received from the surveyed villages,the average expenditure for each adaptive measure and the different adaptation costs between‘near-shore’ and ‘next-to-shore’ villages could not be well analyzed. Nevertheless, for generalreference, by considering all studied sites, the average of 2,258 baht per household can be usedas annual operating expenditures for autonomous adaptations to sea level rise impacts.
6.3 Future adaptation cost requirements
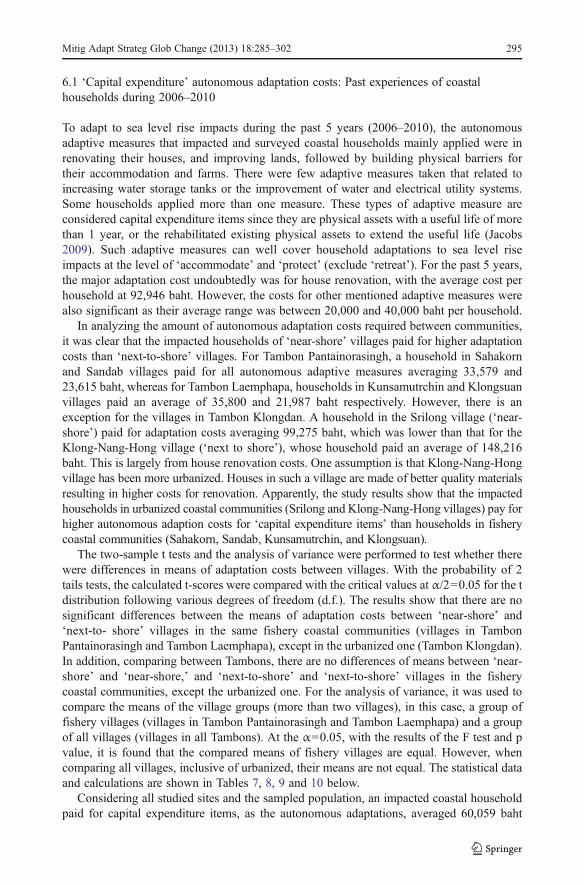
The future adaption cost requirements for the surveyed coastal households were forecastedfor two periods: short-term and long-term. For the short-term, or within the next 5 years, theresults from the personal interview or the expected future cost requirements for capitalexpenditure items from the informant’s views were used. Nonetheless, over 60% of thesurveyed households (249 from 400 households) confirmed their future adaptation require-ments. The study results show that the expected future adaption costs of urbanized coastalvillages are apparently higher than for those of the coastal fishery villages. The averageexpected future costs required by Srilong and Klong-Nang-Hong villages in TambonKlongdan are over 100,000 baht per household; whereas, the Sahakorn and Sandab villagesin Tambon Pantainorasingh, and Kunsamutrchin and Klongsuan in Tambon Laemphaparequire an average of between 18,000 and 33,000 baht per household. The difference in thedegree of future cost requirements between ‘near-shore’ and ‘next-to-shore’ villages cannot beconcluded, as the survey results are not clustered (not for all cases that ‘near-shore’ will requirehigher future costs than ‘next-to-shore,’ or vice versa). Overall, a household will require anaverage of 57,140 baht for capital expenditure items to adapt to sea level rise impacts in the
Table 9 Test of the difference of two means (Two-sample t test) of investment adaptation costs, for capitalexpenditures items, between ‘near-shore’ and ‘near-shore,’ and ‘next-to-shore’ and ‘next-to-shore’ villages inthe different studied Tambons
Compared Tambons Compared villages t-score(calculation)
Degree offreedom(d.f.)
t-valueα/2(0.05)
Meandifferences
Pantainorasingh-LaemPhapa
Sahakorn (near)-Kunsamutrchin (near)
−0.1630 115 +/− 1.658 –
Pantainorasingh-LaemPhapa
Sandab (next)-Klongsuan(next)
0.1642 76 +/− 1.665 –
Laemphapa-Klongdan Kunsamutrchin (near)-Srilong (near)
−4.1382 88 +/− 1.662 difference
Laemphapa-Klongdan Klongsuan (next)-KNH (next) −5.0661 85 +/− 1.663 difference
Pantainorasingh-Klongdan Sahakorn (near)-Srilong (near) −4.5855 105 +/− 1.659 difference
Pantainorasingh-Klongdan Sandab (next)-KNH (next) −4.8906 87 +/− 1.663 difference
Table 10 Analysis of variance of investment adaptation costs, for capital expenditures items, between groupsof villages
Sum of squares d.f. Mean square F test p value
Between groups of fishery villages 5.4E+09 3 1.8E+09 .447 .720
Between groups of all villages 6.2E+11 5 1.25E+11 14.593 .000
Mitig Adapt Strateg Glob Change (2013) 18:285–302 297
next 5 years. The purposes of money usage are still mainly for house renovation, followed byland improvement, building physical barriers, and other miscellaneous items. It is noticeablethat many informants predict their required future adaptation costs from their own pastexperiences, and the result to the costs required in those two different time periods (past andfuture) are nearly the same. This is in line with a cost estimating method, extrapolating fromactual costs. The extrapolation is best suited for estimating the same item when there areproperly normalized current or past data (U.S. Government Accountability Office 2009).
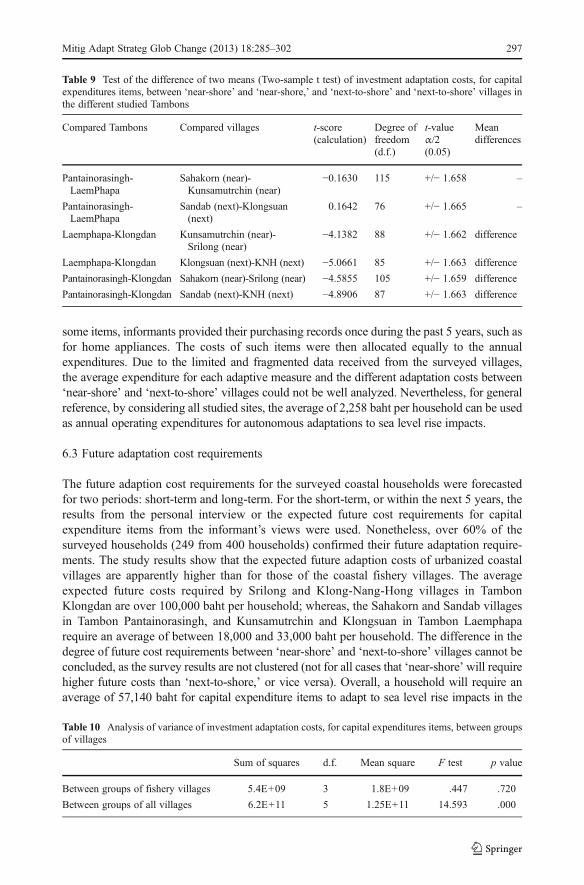
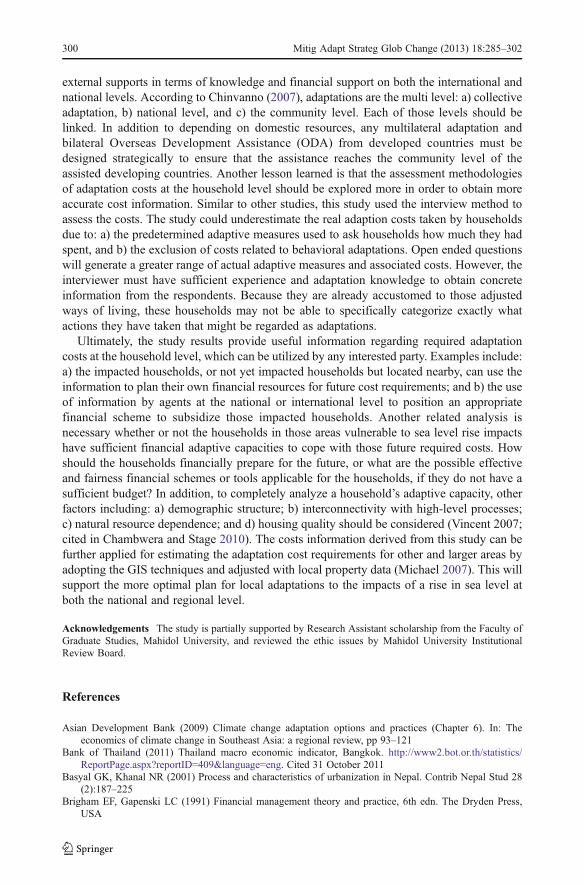
For the longer term of future adaptation cost requirements in the next 30 years, the studyused the aforementioned Eqs. 1 and 2 to forecast, respectively, the required future costs forcapital expenditure and operating expenditure items. Following Eq. 1, the required param-eters are the present costs of the adaptive measures, the average useful life of those adaptivemeasures, and the expected inflation. According to the Thailand Ministry of Finance (2000),the useful life of a concrete building or house is 25 years. For other wooden and concretefacilities, their useful life ranges from 10 to 15 years. The study then applied the minimumuseful life of facilities, which is approximately 10 years, as the average useful life of thoseadaptive measures. With this, in the next 30 years, a household will have to pay three timesfor reinvesting their adaptive measures. The inflation or discount rate to be used is debatable.However, it must well represent the local risks. Therefore, the study used the average Thailandconsumer price index, determined by the Bank of Thailand, during the past 5 years of 2006–2010, which was about 2.98% per year (Bank of Thailand 2011). Given the average investmentcosts of adaptive measures at 60,059 baht (the results from the survey), a household willrequire future costs totaling 334,966 baht for capital expenditure items to adapt to sea level riseimpacts in the next 30 years, partially paid every 10 years. To forecast the future requiredadaption costs in/as related to operating expenditure items, the figures of past actual annualexpenditures were used and adjusted for inflation. With the future value of an annuity equalpayment (Eq. 2), given the average annual expenditures at 2,258 baht (result from the survey),a household will require future adaptation costs for operating expenditure items totaling110,648 baht throughout the next 30-year period. The cost projections of such forecastedfuture adaptation cost requirements can be presented as shown in Figs. 2 and 3.
7 Conclusion and recommendations
The study results clearly show that the coastal households in the studied sites, whichcurrently have been experiencing the impacts of sea level rise, have to autonomously adapttheir living conditions. In doing so, households have spent their money primarily for capitalexpenditure items related to home and farming environments (e.g., house renovation, landimprovement, and building physical barriers for house and aquaculture land) so that they canstill accommodate and adequately protect their current home land to and from the impact of arise in sea level. The operating expenditure items for adaptations such as maintenance costs,medical expenses, and drinkable water are not their major concern. Mainly because of higherhouse renovation costs, the average autonomous adaptation costs required by the urbanizedcoastal households are clearly higher than the requirements of coastal fishery households.Comparing the adaptation costs of households located in ‘near-shore’ and ‘next-to-shore’villages, it has been found that the average costs are not significantly statistically different infishery coastal communities. This is probably due to the high variation in the amount ofadaptation costs (high standard deviation), and the ‘next-to-shore’ are so close to ‘near-shore’ villages that the ‘next-to-shore’ have been impacted, or are already aware of theimpacts and have thus already adapted.
298 Mitig Adapt Strateg Glob Change (2013) 18:285–302
As long as sea level rise impacts remain, the additional future autonomous adaptation costrequirements for coastal households are inevitable. The estimated short and long-term futurecost requirements, both in view of impacted households and by using financial formulas,supports such claims. However, those estimations have been done on the assumption that thedegree of sea level rise impacts is maintained. If the sea level has been rising with a slightlyincreasing rate, as quoted by Hulme et al. (2002; cited in Nicholls et al. 2005), the degree ofimpacts certainly will be more severe. Accordingly, the required future autonomous adap-tation costs for impacted households will likely be much higher than these forecasted costs.To develop the relationship between the increasing rate of sea level rise and additionaladaptation costs required in the future, information regarding both adaptation costs and sealevel through different periods of time is required. One benefit of this study is that its cost resultscan be used as a reference for any future study that attempts to find such a relationship.
Some specific lessons learned from this study merit attention. Obviously, local house-holds have been self-learning how to autonomously adapt to the impacts. Nonetheless, theirown adaptive capacities limit how well they can adapt. This would somehow require
Fig. 2 Projection of costs for ‘capital expenditure’ adaptive measure for adaptation to sea level rise impacts inthe next 30 years with accumulated value equal to 334,966 baht
2,326
2,396
2,467
2,541
2,618
2,696
2,777
2,860
2,946
3,035
3,126
3,219
3,316
3,415
3,518
3,623
3,732
3,844
3,959
4,078
4,201
4,327
4,456
4,590
4,728
4,870
5,016
5,166
5,321
5,481
-
2,000
4,000
6,000
8,000
1 3 5 7 9 11 13 15 17 19 21 23 25 27 29
Thai Baht
Years
Fig. 3 Projection of annual operating expenditures for adaptation to sea level rise impacts in the next 30 yearswith accumulated value equal to 110,648 baht
Mitig Adapt Strateg Glob Change (2013) 18:285–302 299
external supports in terms of knowledge and financial support on both the international andnational levels. According to Chinvanno (2007), adaptations are the multi level: a) collectiveadaptation, b) national level, and c) the community level. Each of those levels should belinked. In addition to depending on domestic resources, any multilateral adaptation andbilateral Overseas Development Assistance (ODA) from developed countries must bedesigned strategically to ensure that the assistance reaches the community level of theassisted developing countries. Another lesson learned is that the assessment methodologiesof adaptation costs at the household level should be explored more in order to obtain moreaccurate cost information. Similar to other studies, this study used the interview method toassess the costs. The study could underestimate the real adaption costs taken by householdsdue to: a) the predetermined adaptive measures used to ask households how much they hadspent, and b) the exclusion of costs related to behavioral adaptations. Open ended questionswill generate a greater range of actual adaptive measures and associated costs. However, theinterviewer must have sufficient experience and adaptation knowledge to obtain concreteinformation from the respondents. Because they are already accustomed to those adjustedways of living, these households may not be able to specifically categorize exactly whatactions they have taken that might be regarded as adaptations.
Ultimately, the study results provide useful information regarding required adaptationcosts at the household level, which can be utilized by any interested party. Examples include:a) the impacted households, or not yet impacted households but located nearby, can use theinformation to plan their own financial resources for future cost requirements; and b) the useof information by agents at the national or international level to position an appropriatefinancial scheme to subsidize those impacted households. Another related analysis isnecessary whether or not the households in those areas vulnerable to sea level rise impactshave sufficient financial adaptive capacities to cope with those future required costs. Howshould the households financially prepare for the future, or what are the possible effectiveand fairness financial schemes or tools applicable for the households, if they do not have asufficient budget? In addition, to completely analyze a household’s adaptive capacity, otherfactors including: a) demographic structure; b) interconnectivity with high-level processes;c) natural resource dependence; and d) housing quality should be considered (Vincent 2007;cited in Chambwera and Stage 2010). The costs information derived from this study can befurther applied for estimating the adaptation cost requirements for other and larger areas byadopting the GIS techniques and adjusted with local property data (Michael 2007). This willsupport the more optimal plan for local adaptations to the impacts of a rise in sea level atboth the national and regional level.
Acknowledgements The study is partially supported by Research Assistant scholarship from the Faculty ofGraduate Studies, Mahidol University, and reviewed the ethic issues by Mahidol University InstitutionalReview Board.
References
Asian Development Bank (2009) Climate change adaptation options and practices (Chapter 6). In: Theeconomics of climate change in Southeast Asia: a regional review, pp 93–121
Bank of Thailand (2011) Thailand macro economic indicator, Bangkok. http://www2.bot.or.th/statistics/ReportPage.aspx?reportID0409&language0eng. Cited 31 October 2011
Basyal GK, Khanal NR (2001) Process and characteristics of urbanization in Nepal. Contrib Nepal Stud 28(2):187–225
Brigham EF, Gapenski LC (1991) Financial management theory and practice, 6th edn. The Dryden Press,USA
300 Mitig Adapt Strateg Glob Change (2013) 18:285–302
Burnetta WC, Wattayakorn G, Taniguchi M et al (2007) Groundwater-derived nutrient inputs to the UpperGulf of Thailand. Cont Shelf Res 27:176–190
Callaway MJ et al (1998) Adaptation costs: a framework and methods (Chapter 5). In: Mitigation andadaptation costs assessment: concepts, methods and appropriate use. UNEP Collaborating Center onEnergy and Environment, Riso, Denmark, pp 97–117
Carter TR, La Rovere EL (2001) Developing and applying scenarios. In: McCarthy JJ (ed) Climate change 2001:impacts, adaptation, and vulnerability. Contribution of working group II to the third assessmentreport of the Intergovernmental Panel on Climate Change. Cambridge University press, Cambridge,pp 147–181
Chambwera M, Stage J (2010) Climate change adaptation in developing countries: issues and perspectives foreconomic analysis. International Institute for Environment and Development (IIED), London, pp 14–15
Chinvanno S (2007) Assessment on community vulnerability and adaptation to impact of climate change:overview of pilot study in Lower Mekong River Region. SEA START Research Center, Bangkok
Climate Change Information Center, Department of Science and Technology (2009) Inundation areas of theGulf of Thailand for scenario 2 m sea level rise. Chulalongkorn University, Bangkok
Community Development Department (2009) Household basic information. Ministry of Interior, ThailandCutter SL (1996) Vulnerability to environmental hazards. Prog Hum Geogr 20(4):529–539Department of Provincial Administration (2010) Population statistics as of December 2010, Thailand. http://
ww.DOPA.go.th, cited March 5, 2011Dore MHI, Burton I (2000) The costs of adaptation to climate change in Canada: a stratified estimate by
sectors and regions. Brock University Climate Change Laboratory, St. CatharinesHideyuki K (2004) Impact evaluation of sea level rise on Indonesian coastal cities - Micro approach through
field survey and macro approach through satellite image analysis. J Glob Environ Eng 10:65–76Hillen MM, Jonkman SN, Kanning W (2010) Coastal defence cost estimates case study of the Netherlands,
New Orleans and Vietnam. Delft University of Technology, Delft, p 42Hoffman J, Keyes D, Titus J (1983) Projecting future sea level rise: methodology, estimates to the year 2100,
and research needs, 2nd rev. ed. (U.S. GPO No. 055-000-00236-3). Government Printing Office,Washington, D.C.
Jacobs DF (2009) Capital expenditure and the budget. IMF: public finance management, Technical guidancenote No.8, pp 2–3
Jarungrattanapong R, Manasboonphempool A (2007) Adaptation strategies to coastal erosion/flooding: a casestudy of the communities in Bang Khun Thian District, Bangkok, Thailand. Thailand DevelopmentResearch Institute (TDRI), Bangkok
Jarupongsakul T (2006) Coastal erosion in Thailand: causes and management. Research paper. Department ofGeology, Chulalongkorn University, Bangkok
Karakaya E (2007) The economic costs of climate change impacts and adaptation. Paper presented at AppliedEnvironmental Economics Conference, European Environment Agency, London, 23 March 2007
Klein RJT, Nicholls RJ (1999) Assessment of coastal vulnerability to climate change. Ambio 28(2):182–187Malik et al (2010) Autonomous adaptation to climate change: a literature review. Institute for International
Economic Policy (IIEP) Working Paper 2010–24. George Washington University, Washington, p 5Margulis S, Bucher A, Corderi D et al (2009) The economics of adaptation to climate change—Final
methodology report. World BankMarkandya, Halsnaes K, Milborrow I (1998) Cost analysis principles (Chapter2). In: Mitigation and adapta-
tion costs assessment: concept, method and appropriate use. UNEP Collaborating Center on Energy andEnvironment, Denmark, pp 17–49
Meehl GA, Stocker TF, Collins W (2007) Global climate projections, climate change 2007: the physicalscience basis. In: Solomon S (ed) Climate change 2007: impacts, adaptation and vulnerability, Contribu-tion of working group I to the fourth assessment report of the Intergovernmental Panel on ClimateChange. Cambridge University Press, Cambridge, pp 747–846
Messner F, Meyer V (2005) Flood damage, vulnerability and risk perception challenges for flood damageresearch, Discussion paper 13/2005, Department of Economics, UFZ–Umweltforschungszentrum:Leipzig–Halle
Michael JA (2007) Analysis: episodic flooding and the cost of sea-level rise. Ecol Econ 63:149–159Nicholls R J (2003) Improving information for policy makers: case study on sea-level rise impacts. Paper
presented in OECD workshop on the benefits of climate policy. ENV/EPOC/GSP(2003)9/FINAL,Organisation for Economic Co-operation and Development
Nicholls R, Brown S, Hanson S et al (2010) Economics of coastal zone—Adaptation to climate change.Discussion paper no. 10, World Bank, Washington D.C.
Nicholls R, Mokrech M, Richards J (2005) Assessing coastal flood risk at specific sites and regional scales:regional assessment of coastal flood risk. Technical report No. 45. Tyndall Centre for Climate ChangeResearch, University of East Anglia, Norwich, pp 32–33
Mitig Adapt Strateg Glob Change (2013) 18:285–302 301
Parry M, Arnell N, Berry P et al (2009a) Adaptation to climate change: assessing the costs investment andfinancial flows to address climate change. Environment 51(6):29–36
Parry M, Arnell N, Berry P et al (2009b) Assessing the costs of adaptation to climate change: a review of theUNFCCC and other recent estimates. International Institute for Environment and Development andGrantham, Institute for Climate Change, London
Resurreccion BP, Sajor EE, Fajber E (2008) Climate adaptation in Asia: knowledge gaps and research issuesin South East Asia. Report of the South East Asia Team Climate Change Adaptation, ISET-Internationaland ISET-Nepal. Format Printing Press, Nepal
Sathaye JA, Christensen J (1998) Introduction. In: Mitigation and adaptation costs assessment: concepts,methods and appropriate use. UNEP Collaborating Center on Energy and Environment, Denmark, pp 9–15
Schneider S, Sarukhan J (2001) Overview of impacts, adaptation, and vulnerability to climate change. In:McCarthy JJ (ed) Climate change 2001: impacts, adaptation, and vulnerability. Contribution of workinggroup II to the third assessment report of the Intergovernmental Panel on Climate Change. CambridgeUniversity press, Cambridge, pp 77–100
Scott M, Sujata G (2001) Human settlements, energy, and industry. In: McCarthy JJ (ed) Climate change2001: impacts, adaptation, and vulnerability. Contribution of working group II to the third assessmentreport of the Intergovernmental Panel on Climate Change. Cambridge University press, Cambridge, pp383–411
Smit B, Pilifosova O (2001) Adaptation to climate change in the context of sustainable development andequity. In: McCarthy JJ (ed) Climate change 2001: impacts, adaptation, and vulnerability, Contribution ofWorking Group II to the Third Assessment Report of the Intergovernmental Panel on Climate Change.Cambridge University Press, Cambridge, pp 147–181
Smith JB, Tirpak DA (1990) The potential effects of global climate change on the United States. HemispherePublishing Corporation, Washington, D.C
Stern NS, Peters V, Bakhshi A et al (2006) Stern review: the economics of climate change. HM Treasury,London
Thailand Ministry of Finance (2000) Asset valuation, memorandum ref. 0528.2/91 dated 7 September 2000.http://www.moe.go.th/webfnd/mo29.htm. Cited 12 November 2011
U.S. Government Accountability Office (2009) Develop a point estimate (Chapter 11). In: GAO Costestimating and assessment guide—Best practices for developing and managing capital program costs,GAO-09-3SP, Washington, D.C, pp 107–122
Umitsu M (2000) Geo-environment and effect of sea level rise in the Chao Phraya Delta. In: The InternationalConference on the Chao Phraya Delta: historical development, dynamics and challenges of Thailand’srice bowl. Kasetsart University, Bangkok, 12–15 December 2000, pp 153–158
United Nations (2005) Planning and executive survey (Chapter 2). In: Designing household survey samples:practical guidelines, United Nations Publication No. ST/ESA/STAT/SER.F/98. Department of Economicand Social Affairs, New York, pp 9–26
United Nations Framework Convention on Climate Change (2007) An overview of investment and financialflows needed for adaptation (Chapter 5). In: Investment and financial flows to address climate change,Bonn, pp 116–120
United Nations Framework Convention on Climate Change (2010) Synthesis report on efforts undertaken toassess the costs and benefits of adaptation options, and views on lessons learned, and good practices,gaps, and needs. Synthesis report no. FCCC/SBSTA/2010/3, Bonn
USAID (2010) Asia-Pacific regional climate change adaptation assessment, Final report: findings andrecommendations. Washington, D.C., pp 88–89
Wigley TML, Raper SCB (1992) Implications for climate and sea level of revised IPCC emission scenarios.Nature 357:293–300
Yamane T (1973) Statistics: an introductory analysis, 3rd edn. Harper International Edition, Tokyo
302 Mitig Adapt Strateg Glob Change (2013) 18:285–302