co synthesis of rare earth compounds and co … · synthesis of rare earth compounds and study of...
TRANSCRIPT

CO CO CO t>
SYNTHESIS OF RARE EARTH COMPOUNDS AND
STUDY OF THEIR MAGNETIC OPTICAL AND
SEMICONDUCTING PROPERTIES
IBM Corporation
Thomas J. Watson Research Center
Yorktown Heights, New York 1059C
SEMIANNUAL TECHNICAL REPORT
30 June 1971 to 31 December 1971
Contract No. DAAH01-7i-C-1313
Sponsored by
Advanced Research Project Agency
ARPA Order No. 1588
DISTRIIiUTION STATEMEHl A
Approved for public releaso; Dh'.xibuüov. 'C-A'T.n&i
\
ARPA Support Office - Arn\y Missile Command
Directorate for Research, Development,
Engineering and Missile Systems Laboratory
U. S. Army Missile Command
Redstone Arsenal, Alabama
,NFOfp!l!:9«..i v.. «»•

SYNTHESIS OF RARE EARTH COMPOUNDS AND
STUDY OF THEIR MAGNETIC OPTICAL AND
SEMICONDUCTING PROPERTIES
IBM Corporation
Thomas J. Watson Research Center
Yorktown Heights, New York 10598
SEMIANNUAL TECHNICAL REPORT
30 June 1971 to 31 December 1971
Contract No. DAAH01-71-C-1313
Sponsored by
Advanced Research Project Agency
ARPA Order No. 1588
ARPA Support Office - Arn\y Missile Command
Directorate for Research, Development,
Engineering and Missile Systems Laboratory
U. S. Army Missile Command
Redstone Arsenal, Alabama
:%- . ■■■.)- /VA - '.•' ■;' :■
■OFSTI iUdE SkCTUM
i'aoe BiifF sEcriei p
I'ilAN, CEO. Q
j DijiÄiSjti:!J/Ay<;,:,..'ain CODES I
UISIJ^I TVAIL mi cr SPECIAL
NOTICE
"This research was sponsored by the Advanced Research Projects Aciency
of the Department of Defense under ARPA Order Ho. 1588 and was
monitored by the U. S. Army Missile Command under Contract No.
DAAHOl-71-^ 1313. Views and conclusions expressed herein are the
primary responsibility of the author or the contractor and should not
be interpreted as representing the official opinion or policy of
USAMICOM, ARPA, DOD or any other agency of the Government."

FOREWORD
This report describes work performed under Contract DAAH01-71-C01313 for
the ARPA Support Office, Research, Development, Engineering and Missiles
Laboratory, U. S. Army Missile Command, Redstone Arsenal, Alabama during the
period 30 June 1971 through 31 December 1971. The monitors for this project
were R. L. Norman and S. L. Johnston. The principal investigator was
F. Holtzberg and the report was written by F. Holtzberg, T. R. McGuire,
T. Penney, M. W. Shafer and S. von Molnar. The work was performed at the IBM
Thomas J. Watson Research Center. The authors gratefully acknowledge the
technical assistance of R. B. Hamilton, R. A. Figat, H. R. Lilienthal,
P. G. Lockwood and J. M. Rigotty, and the support of R. W. Johnson, B. L. Olson,
J. D. Kuptsis and W. Reuter who provided the following analytical techniques:
Solid state mass spectroscopy, classical chemical analysis and quantitative
electron probe microanalysis.
ii
Unclassified iuu-unly Cluhsifnnlion
DOCUMENT CONTROL DATA -R&D
rn t. OMICINATrNG ACTIVITY (Corpoflt aulhot)
International Business Machines Corporation Thomas J. Watson Research Center, P. 0. Box 218 Yorktown Heights, New York 10598
2a. REPORT SECURITY CLASSIFICATION
Unclassified a. ewroi»
S. REPORT TITLE
RESEARCH IN THE SYNTHESIS OF RARE EARTH COMPOUNDS AND A STUDY
OF THEIR MAGNETIC OPTICAL AND SEMICONDUCTING PROPERTIES 4. DESCRIPTIVE NOTtiS (Type ol report and inc/uaiv« <*«(»*>
Semiannual Technical Report (30 June 1971 to 31 December 1971) S. AUTHOR(S) (Firm nmm», middle inlliml, tmmt ntmt)
F. Holtzberg, T. R. McGuire, T. Penney, M. W. Shafer and S. von Molnar
6. REPORT OATE
January 1972 Vim. TOTAL NO. OF PAGES
.i_31 7t. NO. OF REFS
20 la. CONTRACT OR GRANT NO.
DAAH01-71-C-1313 t. PROJEC1 NO.
IS«. OrllGlNATOR'S REPORT NUMBERIS)
i IBM Project # 2552
. 9b. OTHER REPORT NO(S> (Any older .'nj/nofr» :hul r;,Hy be omlnud 1 rhfN report)
10. DISTRIBUTION STATEMENT
Distribution of this document is unlimited.
II. SUPPLEMENTARY NOTES 12. SPONSORING MILITARY ACTIVITY
Advanced Research Project Agency Arlington, Virginia 22209 ARPA Order No. 1588
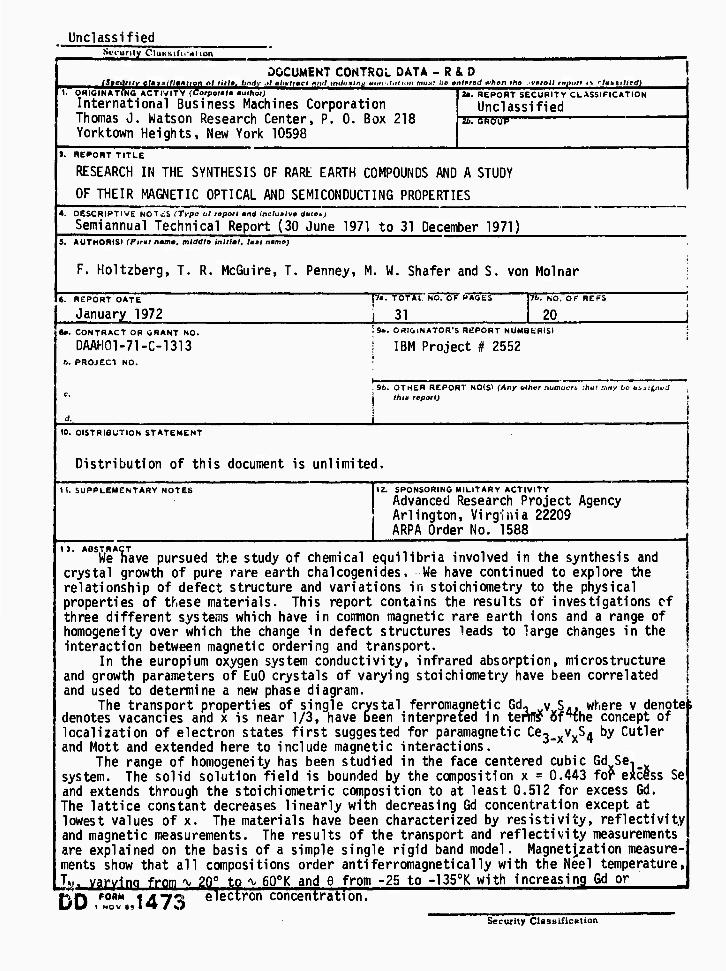
13. ABSTRAC 'We liave pursued the study of chemical equilibria involved in the synthesis and
crystal growth of pure rare earth chalcogenides. We have continued to explore the relationship of defect structure and variations in stoichiometry to the physical properties of these materials. This report contains the results of investigations cf three different systems which have in conrion magnetic rare earth ions and a range of homogeneity over which the change in defect structures leads to large changes in the interaction between magnetic ordering and transport.
In the europium oxygen system conductivity, infrared absorption, microstructure and growth parameters of EuO crystals of varying stoichiometry have been correlated and used to determine a new phase diagram.
The transport properties of single crystal ferromagnetic Gd, v S«. where v denote denotes vacancies and x is near 1/3, have been interpreted in tent» of^the concept of localization of electron states first suggested for paramagnetic Ce, v S. by Cutler and Mott and extended here to include magnetic interactions.
The range of homogeneity has been studied in the face centered cubic Gd Se, system. The solid solution field is bounded by the composition x = 0.443 for excess Se and extends through the stoichiometric composition to at least 0.512 for excess Gd. The lattice constant decreases linearly with decreasing Gd concentration except at lowest values of x. The materials have been characterized by resistivity, reflectivity and magnetic measurements. The results of the transport and reflectivity measurements are explained on the basis of a simple single rigid band model. Magnetization measure- ments show that all compositions order antiferromagnetically with the Neel temperature, Jflj varying from ^ 2Q0 to -v 60°K and 6 from -25 to -1350K with increasing Gd or FJO '0"M lÄT^i electron concentration.
Security Classification

Unclassified '- ■«CurUy CI«»tlfu«lloir
U.
KIV «0R01 ROLE WT LINK B . INK C
HOLE ROLE WT
Jemlconducting ferromagnets
Europium oxide
Synthesis
Nonstoichlometry
Crystal growth
Rare earths
Gd0 v S, 3-x x 4
GdSe
Unclassified " Sacurlty Clattiflcation
■■.•■-•'ul-t.-umtii'iru.&.wiM i'Jrt-t^Kvaii''"

SUMMARY
We have pursued the study of chemical equilibria involved in the synthesis
and crystal growth of pure rare earth chalcogenides. We have continued to
explore the relationship of defect structure and variations in stoichiometry
to the physical properties of these materials. This report contains the
results of investigations of three different systems which have in common
magnetic rare earth ions and a range of homogeneity over which the change in
defect structures leads to large changes in the interaction between magnetic
ordering and transport.
In the europium oxygen system conductivity, infrared absorption, micro-
structure and growth parameters of EuO crystals of varying stoichiometry have
been correlated and used to determine a new phase diagram.
The transport properties of single crystal ferromagnetic Gd3_xvxS4» where
v denotes vacancies and x is near 1/3, have been interpreted in terms of the
concept of localization of electron states first suggested for paramagnetic
Ce- v S. by Cutler and Mott and extended here to include magnetic interactions.
The range of homogeneity has been studied in the face centered cubic
Gd Se, system. The solid solution field is bounded by the compositi0«
x = 0.443 for excess Se and extends through the stoichiometric composition
to at least 0.512 for excess Gd. The lattice constant decreases linearly with
decreasing Gd concentration except at lowest values of x. The materials have
been characterized by resistivity, reflectivity and magnetic measurements.
The results of the transpor and reflectivity measurements are explained- on
the basis of a simple single rigid band model. Magnetization measurements show
iii

that all compositions order antiferromagnetically with the Neel temperature,
TN, varying from ^ 20° to ^ 60oK and e from -25 to -1350K with increasing Gd
or electron concentration.
iv
■-■*-™fi*Mmim&amtMii&>^'''

TABLE OF CONTENTS
1.0 INTRODUCTION
2.0 THE EUROPIUM OXIDE SYSTEM
3.0 THE FERROMAGNETIC SEMICONDUCTOR Gd3.xvxS4
3.1 Experimental
3.2 Discussion
4.0 THE GdxSe1_x SYSTEM
4.1 Experimental
4.2 Results
Paae
1
4
9
9
13
16
16
18

1.0 INTRODUCTION
In the previous contract (DAAH01-70-C-1309) we demonstrated that the
europium monochalcogenides exist over a range of compositions. Although this
homogeneity range is relatively narrow, the effective change in carrier
concentration with compositional changes results in dramatic variations in
magnetic, optical and transport properties of these systems.
We-have explored the EuO system in detail and have correlated the chemical
and physical measurements in this classic ferromagnetic semiconducting material.
We-+rttveJ[uthermore,.'generalized owr-findings by extending our studies to
other magnetic semiconductors, notably the Th^P* type gadolinium sulfide and
to the extended solid solution system GdvSe, „. ^r- (Xj ■ I -X; x^
Europium oxide, EuO, is a ferromagnet which may be metallic, insulating
or exhibit an insulator-metal transition. These differences, together with
those observed in the infrared (IR) absorption spectrum, are most likely
related to the stoichiometry of the crystals. In order to examine this
supposition in detail, we have studied the relationship of the IR and the
conductivity to the growth temperature and starting composition. We have found
that systematic changes in these parameters result in systematic changes in
the conductivity, IR absorption and the stoichiometry of the crystals. Some 2
aspects of the problem have been examined by Oliver, et al_ in their work on
the conductivity of EuO.
Although both transport and magnetic measurements have been reported on 3
various rare earth TtuP. type structures, to the best of our knowledge only
very few examples of systematic studies on either of these properties exist.
Interest in these substances is twofold: First of all the Re3_xvxX4
(X = S, Se, Te) (0 <. x < 1/3) change continuously from metals to insulators
with increasing vacancy (v) concentration, x, leading to a variety of
—-"•■^^•^■AuHi^A^^^-

3 cooperative effects such as superconductivity and ferromagnetism; secondly,
as was first recognized by the authors of Ref. 4, the random distribution of
vacancies at the Th sites leads to fluctuating repulsive potentials and tailing
of the conduction band in which the electronic states are localized. The
purpose of this study is to present magnetic and transport measurements on
magnetic ^ v S. and to interpret them, in part, in terms of the concepts
developed by Cutler and Mott for paramagnetic Ce, v S-.
During a recent attempt to grow crystals in the GdgSe.-GdgSe, system in
the vicinity of the 3:4 composition, the primary crystallization phase was
found to have a NaCl type structure with a deep blue metallic color, the
remaining phase being a eutectic composition of NaCl and the Th.,?, type defect
structure. The blue phase had a smaller lattice constant than that expected
for GdSe.
There has been evidence for some time in the literature, of compositional 5
variation in the trivalert monochalcogemdes. landelli noticed a color
variation from yellow gold to red violet in the sulfides and selemties, which
he attributed to incomplete or non-homogeneous reaction. These were poly-
crystalline materials which were reacted in quartz at temperatures up to 1450oC.
M. Guittard studied the range of homogeneity of all the rare earth mono-
sulfides using lattice constant variations of polycrystalline material to
explore the range of solid solubility. She found that the range of homogeneity
increased with atomic number. Furthermore, she determined from density
measurements that the solid solubility was on the metal-rich side with sulfur
vacancies for all the rare earth sulfides except Lu, for which the homogeneity
range extended to both sides of the stoichiometric composition. In all cases
the lattice constant increased with increasing sulfur concentration.

The rare earth monochalcogenides are gold colored because the electron
not used in bond formation is believed to be in a band formed by 5d and 6s o
wave functions giving rise to the metallic character. The Sy.p ground state
of Gd provides an atomic moment of 7yB and is, as a pure spin state
insensitive to lower order crystalline field splittings. The Gd-Se system
was chosen for a study of compositional variation in the monoselenides since
the interpretation of magnetization data does not present the complication of
having to consider orbital contributions to the magnetic moment.

BIKHUWMUmBiMMwo
2.0 THE EUROPIUM OXIDE SYSTEM
Crystals of EuO were synthesized by reacting Eu-metal and ELUOO at high
7 8 temperatures, i.e. 1450-2100^:. Since EuO at these temperatures loses Eu,
the crystals were grown in sealed tungsten crucibles from Eu rich starting
mixtures which varied from 50-35 mol % oxygen. The resulting crystals, as we
shall show, can be grouped into five classes according to their physical
properties. The growth parameters as well as the physical properties of
crystals in these five classes are summarized in Table I.
All crystals grown in the temperature range defined by Region I were found
to have an IR absorption spectrum similar to that labelled I in Fig. 1. This
spectrum is the same as that of Eu30*, indicating that in these crystals EUgO^
was present as a second phase. This supposition was confirmed by metallo-
graphic and x-ray analyses. The intensity of this absorption was weaker for
crystals richer in Eu and was absent in crystals whose starting composition
was less than 40 mole % oxygen. EuO crystals from Region I, therefore, lose
some Eu and precipitate a second phase of EuoO« (Table I).
Crystals from Region II showed no EUoO, absorption, but did have sharp
absorption lines near 3117 and 4848 cm as shown on Fig. 1. These lines are
Q 3+ characteristic of Eu , which would be expected in the EuO lattice if Eu
vacancies were also present. The absorption intensity of these lines was,
therefore, taken as a measure of the number of Eu vacancies and was observed
to be weaker in samples grown from richer Eu solutions. Crystals from Region
III had no Eu absorption and, in fact, had only weak absorption (typically
0.5 < a < 5 cm' ) between the strong lattice absorption below 600 cm' and
the electronic absorption above 7500 cm. These crystals, with minimal
absorption over a wide range of frequency, are closest to 1:1 stoichiometry.
Crystals grown with even more excess Eu show a new IR absorption spectrum

WAVE-LENGTH (MICRONS) 10.0 6.0 4.0 3.0 2.0 1.5 1.25
2000 4000 6000 FREQUENCY (cnr<)
8000
Figure 1 IR Absorption at Room Temperature for Different EuO Compositions
i
C3
§
H OOoOOOoO^
•'■-•■ 1
2
0
0 o 0 o o o 0 o0oooooooooo
y V 1
-2 \7
•1
-4 \7
V ^7
m j
-6 V 1 v T \
-8 V V = ^ ■ ^
v V
GA J
-10 . D^ n o A
y o**
-12 : , . ,?,
a 1
40 80 120 160 200 240 280 TPK)
Figure 2 Conductivity vs Temperature for Different EuO Compositions
•n-.:kv.witiM«iSJte'5ü-iiSiS

(curve IV, Fig. 1). This absorption increases with decreasing oxygen content
in the starting mixture and finally the spectrum V is observed. It is natural
to associate these spectra with the presence of oxygen deficiencies (probably
vacancies) in the crystals. The low frequency portion of the Region V spectra
show metallic absorption.
The electrical conductivity of crystals from Regions I and II are all very
similar and typical results are shown in Fig. 2. All crystals from these
regions are quite insulating, with thermal activation energies of 0.6 + 0.1 eV C Q
and room temperature resistivities of 10 - 10 Ü cm. These results are
consistent with the characterization of Regions I and II from IR and metallo-
graphic results. The conductivity of Region IV crystals is particularly
dramatic, exhibiting an insulator-metal transition ' 'below the Curie
temperature (69.30K) as shown by curve IV in Fig. 2. Near this temperature
the conductivity may change by more than 13 orders of magnitude. From this
work we expect these samples to have oxygen deficiencies of some sort. In
fact, the existence of the insulator-metal transition has been theoretically 2
related to the presence of oxygen vacancies. Crystals from Region V are
metallic at all temperatures (curve V, Fig. 2). Since oxygen vacancies are
donors in EuO, they merge with the bottom of the conduction band at these large
concentrations, giving metallic conduction.
From the results of these IR and conductivity measurements, together with
a metallographic and x-ray study of quenched samples, we were able to construct
the phase diagram shown in Fig. 3. First; there is appreciable compositional
variation in the EuO phase, on both the oxygen-rich and Eu-rich side of the
stoichiometric composition. We show the maximum width to be about 2-33», in
rough agreement with the composition at 1500oC reported in Ref. 13. Recognizing
the difficulty in using conventional techniques to determine small compositional

EuQ+LIQUID
lü
Q.
35 40 46
MOL%OXYGEN
^r OXYGEN
Figure 3 Partial Phase Diagram for the Eu-0 System
"aiiäbKääiSJS

8
ranges on this, we have used data from several sources to arrive at the 2-3%
range. These data, from microstructure, chemical analyses, carrier
concentration, and Mossbauer measurements were all consistent with this value.
However, each of these measurements alone would probably not be sufficient for
us to arrive at this value. Second; above ^ 18250C EuO is always oxygen-rich.
This fact is due to a preferential loss of europium which cannot be prevented
by adding excess Eu-metal to the closed crucible. Third; it is possible to
grow EuO crystals from a liquid phase at much lower temperatures (^ 1450oC)
7 14 than was previously thought possible. ' Finally; from the phase diagram it
is possible to select the proper composition and growth temperature so that
EuO crystals can be grown with the desired stoichiometry.
In Fig. 3, the heavy dashed line shows the composition of the liquid and
solid phases in equilibrium with pure europium vapor. There is a univariant
point at 13550C (point A) where three phases, liquid (A), solid (B) and vapor
(P- = 370 mm, the vapor pressure of Eu at this temperature) are in equilibrium.
Further lowering of the temperature or the Eu-pressure will result in the
liquid being converted to an oxygen deficient solid (B). This diagram was
determined under conditions where all reactions were carried out in closed
containers so that it was not possible to vary the pressure independently.
It therefore represents a curved surface which cuts across the volume defining
the P-T-X diagram for the europium oxygen system.
Because of the concentration gradients, a usual difficulty of melt grown
"non-stoichiometric" crystals, it is difficult to specify a distinct boundary
between adjacent regions (I, II, III, etc.) of the diagram. For example, the 3+
first part of the crystal to freeze may contain sone Eu (Region II) while
it may be absent in the last part to freeze. For this reason, broad boundaries
between the regions are shown in Fig. 3 - particularly between Regions IV and V.
/ i

3.0 THE FERROMAGNETIC SEMICONDUCTOR Gd3_xvxS4
3.1 Experimental
Crystals were grown from previously synthesized compositions in sealed W
crucibles by heating to the melting point and cooling slowly to room temperature.
The resulting material does not show any easy direction for cleavage and
magnetic measurements were performed on small samples of arbitrary shape. D.C.
transport measurements, however, were made on crystals shaped as rectangular
parallelopipeds.
Our present investigation of the GcL „v S. system extends over a very
limited range of compositions, .318^ x ^ .326. For these compositions ferro-
magnetic behavior is observed as shown in Fig. 4a and 4b. Figure 4b gives the
4.20K magnetization data which shows a pronounced field dependent moment for
both compositions. The projected zero field magnetic moment is 43 and 55 emu/gm
respectively for I and II which represents only between 1/4 and 1/3 of the
3+ 190 emu/gm calculated for complete alignment of the Gd moments.
For sample I the temperature-moment curves indicate that the Curie point,
T , is ^ 150K. On sample II measurements in the range 5 to 50oK are lacking.
A third sample from the same boule as II gave values e ^ 190K and Tc ^ 190K.
Evidently, small variations in composition exist.
Figure 4b indicates that the paramagnetic susceptibility, x. follows a
Curie-Weiss law, x " C/(T - e), where C is the Curie constant. From the linear
dependence of 1/x on temperature we conclude that the material is not ferri-
magnetic, which almost always results in a negative e intercept rather than the
observed positive values of 16.1 and 22.20K. The molar Curie constants, CM,
derived from the slopes of Fig. 4b are 7.51 and 7.56 for samples I and II 3+
respectively. These values are 'v 5% lower than CM = 7.87 calculated for 6d .
... .■'-«-MU(u*».i^ftW««^^iwita'^^RS

10
100
I | 50
b 25
0 i 1 i 1 2 4
O—"
IF
n ei-*'
_o._J
I 1
T=4.20K i
(a)| 1 1 1 6 8
i 1 i 1 , ; 10 12
H(kOe)
0 50 100 150 200 250 JDO 350 TCK)
Figure 4a Magnetic Moment, a, vs Applied Magnetic Field, H, at 4.2CK
Figure 4b Temperature Dependence of the Inverse Susceptibility, 1/X» for Two Compositions, I and II

11
icrl
n(H*o) ...o——o——0"
n(H>l2k(M
j L J i I i I SO 100 ISO 200 2S0
Figure 5 Resistivity, p, vs Reciprocal Temperature. The Paramagnetic Curie Temperatures are 6(1) = 16.TK and 6(11) = 22.20K.
to
- 9- h-ft™
I .XE? -5
I oJ -B
J I I L. so no eo
»Vr (•K)-' 200
Figure 6 Hall Coefficient, eH/H , and Seebeck Coefficient, S, vs Reciprocal Temperature

12
We speculate that the materials either form a canted structure15 or that
the results represent a superposition of several magnetic phases.
The results of the resistivity, p, with and without an applied field of
12 kOe as a function of temperature are exhibited in Fig. 5. The following
features should be noted: (i) Both samples show a resistance minimum near
100oK; (ii) Between % 100oK and ^ e, p is activated with an energy E{I) ^ -2 -2
1.7 x 10 eV and E(II) ^1.1 x 10 eV. Below e, p remains activated but with
a significantly reduced activation energy; (iii) Application of a magnetic
field reduces p and E below ^ 40°K. It is clear that the negative magneto-
resistance which is effected either by an applied magnetic field or by
temperature (through the Weiss field), is related to the state of magnetic
order.
Figure 6 depicts the results of thermoelectric power and Hall measurements.
The Seebeck coefficient, S, becomes a minimum near 100oK, just as did p, rises
to a maximum just above e, and then decreases towards 0 as T -♦■ 0. The sign of
S is always negative. The Hall coefficient, eu/HA. is negative at room
temperature but reverses sign near, but below, the temperature at which p is
a minimum. For reasons discussed below, this sign reversal was unexpected and
we have attempted to eliminate such spurious causes for anomalous Hall behavior
as surface effects and an unusually large Nernst-Ettinghausen effect. The
former was tested by comparing the temperature dependent resistivities of
samples with clean and lapped surfaces. No significant differences were
observed. The latter was tested by comparing 210 hz and D.C. results on
sample II at 300°K and % 56°K. Both the magnitude and sign of the Hall
coefficient agreed. We were unable to make Hall measurements below ^ 350K
because the onset of the large negative magnetoresistance masked the effect.

13
3.2 Discussion
If we restrict our discussion to the region above e, Gd, v S., exhibits
resistivity characteristics (Fig. 5) very similar to those observed in
4 4 Ce3-xvxS4' Cut",er anc' Mott ana"lyze their data in terms of band conduction
above the mobility edge at high temperatures and hopping conduction in
localized states below this edge at low temperatures. The potential giving
rise to this tail is attributed to the disordered vacancies in the Th,?.
structure. Besides the resistivity minimum in various samples of Ce3 v S-,
with x near 1/3, we note other similarities in transport phenomena. |S|
decreases linearly with decreasing T with a slope having non-zero intercept
but in several cases starts to rise again in a manner similar to that shown
in Fig. 6 below ^ 100oK. The sign of S is always negative. Cutler and Mott
argue that hopping transport results in a linear dependence of S on T, i.e.
S = (^ + C2T 3.2.1
where C, and C« are constants, provided that the density of states at the Fermi
energy, N(Ep) and a(Ep) = l/p(Ep) are appreciable. If this is not the case,
these authors show that an increase in |S| is expected, since transport will
then be dominated by contribution of thermally excited electrons above the
mobility edge. S as well as eu/HA are negative as expected, since the
substitution of Ce atoms for vacancies adds electrons to the conduction band.
Since transport in the paramagnetic Ce system is satisfactorily explained
in terms of localization of electron states, we shall adopt a similar point of
view for its ferromagnetic counterpart Gd3_xvxS4, with the additional hypothesis
that at least part of the energy which localizes the electrons is magnetic in

14
origin. The idea of localization through exchange interactions, J -, between
conduction electrons and localized spins has been explored in detail with ■jo
respect to the transport properties of NaCl-type Eu-chalcogenides. We wish
to note here only two properties of this magnetic binding energy, E : (i) E
exists far above the magnetic ordering temperature because J f is, in general,
larger than Jf_f, the exchange primarily responsible for long range order, (ii)
Em approaches 0 with increasing magnetic order since J - can no longer
significantly alter the magnetic environment near the electron.
The gross features of the temperature dependence of the resistivity in
samples I and II can then be explained as follows: (i) The approximately
linear decrease in p betweer .»00 and 100oK is dominated by lattice scattering
of thermally excited band electrons; (ii) The activated process between ^ 80
and ^ 20fK is dominated by hopping in localized states (although thermally
excited states may contribute); (iii) Near and below 6, the activation energy
for transport becomes smaller due to the onset of magnetic order, as seen in
Fig. 5 below ^ 20°K. The qualitative behavior with an applied magnetic field
follows, since, the magnetic field tends to decrease the binding energy for the
electron and hence its activation energy.
The model is also consistent with the observed behavior of S if we accept
the explanation for the low temperature rise in |S| given by Cutler and Mott
i.e. that S is dominated by contributions from band states. The final reduction
in |S| below 6 is then due to the reduction in magnetic binding energy which
will increase the number of thermally excited carriers. Futhermore, fundamental
considerations require that S approach 0 at T -► 0oK.
We believe that the sign reversal of the Hall effect is due to a
contribution from the anomalous Hall constant, R^ usually found in ferro-
magnetic materials. A plot of eH/H versus x for sample II (where the best data

15
is available) yields a straight line with slope |R| ^ 7 x 10 fi-cm/G which is
19 comparable in magnitude to values found in ferrites where conduction is
believed to occur in narrow d-bands. Further work is necessary to confirm
this explanation.
•.i-J V. J. JJ«;, 'iiri^vSiVAJ

16
4.0 THE 6dxSe1_x SYSTEM
4.1 Experimental
Since among other measurements, we elected to examine transport properties
and reflectivity as a function of concentration, it became apparent that it
would be useful to obtain single crystals. In order to study the homogeneity
range, two large charges on either side of the stoichiometric composition were
synthesized using the following procedure: All materials were handled in a He
purged dry box. Metallic Gd sponge obtained from the Lunex Corp. having a
nominal 99.9 concentration and 99.999 Se from the United Mineral and Chemical
Corp. were reacted by the vapor transport of Se to the gadolinium side of an
evacuated and sealed dual chamber quartz reaction tube. This reaction was
carried out at a maximum temperature of 600oC because at higher temperatures
there was evidence of quartz attack. Transport was considered complete when
the characteristic color of Se vapor disappeared. The product of this reaction
is quite inhomogeneous. The entire charge was transferred to a large tungsten
crucible which was covered and sealed by electron beam welding. The crucible
was then heated to 1600oC in a vacuum heated RF furnace. The two samples were
powdered and chemical analysis gave the Gd rich composition as GdSe g, and the
Se rich composition as Gd 72Se- A series of samples developed from mixtures of
these two compositions were used for crystal growth. Samples of approximately
6 grams were pressed into pellets which were sealed into 3/8 x 2 in. tungsten
crucibles. Crystals were grown in an induction heated RF furnace using a 10
torr vacuum to protect the crucible from surface reaction. Temperature
measurement and control were achieved with an NBS calibrated L&N automatic
optical pyrometer, surface temperature having been calibrated with a black body

17
measurement obtained with the same geometry. Samples were heated to the
melting point and cooled at about a degree per minute to 700oC at which point
the power was turned off.
X-ray data were obtained with a Guinier focussing camera using Si as an
internal standard. A least squares fit to the data gave a standard deviation
of 0.001 A.
Relative sample concentrations were obtained using an ARL EMX-SM electron
microprobe with Gd metal as a standard. The error in concentration from sample
to sample was estimated to be of the order of 0.5%. The composition scale was
fixed wUh wet chemical analysis of three of the microprobe samples. Gd was
determined by an EDTA titration and Se by a permanganometric titration. The
error in the analysis was estimated to be of the order of 1%.
An AE1 MS-7 double focussing solid state mass spectrometer was used for
impurity analysis of the Gd metal and several single crystals of the selenide.
Y and Ho were found in the 100-200 pptn range and Cu, Si, 0, C and Na at the
100-300 ppm level. Synthesis and crystal growth of the selenide led to small
increases in Na and Cu concentrations and considerable reduction in the C and
0 impurity levels. Since the small increase in Na and Cu concentrations
(about 50 ppm) was not found to scale with Gd content, the effects of
impurities on physical properties were considered to be negligible.
Magnetization data were obtained with a force balance in fields up to 20
Kilogauss in the temperature range 4.20K to room temperature.
A Gary 14 R spectrometer, modified with a reflectivity jig for 10°
incidence was used for measuring the shift in reflectance spectra with
composition. Instrumental corrections were obtained with an evaporated gold
film standard.
18
A standard 5 probe D.C. technique was used to measure the resistivity as
a function of temperature as well as the Hall effect, wherever possible.
Measurements were limited to signals greater than 10" volts.
4.2 Results
A striking result of the crystal growth experiments is the dramatic
variation of sample color as a function of composition. The Gd rich samples
were a bright yellow gold color and as the Gd concentration decreased the color
changed progressively to bronze, copper, red gold, purple and at the lowest Gd
concentration, a deep metallic blue. Since there was a small temperature
gradient along the crucible during crystal growth, a concentration gradient
developed as the sample crystallized. Each single crystal ingot, therefore,
graphically represented the crystallization process of the system. The initial
crystallization was found to have the highest Gd concentration or most gold-
like color and the final crystallization the lowest Gd concentration or most
blue-like color, reflecting the range of solidus concentrations for a particular
melt composition. Crystals of uniform color were cleaved from an ingot for
analysis and it was found that by carefully matching the color of crystals from
different areas it was possible to reproduce all physical measurements within
the error of each determination. The gadolinium rich compositions were found
to melt at approximately 2350oC. Melting temperatures decreased smoothly to
about 1750oC for the blue, selenium rich phase.
Figure 7 is a plot of lattice constant as a function of concentration.
The overall decrease of lattice constant with increasing Se concentration is
unexpected and contrary to Guittard's results for LuS. It is possible that
density determinations will shed some light on the nature of the defect

19
•S 5.79
V)
8 5Te
UJ Ü H
5.77-
5.76
^ GOLD
4-( BRONZE
i-J-^COPPER
I^H RED GOLD
\^ PURPLE : ^BLUE
i i i i iii
""BLUE PURPLE
.52 .51 .50 .49 .48 .47 .46 45 MOLE FRACTION x in GdxSe|.x
44
Figure 7 Lattice Constant a as a Function of Composition x in Gcl^e^

20
structure and provide an explanation for the lattice contraction. A straight
line has been drawn through the stoichiometric composition. It is reasonable,
however, to expect differences in slope on either side of this concentration.
Although the data illustrates the general trend shown by the straight line,
additional measurements are necessary to show any detailed changes in slope.
In the composition range x = 0.443 to 0.463 the lattice constant goes
through a minimum as shown by the solid line. The lattice constant for the o
blue phase, (x = 0.443), is 5.770 A, which is identical with the value obtained
from the NaCl pattern of the two phase region. This composition therefore,
represents the limiting concentration of the Se rich field.
It is also possible to draw a horizontal line (dashed line) which just
touches the error bars for the three data points used to define the minimum.
Such a line of constant a0 would indicate that this is a two phase region.
This would place the solubility limit in the Se rich field at x 'v* 0.465.
However, neither x-ray nor metallographic analyses showed any evidence of a
second phase.
The results of the resistivity measurements can be summarized as follows:
(i) The bronze and gold colored samples, which have comparably low resistivities,
p, exhibit a temperature dependence in p normal for magnetically ordered metals
(lower curves in Fig. 8). The resistivity is linear in the paramagnetic region
with a knee near TN and drops precipitously as the temperature decreases towards
0oK. This is readily analyzed with three contributions to the resistivity
ü = P, +p.+D, 4.2.1 M ML Mi Mm'
where p. = lattice, p. = impurity and p = magnetic contributions to the
resistivity. For these two samples pm is constant above TN (only spin disorder

21
22.5
20.0
1175 i
CS *P5.0 o ^12.5 l-
plO.0 V) W ^7.5
50
2.5
0.0
BRONZE
j l i l i l i I i I i I i I 50 100 150 200 250 300 350
TEMPERATURECK)
Figure 8 Resistivity, p, as a Funciton of Temperature (0K) for Four Compositions, x, in the Gd Se, System

22
scattering) which accounts for the observed curve, (ii) The resistivity as a
function of temperature for both the blue and purple samples are plotted in
the upper part of Fig. 8. The room temperature resistivity is higher (because
the free electron concentration is lower) and the linear decrease in p with
decreasing temperature reaches a minimum near 750K, thereafter increasing to
a constant value at low temperatures. Again we might analyze the data with
equation (4.2.1) with the assumption that p includes a critical scattering term.
On -the other hand T... from magnetic data has not changed appreciably and it
is unlikely that the resistivity will remain constant below T...
The Hall effect was measured at room temperature for the purple sample
(Gd ^gcSe 535) and the carrier concentration derived by assuming a simple band
22 -3 was n = 1.4 x 10 cm . It is possible to check the consistency of this
number with other independent measurements as follows: If we assume that each
Gd contributes one electron to the conduction band, simple valence arguments
lead to the expression
N0 [3x - 2(1 - x)] x2 = n 4.2.2
where M = carrier concentration for the stoichiometric composition (x = 0.5)
where x = composition. Solving for N , using the experimental values x = 0.465
and n = 1.4 x 1022 cm-3, one obtains N0 = 2.2 x 10 cm" . On the other hand
we can also calculate No lJSing the lattice parameter for stoichiometric material
as N = 4/a3 = 4/(5.78 x 10'8)3 = 2.1 x 1022 cm"3. The agreement is very
satisfying and lends evidence to our model of a simple rigid band in which the
number of free carriers is determined by the stoichiometry.

23
lOOr
ÜJ
I Lü er
ÜJ o a: LÜ Q.
10
BRONZE
PURPLE
BRONZE
BLUE
PURPLE
2 3 4 hi/(eV)
Figure 9 Percent Reflectance R as a Function of Energy hv

10 9 8 7
24
'E
CM o
^ 3
x = 512-1
x =493-1 -.504
x =465-1
^-xs 443
|L 1 3 4
hi/ (eV)
J I I I I I 5 6 7 8 9 iO
Figure 10 Carrier Concentration, n. Derived from Experimental Composition, x, as a Function of hv for Which the Reflectivity is a Minimum. The Data is Plotted on a Log-Log Scale to Demonstrate that n « (hv) in the GdSe1 System.

25
It is also tempting to attribute the dramatic changes in color simply to
changes in carrier concentration. Figure 9 shows reflectivity data for three
representative samples. For the case that the reflectivity minimum, R-.^» is
< 5%, the dispersion relation for free carriers yields the following expression:
n A,»_ ras a r^^r 4-2'3
oo
where ms is the effective mass e^ is the high frequency dielectric constant, n
is the number of free carriers per unit volume and A . is the wavelength at
1 2 which R j occurs. Since v<*r-, (4.2.3) can be rewritten as (hv)'. « n, and,
assuming that m. and e do not vary substantially throughout the series, a plot
of log n vs hv should yield a straight line with a slope equal to 2. We have
assumed here that the reflectivity is dominated by free carriers and that
interband transitions, etc. perturb the spectra only slightly. Figure 10
exhibits the results of such a plot. It is apparent that the curve is
consistent with our model with the exception of the lowest point.
All compositions in the solid solution system order antiferromagnetically.
A rough measure of Neel temperatures Indicates that they vary from ^ 20oK for
x = 0.443 to ** 60oK for x = 0.512. A plot of paramagnetic e values as a
function of composition (Fig. 11) is essentially linear with composition except
for x = 0.443. Comparing these with the resistivity results we see that ths
negative exchange Interaction increases strongly with electron concentration.
As we have shown the relationship between observed experimental parameters
and composition Is surprisingly direct, and in the case of resistivity and
reflectivity is well explained by the simplest of all models, a single rigid
band. It should of course be noted that in all cases the lowest Gd composition

iMUMItjaBIIIBIWMWftWBMrrWt^ *~K i "n • s ni..;
26
-140
£ -120
51 .50 49 48 47 46 MOLE FRACTION x in GdxSe,.x
45 44
Figure 11 Paramagnetic Curie Temperature, 9, as a Function of Composition x, for Gd SeT
A I "A

27
appears to be anomolous, but the explanation probably lies in the breakdown of
the free electron approach at lowest Gd concentrations. The possibility of
two phases can be ruled out from the lattice constant argument given earlier
as well as on the basis of a more detailed examination of the susceptibility
data. The limiting concentration of the Gd - Th3P4 solid solution system
forming the boundary of ehe two phase region is strongly ferromagnetic with 6
20 positive and equal to 880K. Measurements on the eutectic phase also gave
a positive 6. Any small amount of this ferromagnetic material in the
composition x = 0.443 would show a deviation from the linear plot in Fig. 11
towards a more positive 6, which is contrary to experimental results.
s
28
References
1. J. B. Torrance provided the infrared data - this work was performed under
ONR Contract No. N00014-70-C-0272.
2. M. R. Oliver, Ph.D. thesis, Dept. of Electrical Eng., M.I.T., June 1970
(unpublished).
M. R. Oliver, J. A. Kafalas, J. 0. Dimmock and T. B. Reed, Phys. Rev.
Letters, 24, 1064 (1970).
M. R. Oliver, 0. 0. Dimmock, A. L. McWhorter and T. B. Reed, Phys. Rev.
B (to be published).
3. Landolt-Bornstein Tables, K. -H. Hellwege and A. M. Hellwege eds., 4^,
pp. 41-109, Springer-New York (1970).
4. M. Cutler, J. F. Leavy and R. I. Fitzpatrick, Phys. Rev., 133, A1143
(1964); M. Cutler and J. F. Leavy, Phys. Rev., 133, A1153 (1964);
M. Cutler and N. F. Mott, Phys. Rev., 181., 1336 (1969).
5. A. landelli, "Rare Earth Research" Ed. E. V. Kleeber, MacMillan, 1961,
New York, Vol. 1, p. 135.
6. Mile M. Guittard, Compt. Rend., 261, 2109 (1965).
7. M. W. Shafer, J. Appl. Phys., 36, 1145 (1965).
8. J. M. Haschke and H. A. Eick, J. Phys. Chem., 73, 374 (1969).
9. G. H. Dieke, "Spectra and Energy Levels of Rare Earth Ions in Crystals",
Interscience, New York (1968).
10. G. Petrich, S. von Molnar and T. Penney, Phys. Rev. Letters, 26_, 885 (1971),
11. T. Penney, M. U. Shafer and J. B. Torrance (to be published).
12. S. von Molnar and T. Kasuya, Proc. 10th Int. Conf. on Phys. Semiconductors,
S. P. Keller, 0. C. Hensel, F. Stern Eds. Conf. 700, 801, U. S. AEC Div.
of Tech. Inf., Oak Ridge, Tenn., 1970, p. 233.

ir.wHemMmtamMwm&säsBesmmiss^^
29
13. R. G. Bedford and E. Catalano, J. Solid State Chem., 3, 112 (1971).
14. T. B. Reed and R. E. Fahey, J. Crystal Growth, ]0, 211 (1971).
15. P. G. de Gennes, Phys. Rev., l^B, 141 (1960).
16. E. H. Putley, "The Hall Effect and Related Phenomena", Butterworth,
London (1960).
17. Olof Lindberg, Proc. I.R.E., 40, 1414 (1952).
18. S. von Molnar and T. Kasuya, Proc. 10th Int. Conf. on Phys. of
Semiconductors, S. P. Keller, J. C. Hensel, F. Stern, eds. Conf. 700,
801, U. S. AEC Div. of Tech. Inf., Oak Ridge, Tenn., 1970, p. 233.
19. J. M. Lavine, Phys. Rev., J23, 1273 (1961).
20. F. Holtzberg, T. R. McGuire, S. Methfessel and J. C. Suits, J. Appl.
Phys., 35, 1033 (1964).