cmsc 471 fall 2009
DESCRIPTION
CMSC 471 Fall 2009. Class #21 – Tuesday, November 10. Instance-Based & Bayesian Learning. Chapter 20.1-20.4. Some material adapted from lecture notes by Lise Getoor and Ron Parr. Today’s class. k-nearest neighbor Naïve Bayes Learning Bayes networks. Instance-Based Learning. - PowerPoint PPT PresentationTRANSCRIPT

1
CMSC 471CMSC 471Fall 2009Fall 2009
Class #21 – Tuesday, November 10

2
Instance-Based & Bayesian Learning
Chapter 20.1-20.4
Some material adapted from lecture notes by Lise Getoor and Ron Parr

3
Today’s class
• k-nearest neighbor• Naïve Bayes• Learning Bayes networks

Instance-Based Learning
K-nearest neighbor
4

IBL
• Decision trees are a kind of model-based learning– We take the training instances and use them to build a model of the
mapping from inputs to outputs– This model (e.g., a decision tree) can be used to make predictions on new
(test) instances
• Another option is to do instance-based learning– Save all (or some subset) of the instances– Given a test instance, use some of the stored instances in some way to
make a prediction
• Instance-based methods:– Nearest neighbor and its variants (today)– Support vector machines (next time)
5

Nearest Neighbor• Vanilla “Nearest Neighbor”:
– Save all training instances Xi = (Ci, Fi) in T
– Given a new test instance Y, find the instance Xj that is closest to Y
– Predict class Ci
• What does “closest” mean?– Usually: Euclidean distance in feature space– Alternatively: Manhattan distance, or any other distance metric
• What if the data is noisy?– Generalize to k-nearest neighbor– Find the k closest training instances to Y– Use majority voting to predict the class label of Y– Better yet: use weighted (by distance) voting to predict the class label
6

Nearest Neighbor Example:Run Outside (+) or Inside (-)
7
Humidity
Temperature
0
100
0 100
+
+
+
+
- --
-
-
-
-
+
+
• Noisy data• Not linearly separable
Decision tree boundary (not very good...)
??
??
????
--
??
??
??

Naïve Bayes
8

Naïve Bayes
• Use Bayesian modeling
• Make the simplest possible independence assumption:– Each attribute is independent of the values of the other attributes,
given the class variable
– In our restaurant domain: Cuisine is independent of Patrons, given a decision to stay (or not)
9
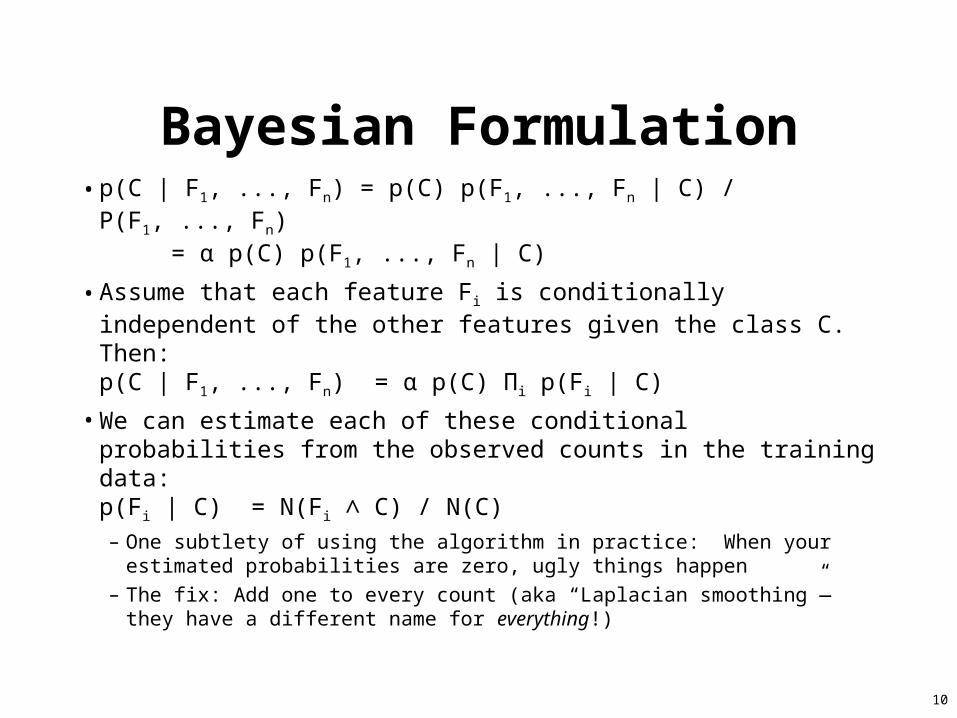
Bayesian Formulation• p(C | F1, ..., Fn) = p(C) p(F1, ..., Fn | C) / P(F1, ..., Fn)
= α p(C) p(F1, ..., Fn | C)
• Assume that each feature Fi is conditionally independent of the other features given the class C. Then:p(C | F1, ..., Fn) = α p(C) Πi p(Fi | C)
• We can estimate each of these conditional probabilities from the observed counts in the training data:p(Fi | C) = N(Fi ∧ C) / N(C)– One subtlety of using the algorithm in practice: When your estimated
probabilities are zero, ugly things happen
– The fix: Add one to every count (aka “Laplacian smoothing”—they have a different name for everything!)
10
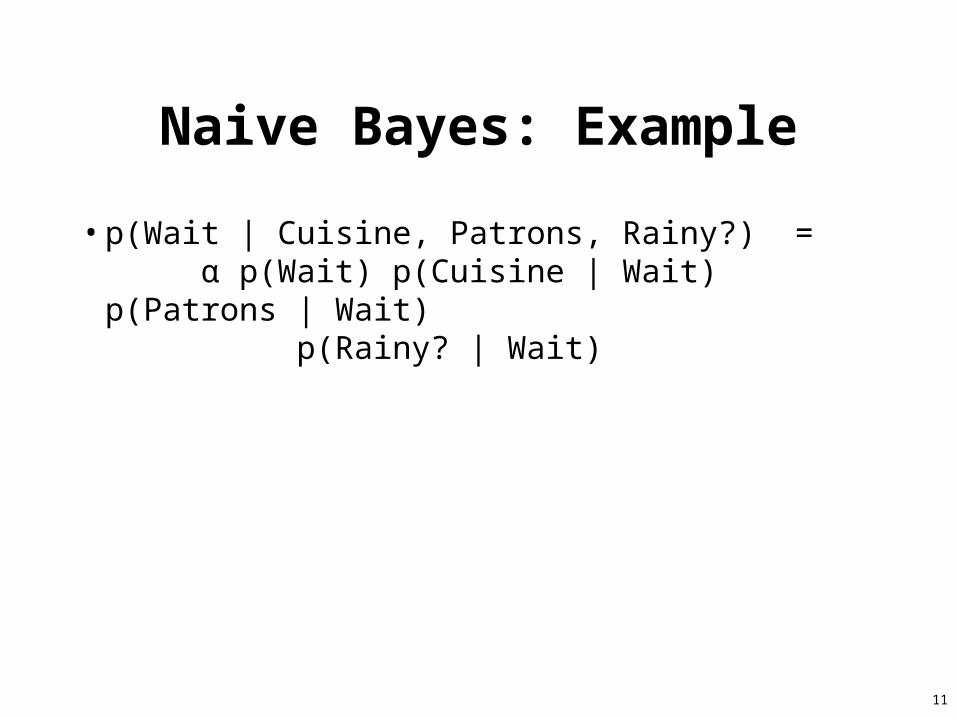
Naive Bayes: Example
• p(Wait | Cuisine, Patrons, Rainy?) = α p(Wait) p(Cuisine | Wait) p(Patrons | Wait) p(Rainy? | Wait)
11

Naive Bayes: Analysis
• Naive Bayes is amazingly easy to implement (once you understand the bit of math behind it)
• Remarkably, naive Bayes can outperform many much more complex algorithms—it’s a baseline that should pretty much always be used for comparison
• Naive Bayes can’t capture interdependencies between variables (obviously)—for that, we need Bayes nets!
12

Learning Bayesian Networks
13

14
Bayesian learning: Bayes’ rule
• Given some model space (set of hypotheses hi) and evidence (data D):– P(hi|D) = P(D|hi) P(hi)
• We assume that observations are independent of each other, given a model (hypothesis), so:– P(hi|D) = j P(dj|hi) P(hi)
• To predict the value of some unknown quantity, X (e.g., the class label for a future observation):– P(X|D) = i P(X|D, hi) P(hi|D) = i P(X|hi) P(hi|D)
These are equal by ourindependence assumption

15
Bayesian learning• We can apply Bayesian learning in three basic ways:
– BMA (Bayesian Model Averaging): Don’t just choose one hypothesis; instead, make predictions based on the weighted average of all hypotheses (or some set of best hypotheses)
– MAP (Maximum A Posteriori) hypothesis: Choose the hypothesis with the highest a posteriori probability, given the data
– MLE (Maximum Likelihood Estimate): Assume that all hypotheses are equally likely a priori; then the best hypothesis is just the one that maximizes the likelihood (i.e., the probability of the data given the hypothesis)
• MDL (Minimum Description Length) principle: Use some encoding to model the complexity of the hypothesis, and the fit of the data to the hypothesis, then minimize the overall description of hi + D

16
Learning Bayesian networks
• Given training set
• Find B that best matches D– model selection
– parameter estimation
]}[],...,1[{ MxxD
Data D
InducerInducerInducerInducer
C
A
EB
][][][][
]1[]1[]1[]1[
MCMAMBME
CABE

17
Parameter estimation• Assume known structure
• Goal: estimate BN parameters – entries in local probability models, P(X | Parents(X))
• A parameterization is good if it is likely to generate the observed data:
• Maximum Likelihood Estimation (MLE) Principle: Choose so as to maximize L
m
mxPDPDL )|][()|():(
i.i.d. samples
18
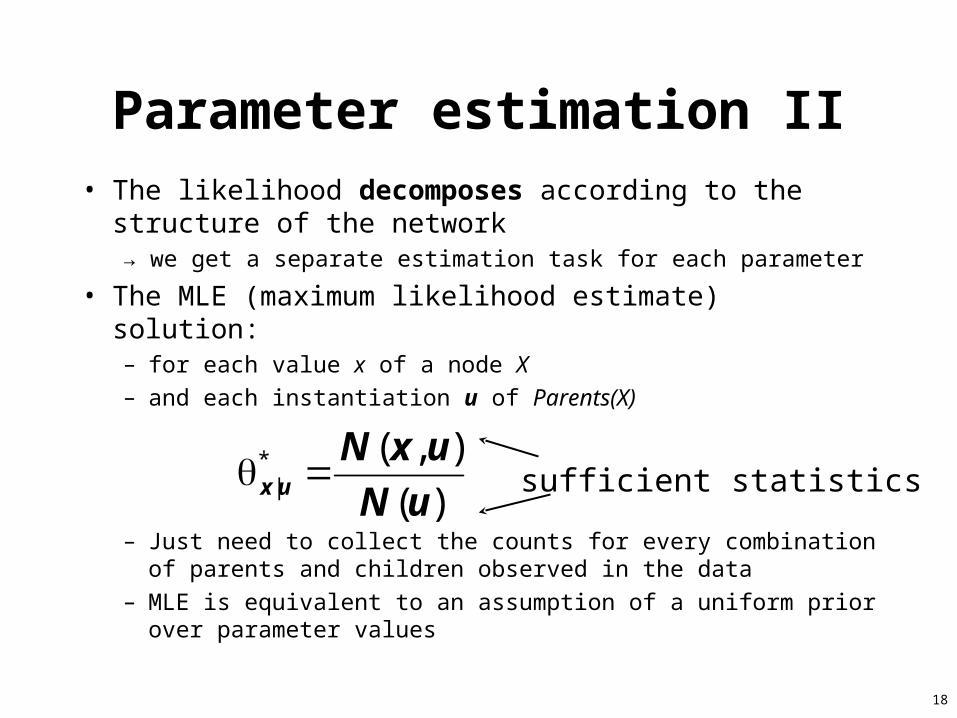
Parameter estimation II• The likelihood decomposes according to the structure of
the network→ we get a separate estimation task for each parameter
• The MLE (maximum likelihood estimate) solution:– for each value x of a node X
– and each instantiation u of Parents(X)
– Just need to collect the counts for every combination of parents and children observed in the data
– MLE is equivalent to an assumption of a uniform prior over parameter values
)(
),(*| uN
uxNux sufficient statistics

19
Sufficient statistics: Example
• Why are the counts sufficient?
Earthquake Burglary
Alarm
Moon-phase
Light-level
)(
),(*| uN
uxNux
θ*A | E, B = N(A, E, B) / N(E, B)

20
Model selection
Goal: Select the best network structure, given the data
Input:
– Training data
– Scoring function
Output:
– A network that maximizes the score

21
Structure selection: Scoring• Bayesian: prior over parameters and structure
– get balance between model complexity and fit to data as a byproduct
• Score (G:D) = log P(G|D) log [P(D|G) P(G)]
• Marginal likelihood just comes from our parameter estimates
• Prior on structure can be any measure we want; typically a function of the network complexity
Same key property: Decomposability
Score(structure) = i Score(family of Xi)
Marginal likelihoodPrior
22
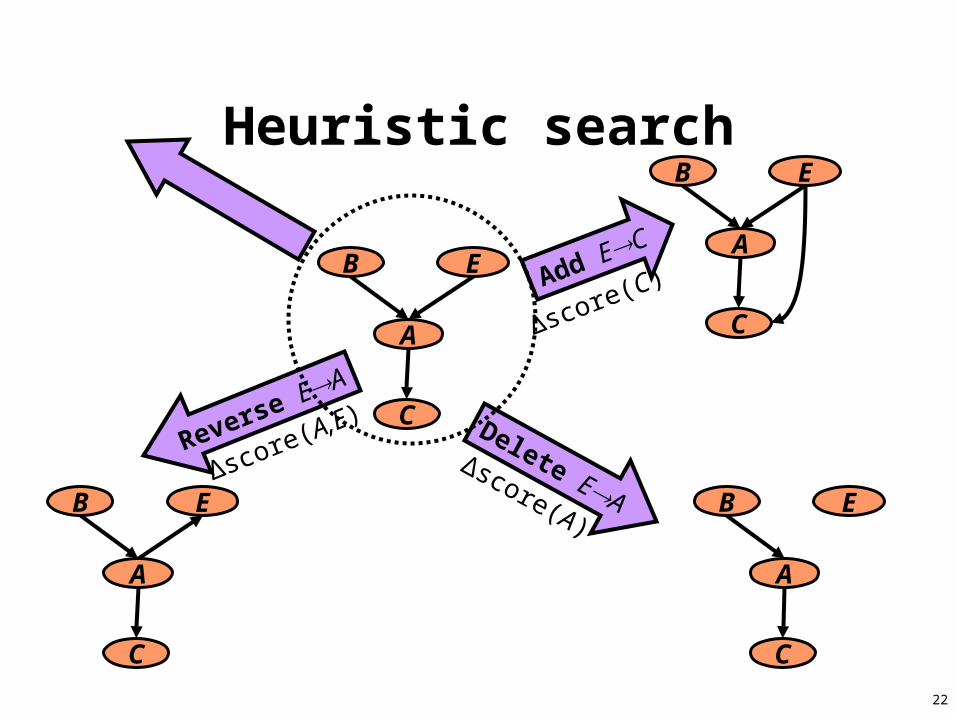
Heuristic search
B E
A
C
B E
A
C
B E
A
C
B E
A
C
Δscore(C)Add EC
Δscore(A)
Delete EAΔscore(A,E)
Reverse EA

23
Exploiting decomposability
B E
A
C
B E
A
C
B E
A
C
Δscore(C)Add EC
Δscore(A)
Delete EAΔscore(A)
Reverse EA
B E
A
C
Δscore(A)
Delete EA
To recompute scores, only need to re-score familiesthat changed in the last move

24
Variations on a theme
• Known structure, fully observable: only need to do parameter estimation
• Unknown structure, fully observable: do heuristic search through structure space, then parameter estimation
• Known structure, missing values: use expectation maximization (EM) to estimate parameters
• Known structure, hidden variables: apply adaptive probabilistic network (APN) techniques
• Unknown structure, hidden variables: too hard to solve!

25
Handling missing data
• Suppose that in some cases, we observe earthquake, alarm, light-level, and moon-phase, but not burglary
• Should we throw that data away??
• Idea: Guess the missing valuesbased on the other data
Earthquake Burglary
Alarm
Moon-phase
Light-level

26
EM (expectation maximization)
• Guess probabilities for nodes with missing values (e.g., based on other observations)
• Compute the probability distribution over the missing values, given our guess
• Update the probabilities based on the guessed values
• Repeat until convergence

27
EM example
• Suppose we have observed Earthquake and Alarm but not Burglary for an observation on November 27
• We estimate the CPTs based on the rest of the data
• We then estimate P(Burglary) for November 27 from those CPTs
• Now we recompute the CPTs as if that estimated value had been observed
• Repeat until convergence! Earthquake Burglary
Alarm