cmi limited annual report 2009 · cmi limited annual report 2009 cmi l imi ted annu al repo r t...
TRANSCRIPT
CMI Limited Annual Report 2009
CM
I LIM
Ite
d A
nn
uA
L R
ep
oR
t 2009

CMI LIMITED ANNUAL REPORT 2009
CMI LIMITED ANNUAL REPORT 2009 1
CONTENTSCMI 2
Chairman’s Review 3
Operational Overview 4
Directors & Senior Management 5
CMI Locations 6
Financial Report 7
Shareholder Information 81
Corporate Directory 84
The Annual General Meeting of CMI Limited will be held at the Brisbane Riverview Hotel, cnr Kingsford Smith Drive and Hunt Street, Hamilton on Friday 27 November at 10.00 am. The business of the meeting is outlined in the formal Notice and Proxy Form that is enclosed with this report.
FINANCIAL CALENDAR
Financial year end 30 June 2009ASX announcement of results and dividend 28 August 2009Annual General Meeting 27 November 2009
ANNUAL GENERAL MEETING

CMI LIMITED ANNUAL REPORT 20092
CMI
CMI Limited’s continuing operations comprise the CMI Electrical Products division and the TJM Products division
• CMI Electrical Products
– This division specialises in the manufacture of specialty electrical cables, sourcing and supply of niche electrical cables, high voltage cables, flexible cables and plugs and couplers.
– Business units include: Aflex Cables, Hartland Cables, XLPE Cables, Minto Industrial Products and a cable assembly unit.
– Each of the five electrical components business units focuses on one or two industry sectors and the cumulative reach of the division’s product range now extends across mining, industrial and construction.
– Market penetration is achieved through 7 distribution outlets, 5 that are run by the company in Sydney, Brisbane, Rockhampton, Melbourne and Perth and 2 distributors located in New Zealand and Adelaide.
• TJMProducts
– This division specialises in designing, manufacturing, wholesaling and retailing of vehicle accessories for the 4WD, SUV & Trade markets.
– Primary products include bull bars, winches, recovery gear, snorkels, canopies & suspension.
– Market penetration is achieved through approximately 40 TJM branded aftermarket retail distribution stores throughout Australia, product supply to major original equipment manufacturers such as Nissan and direct export to a distribution network covering most continents.
CMI Limited’s other operation during the year is the Capitalcorp Finance division. This division specialised in broking finance products in the automotive, equipment & business sectors with a small focus on the housing sector, insurance & warranties. During the 2009 financial year, CMI Limited successfully divested 51% of its finance division with the remaining 49% sold in the 2010 financial year.
CMI LIMITED ANNUAL REPORT 2009 3
Chairman’s Review
This last year has been difficult for most companies. The collapse in Australian and global financial markets has impacted nearly every sector of the economy. The result for CMI has been weakness in the markets for the sales of products in Electrical and in TJM which has affected trading and profitability for the two divisions.
This year has also seen the completion of the disposal of the finance division.
As we reviewed TJM, it became clear that the cost base for the manufacturing operations needed to be reorganised in order to compete effectively in the future. As a result, manufactured products are sourced directly from suppliers both in China and in Thailand. We believe that TJM now has an effective cost base for its products and while it will take a period of time to properly establish supply lines and quality control, we believe that TJM is now able to position itself, with an expanded range of products, for increased sales both in Australia and overseas.
The Electrical business has substantial sales into both mining and construction. Both sectors have suffered in the last year and Electrical sales have been affected. However, we believe that with the recovery of those sectors, Electrical will also recover and will regain its previous sales and profitability. The business will seek expansion opportunities in product and in markets.
While the year has been difficult, and the Company has reviewed the balance sheet to ensure that we are carrying assets at realistic values, we believe that CMI is now positioned for a solid period of performance.
Colin Ryan
Chairman
CMI LIMITED ANNUAL REPORT 20094
CMI Operational Overview
CMI Electrical Products 2009The Electrical Products Division produced a pre-tax profit of $11.9m, a decrease of $3.0m on the 2008 year. Revenue decreased to $49.1m, 5.4% (or $2.8m) down on last year.
The Mining Sector performed above expectations in QLD and NSW with WA seeing a downturn in the mining sector caused by the GEC.
The downturn in sales came mainly from the Industrial and OEM sectors.
Market penetration is achieved through 7 distribution outlets, 5 that are run by the company in Sydney, Brisbane, Rockhampton, Melbourne and Perth and 2 distributors located in New Zealand and Adelaide.
CMI Electrical comprises a number of well known product brands which include the following:
• HartlandCables
• MintoIndustrialProducts
• XLPECables
• AflexCables
In the 2010 year CMI Electrical proposes to focus on the following:
• Increasingtherevenueandmargins
• Continuationoftheintroductionofnewproductstothe market
TJM Products 2009The TJM Products Division produced a pre-tax loss of $14.3m which includes an impairment expense in non-current assets of $8.4m. Revenue decreased to $35.0m, 22.0% (or $9.8m) down on last year. The reduction in sales can in large part be attributed to significant decreases in product sales to Original Equipment Manufacturers coupled with the effects of the GEC on new car, aftermarket and export accessory sales.
In the 2010 year TJM Products proposes to focus on the following:
• increasingsalesrevenueandmargins
• thedevelopmentofinnovative,marketrelevantproducts
• themigrationtocost-effectiveoff-shoremanufacturing
• sourcingadditionalproductsfromthirdpartysuppliers
• theongoingdevelopmentofthesales&distributionnetwork.
Market Distribution
Market distribution is achieved through approximately 40 TJM branded aftermarket retail distribution stores throughout Australia, product supply to original equipment manufacturers such as Nissan and direct export to a distribution network covering most continents.
Product Design
The 2009 year has seen a concentrated effort on the design of new products and the redesign of selected existing products. These design efforts have resulted in greatly improved product aesthetics & features placing TJM in a better position to capitalise on improvements in market demand expected in the 2010 year.
Manufacturing & Product Sourcing
The TJM factory based in Brisbane, Australia was effectively closed at the end of the 2009 year due largely to the effects of the GEC. Manufacture of core product lines have been migrated to off-shore sub-contractors over recent years and the further development of these sub-contractor relationships will be integral to the future success of the business. TJM sources various independent product lines from third party suppliers to compliment the range offered by the company.
Capitalcorp Finance & Leasing 2009CMI Limited’s other operation during the year is the Capitalcorp Finance division. This division specialised in broking finance products in the automotive, equipment & business sectors with a small focus on the housing sector, insurance & warranties. During the 2009 financial year, CMI Limited successfully divested 51% of its finance division with the remaining 49% sold in the 2010 financial year.
CMI LIMITED ANNUAL REPORT 2009 5
Directors and Senior Management
Colin Ryan AM
Chairman
Colin Ryan joined the board on 28 February 2007 as the non-executive chairman and independent director. Colin is currently Chairman of the Royal Children’s Hospital Foundation, Director of Softlink International Ltd and former Chairman of the Brisbane Airport Corporation Ltd and former Deputy Chairman of Port of Brisbane.
Colin is the former Queensland managing partner of Arthur Andersen. He holds bachelor degrees in Commerce and Law, is a Fellow of the Institute of Chartered Accountants and a Fellow of the Australian Institute of Company Directors. Colin was awarded the Order of Australia in 2004 for his services to children’s health and in 2008 was appointed an Honorary Professor in the School of Medicine at University of Queensland.
Raymond Catelan
Managing Director
Ray Catelan joined the board as a director on 18 May 2007 and as Managing Director on 3 July 2007. Ray has extensive commercial and management experience both in public and private company environments including more than 12 years in the IT industry. Ray founded RP Data in 1991 and was the Managing Director. RP Data was listed on the Australian Stock Exchange in December 2006.
Danny Herceg
Non-Executive Director
Danny Herceg joined the board on 9 March 2007 as an independent director. Danny is a senior corporate and commercial lawyer with a specialisation in capital raisings, mergers and acquisitions, privatisations, restructurings and venture capital. Danny commenced practise in 1990 after completing degrees in science and law. He was a capital raisings partner of Gilbert + Tobin before establishing Herceg Lawyers in 2002. In addition to Danny’s capital raisings expertise, Danny advises on various commercial and corporate law issues, including prospectus issues, corporate governance and employee share and option plans, as well as joint ventures and non-equity funding.
Richard Catelan
Chief Operating Officer – CMI Limited General Manager – TJM Products Division
Based in Brisbane, Richard has extensive experience with implementation of corporate management systems, sales management, marketing, customer service and information technology.
Richard is the nephew of the current CMI Limited Managing Director, Ray Catelan and has worked closely with the current Managing Director between 1994 and 2004 where he held positions as New South Wales State Manager ultimately rising to General Manager of RP Data Ltd which has given him extensive experience in information technology.
Richard joined the CMI group in 2008 at TJM in the sales division and was appointed a Director of CMI Limited in June 2008.
Sharyn Williams
Chief Financial Officer/Company Secretary – CMI Limited
Sharyn joined CMI Limited in July 2007 and was appointed Company Secretary and Chief Financial Officer in April 2008. Sharyn has extensive experience in business management consulting and prior to joining CMI Limited Sharyn was employed with RP Data Ltd. Sharyn holds a Bachelor of Business from the Queensland University of Technology.
Jeff Heslington
General Manager – Electrical Components Division
Jeff Heslington joined CMI’s Hartland Cables business in 1999. Since then he has focused on strengthening the Electrical Components Division’s product range, including new design development.
Jeff, who is based in Sydney, was appointed General Manager of the Electrical Components Division in 2002. He has over 20 years experience in the electrical industry having worked for a range of companies including MM Cables where he was heavily involved in exports and government contracts.
CMI LIMITED ANNUAL REPORT 20096
CMI Limited – Head Office
150 Robinson Road Geebung QLD 4034 T: 07 3865 9969 F: 07 3865 3677 E: [email protected]
TJM Products Pty Ltd – Head Office
150 Robinson Road Geebung QLD 4034 T: 07 3865 9999 F: 07 3865 9922 Email: [email protected]
TJM Products Seven Hills (retail branch)
Unit 1/165 Prospect Hwy Seven Hills NSW 2147 T: 02 8825 7600 F: 02 8825 7699
TJM Products Penrith (retail branch)
1 Peachtree Road Penrith NSW 2750 T: 02 4731 1400 F: 02 4731 1324
TJM Products Orange (retail branch)
37 Peisley Street Orange NSW 2800 T: 02 6361 7999 F: 02 6361 2899
CMI Electrical Products – Head Office
18-20 Railway Road Meadowbank NSW 2114 T: 02 9807 6155 F: 02 9808 2033 Email: [email protected]
QLD - Brisbane
57 Yarraman Place Virginia QLD 4014 T: 07 3865 4745 F: 07 3865 7494 Email: [email protected]
QLD - Rockhampton
76 Hollingsworth Street North Rockhampton QLD 4701 T: 07 4921 0978 F: 07 4921 0981 Email: [email protected]
VIC - Melbourne
3-5 Dissik Street Cheltenham VIC 3189 T: 03 9532 1233 F: 03 9553 3502 Email: [email protected]
WA – Perth
7 Rothschild Place Midvale WA 6056 T: 08 9250 5933 F: 08 9250 5722 Email: [email protected]
CMI Locations
CMI LIMITED ANNUAL REPORT 2009 7
Corporate Governance Statement 8-10
Directors’ Report 11-17
Independence Declaration by Auditors 18
Independent Audit Report 19-20
Directors’ Declaration 21
Income Statement 22
Balance Sheet 23
Statement of Changes in Equity 24
Cash Flow Statement 25
Notes to the Financial Statements 26-80
Financial Report
CMI LIMITED ANNUAL REPORT 20098
The Board of Directors (“Board”) is responsible for the corporate governance practices of the Company. Following the release of the Principles of Good Corporate Governance and Best Practice Recommendations by the ASX Corporate Governance Council, the Board formalised a Corporate Governance Charter in 2004. The summary of the Corporate Governance Charter is available on the Company’s website (www.cmilimited.com.au). The ASX Corporate Governance Council has updated the Principles and Recommendations in 2007.
The following statement sets out the main corporate governance practices adopted by the Board and discloses any instances of non-compliance with, and reasons for not adopting, the best practice recommendations of the ASX Corporate Governance Council.
Lay Solid Foundations for Management and Oversight
The Board is responsible for, and has the authority to determine, all matters relating to the running of the Company including the policies, practices, management, operations and objectives of the Company. It is the role of management to manage the Company in accordance with the directions of the Board. The functions reserved to the Board, and those delegated to management, are disclosed in the Corporate Governance Charter.
Each year the Board, with the assistance of the Managing Director, and the Remuneration Committee, undertakes a review of the performance of senior executives. The measures generally relate to the performance of CMI Limited, the performance of the executive’s divisions, and the performance of the executive individually. Further details of the assessment criteria for senior executive remuneration (including equity-based share plans) are disclosed in the Remuneration Report.
Structure the Board to Add Value
As at the date of this statement, the Board comprises four directors - two executive and two non-executives. Details of the directors, including their skills, expertise, length of service and independence, are set out in the Directors’ Report.
An independent director is one who is free from any interest and any business or other relationship which could, or could reasonably be perceived to materially interfere with the director’s ability to act with a view to the best interests of the company. The board does not consider that independence can be assessed with reference to an arbitrary and set period of time.
In accordance with the definition of independence above, the following directors of CMI Limited are considered to be independent:
Name Position
Colin Ryan, AM Chairman, Non-executive director Danny Herceg Non-executive director
The Board acknowledges the ASX Corporate Governance Council recommendation that the board should consist of a majority of independent directors, however, the Board is of a view that the specialised knowledge of the operations and industry possessed by the current directors outweighs the potential loss of existing expertise through a change to the board structure.
Additionally, the cost of an additional independent director to provide the majority is not seen by the current Board as warranted.
The Company complies with the ASX Corporate Governance Council recommendation of having different people in the roles of Chairman and Managing Director. The Chairman is also an independent director.
With the prior approval of the Board, each director has the right to seek independent legal and other professional advice at the Company’s expense concerning any aspect of the Company’s operations or undertakings in order to fulfil his duties and responsibilities.
The Board established an Audit Committee in 1994 and a Remuneration Committee in 1998. Each has had a formal charter since that time. A summary of the charters is available on the Company’s website.
The Board performs the duties of the Nomination Committee. There is no established formal Nomination Committee. Due to the small number of directors it is unlikely that the company would obtain additional benefits from a formal committee structure.
The Group has an informal process to educate new Directors about the nature of the business, current issues, the Group strategy and the expectations of the performance of Directors. Executive management presents to the Board on a regular basis to enable the Directors to gain a better understanding of the business operations. The performance of all other Directors and of Committees is reviewed and assessed each year by the Chairman. The performance of the Chairman is reviewed and assessed each year by the other Directors.
Promote Ethical and Responsible Decision Making
It is part of the philosophy of the Company that it will at all times comply with the law and behave ethically.
The Company has a Code of Ethics to guide directors, the Managing Director, and other executives as to the practices necessary to maintain confidence in the Company’s integrity, and the responsibility and accountability of individuals for reporting and investigating reports of unethical practices.
The directors and employees must be aware of, and comply with the provisions of, the Corporations Act 2001 in relation to insider trading. The Company has Security Transaction Rules that set out the policy of the Company on dealing in shares and securities by directors and employees. These are formally acknowledged by all directors and relevant employees of the Company.
The Code of Ethics and the Security Transaction Rules form part of the Corporate Governance Charter available on the Company’s website.
Corporate Governance Statement
CMI LIMITED ANNUAL REPORT 2009 9
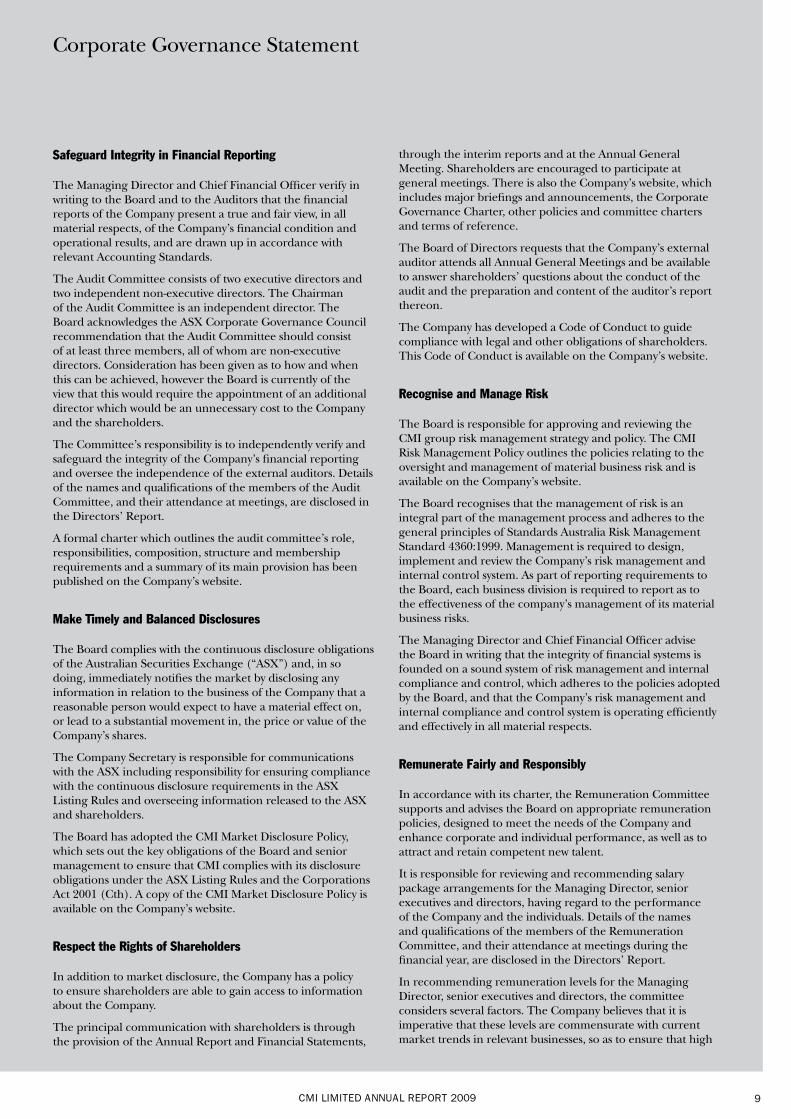
Safeguard Integrity in Financial Reporting
The Managing Director and Chief Financial Officer verify in writing to the Board and to the Auditors that the financial reports of the Company present a true and fair view, in all material respects, of the Company’s financial condition and operational results, and are drawn up in accordance with relevant Accounting Standards.
The Audit Committee consists of two executive directors and two independent non-executive directors. The Chairman of the Audit Committee is an independent director. The Board acknowledges the ASX Corporate Governance Council recommendation that the Audit Committee should consist of at least three members, all of whom are non-executive directors. Consideration has been given as to how and when this can be achieved, however the Board is currently of the view that this would require the appointment of an additional director which would be an unnecessary cost to the Company and the shareholders.
The Committee’s responsibility is to independently verify and safeguard the integrity of the Company’s financial reporting and oversee the independence of the external auditors. Details of the names and qualifications of the members of the Audit Committee, and their attendance at meetings, are disclosed in the Directors’ Report.
A formal charter which outlines the audit committee’s role, responsibilities, composition, structure and membership requirements and a summary of its main provision has been published on the Company’s website.
Make Timely and Balanced Disclosures
The Board complies with the continuous disclosure obligations of the Australian Securities Exchange (“ASX”) and, in so doing, immediately notifies the market by disclosing any information in relation to the business of the Company that a reasonable person would expect to have a material effect on, or lead to a substantial movement in, the price or value of the Company’s shares.
The Company Secretary is responsible for communications with the ASX including responsibility for ensuring compliance with the continuous disclosure requirements in the ASX Listing Rules and overseeing information released to the ASX and shareholders.
The Board has adopted the CMI Market Disclosure Policy, which sets out the key obligations of the Board and senior management to ensure that CMI complies with its disclosure obligations under the ASX Listing Rules and the Corporations Act 2001 (Cth). A copy of the CMI Market Disclosure Policy is available on the Company’s website.
Respect the Rights of Shareholders
In addition to market disclosure, the Company has a policy to ensure shareholders are able to gain access to information about the Company.
The principal communication with shareholders is through the provision of the Annual Report and Financial Statements,
through the interim reports and at the Annual General Meeting. Shareholders are encouraged to participate at general meetings. There is also the Company’s website, which includes major briefings and announcements, the Corporate Governance Charter, other policies and committee charters and terms of reference.
The Board of Directors requests that the Company’s external auditor attends all Annual General Meetings and be available to answer shareholders’ questions about the conduct of the audit and the preparation and content of the auditor’s report thereon.
The Company has developed a Code of Conduct to guide compliance with legal and other obligations of shareholders. This Code of Conduct is available on the Company’s website.
Recognise and Manage Risk
The Board is responsible for approving and reviewing the CMI group risk management strategy and policy. The CMI Risk Management Policy outlines the policies relating to the oversight and management of material business risk and is available on the Company’s website.
The Board recognises that the management of risk is an integral part of the management process and adheres to the general principles of Standards Australia Risk Management Standard 4360:1999. Management is required to design, implement and review the Company’s risk management and internal control system. As part of reporting requirements to the Board, each business division is required to report as to the effectiveness of the company’s management of its material business risks.
The Managing Director and Chief Financial Officer advise the Board in writing that the integrity of financial systems is founded on a sound system of risk management and internal compliance and control, which adheres to the policies adopted by the Board, and that the Company’s risk management and internal compliance and control system is operating efficiently and effectively in all material respects.
Remunerate Fairly and Responsibly
In accordance with its charter, the Remuneration Committee supports and advises the Board on appropriate remuneration policies, designed to meet the needs of the Company and enhance corporate and individual performance, as well as to attract and retain competent new talent.
It is responsible for reviewing and recommending salary package arrangements for the Managing Director, senior executives and directors, having regard to the performance of the Company and the individuals. Details of the names and qualifications of the members of the Remuneration Committee, and their attendance at meetings during the financial year, are disclosed in the Directors’ Report.
In recommending remuneration levels for the Managing Director, senior executives and directors, the committee considers several factors. The Company believes that it is imperative that these levels are commensurate with current market trends in relevant businesses, so as to ensure that high
Corporate Governance Statement
CMI LIMITED ANNUAL REPORT 200910
calibre employees and directors are attracted to and retained by the Company.
Remuneration packages usually include bonus and option elements, thus providing maximum benefits to both the Company and its shareholders. Details of directors’ and senior executives’ remuneration are disclosed in the Directors’ Report.
In accordance with the Company’s Constitution, the total remuneration payable to non-executive directors is not to exceed $390,000 per annum as approved by the shareholders at a general meeting.
The policy on bonuses for the Managing Director and senior executives takes into account both quantitative and qualitative measures and, while profit performance is a key factor, revenue, market share, production hours, customer satisfaction and achievement of strategic objectives are considered, as well as the individual’s performance. Payment is always at the discretion of the Board, which takes into account the Company’s overall financial and strategic performance.
The Company operates the CMI Employee Incentive Scheme, approved by the shareholders in accordance with the requirements of the ASX. This policy is available on the Company’s website and sets out all restrictions and benefits applicable to the issue of equity securities to employees. There are restrictions on the exercise of options so that no more than 20% of awarded options to an employee can be exercised for each year of employment, up to five years, when the restrictions no longer apply. Options which issue are ‘vested’. Hence, there is no Company policy associated with employee transactions in unvested options. The intention of the Scheme is to assist in the attraction and retention of employees and executives. The Board will determine in its absolute discretion the eligibility and the number of options to be offered, having regard to length of service, contribution, and potential contribution to the Company. Further detail is contained in the Directors’ Report and the Financial Statements.
The Managing Director is a key member of the Board and the key employee of the Company. An Operating Report is provided monthly to each of the directors. The report keeps them informed of the Company’s activities and performance.
The Remuneration Committee undertakes a detailed evaluation of the Managing Director’s performance on an annual basis. This evaluation utilises both quantitative and qualitative measures, and is judged against approved plans.
In addition, the Remuneration Committee, in conjunction with the Managing Director, reviews in a similar manner the performance of the senior executives of the Company who report directly to the Managing Director.
The results of these evaluations are tabled to the Board as part of the Remuneration Committee’s report. At this meeting, the Board and Managing Director discuss and agree goals (both quantitative and qualitative) for the coming year.
Corporate Governance Statement
CMI LIMITED ANNUAL REPORT 2009 11
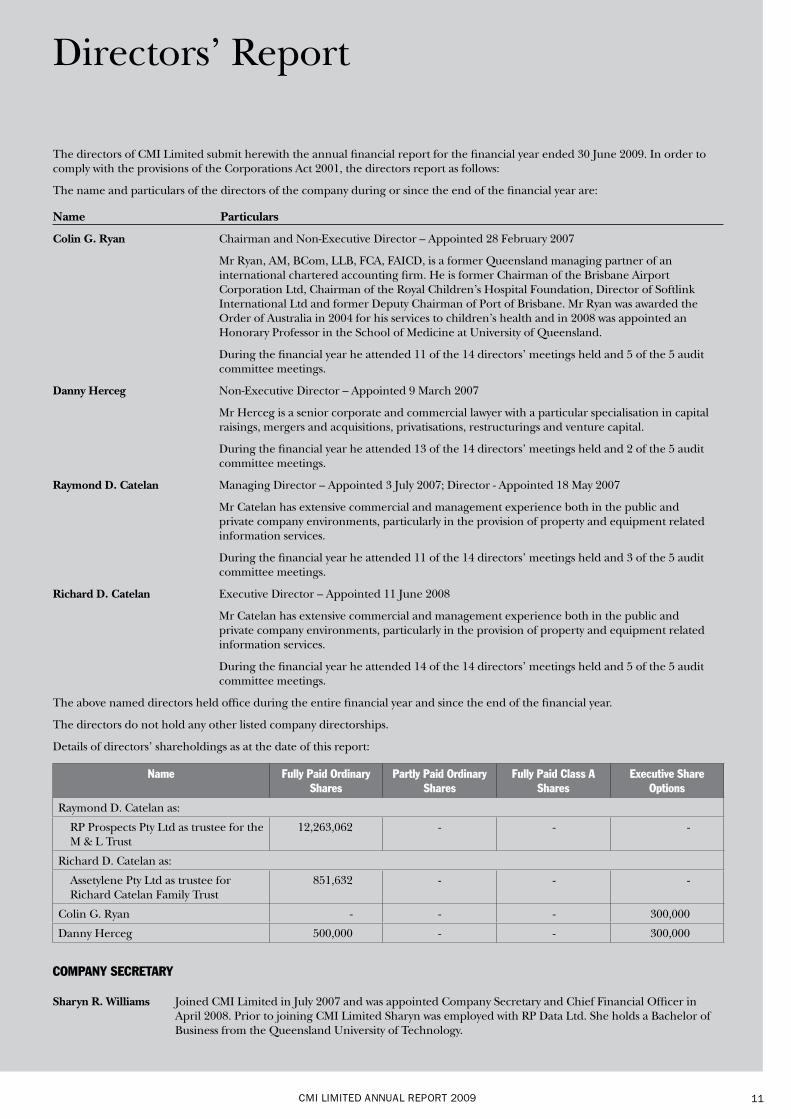
The directors of CMI Limited submit herewith the annual financial report for the financial year ended 30 June 2009. In order to comply with the provisions of the Corporations Act 2001, the directors report as follows:
The name and particulars of the directors of the company during or since the end of the financial year are:
Name Particulars
Colin G. Ryan Chairman and Non-Executive Director – Appointed 28 February 2007
Mr Ryan, AM, BCom, LLB, FCA, FAICD, is a former Queensland managing partner of an international chartered accounting firm. He is former Chairman of the Brisbane Airport Corporation Ltd, Chairman of the Royal Children’s Hospital Foundation, Director of Softlink International Ltd and former Deputy Chairman of Port of Brisbane. Mr Ryan was awarded the Order of Australia in 2004 for his services to children’s health and in 2008 was appointed an Honorary Professor in the School of Medicine at University of Queensland.
During the financial year he attended 11 of the 14 directors’ meetings held and 5 of the 5 audit committee meetings.
Danny Herceg Non-Executive Director – Appointed 9 March 2007
Mr Herceg is a senior corporate and commercial lawyer with a particular specialisation in capital raisings, mergers and acquisitions, privatisations, restructurings and venture capital.
During the financial year he attended 13 of the 14 directors’ meetings held and 2 of the 5 audit committee meetings.
Raymond D. Catelan Managing Director – Appointed 3 July 2007; Director - Appointed 18 May 2007
Mr Catelan has extensive commercial and management experience both in the public and private company environments, particularly in the provision of property and equipment related information services.
During the financial year he attended 11 of the 14 directors’ meetings held and 3 of the 5 audit committee meetings.
Richard D. Catelan Executive Director – Appointed 11 June 2008
Mr Catelan has extensive commercial and management experience both in the public and private company environments, particularly in the provision of property and equipment related information services.
During the financial year he attended 14 of the 14 directors’ meetings held and 5 of the 5 audit committee meetings.
The above named directors held office during the entire financial year and since the end of the financial year.
The directors do not hold any other listed company directorships.
Details of directors’ shareholdings as at the date of this report:
Name Fully Paid Ordinary Shares
Partly Paid Ordinary Shares
Fully Paid Class A Shares
Executive Share Options
Raymond D. Catelan as:
RP Prospects Pty Ltd as trustee for the M & L Trust
12,263,062 - - -
Richard D. Catelan as:
Assetylene Pty Ltd as trustee for Richard Catelan Family Trust
851,632 - - -
Colin G. Ryan - - - 300,000
Danny Herceg 500,000 - - 300,000
COMPANY SECRETARY
Sharyn R. Williams Joined CMI Limited in July 2007 and was appointed Company Secretary and Chief Financial Officer in April 2008. Prior to joining CMI Limited Sharyn was employed with RP Data Ltd. She holds a Bachelor of Business from the Queensland University of Technology.
Directors’ Report
CMI LIMITED ANNUAL REPORT 200912
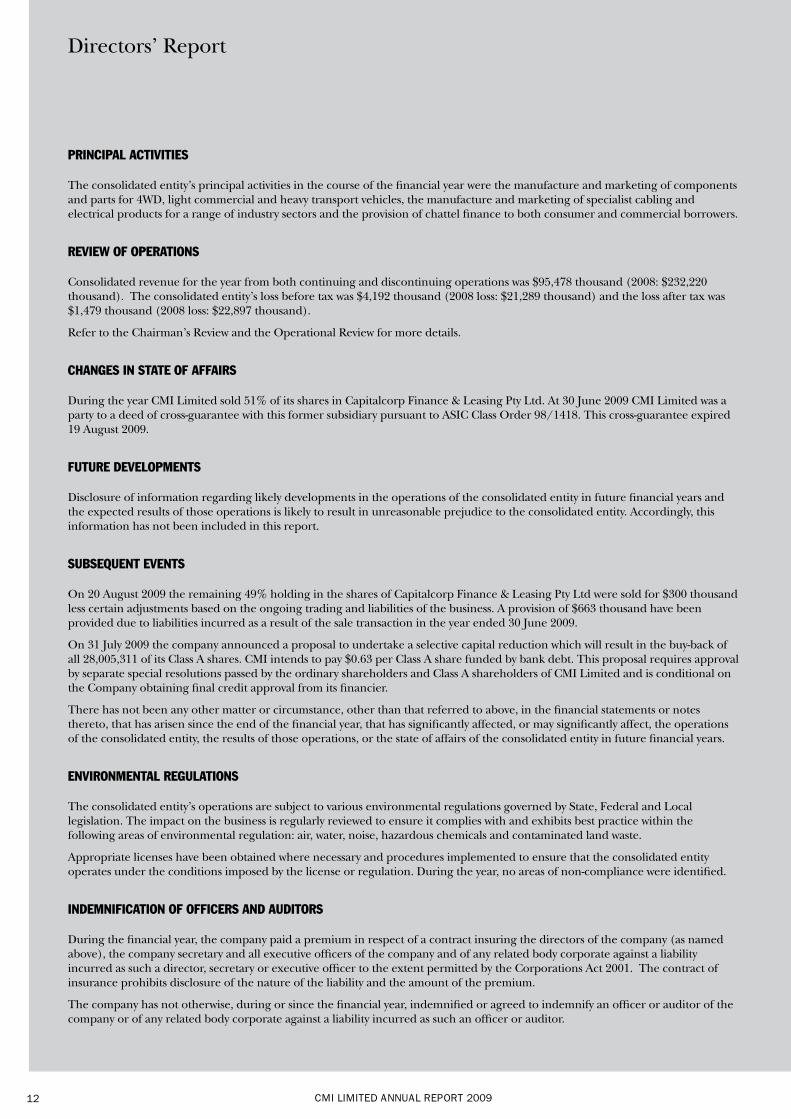
PRINCIPAL ACTIVITIES
The consolidated entity’s principal activities in the course of the financial year were the manufacture and marketing of components and parts for 4WD, light commercial and heavy transport vehicles, the manufacture and marketing of specialist cabling and electrical products for a range of industry sectors and the provision of chattel finance to both consumer and commercial borrowers.
REVIEW OF OPERATIONS
Consolidated revenue for the year from both continuing and discontinuing operations was $95,478 thousand (2008: $232,220 thousand). The consolidated entity’s loss before tax was $4,192 thousand (2008 loss: $21,289 thousand) and the loss after tax was $1,479 thousand (2008 loss: $22,897 thousand).
Refer to the Chairman’s Review and the Operational Review for more details.
CHANGES IN STATE OF AFFAIRS
During the year CMI Limited sold 51% of its shares in Capitalcorp Finance & Leasing Pty Ltd. At 30 June 2009 CMI Limited was a party to a deed of cross-guarantee with this former subsidiary pursuant to ASIC Class Order 98/1418. This cross-guarantee expired 19 August 2009.
FUTURE DEVELOPMENTS
Disclosure of information regarding likely developments in the operations of the consolidated entity in future financial years and the expected results of those operations is likely to result in unreasonable prejudice to the consolidated entity. Accordingly, this information has not been included in this report.
SUBSEQUENT EVENTS
On 20 August 2009 the remaining 49% holding in the shares of Capitalcorp Finance & Leasing Pty Ltd were sold for $300 thousand less certain adjustments based on the ongoing trading and liabilities of the business. A provision of $663 thousand have been provided due to liabilities incurred as a result of the sale transaction in the year ended 30 June 2009.
On 31 July 2009 the company announced a proposal to undertake a selective capital reduction which will result in the buy-back of all 28,005,311 of its Class A shares. CMI intends to pay $0.63 per Class A share funded by bank debt. This proposal requires approval by separate special resolutions passed by the ordinary shareholders and Class A shareholders of CMI Limited and is conditional on the Company obtaining final credit approval from its financier.
There has not been any other matter or circumstance, other than that referred to above, in the financial statements or notes thereto, that has arisen since the end of the financial year, that has significantly affected, or may significantly affect, the operations of the consolidated entity, the results of those operations, or the state of affairs of the consolidated entity in future financial years.
ENVIRONMENTAL REGULATIONS
The consolidated entity’s operations are subject to various environmental regulations governed by State, Federal and Local legislation. The impact on the business is regularly reviewed to ensure it complies with and exhibits best practice within the following areas of environmental regulation: air, water, noise, hazardous chemicals and contaminated land waste.
Appropriate licenses have been obtained where necessary and procedures implemented to ensure that the consolidated entity operates under the conditions imposed by the license or regulation. During the year, no areas of non-compliance were identified.
INDEMNIFICATION OF OFFICERS AND AUDITORS
During the financial year, the company paid a premium in respect of a contract insuring the directors of the company (as named above), the company secretary and all executive officers of the company and of any related body corporate against a liability incurred as such a director, secretary or executive officer to the extent permitted by the Corporations Act 2001. The contract of insurance prohibits disclosure of the nature of the liability and the amount of the premium.
The company has not otherwise, during or since the financial year, indemnified or agreed to indemnify an officer or auditor of the company or of any related body corporate against a liability incurred as such an officer or auditor.
Directors’ Report
CMI LIMITED ANNUAL REPORT 2009 13
REMUNERATION REPORT
The remuneration report is set out under the following main headings:
A Principles used to determine the nature and amount of remuneration
B Service agreements
C Details of remuneration
D Share-based compensation
E Performance history
F Dividends
G Share Price
A Principles Used to Determine the Nature and Amount of Remuneration
The remuneration committee reviews the remuneration packages of all directors and executives on an annual basis and makes recommendations to the board. Remuneration packages are reviewed and determined with due regard to current market rates and are benchmarked against comparable industry salaries, adjusted by a performance factor to reflect changes in the performance of the company.
The objective of the company’s remuneration reward framework is to ensure reward for performance is competitive and appropriate for the results delivered. The framework aligns reward with achievement of strategic and financial objectives and the creation of wealth for shareholders.
In order to retain and attract executives of sufficient calibre to facilitate the efficient and effective management of the company’s operations, the remuneration committee seeks the advice of external advisers in connection with the structure of remuneration packages.
The overall level of executive reward takes into account the performance of the consolidated entity over a number of years. Over the past five years, the consolidated entity’s profit from ordinary activities after income tax (but prior to the impairment loss) has reduced by 35.6%, and total equity has reduced by 36.8%. During the same period, directors and executives remuneration (included in part C below) have reduced by 42.8%. Refer to the review of Operations in the Directors’ Report for more details.
In accordance with the company’s constitution, the total remuneration payable to non-executive directors is not to exceed $390,000 per annum as approved by the shareholders at a general meeting.
Remuneration packages contain the following key elements:
a) Short-term employee benefits - salary/fees, bonuses and non monetary benefits including the provision of motor vehicles, accommodation and interest not charged on loans provided by the company;
b) Post-employment benefits - including superannuation and prescribed benefits; and
c) Share-based payment – shares issued during the financial year and share options granted under the director and employee share option plans approved by shareholders on 23 August 1999, and
d) Long-term benefits – including long service leave and retirement benefits.
Short-term employee benefits – directors and key management personnel listed in part C below are offered a competitive remuneration that comprises the components of base pay and benefits. Base pay for executives is reviewed annually to ensure the executive’s pay is competitive with the market. An executive’s pay is also reviewed on promotion. Specific key management personnel are paid cash bonuses based on performance criteria set at the beginning of the financial year. The performance criteria used to determine the amount of compensation consist of a number of key performance indicators covering both financial and non-financial measures of performance. Typically included measures include revenue, net profit before tax, inventory targets, quality assurance and leadership. These measures were chosen as they represent the key drivers for the short term success of the business and provide a framework for delivering long term value.
In the 2009 financial year, Jeff Heslington, Richard Catelan, Neil Saxon and Sharyn Williams received performance-related bonuses totalling $102 thousand calculated on achieving budgeted financial targets in the 2009 financial year.
In the 2008 financial year, Jeff Heslington (General Manager – Electrical Components Division) received a performance-related bonus of $150 thousand calculated on the electrical division achieving budgeted financial targets in the 2007 financial year. The cash bonus relating to the 2008 financial year was nil as the budgeted financial targets in the 2008 year were not achieved.
Other benefits – executives receive benefits including long service leave and superannuation as required by the laws in the various jurisdictions in which the company operates. In certain circumstances, additional benefits (e.g. travel, car parking and accommodation) may also be provided.
Equity - further details of the employee incentive scheme are disclosed in note 23 to the financial statements.
Directors’ Report
CMI LIMITED ANNUAL REPORT 200914
B Service Agreements
Directors and executives are employed through contracts for service which contain the following key conditions:
• Reviewedannuallyonorabout1September;
• Requireaonetosixmonthnoticeperiod;and
• Ifemploymentisterminatedbythecompanybeforethetermofthecontractexpires,thespecifieddirectororexecutiveisentitled to a termination payment based on the remaining contract period.
C Details of Remuneration
The directors of the company and the consolidated entity are detailed below as are the seven key management personnel who received the highest remuneration for the year ended 30 June 2009:
Directors
C. G. Ryan (appointed 28 February 2007)
D. Herceg (appointed 9 March 2007)
Raymond D. Catelan (appointed 18 May 2007)
Richard D. Catelan (appointed 11 June 2008)
The key management personnel of the Group during the year were:
Raymond D. Catelan (Managing Director)
Richard D. Catelan (General Manager – TJM Products Division), appointed 14 November 2008
J.L. Heslington (General Manager – Electrical Components Division)
S.R. Williams (Chief Financial Officer/Company Secretary)
J. Bradford (General Manager – Finance Division), transferred with business sale 30 November 2008
N. Saxon (General Manager – TJM Products Division), resigned 14 November 2008
I.C. Whittle (Managing Director – Capitalcorp Finance & Leasing Pty Ltd), resigned 4 August 2008
The key management personnel of the group during the prior year were:
Raymond D. Catelan (Managing Director), appointed 3 July 2007
Richard D. Catelan (Chief Operating Officer), appointed 23 January 2008
J.L. Heslington (General Manager – Electrical Components Division)
N. Saxon (General Manager – TJM Products Division)
J. Bradford (General Manager – Finance Division)
S.R. Williams (Chief Financial Officer/Company Secretary)
I.C. Whittle (Managing Director – Capitalcorp Finance & Leasing Pty Ltd)
D.J. Gallagher (Manufacturing Manager – Engineering Division), transferred with business sale 16 April 2008
M.D. Laidlaw (Chief Financial Officer/Company Secretary), transferred with business sale 16 April 2008
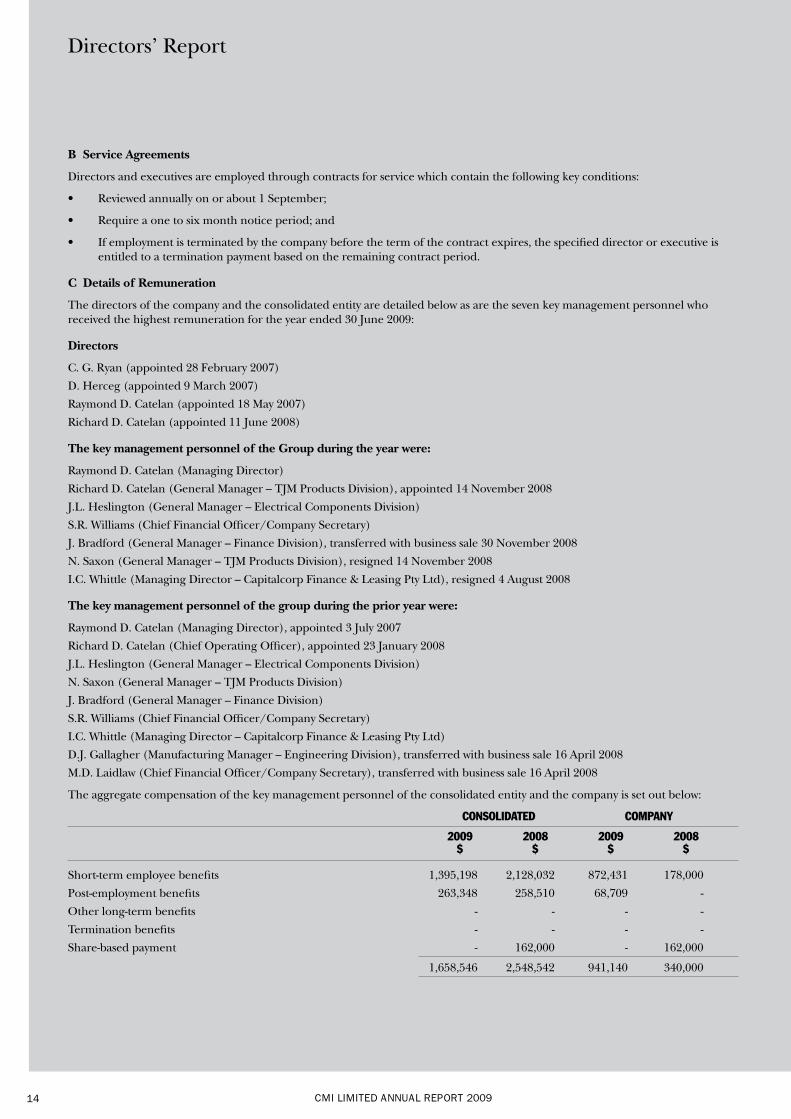
The aggregate compensation of the key management personnel of the consolidated entity and the company is set out below:
CONSOLIDATED COMPANY
2009 2008 2009 2008 $ $ $ $
Short-term employee benefits 1,395,198 2,128,032 872,431 178,000
Post-employment benefits 263,348 258,510 68,709 -
Other long-term benefits - - - -
Termination benefits - - - -
Share-based payment - 162,000 - 162,000
1,658,546 2,548,542 941,140 340,000
Directors’ Report
CMI LIMITED ANNUAL REPORT 2009 15
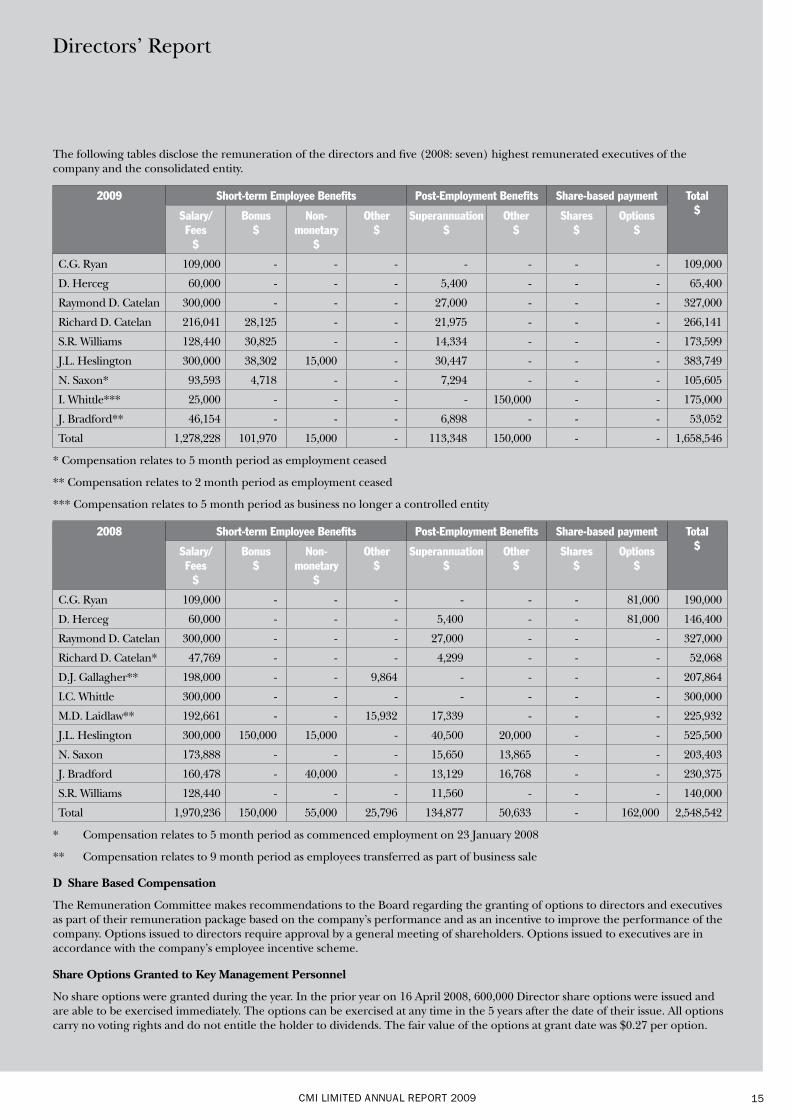
The following tables disclose the remuneration of the directors and five (2008: seven) highest remunerated executives of the company and the consolidated entity.
2009 Short-term Employee Benefits Post-Employment Benefits Share-based payment Total $Salary/
Fees $
Bonus $
Non-monetary
$
Other $
Superannuation $
Other $
Shares $
Options $
C.G. Ryan 109,000 - - - - - - - 109,000
D. Herceg 60,000 - - - 5,400 - - - 65,400
Raymond D. Catelan 300,000 - - - 27,000 - - - 327,000
Richard D. Catelan 216,041 28,125 - - 21,975 - - - 266,141
S.R. Williams 128,440 30,825 - - 14,334 - - - 173,599
J.L. Heslington 300,000 38,302 15,000 - 30,447 - - - 383,749
N. Saxon* 93,593 4,718 - - 7,294 - - - 105,605
I. Whittle*** 25,000 - - - - 150,000 - - 175,000
J. Bradford** 46,154 - - - 6,898 - - - 53,052
Total 1,278,228 101,970 15,000 - 113,348 150,000 - - 1,658,546
* Compensation relates to 5 month period as employment ceased
** Compensation relates to 2 month period as employment ceased
*** Compensation relates to 5 month period as business no longer a controlled entity
2008 Short-term Employee Benefits Post-Employment Benefits Share-based payment Total $Salary/
Fees $
Bonus $
Non-monetary
$
Other $
Superannuation $
Other $
Shares $
Options $
C.G. Ryan 109,000 - - - - - - 81,000 190,000
D. Herceg 60,000 - - - 5,400 - - 81,000 146,400
Raymond D. Catelan 300,000 - - - 27,000 - - - 327,000
Richard D. Catelan* 47,769 - - - 4,299 - - - 52,068
D.J. Gallagher** 198,000 - - 9,864 - - - - 207,864
I.C. Whittle 300,000 - - - - - - - 300,000
M.D. Laidlaw** 192,661 - - 15,932 17,339 - - - 225,932
J.L. Heslington 300,000 150,000 15,000 - 40,500 20,000 - - 525,500
N. Saxon 173,888 - - - 15,650 13,865 - - 203,403
J. Bradford 160,478 - 40,000 - 13,129 16,768 - - 230,375
S.R. Williams 128,440 - - - 11,560 - - - 140,000
Total 1,970,236 150,000 55,000 25,796 134,877 50,633 - 162,000 2,548,542
* Compensation relates to 5 month period as commenced employment on 23 January 2008
** Compensation relates to 9 month period as employees transferred as part of business sale
D Share Based Compensation
The Remuneration Committee makes recommendations to the Board regarding the granting of options to directors and executives as part of their remuneration package based on the company’s performance and as an incentive to improve the performance of the company. Options issued to directors require approval by a general meeting of shareholders. Options issued to executives are in accordance with the company’s employee incentive scheme.
Share Options Granted to Key Management Personnel
No share options were granted during the year. In the prior year on 16 April 2008, 600,000 Director share options were issued and are able to be exercised immediately. The options can be exercised at any time in the 5 years after the date of their issue. All options carry no voting rights and do not entitle the holder to dividends. The fair value of the options at grant date was $0.27 per option.
Directors’ Report
CMI LIMITED ANNUAL REPORT 200916
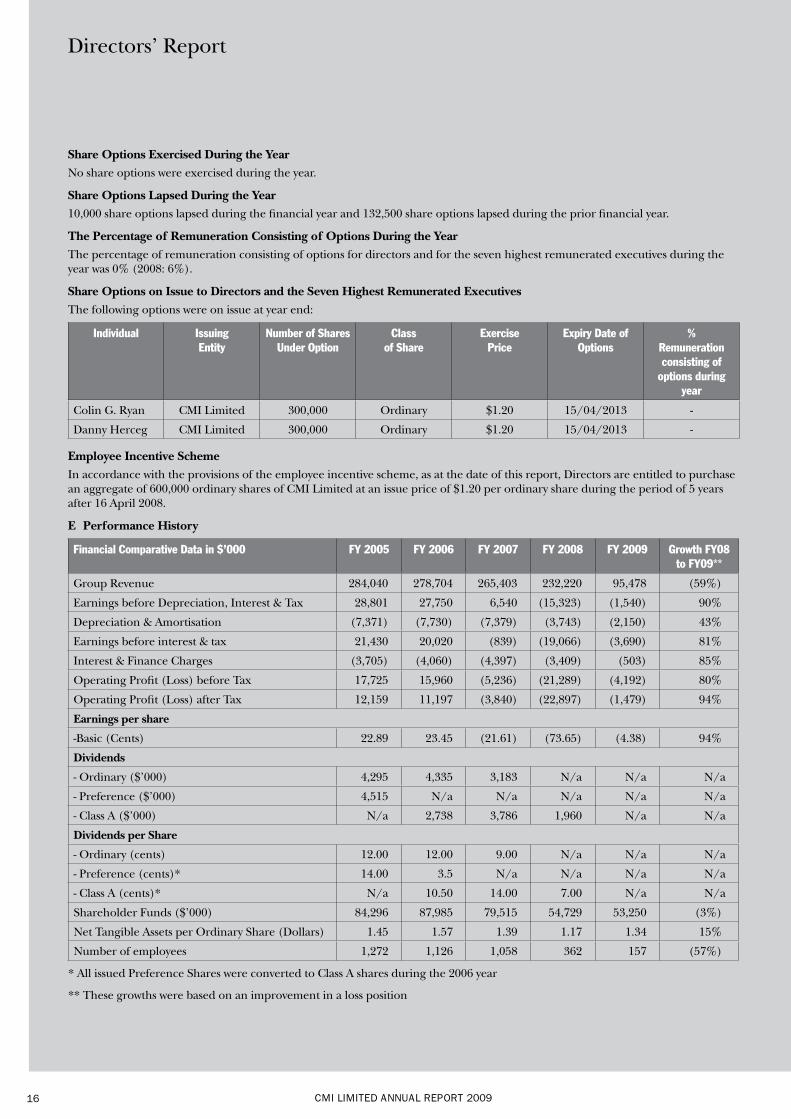
Share Options Exercised During the YearNo share options were exercised during the year.
Share Options Lapsed During the Year10,000 share options lapsed during the financial year and 132,500 share options lapsed during the prior financial year.
The Percentage of Remuneration Consisting of Options During the YearThe percentage of remuneration consisting of options for directors and for the seven highest remunerated executives during the year was 0% (2008: 6%).
Share Options on Issue to Directors and the Seven Highest Remunerated ExecutivesThe following options were on issue at year end:
Individual Issuing Entity
Number of Shares Under Option
Class of Share
Exercise Price
Expiry Date of Options
% Remuneration consisting of
options during year
Colin G. Ryan CMI Limited 300,000 Ordinary $1.20 15/04/2013 -
Danny Herceg CMI Limited 300,000 Ordinary $1.20 15/04/2013 -
Employee Incentive SchemeIn accordance with the provisions of the employee incentive scheme, as at the date of this report, Directors are entitled to purchase an aggregate of 600,000 ordinary shares of CMI Limited at an issue price of $1.20 per ordinary share during the period of 5 years after 16 April 2008.
E Performance History
Financial Comparative Data in $’000 FY 2005 FY 2006 FY 2007 FY 2008 FY 2009 Growth FY08 to FY09**
Group Revenue 284,040 278,704 265,403 232,220 95,478 (59%)
Earnings before Depreciation, Interest & Tax 28,801 27,750 6,540 (15,323) (1,540) 90%
Depreciation & Amortisation (7,371) (7,730) (7,379) (3,743) (2,150) 43%
Earnings before interest & tax 21,430 20,020 (839) (19,066) (3,690) 81%
Interest & Finance Charges (3,705) (4,060) (4,397) (3,409) (503) 85%
Operating Profit (Loss) before Tax 17,725 15,960 (5,236) (21,289) (4,192) 80%
Operating Profit (Loss) after Tax 12,159 11,197 (3,840) (22,897) (1,479) 94%
Earnings per share
-Basic (Cents) 22.89 23.45 (21.61) (73.65) (4.38) 94%
Dividends
- Ordinary ($’000) 4,295 4,335 3,183 N/a N/a N/a
- Preference ($’000) 4,515 N/a N/a N/a N/a N/a
- Class A ($’000) N/a 2,738 3,786 1,960 N/a N/a
Dividends per Share
- Ordinary (cents) 12.00 12.00 9.00 N/a N/a N/a
- Preference (cents)* 14.00 3.5 N/a N/a N/a N/a
- Class A (cents)* N/a 10.50 14.00 7.00 N/a N/a
Shareholder Funds ($’000) 84,296 87,985 79,515 54,729 53,250 (3%)
Net Tangible Assets per Ordinary Share (Dollars) 1.45 1.57 1.39 1.17 1.34 15%
Number of employees 1,272 1,126 1,058 362 157 (57%)
* All issued Preference Shares were converted to Class A shares during the 2006 year
** These growths were based on an improvement in a loss position
Directors’ Report
CMI LIMITED ANNUAL REPORT 2009 17
Directors’ Report
F Dividends
All dividends stated below are whole numbers and are not rounded to the nearest thousand dollars.
In respect of the financial year ended 30 June 2009, the directors do not recommend the payment of a final dividend to the holders of fully paid Class A shares.
In respect of the financial year ended 30 June 2009, the directors do not recommend the payment of a final dividend to the holders of fully paid ordinary shares.
In respect of the financial year ended 30 June 2007, as detailed in the directors’ report for that financial year, a final dividend of $980,188 (3.5 cents per share) franked to 100% at 30% corporate income tax rate was paid to the holders of fully paid Class A shares on 3 September 2007.
In respect of the financial year ended 30 June 2008, an interim dividend of $980,188 (3.5 cents per share) franked to 100% at 30% corporate income tax rate was paid to the holders of fully paid Class A shares on 3 December 2007.
In respect of the financial year ended 30 June 2008 the directors did not declare a final dividend to the holders of fully paid Class A or Ordinary shares.
G Share Price
The closing market share price at the end of the previous financial year was $0.825 per ordinary share and at market close on 30 June 2009 was $0.33. The closing market share price at the end of the previous financial year was $0.60 per Class A share and at market close on 30 June 2009 was $0.32.
NON-AUDIT SERVICES
The directors are satisfied that the provision of non-audit services, during the year, by the auditor (or by another person or firm on the auditor’s behalf) is compatible with the general standard of independence for auditors imposed by the Corporations Act 2001. Details of amounts paid or payable for non-audit services provided during the year by the auditor are outlined in note 25 to the financial statements.
INDEPENDENCE DECLARATION BY AUDITORS
The auditor’s independence declaration is included on page 18.
ROUNDING OFF OF AMOUNTS
The company is a company of the kind referred to in ASIC Class Order 98/0100, dated 10 July 1998, and in accordance with that Class Order amounts in the directors’ report and the financial report have been rounded off to the nearest thousand dollars, unless otherwise stated.
Signed in accordance with a resolution of the directors made pursuant to section 298(2) of the Corporations Act 2001.
On behalf of the Directors
C.G. Ryan Chairman
R.D. Catelan Director
BRISBANE
Dated: 23 September 2009
CMI LIMITED ANNUAL REPORT 200918
xx September 2009
The Board of Directors CMI Limited Level 4 240 Margaret Street Brisbane QLD 4000
Dear Board Members
CMI Limited
In accordance with section 307C of the Corporations Act 2001, I am pleased to provide the following declaration of independence to the directors of CMI Limited.
As lead audit partner for the audit of the financial statements of CMI Limited for the financial year 30 June 2009, I declare that to the best of my knowledge and belief, there have been no contraventions of:
(i) the auditor independence requirements of the Corporations Act 2001 in relation to the audit; and
(ii) any applicable code of professional conduct in relation to the audit.
Yours sincerely
DELOITTE TOUCHE TOHMATSU
Carl Harris Partner Chartered Accountants 123 Eagle Street BRISBANE
Liability limited by a scheme approved under Professional Standards Legislation.
Independence Declaration By Auditors
Liability limited by a scheme approved under Professional Standards Legislation.
18
Deloitte Touche Tohmatsu
A.B.N. 74 490 121 060 Riverside Centre Level 25 123 Eagle Street Brisbane QLD 4000 GPO Box 1463 Brisbane QLD 4001 Australia Tel: +61 (0) 7 3308 7000 Fax: +61 (0) 7 3308 7001 www.deloitte.com.au
23 September 2009
Dear Board Members
CMI Limited
In accordance with section 307C of the Corporations Act 2001, I am pleased to provide the
following declaration of independence to the directors of CMI Limited.
As lead audit partner for the audit of the financial statements of CMI Limited for the financial
year ended 30 June 2009, I declare that to the best of my knowledge and belief, there have been
no contraventions of:
(i) the auditor independence requirements of the Corporations Act 2001 in relation to
the audit; and
(ii) any applicable code of professional conduct in relation to the audit.
Yours sincerely
DELOITTE TOUCHE TOHMATSU
Carl Harris
Partner
Chartered Accountants
The Board of Directors
CMI Limited
150 Robinson Road
Geebung QLD 4034
CMI LIMITED ANNUAL REPORT 2009 19
We have audited the accompanying financial report of CMI Limited (the company), which comprises the balance sheet as at 30 June 2009, and the income statement, cash flow statement and statement of changes in equity for the year ended on that date, a summary of significant accounting policies, other explanatory notes and the directors’ declaration of the consolidated entity comprising the company and the entities it controlled at the year’s end or from time to time during the financial year as set out on pages 21 to 80.
Directors’ Responsibility for the Financial Report
The directors of the company are responsible for the preparation and fair presentation of the financial report in accordance with Australian Accounting Standards (including the Australian Accounting Interpretations) and the Corporations Act 2001. This responsibility includes establishing and maintaining internal control relevant to the preparation and fair presentation of the financial report that is free from material misstatement, whether due to fraud or error; selecting and applying appropriate accounting policies; and making accounting estimates that are reasonable in the circumstances.
In Note 1 the directors also state, in accordance with Accounting Standard AASB 101 Presentation of Financial Statements, that compliance with the Australian equivalents to International Financial Reporting Standards ensures that the consolidated financial statements and notes, comply with International Financial Reporting Standards.
Auditor’s Responsibility
Our responsibility is to express an opinion on the financial report based on our audit. We conducted our audit in accordance with Australian Auditing Standards. These Auditing Standards require that we comply with relevant ethical requirements relating to audit engagements and plan and perform the audit to obtain reasonable assurance whether the financial report is free of material misstatement.
An audit involves performing procedures to obtain audit evidence about the amounts and disclosures in the financial report. The procedures selected depend on auditor’s judgement, including the assessment of the risks of material misstatement of the financial report, whether due to fraud or error. In making those risk assessments, the auditor considers internal control relevant to the entity’s preparation and fair presentation of the financial report in order to design audit procedures that are appropriate in the circumstances, but not for the purpose of expressing an opinion on the effectiveness of the entity’s internal control. An audit also includes evaluating the appropriateness of accounting policies used and the reasonableness of accounting estimates made by the directors, as well as evaluating the overall presentation of the financial report.
We believe that the audit evidence we have obtained is sufficient and appropriate to provide a basis for our audit opinion.
Independence Declaration by Auditors
In conducting our audit, we have complied with the independence requirements of the Corporations Act 2001.
Liability limited by a scheme approved under Professional Standards Legislation.
Independent Audit ReportTO THE MEMBERS OF CMI LIMITED
Liability limited by a scheme approved under Professional Standards Legislation
19
Independent Auditor’s Report to the Members of
CMI Limited
Report on the Financial Report
We have audited the accompanying financial report of CMI Limited (the company), which comprises
the balance sheet as at 30 June 2009, and the income statement, cash flow statement and statement of
changes in equity for the year ended on that date, a summary of significant accounting policies, other
explanatory notes and the directors’ declaration of the consolidated entity comprising the company
and the entities it controlled at the year’s end or from time to time during the financial year as set out
on pages 21 to 80.
Directors’ Responsibility for the Financial Report
The directors of the company are responsible for the preparation and fair presentation of the financial
report in accordance with Australian Accounting Standards (including the Australian Accounting
Interpretations) and the Corporations Act 2001. This responsibility includes establishing and
maintaining internal control relevant to the preparation and fair presentation of the financial report that
is free from material misstatement, whether due to fraud or error; selecting and applying appropriate
accounting policies; and making accounting estimates that are reasonable in the circumstances. In
Note 1, the directors also state, in accordance with Accounting Standard AASB 101 Presentation of
Financial Statements, that compliance with the Australian equivalents to International Financial
Reporting Standards ensures that the financial report, comprising the financial statements and notes,
complies with International Financial Reporting Standards.
Auditor’s Responsibility
Our responsibility is to express an opinion on the financial report based on our audit. We conducted
our audit in accordance with Australian Auditing Standards. These Auditing Standards require that we
comply with relevant ethical requirements relating to audit engagements and plan and perform the
audit to obtain reasonable assurance whether the financial report is free from material misstatement.
An audit involves performing procedures to obtain audit evidence about the amounts and disclosures
in the financial report. The procedures selected depend on the auditor’s judgement, including the
assessment of the risks of material misstatement of the financial report, whether due to fraud or error.
In making those risk assessments, the auditor considers internal control relevant to the entity’s
preparation and fair presentation of the financial report in order to design audit procedures that are
appropriate in the circumstances, but not for the purpose of expressing an opinion on the effectiveness
of the entity’s internal control. An audit also includes evaluating the appropriateness of accounting
policies used and the reasonableness of accounting estimates made by the directors, as well as
evaluating the overall presentation of the financial report.
Deloitte Touche Tohmatsu ABN 74 490 121 060 Riverside Centre Level 25 123 Eagle Street Brisbane QLD 4000 GPO Box 1463 Brisbane QLD 4001 Australia DX 115 Tel: +61 (0) 7 3308 7000 Fax: +61 (0) 7 3308 7001 www.deloitte.com.au
CMI LIMITED ANNUAL REPORT 200920
Independent Audit ReportTO THE MEMBERS OF CMI LIMITED
Auditor’s Opinion
In our opinion:
a) the financial report of CMI Limited is in accordance with the Corporations Act 2001, including:
(i) giving a true and fair view of the company’s and consolidated entity’s financial position as at 30 June 2008 and of their performance for the year ended on that date; and
(ii) complying with Australian Accounting Standards (including the Australian Accounting Interpretations) and the Corporations Regulations 2001.
b) the consolidated financial statements and notes also comply with International Financial Reporting Standards as disclosed in Note 1.
DELOITTE TOUCHE TOHMATSU
Carl Harris Partner Chartered Accountants 123 Eagle Street BRISBANE Dated: 25 September 2008
20
We believe that the audit evidence we have obtained is sufficient and appropriate to provide a basis for
our audit opinion.
Auditor’s Independence Declaration
In conducting our audit, we have complied with the independence requirements of the Corporations
Act 2001.
Auditor’s Opinion
In our opinion:
(a) the financial report of CMI Limited is in accordance with the Corporations Act 2001, including:
(i) giving a true and fair view of the company’s and consolidated entity’s financial position as at
30 June 2009 and of their performance for the year ended on that date; and
(ii) complying with Australian Accounting Standards (including the Australian Accounting
Interpretations) and the Corporations Regulations 2001; and
(b) the financial report also complies with International Financial Reporting Standards as disclosed in
Note 1.
Report on the Remuneration Report
We have audited the Remuneration Report included in pages 13 to 17 of the directors’ report for the
year ended 30 June 2009. The directors of the company are responsible for the preparation and
presentation of the Remuneration Report in accordance with section 300A of the Corporations Act
2001. Our responsibility is to express an opinion on the Remuneration Report, based on our audit
conducted in accordance with Australian Auditing Standards.
Auditor’s Opinion
In our opinion the Remuneration Report of CMI Limited for the year ended 30 June 2009, complies
with section 300A of the Corporations Act 2001.
DELOITTE TOUCHE TOHMATSU
Carl Harris
Partner
Chartered Accountants
Brisbane, 23 September 2009
CMI LIMITED ANNUAL REPORT 2009 21
The directors declare that:
a) In the directors’ opinion, there are reasonable grounds to believe that the company will be able to pay its debts as and when they become due and payable;
b) In the directors’ opinion, the attached financial statements and notes thereto are in accordance with the Corporations Act 2001, including compliance with accounting standards and giving a true and fair view of the financial position and performance of the company and the consolidated entity; and
c) The directors have been given the declarations required by section 295A of the Corporations Act 2001.
At the date of this declaration the company is within the class of companies affected by ASIC Class Order 98/1418. The nature of the deed of cross-guarantee is such that each company which is party to the deed guarantees to each creditor payment in full of any debt in accordance with the deed of cross-guarantee.
In the directors’ opinion, there are reasonable grounds to believe that the company and the companies to which the ASIC Class Order applies, as detailed in Note 28 to the financial statements, will as a group, be able to meet any obligations or liabilities to which they are, or may become, subject by virtue of the deed of cross-guarantee.
Signed in accordance with a resolution of the directors made pursuant to section 295(5) of the Corporations Act 2001.
On behalf of the Directors
C.G. Ryan Chairman
R.D. Catelan Director
BRISBANE
Dated: 23 September 2009
Directors’ DeclarationFOR THE FINANCIAL YEAR ENDED 30 JUNE 2009
CMI LIMITED ANNUAL REPORT 200922
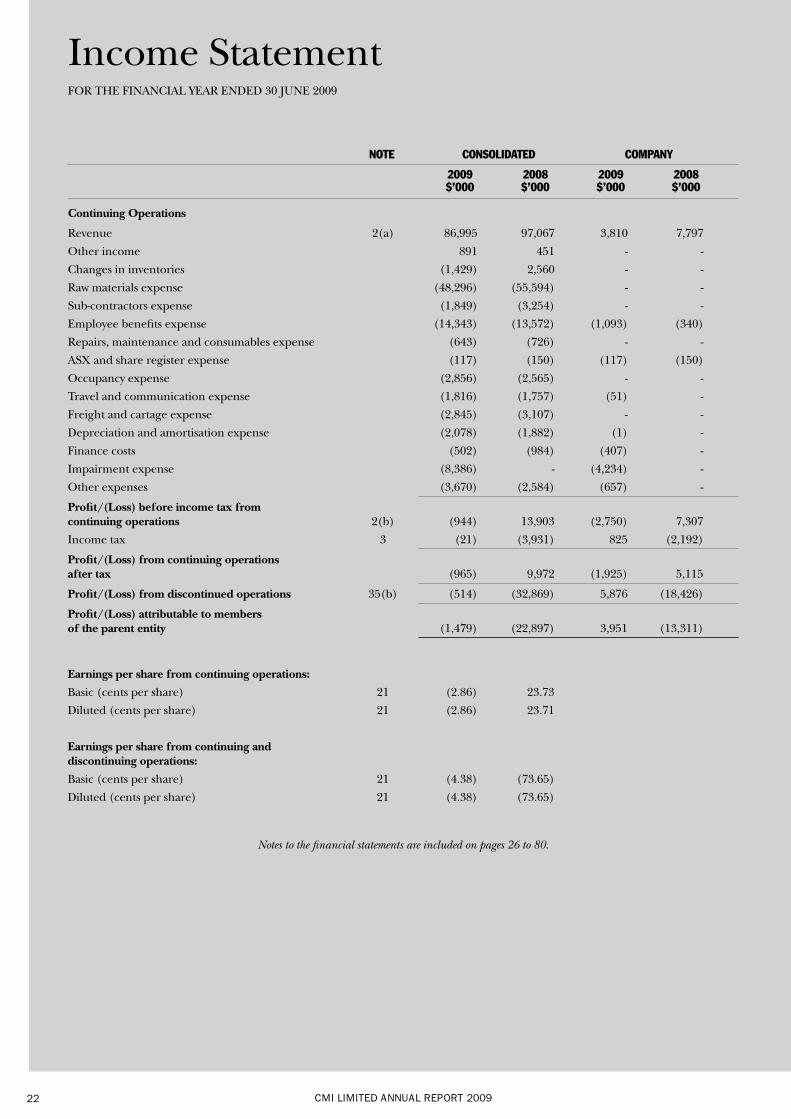
NOTE CONSOLIDATED COMPANY
2009 2008 2009 2008 $’000 $’000 $’000 $’000
Continuing Operations
Revenue 2(a) 86,995 97,067 3,810 7,797
Other income 891 451 - -
Changes in inventories (1,429) 2,560 - -
Raw materials expense (48,296) (55,594) - -
Sub-contractors expense (1,849) (3,254) - -
Employee benefits expense (14,343) (13,572) (1,093) (340)
Repairs, maintenance and consumables expense (643) (726) - -
ASX and share register expense (117) (150) (117) (150)
Occupancy expense (2,856) (2,565) - -
Travel and communication expense (1,816) (1,757) (51) -
Freight and cartage expense (2,845) (3,107) - -
Depreciation and amortisation expense (2,078) (1,882) (1) -
Finance costs (502) (984) (407) -
Impairment expense (8,386) - (4,234) -
Other expenses (3,670) (2,584) (657) -
Profit/(Loss) before income tax from continuing operations 2(b) (944) 13,903 (2,750) 7,307
Income tax 3 (21) (3,931) 825 (2,192)
Profit/(Loss) from continuing operations after tax (965) 9,972 (1,925) 5,115
Profit/(Loss) from discontinued operations 35(b) (514) (32,869) 5,876 (18,426)
Profit/(Loss) attributable to members of the parent entity (1,479) (22,897) 3,951 (13,311)
Earnings per share from continuing operations:
Basic (cents per share) 21 (2.86) 23.73
Diluted (cents per share) 21 (2.86) 23.71
Earnings per share from continuing and discontinuing operations:
Basic (cents per share) 21 (4.38) (73.65)
Diluted (cents per share) 21 (4.38) (73.65)
Notes to the financial statements are included on pages 26 to 80.
Income StatementFOR THE FINANCIAL YEAR ENDED 30 JUNE 2009
CMI LIMITED ANNUAL REPORT 2009 23
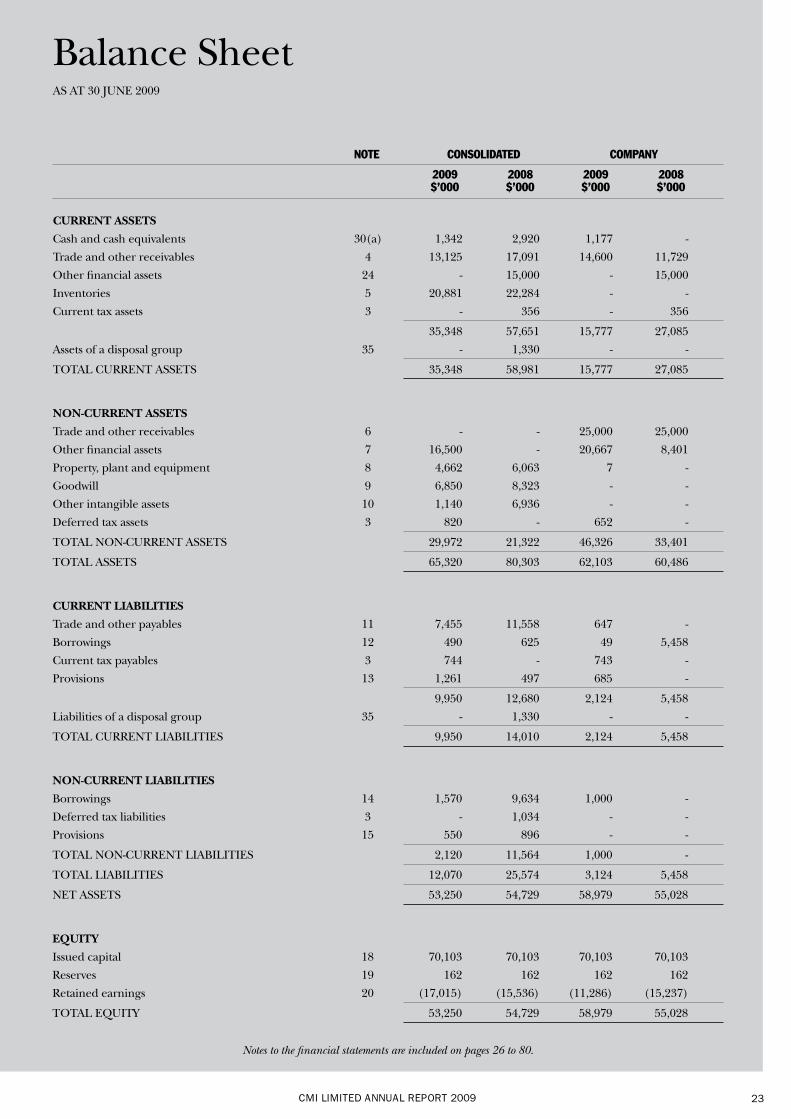
NOTE CONSOLIDATED COMPANY
2009 2008 2009 2008 $’000 $’000 $’000 $’000
CURRENT ASSETS
Cash and cash equivalents 30(a) 1,342 2,920 1,177 -
Trade and other receivables 4 13,125 17,091 14,600 11,729
Other financial assets 24 - 15,000 - 15,000
Inventories 5 20,881 22,284 - -
Current tax assets 3 - 356 - 356
35,348 57,651 15,777 27,085
Assets of a disposal group 35 - 1,330 - -
TOTAL CURRENT ASSETS 35,348 58,981 15,777 27,085
NON-CURRENT ASSETS
Trade and other receivables 6 - - 25,000 25,000
Other financial assets 7 16,500 - 20,667 8,401
Property, plant and equipment 8 4,662 6,063 7 -
Goodwill 9 6,850 8,323 - -
Other intangible assets 10 1,140 6,936 - -
Deferred tax assets 3 820 - 652 -
TOTAL NON-CURRENT ASSETS 29,972 21,322 46,326 33,401
TOTAL ASSETS 65,320 80,303 62,103 60,486
CURRENT LIABILITIES
Trade and other payables 11 7,455 11,558 647 -
Borrowings 12 490 625 49 5,458
Current tax payables 3 744 - 743 -
Provisions 13 1,261 497 685 -
9,950 12,680 2,124 5,458
Liabilities of a disposal group 35 - 1,330 - -
TOTAL CURRENT LIABILITIES 9,950 14,010 2,124 5,458
NON-CURRENT LIABILITIES
Borrowings 14 1,570 9,634 1,000 -
Deferred tax liabilities 3 - 1,034 - -
Provisions 15 550 896 - -
TOTAL NON-CURRENT LIABILITIES 2,120 11,564 1,000 -
TOTAL LIABILITIES 12,070 25,574 3,124 5,458
NET ASSETS 53,250 54,729 58,979 55,028
EQUITY
Issued capital 18 70,103 70,103 70,103 70,103
Reserves 19 162 162 162 162
Retained earnings 20 (17,015) (15,536) (11,286) (15,237)
TOTAL EQUITY 53,250 54,729 58,979 55,028
Notes to the financial statements are included on pages 26 to 80.
Balance SheetAS AT 30 JUNE 2009
CMI LIMITED ANNUAL REPORT 200924
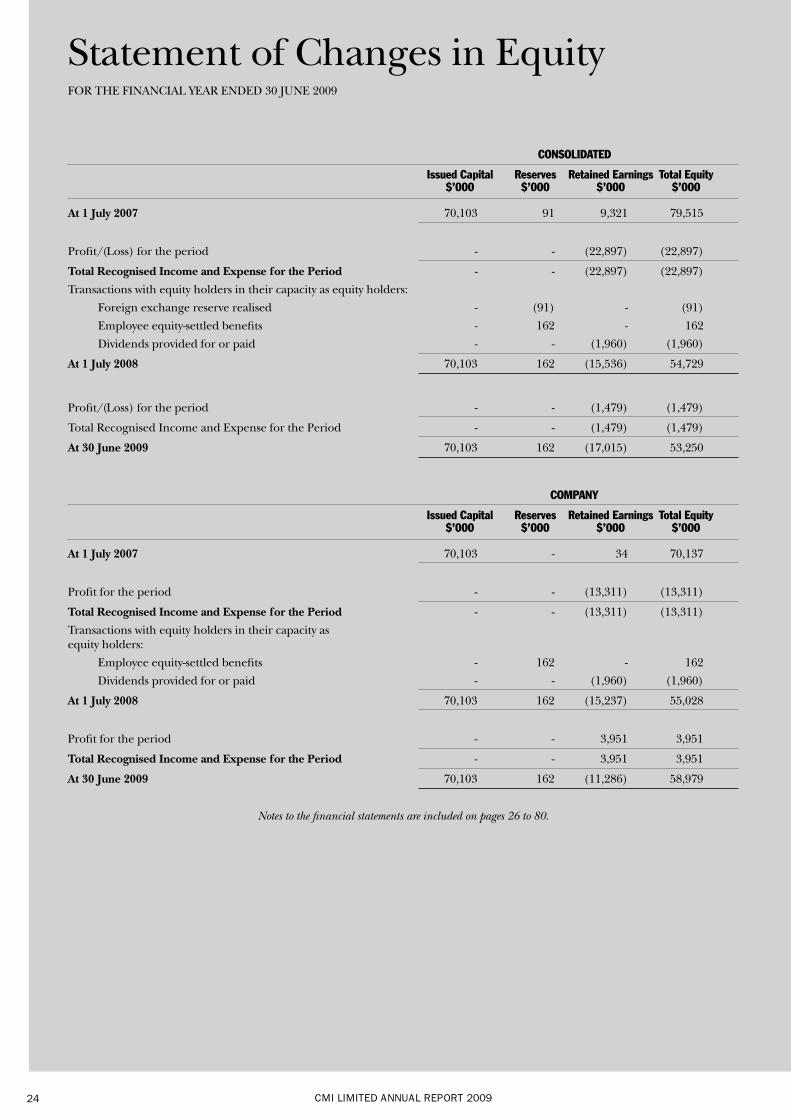
CONSOLIDATED
Issued Capital Reserves Retained Earnings Total Equity $’000 $’000 $’000 $’000
At 1 July 2007 70,103 91 9,321 79,515
Profit/(Loss) for the period - - (22,897) (22,897)
Total Recognised Income and Expense for the Period - - (22,897) (22,897)
Transactions with equity holders in their capacity as equity holders:
Foreign exchange reserve realised - (91) - (91)
Employee equity-settled benefits - 162 - 162
Dividends provided for or paid - - (1,960) (1,960)
At 1 July 2008 70,103 162 (15,536) 54,729
Profit/(Loss) for the period - - (1,479) (1,479)
Total Recognised Income and Expense for the Period - - (1,479) (1,479)
At 30 June 2009 70,103 162 (17,015) 53,250
COMPANY
Issued Capital Reserves Retained Earnings Total Equity $’000 $’000 $’000 $’000
At 1 July 2007 70,103 - 34 70,137
Profit for the period - - (13,311) (13,311)
Total Recognised Income and Expense for the Period - - (13,311) (13,311)
Transactions with equity holders in their capacity as equity holders:
Employee equity-settled benefits - 162 - 162
Dividends provided for or paid - - (1,960) (1,960)
At 1 July 2008 70,103 162 (15,237) 55,028
Profit for the period - - 3,951 3,951
Total Recognised Income and Expense for the Period - - 3,951 3,951
At 30 June 2009 70,103 162 (11,286) 58,979
Notes to the financial statements are included on pages 26 to 80.
Statement of Changes in EquityFOR THE FINANCIAL YEAR ENDED 30 JUNE 2009
CMI LIMITED ANNUAL REPORT 2009 25
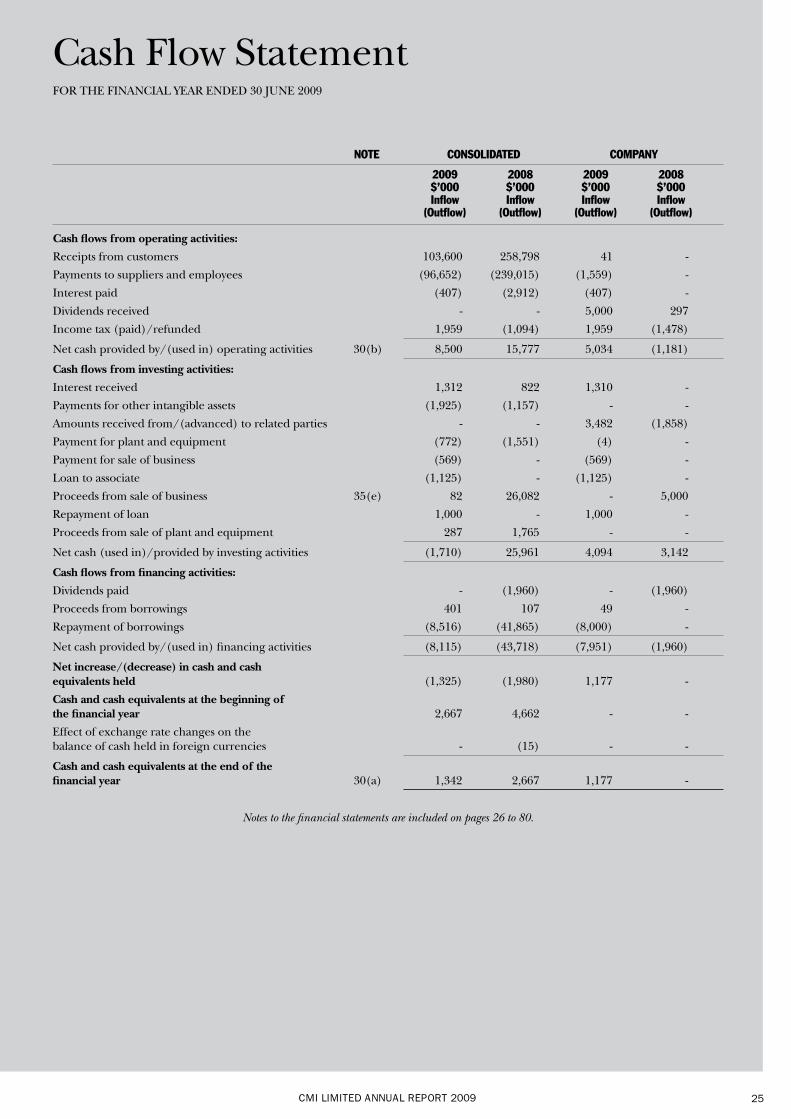
NOTE CONSOLIDATED COMPANY
2009 2008 2009 2008 $’000 $’000 $’000 $’000 Inflow Inflow Inflow Inflow (Outflow) (Outflow) (Outflow) (Outflow)
Cash flows from operating activities:
Receipts from customers 103,600 258,798 41 -
Payments to suppliers and employees (96,652) (239,015) (1,559) -
Interest paid (407) (2,912) (407) -
Dividends received - - 5,000 297
Income tax (paid)/refunded 1,959 (1,094) 1,959 (1,478)
Net cash provided by/(used in) operating activities 30(b) 8,500 15,777 5,034 (1,181)
Cash flows from investing activities:
Interest received 1,312 822 1,310 -
Payments for other intangible assets (1,925) (1,157) - -
Amounts received from/(advanced) to related parties - - 3,482 (1,858)
Payment for plant and equipment (772) (1,551) (4) -
Payment for sale of business (569) - (569) -
Loan to associate (1,125) - (1,125) -
Proceeds from sale of business 35(e) 82 26,082 - 5,000
Repayment of loan 1,000 - 1,000 -
Proceeds from sale of plant and equipment 287 1,765 - -
Net cash (used in)/provided by investing activities (1,710) 25,961 4,094 3,142
Cash flows from financing activities:
Dividends paid - (1,960) - (1,960)
Proceeds from borrowings 401 107 49 -
Repayment of borrowings (8,516) (41,865) (8,000) -
Net cash provided by/(used in) financing activities (8,115) (43,718) (7,951) (1,960)
Net increase/(decrease) in cash and cash equivalents held (1,325) (1,980) 1,177 -
Cash and cash equivalents at the beginning of the financial year 2,667 4,662 - -
Effect of exchange rate changes on the balance of cash held in foreign currencies - (15) - -
Cash and cash equivalents at the end of the financial year 30(a) 1,342 2,667 1,177 -
Notes to the financial statements are included on pages 26 to 80.
Cash Flow StatementFOR THE FINANCIAL YEAR ENDED 30 JUNE 2009
CMI LIMITED ANNUAL REPORT 200926
1. SUMMARY OF ACCOUNTING POLICIES
Statement of Compliance
The financial report is a general purpose financial report which has been prepared in accordance with the Corporations Act 2001, Accounting Standards and Interpretations, and complies with other requirements of the law. The financial report includes the separate financial statements of the company and the consolidated financial statements of the Group. Accounting Standards include Australian equivalents to International Financial Reporting Standards (‘A-IFRS’). Compliance with the A-IFRS ensures that the financial statements and notes of the company and the Group comply with International Financial Reporting Standards (‘IFRS’).
The financial statements were authorised for issue by the directors on 23 September 2009.
Basis of Preparation
The financial report has been prepared on the basis of historical cost, except for the revaluation of certain non-current assets and financial instruments. Cost is based on the fair values of the consideration given in exchange for assets. All amounts are presented in Australian dollars, unless otherwise noted.
The company is a company of the kind referred to in ASIC Class Order 98/0100, dated 10 July 1998, and in accordance with that Class Order amounts in the directors’ report and the financial report have been rounded off to the nearest thousand dollars, unless otherwise stated.
In the application of CMI Limited (“Group”) accounting policies, management is required to make judgments, estimates and assumptions about carrying values of assets and liabilities that are not readily apparent from other sources. The estimates and associated assumptions are based on historical experience and various other factors that are believed to be reasonable under the circumstance, the results of which form the basis of making the judgments. Actual results may differ from these estimates. The estimates and underlying assumptions are reviewed on an ongoing basis. Revisions to accounting estimates are recognized in the period in which the estimate is revised if the revision only affects that period, or in the period of the revision and future periods if the revision affects both current and future periods.
Judgments made by management in the application of the Group’s accounting policies that have significant effects on the financial statements and estimates with a significant risk of material adjustments in the next year are disclosed, where applicable, in the relevant notes to the financial statements.
Accounting policies are selected and applied in a manner which ensures that the resulting financial information satisfies the concepts of relevance and reliability, thereby ensuring that the substance of the underlying transactions or other events is reported.
The following significant accounting policies have been adopted in the preparation and presentation of the financial report.
Significant Accounting Policies
a) Borrowings
Borrowings are recorded initially at fair value, net of transaction costs. Subsequent to initial recognition, borrowings are measured at amortised cost with any difference between the initial recognised amount and the redemption value being recognised in profit and loss over the period of the borrowing using the effective interest rate method.
b) Borrowing Costs
Borrowing costs directly attributable to qualifying assets are capitalised and amortised over the life of the asset. All other borrowing costs are expensed when incurred.
c) Cash and Cash Equivalents
Cash and cash equivalents comprise cash on hand, cash in banks and investments in money market instruments, net of outstanding bank overdrafts. Bank overdrafts are shown within borrowings in current liabilities in the balance sheet.
d) Employee Benefits
Provision is made for benefits accruing to employees in respect of wages and salaries, annual leave, long service leave and sick leave when it is probable that settlement will be required and they are capable of being measured reliably.
Provisions made in respect of employee benefits expected to be settled within 12 months, are measured at their nominal values using the remuneration rate expected to apply at the time of settlement.
Provisions made in respect of employee benefits which are not expected to be settled within 12 months are measured as the present value of the estimated future cash outflows to be made by the consolidated entity in respect of services provided by employees up to the reporting date.
Contributions to defined contribution superannuation plans are expensed when incurred.
Notes to the Financial StatementsFOR THE FINANCIAL YEAR ENDED 30 JUNE 2009
CMI LIMITED ANNUAL REPORT 2009 27
1. SUMMARY OF ACCOUNTING POLICIES (continued)
e) Financial Assets
Subsequent to initial recognition, investments in subsidiaries are measured at cost.
Other financial assets are classified into the following specified categories: financial assets at fair value through profit or loss, held-to-maturity investments, available-for-sale financial assets, investments in subsidiaries and loans and receivables. The classification depends on the nature and purpose of the financial assets and is determined at the time of the initial recognition.
Financial assets at fair value through profit or loss
Financial assets are classified as financial assets at fair value through profit or loss where the financial asset:
• hasbeenacquiredprincipallyforthepurposeofsellinginthenearfuture;
• isapartofanidentifiedportfoliooffinancialinstrumentsthattheGroupmanagestogetherandhasarecentactualpattern of short-term profit-taking; or
• isaderivativeinstrumentthatisnotdesignatedandeffectiveasahedginginstrument.
Financial assets at fair value through profit or loss are stated at fair value, with any resultant gain or loss recognised in profit or loss. The net gain or loss recognised in profit or loss incorporates any dividend or interest earned on the financial asset.
Held-to-maturity investments
Bills of exchange and debentures with fixed or determinable payments and fixed maturity dates where the group has the positive intent and ability to hold to maturity are classified as held-to-maturity investments. Held-to-maturity investments are recorded at amortised cost using the effective interest method less impairment, with revenue recognised on an effective yield basis in Other Expenses.
Available-for-sale financial assets
Gains and losses arising from changes in fair value are recognised directly in the investments revaluation reserve with the exception of impairment losses, interest calculated using the effective interest method and foreign exchange gains and losses on monetary assets which are recognised directly in profit or loss. Where the investment is disposed of or is determined to be impaired, the cumulative gain or loss previously recognised in the investments revaluation reserve is included in profit or loss for the period in Other Expenses.
Loans and receivables
Trade receivables, loans and other receivables are recorded at amortised cost less impairment.
f) Financial Instruments Issued by the Company
Debt and Equity Instruments
Debt and equity instruments are classified as either liabilities or as equity in accordance with the substance of the contractual arrangement.
Compound Instruments
The component parts of compound instruments are classified separately as liabilities and equity in accordance with the substance of the contractual arrangement. At the date of issue, the fair value of the liability component is estimated using the prevailing market interest rate for a similar non-convertible debt. The equity component initially brought to account is determined by deducting the amount of the liability component from the amount of the compound instrument as a whole.
Transaction Costs on the Issue of Equity Instruments
Transaction costs arising on the issue of equity instruments are recognised directly in equity as a reduction of the proceeds of the equity instruments to which the costs relate. Transaction costs are the costs that are incurred directly in connection with the issue of those equity instruments and which would not have been incurred had those instruments not been issued.
Interest and Dividends
Interest and dividends are classified as expenses or as distributions of profit consistent with the balance sheet classification of the related debt or equity instruments.
Notes to the Financial StatementsFOR THE FINANCIAL YEAR ENDED 30 JUNE 2009
CMI LIMITED ANNUAL REPORT 200928
1. SUMMARY OF ACCOUNTING POLICIES (continued)
g) Foreign Currency
Foreign currency transactions
All foreign currency transactions during the year are brought to account using the exchange rate in effect at the date of the transaction. Foreign currency monetary items at reporting date are translated at the exchange rate existing at that date. Non-monetary assets and liabilities carried at fair value that are denominated in foreign currencies are translated at the rates prevailing at the date when the fair value was determined.
Exchange differences are recognised in net profit or loss in the period in which they arise.
Foreign operations
On consolidation, the assets and liabilities of the consolidated entity’s overseas operations are translated at exchange rates prevailing at the reporting date. Income and expense items are translated at the average exchange rates for the period unless exchange rates fluctuate significantly. Exchange differences arising, if any, are recognised in the foreign currency translation reserve, and recognised in profit or loss on disposal of the foreign operation.
h) Goods and Services Tax
Revenues, expenses and assets are recognised net of the amount of goods and services tax (GST), except:
a. where the amount of GST incurred is not recoverable from the taxation authority, it is recognised as part of the cost of acquisition of an asset or as part of an item of expense; or
b. for receivables and payables which are recognised inclusive of GST.
The net amount of GST recoverable from, or payable to, the taxation authority is included as part of receivables or payables.
Cash flows are included in the statement of cash flows on a gross basis. The GST component of cash flows arising from investing and financing activities which is recoverable from, or payable to, the taxation authority is classified as operating cash flows.
i) Goodwill
Goodwill, representing the excess of the cost of acquisition over the fair value of the identifiable assets, liabilities and contingent liabilities acquired, is recognised as an asset and not amortised, but tested for impairment annually and whenever there is an indication that the goodwill may be impaired. Any impairment is recognised immediately in profit and loss and is not subsequently reversed. Refer to note 1(j).
j) Impairment of Assets
At each reporting date, the consolidated entity reviews the carrying amounts of its tangible and intangible assets to determine whether there is any indication that those assets have suffered an impairment loss. If any such indication exists, the recoverable amount of the asset is estimated in order to determine the extent of the impairment loss (if any). Where the asset does not generate cash flows that are independent from other assets, the consolidated entity estimates the recoverable amount of the cash-generating unit to which the asset belongs.
Goodwill, intangible assets with indefinite useful lives and intangible assets not yet available for use are tested for impairment annually and whenever there is an indication that the asset may be impaired. An impairment of goodwill is not subsequently reversed. Recoverable amount is the higher of fair value less costs to sell and value in use. In assessing value in use, the estimated future cash flows are discounted to their present value using a pre-tax discount rate that reflects current market assessments of the time value of money and the risks specific to the asset for which the estimates of future cash flows have not been adjusted.
If the recoverable amount of an asset (or cash-generating unit) is estimated to be less than its carrying amount, the carrying amount of the asset (cash-generating unit) is reduced to its recoverable amount. An impairment loss is recognised in profit or loss immediately, unless the relevant asset is carried at fair value, in which case the impairment loss is treated as a revaluation decrease.
Where an impairment loss subsequently reverses, the carrying amount of the asset (cash-generating unit) is increased to the revised estimate of its recoverable amount, but only to the extent that the increased carrying amount does not exceed the carrying amount that would have been determined had no impairment loss been recognised for the asset (cash-generating unit) in prior years. A reversal of an impairment loss is recognised in profit or loss immediately, unless the relevant asset is carried at fair value, in which case the reversal of the impairment loss is treated as a revaluation increase.
Notes to the Financial StatementsFOR THE FINANCIAL YEAR ENDED 30 JUNE 2009
CMI LIMITED ANNUAL REPORT 2009 29
1. SUMMARY OF ACCOUNTING POLICIES (continued)
k) Income Tax
Current Tax
Current tax is calculated by reference to the amount of income taxes payable or recoverable in respect of the taxable profit or tax loss for the period. It is calculated using tax rates and tax laws that have been enacted or substantively enacted by reporting date. Current tax for current and prior periods is recognised as a liability (or asset) to the extent that it is unpaid (or refundable).
Deferred Tax
Deferred tax is accounted for using the comprehensive balance sheet liability method in respect of temporary differences arising from differences between the carrying amount of assets and liabilities in the financial statements and the corresponding tax base of those items.
In principle, deferred tax liabilities are recognised for all taxable temporary differences. Deferred tax assets are recognised to the extent that it is probable that sufficient taxable amounts will be available against which deductible temporary differences or unused tax losses and tax offsets can be utilised. However, deferred tax assets and liabilities are not recognised if the temporary differences giving rise to them arise from the initial recognition of assets and liabilities (other than as a result of a business combination) which affects neither taxable income nor accounting profit. Furthermore, a deferred tax liability is not recognised in relation to taxable temporary differences arising from goodwill.
Deferred tax liabilities are recognised for taxable temporary differences arising on investments in subsidiaries, branches, associates and joint ventures except where the consolidated entity is able to control the reversal of the temporary differences and it is probable that the temporary differences will not reverse in the foreseeable future. Deferred tax assets arising from deductible temporary differences associated with these investments and interests are only recognised to the extent that it is probable that there will be sufficient taxable profits against which to utilise the benefits of the temporary differences and they are expected to reverse in the foreseeable future.
Deferred tax assets and liabilities are measured at the tax rates that are expected to apply to the period(s) when the asset and liability give rise to them are realised or settled, based on tax rates (and tax laws) that have been enacted or substantively enacted by reporting date. The measurement of deferred tax liabilities and assets reflects the tax consequences that would follow from the manner in which the consolidated entity expects, at the reporting date, to recover or settle the carrying amount of its assets and liabilities.
Deferred tax assets and liabilities are offset when they relate to income taxes levied by the same taxation authority and the consolidated entity intends to settle its current tax assets and liabilities on a net basis.
Current and Deferred Tax for the Period
Current and deferred tax is recognised as an expense or income in the income statement, except when it relates to items credited or debited directly to equity, in which case the deferred tax is also recognised directly in equity, or where it arises from the initial accounting for a business combination, in which case it is taken into account in the determination of goodwill or excess.
Tax Consolidation
The company and all its wholly-owned Australian resident entities are part of a tax-consolidated group under Australian taxation law. CMI Limited is the head entity in the tax-consolidated group.
Entities within the tax-consolidated group have entered into a tax funding agreement with the head entity. Under the terms of the tax funding agreement, CMI Limited and each of the entities in the tax-consolidated group has agreed to pay a tax equivalent payment to or from the head entity, based on the current tax liability or current tax asset of the entity.
The current and deferred tax assets and liabilities of the parent entity are not reduced by the amounts owing from or to subsidiary entities in accordance with the tax funding agreement as these amounts are recognised as inter-company receivables and payables.
Entities within the tax-consolidated group have adopted the stand alone approach to measuring current and deferred tax amounts.
l) Intangible Assets
Brandnames
Brandnames are recorded at cost and amortised on a straight-line basis over a period of 40 years. Other intangible assets are amortised over a period not exceeding 20 years.
Notes to the Financial StatementsFOR THE FINANCIAL YEAR ENDED 30 JUNE 2009
CMI LIMITED ANNUAL REPORT 200930
1. SUMMARY OF ACCOUNTING POLICIES (continued)
Research and Development Costs
Expenditure on research activities is recognised as an expense in the period in which it is incurred. Where no internally-generated intangible asset can be recognised, development expenditure is recognised as an expense in the period as incurred.
An intangible asset arising from development (or from the development phase of an internal project) is recognised if, and only if, all of the following are demonstrated:
• thetechnicalfeasibilityofcompletingtheintangibleassetsothatitwillbeavailableforuseorsale;
• theintentiontocompletetheintangibleassetanduseorsellit;
• theabilitytouseorselltheintangibleasset;
• howtheintangibleassetwillgenerateprobablefutureeconomicbenefits;
• theavailabilityofadequatetechnical,financialandotherresourcestocompletethedevelopmentandtouseorselltheintangible asset; and
• theabilitytomeasurereliablytheexpenditureattributabletotheintangibleassetduringitsdevelopment.
Internally-generated intangible assets are stated at cost less accumulated amortised and impairment, and are amortised on a straight-line basis over the period in which the corresponding benefits are expected to arise, commencing with the commercial production of the product.
The unamortised balance of development costs deferred in previous periods is reviewed regularly and at each reporting date, to ensure the criterion for deferral continues to be met. Where such costs are no longer considered recoverable, they are written-off as an expense in net profit or loss.
m) Inventories
Inventories are valued at the lower of cost and net realisable value. Costs, including an appropriate portion of fixed and variable overhead expenses, are assigned to inventory on hand by the method most appropriate to each particular class of inventory, with the majority being valued on a weighted average basis. Net realisable value represents the estimated selling price less all estimated costs of completion and costs to be incurred in marketing, selling and distribution.
n) Leased Assets
Leases are classified as finance leases whenever the terms of the lease transfer substantially all the risks and rewards of ownership to the lessee. All other leases are classified as operating leases.
Assets held under finance leases are initially recognised at their fair value or, if lower, at amounts equal to the present value of the minimum lease payments, each determined at the inception of the lease. The corresponding liability to the lessor is included in the balance sheet as a finance lease obligation.
Lease payments are apportioned between finance charges and reduction of the lease obligation so as to achieve a constant rate of interest on the remaining balance of the liability. Finance charges are charged directly to income, unless they are directly attributable to qualifying assets, in which case they are capitalised in accordance with the consolidated entity’s general policy on borrowing costs. Refer to note 1(b).
Finance leased assets are amortised on a straight-line basis over the estimated useful life of the asset.
Operating lease payments are recognised as an expense on a straight-line basis over the lease term, except where another systematic basis is more representative of the time pattern in which economic benefits from the leased asset are consumed.
o) Payables
Trade payables and other accounts payable are recognised when the consolidated entity becomes obliged to make future payments resulting from the purchase of goods and services.
p) Principles of Consolidation
The consolidated financial statements have been prepared by combining the financial statements of all the entities that comprise the consolidated entity, being the company (the parent entity) and its subsidiaries as defined in Accounting Standard AASB 127 Consolidated and Separate Financial Statements. Consistent accounting policies have been employed in the preparation and presentation of the consolidated financial statements.
On acquisition, the assets, liabilities and contingent liabilities of a subsidiary are measured at their fair values at the date of acquisition. Any excess of the cost of acquisition over the fair values of the identifiable net assets acquired is recognised as goodwill. If, after reassessment, the fair values of the identifiable net assets acquired exceeds the cost of acquisition, the deficiency is credited to profit and loss in the period of acquisition.
Notes to the Financial StatementsFOR THE FINANCIAL YEAR ENDED 30 JUNE 2009
CMI LIMITED ANNUAL REPORT 2009 31
1. SUMMARY OF ACCOUNTING POLICIES (continued)
The consolidated financial statements include the information and results of each subsidiary from the date on which the company obtains control and until such time as the company ceases to control such entity. In preparing the consolidated financial statements, all intercompany balances and transactions, and unrealised profits arising within the consolidated entity are eliminated in full.
q) Property, Plant and Equipment
Land and buildings, plant and equipment, leasehold improvements and equipment under finance lease are stated at cost less accumulated depreciation and impairment. Cost includes expenditure that is directly attributable to the acquisition of the item.
Depreciation is provided on property, plant and equipment, including freehold buildings but excluding land. Depreciation is calculated on a straight-line basis so as to write off the net cost of each asset during its expected useful life to its estimated residual value. Leasehold improvements are depreciated over the period of the lease or estimated useful life, whichever is the shorter, using the straight-line method. The estimated useful lives, residual values and depreciation method are reviewed at the end of each annual reporting period.
The following estimated useful lives are used in the calculation of depreciation:
• Buildings 25–50years • Plantandequipment 3–20years • Equipmentunderfinanceleases 3–20years
r) Provisions
Provisions are recognised when the consolidated entity has a present obligation, the future sacrifice of economic benefits is probable, and the amount of the provision can be measured reliably.
The amount recognised as a provision is the best estimate of the consideration required to settle the present obligation at reporting date, taking into account the risks and uncertainties surrounding the obligation. Where a provision is measured using the cashflows estimated to settle the present obligation, its carrying amount is the present value of those cashflows.
When some or all of the economic benefits required to settle a provision are expected to be recovered from a third party, the receivable is recognised as an asset if it is probable that recovery will be received and the amount of the receivable can be measured reliably.
Dividends
A provision is recognised for dividends when they have been declared, determined or publicly recommended by the directors on or before reporting date.
s) Revenue Recognition
Sale of goods and disposal of assets
Revenue from the sale of goods is recognised when the consolidated entity has transferred to the buyer the significant risks and rewards of ownership of the goods.
Rendering of services
Revenue from services provided is recognised upon the delivery of the service to the customer.
Interest received
Interest received is accrued on a time basis, by reference to the principal outstanding and at the effective interest rate applicable.
Management fees received
Management fees are recognised as revenue over the period during which the services are provided.
Dividends received
Dividend income is recorded in the income statement on an accruals basis when the Group’s right to receive the dividend is established.
t) Tooling
Material items of expenditure, relating to tooling, are capitalised into plant and equipment to the extent that there will be future economic benefits.
Notes to the Financial StatementsFOR THE FINANCIAL YEAR ENDED 30 JUNE 2009
CMI LIMITED ANNUAL REPORT 200932
1. SUMMARY OF ACCOUNTING POLICIES (continued)
The capitalised costs are amortised over the expected period (not exceeding 15 years) in which the corresponding benefits are expected to arise. The amortised balance of costs capitalised is reviewed regularly and at each balance date, to ensure the criterion for capitalisation continues to be met. Where such costs are no longer considered recoverable, they are recognised in net profit or loss.
u) Standards and Interpretations in issue not yet adopted
At the date of authorisation of the financial report, a number of Standards and Interpretations were in issue but not yet effective. The table below discloses those items applicable to the Group and their expected impact.
Reference Title Summary Application date of
standard
Impact on Group financial report
Application date for Group
AASB 101, AASB 2007-8 and AASB 2007-10
‘Presentation of Financial Statements’ (revised September 2007), ‘Amendments to Australian Accounting Standards arising from AASB 101’ and ‘Further Amendments to Australian Accounting Standards arising from AASB 101’
Introduces a statement of comprehensive income.
Other revisions include impacts on the presentation of items in the statement of changes in equity, new presentation requirements for restatements or reclassifications of items in the financial statements, changes in the presentation requirements for dividends and changes to the titles of the financial statements.
1 January 2009
These amendments are only expected to affect the presentation of the Group’s financial report and will not have a direct impact on the measurement and recognition of amounts disclosed in the financial report. The Group has not determined at this stage whether to present a single statement of comprehensive income or two separate statements.
1 July 2009
AASB 8 and AASB 2007-3
Operating Segments and consequential amendments to other Australian Accounting Standards
New standard replacing AASB 114 Segment Reporting, which adopts a management reporting approach to segment reporting.
1 January 2009
AASB 8 is a disclosure standard so will have no direct impact on the amounts included in the Group’s financial statements, although it may indirectly impact the level at which goodwill is tested for impairment. In addition, the amendments may have an impact on the Group’s segment disclosures.
1 July 2009
AASB 2009-2 ‘Amendments to Australian Accounting Standards – Improving Disclosures about Financial Instruments’
Amends AASB 7 Financial Instruments: Disclosures to require enhanced disclosures about fair value measurements (in respect of financial instruments recognised at fair value) and liquidity risk.
1 January 2009
Initial application of this Standard will not affect any of the amounts recognised in the financial report, but will change the disclosures presently made in relation to the Group and the Company’s financial report.
1 July 2009
AASB 123 (Revised) and AASB 2007-6
Borrowing Costs and consequential amendments to other Australian Accounting Standards
The amendments to AASB 123 require that all borrowing costs associated with a qualifying asset be capitalised.
1 January 2009
These amendments to AASB 123 require that all borrowing costs associated with a qualifying asset be capitalised. The Group has no borrowing costs associated with qualifying assets and as such the amendments are not expected to have any impact on the Group’s financial report.
1 July 2009
Notes to the Financial StatementsFOR THE FINANCIAL YEAR ENDED 30 JUNE 2009
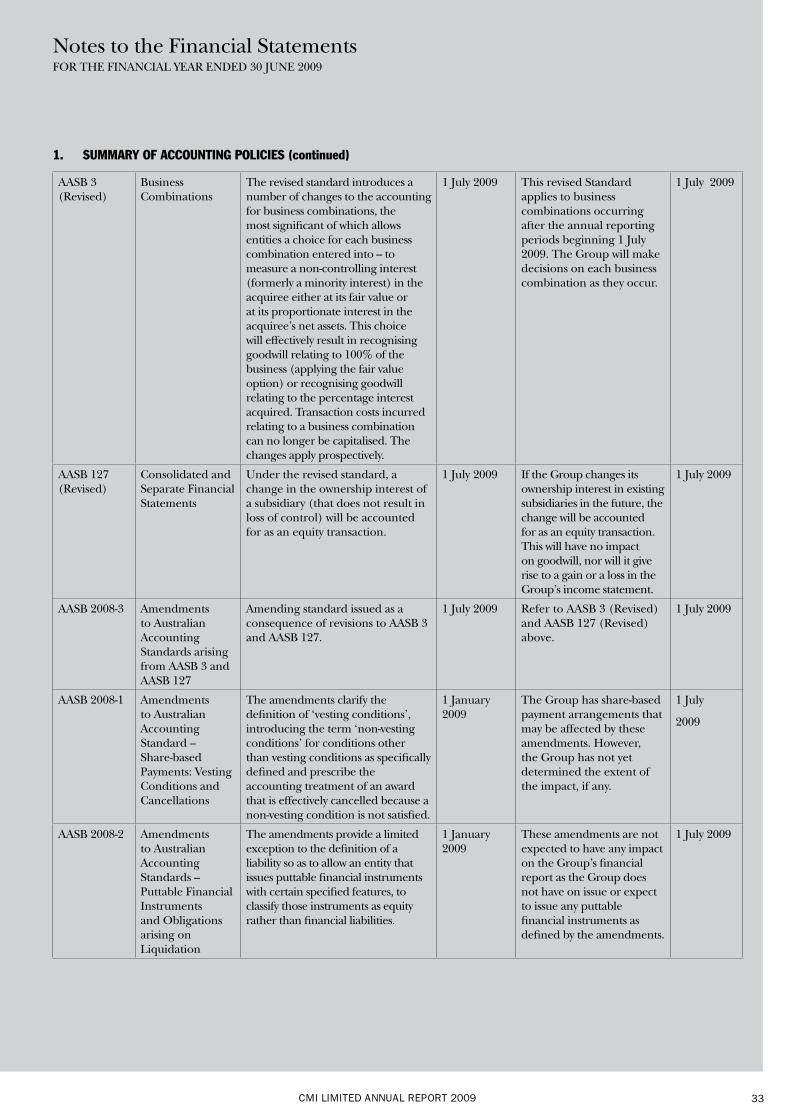
CMI LIMITED ANNUAL REPORT 2009 33
AASB 3 (Revised)
Business Combinations
The revised standard introduces a number of changes to the accounting for business combinations, the most significant of which allows entities a choice for each business combination entered into – to measure a non-controlling interest (formerly a minority interest) in the acquiree either at its fair value or at its proportionate interest in the acquiree’s net assets. This choice will effectively result in recognising goodwill relating to 100% of the business (applying the fair value option) or recognising goodwill relating to the percentage interest acquired. Transaction costs incurred relating to a business combination can no longer be capitalised. The changes apply prospectively.
1 July 2009 This revised Standard applies to business combinations occurring after the annual reporting periods beginning 1 July 2009. The Group will make decisions on each business combination as they occur.
1 July 2009
AASB 127 (Revised)
Consolidated and Separate Financial Statements
Under the revised standard, a change in the ownership interest of a subsidiary (that does not result in loss of control) will be accounted for as an equity transaction.
1 July 2009 If the Group changes its ownership interest in existing subsidiaries in the future, the change will be accounted for as an equity transaction. This will have no impact on goodwill, nor will it give rise to a gain or a loss in the Group’s income statement.
1 July 2009
AASB 2008-3 Amendments to Australian Accounting Standards arising from AASB 3 and AASB 127
Amending standard issued as a consequence of revisions to AASB 3 and AASB 127.
1 July 2009 Refer to AASB 3 (Revised) and AASB 127 (Revised) above.
1 July 2009
AASB 2008-1 Amendments to Australian Accounting Standard – Share-based Payments: Vesting Conditions and Cancellations
The amendments clarify the definition of ‘vesting conditions’, introducing the term ‘non-vesting conditions’ for conditions other than vesting conditions as specifically defined and prescribe the accounting treatment of an award that is effectively cancelled because a non-vesting condition is not satisfied.
1 January 2009
The Group has share-based payment arrangements that may be affected by these amendments. However, the Group has not yet determined the extent of the impact, if any.
1 July
2009
AASB 2008-2 Amendments to Australian Accounting Standards – Puttable Financial Instruments and Obligations arising on Liquidation
The amendments provide a limited exception to the definition of a liability so as to allow an entity that issues puttable financial instruments with certain specified features, to classify those instruments as equity rather than financial liabilities.
1 January 2009
These amendments are not expected to have any impact on the Group’s financial report as the Group does not have on issue or expect to issue any puttable financial instruments as defined by the amendments.
1 July 2009
Notes to the Financial StatementsFOR THE FINANCIAL YEAR ENDED 30 JUNE 2009
1. SUMMARY OF ACCOUNTING POLICIES (continued)
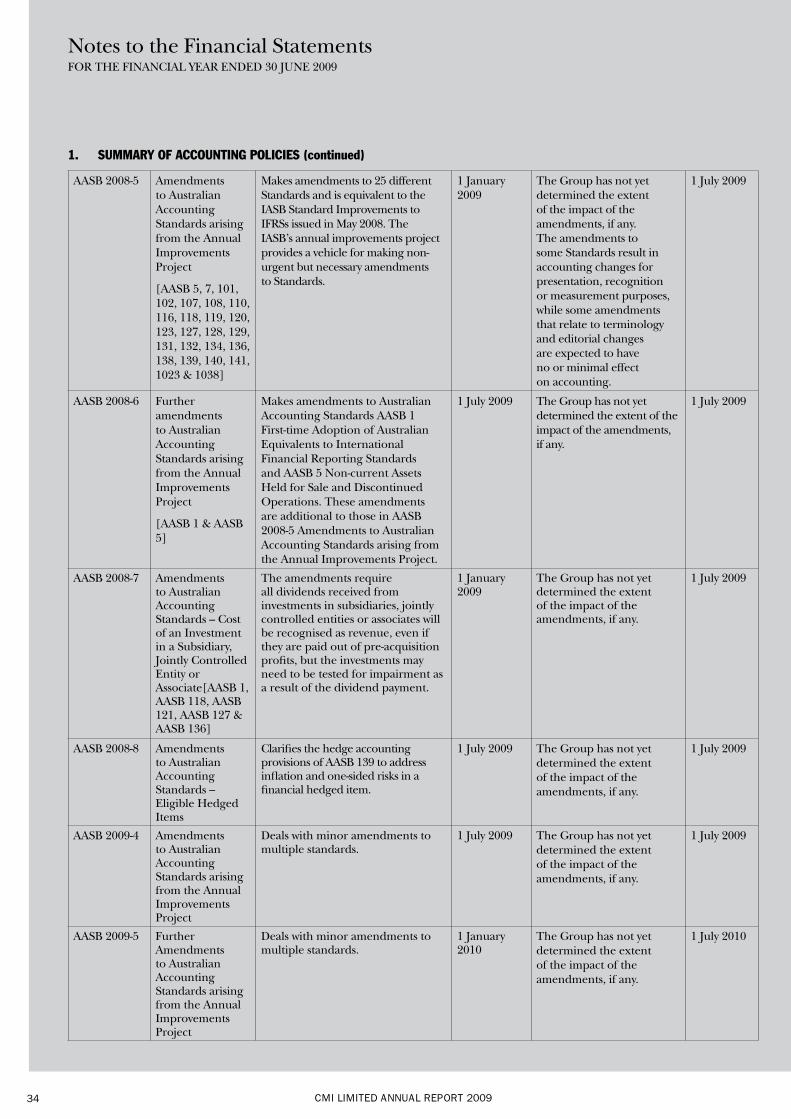
CMI LIMITED ANNUAL REPORT 200934
AASB 2008-5 Amendments to Australian Accounting Standards arising from the Annual Improvements Project
[AASB 5, 7, 101, 102, 107, 108, 110, 116, 118, 119, 120, 123, 127, 128, 129, 131, 132, 134, 136, 138, 139, 140, 141, 1023 & 1038]
Makes amendments to 25 different Standards and is equivalent to the IASB Standard Improvements to IFRSs issued in May 2008. The IASB’s annual improvements project provides a vehicle for making non-urgent but necessary amendments to Standards.
1 January 2009
The Group has not yet determined the extent of the impact of the amendments, if any. The amendments to some Standards result in accounting changes for presentation, recognition or measurement purposes, while some amendments that relate to terminology and editorial changes are expected to have no or minimal effect on accounting.
1 July 2009
AASB 2008-6 Further amendments to Australian Accounting Standards arising from the Annual Improvements Project
[AASB 1 & AASB 5]
Makes amendments to Australian Accounting Standards AASB 1 First-time Adoption of Australian Equivalents to International Financial Reporting Standards and AASB 5 Non-current Assets Held for Sale and Discontinued Operations. These amendments are additional to those in AASB 2008-5 Amendments to Australian Accounting Standards arising from the Annual Improvements Project.
1 July 2009 The Group has not yet determined the extent of the impact of the amendments, if any.
1 July 2009
AASB 2008-7 Amendments to Australian Accounting Standards – Cost of an Investment in a Subsidiary, Jointly Controlled Entity or Associate[AASB 1, AASB 118, AASB 121, AASB 127 & AASB 136]
The amendments require all dividends received from investments in subsidiaries, jointly controlled entities or associates will be recognised as revenue, even if they are paid out of pre-acquisition profits, but the investments may need to be tested for impairment as a result of the dividend payment.
1 January 2009
The Group has not yet determined the extent of the impact of the amendments, if any.
1 July 2009
AASB 2008-8 Amendments to Australian Accounting Standards – Eligible Hedged Items
Clarifies the hedge accounting provisions of AASB 139 to address inflation and one-sided risks in a financial hedged item.
1 July 2009 The Group has not yet determined the extent of the impact of the amendments, if any.
1 July 2009
AASB 2009-4 Amendments to Australian Accounting Standards arising from the Annual Improvements Project
Deals with minor amendments to multiple standards.
1 July 2009 The Group has not yet determined the extent of the impact of the amendments, if any.
1 July 2009
AASB 2009-5 Further Amendments to Australian Accounting Standards arising from the Annual Improvements Project
Deals with minor amendments to multiple standards.
1 January 2010
The Group has not yet determined the extent of the impact of the amendments, if any.
1 July 2010
Notes to the Financial StatementsFOR THE FINANCIAL YEAR ENDED 30 JUNE 2009
1. SUMMARY OF ACCOUNTING POLICIES (continued)
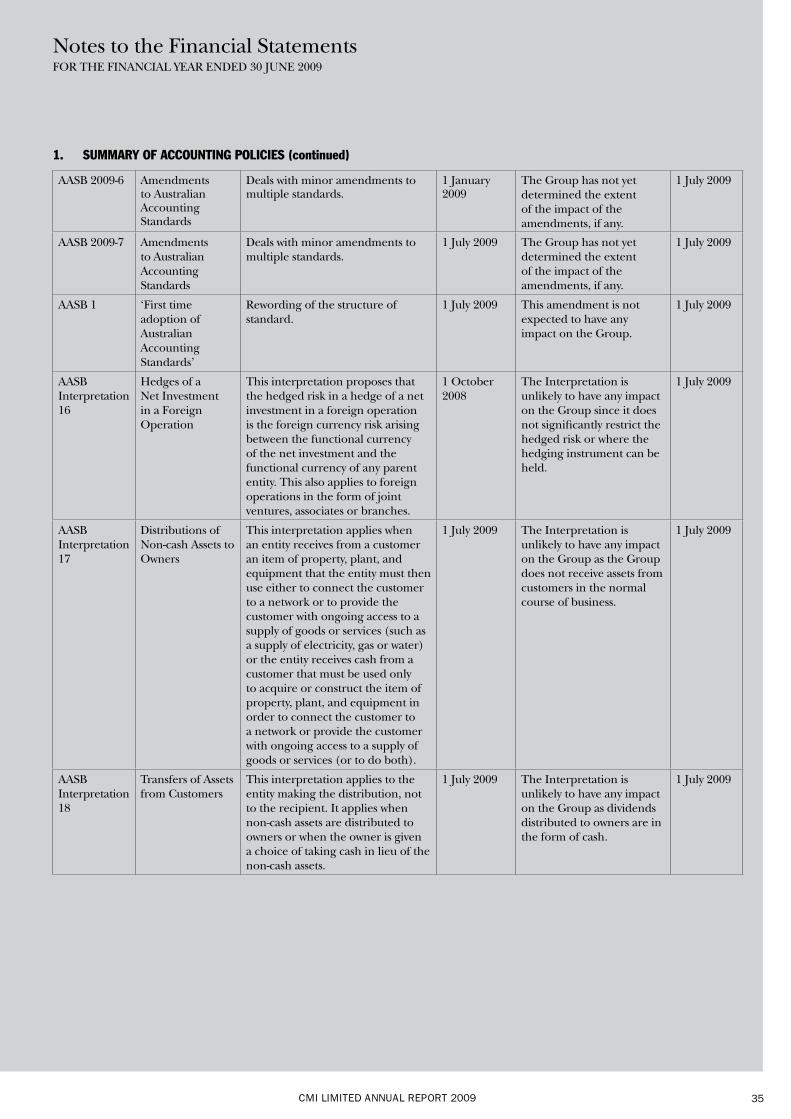
CMI LIMITED ANNUAL REPORT 2009 35
AASB 2009-6 Amendments to Australian Accounting Standards
Deals with minor amendments to multiple standards.
1 January 2009
The Group has not yet determined the extent of the impact of the amendments, if any.
1 July 2009
AASB 2009-7 Amendments to Australian Accounting Standards
Deals with minor amendments to multiple standards.
1 July 2009 The Group has not yet determined the extent of the impact of the amendments, if any.
1 July 2009
AASB 1 ‘First time adoption of Australian Accounting Standards’
Rewording of the structure of standard.
1 July 2009 This amendment is not expected to have any impact on the Group.
1 July 2009
AASB Interpretation 16
Hedges of a Net Investment in a Foreign Operation
This interpretation proposes that the hedged risk in a hedge of a net investment in a foreign operation is the foreign currency risk arising between the functional currency of the net investment and the functional currency of any parent entity. This also applies to foreign operations in the form of joint ventures, associates or branches.
1 October 2008
The Interpretation is unlikely to have any impact on the Group since it does not significantly restrict the hedged risk or where the hedging instrument can be held.
1 July 2009
AASB Interpretation 17
Distributions of Non-cash Assets to Owners
This interpretation applies when an entity receives from a customer an item of property, plant, and equipment that the entity must then use either to connect the customer to a network or to provide the customer with ongoing access to a supply of goods or services (such as a supply of electricity, gas or water) or the entity receives cash from a customer that must be used only to acquire or construct the item of property, plant, and equipment in order to connect the customer to a network or provide the customer with ongoing access to a supply of goods or services (or to do both).
1 July 2009 The Interpretation is unlikely to have any impact on the Group as the Group does not receive assets from customers in the normal course of business.
1 July 2009
AASB Interpretation 18
Transfers of Assets from Customers
This interpretation applies to the entity making the distribution, not to the recipient. It applies when non-cash assets are distributed to owners or when the owner is given a choice of taking cash in lieu of the non-cash assets.
1 July 2009 The Interpretation is unlikely to have any impact on the Group as dividends distributed to owners are in the form of cash.
1 July 2009
Notes to the Financial StatementsFOR THE FINANCIAL YEAR ENDED 30 JUNE 2009
1. SUMMARY OF ACCOUNTING POLICIES (continued)
CMI LIMITED ANNUAL REPORT 200936
1. SUMMARY OF ACCOUNTING POLICIES (continued)
v) Non-current assets and disposal group held for sale and discontinued operations - refer note 35
Non-current assets and disposal groups are classified as held for sale and measured at the lower of their carrying amount and fair value less costs to sell if their carrying amount will be recovered principally through a sale transaction. They are not depreciated or amortised. For an asset or disposal group to be classified as held for sale, it must be available for immediate sale in its present condition and its sale must be highly probable.
An impairment loss is recognised for any initial or subsequent write-down of the asset (or disposal group) to fair value less costs to sell. A gain is recognised for any subsequent increases in fair value less costs to sell of an asset (or disposal group), but not in excess of any cumulative impairment loss previously recognised. A gain or loss not previously recognised by the date of the sale of the non-current asset (or disposal group) is recognised at the date of derecognition.
A discontinued operation is a component of the entity that has been disposed of or is classified as held for sale and that represents a separate major line of business or geographical area of operations, is part of a single coordinated plan to dispose of such a line of business or area of operations, or is a subsidiary acquired exclusively with a view to resale. The results of discontinued operations are presented separately on the face of the income statement, with comparatives restated, and the assets and liabilities are presented separately on the face of the balance sheet.
w) Investments in associates – refer note 29
The Group’s investment in its associates is accounted for using the equity method of accounting in the consolidated financial statements and at cost in the parent. The associates are entities over which the Group has significant influence and that are neither subsidiaries nor joint ventures. Significant influence is the power to participate in the financial and operating policy decisions of the investee but is not control or joint control over these policies.
Under the equity method, investments in the associates are carried in the consolidated balance sheet at cost plus post-acquisition changes in the Group’s share of net assets of the associates. Goodwill relating to an associate is included in the carrying amount of the investment and is not amortised. After application of the equity method, the Group determines whether it is necessary to recognise any impairment loss with respect to the Group’s net investment in associates.
The Group’s share of its associates’ post-acquisition profits or losses is recognised in the income statement, and its share of post-acquisition movements in reserves is recognised in reserves. The cumulative post-acquisition movements are adjusted against the carrying amount of the investment. Dividends receivable from associates are recognised in the parent entity’s income statement, while in the consolidated financial statements they reduce the carrying amount of the investment.
When the Group’s share of losses in an associate equals or exceeds its interest in the associate, including any unsecured long-term receivables and loans, the Group does not recognise further losses, unless it has incurred obligations or made payments on behalf of the associate.
The reporting dates of the associates and the Group are identical and the associates’ accounting policies conform to those used by the Group for like transactions and events in similar circumstances.
Notes to the Financial StatementsFOR THE FINANCIAL YEAR ENDED 30 JUNE 2009
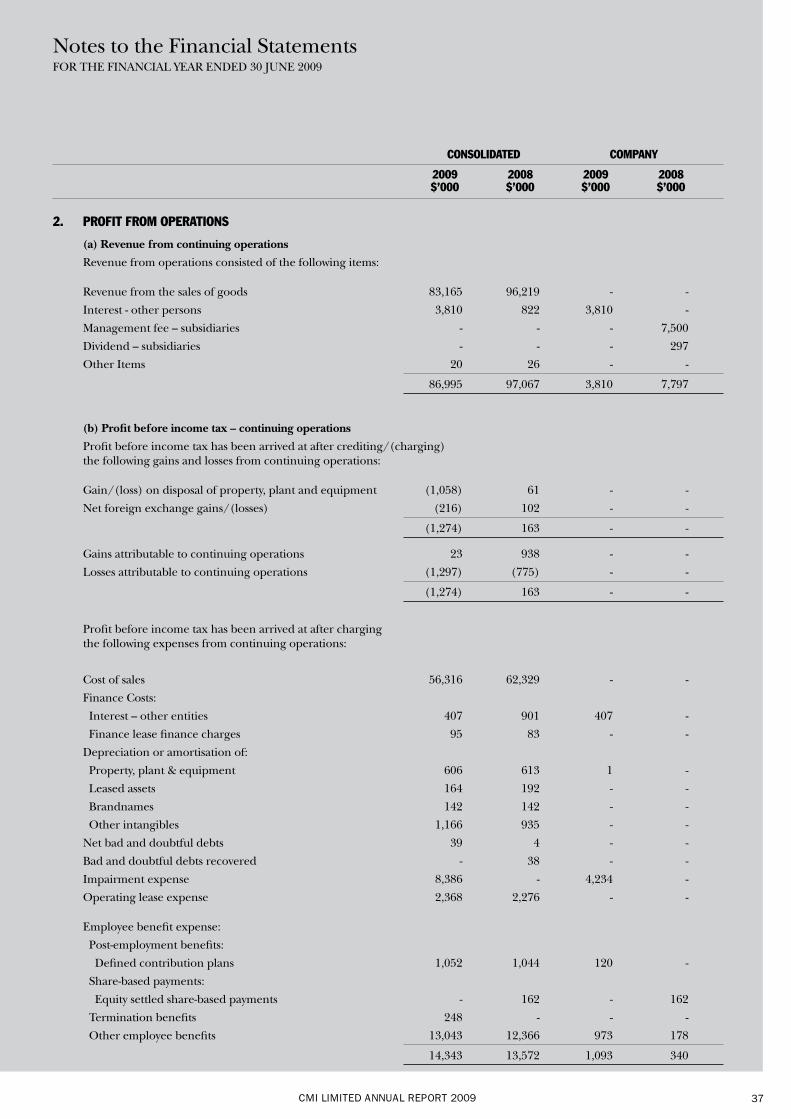
CMI LIMITED ANNUAL REPORT 2009 37
CONSOLIDATED COMPANY
2009 2008 2009 2008 $’000 $’000 $’000 $’000
2. PROFIT FROM OPERATIONS
(a) Revenue from continuing operations
Revenue from operations consisted of the following items:
Revenue from the sales of goods 83,165 96,219 - -
Interest - other persons 3,810 822 3,810 -
Management fee – subsidiaries - - - 7,500
Dividend – subsidiaries - - - 297
Other Items 20 26 - -
86,995 97,067 3,810 7,797
(b) Profit before income tax – continuing operations
Profit before income tax has been arrived at after crediting/(charging) the following gains and losses from continuing operations:
Gain/(loss) on disposal of property, plant and equipment (1,058) 61 - -
Net foreign exchange gains/(losses) (216) 102 - -
(1,274) 163 - -
Gains attributable to continuing operations 23 938 - -
Losses attributable to continuing operations (1,297) (775) - -
(1,274) 163 - -
Profit before income tax has been arrived at after charging the following expenses from continuing operations:
Cost of sales 56,316 62,329 - -
Finance Costs:
Interest – other entities 407 901 407 -
Finance lease finance charges 95 83 - -
Depreciation or amortisation of:
Property, plant & equipment 606 613 1 -
Leased assets 164 192 - -
Brandnames 142 142 - -
Other intangibles 1,166 935 - -
Net bad and doubtful debts 39 4 - -
Bad and doubtful debts recovered - 38 - -
Impairment expense 8,386 - 4,234 -
Operating lease expense 2,368 2,276 - -
Employee benefit expense:
Post-employment benefits:
Defined contribution plans 1,052 1,044 120 -
Share-based payments:
Equity settled share-based payments - 162 - 162
Termination benefits 248 - - -
Other employee benefits 13,043 12,366 973 178
14,343 13,572 1,093 340
Notes to the Financial StatementsFOR THE FINANCIAL YEAR ENDED 30 JUNE 2009
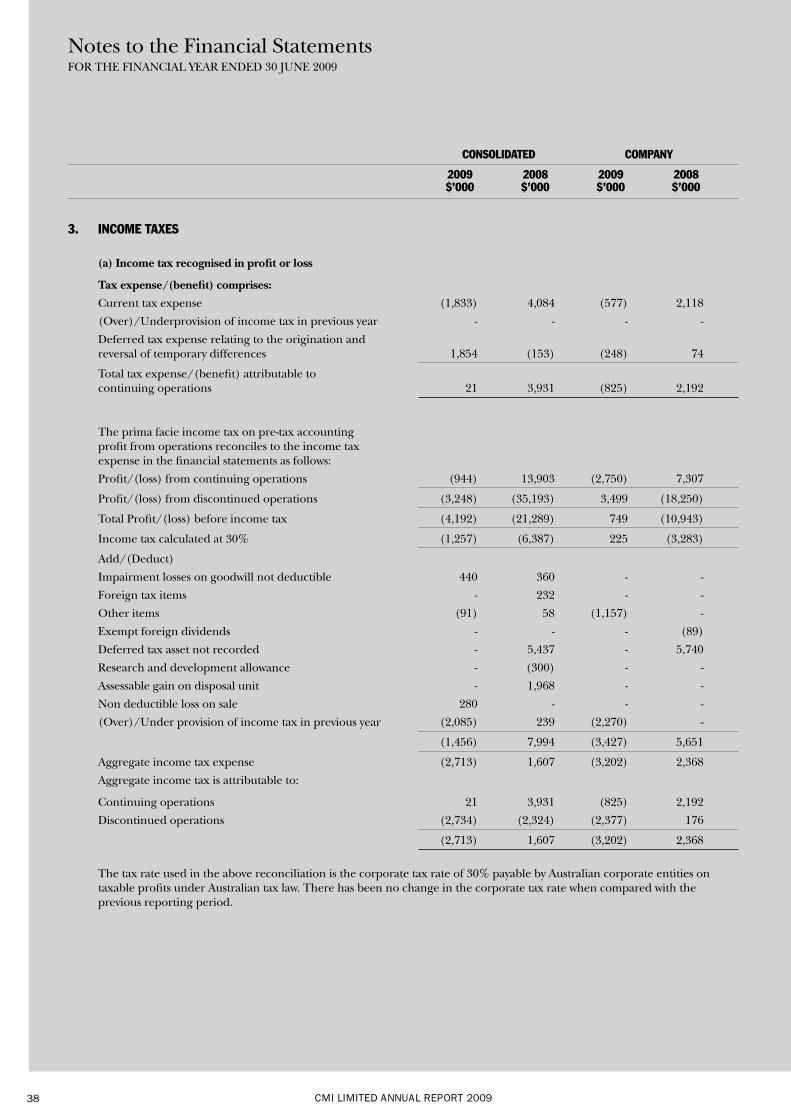
CMI LIMITED ANNUAL REPORT 200938
CONSOLIDATED COMPANY
2009 2008 2009 2008 $’000 $’000 $’000 $’000
3. INCOME TAXES
(a) Income tax recognised in profit or loss
Tax expense/(benefit) comprises:
Current tax expense (1,833) 4,084 (577) 2,118
(Over)/Underprovision of income tax in previous year - - - -
Deferred tax expense relating to the origination and reversal of temporary differences 1,854 (153) (248) 74
Total tax expense/(benefit) attributable to continuing operations 21 3,931 (825) 2,192
The prima facie income tax on pre-tax accounting profit from operations reconciles to the income tax expense in the financial statements as follows:
Profit/(loss) from continuing operations (944) 13,903 (2,750) 7,307
Profit/(loss) from discontinued operations (3,248) (35,193) 3,499 (18,250)
Total Profit/(loss) before income tax (4,192) (21,289) 749 (10,943)
Income tax calculated at 30% (1,257) (6,387) 225 (3,283)
Add/(Deduct)
Impairment losses on goodwill not deductible 440 360 - -
Foreign tax items - 232 - -
Other items (91) 58 (1,157) -
Exempt foreign dividends - - - (89)
Deferred tax asset not recorded - 5,437 - 5,740
Research and development allowance - (300) - -
Assessable gain on disposal unit - 1,968 - -
Non deductible loss on sale 280 - - -
(Over)/Under provision of income tax in previous year (2,085) 239 (2,270) -
(1,456) 7,994 (3,427) 5,651
Aggregate income tax expense (2,713) 1,607 (3,202) 2,368
Aggregate income tax is attributable to:
Continuing operations 21 3,931 (825) 2,192
Discontinued operations (2,734) (2,324) (2,377) 176
(2,713) 1,607 (3,202) 2,368
The tax rate used in the above reconciliation is the corporate tax rate of 30% payable by Australian corporate entities on taxable profits under Australian tax law. There has been no change in the corporate tax rate when compared with the previous reporting period.
Notes to the Financial StatementsFOR THE FINANCIAL YEAR ENDED 30 JUNE 2009
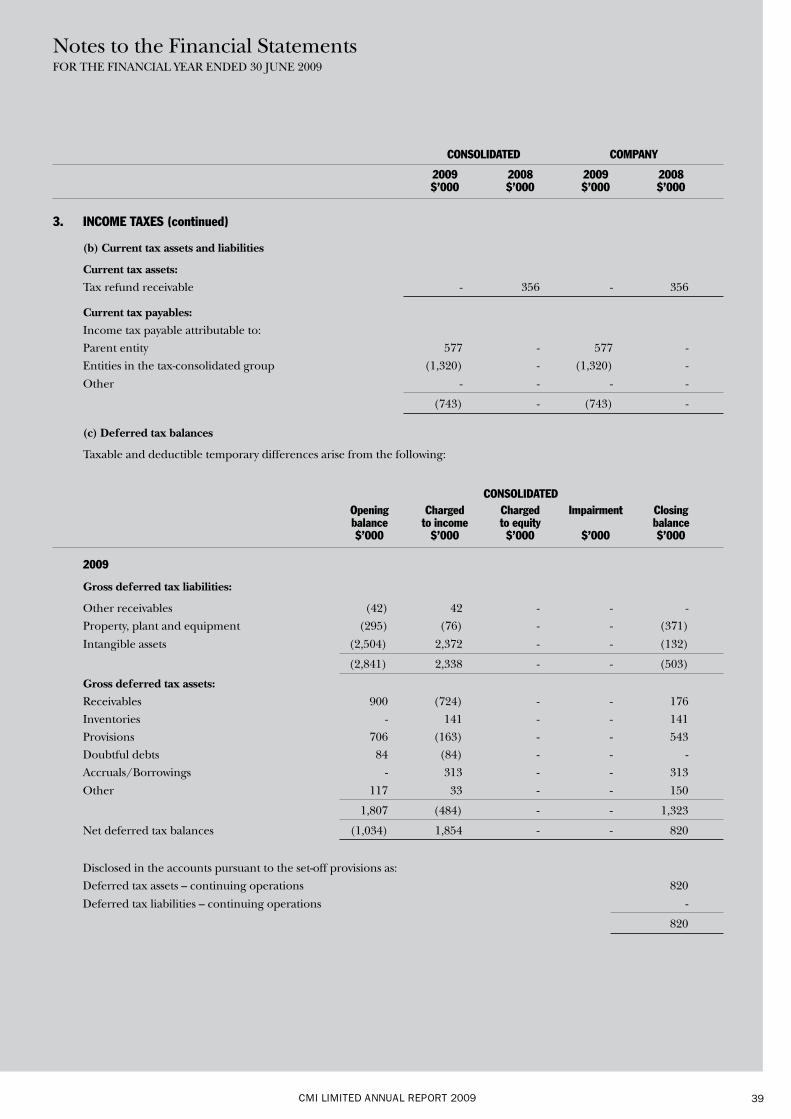
CMI LIMITED ANNUAL REPORT 2009 39
CONSOLIDATED COMPANY
2009 2008 2009 2008 $’000 $’000 $’000 $’000
3. INCOME TAXES (continued)
(b) Current tax assets and liabilities
Current tax assets:
Tax refund receivable - 356 - 356
Current tax payables:
Income tax payable attributable to:
Parent entity 577 - 577 -
Entities in the tax-consolidated group (1,320) - (1,320) -
Other - - - -
(743) - (743) -
(c) Deferred tax balances
Taxable and deductible temporary differences arise from the following:
CONSOLIDATED Opening Charged Charged Impairment Closing balance to income to equity balance $’000 $’000 $’000 $’000 $’000
2009
Gross deferred tax liabilities:
Other receivables (42) 42 - - -
Property, plant and equipment (295) (76) - - (371)
Intangible assets (2,504) 2,372 - - (132)
(2,841) 2,338 - - (503)
Gross deferred tax assets:
Receivables 900 (724) - - 176
Inventories - 141 - - 141
Provisions 706 (163) - - 543
Doubtful debts 84 (84) - - -
Accruals/Borrowings - 313 - - 313
Other 117 33 - - 150
1,807 (484) - - 1,323
Net deferred tax balances (1,034) 1,854 - - 820
Disclosed in the accounts pursuant to the set-off provisions as:
Deferred tax assets – continuing operations 820
Deferred tax liabilities – continuing operations -
820
Notes to the Financial StatementsFOR THE FINANCIAL YEAR ENDED 30 JUNE 2009
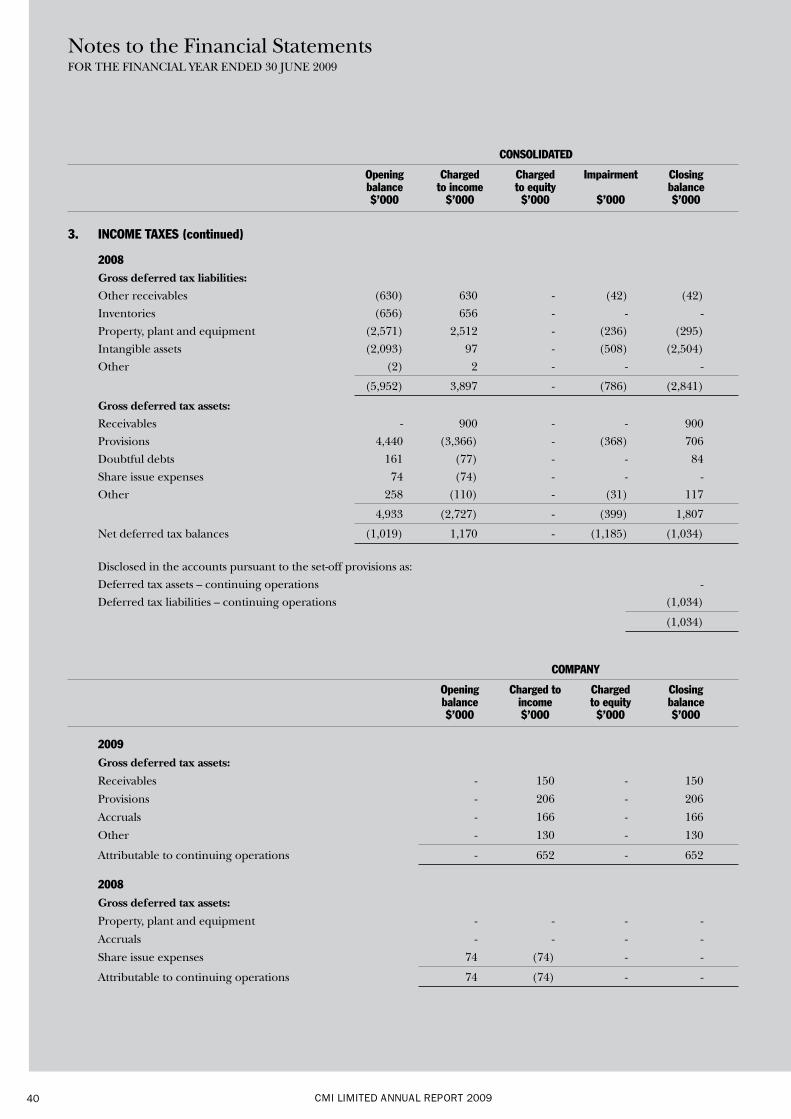
CMI LIMITED ANNUAL REPORT 200940
CONSOLIDATED
Opening Charged Charged Impairment Closing balance to income to equity balance $’000 $’000 $’000 $’000 $’000
3. INCOME TAXES (continued)
2008 Gross deferred tax liabilities:
Other receivables (630) 630 - (42) (42)
Inventories (656) 656 - - -
Property, plant and equipment (2,571) 2,512 - (236) (295)
Intangible assets (2,093) 97 - (508) (2,504)
Other (2) 2 - - -
(5,952) 3,897 - (786) (2,841)
Gross deferred tax assets:
Receivables - 900 - - 900
Provisions 4,440 (3,366) - (368) 706
Doubtful debts 161 (77) - - 84
Share issue expenses 74 (74) - - -
Other 258 (110) - (31) 117
4,933 (2,727) - (399) 1,807
Net deferred tax balances (1,019) 1,170 - (1,185) (1,034)
Disclosed in the accounts pursuant to the set-off provisions as:
Deferred tax assets – continuing operations -
Deferred tax liabilities – continuing operations (1,034)
(1,034)
COMPANY
Opening Charged to Charged Closing balance income to equity balance $’000 $’000 $’000 $’000
2009
Gross deferred tax assets:
Receivables - 150 - 150
Provisions - 206 - 206
Accruals - 166 - 166
Other - 130 - 130
Attributable to continuing operations - 652 - 652
2008
Gross deferred tax assets:
Property, plant and equipment - - - -
Accruals - - - -
Share issue expenses 74 (74) - -
Attributable to continuing operations 74 (74) - -
Notes to the Financial StatementsFOR THE FINANCIAL YEAR ENDED 30 JUNE 2009
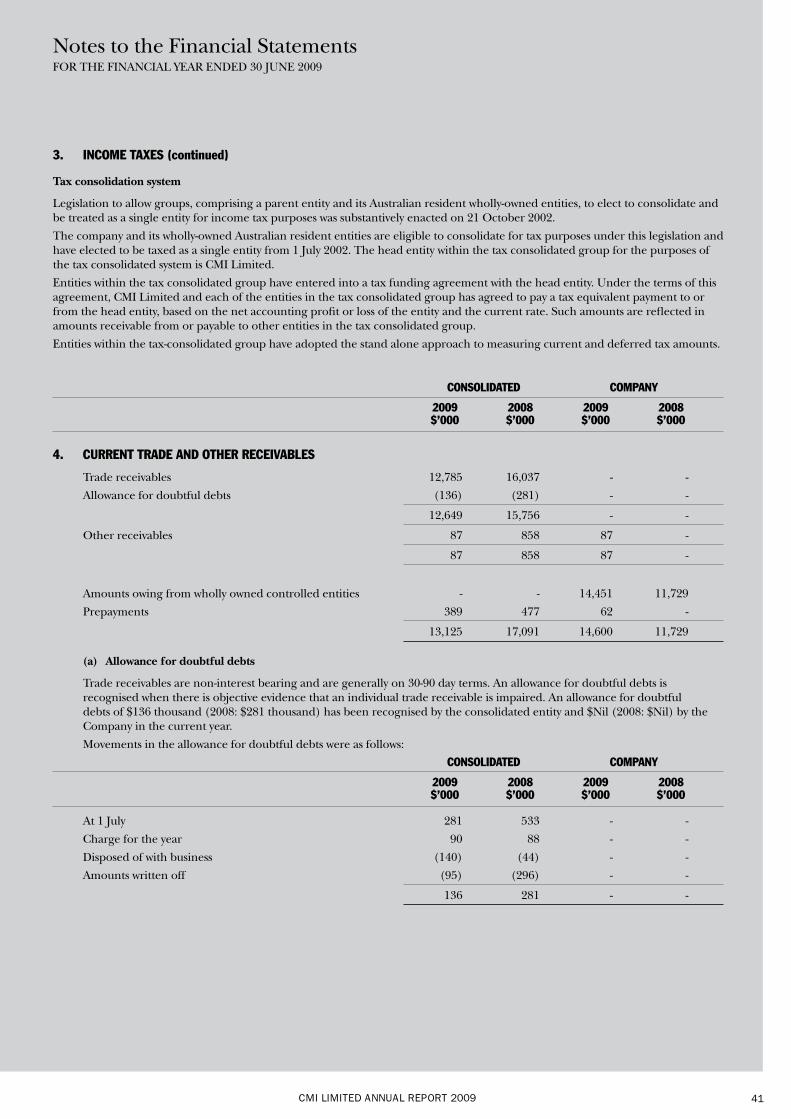
CMI LIMITED ANNUAL REPORT 2009 41
3. INCOME TAXES (continued)
Tax consolidation system
Legislation to allow groups, comprising a parent entity and its Australian resident wholly-owned entities, to elect to consolidate and be treated as a single entity for income tax purposes was substantively enacted on 21 October 2002.
The company and its wholly-owned Australian resident entities are eligible to consolidate for tax purposes under this legislation and have elected to be taxed as a single entity from 1 July 2002. The head entity within the tax consolidated group for the purposes of the tax consolidated system is CMI Limited.
Entities within the tax consolidated group have entered into a tax funding agreement with the head entity. Under the terms of this agreement, CMI Limited and each of the entities in the tax consolidated group has agreed to pay a tax equivalent payment to or from the head entity, based on the net accounting profit or loss of the entity and the current rate. Such amounts are reflected in amounts receivable from or payable to other entities in the tax consolidated group.
Entities within the tax-consolidated group have adopted the stand alone approach to measuring current and deferred tax amounts.
CONSOLIDATED COMPANY
2009 2008 2009 2008 $’000 $’000 $’000 $’000
4. CURRENT TRADE AND OTHER RECEIVABLES
Trade receivables 12,785 16,037 - -
Allowance for doubtful debts (136) (281) - -
12,649 15,756 - -
Other receivables 87 858 87 -
87 858 87 -
Amounts owing from wholly owned controlled entities - - 14,451 11,729
Prepayments 389 477 62 -
13,125 17,091 14,600 11,729
(a) Allowance for doubtful debts
Trade receivables are non-interest bearing and are generally on 30-90 day terms. An allowance for doubtful debts is recognised when there is objective evidence that an individual trade receivable is impaired. An allowance for doubtful debts of $136 thousand (2008: $281 thousand) has been recognised by the consolidated entity and $Nil (2008: $Nil) by the Company in the current year.
Movements in the allowance for doubtful debts were as follows:
CONSOLIDATED COMPANY
2009 2008 2009 2008 $’000 $’000 $’000 $’000
At 1 July 281 533 - -
Charge for the year 90 88 - -
Disposed of with business (140) (44) - -
Amounts written off (95) (296) - -
136 281 - -
Notes to the Financial StatementsFOR THE FINANCIAL YEAR ENDED 30 JUNE 2009
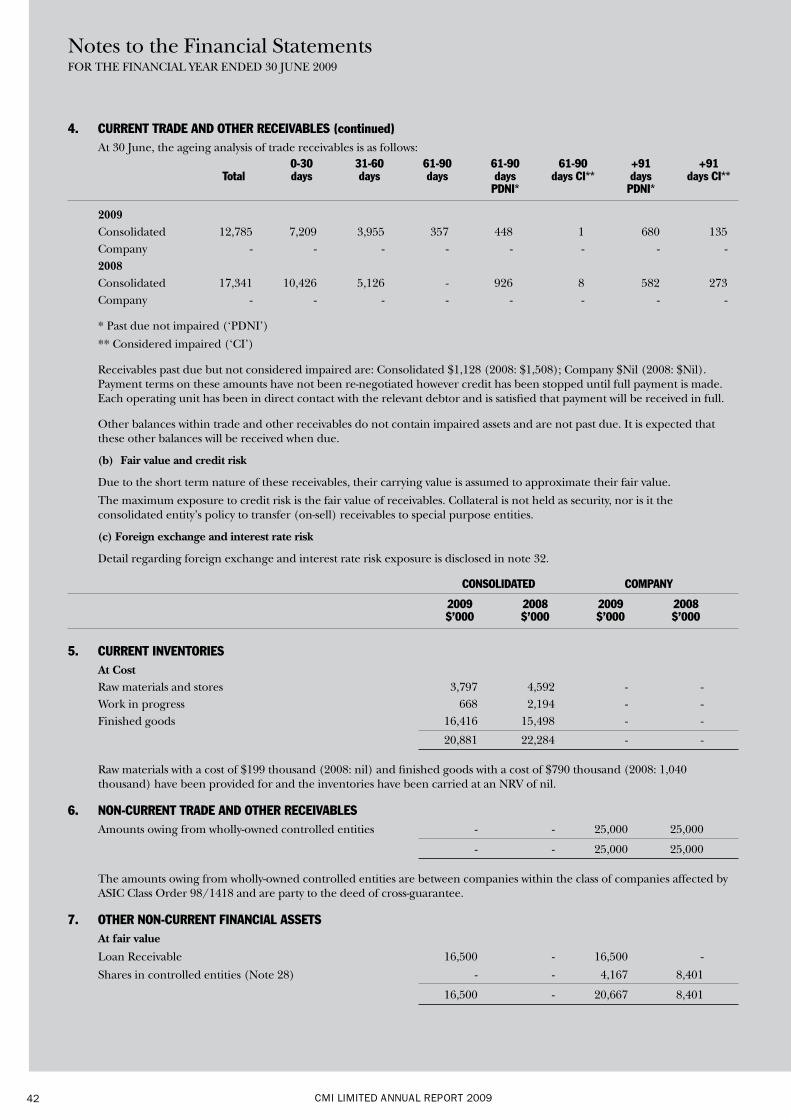
CMI LIMITED ANNUAL REPORT 200942
4. CURRENT TRADE AND OTHER RECEIVABLES (continued) At 30 June, the ageing analysis of trade receivables is as follows: 0-30 31-60 61-90 61-90 61-90 +91 +91 Total days days days days days CI** days days CI** PDNI* PDNI*
2009 Consolidated 12,785 7,209 3,955 357 448 1 680 135 Company - - - - - - - - 2008 Consolidated 17,341 10,426 5,126 - 926 8 582 273 Company - - - - - - - -
* Past due not impaired (‘PDNI’)
** Considered impaired (‘CI’)
Receivables past due but not considered impaired are: Consolidated $1,128 (2008: $1,508); Company $Nil (2008: $Nil). Payment terms on these amounts have not been re-negotiated however credit has been stopped until full payment is made. Each operating unit has been in direct contact with the relevant debtor and is satisfied that payment will be received in full.
Other balances within trade and other receivables do not contain impaired assets and are not past due. It is expected that these other balances will be received when due.
(b) Fair value and credit risk
Due to the short term nature of these receivables, their carrying value is assumed to approximate their fair value.
The maximum exposure to credit risk is the fair value of receivables. Collateral is not held as security, nor is it the consolidated entity’s policy to transfer (on-sell) receivables to special purpose entities.
(c) Foreign exchange and interest rate risk
Detail regarding foreign exchange and interest rate risk exposure is disclosed in note 32.
CONSOLIDATED COMPANY
2009 2008 2009 2008 $’000 $’000 $’000 $’000
5. CURRENT INVENTORIES At Cost Raw materials and stores 3,797 4,592 - - Work in progress 668 2,194 - - Finished goods 16,416 15,498 - -
20,881 22,284 - -
Raw materials with a cost of $199 thousand (2008: nil) and finished goods with a cost of $790 thousand (2008: 1,040 thousand) have been provided for and the inventories have been carried at an NRV of nil.
6. NON-CURRENT TRADE AND OTHER RECEIVABLES Amounts owing from wholly-owned controlled entities - - 25,000 25,000
- - 25,000 25,000
The amounts owing from wholly-owned controlled entities are between companies within the class of companies affected by ASIC Class Order 98/1418 and are party to the deed of cross-guarantee.
7. OTHER NON-CURRENT FINANCIAL ASSETS At fair value
Loan Receivable 16,500 - 16,500 -
Shares in controlled entities (Note 28) - - 4,167 8,401
16,500 - 20,667 8,401
Notes to the Financial StatementsFOR THE FINANCIAL YEAR ENDED 30 JUNE 2009
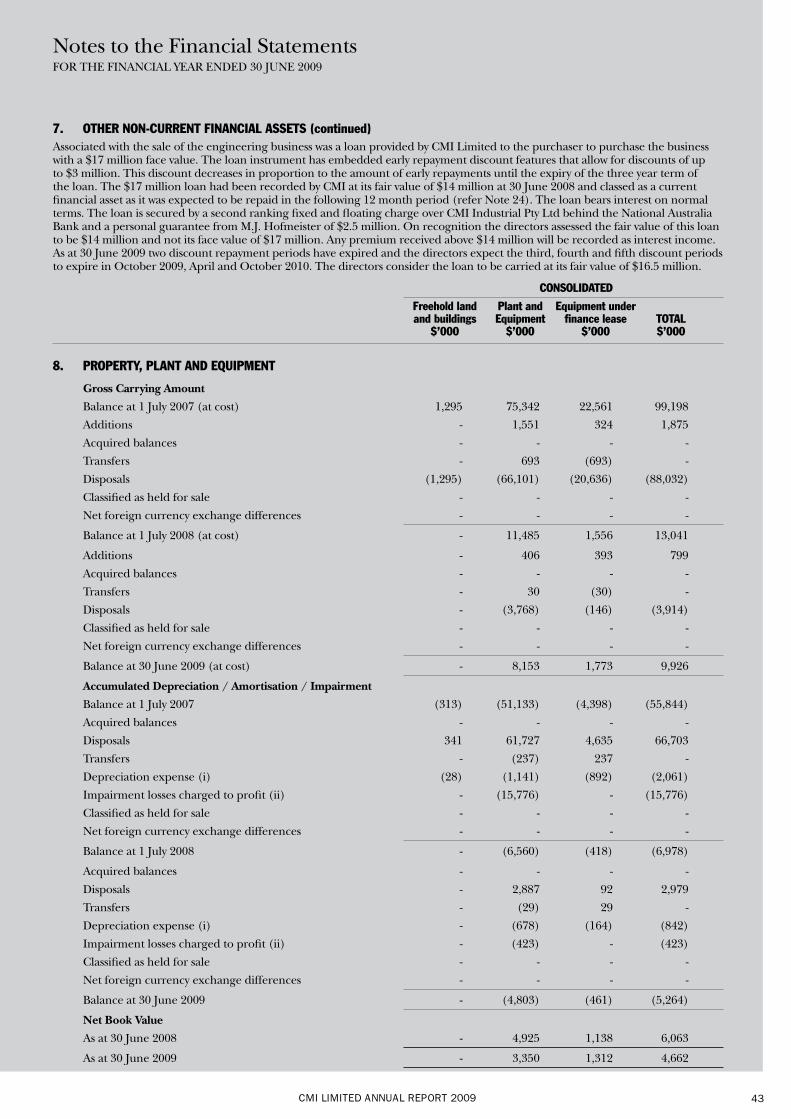
CMI LIMITED ANNUAL REPORT 2009 43
Associated with the sale of the engineering business was a loan provided by CMI Limited to the purchaser to purchase the business with a $17 million face value. The loan instrument has embedded early repayment discount features that allow for discounts of up to $3 million. This discount decreases in proportion to the amount of early repayments until the expiry of the three year term of the loan. The $17 million loan had been recorded by CMI at its fair value of $14 million at 30 June 2008 and classed as a current financial asset as it was expected to be repaid in the following 12 month period (refer Note 24). The loan bears interest on normal terms. The loan is secured by a second ranking fixed and floating charge over CMI Industrial Pty Ltd behind the National Australia Bank and a personal guarantee from M.J. Hofmeister of $2.5 million. On recognition the directors assessed the fair value of this loan to be $14 million and not its face value of $17 million. Any premium received above $14 million will be recorded as interest income. As at 30 June 2009 two discount repayment periods have expired and the directors expect the third, fourth and fifth discount periods to expire in October 2009, April and October 2010. The directors consider the loan to be carried at its fair value of $16.5 million.
CONSOLIDATED
Freehold land Plant and Equipment under and buildings Equipment finance lease TOTAL $’000 $’000 $’000 $’000
8. PROPERTY, PLANT AND EQUIPMENT
Gross Carrying Amount
Balance at 1 July 2007 (at cost) 1,295 75,342 22,561 99,198
Additions - 1,551 324 1,875
Acquired balances - - - -
Transfers - 693 (693) -
Disposals (1,295) (66,101) (20,636) (88,032)
Classified as held for sale - - - -
Net foreign currency exchange differences - - - -
Balance at 1 July 2008 (at cost) - 11,485 1,556 13,041
Additions - 406 393 799
Acquired balances - - - -
Transfers - 30 (30) -
Disposals - (3,768) (146) (3,914)
Classified as held for sale - - - -
Net foreign currency exchange differences - - - -
Balance at 30 June 2009 (at cost) - 8,153 1,773 9,926
Accumulated Depreciation / Amortisation / Impairment
Balance at 1 July 2007 (313) (51,133) (4,398) (55,844)
Acquired balances - - - -
Disposals 341 61,727 4,635 66,703
Transfers - (237) 237 -
Depreciation expense (i) (28) (1,141) (892) (2,061)
Impairment losses charged to profit (ii) - (15,776) - (15,776)
Classified as held for sale - - - -
Net foreign currency exchange differences - - - -
Balance at 1 July 2008 - (6,560) (418) (6,978)
Acquired balances - - - -
Disposals - 2,887 92 2,979
Transfers - (29) 29 -
Depreciation expense (i) - (678) (164) (842)
Impairment losses charged to profit (ii) - (423) - (423)
Classified as held for sale - - - -
Net foreign currency exchange differences - - - -
Balance at 30 June 2009 - (4,803) (461) (5,264)
Net Book Value
As at 30 June 2008 - 4,925 1,138 6,063
As at 30 June 2009 - 3,350 1,312 4,662
Notes to the Financial StatementsFOR THE FINANCIAL YEAR ENDED 30 JUNE 2009
7. OTHER NON-CURRENT FINANCIAL ASSETS (continued)
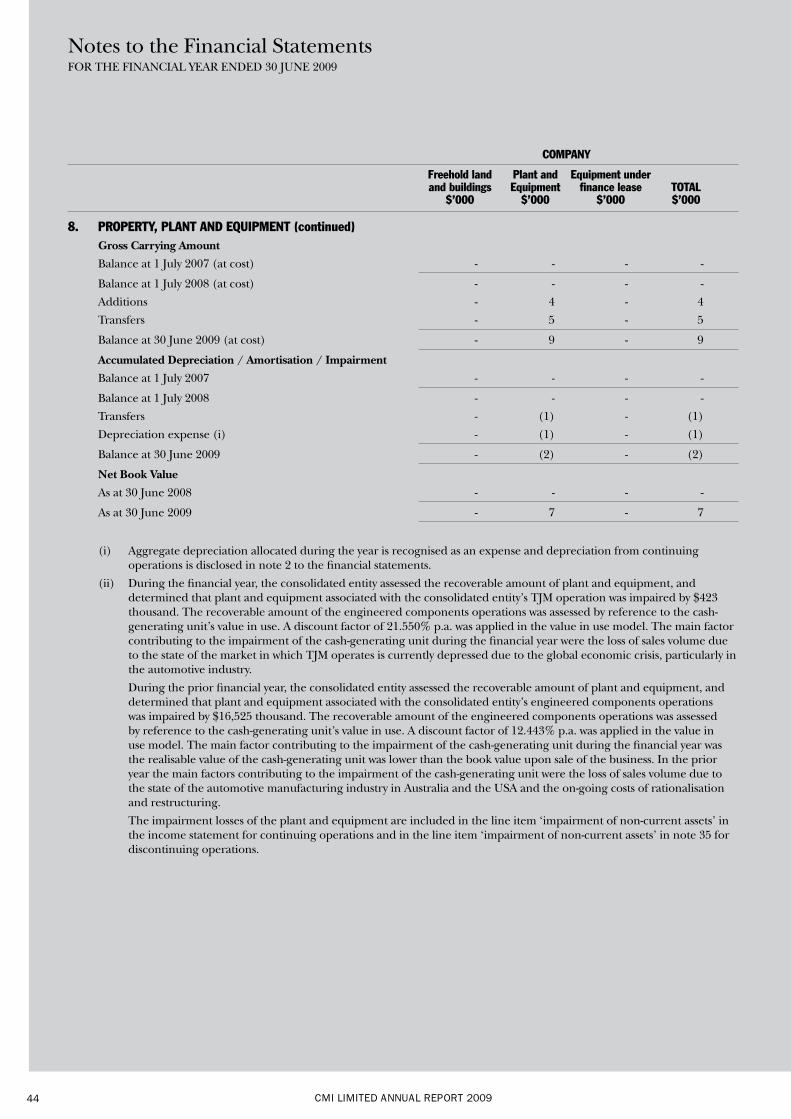
CMI LIMITED ANNUAL REPORT 200944
COMPANY
Freehold land Plant and Equipment under and buildings Equipment finance lease TOTAL $’000 $’000 $’000 $’000
8. PROPERTY, PLANT AND EQUIPMENT (continued) Gross Carrying Amount
Balance at 1 July 2007 (at cost) - - - -
Balance at 1 July 2008 (at cost) - - - -
Additions - 4 - 4
Transfers - 5 - 5
Balance at 30 June 2009 (at cost) - 9 - 9
Accumulated Depreciation / Amortisation / Impairment
Balance at 1 July 2007 - - - -
Balance at 1 July 2008 - - - -
Transfers - (1) - (1)
Depreciation expense (i) - (1) - (1)
Balance at 30 June 2009 - (2) - (2)
Net Book Value
As at 30 June 2008 - - - -
As at 30 June 2009 - 7 - 7
(i) Aggregate depreciation allocated during the year is recognised as an expense and depreciation from continuing operations is disclosed in note 2 to the financial statements.
(ii) During the financial year, the consolidated entity assessed the recoverable amount of plant and equipment, and determined that plant and equipment associated with the consolidated entity’s TJM operation was impaired by $423 thousand. The recoverable amount of the engineered components operations was assessed by reference to the cash-generating unit’s value in use. A discount factor of 21.550% p.a. was applied in the value in use model. The main factor contributing to the impairment of the cash-generating unit during the financial year were the loss of sales volume due to the state of the market in which TJM operates is currently depressed due to the global economic crisis, particularly in the automotive industry.
During the prior financial year, the consolidated entity assessed the recoverable amount of plant and equipment, and determined that plant and equipment associated with the consolidated entity’s engineered components operations was impaired by $16,525 thousand. The recoverable amount of the engineered components operations was assessed by reference to the cash-generating unit’s value in use. A discount factor of 12.443% p.a. was applied in the value in use model. The main factor contributing to the impairment of the cash-generating unit during the financial year was the realisable value of the cash-generating unit was lower than the book value upon sale of the business. In the prior year the main factors contributing to the impairment of the cash-generating unit were the loss of sales volume due to the state of the automotive manufacturing industry in Australia and the USA and the on-going costs of rationalisation and restructuring.
The impairment losses of the plant and equipment are included in the line item ‘impairment of non-current assets’ in the income statement for continuing operations and in the line item ‘impairment of non-current assets’ in note 35 for discontinuing operations.
Notes to the Financial StatementsFOR THE FINANCIAL YEAR ENDED 30 JUNE 2009
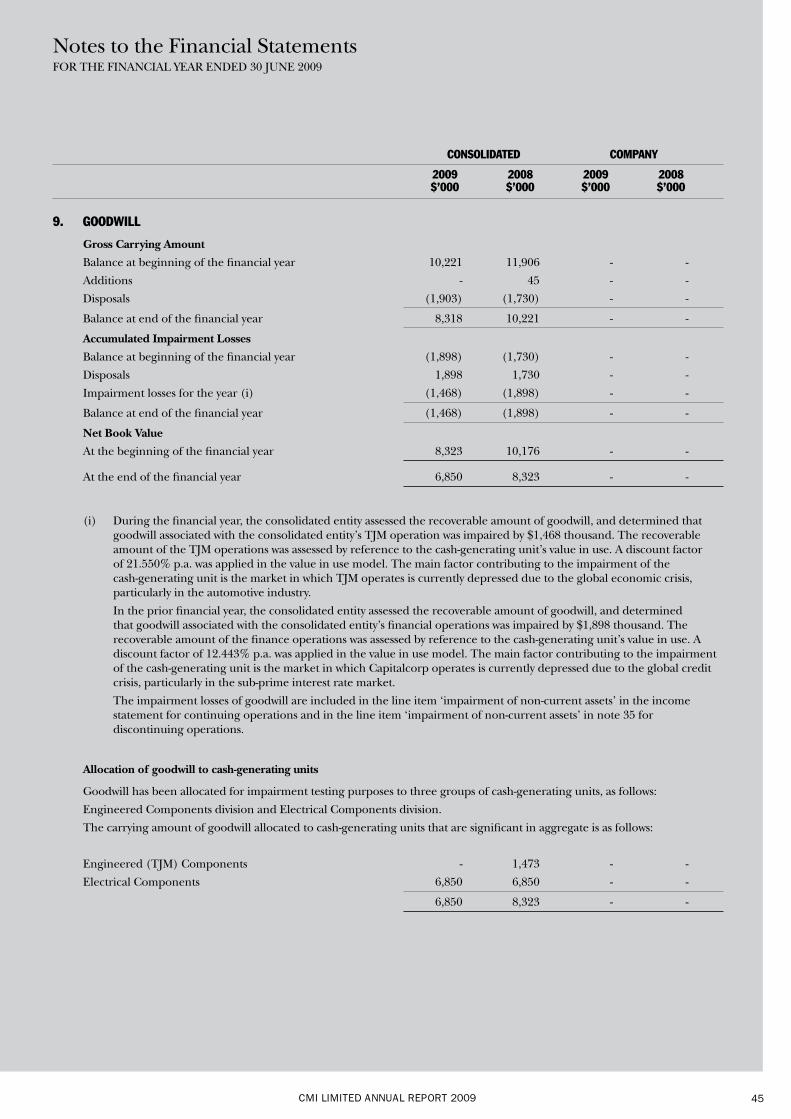
CMI LIMITED ANNUAL REPORT 2009 45
CONSOLIDATED COMPANY
2009 2008 2009 2008 $’000 $’000 $’000 $’000
9. GOODWILL
Gross Carrying Amount
Balance at beginning of the financial year 10,221 11,906 - -
Additions - 45 - -
Disposals (1,903) (1,730) - -
Balance at end of the financial year 8,318 10,221 - -
Accumulated Impairment Losses
Balance at beginning of the financial year (1,898) (1,730) - -
Disposals 1,898 1,730 - -
Impairment losses for the year (i) (1,468) (1,898) - -
Balance at end of the financial year (1,468) (1,898) - -
Net Book Value
At the beginning of the financial year 8,323 10,176 - -
At the end of the financial year 6,850 8,323 - -
(i) During the financial year, the consolidated entity assessed the recoverable amount of goodwill, and determined that goodwill associated with the consolidated entity’s TJM operation was impaired by $1,468 thousand. The recoverable amount of the TJM operations was assessed by reference to the cash-generating unit’s value in use. A discount factor of 21.550% p.a. was applied in the value in use model. The main factor contributing to the impairment of the cash-generating unit is the market in which TJM operates is currently depressed due to the global economic crisis, particularly in the automotive industry.
In the prior financial year, the consolidated entity assessed the recoverable amount of goodwill, and determined that goodwill associated with the consolidated entity’s financial operations was impaired by $1,898 thousand. The recoverable amount of the finance operations was assessed by reference to the cash-generating unit’s value in use. A discount factor of 12.443% p.a. was applied in the value in use model. The main factor contributing to the impairment of the cash-generating unit is the market in which Capitalcorp operates is currently depressed due to the global credit crisis, particularly in the sub-prime interest rate market.
The impairment losses of goodwill are included in the line item ‘impairment of non-current assets’ in the income statement for continuing operations and in the line item ‘impairment of non-current assets’ in note 35 for discontinuing operations.
Allocation of goodwill to cash-generating units
Goodwill has been allocated for impairment testing purposes to three groups of cash-generating units, as follows:
Engineered Components division and Electrical Components division.
The carrying amount of goodwill allocated to cash-generating units that are significant in aggregate is as follows:
Engineered (TJM) Components - 1,473 - -
Electrical Components 6,850 6,850 - -
6,850 8,323 - -
Notes to the Financial StatementsFOR THE FINANCIAL YEAR ENDED 30 JUNE 2009
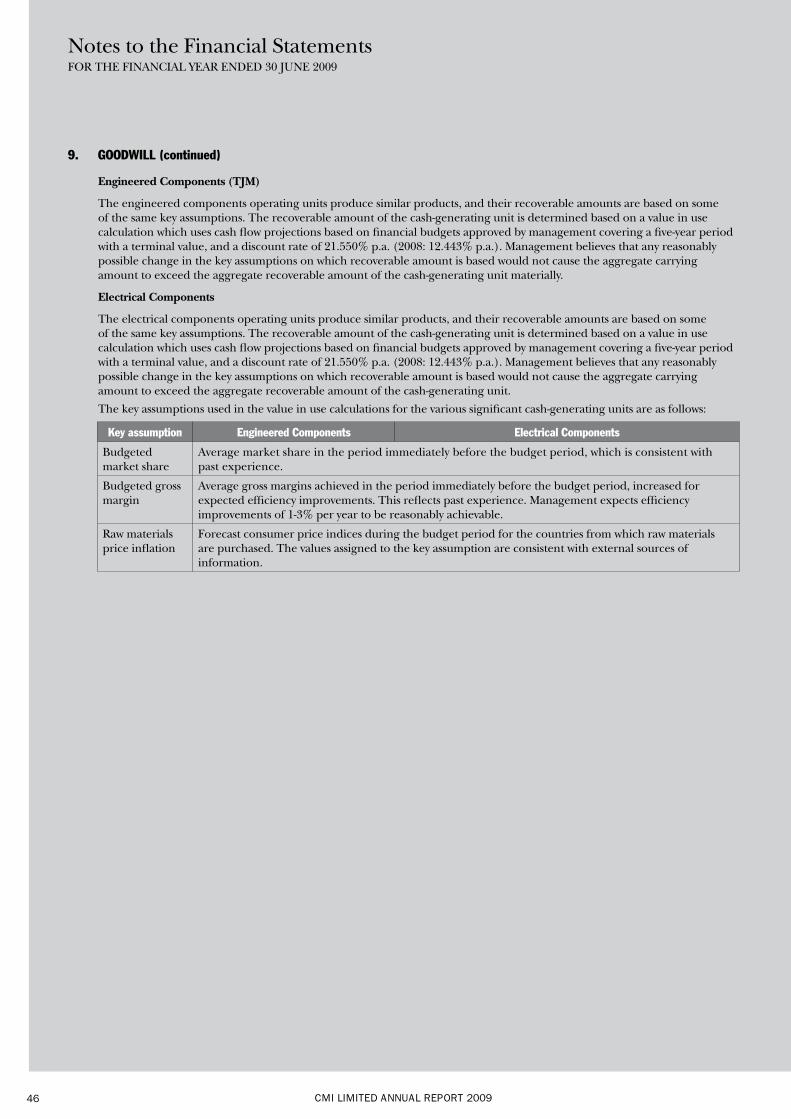
CMI LIMITED ANNUAL REPORT 200946
9. GOODWILL (continued)
Engineered Components (TJM)
The engineered components operating units produce similar products, and their recoverable amounts are based on some of the same key assumptions. The recoverable amount of the cash-generating unit is determined based on a value in use calculation which uses cash flow projections based on financial budgets approved by management covering a five-year period with a terminal value, and a discount rate of 21.550% p.a. (2008: 12.443% p.a.). Management believes that any reasonably possible change in the key assumptions on which recoverable amount is based would not cause the aggregate carrying amount to exceed the aggregate recoverable amount of the cash-generating unit materially.
Electrical Components
The electrical components operating units produce similar products, and their recoverable amounts are based on some of the same key assumptions. The recoverable amount of the cash-generating unit is determined based on a value in use calculation which uses cash flow projections based on financial budgets approved by management covering a five-year period with a terminal value, and a discount rate of 21.550% p.a. (2008: 12.443% p.a.). Management believes that any reasonably possible change in the key assumptions on which recoverable amount is based would not cause the aggregate carrying amount to exceed the aggregate recoverable amount of the cash-generating unit.
The key assumptions used in the value in use calculations for the various significant cash-generating units are as follows:
Key assumption Engineered Components Electrical Components
Budgeted market share
Average market share in the period immediately before the budget period, which is consistent with past experience.
Budgeted gross margin
Average gross margins achieved in the period immediately before the budget period, increased for expected efficiency improvements. This reflects past experience. Management expects efficiency improvements of 1-3% per year to be reasonably achievable.
Raw materials price inflation
Forecast consumer price indices during the budget period for the countries from which raw materials are purchased. The values assigned to the key assumption are consistent with external sources of information.
Notes to the Financial StatementsFOR THE FINANCIAL YEAR ENDED 30 JUNE 2009
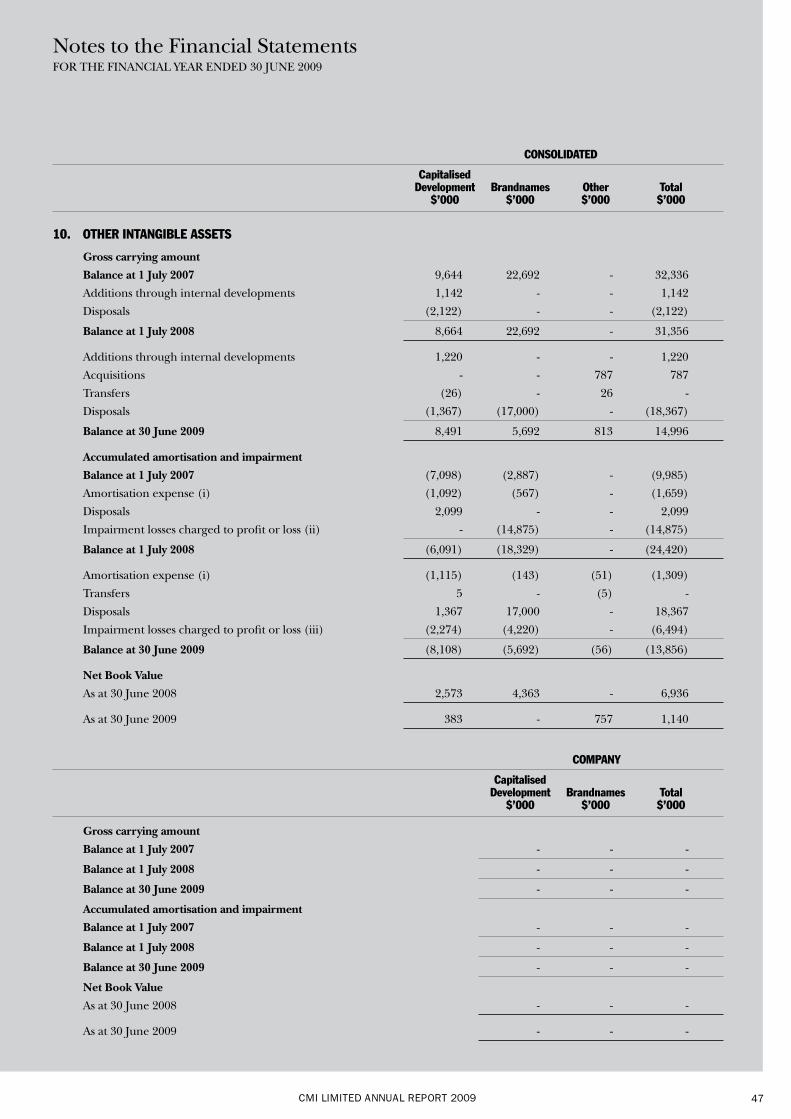
CMI LIMITED ANNUAL REPORT 2009 47
CONSOLIDATED
Capitalised Development Brandnames Other Total $’000 $’000 $’000 $’000
10. OTHER INTANGIBLE ASSETS
Gross carrying amount
Balance at 1 July 2007 9,644 22,692 - 32,336
Additions through internal developments 1,142 - - 1,142
Disposals (2,122) - - (2,122)
Balance at 1 July 2008 8,664 22,692 - 31,356
Additions through internal developments 1,220 - - 1,220
Acquisitions - - 787 787
Transfers (26) - 26 -
Disposals (1,367) (17,000) - (18,367)
Balance at 30 June 2009 8,491 5,692 813 14,996
Accumulated amortisation and impairment
Balance at 1 July 2007 (7,098) (2,887) - (9,985)
Amortisation expense (i) (1,092) (567) - (1,659)
Disposals 2,099 - - 2,099
Impairment losses charged to profit or loss (ii) - (14,875) - (14,875)
Balance at 1 July 2008 (6,091) (18,329) - (24,420)
Amortisation expense (i) (1,115) (143) (51) (1,309)
Transfers 5 - (5) -
Disposals 1,367 17,000 - 18,367
Impairment losses charged to profit or loss (iii) (2,274) (4,220) - (6,494)
Balance at 30 June 2009 (8,108) (5,692) (56) (13,856)
Net Book Value
As at 30 June 2008 2,573 4,363 - 6,936
As at 30 June 2009 383 - 757 1,140
COMPANY
Capitalised Development Brandnames Total $’000 $’000 $’000
Gross carrying amount
Balance at 1 July 2007 - - -
Balance at 1 July 2008 - - -
Balance at 30 June 2009 - - -
Accumulated amortisation and impairment
Balance at 1 July 2007 - - -
Balance at 1 July 2008 - - -
Balance at 30 June 2009 - - -
Net Book Value
As at 30 June 2008 - - -
As at 30 June 2009 - - -
Notes to the Financial StatementsFOR THE FINANCIAL YEAR ENDED 30 JUNE 2009
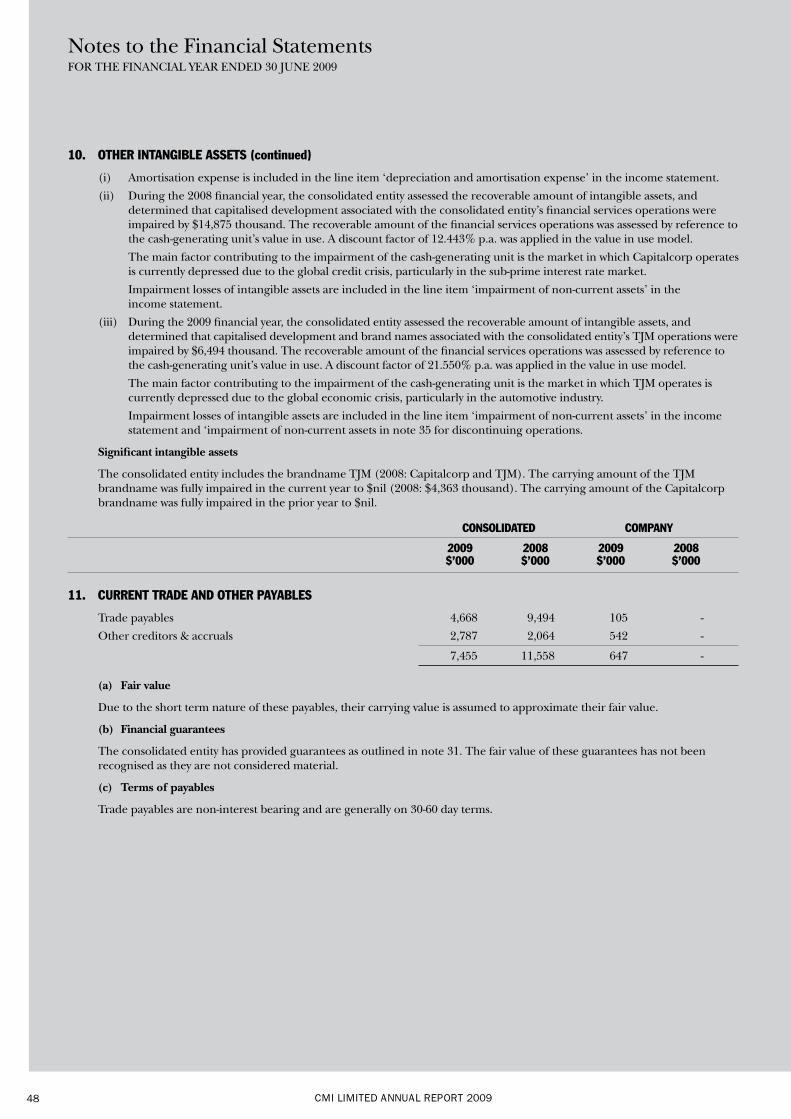
CMI LIMITED ANNUAL REPORT 200948
10. OTHER INTANGIBLE ASSETS (continued)
(i) Amortisation expense is included in the line item ‘depreciation and amortisation expense’ in the income statement.
(ii) During the 2008 financial year, the consolidated entity assessed the recoverable amount of intangible assets, and determined that capitalised development associated with the consolidated entity’s financial services operations were impaired by $14,875 thousand. The recoverable amount of the financial services operations was assessed by reference to the cash-generating unit’s value in use. A discount factor of 12.443% p.a. was applied in the value in use model.
The main factor contributing to the impairment of the cash-generating unit is the market in which Capitalcorp operates is currently depressed due to the global credit crisis, particularly in the sub-prime interest rate market.
Impairment losses of intangible assets are included in the line item ‘impairment of non-current assets’ in the income statement.
(iii) During the 2009 financial year, the consolidated entity assessed the recoverable amount of intangible assets, and determined that capitalised development and brand names associated with the consolidated entity’s TJM operations were impaired by $6,494 thousand. The recoverable amount of the financial services operations was assessed by reference to the cash-generating unit’s value in use. A discount factor of 21.550% p.a. was applied in the value in use model.
The main factor contributing to the impairment of the cash-generating unit is the market in which TJM operates is currently depressed due to the global economic crisis, particularly in the automotive industry.
Impairment losses of intangible assets are included in the line item ‘impairment of non-current assets’ in the income statement and ‘impairment of non-current assets in note 35 for discontinuing operations.
Significant intangible assets
The consolidated entity includes the brandname TJM (2008: Capitalcorp and TJM). The carrying amount of the TJM brandname was fully impaired in the current year to $nil (2008: $4,363 thousand). The carrying amount of the Capitalcorp brandname was fully impaired in the prior year to $nil.
CONSOLIDATED COMPANY
2009 2008 2009 2008 $’000 $’000 $’000 $’000
11. CURRENT TRADE AND OTHER PAYABLES
Trade payables 4,668 9,494 105 -
Other creditors & accruals 2,787 2,064 542 -
7,455 11,558 647 -
(a) Fair value
Due to the short term nature of these payables, their carrying value is assumed to approximate their fair value.
(b) Financial guarantees
The consolidated entity has provided guarantees as outlined in note 31. The fair value of these guarantees has not been recognised as they are not considered material.
(c) Terms of payables
Trade payables are non-interest bearing and are generally on 30-60 day terms.
Notes to the Financial StatementsFOR THE FINANCIAL YEAR ENDED 30 JUNE 2009

CMI LIMITED ANNUAL REPORT 2009 49
CONSOLIDATED COMPANY
2009 2008 2009 2008 $’000 $’000 $’000 $’000
12. CURRENT BORROWINGS
Unsecured
At amortised cost:
Other loans from other entities 49 - 49 -
Amounts owing to wholly-owned controlled entities - - - 5,458
49 - 49 5,458
Secured
At amortised cost:
Bank Overdraft (i) - 278 - -
Finance Lease Liabilities (ii) (Note 17) 441 347 - -
441 625 - -
490 625 49 5,458
(i) Secured by a fixed and floating charge over the assets and undertaking of the consolidated entity.
(ii) Secured over the assets leased; part of a $3.85 million lease facility (2008: $4 million).
(a) Fair values
Due to the short term nature of these payables, their carrying value is assumed to approximate their fair value.
(b) Interest rate, foreign exchange and liquidity risk
Details regarding interest rate, foreign exchange and liquidity risk is disclosed in Note 32.
(c) Assets pledged as security
The carrying amounts of assets pledged as security for current and non-current interest bearing liabilities are:
CONSOLIDATED COMPANY
2009 2008 2009 2008 $’000 $’000 $’000 $’000
Bills of exchange - Fixed and Floating 64,008 80,072 - -
Bank loans – Specific charge - 278 - -
Leased asset charges 1,312 1,138 - -
Total assets pledged as security 65,320 81,488 - -
The specific terms and conditions related to the above pledges include repayment requirements, security undertakings and quarterly reporting on bank covenants relating to financial charges cover, capital adequacy, operating leverage and dividend payout ratio.
(d) Set-off assets and liabilities
The Consolidated entity has no set-off rights apart from cash as detailed in Note 30(a).
(e) Defaults and breaches
During the current year the consolidated entity was in breach of its borrowing covenants on bank financial liabilities, in particular financial charges cover and operating leverage ratio, due to the impairment expense of the TJM division and a loan to discontinuing operations of finance division. The consolidated entity received a waiver of these breaches from its bankers prior to 30 June 2009.
During the prior year the consolidated entity was in breach of its borrowing covenants on bank financial liabilities, in particular financial charges cover and operating leverage ratio, due to the impairment expense of the discontinuing operations of engineering and finance division. The consolidated entity received a waiver of these breaches from its bankers prior to 30 June 2008.
Notes to the Financial StatementsFOR THE FINANCIAL YEAR ENDED 30 JUNE 2009
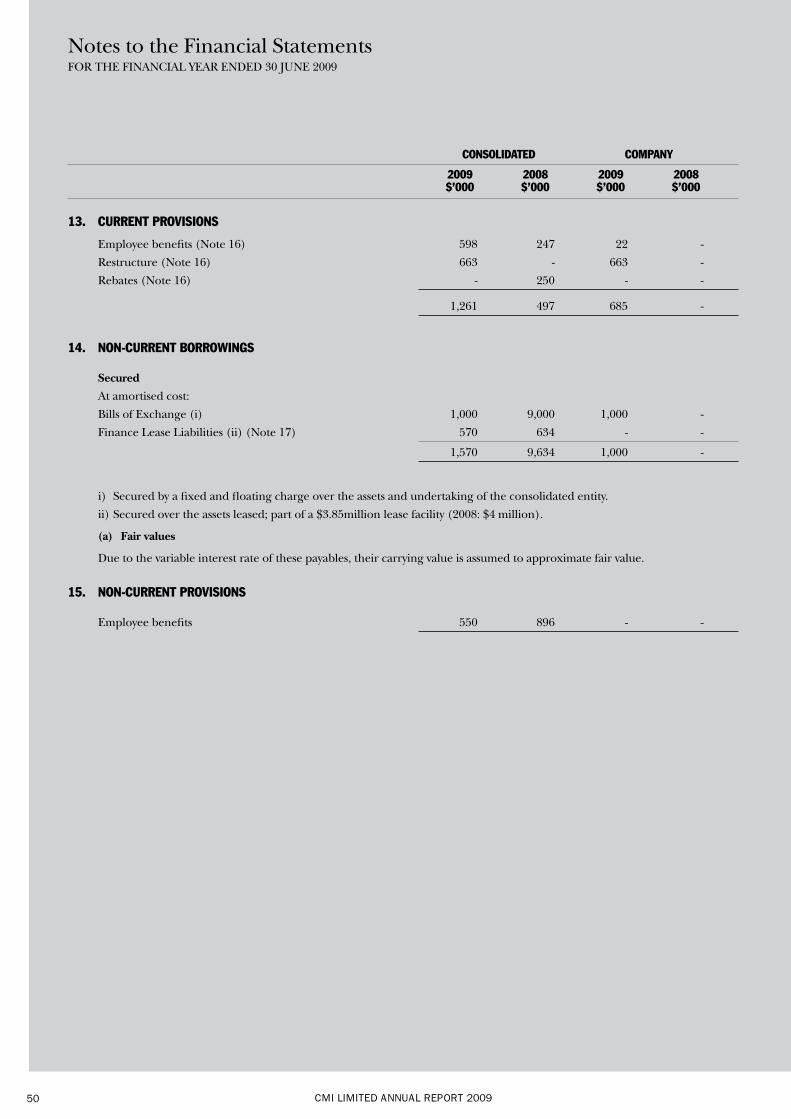
CMI LIMITED ANNUAL REPORT 200950
CONSOLIDATED COMPANY
2009 2008 2009 2008 $’000 $’000 $’000 $’000
13. CURRENT PROVISIONS
Employee benefits (Note 16) 598 247 22 -
Restructure (Note 16) 663 - 663 -
Rebates (Note 16) - 250 - -
1,261 497 685 -
14. NON-CURRENT BORROWINGS
Secured
At amortised cost:
Bills of Exchange (i) 1,000 9,000 1,000 -
Finance Lease Liabilities (ii) (Note 17) 570 634 - -
1,570 9,634 1,000 -
i) Secured by a fixed and floating charge over the assets and undertaking of the consolidated entity.
ii) Secured over the assets leased; part of a $3.85million lease facility (2008: $4 million).
(a) Fair values
Due to the variable interest rate of these payables, their carrying value is assumed to approximate fair value.
15. NON-CURRENT PROVISIONS
Employee benefits 550 896 - -
Notes to the Financial StatementsFOR THE FINANCIAL YEAR ENDED 30 JUNE 2009
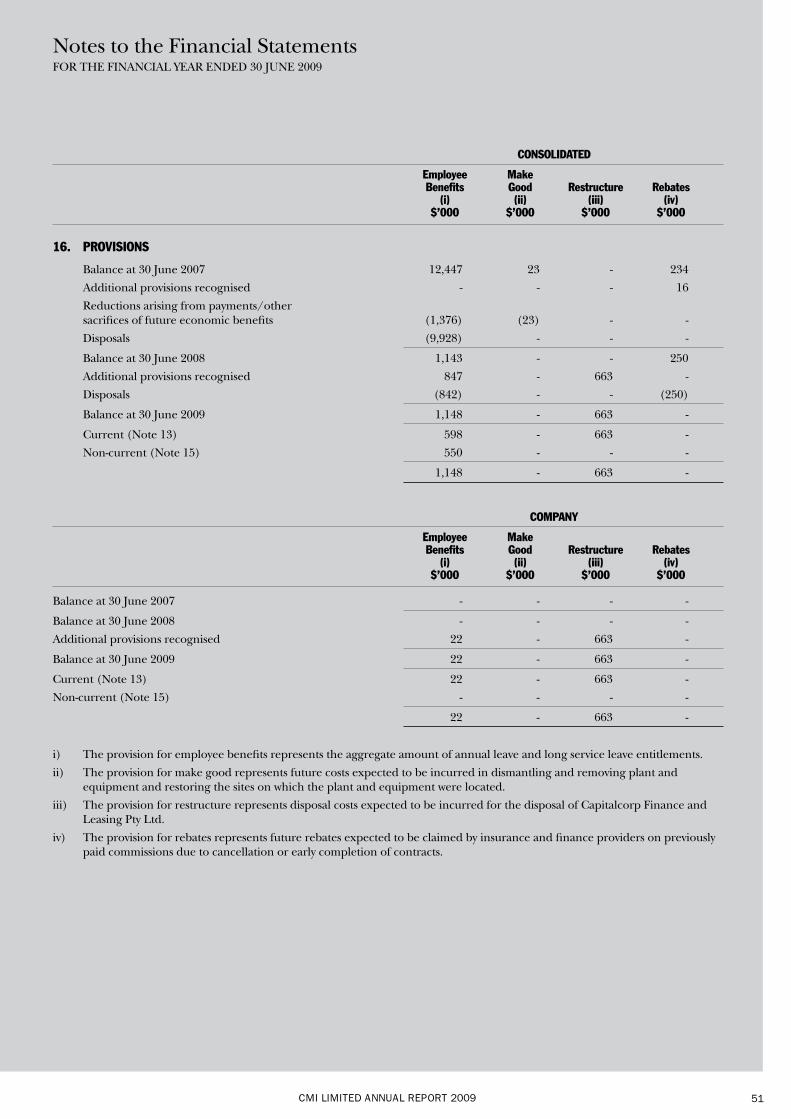
CMI LIMITED ANNUAL REPORT 2009 51
CONSOLIDATED
Employee Make Benefits Good Restructure Rebates (i) (ii) (iii) (iv) $’000 $’000 $’000 $’000
16. PROVISIONS
Balance at 30 June 2007 12,447 23 - 234
Additional provisions recognised - - - 16
Reductions arising from payments/other sacrifices of future economic benefits (1,376) (23) - -
Disposals (9,928) - - -
Balance at 30 June 2008 1,143 - - 250
Additional provisions recognised 847 - 663 -
Disposals (842) - - (250)
Balance at 30 June 2009 1,148 - 663 -
Current (Note 13) 598 - 663 -
Non-current (Note 15) 550 - - -
1,148 - 663 -
COMPANY
Employee Make Benefits Good Restructure Rebates (i) (ii) (iii) (iv) $’000 $’000 $’000 $’000
Balance at 30 June 2007 - - - -
Balance at 30 June 2008 - - - -
Additional provisions recognised 22 - 663 -
Balance at 30 June 2009 22 - 663 -
Current (Note 13) 22 - 663 -
Non-current (Note 15) - - - -
22 - 663 -
i) The provision for employee benefits represents the aggregate amount of annual leave and long service leave entitlements.
ii) The provision for make good represents future costs expected to be incurred in dismantling and removing plant and equipment and restoring the sites on which the plant and equipment were located.
iii) The provision for restructure represents disposal costs expected to be incurred for the disposal of Capitalcorp Finance and Leasing Pty Ltd.
iv) The provision for rebates represents future rebates expected to be claimed by insurance and finance providers on previously paid commissions due to cancellation or early completion of contracts.
Notes to the Financial StatementsFOR THE FINANCIAL YEAR ENDED 30 JUNE 2009
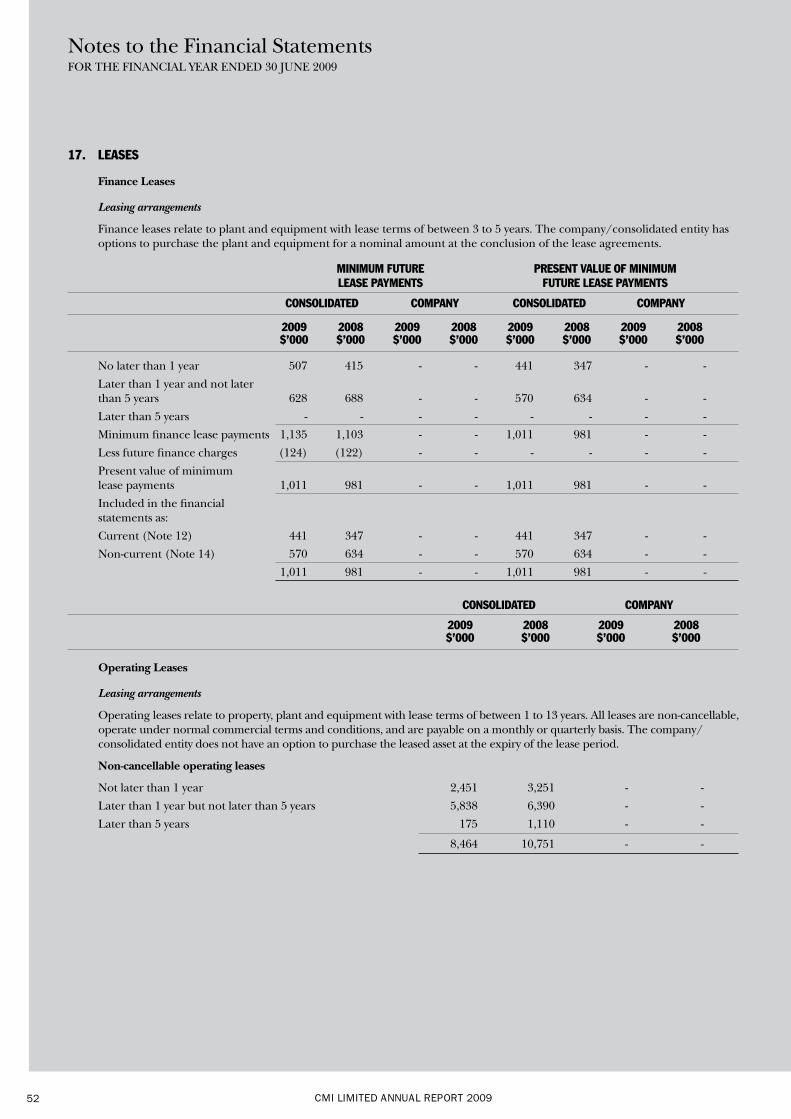
CMI LIMITED ANNUAL REPORT 200952
17. LEASES
Finance Leases
Leasing arrangements
Finance leases relate to plant and equipment with lease terms of between 3 to 5 years. The company/consolidated entity has options to purchase the plant and equipment for a nominal amount at the conclusion of the lease agreements.
MINIMUM FUTURE PRESENT VALUE OF MINIMUM LEASE PAYMENTS FUTURE LEASE PAYMENTS
CONSOLIDATED COMPANY CONSOLIDATED COMPANY
2009 2008 2009 2008 2009 2008 2009 2008 $’000 $’000 $’000 $’000 $’000 $’000 $’000 $’000
No later than 1 year 507 415 - - 441 347 - -
Later than 1 year and not later than 5 years 628 688 - - 570 634 - -
Later than 5 years - - - - - - - -
Minimum finance lease payments 1,135 1,103 - - 1,011 981 - -
Less future finance charges (124) (122) - - - - - -
Present value of minimum lease payments 1,011 981 - - 1,011 981 - -
Included in the financial statements as:
Current (Note 12) 441 347 - - 441 347 - -
Non-current (Note 14) 570 634 - - 570 634 - -
1,011 981 - - 1,011 981 - -
CONSOLIDATED COMPANY
2009 2008 2009 2008 $’000 $’000 $’000 $’000
Operating Leases
Leasing arrangements
Operating leases relate to property, plant and equipment with lease terms of between 1 to 13 years. All leases are non-cancellable, operate under normal commercial terms and conditions, and are payable on a monthly or quarterly basis. The company/consolidated entity does not have an option to purchase the leased asset at the expiry of the lease period.
Non-cancellable operating leases
Not later than 1 year 2,451 3,251 - -
Later than 1 year but not later than 5 years 5,838 6,390 - -
Later than 5 years 175 1,110 - -
8,464 10,751 - -
Notes to the Financial StatementsFOR THE FINANCIAL YEAR ENDED 30 JUNE 2009
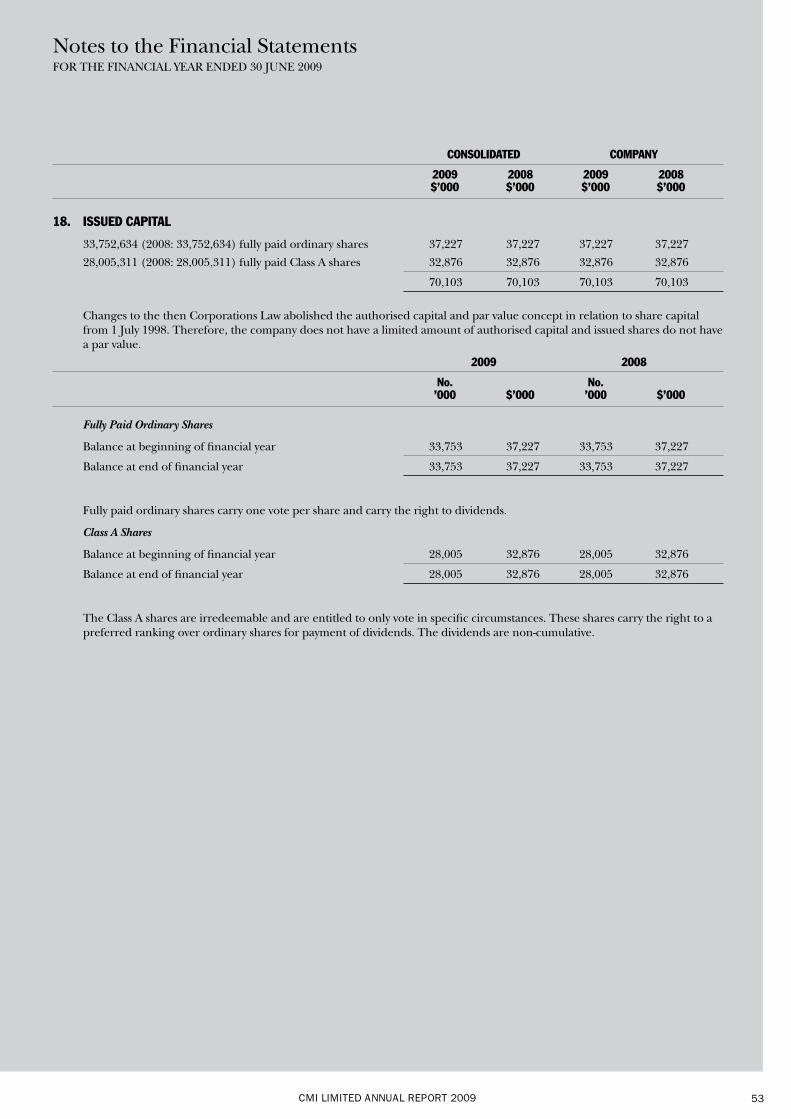
CMI LIMITED ANNUAL REPORT 2009 53
CONSOLIDATED COMPANY
2009 2008 2009 2008 $’000 $’000 $’000 $’000
18. ISSUED CAPITAL
33,752,634 (2008: 33,752,634) fully paid ordinary shares 37,227 37,227 37,227 37,227
28,005,311 (2008: 28,005,311) fully paid Class A shares 32,876 32,876 32,876 32,876
70,103 70,103 70,103 70,103
Changes to the then Corporations Law abolished the authorised capital and par value concept in relation to share capital from 1 July 1998. Therefore, the company does not have a limited amount of authorised capital and issued shares do not have a par value.
2009 2008
No. No. ’000 $’000 ’000 $’000
Fully Paid Ordinary Shares
Balance at beginning of financial year 33,753 37,227 33,753 37,227
Balance at end of financial year 33,753 37,227 33,753 37,227
Fully paid ordinary shares carry one vote per share and carry the right to dividends.
Class A Shares
Balance at beginning of financial year 28,005 32,876 28,005 32,876
Balance at end of financial year 28,005 32,876 28,005 32,876
The Class A shares are irredeemable and are entitled to only vote in specific circumstances. These shares carry the right to a preferred ranking over ordinary shares for payment of dividends. The dividends are non-cumulative.
Notes to the Financial StatementsFOR THE FINANCIAL YEAR ENDED 30 JUNE 2009
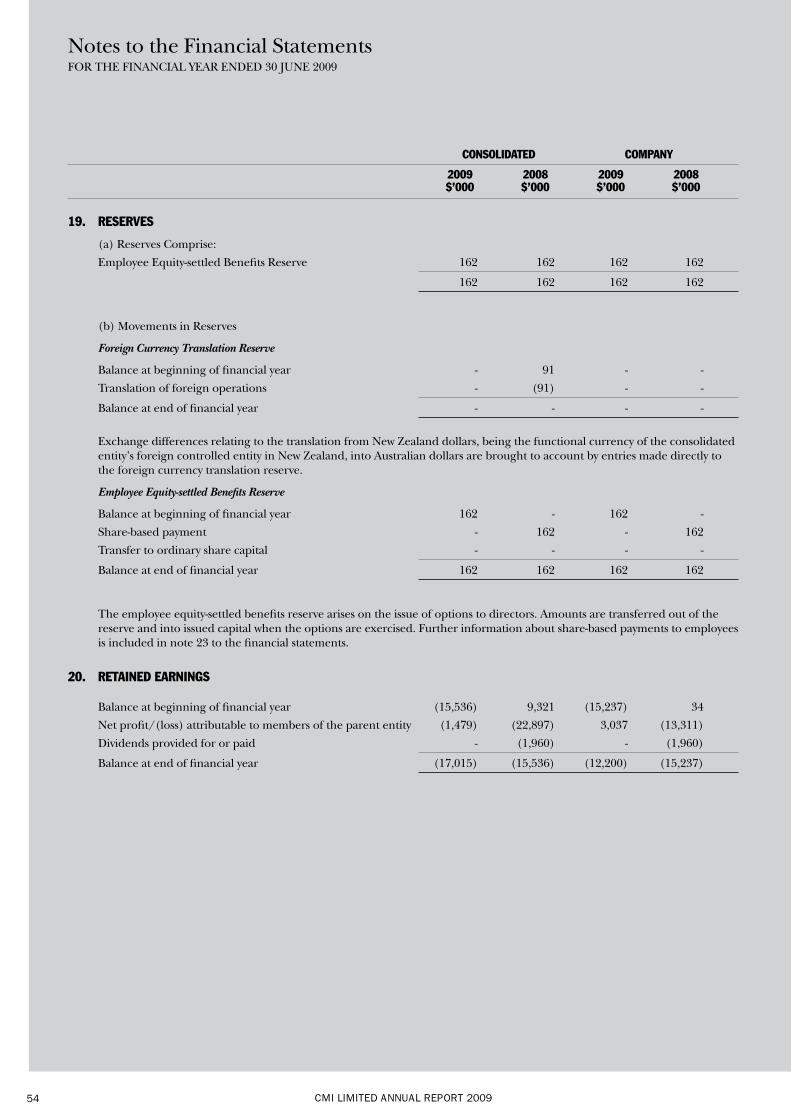
CMI LIMITED ANNUAL REPORT 200954
CONSOLIDATED COMPANY
2009 2008 2009 2008 $’000 $’000 $’000 $’000
19. RESERVES
(a) Reserves Comprise:
Employee Equity-settled Benefits Reserve 162 162 162 162
162 162 162 162
(b) Movements in Reserves
Foreign Currency Translation Reserve
Balance at beginning of financial year - 91 - -
Translation of foreign operations - (91) - -
Balance at end of financial year - - - -
Exchange differences relating to the translation from New Zealand dollars, being the functional currency of the consolidated entity’s foreign controlled entity in New Zealand, into Australian dollars are brought to account by entries made directly to the foreign currency translation reserve.
Employee Equity-settled Benefits Reserve
Balance at beginning of financial year 162 - 162 -
Share-based payment - 162 - 162
Transfer to ordinary share capital - - - -
Balance at end of financial year 162 162 162 162
The employee equity-settled benefits reserve arises on the issue of options to directors. Amounts are transferred out of the reserve and into issued capital when the options are exercised. Further information about share-based payments to employees is included in note 23 to the financial statements.
20. RETAINED EARNINGS
Balance at beginning of financial year (15,536) 9,321 (15,237) 34
Net profit/(loss) attributable to members of the parent entity (1,479) (22,897) 3,037 (13,311)
Dividends provided for or paid - (1,960) - (1,960)
Balance at end of financial year (17,015) (15,536) (12,200) (15,237)
Notes to the Financial StatementsFOR THE FINANCIAL YEAR ENDED 30 JUNE 2009
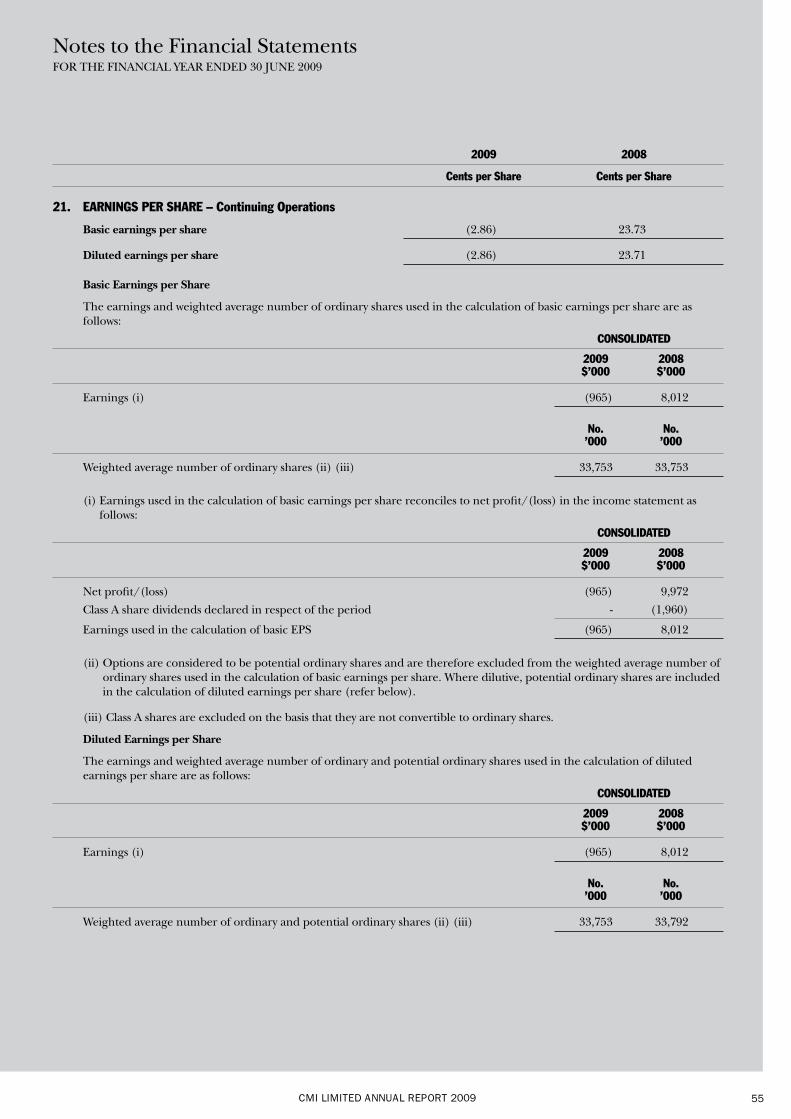
CMI LIMITED ANNUAL REPORT 2009 55
2009 2008
Cents per Share Cents per Share
21. EARNINGS PER SHARE – Continuing Operations
Basic earnings per share (2.86) 23.73
Diluted earnings per share (2.86) 23.71
Basic Earnings per Share
The earnings and weighted average number of ordinary shares used in the calculation of basic earnings per share are as follows:
CONSOLIDATED
2009 2008 $’000 $’000
Earnings (i) (965) 8,012
No. No. ’000 ’000
Weighted average number of ordinary shares (ii) (iii) 33,753 33,753
(i) Earnings used in the calculation of basic earnings per share reconciles to net profit/(loss) in the income statement as follows:
CONSOLIDATED
2009 2008 $’000 $’000
Net profit/(loss) (965) 9,972
Class A share dividends declared in respect of the period - (1,960)
Earnings used in the calculation of basic EPS (965) 8,012
(ii) Options are considered to be potential ordinary shares and are therefore excluded from the weighted average number of ordinary shares used in the calculation of basic earnings per share. Where dilutive, potential ordinary shares are included in the calculation of diluted earnings per share (refer below).
(iii) Class A shares are excluded on the basis that they are not convertible to ordinary shares.
Diluted Earnings per Share
The earnings and weighted average number of ordinary and potential ordinary shares used in the calculation of diluted earnings per share are as follows:
CONSOLIDATED
2009 2008 $’000 $’000
Earnings (i) (965) 8,012
No. No. ’000 ’000
Weighted average number of ordinary and potential ordinary shares (ii) (iii) 33,753 33,792
Notes to the Financial StatementsFOR THE FINANCIAL YEAR ENDED 30 JUNE 2009
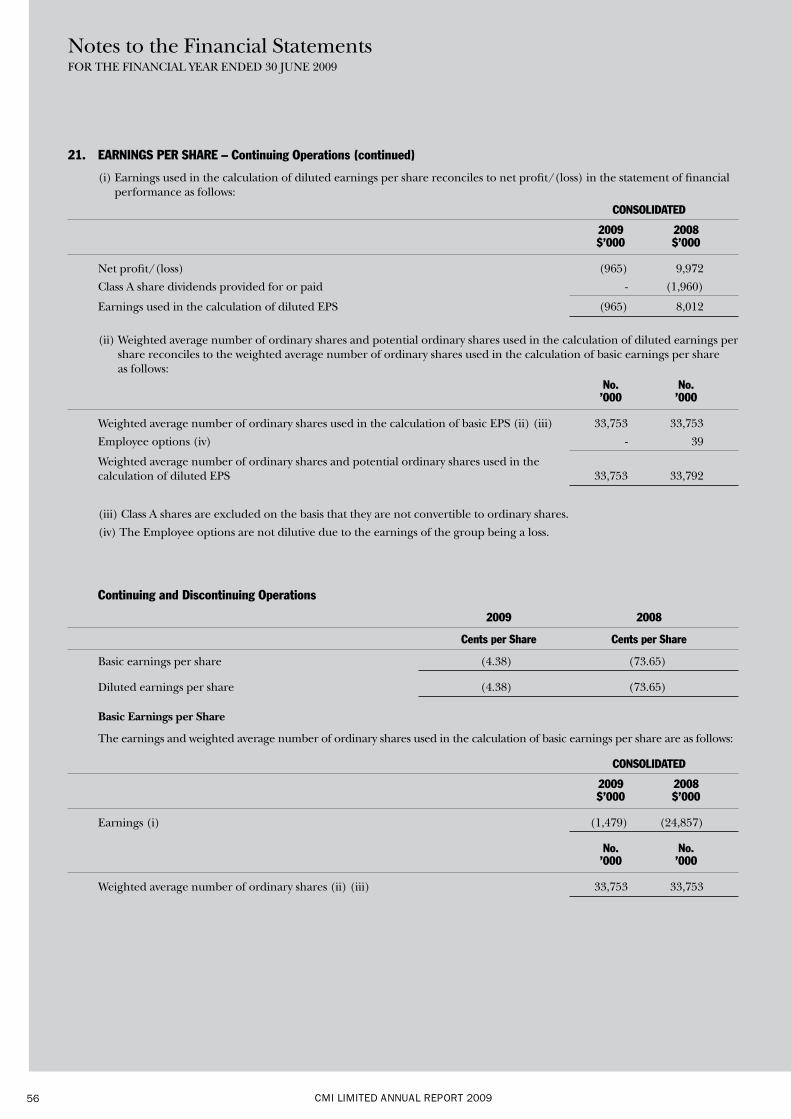
CMI LIMITED ANNUAL REPORT 200956
21. EARNINGS PER SHARE – Continuing Operations (continued)
(i) Earnings used in the calculation of diluted earnings per share reconciles to net profit/(loss) in the statement of financial performance as follows:
CONSOLIDATED
2009 2008 $’000 $’000
Net profit/(loss) (965) 9,972
Class A share dividends provided for or paid - (1,960)
Earnings used in the calculation of diluted EPS (965) 8,012
(ii) Weighted average number of ordinary shares and potential ordinary shares used in the calculation of diluted earnings per share reconciles to the weighted average number of ordinary shares used in the calculation of basic earnings per share as follows:
No. No. ’000 ’000
Weighted average number of ordinary shares used in the calculation of basic EPS (ii) (iii) 33,753 33,753
Employee options (iv) - 39
Weighted average number of ordinary shares and potential ordinary shares used in the calculation of diluted EPS 33,753 33,792
(iii) Class A shares are excluded on the basis that they are not convertible to ordinary shares.
(iv) The Employee options are not dilutive due to the earnings of the group being a loss.
Continuing and Discontinuing Operations
2009 2008
Cents per Share Cents per Share
Basic earnings per share (4.38) (73.65)
Diluted earnings per share (4.38) (73.65)
Basic Earnings per Share
The earnings and weighted average number of ordinary shares used in the calculation of basic earnings per share are as follows:
CONSOLIDATED
2009 2008 $’000 $’000
Earnings (i) (1,479) (24,857)
No. No. ’000 ’000
Weighted average number of ordinary shares (ii) (iii) 33,753 33,753
Notes to the Financial StatementsFOR THE FINANCIAL YEAR ENDED 30 JUNE 2009
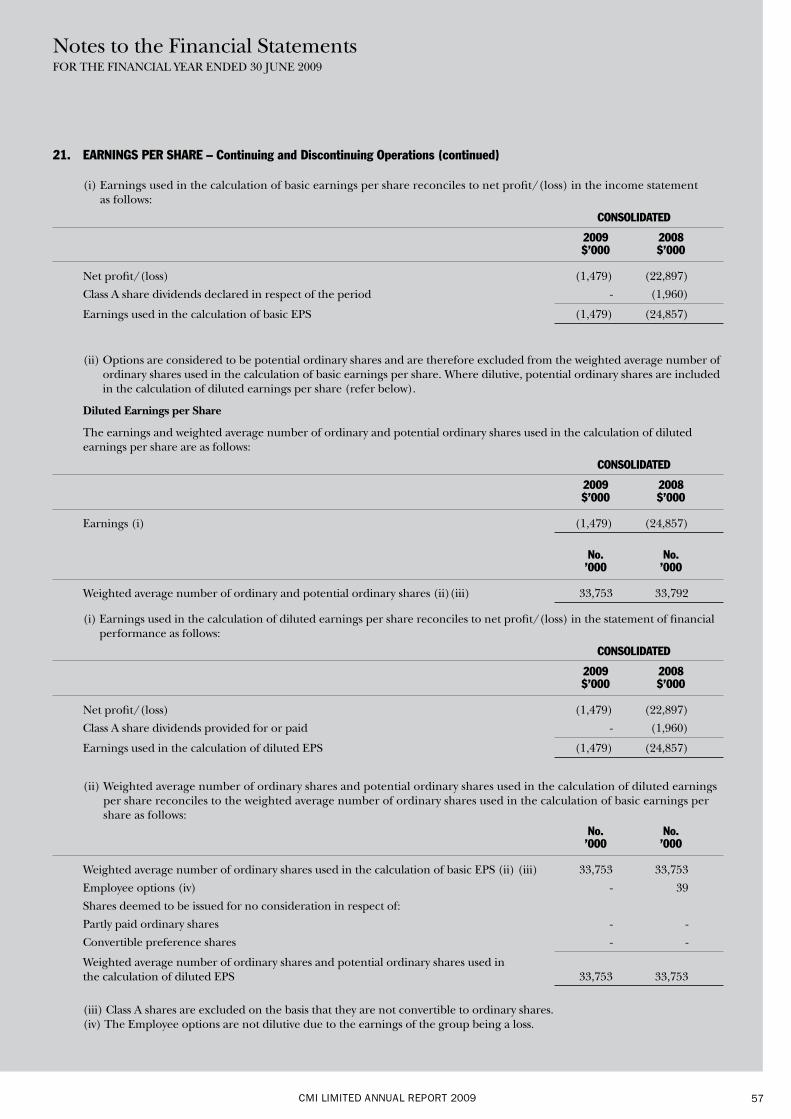
CMI LIMITED ANNUAL REPORT 2009 57
21. EARNINGS PER SHARE – Continuing and Discontinuing Operations (continued)
(i) Earnings used in the calculation of basic earnings per share reconciles to net profit/(loss) in the income statement as follows:
CONSOLIDATED
2009 2008 $’000 $’000
Net profit/(loss) (1,479) (22,897)
Class A share dividends declared in respect of the period - (1,960)
Earnings used in the calculation of basic EPS (1,479) (24,857)
(ii) Options are considered to be potential ordinary shares and are therefore excluded from the weighted average number of ordinary shares used in the calculation of basic earnings per share. Where dilutive, potential ordinary shares are included in the calculation of diluted earnings per share (refer below).
Diluted Earnings per Share
The earnings and weighted average number of ordinary and potential ordinary shares used in the calculation of diluted earnings per share are as follows:
CONSOLIDATED
2009 2008 $’000 $’000
Earnings (i) (1,479) (24,857)
No. No. ’000 ’000
Weighted average number of ordinary and potential ordinary shares (ii)(iii) 33,753 33,792
(i) Earnings used in the calculation of diluted earnings per share reconciles to net profit/(loss) in the statement of financial performance as follows:
CONSOLIDATED
2009 2008 $’000 $’000
Net profit/(loss) (1,479) (22,897)
Class A share dividends provided for or paid - (1,960)
Earnings used in the calculation of diluted EPS (1,479) (24,857)
(ii) Weighted average number of ordinary shares and potential ordinary shares used in the calculation of diluted earnings per share reconciles to the weighted average number of ordinary shares used in the calculation of basic earnings per share as follows:
No. No. ’000 ’000
Weighted average number of ordinary shares used in the calculation of basic EPS (ii) (iii) 33,753 33,753
Employee options (iv) - 39
Shares deemed to be issued for no consideration in respect of:
Partly paid ordinary shares - -
Convertible preference shares - -
Weighted average number of ordinary shares and potential ordinary shares used in the calculation of diluted EPS 33,753 33,753
(iii) Class A shares are excluded on the basis that they are not convertible to ordinary shares. (iv) The Employee options are not dilutive due to the earnings of the group being a loss.
Notes to the Financial StatementsFOR THE FINANCIAL YEAR ENDED 30 JUNE 2009
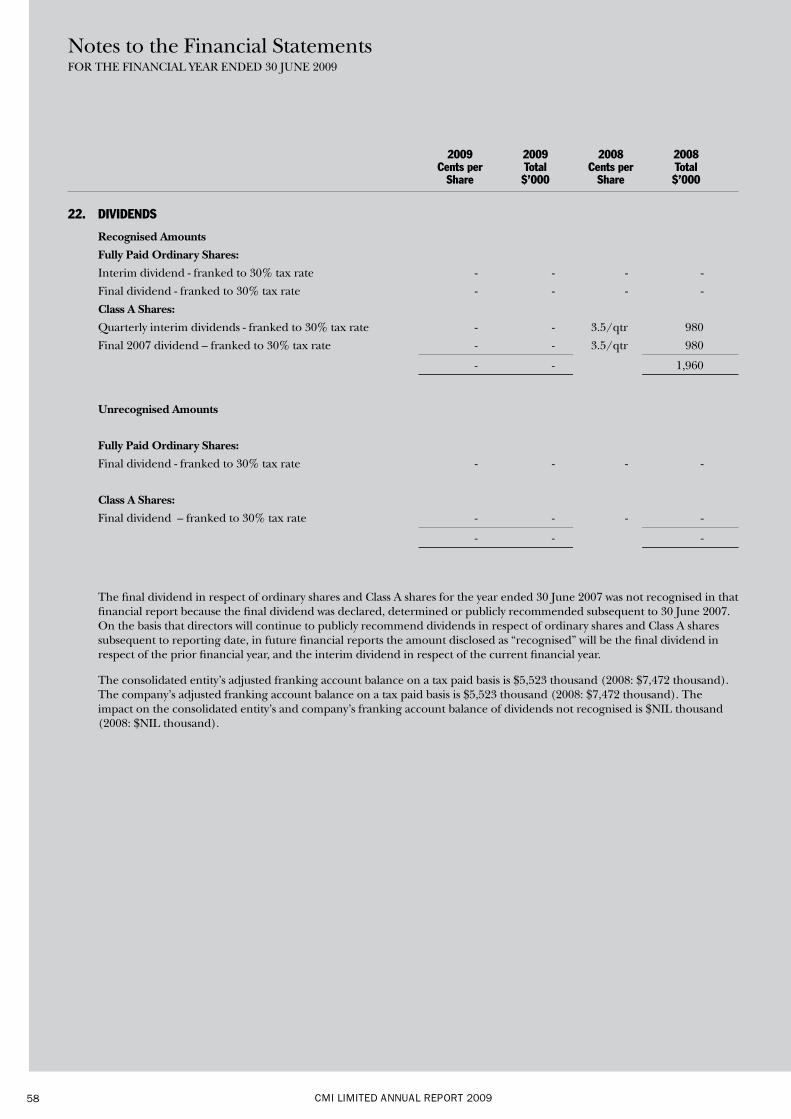
CMI LIMITED ANNUAL REPORT 200958
2009 2009 2008 2008 Cents per Total Cents per Total Share $’000 Share $’000
22. DIVIDENDS
Recognised Amounts
Fully Paid Ordinary Shares:
Interim dividend - franked to 30% tax rate - - - -
Final dividend - franked to 30% tax rate - - - -
Class A Shares:
Quarterly interim dividends - franked to 30% tax rate - - 3.5/qtr 980
Final 2007 dividend – franked to 30% tax rate - - 3.5/qtr 980
- - 1,960
Unrecognised Amounts
Fully Paid Ordinary Shares:
Final dividend - franked to 30% tax rate - - - -
Class A Shares:
Final dividend – franked to 30% tax rate - - - -
- - -
The final dividend in respect of ordinary shares and Class A shares for the year ended 30 June 2007 was not recognised in that financial report because the final dividend was declared, determined or publicly recommended subsequent to 30 June 2007. On the basis that directors will continue to publicly recommend dividends in respect of ordinary shares and Class A shares subsequent to reporting date, in future financial reports the amount disclosed as “recognised” will be the final dividend in respect of the prior financial year, and the interim dividend in respect of the current financial year.
The consolidated entity’s adjusted franking account balance on a tax paid basis is $5,523 thousand (2008: $7,472 thousand). The company’s adjusted franking account balance on a tax paid basis is $5,523 thousand (2008: $7,472 thousand). The impact on the consolidated entity’s and company’s franking account balance of dividends not recognised is $NIL thousand (2008: $NIL thousand).
Notes to the Financial StatementsFOR THE FINANCIAL YEAR ENDED 30 JUNE 2009
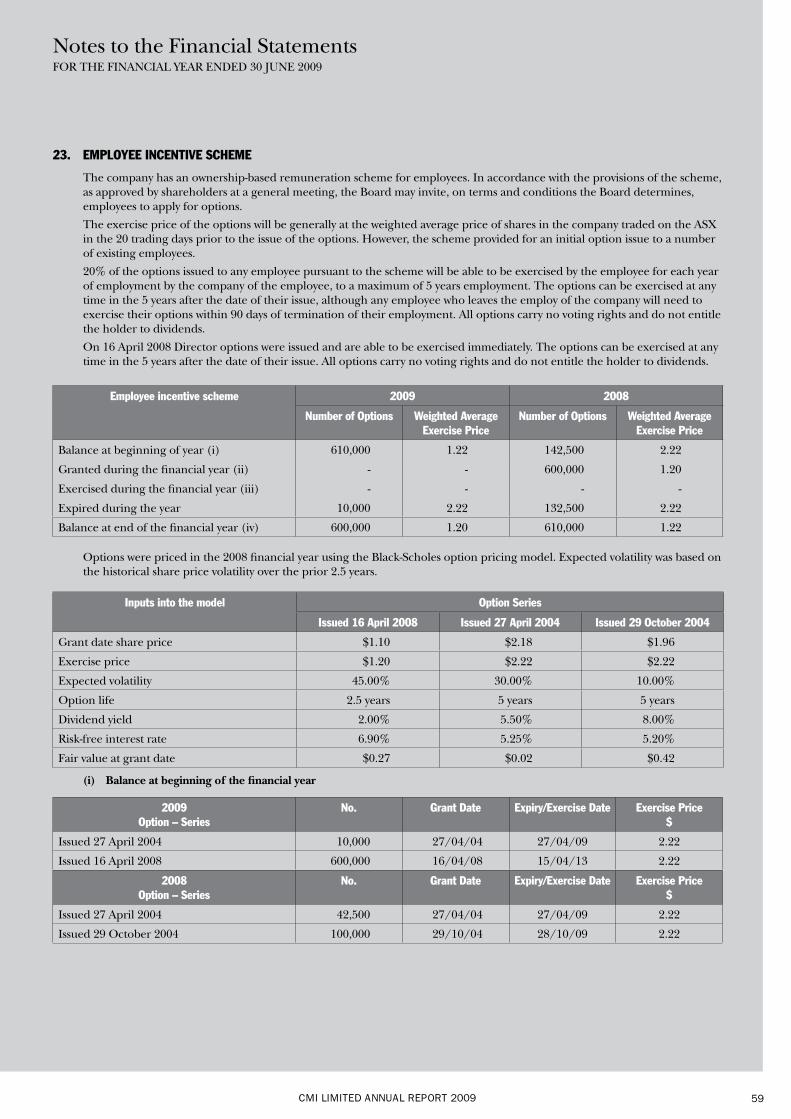
CMI LIMITED ANNUAL REPORT 2009 59
23. EMPLOYEE INCENTIVE SCHEME
The company has an ownership-based remuneration scheme for employees. In accordance with the provisions of the scheme, as approved by shareholders at a general meeting, the Board may invite, on terms and conditions the Board determines, employees to apply for options.
The exercise price of the options will be generally at the weighted average price of shares in the company traded on the ASX in the 20 trading days prior to the issue of the options. However, the scheme provided for an initial option issue to a number of existing employees.
20% of the options issued to any employee pursuant to the scheme will be able to be exercised by the employee for each year of employment by the company of the employee, to a maximum of 5 years employment. The options can be exercised at any time in the 5 years after the date of their issue, although any employee who leaves the employ of the company will need to exercise their options within 90 days of termination of their employment. All options carry no voting rights and do not entitle the holder to dividends.
On 16 April 2008 Director options were issued and are able to be exercised immediately. The options can be exercised at any time in the 5 years after the date of their issue. All options carry no voting rights and do not entitle the holder to dividends.
Employee incentive scheme 2009 2008
Number of Options Weighted Average Exercise Price
Number of Options Weighted Average Exercise Price
Balance at beginning of year (i) 610,000 1.22 142,500 2.22
Granted during the financial year (ii) - - 600,000 1.20
Exercised during the financial year (iii) - - - -
Expired during the year 10,000 2.22 132,500 2.22
Balance at end of the financial year (iv) 600,000 1.20 610,000 1.22
Options were priced in the 2008 financial year using the Black-Scholes option pricing model. Expected volatility was based on the historical share price volatility over the prior 2.5 years.
Inputs into the model Option Series
Issued 16 April 2008 Issued 27 April 2004 Issued 29 October 2004
Grant date share price $1.10 $2.18 $1.96
Exercise price $1.20 $2.22 $2.22
Expected volatility 45.00% 30.00% 10.00%
Option life 2.5 years 5 years 5 years
Dividend yield 2.00% 5.50% 8.00%
Risk-free interest rate 6.90% 5.25% 5.20%
Fair value at grant date $0.27 $0.02 $0.42
(i) Balance at beginning of the financial year
2009 Option – Series
No. Grant Date Expiry/Exercise Date Exercise Price $
Issued 27 April 2004 10,000 27/04/04 27/04/09 2.22
Issued 16 April 2008 600,000 16/04/08 15/04/13 2.22
2008 Option – Series
No. Grant Date Expiry/Exercise Date Exercise Price $
Issued 27 April 2004 42,500 27/04/04 27/04/09 2.22
Issued 29 October 2004 100,000 29/10/04 28/10/09 2.22
Notes to the Financial StatementsFOR THE FINANCIAL YEAR ENDED 30 JUNE 2009
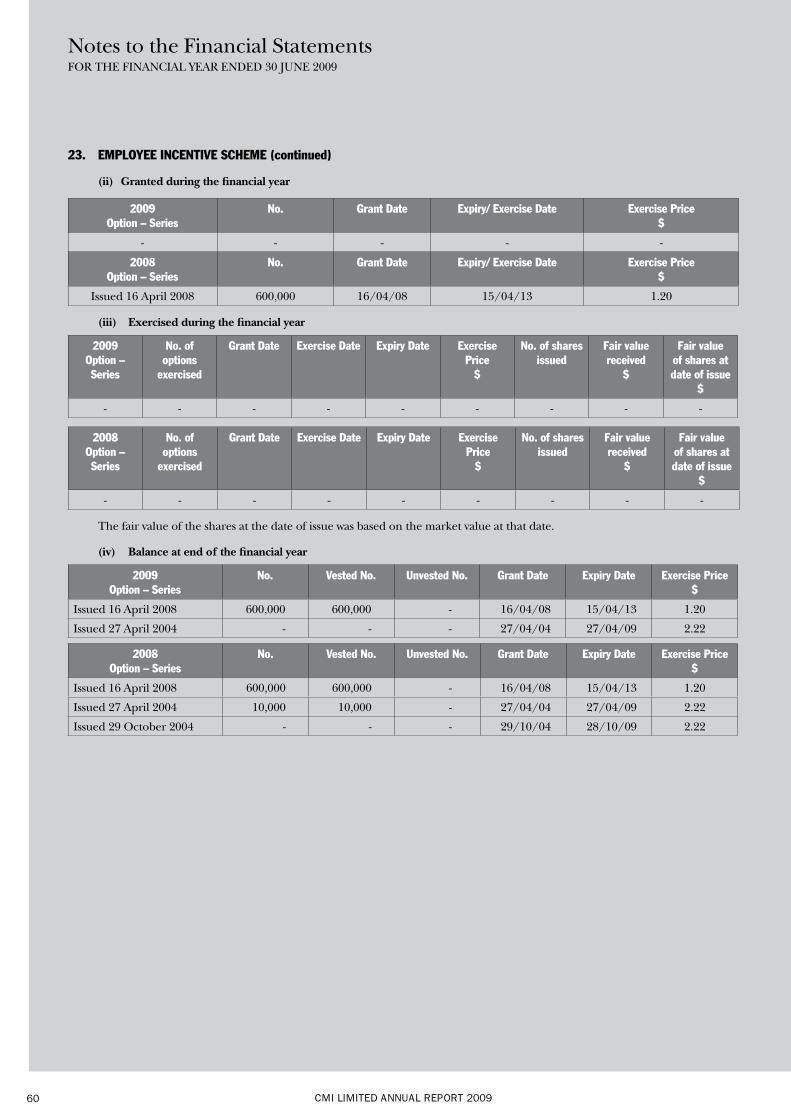
CMI LIMITED ANNUAL REPORT 200960
23. EMPLOYEE INCENTIVE SCHEME (continued)
(ii) Granted during the financial year
2009 Option – Series
No. Grant Date Expiry/ Exercise Date Exercise Price $
- - - - -
2008 Option – Series
No. Grant Date Expiry/ Exercise Date Exercise Price $
Issued 16 April 2008 600,000 16/04/08 15/04/13 1.20
(iii) Exercised during the financial year
2009 Option – Series
No. of options
exercised
Grant Date Exercise Date Expiry Date Exercise Price
$
No. of shares issued
Fair value received
$
Fair value of shares at date of issue
$
- - - - - - - - -
2008 Option – Series
No. of options
exercised
Grant Date Exercise Date Expiry Date Exercise Price
$
No. of shares issued
Fair value received
$
Fair value of shares at date of issue
$
- - - - - - - - -
The fair value of the shares at the date of issue was based on the market value at that date.
(iv) Balance at end of the financial year
2009 Option – Series
No. Vested No. Unvested No. Grant Date Expiry Date Exercise Price $
Issued 16 April 2008 600,000 600,000 - 16/04/08 15/04/13 1.20
Issued 27 April 2004 - - - 27/04/04 27/04/09 2.22
2008 Option – Series
No. Vested No. Unvested No. Grant Date Expiry Date Exercise Price $
Issued 16 April 2008 600,000 600,000 - 16/04/08 15/04/13 1.20
Issued 27 April 2004 10,000 10,000 - 27/04/04 27/04/09 2.22
Issued 29 October 2004 - - - 29/10/04 28/10/09 2.22
Notes to the Financial StatementsFOR THE FINANCIAL YEAR ENDED 30 JUNE 2009
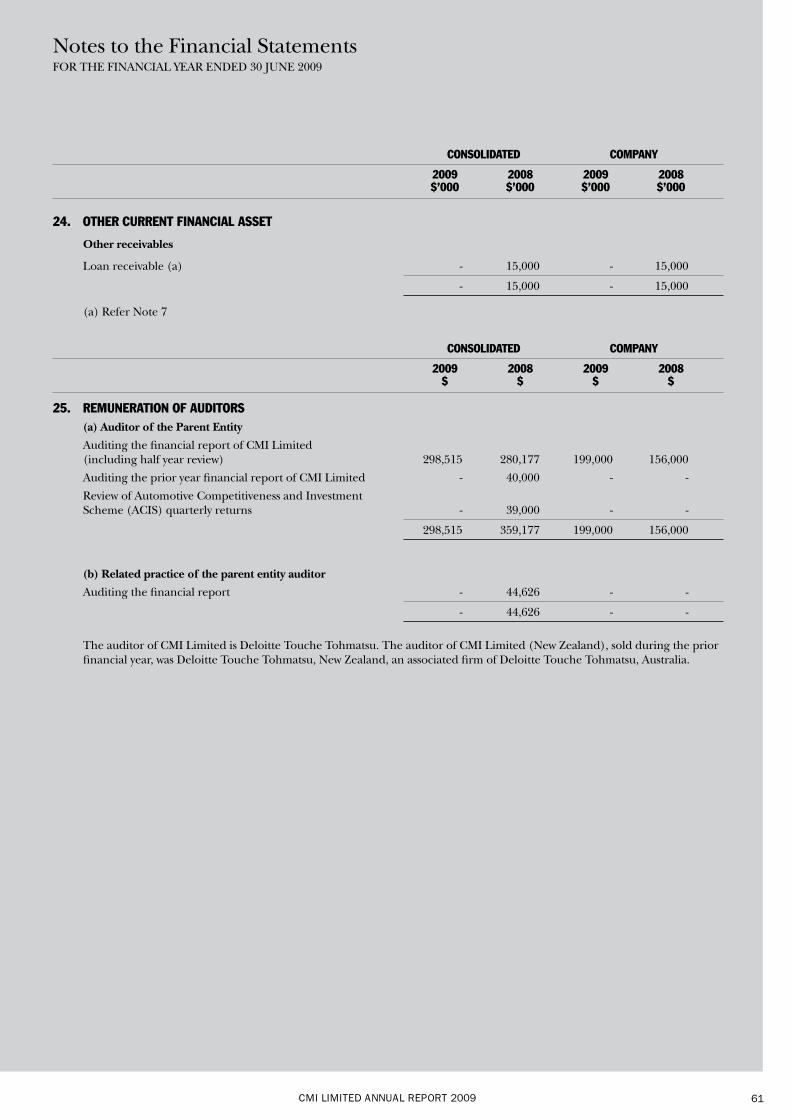
CMI LIMITED ANNUAL REPORT 2009 61
CONSOLIDATED COMPANY
2009 2008 2009 2008 $’000 $’000 $’000 $’000
24. OTHER CURRENT FINANCIAL ASSET
Other receivables
Loan receivable (a) - 15,000 - 15,000
- 15,000 - 15,000
(a) Refer Note 7
CONSOLIDATED COMPANY
2009 2008 2009 2008 $ $ $ $
25. REMUNERATION OF AUDITORS (a) Auditor of the Parent Entity
Auditing the financial report of CMI Limited (including half year review) 298,515 280,177 199,000 156,000
Auditing the prior year financial report of CMI Limited - 40,000 - -
Review of Automotive Competitiveness and Investment Scheme (ACIS) quarterly returns - 39,000 - -
298,515 359,177 199,000 156,000
(b) Related practice of the parent entity auditor
Auditing the financial report - 44,626 - -
- 44,626 - -
The auditor of CMI Limited is Deloitte Touche Tohmatsu. The auditor of CMI Limited (New Zealand), sold during the prior financial year, was Deloitte Touche Tohmatsu, New Zealand, an associated firm of Deloitte Touche Tohmatsu, Australia.
Notes to the Financial StatementsFOR THE FINANCIAL YEAR ENDED 30 JUNE 2009
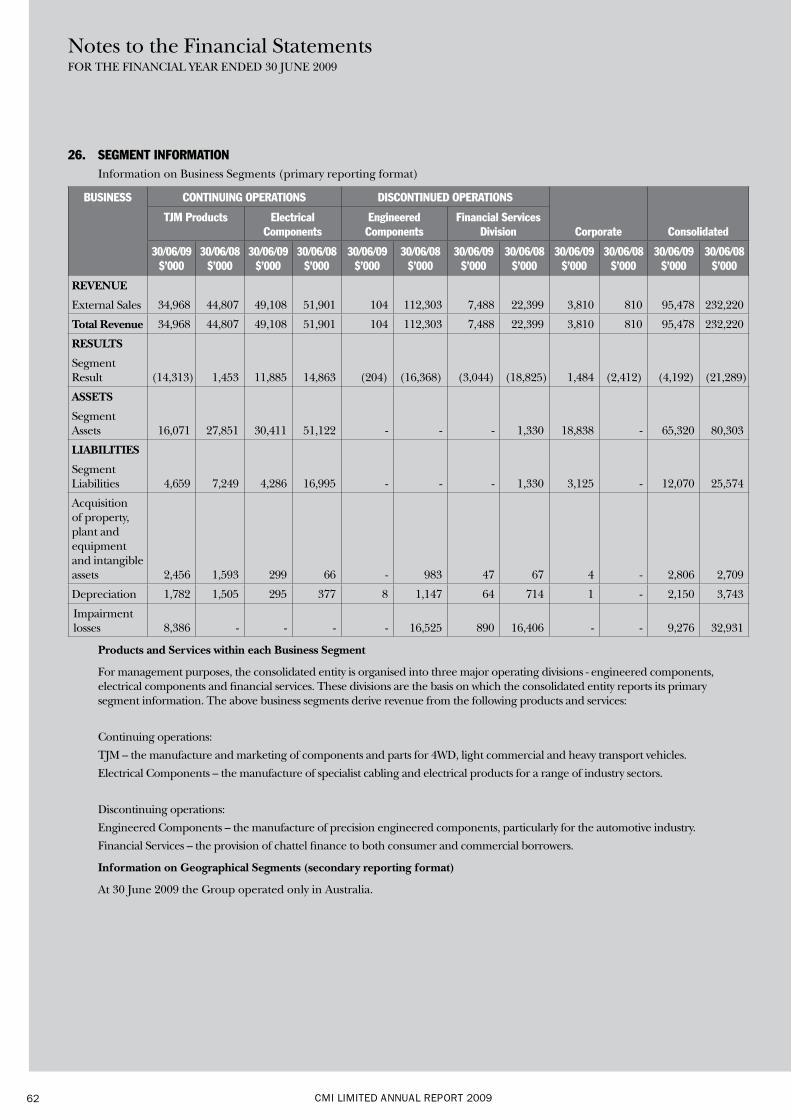
CMI LIMITED ANNUAL REPORT 200962
26. SEGMENT INFORMATION Information on Business Segments (primary reporting format)
BUSINESS CONTINUING OPERATIONS DISCONTINUED OPERATIONS
Corporate ConsolidatedTJM Products Electrical
ComponentsEngineered Components
Financial Services Division
30/06/09 $’000
30/06/08 $’000
30/06/09 $’000
30/06/08 $’000
30/06/09 $’000
30/06/08 $’000
30/06/09 $’000
30/06/08 $’000
30/06/09 $’000
30/06/08 $’000
30/06/09 $’000
30/06/08 $’000
REVENUE
External Sales 34,968 44,807 49,108 51,901 104 112,303 7,488 22,399 3,810 810 95,478 232,220
Total Revenue 34,968 44,807 49,108 51,901 104 112,303 7,488 22,399 3,810 810 95,478 232,220
RESULTS
Segment Result (14,313) 1,453 11,885 14,863 (204) (16,368) (3,044) (18,825) 1,484 (2,412) (4,192) (21,289)
ASSETS
Segment Assets 16,071 27,851 30,411 51,122 - - - 1,330 18,838 - 65,320 80,303
LIABILITIES
Segment Liabilities 4,659 7,249 4,286 16,995 - - - 1,330 3,125 - 12,070 25,574
Acquisition of property, plant and equipment and intangible assets 2,456 1,593 299 66 - 983 47 67 4 - 2,806 2,709
Depreciation 1,782 1,505 295 377 8 1,147 64 714 1 - 2,150 3,743
Impairment losses 8,386 - - - - 16,525 890 16,406 - - 9,276 32,931
Products and Services within each Business Segment
For management purposes, the consolidated entity is organised into three major operating divisions - engineered components, electrical components and financial services. These divisions are the basis on which the consolidated entity reports its primary segment information. The above business segments derive revenue from the following products and services:
Continuing operations:
TJM – the manufacture and marketing of components and parts for 4WD, light commercial and heavy transport vehicles.
Electrical Components – the manufacture of specialist cabling and electrical products for a range of industry sectors.
Discontinuing operations:
Engineered Components – the manufacture of precision engineered components, particularly for the automotive industry.
Financial Services – the provision of chattel finance to both consumer and commercial borrowers.
Information on Geographical Segments (secondary reporting format)
At 30 June 2009 the Group operated only in Australia.
Notes to the Financial StatementsFOR THE FINANCIAL YEAR ENDED 30 JUNE 2009
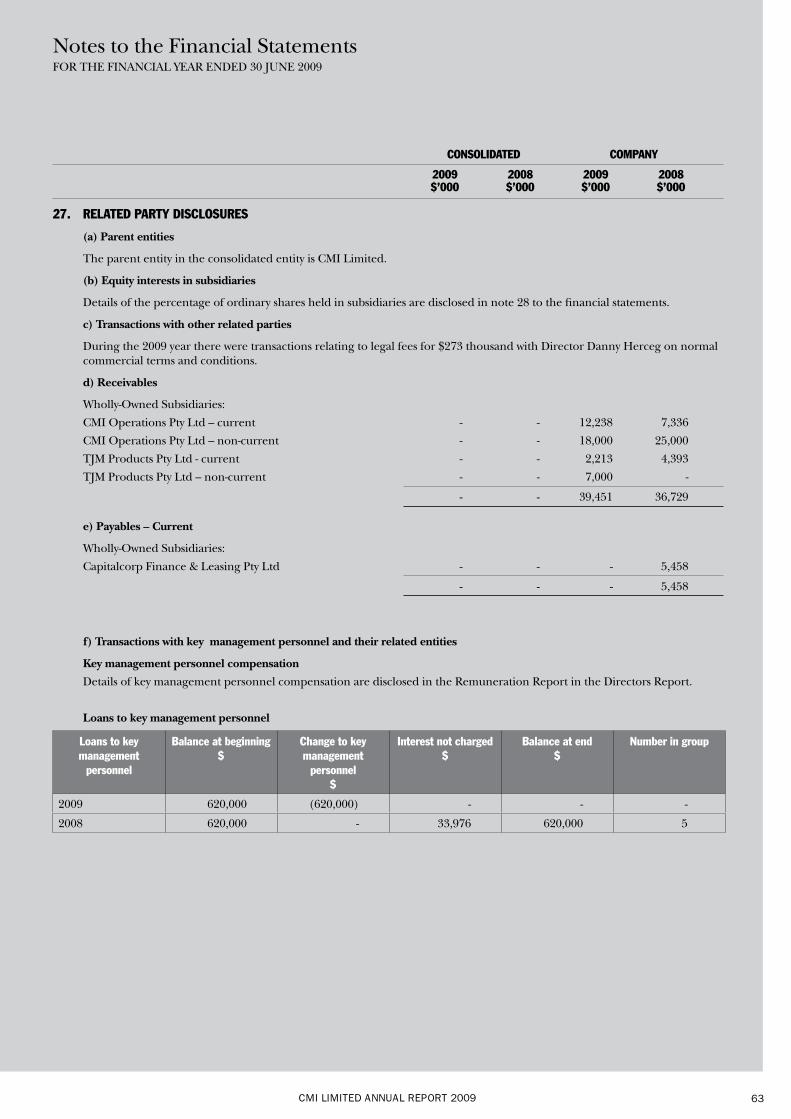
CMI LIMITED ANNUAL REPORT 2009 63
CONSOLIDATED COMPANY
2009 2008 2009 2008 $’000 $’000 $’000 $’000
27. RELATED PARTY DISCLOSURES
(a) Parent entities
The parent entity in the consolidated entity is CMI Limited.
(b) Equity interests in subsidiaries
Details of the percentage of ordinary shares held in subsidiaries are disclosed in note 28 to the financial statements.
c) Transactions with other related parties
During the 2009 year there were transactions relating to legal fees for $273 thousand with Director Danny Herceg on normal commercial terms and conditions.
d) Receivables
Wholly-Owned Subsidiaries:
CMI Operations Pty Ltd – current - - 12,238 7,336
CMI Operations Pty Ltd – non-current - - 18,000 25,000
TJM Products Pty Ltd - current - - 2,213 4,393
TJM Products Pty Ltd – non-current - - 7,000 -
- - 39,451 36,729
e) Payables – Current
Wholly-Owned Subsidiaries:
Capitalcorp Finance & Leasing Pty Ltd - - - 5,458
- - - 5,458
f) Transactions with key management personnel and their related entities
Key management personnel compensation
Details of key management personnel compensation are disclosed in the Remuneration Report in the Directors Report.
Loans to key management personnel
Loans to key management
personnel
Balance at beginning $
Change to key management
personnel $
Interest not charged $
Balance at end $
Number in group
2009 620,000 (620,000) - - -
2008 620,000 - 33,976 620,000 5
Notes to the Financial StatementsFOR THE FINANCIAL YEAR ENDED 30 JUNE 2009
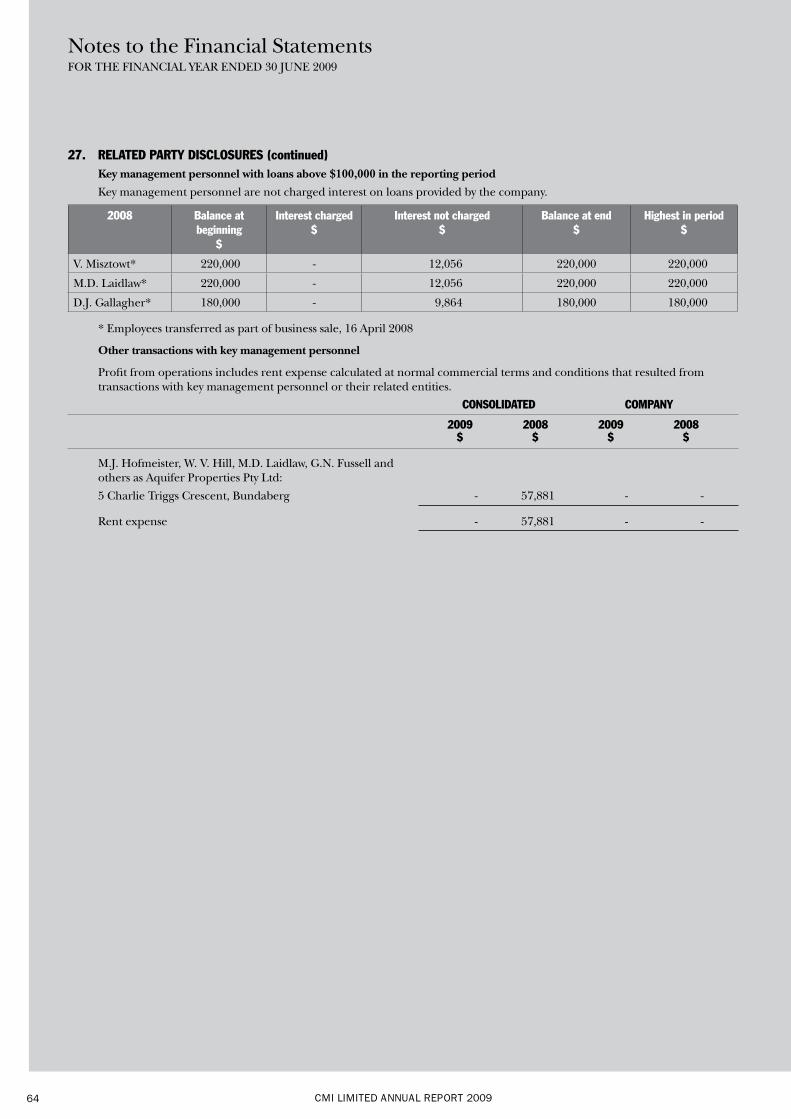
CMI LIMITED ANNUAL REPORT 200964
27. RELATED PARTY DISCLOSURES (continued) Key management personnel with loans above $100,000 in the reporting period
Key management personnel are not charged interest on loans provided by the company.
2008 Balance at beginning
$
Interest charged $
Interest not charged $
Balance at end $
Highest in period $
V. Misztowt* 220,000 - 12,056 220,000 220,000
M.D. Laidlaw* 220,000 - 12,056 220,000 220,000
D.J. Gallagher* 180,000 - 9,864 180,000 180,000
* Employees transferred as part of business sale, 16 April 2008
Other transactions with key management personnel
Profit from operations includes rent expense calculated at normal commercial terms and conditions that resulted from transactions with key management personnel or their related entities.
CONSOLIDATED COMPANY
2009 2008 2009 2008 $ $ $ $
M.J. Hofmeister, W. V. Hill, M.D. Laidlaw, G.N. Fussell and others as Aquifer Properties Pty Ltd:
5 Charlie Triggs Crescent, Bundaberg - 57,881 - -
Rent expense - 57,881 - -
Notes to the Financial StatementsFOR THE FINANCIAL YEAR ENDED 30 JUNE 2009
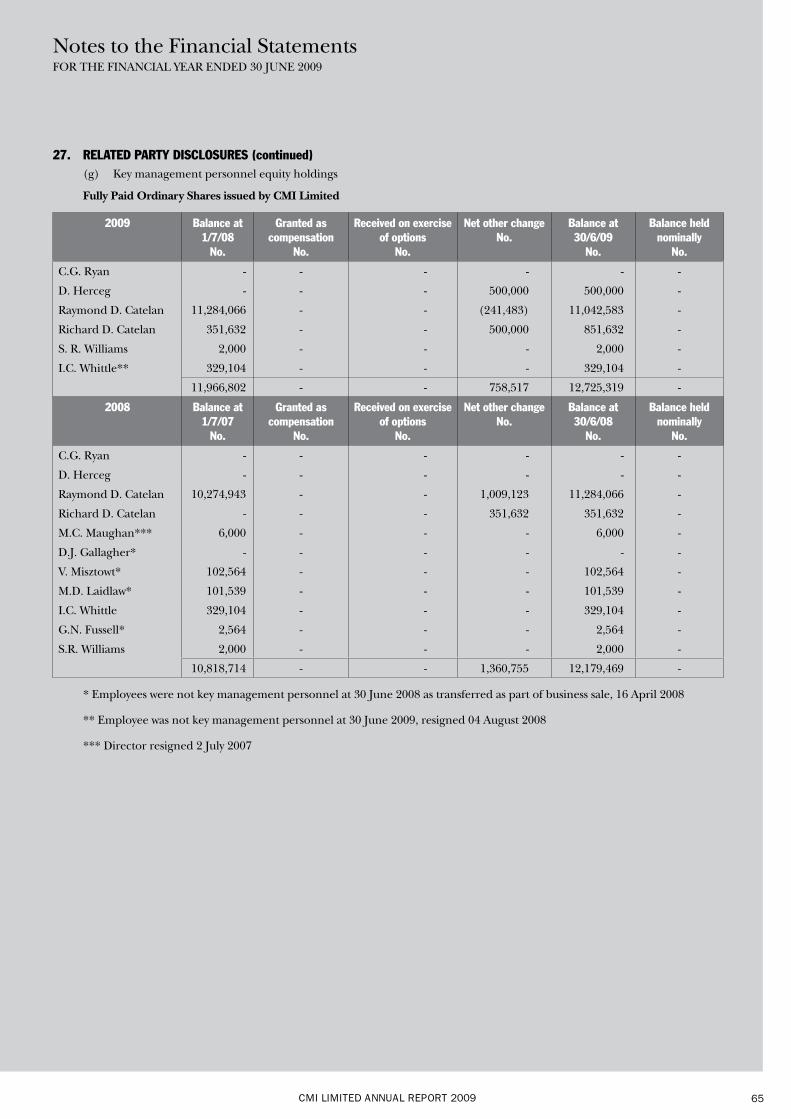
CMI LIMITED ANNUAL REPORT 2009 65
27. RELATED PARTY DISCLOSURES (continued) (g) Key management personnel equity holdings
Fully Paid Ordinary Shares issued by CMI Limited
2009 Balance at 1/7/08
No.
Granted as compensation
No.
Received on exercise of options
No.
Net other change No.
Balance at 30/6/09
No.
Balance held nominally
No.
C.G. Ryan - - - - - -
D. Herceg - - - 500,000 500,000 -
Raymond D. Catelan 11,284,066 - - (241,483) 11,042,583 -
Richard D. Catelan 351,632 - - 500,000 851,632 -
S. R. Williams 2,000 - - - 2,000 -
I.C. Whittle** 329,104 - - - 329,104 -
11,966,802 - - 758,517 12,725,319 -
2008 Balance at 1/7/07
No.
Granted as compensation
No.
Received on exercise of options
No.
Net other change No.
Balance at 30/6/08
No.
Balance held nominally
No.
C.G. Ryan - - - - - -
D. Herceg - - - - - -
Raymond D. Catelan 10,274,943 - - 1,009,123 11,284,066 -
Richard D. Catelan - - - 351,632 351,632 -
M.C. Maughan*** 6,000 - - - 6,000 -
D.J. Gallagher* - - - - - -
V. Misztowt* 102,564 - - - 102,564 -
M.D. Laidlaw* 101,539 - - - 101,539 -
I.C. Whittle 329,104 - - - 329,104 -
G.N. Fussell* 2,564 - - - 2,564 -
S.R. Williams 2,000 - - - 2,000 -
10,818,714 - - 1,360,755 12,179,469 -
* Employees were not key management personnel at 30 June 2008 as transferred as part of business sale, 16 April 2008
** Employee was not key management personnel at 30 June 2009, resigned 04 August 2008
*** Director resigned 2 July 2007
Notes to the Financial StatementsFOR THE FINANCIAL YEAR ENDED 30 JUNE 2009
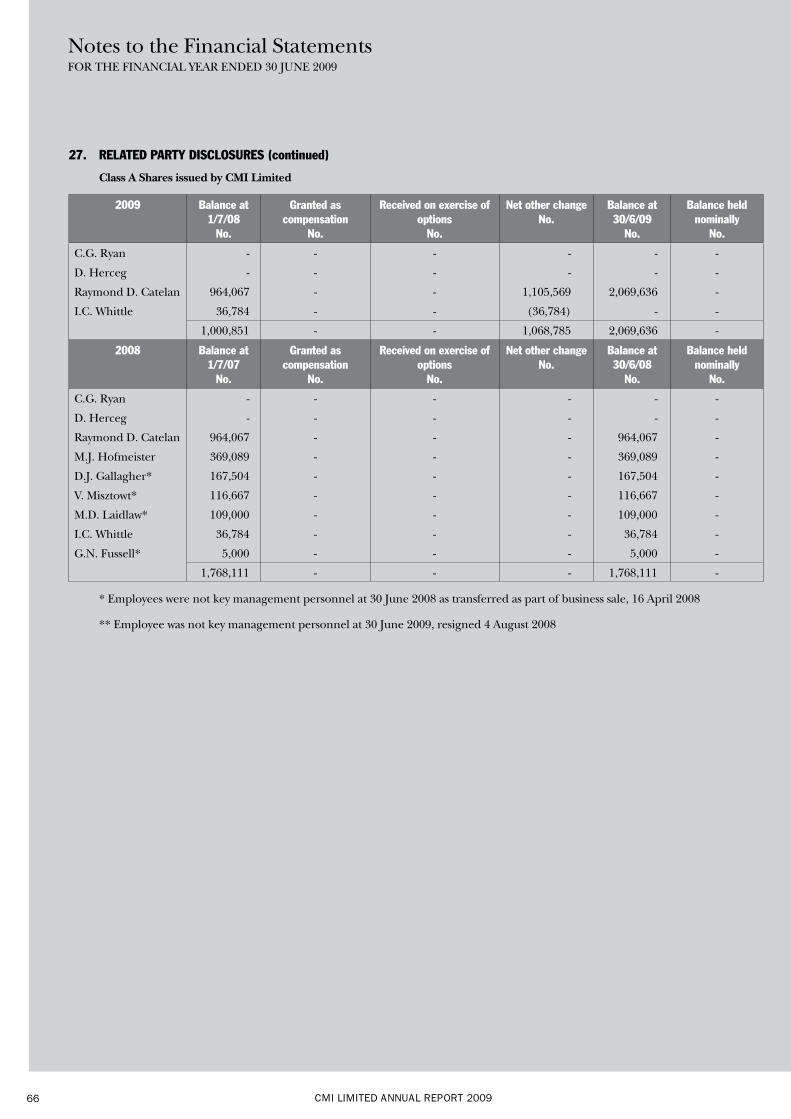
CMI LIMITED ANNUAL REPORT 200966
27. RELATED PARTY DISCLOSURES (continued)
Class A Shares issued by CMI Limited
2009 Balance at 1/7/08
No.
Granted as compensation
No.
Received on exercise of options
No.
Net other change No.
Balance at 30/6/09
No.
Balance held nominally
No.
C.G. Ryan - - - - - -
D. Herceg - - - - - -
Raymond D. Catelan 964,067 - - 1,105,569 2,069,636 -
I.C. Whittle 36,784 - - (36,784) - -
1,000,851 - - 1,068,785 2,069,636 -
2008 Balance at 1/7/07
No.
Granted as compensation
No.
Received on exercise of options
No.
Net other change No.
Balance at 30/6/08
No.
Balance held nominally
No.
C.G. Ryan - - - - - -
D. Herceg - - - - - -
Raymond D. Catelan 964,067 - - - 964,067 -
M.J. Hofmeister 369,089 - - - 369,089 -
D.J. Gallagher* 167,504 - - - 167,504 -
V. Misztowt* 116,667 - - - 116,667 -
M.D. Laidlaw* 109,000 - - - 109,000 -
I.C. Whittle 36,784 - - - 36,784 -
G.N. Fussell* 5,000 - - - 5,000 -
1,768,111 - - - 1,768,111 -
* Employees were not key management personnel at 30 June 2008 as transferred as part of business sale, 16 April 2008
** Employee was not key management personnel at 30 June 2009, resigned 4 August 2008
Notes to the Financial StatementsFOR THE FINANCIAL YEAR ENDED 30 JUNE 2009
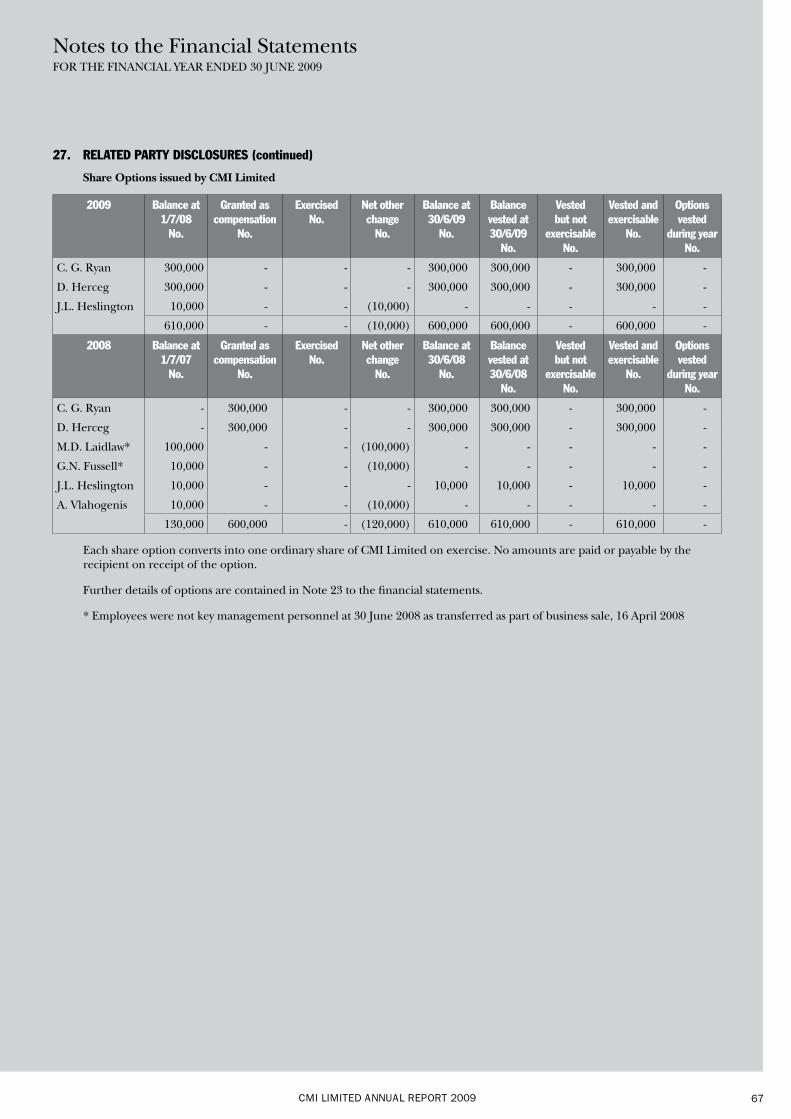
CMI LIMITED ANNUAL REPORT 2009 67
27. RELATED PARTY DISCLOSURES (continued)
Share Options issued by CMI Limited
2009 Balance at 1/7/08
No.
Granted as compensation
No.
Exercised No.
Net other change
No.
Balance at 30/6/09
No.
Balance vested at 30/6/09
No.
Vested but not
exercisable No.
Vested and exercisable
No.
Options vested
during year No.
C. G. Ryan 300,000 - - - 300,000 300,000 - 300,000 -
D. Herceg 300,000 - - - 300,000 300,000 - 300,000 -
J.L. Heslington 10,000 - - (10,000) - - - - -
610,000 - - (10,000) 600,000 600,000 - 600,000 -
2008 Balance at 1/7/07
No.
Granted as compensation
No.
Exercised No.
Net other change
No.
Balance at 30/6/08
No.
Balance vested at 30/6/08
No.
Vested but not
exercisable No.
Vested and exercisable
No.
Options vested
during year No.
C. G. Ryan - 300,000 - - 300,000 300,000 - 300,000 -
D. Herceg - 300,000 - - 300,000 300,000 - 300,000 -
M.D. Laidlaw* 100,000 - - (100,000) - - - - -
G.N. Fussell* 10,000 - - (10,000) - - - - -
J.L. Heslington 10,000 - - - 10,000 10,000 - 10,000 -
A. Vlahogenis 10,000 - - (10,000) - - - - -
130,000 600,000 - (120,000) 610,000 610,000 - 610,000 -
Each share option converts into one ordinary share of CMI Limited on exercise. No amounts are paid or payable by the recipient on receipt of the option.
Further details of options are contained in Note 23 to the financial statements.
* Employees were not key management personnel at 30 June 2008 as transferred as part of business sale, 16 April 2008
Notes to the Financial StatementsFOR THE FINANCIAL YEAR ENDED 30 JUNE 2009
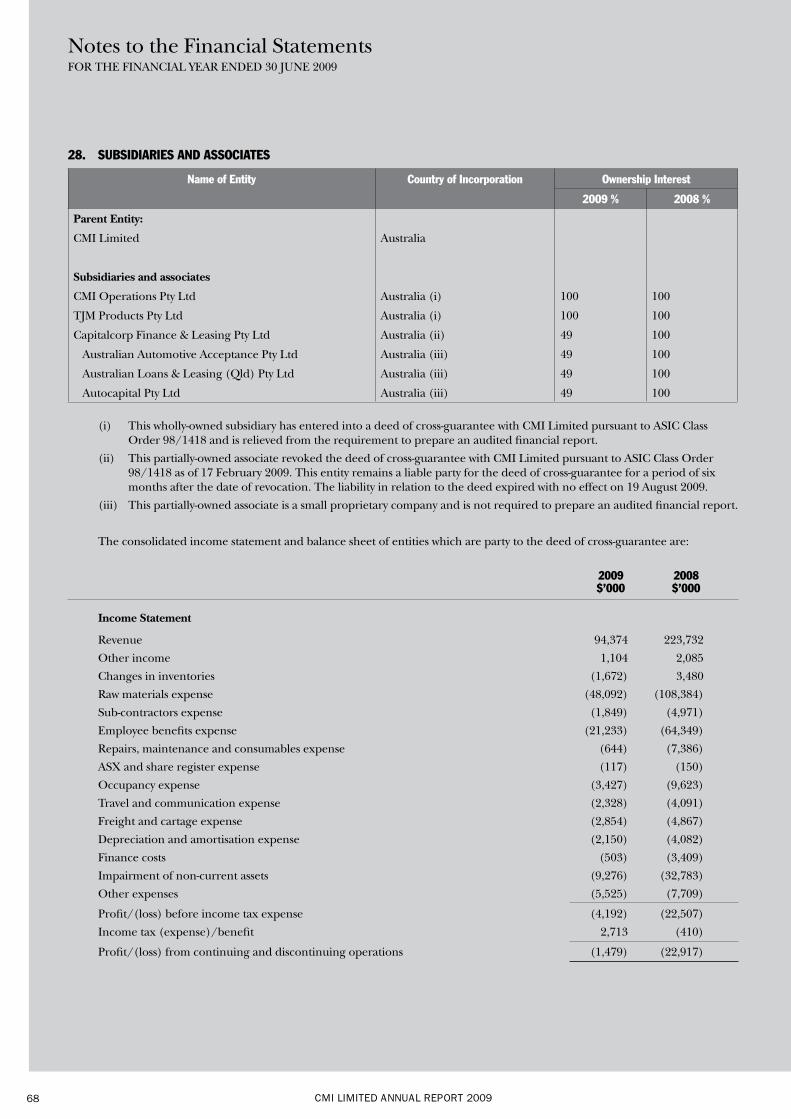
CMI LIMITED ANNUAL REPORT 200968
28. SUBSIDIARIES AND ASSOCIATES
Name of Entity Country of Incorporation Ownership Interest
2009 % 2008 %
Parent Entity:
CMI Limited Australia
Subsidiaries and associates
CMI Operations Pty Ltd Australia (i) 100 100
TJM Products Pty Ltd Australia (i) 100 100
Capitalcorp Finance & Leasing Pty Ltd Australia (ii) 49 100
Australian Automotive Acceptance Pty Ltd Australia (iii) 49 100
Australian Loans & Leasing (Qld) Pty Ltd Australia (iii) 49 100
Autocapital Pty Ltd Australia (iii) 49 100
(i) This wholly-owned subsidiary has entered into a deed of cross-guarantee with CMI Limited pursuant to ASIC Class Order 98/1418 and is relieved from the requirement to prepare an audited financial report.
(ii) This partially-owned associate revoked the deed of cross-guarantee with CMI Limited pursuant to ASIC Class Order 98/1418 as of 17 February 2009. This entity remains a liable party for the deed of cross-guarantee for a period of six months after the date of revocation. The liability in relation to the deed expired with no effect on 19 August 2009.
(iii) This partially-owned associate is a small proprietary company and is not required to prepare an audited financial report.
The consolidated income statement and balance sheet of entities which are party to the deed of cross-guarantee are:
2009 2008 $’000 $’000
Income Statement
Revenue 94,374 223,732
Other income 1,104 2,085
Changes in inventories (1,672) 3,480
Raw materials expense (48,092) (108,384)
Sub-contractors expense (1,849) (4,971)
Employee benefits expense (21,233) (64,349)
Repairs, maintenance and consumables expense (644) (7,386)
ASX and share register expense (117) (150)
Occupancy expense (3,427) (9,623)
Travel and communication expense (2,328) (4,091)
Freight and cartage expense (2,854) (4,867)
Depreciation and amortisation expense (2,150) (4,082)
Finance costs (503) (3,409)
Impairment of non-current assets (9,276) (32,783)
Other expenses (5,525) (7,709)
Profit/(loss) before income tax expense (4,192) (22,507)
Income tax (expense)/benefit 2,713 (410)
Profit/(loss) from continuing and discontinuing operations (1,479) (22,917)
Notes to the Financial StatementsFOR THE FINANCIAL YEAR ENDED 30 JUNE 2009
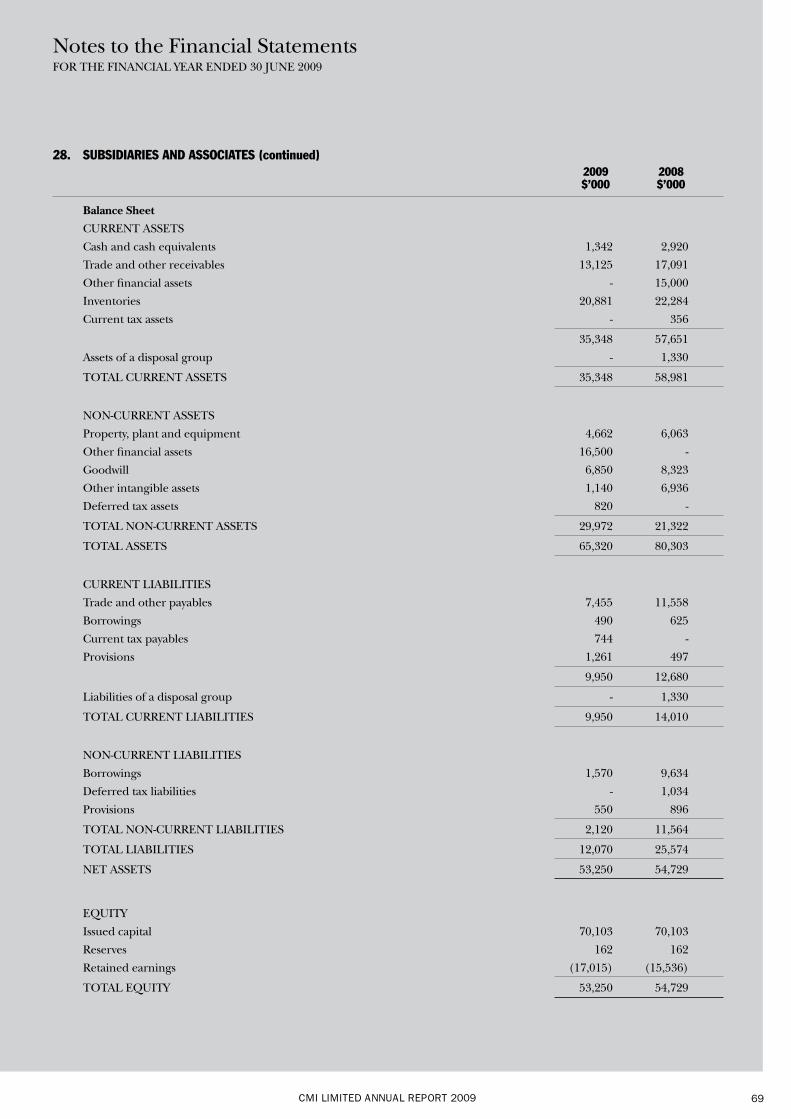
CMI LIMITED ANNUAL REPORT 2009 69
28. SUBSIDIARIES AND ASSOCIATES (continued) 2009 2008 $’000 $’000
Balance Sheet
CURRENT ASSETS
Cash and cash equivalents 1,342 2,920
Trade and other receivables 13,125 17,091
Other financial assets - 15,000
Inventories 20,881 22,284
Current tax assets - 356
35,348 57,651
Assets of a disposal group - 1,330
TOTAL CURRENT ASSETS 35,348 58,981
NON-CURRENT ASSETS
Property, plant and equipment 4,662 6,063
Other financial assets 16,500 -
Goodwill 6,850 8,323
Other intangible assets 1,140 6,936
Deferred tax assets 820 -
TOTAL NON-CURRENT ASSETS 29,972 21,322
TOTAL ASSETS 65,320 80,303
CURRENT LIABILITIES
Trade and other payables 7,455 11,558
Borrowings 490 625
Current tax payables 744 -
Provisions 1,261 497
9,950 12,680
Liabilities of a disposal group - 1,330
TOTAL CURRENT LIABILITIES 9,950 14,010
NON-CURRENT LIABILITIES
Borrowings 1,570 9,634
Deferred tax liabilities - 1,034
Provisions 550 896
TOTAL NON-CURRENT LIABILITIES 2,120 11,564
TOTAL LIABILITIES 12,070 25,574
NET ASSETS 53,250 54,729
EQUITY
Issued capital 70,103 70,103
Reserves 162 162
Retained earnings (17,015) (15,536)
TOTAL EQUITY 53,250 54,729
Notes to the Financial StatementsFOR THE FINANCIAL YEAR ENDED 30 JUNE 2009
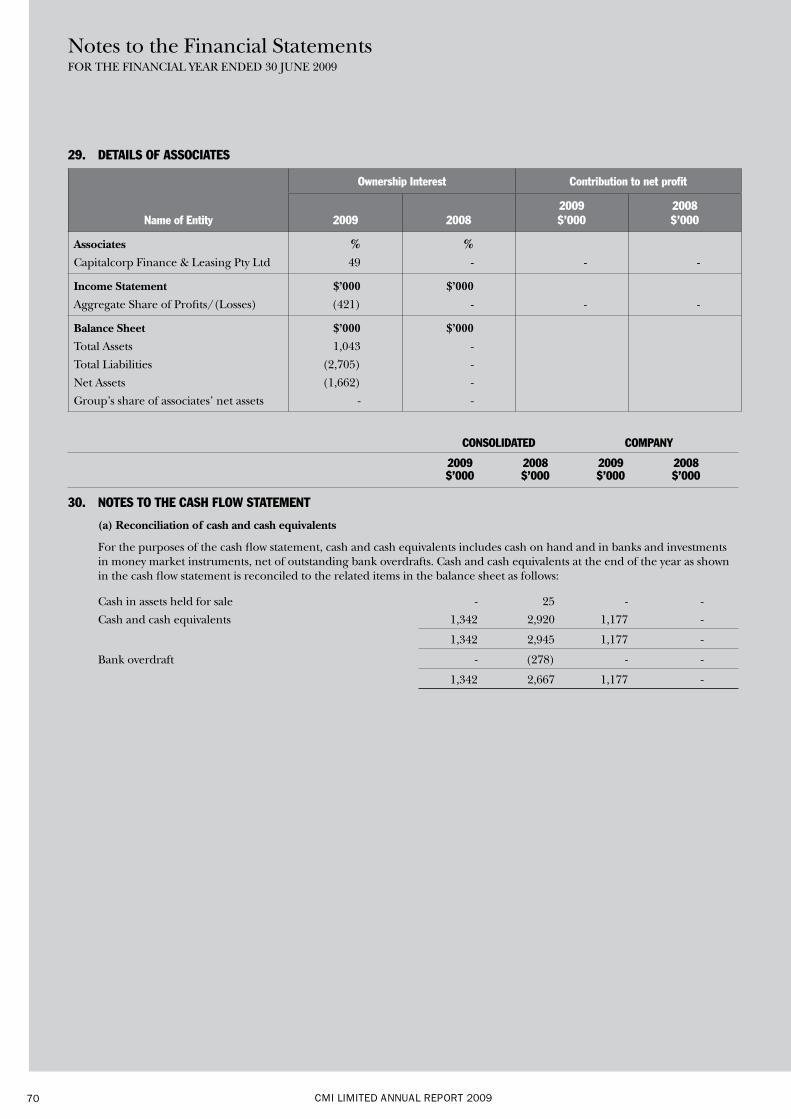
CMI LIMITED ANNUAL REPORT 200970
29. DETAILS OF ASSOCIATES
Name of Entity
Ownership Interest Contribution to net profit
2009 20082009 $’000
2008 $’000
Associates
Capitalcorp Finance & Leasing Pty Ltd
%
49
%
- - -
Income Statement
Aggregate Share of Profits/(Losses)
$’000
(421)
$’000
- - -
Balance Sheet
Total Assets
Total Liabilities
Net Assets
Group’s share of associates’ net assets
$’000
1,043
(2,705)
(1,662)
-
$’000
-
-
-
-
CONSOLIDATED COMPANY
2009 2008 2009 2008 $’000 $’000 $’000 $’000
30. NOTES TO THE CASH FLOW STATEMENT
(a) Reconciliation of cash and cash equivalents
For the purposes of the cash flow statement, cash and cash equivalents includes cash on hand and in banks and investments in money market instruments, net of outstanding bank overdrafts. Cash and cash equivalents at the end of the year as shown in the cash flow statement is reconciled to the related items in the balance sheet as follows:
Cash in assets held for sale - 25 - -
Cash and cash equivalents 1,342 2,920 1,177 -
1,342 2,945 1,177 -
Bank overdraft - (278) - -
1,342 2,667 1,177 -
Notes to the Financial StatementsFOR THE FINANCIAL YEAR ENDED 30 JUNE 2009
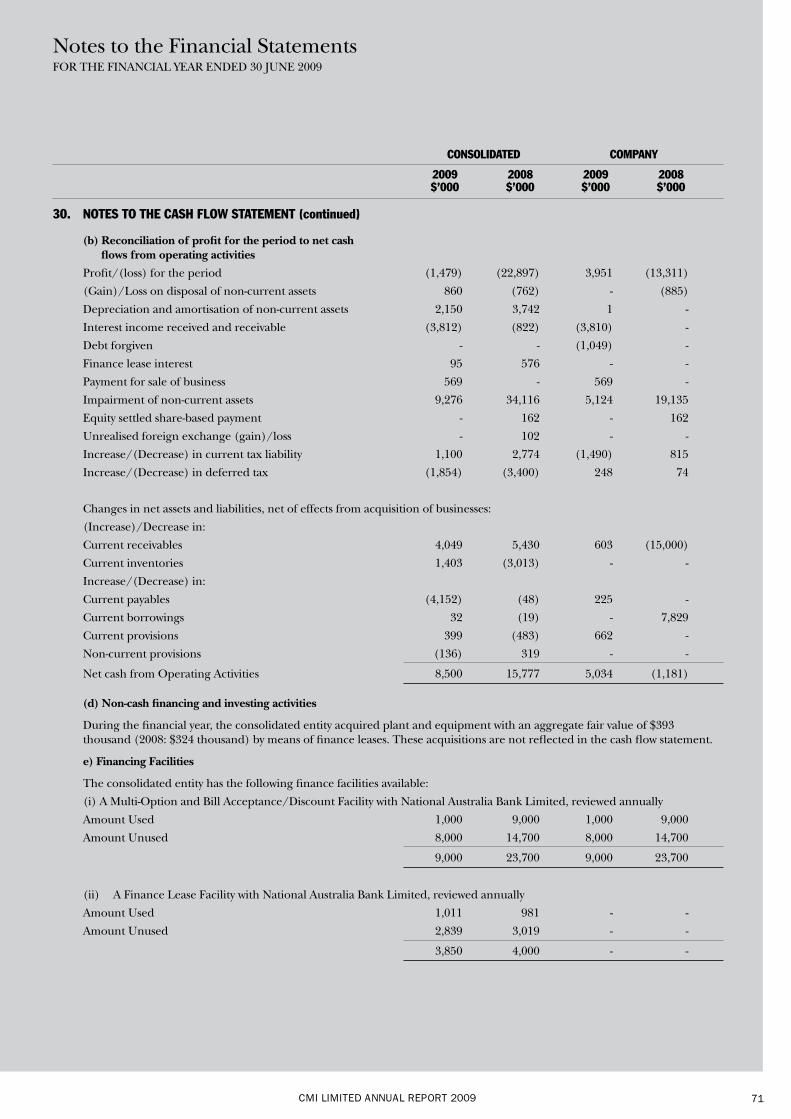
CMI LIMITED ANNUAL REPORT 2009 71
CONSOLIDATED COMPANY
2009 2008 2009 2008 $’000 $’000 $’000 $’000
30. NOTES TO THE CASH FLOW STATEMENT (continued)
(b) Reconciliation of profit for the period to net cash flows from operating activities
Profit/(loss) for the period (1,479) (22,897) 3,951 (13,311)
(Gain)/Loss on disposal of non-current assets 860 (762) - (885)
Depreciation and amortisation of non-current assets 2,150 3,742 1 -
Interest income received and receivable (3,812) (822) (3,810) -
Debt forgiven - - (1,049) -
Finance lease interest 95 576 - -
Payment for sale of business 569 - 569 -
Impairment of non-current assets 9,276 34,116 5,124 19,135
Equity settled share-based payment - 162 - 162
Unrealised foreign exchange (gain)/loss - 102 - -
Increase/(Decrease) in current tax liability 1,100 2,774 (1,490) 815
Increase/(Decrease) in deferred tax (1,854) (3,400) 248 74
Changes in net assets and liabilities, net of effects from acquisition of businesses:
(Increase)/Decrease in:
Current receivables 4,049 5,430 603 (15,000)
Current inventories 1,403 (3,013) - -
Increase/(Decrease) in:
Current payables (4,152) (48) 225 -
Current borrowings 32 (19) - 7,829
Current provisions 399 (483) 662 -
Non-current provisions (136) 319 - -
Net cash from Operating Activities 8,500 15,777 5,034 (1,181)
(d) Non-cash financing and investing activities
During the financial year, the consolidated entity acquired plant and equipment with an aggregate fair value of $393 thousand (2008: $324 thousand) by means of finance leases. These acquisitions are not reflected in the cash flow statement.
e) Financing Facilities
The consolidated entity has the following finance facilities available:
(i) A Multi-Option and Bill Acceptance/Discount Facility with National Australia Bank Limited, reviewed annually
Amount Used 1,000 9,000 1,000 9,000
Amount Unused 8,000 14,700 8,000 14,700
9,000 23,700 9,000 23,700
(ii) A Finance Lease Facility with National Australia Bank Limited, reviewed annually
Amount Used 1,011 981 - -
Amount Unused 2,839 3,019 - -
3,850 4,000 - -
Notes to the Financial StatementsFOR THE FINANCIAL YEAR ENDED 30 JUNE 2009
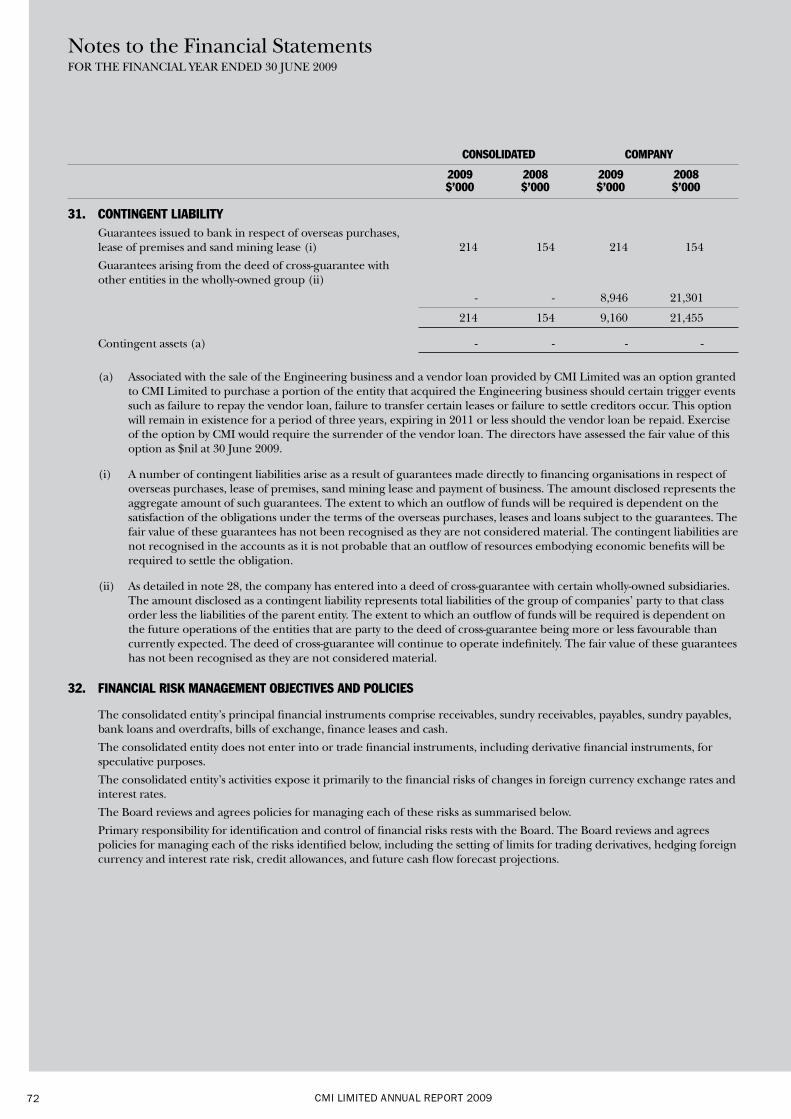
CMI LIMITED ANNUAL REPORT 200972
CONSOLIDATED COMPANY
2009 2008 2009 2008 $’000 $’000 $’000 $’000
31. CONTINGENT LIABILITY Guarantees issued to bank in respect of overseas purchases,
lease of premises and sand mining lease (i) 214 154 214 154
Guarantees arising from the deed of cross-guarantee with other entities in the wholly-owned group (ii)
- - 8,946 21,301
214 154 9,160 21,455
Contingent assets (a) - - - -
(a) Associated with the sale of the Engineering business and a vendor loan provided by CMI Limited was an option granted to CMI Limited to purchase a portion of the entity that acquired the Engineering business should certain trigger events such as failure to repay the vendor loan, failure to transfer certain leases or failure to settle creditors occur. This option will remain in existence for a period of three years, expiring in 2011 or less should the vendor loan be repaid. Exercise of the option by CMI would require the surrender of the vendor loan. The directors have assessed the fair value of this option as $nil at 30 June 2009.
(i) A number of contingent liabilities arise as a result of guarantees made directly to financing organisations in respect of overseas purchases, lease of premises, sand mining lease and payment of business. The amount disclosed represents the aggregate amount of such guarantees. The extent to which an outflow of funds will be required is dependent on the satisfaction of the obligations under the terms of the overseas purchases, leases and loans subject to the guarantees. The fair value of these guarantees has not been recognised as they are not considered material. The contingent liabilities are not recognised in the accounts as it is not probable that an outflow of resources embodying economic benefits will be required to settle the obligation.
(ii) As detailed in note 28, the company has entered into a deed of cross-guarantee with certain wholly-owned subsidiaries. The amount disclosed as a contingent liability represents total liabilities of the group of companies’ party to that class order less the liabilities of the parent entity. The extent to which an outflow of funds will be required is dependent on the future operations of the entities that are party to the deed of cross-guarantee being more or less favourable than currently expected. The deed of cross-guarantee will continue to operate indefinitely. The fair value of these guarantees has not been recognised as they are not considered material.
32. FINANCIAL RISK MANAGEMENT OBJECTIVES AND POLICIES
The consolidated entity’s principal financial instruments comprise receivables, sundry receivables, payables, sundry payables, bank loans and overdrafts, bills of exchange, finance leases and cash.
The consolidated entity does not enter into or trade financial instruments, including derivative financial instruments, for speculative purposes.
The consolidated entity’s activities expose it primarily to the financial risks of changes in foreign currency exchange rates and interest rates.
The Board reviews and agrees policies for managing each of these risks as summarised below.
Primary responsibility for identification and control of financial risks rests with the Board. The Board reviews and agrees policies for managing each of the risks identified below, including the setting of limits for trading derivatives, hedging foreign currency and interest rate risk, credit allowances, and future cash flow forecast projections.
Notes to the Financial StatementsFOR THE FINANCIAL YEAR ENDED 30 JUNE 2009
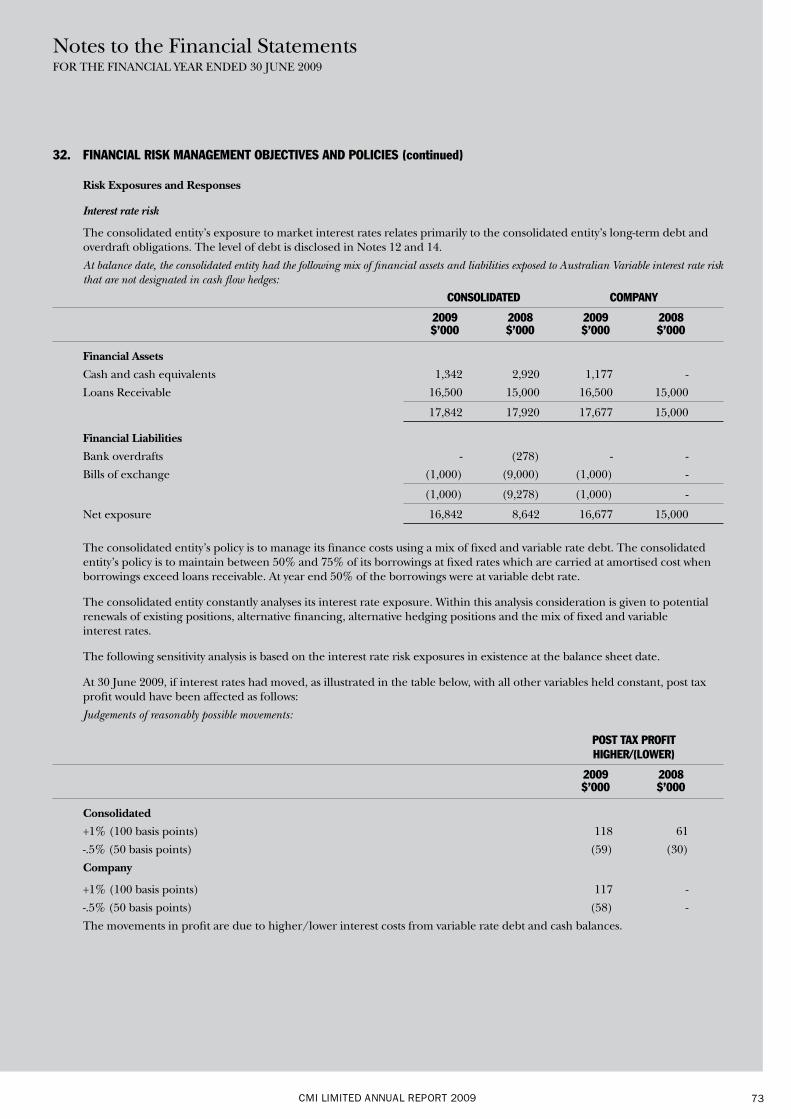
CMI LIMITED ANNUAL REPORT 2009 73
32. FINANCIAL RISK MANAGEMENT OBJECTIVES AND POLICIES (continued)
Risk Exposures and Responses
Interest rate risk
The consolidated entity’s exposure to market interest rates relates primarily to the consolidated entity’s long-term debt and overdraft obligations. The level of debt is disclosed in Notes 12 and 14.
At balance date, the consolidated entity had the following mix of financial assets and liabilities exposed to Australian Variable interest rate risk that are not designated in cash flow hedges:
CONSOLIDATED COMPANY
2009 2008 2009 2008 $’000 $’000 $’000 $’000
Financial Assets
Cash and cash equivalents 1,342 2,920 1,177 -
Loans Receivable 16,500 15,000 16,500 15,000
17,842 17,920 17,677 15,000
Financial Liabilities
Bank overdrafts - (278) - -
Bills of exchange (1,000) (9,000) (1,000) -
(1,000) (9,278) (1,000) -
Net exposure 16,842 8,642 16,677 15,000
The consolidated entity’s policy is to manage its finance costs using a mix of fixed and variable rate debt. The consolidated entity’s policy is to maintain between 50% and 75% of its borrowings at fixed rates which are carried at amortised cost when borrowings exceed loans receivable. At year end 50% of the borrowings were at variable debt rate.
The consolidated entity constantly analyses its interest rate exposure. Within this analysis consideration is given to potential renewals of existing positions, alternative financing, alternative hedging positions and the mix of fixed and variable interest rates.
The following sensitivity analysis is based on the interest rate risk exposures in existence at the balance sheet date.
At 30 June 2009, if interest rates had moved, as illustrated in the table below, with all other variables held constant, post tax profit would have been affected as follows:
Judgements of reasonably possible movements:
POST TAX PROFIT HIGHER/(LOWER)
2009 2008 $’000 $’000
Consolidated
+1% (100 basis points) 118 61
-.5% (50 basis points) (59) (30)
Company
+1% (100 basis points) 117 -
-.5% (50 basis points) (58) -
The movements in profit are due to higher/lower interest costs from variable rate debt and cash balances.
Notes to the Financial StatementsFOR THE FINANCIAL YEAR ENDED 30 JUNE 2009
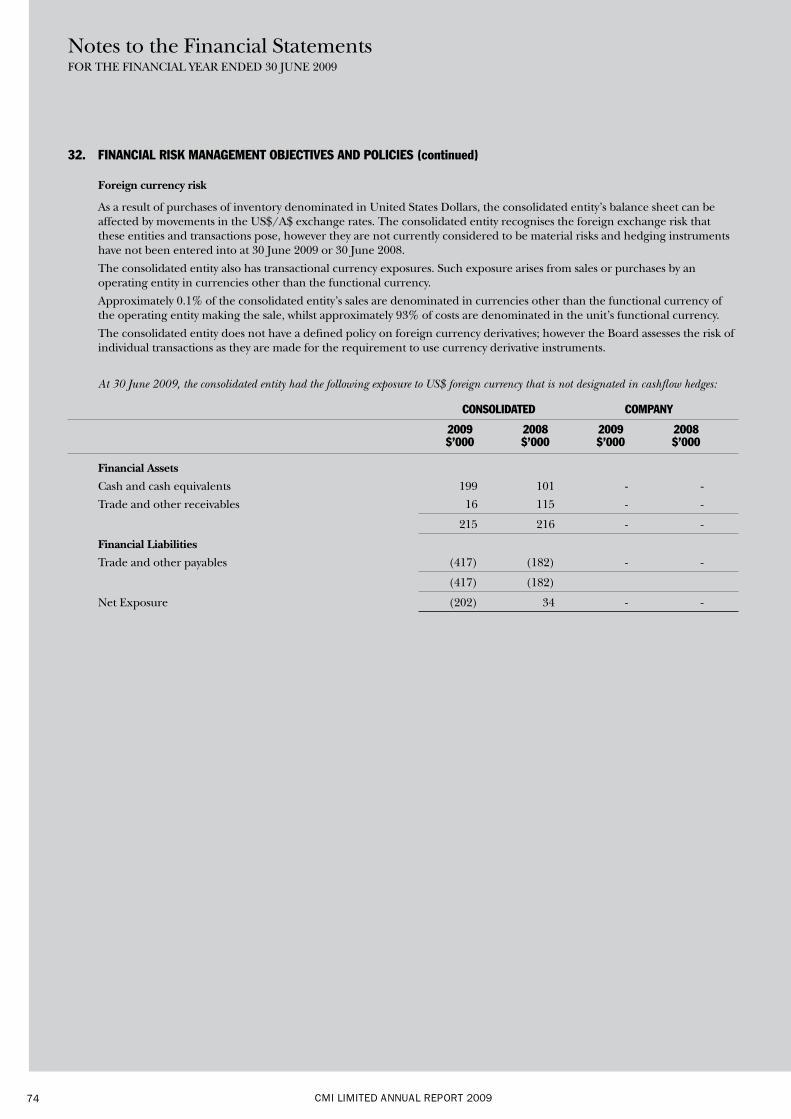
CMI LIMITED ANNUAL REPORT 200974
32. FINANCIAL RISK MANAGEMENT OBJECTIVES AND POLICIES (continued)
Foreign currency risk
As a result of purchases of inventory denominated in United States Dollars, the consolidated entity’s balance sheet can be affected by movements in the US$/A$ exchange rates. The consolidated entity recognises the foreign exchange risk that these entities and transactions pose, however they are not currently considered to be material risks and hedging instruments have not been entered into at 30 June 2009 or 30 June 2008.
The consolidated entity also has transactional currency exposures. Such exposure arises from sales or purchases by an operating entity in currencies other than the functional currency.
Approximately 0.1% of the consolidated entity’s sales are denominated in currencies other than the functional currency of the operating entity making the sale, whilst approximately 93% of costs are denominated in the unit’s functional currency.
The consolidated entity does not have a defined policy on foreign currency derivatives; however the Board assesses the risk of individual transactions as they are made for the requirement to use currency derivative instruments.
At 30 June 2009, the consolidated entity had the following exposure to US$ foreign currency that is not designated in cashflow hedges:
CONSOLIDATED COMPANY
2009 2008 2009 2008 $’000 $’000 $’000 $’000
Financial Assets
Cash and cash equivalents 199 101 - -
Trade and other receivables 16 115 - -
215 216 - -
Financial Liabilities
Trade and other payables (417) (182) - -
(417) (182)
Net Exposure (202) 34 - -
Notes to the Financial StatementsFOR THE FINANCIAL YEAR ENDED 30 JUNE 2009
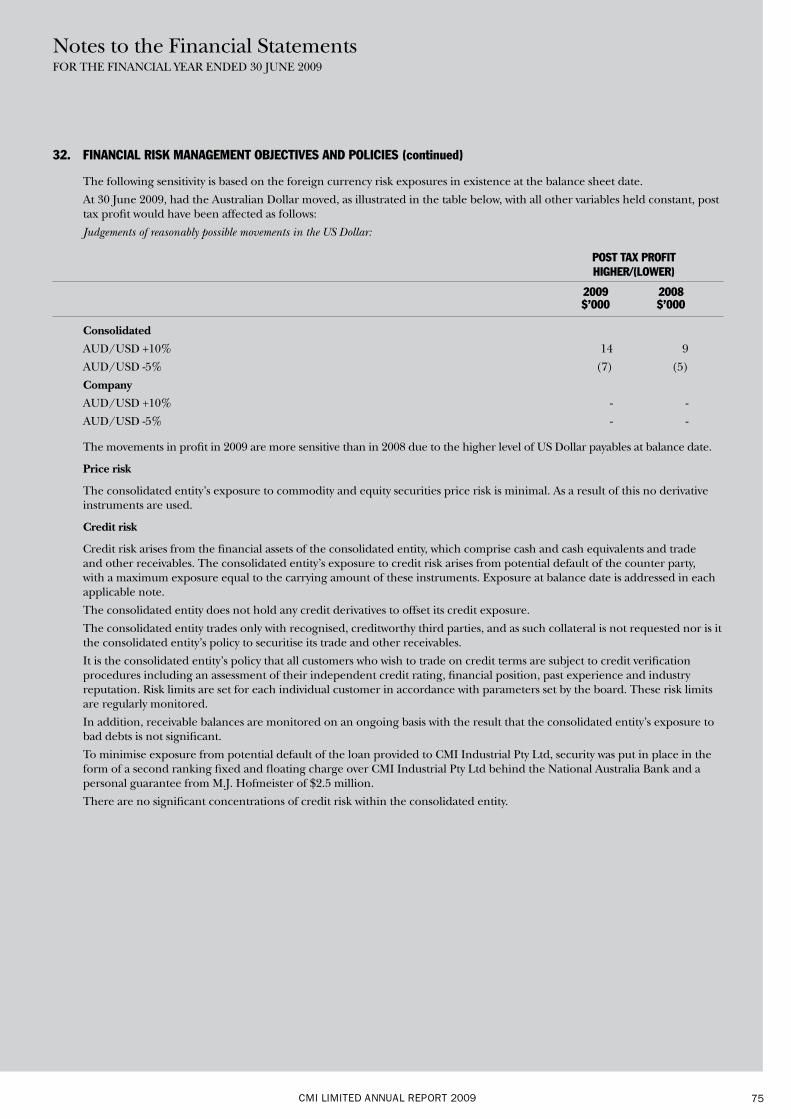
CMI LIMITED ANNUAL REPORT 2009 75
32. FINANCIAL RISK MANAGEMENT OBJECTIVES AND POLICIES (continued)
The following sensitivity is based on the foreign currency risk exposures in existence at the balance sheet date.
At 30 June 2009, had the Australian Dollar moved, as illustrated in the table below, with all other variables held constant, post tax profit would have been affected as follows:
Judgements of reasonably possible movements in the US Dollar:
POST TAX PROFIT HIGHER/(LOWER)
2009 2008 $’000 $’000
Consolidated
AUD/USD +10% 14 9
AUD/USD -5% (7) (5)
Company
AUD/USD +10% - -
AUD/USD -5% - -
The movements in profit in 2009 are more sensitive than in 2008 due to the higher level of US Dollar payables at balance date.
Price risk
The consolidated entity’s exposure to commodity and equity securities price risk is minimal. As a result of this no derivative instruments are used.
Credit risk
Credit risk arises from the financial assets of the consolidated entity, which comprise cash and cash equivalents and trade and other receivables. The consolidated entity’s exposure to credit risk arises from potential default of the counter party, with a maximum exposure equal to the carrying amount of these instruments. Exposure at balance date is addressed in each applicable note.
The consolidated entity does not hold any credit derivatives to offset its credit exposure.
The consolidated entity trades only with recognised, creditworthy third parties, and as such collateral is not requested nor is it the consolidated entity’s policy to securitise its trade and other receivables.
It is the consolidated entity’s policy that all customers who wish to trade on credit terms are subject to credit verification procedures including an assessment of their independent credit rating, financial position, past experience and industry reputation. Risk limits are set for each individual customer in accordance with parameters set by the board. These risk limits are regularly monitored.
In addition, receivable balances are monitored on an ongoing basis with the result that the consolidated entity’s exposure to bad debts is not significant.
To minimise exposure from potential default of the loan provided to CMI Industrial Pty Ltd, security was put in place in the form of a second ranking fixed and floating charge over CMI Industrial Pty Ltd behind the National Australia Bank and a personal guarantee from M.J. Hofmeister of $2.5 million.
There are no significant concentrations of credit risk within the consolidated entity.
Notes to the Financial StatementsFOR THE FINANCIAL YEAR ENDED 30 JUNE 2009
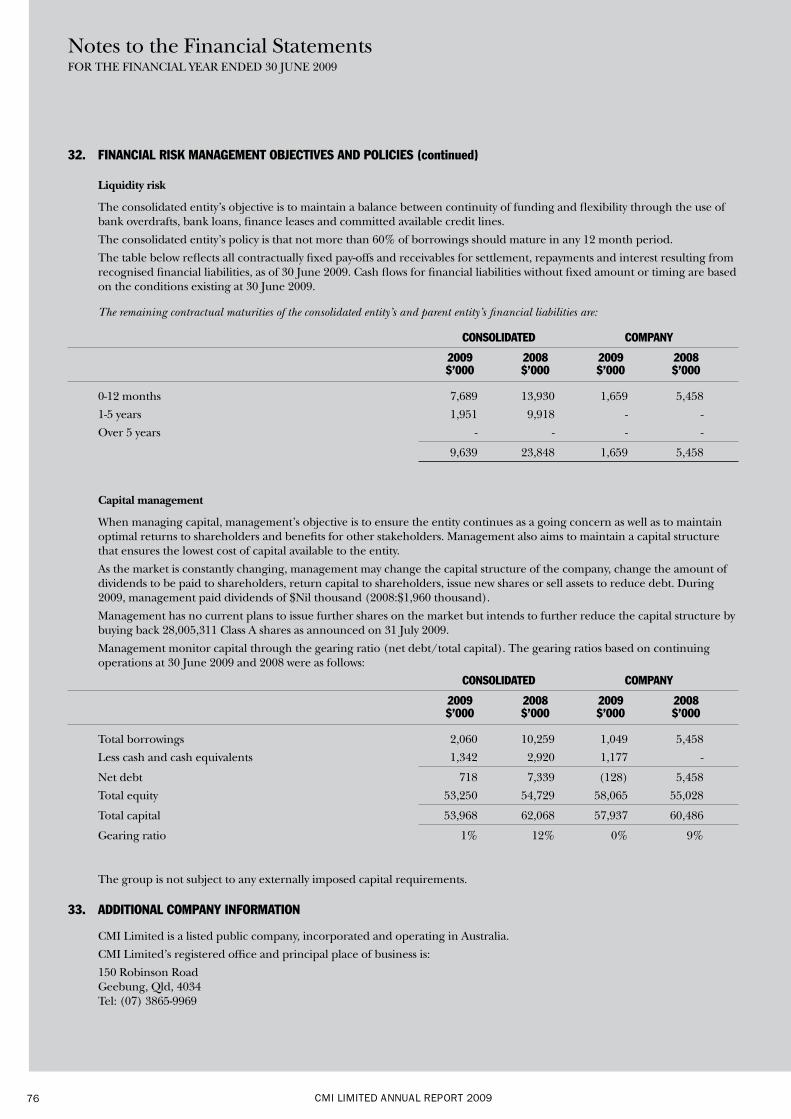
CMI LIMITED ANNUAL REPORT 200976
32. FINANCIAL RISK MANAGEMENT OBJECTIVES AND POLICIES (continued)
Liquidity risk
The consolidated entity’s objective is to maintain a balance between continuity of funding and flexibility through the use of bank overdrafts, bank loans, finance leases and committed available credit lines.
The consolidated entity’s policy is that not more than 60% of borrowings should mature in any 12 month period.
The table below reflects all contractually fixed pay-offs and receivables for settlement, repayments and interest resulting from recognised financial liabilities, as of 30 June 2009. Cash flows for financial liabilities without fixed amount or timing are based on the conditions existing at 30 June 2009.
The remaining contractual maturities of the consolidated entity’s and parent entity’s financial liabilities are:
CONSOLIDATED COMPANY
2009 2008 2009 2008 $’000 $’000 $’000 $’000
0-12 months 7,689 13,930 1,659 5,458
1-5 years 1,951 9,918 - -
Over 5 years - - - -
9,639 23,848 1,659 5,458
Capital management
When managing capital, management’s objective is to ensure the entity continues as a going concern as well as to maintain optimal returns to shareholders and benefits for other stakeholders. Management also aims to maintain a capital structure that ensures the lowest cost of capital available to the entity.
As the market is constantly changing, management may change the capital structure of the company, change the amount of dividends to be paid to shareholders, return capital to shareholders, issue new shares or sell assets to reduce debt. During 2009, management paid dividends of $Nil thousand (2008:$1,960 thousand).
Management has no current plans to issue further shares on the market but intends to further reduce the capital structure by buying back 28,005,311 Class A shares as announced on 31 July 2009.
Management monitor capital through the gearing ratio (net debt/total capital). The gearing ratios based on continuing operations at 30 June 2009 and 2008 were as follows:
CONSOLIDATED COMPANY
2009 2008 2009 2008 $’000 $’000 $’000 $’000
Total borrowings 2,060 10,259 1,049 5,458
Less cash and cash equivalents 1,342 2,920 1,177 -
Net debt 718 7,339 (128) 5,458
Total equity 53,250 54,729 58,065 55,028
Total capital 53,968 62,068 57,937 60,486
Gearing ratio 1% 12% 0% 9%
The group is not subject to any externally imposed capital requirements.
33. ADDITIONAL COMPANY INFORMATION
CMI Limited is a listed public company, incorporated and operating in Australia.
CMI Limited’s registered office and principal place of business is:
150 Robinson Road Geebung, Qld, 4034 Tel: (07) 3865-9969
Notes to the Financial StatementsFOR THE FINANCIAL YEAR ENDED 30 JUNE 2009
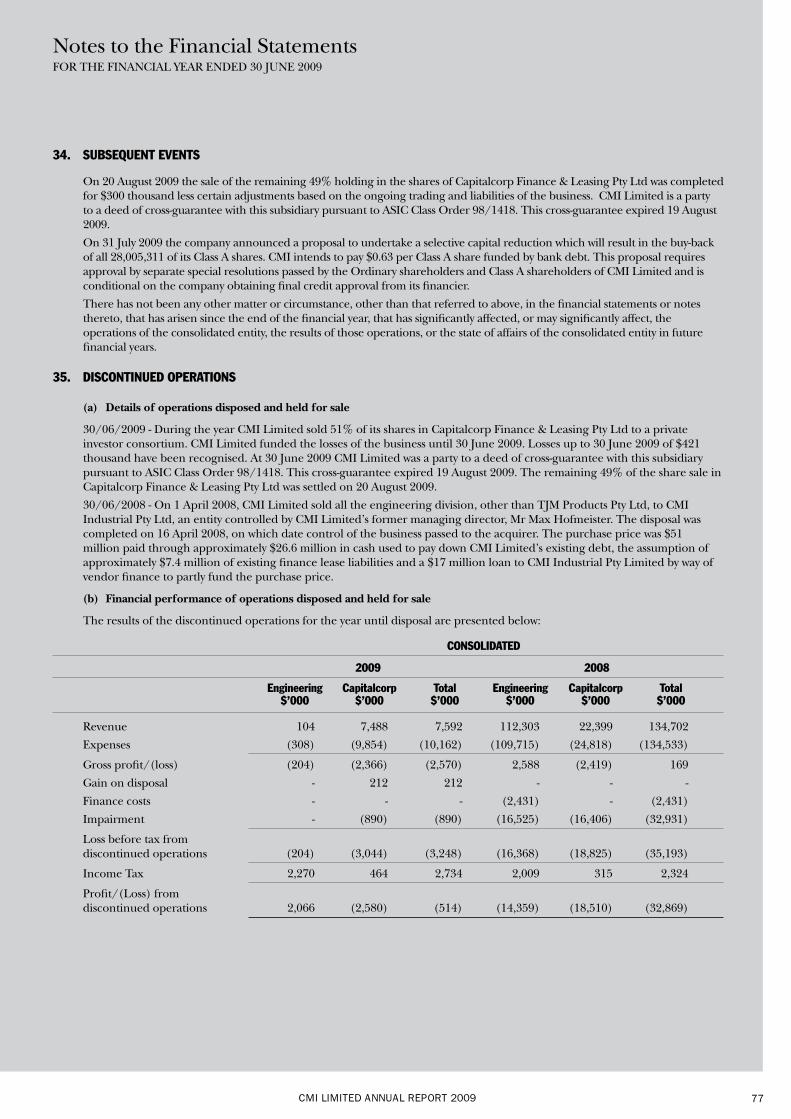
CMI LIMITED ANNUAL REPORT 2009 77
34. SUBSEQUENT EVENTS
On 20 August 2009 the sale of the remaining 49% holding in the shares of Capitalcorp Finance & Leasing Pty Ltd was completed for $300 thousand less certain adjustments based on the ongoing trading and liabilities of the business. CMI Limited is a party to a deed of cross-guarantee with this subsidiary pursuant to ASIC Class Order 98/1418. This cross-guarantee expired 19 August 2009.
On 31 July 2009 the company announced a proposal to undertake a selective capital reduction which will result in the buy-back of all 28,005,311 of its Class A shares. CMI intends to pay $0.63 per Class A share funded by bank debt. This proposal requires approval by separate special resolutions passed by the Ordinary shareholders and Class A shareholders of CMI Limited and is conditional on the company obtaining final credit approval from its financier.
There has not been any other matter or circumstance, other than that referred to above, in the financial statements or notes thereto, that has arisen since the end of the financial year, that has significantly affected, or may significantly affect, the operations of the consolidated entity, the results of those operations, or the state of affairs of the consolidated entity in future financial years.
35. DISCONTINUED OPERATIONS
(a) Details of operations disposed and held for sale
30/06/2009 - During the year CMI Limited sold 51% of its shares in Capitalcorp Finance & Leasing Pty Ltd to a private investor consortium. CMI Limited funded the losses of the business until 30 June 2009. Losses up to 30 June 2009 of $421 thousand have been recognised. At 30 June 2009 CMI Limited was a party to a deed of cross-guarantee with this subsidiary pursuant to ASIC Class Order 98/1418. This cross-guarantee expired 19 August 2009. The remaining 49% of the share sale in Capitalcorp Finance & Leasing Pty Ltd was settled on 20 August 2009.
30/06/2008 - On 1 April 2008, CMI Limited sold all the engineering division, other than TJM Products Pty Ltd, to CMI Industrial Pty Ltd, an entity controlled by CMI Limited’s former managing director, Mr Max Hofmeister. The disposal was completed on 16 April 2008, on which date control of the business passed to the acquirer. The purchase price was $51 million paid through approximately $26.6 million in cash used to pay down CMI Limited’s existing debt, the assumption of approximately $7.4 million of existing finance lease liabilities and a $17 million loan to CMI Industrial Pty Limited by way of vendor finance to partly fund the purchase price.
(b) Financial performance of operations disposed and held for sale
The results of the discontinued operations for the year until disposal are presented below:
CONSOLIDATED
2009 2008
Engineering Capitalcorp Total Engineering Capitalcorp Total $’000 $’000 $’000 $’000 $’000 $’000
Revenue 104 7,488 7,592 112,303 22,399 134,702
Expenses (308) (9,854) (10,162) (109,715) (24,818) (134,533)
Gross profit/(loss) (204) (2,366) (2,570) 2,588 (2,419) 169
Gain on disposal - 212 212 - - -
Finance costs - - - (2,431) - (2,431)
Impairment - (890) (890) (16,525) (16,406) (32,931)
Loss before tax from discontinued operations (204) (3,044) (3,248) (16,368) (18,825) (35,193)
Income Tax 2,270 464 2,734 2,009 315 2,324
Profit/(Loss) from discontinued operations 2,066 (2,580) (514) (14,359) (18,510) (32,869)
Notes to the Financial StatementsFOR THE FINANCIAL YEAR ENDED 30 JUNE 2009
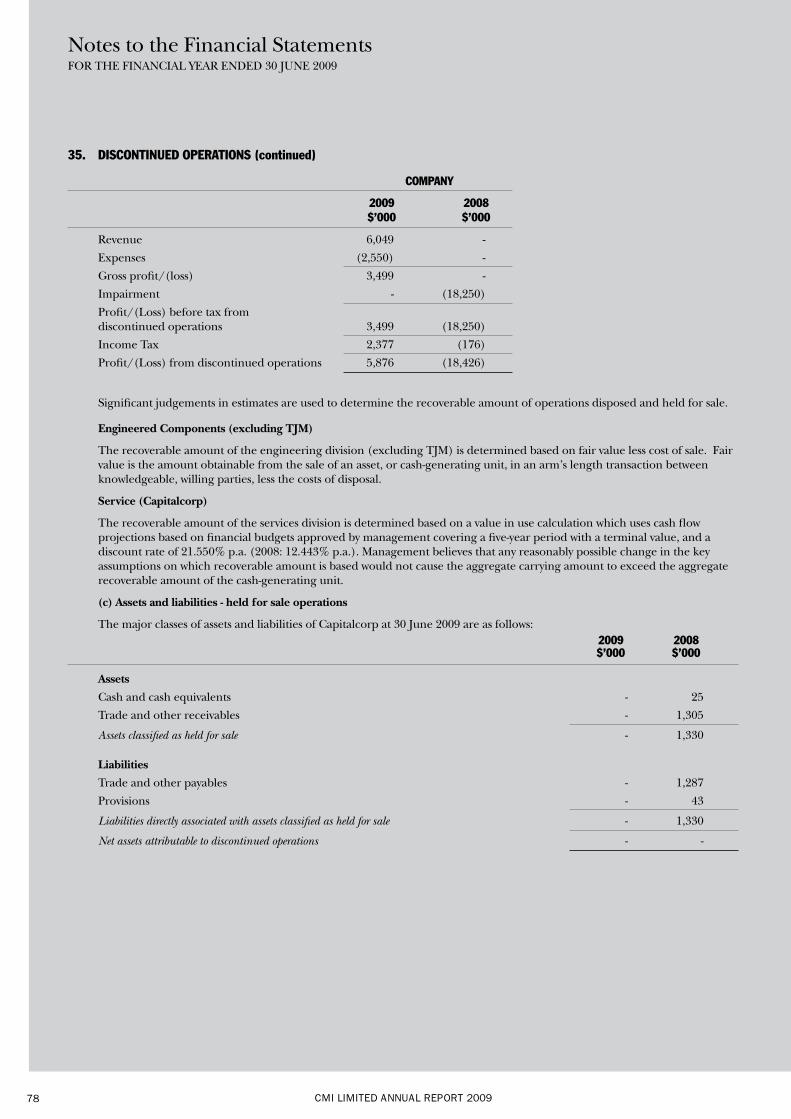
CMI LIMITED ANNUAL REPORT 200978
Notes to the Financial StatementsFOR THE FINANCIAL YEAR ENDED 30 JUNE 2009
35. DISCONTINUED OPERATIONS (continued)
COMPANY
2009 2008 $’000 $’000
Revenue 6,049 -
Expenses (2,550) -
Gross profit/(loss) 3,499 -
Impairment - (18,250)
Profit/(Loss) before tax from discontinued operations 3,499 (18,250)
Income Tax 2,377 (176)
Profit/(Loss) from discontinued operations 5,876 (18,426)
Significant judgements in estimates are used to determine the recoverable amount of operations disposed and held for sale.
Engineered Components (excluding TJM)
The recoverable amount of the engineering division (excluding TJM) is determined based on fair value less cost of sale. Fair value is the amount obtainable from the sale of an asset, or cash-generating unit, in an arm’s length transaction between knowledgeable, willing parties, less the costs of disposal.
Service (Capitalcorp)
The recoverable amount of the services division is determined based on a value in use calculation which uses cash flow projections based on financial budgets approved by management covering a five-year period with a terminal value, and a discount rate of 21.550% p.a. (2008: 12.443% p.a.). Management believes that any reasonably possible change in the key assumptions on which recoverable amount is based would not cause the aggregate carrying amount to exceed the aggregate recoverable amount of the cash-generating unit.
(c) Assets and liabilities - held for sale operations
The major classes of assets and liabilities of Capitalcorp at 30 June 2009 are as follows: 2009 2008 $’000 $’000
Assets
Cash and cash equivalents - 25
Trade and other receivables - 1,305
Assets classified as held for sale - 1,330
Liabilities
Trade and other payables - 1,287
Provisions - 43
Liabilities directly associated with assets classified as held for sale - 1,330
Net assets attributable to discontinued operations - -
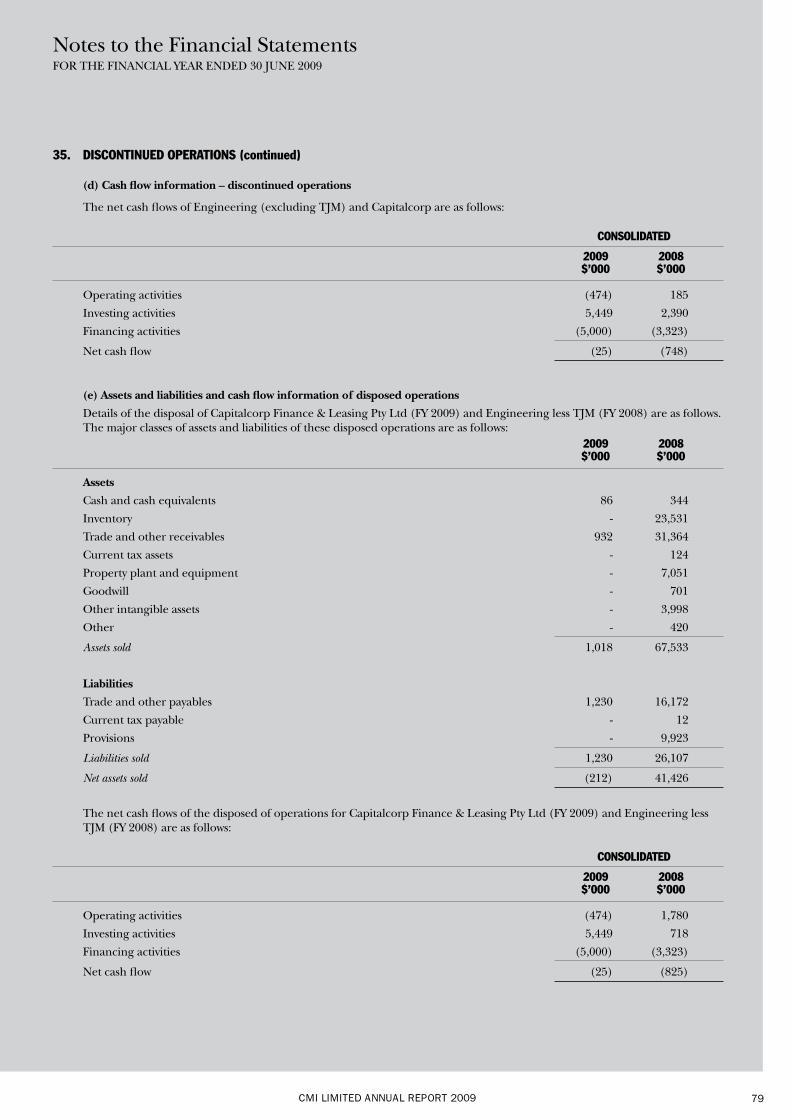
CMI LIMITED ANNUAL REPORT 2009 79
Notes to the Financial StatementsFOR THE FINANCIAL YEAR ENDED 30 JUNE 2009
35. DISCONTINUED OPERATIONS (continued)
(d) Cash flow information – discontinued operations
The net cash flows of Engineering (excluding TJM) and Capitalcorp are as follows:
CONSOLIDATED
2009 2008 $’000 $’000
Operating activities (474) 185
Investing activities 5,449 2,390
Financing activities (5,000) (3,323)
Net cash flow (25) (748)
(e) Assets and liabilities and cash flow information of disposed operations
Details of the disposal of Capitalcorp Finance & Leasing Pty Ltd (FY 2009) and Engineering less TJM (FY 2008) are as follows. The major classes of assets and liabilities of these disposed operations are as follows:
2009 2008 $’000 $’000
Assets
Cash and cash equivalents 86 344
Inventory - 23,531
Trade and other receivables 932 31,364
Current tax assets - 124
Property plant and equipment - 7,051
Goodwill - 701
Other intangible assets - 3,998
Other - 420
Assets sold 1,018 67,533
Liabilities
Trade and other payables 1,230 16,172
Current tax payable - 12
Provisions - 9,923
Liabilities sold 1,230 26,107
Net assets sold (212) 41,426
The net cash flows of the disposed of operations for Capitalcorp Finance & Leasing Pty Ltd (FY 2009) and Engineering less TJM (FY 2008) are as follows:
CONSOLIDATED
2009 2008 $’000 $’000
Operating activities (474) 1,780
Investing activities 5,449 718
Financing activities (5,000) (3,323)
Net cash flow (25) (825)
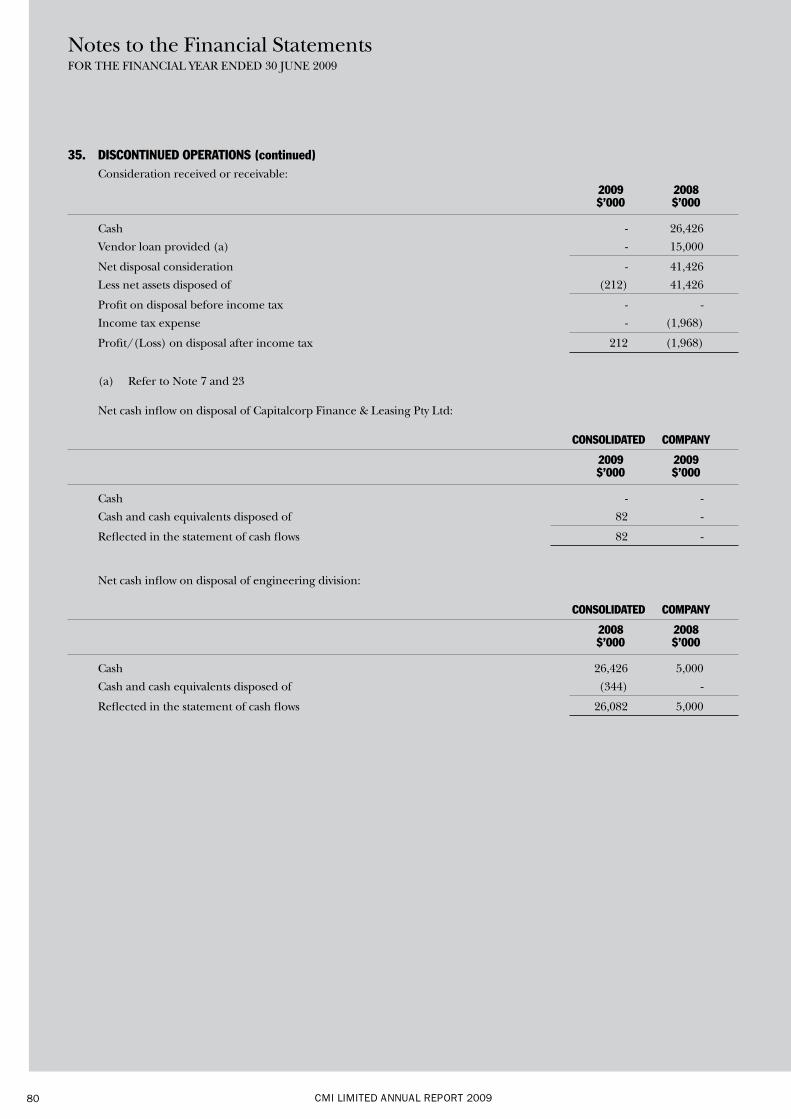
CMI LIMITED ANNUAL REPORT 200980
Notes to the Financial StatementsFOR THE FINANCIAL YEAR ENDED 30 JUNE 2009
35. DISCONTINUED OPERATIONS (continued) Consideration received or receivable: 2009 2008 $’000 $’000
Cash - 26,426
Vendor loan provided (a) - 15,000
Net disposal consideration - 41,426
Less net assets disposed of (212) 41,426
Profit on disposal before income tax - -
Income tax expense - (1,968)
Profit/(Loss) on disposal after income tax 212 (1,968)
(a) Refer to Note 7 and 23
Net cash inflow on disposal of Capitalcorp Finance & Leasing Pty Ltd:
CONSOLIDATED COMPANY
2009 2009 $’000 $’000
Cash - -
Cash and cash equivalents disposed of 82 -
Reflected in the statement of cash flows 82 -
Net cash inflow on disposal of engineering division:
CONSOLIDATED COMPANY
2008 2008 $’000 $’000
Cash 26,426 5,000
Cash and cash equivalents disposed of (344) -
Reflected in the statement of cash flows 26,082 5,000
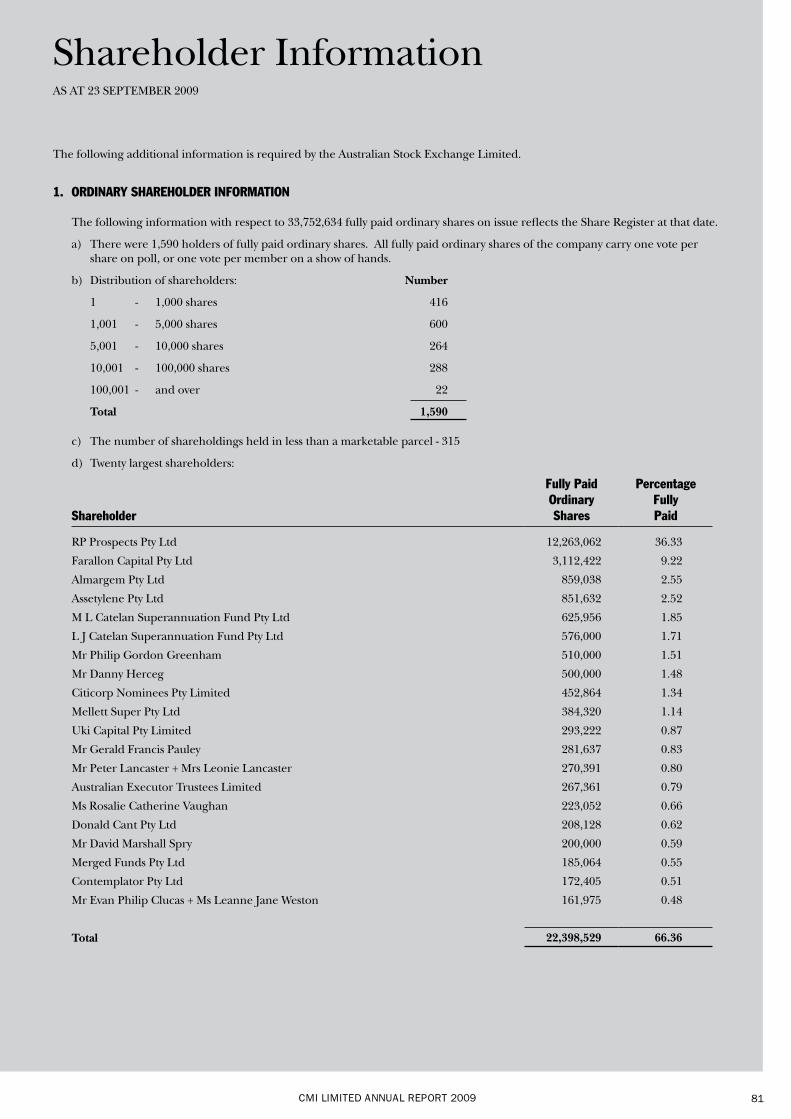
CMI LIMITED ANNUAL REPORT 2009 81
The following additional information is required by the Australian Stock Exchange Limited.
1. ORDINARY SHAREHOLDER INFORMATION
The following information with respect to 33,752,634 fully paid ordinary shares on issue reflects the Share Register at that date.
a) There were 1,590 holders of fully paid ordinary shares. All fully paid ordinary shares of the company carry one vote per share on poll, or one vote per member on a show of hands.
b) Distribution of shareholders: Number
1 - 1,000 shares 416
1,001 - 5,000 shares 600
5,001 - 10,000 shares 264
10,001 - 100,000 shares 288
100,001 - and over 22
Total 1,590
c) The number of shareholdings held in less than a marketable parcel - 315
d) Twenty largest shareholders:
Shareholder
Fully PaidOrdinaryShares
PercentageFullyPaid
RP Prospects Pty Ltd 12,263,062 36.33
Farallon Capital Pty Ltd 3,112,422 9.22
Almargem Pty Ltd 859,038 2.55
Assetylene Pty Ltd 851,632 2.52
M L Catelan Superannuation Fund Pty Ltd 625,956 1.85
L J Catelan Superannuation Fund Pty Ltd 576,000 1.71
Mr Philip Gordon Greenham 510,000 1.51
Mr Danny Herceg 500,000 1.48
Citicorp Nominees Pty Limited 452,864 1.34
Mellett Super Pty Ltd 384,320 1.14
Uki Capital Pty Limited 293,222 0.87
Mr Gerald Francis Pauley 281,637 0.83
Mr Peter Lancaster + Mrs Leonie Lancaster 270,391 0.80
Australian Executor Trustees Limited 267,361 0.79
Ms Rosalie Catherine Vaughan 223,052 0.66
Donald Cant Pty Ltd 208,128 0.62
Mr David Marshall Spry 200,000 0.59
Merged Funds Pty Ltd 185,064 0.55
Contemplator Pty Ltd 172,405 0.51
Mr Evan Philip Clucas + Ms Leanne Jane Weston 161,975 0.48
Total 22,398,529 66.36
Shareholder InformationAS AT 23 SEPTEMBER 2009
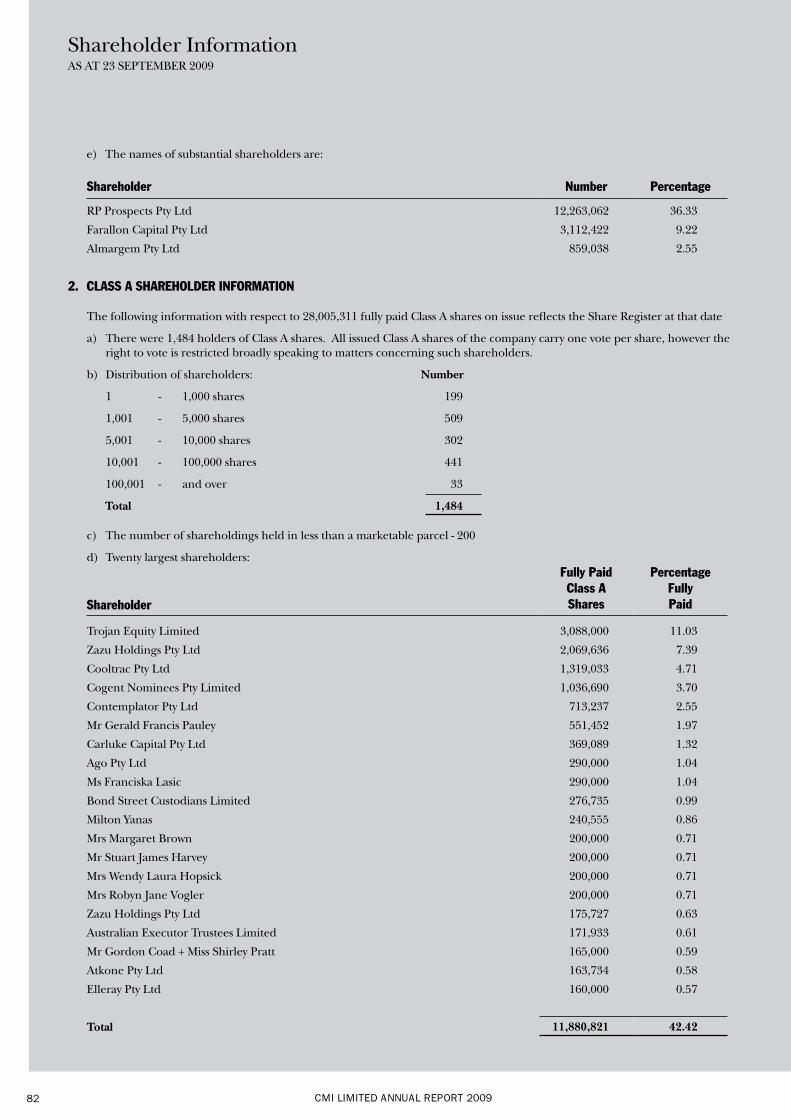
CMI LIMITED ANNUAL REPORT 200982
e) The names of substantial shareholders are:
Shareholder Number Percentage
RP Prospects Pty Ltd 12,263,062 36.33
Farallon Capital Pty Ltd 3,112,422 9.22
Almargem Pty Ltd 859,038 2.55
2. CLASS A SHAREHOLDER INFORMATION
The following information with respect to 28,005,311 fully paid Class A shares on issue reflects the Share Register at that date
a) There were 1,484 holders of Class A shares. All issued Class A shares of the company carry one vote per share, however the right to vote is restricted broadly speaking to matters concerning such shareholders.
b) Distribution of shareholders: Number
1 - 1,000 shares 199
1,001 - 5,000 shares 509
5,001 - 10,000 shares 302
10,001 - 100,000 shares 441
100,001 - and over 33
Total 1,484
c) The number of shareholdings held in less than a marketable parcel - 200
d) Twenty largest shareholders:
Shareholder
Fully PaidClass AShares
PercentageFullyPaid
Trojan Equity Limited 3,088,000 11.03
Zazu Holdings Pty Ltd 2,069,636 7.39
Cooltrac Pty Ltd 1,319,033 4.71
Cogent Nominees Pty Limited 1,036,690 3.70
Contemplator Pty Ltd 713,237 2.55
Mr Gerald Francis Pauley 551,452 1.97
Carluke Capital Pty Ltd 369,089 1.32
Ago Pty Ltd 290,000 1.04
Ms Franciska Lasic 290,000 1.04
Bond Street Custodians Limited 276,735 0.99
Milton Yanas 240,555 0.86
Mrs Margaret Brown 200,000 0.71
Mr Stuart James Harvey 200,000 0.71
Mrs Wendy Laura Hopsick 200,000 0.71
Mrs Robyn Jane Vogler 200,000 0.71
Zazu Holdings Pty Ltd 175,727 0.63
Australian Executor Trustees Limited 171,933 0.61
Mr Gordon Coad + Miss Shirley Pratt 165,000 0.59
Atkone Pty Ltd 163,734 0.58
Elleray Pty Ltd 160,000 0.57
Total 11,880,821 42.42
Shareholder InformationAS AT 23 SEPTEMBER 2009
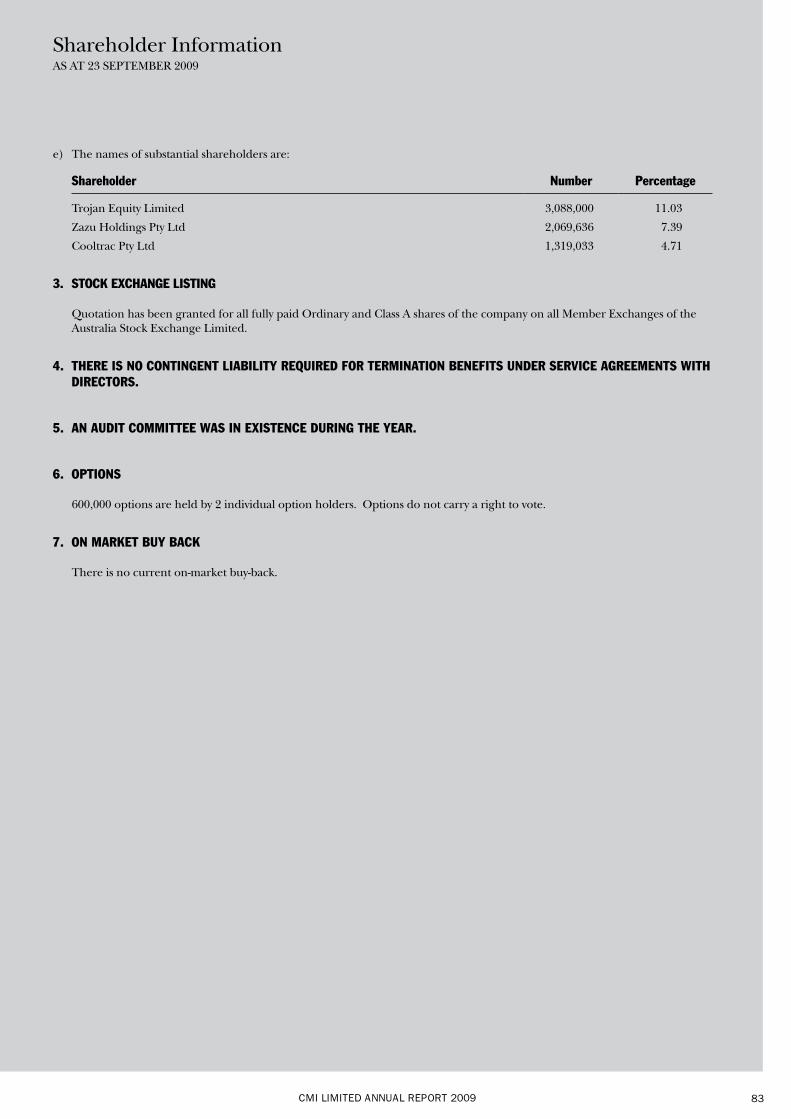
CMI LIMITED ANNUAL REPORT 2009 83
e) The names of substantial shareholders are:
Shareholder Number Percentage
Trojan Equity Limited 3,088,000 11.03
Zazu Holdings Pty Ltd 2,069,636 7.39
Cooltrac Pty Ltd 1,319,033 4.71
3. STOCK EXCHANGE LISTING
Quotation has been granted for all fully paid Ordinary and Class A shares of the company on all Member Exchanges of the Australia Stock Exchange Limited.
4. THERE IS NO CONTINGENT LIABILITY REQUIRED FOR TERMINATION BENEFITS UNDER SERVICE AGREEMENTS WITH DIRECTORS.
5. AN AUDIT COMMITTEE WAS IN EXISTENCE DURING THE YEAR.
6. OPTIONS
600,000 options are held by 2 individual option holders. Options do not carry a right to vote.
7. ON MARKET BUY BACK
There is no current on-market buy-back.
Shareholder InformationAS AT 23 SEPTEMBER 2009
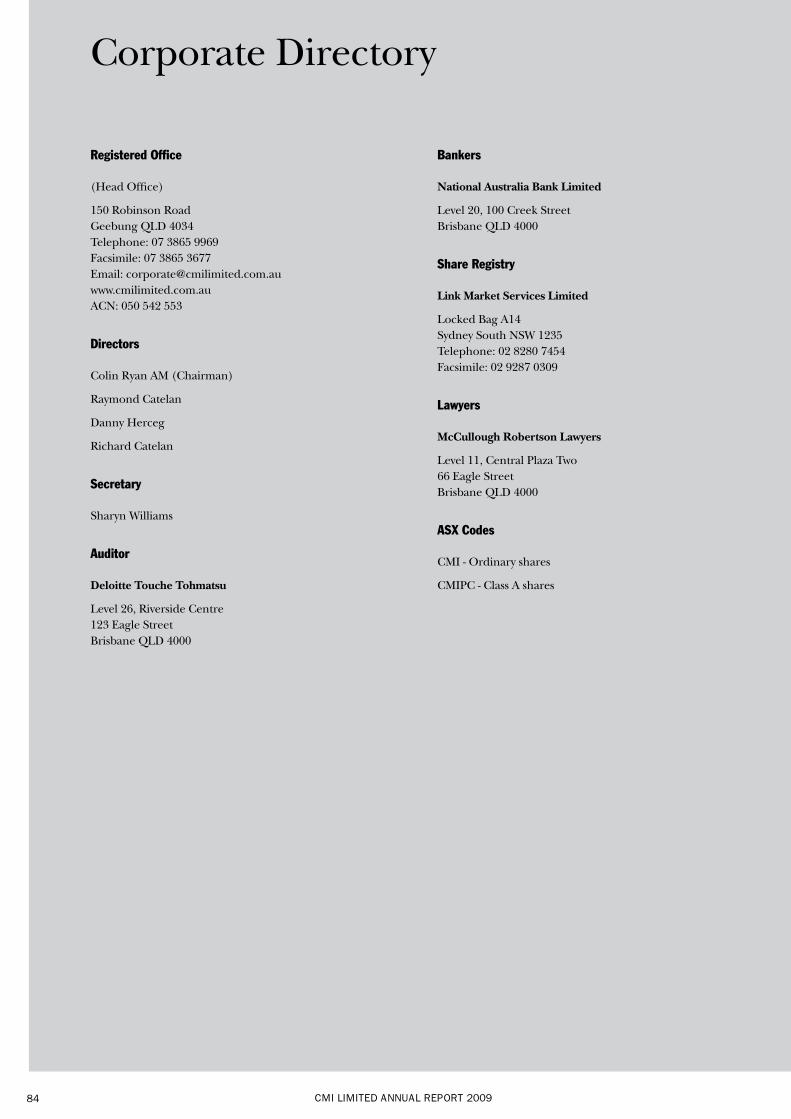
CMI LIMITED ANNUAL REPORT 200984
Corporate Directory
Registered Office
(Head Office)
150 Robinson Road Geebung QLD 4034 Telephone: 07 3865 9969 Facsimile: 07 3865 3677 Email: [email protected] www.cmilimited.com.au ACN: 050 542 553
Directors
Colin Ryan AM (Chairman)
Raymond Catelan
Danny Herceg
Richard Catelan
Secretary
Sharyn Williams
Auditor
Deloitte Touche Tohmatsu
Level 26, Riverside Centre 123 Eagle Street Brisbane QLD 4000
Bankers
National Australia Bank Limited
Level 20, 100 Creek Street Brisbane QLD 4000
Share Registry
Link Market Services Limited
Locked Bag A14 Sydney South NSW 1235 Telephone: 02 8280 7454 Facsimile: 02 9287 0309
Lawyers
McCullough Robertson Lawyers
Level 11, Central Plaza Two 66 Eagle Street Brisbane QLD 4000
ASX Codes
CMI - Ordinary shares
CMIPC - Class A shares

CMI LIMITED ANNUAL REPORT 2009

CMI Limited Annual Report 2009
CM
I LIM
Ite
d A
nn
uA
L R
ep
oR
t 2009