clouds and costs
TRANSCRIPT
Metron-Athene, Inc.
Capacity Planning, Cloud Computing, and Costs
4/29/2015 1
Using cost metrics from IT to provide
decision support to the business

www.metron-athene.com
D
R
S
InternalTest
Application
Servers
VDI
Database
Provider A
Provider B
System
Domains
Internal
DRS
warm failover
Provider A
Gold Service
Provider B
Silver Service
Provider C
Bronze Service
External
Capacity Planning, Cloud Computing, and Costs

Capacity Planning, Cloud Computing, and Costs
4/29/2015 3
Business Domain• Business Functionality Complete
• Client satisfaction
• SLA
• Useability
• Cost Effective
Different Perspectives
Systems
Domain
External• Provider A Services
• Provider B Services
• Provider C Services
Internal
• Facilities
• Platform
• Infrastructure
• Staff
transaction

All Systems
Transaction – the service to the business
• Counts and utilization patterns
• Demand profile by transaction type
• Type of user and class of service
Capacity – accommodate present performance needs and forecast
demand
SLA – performance to goals
• Capacity, availability, response times
• Quality of service
• DRS strategy
4/29/2015 4

0
10000
20000
30000
40000
50000
60000
70000
0
500
1000
1500
2000
2500
tim
e
8:1
5
8:3
5
8:5
5
9:1
5
9:3
5
9:5
5
10
:15
10
:35
10
:55
11
:15
11
:35
11
:55
12
:15
12
:35
12
:55
13
:15
13
:35
13
:55
14
:15
14
:35
14
:55
15
:15
15
:35
15
:55
16
:15
16
:35
16
:55
Oracle18 transaction count
Internal/External Domains – Transaction Metrics
4/29/2015 5
Market1
time login online oracle18 count total cpu
8:00 11 11 264 2
8:05 7 18 432 8
8:10 15 31 744 7
8:15 14 40 600 11
8:20 31 71 1491 14
8:25 83 150 4200 27
8:30 107 249 4482 12
8:35 117 349 5235 7.5
8:40 141 477 13356 27
8:45 214 670 12060 12
8:50 215 862 13792 9

Transaction Metrics
4/29/2015 6
0
10000
20000
30000
40000
50000
60000
0
500
1000
1500
2000
25008
:00
8:2
0
8:4
0
9:0
0
9:2
0
9:4
0
10
:00
10
:20
10
:40
11
:00
11
:20
11
:40
12
:00
12
:20
12
:40
13
:00
13
:20
13
:40
14
:00
14
:20
14
:40
15
:00
15
:20
15
:40
16
:00
16
:20
16
:40
17
:00
Oracle18 transaction count
login onilne oracle18 count

Transaction Metrics
4/29/2015 7
0
10000
20000
30000
40000
50000
60000
0.00
5.00
10.00
15.00
20.00
25.00
30.00
35.00
40.00
45.00
50.00
8:0
0
8:1
5
8:3
0
8:4
5
9:0
0
9:1
5
9:3
0
9:4
5
10
:00
10
:15
10
:30
10
:45
11
:00
11
:15
11
:30
11
:45
12
:00
12
:15
12
:30
12
:45
13
:00
13
:15
13
:30
13
:45
14
:00
14
:15
14
:30
14
:45
15
:00
15
:15
15
:30
15
:45
16
:00
16
:15
16
:30
16
:45
17
:00
Market1 CPU vs Oracle18 Transaction Count
alt cpu oracle18 count

www.metron-athene.com
D
R
S
InternalTest
Application
Servers
VDI
Database
Provider A
Provider B
System
Domains
Internal
DRS
warm failover
Provider A
Gold Service
Provider B
Silver Service
Provider C
Bronze Service
External
Capacity Planning, Cloud Computing, and Costs
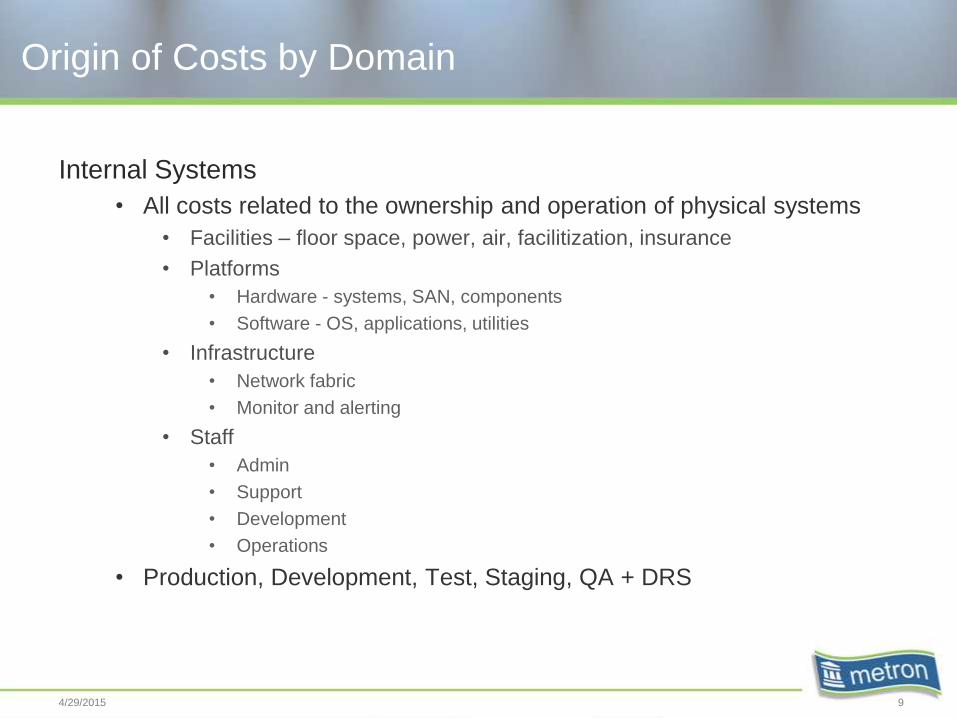
Origin of Costs by Domain
Internal Systems
• All costs related to the ownership and operation of physical systems
• Facilities – floor space, power, air, facilitization, insurance
• Platforms
• Hardware - systems, SAN, components
• Software - OS, applications, utilities
• Infrastructure
• Network fabric
• Monitor and alerting
• Staff
• Admin
• Support
• Development
• Operations
• Production, Development, Test, Staging, QA + DRS
4/29/2015 9
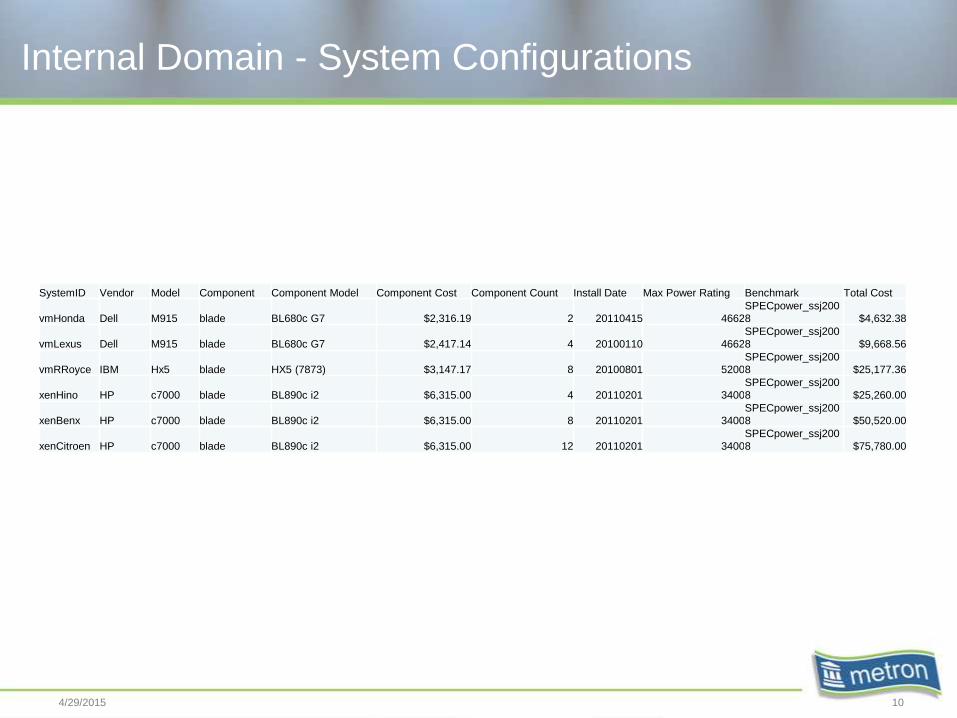
Internal Domain - System Configurations
SystemID Vendor Model Component Component Model Component Cost Component Count Install Date Max Power Rating Benchmark Total Cost
vmHonda Dell M915 blade BL680c G7 $2,316.19 2 20110415 4662
SPECpower_ssj200
8 $4,632.38
vmLexus Dell M915 blade BL680c G7 $2,417.14 4 20100110 4662
SPECpower_ssj200
8 $9,668.56
vmRRoyce IBM Hx5 blade HX5 (7873) $3,147.17 8 20100801 5200
SPECpower_ssj200
8 $25,177.36
xenHino HP c7000 blade BL890c i2 $6,315.00 4 20110201 3400
SPECpower_ssj200
8 $25,260.00
xenBenx HP c7000 blade BL890c i2 $6,315.00 8 20110201 3400
SPECpower_ssj200
8 $50,520.00
xenCitroen HP c7000 blade BL890c i2 $6,315.00 12 20110201 3400
SPECpower_ssj200
8 $75,780.00
4/29/2015 10

Internal Domain - Platform Hardware Costs
System ID Vendor Model Cost Installed Current Value Daily Cost cpu count per cpu
vmHonda Dell M915$23,816.0
0 20110315 $19,846.6722.0518518
5 211.02592
6
vmLexus Dell M915
$34,512.0
0 20100110 $17,256.00
31.9555555
6 4
7.988888
9
vmRRoyce IBM HX5
$45,809.0
0 20100801 $17,814.61
42.4157407
4 8
5.301967
6
xenHino HP c7000
$25,260.0
0 20110201 $18,945.00
23.3888888
9 4
5.847222
2
xenBenx HP c7000$50,520.0
0 20110201 $37,890.0046.7777777
8 85.847222
2
xenCitroen HP c7000
$75,780.0
0 20110201 $56,835.00
70.1666666
7 12
5.847222
2
4/29/2015 11

Internal Domain - Data Center Costs
4/29/2015 12
East Data
Center Floor Space Zone B
square
meter 200.000000vmLexus 0.5 $3.33
East Data
Center Power Zone B watt 0.021603 8600.0 $4.46
East Data
Center Air Zone B btu 8.600000 8.6 $5.75
East Data
Center Facilitization Zone B drop 0.000000 0.0 $0.00
East Data
Center Insurance Zone B zone 2.750000 0.137500 $0.46
East Data
Center Floor Space Zone Csquare
meter 250.000000vmRRoyce 0.5 $4.17
East Data
Center Power Zone C watt 0.021603 41600.0 $21.57
East Data
Center Air Zone C btu 41.600000 41.6 $134.59
East Data
Center Facilitization Zone C drop 0.000000 0.0 $0.00
East Data
Center Insurance Zone C zone 2.750000 0.137500 $0.57
South Data
Center Floor Space Zone X
square
meter 150.000000xenHino 0.7 $3.50
South Data
Center Power Zone X watt 0.017603 13600.0 $5.75
South Data
Center Air Zone X btu 13.600000 13.6 $11.72
South Data
Center Facilitization Zone X drop 0.000000 0.0 $0.00
South Data
Center Insurance Zone X zone 4.700000 0.329000 $1.15

Internal Domain - Total Daily Costs
Row Labels
Sum of Daily
Cost
East Data Center $181.41
Air $141.78
Facilitization $0.00
Floor Space $10.00
Insurance $1.38
Power $28.26
South Data Center $180.32
Air $128.93
Facilitization $0.00
Floor Space $16.33
Insurance $6.33
Power $28.73
Grand Total $361.73
4/29/2015 13

External Domain – Costs of Service
4/29/2015 14
Cost considerations
• Service Level Agreement
• Service Tier
• Service Acquisition• Base cost
• Max capacity available
• Cpu
• Memory
• Storage
• Network
• Fixed base plus overage costs

Transaction Cost
4/29/2015 15
SystemID ApplicationID ProcessID UserID StartTime Stoptime Duration Destination
marketGW1 login 99311 market27 14:09:17.934 14:09:18.365 431 shopper
marketGW1 shopper 103917 market27 14:09:19.104 14:09:19.155 51 shopper
marketGW1 shopper 103917 market27 14:09:43.157 14:09:43.290 133 orderPlace
Market4 orderPlace 394701 market27 14:09:43.291 14:09:43.505 214 oracle18
Market1 oracle18 187632 market27 14:09:43.506 14:09:44.823 1317
…
marketGW1 shopper 103917 market27 14:11:07.132 14:11:09.083 1951 cloud_a
Market1
time login onilne oracle18 count total cpu
8:00 11 11 176 2
8:05 7 18 270 8
8:10 15 31 496 7
8:15 14 40 840 11
8:20 31 71 1988 14
8:25 83 150 1800 3
8:30 107 249 4980 15
8:35 117 349 9772 27
8:40 141 477 9540 15
8:45 214 670 10720 9
8:50 215 862 12930 7.5
8:55 211 1047 12564 3
9:00 200 1214 33992 27
9:05 199 1376 16512 3
9:10 182 1515 31815 16.5
9:15 104 1571 43988 27
Derive the cost of a
transaction
Combine
transaction metrics with
resource utilization metrics
Transaction Cost
4/29/2015 16
Derive the cost of a transaction
• External
• Combine transaction metrics with costs of services
• Internal
• Combine transaction metrics with resource utilization metrics
and costs of domain components

Cost Metrics
Metrics must be sufficiently granular to allow comparisons
• Transaction to transaction
• Between alternative components:
• Internal vs External Service
• Physical vs Virtual System
• SAN vs Local Storage
• .Net vs Java application development effort
4/29/2015 17

Must have the means to collect usage metrics for each
reporting point
• Transactions
• Service Times
• Frequencies
• Usage profiles (frequency by time period)
• Components
• Utilization
• Service time
Cost Metrics

Reporting Goal
To enable the valid comparison of various types and
classes of service, use the same units to describe costs
from each systems domain
Costs
• per transaction
• per application
• per process
4/29/2015 19

Using Cost Comparison as Effective Decision Support
Understand how to build the comparison of any one system
to any other on the basis of costs.
• Internal
• External
• Hybrid
Report costs in the context of the business decision being
supported.

Capacity Planning, Cloud Computing, and Costs
Questions
4/29/2015 21