cloud&performance&factors& … · ·...
TRANSCRIPT
Cloud performance factors (Eucalyptus private cloud) and Service Level Agreements
Presented By: Ramneek
(MT2011118)
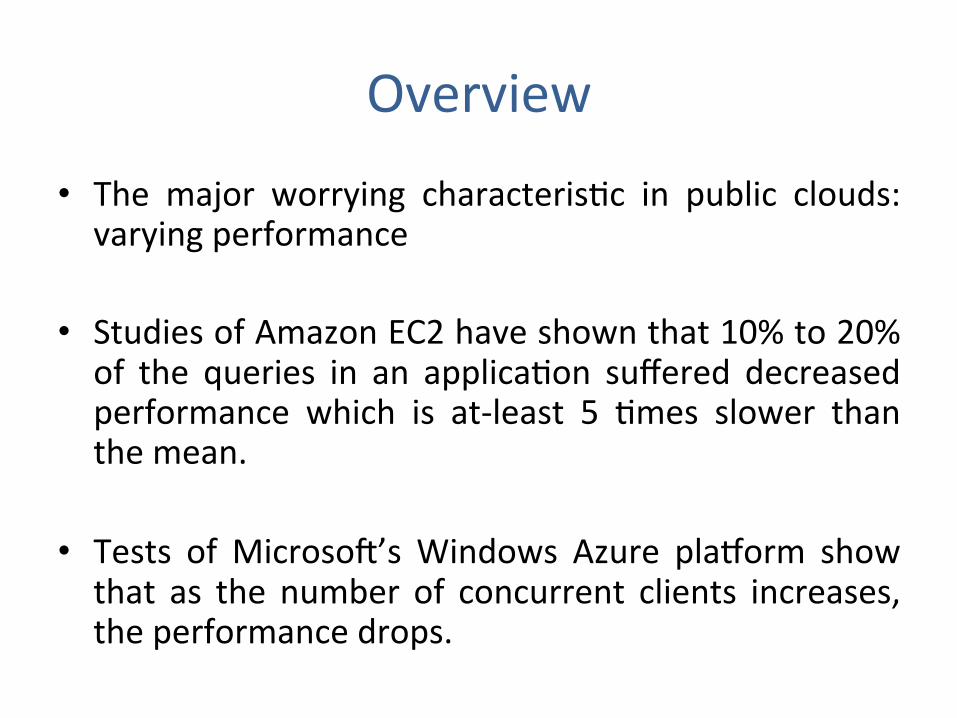
Overview
• The major worrying characterisJc in public clouds: varying performance
• Studies of Amazon EC2 have shown that 10% to 20% of the queries in an applicaJon suffered decreased performance which is at-‐least 5 Jmes slower than the mean.
• Tests of MicrosoS’s Windows Azure plaVorm show that as the number of concurrent clients increases, the performance drops.
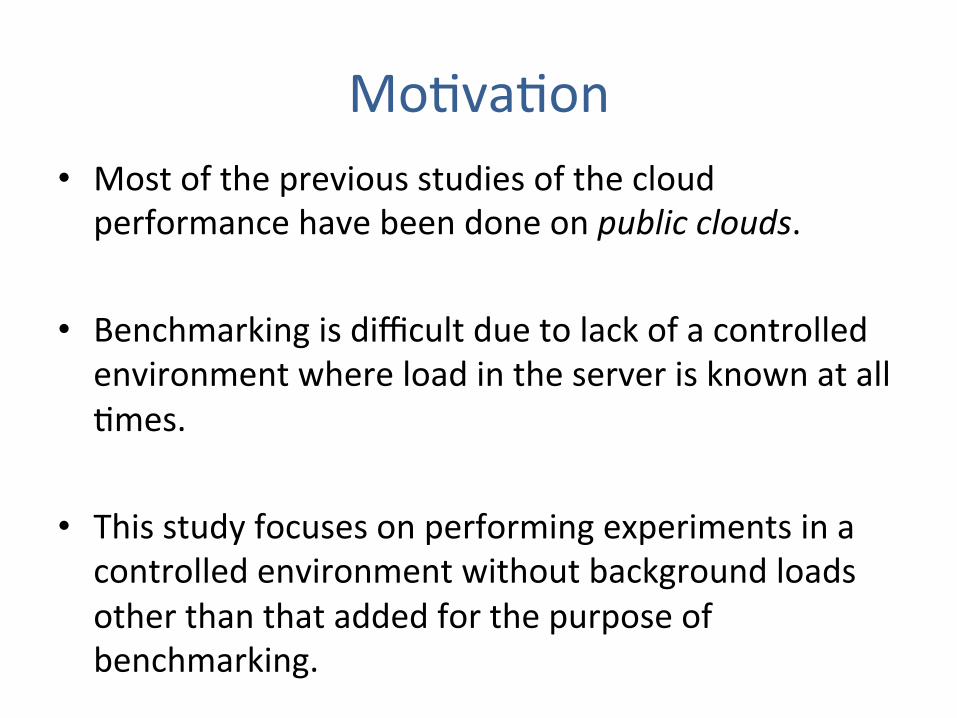
MoJvaJon • Most of the previous studies of the cloud performance have been done on public clouds.
• Benchmarking is difficult due to lack of a controlled environment where load in the server is known at all Jmes.
• This study focuses on performing experiments in a controlled environment without background loads other than that added for the purpose of benchmarking.
Eucalyptus private cloud
• Eucalyptus: an open source private cloud • InstallaJon package: Ubuntu Server 10.04 LTS
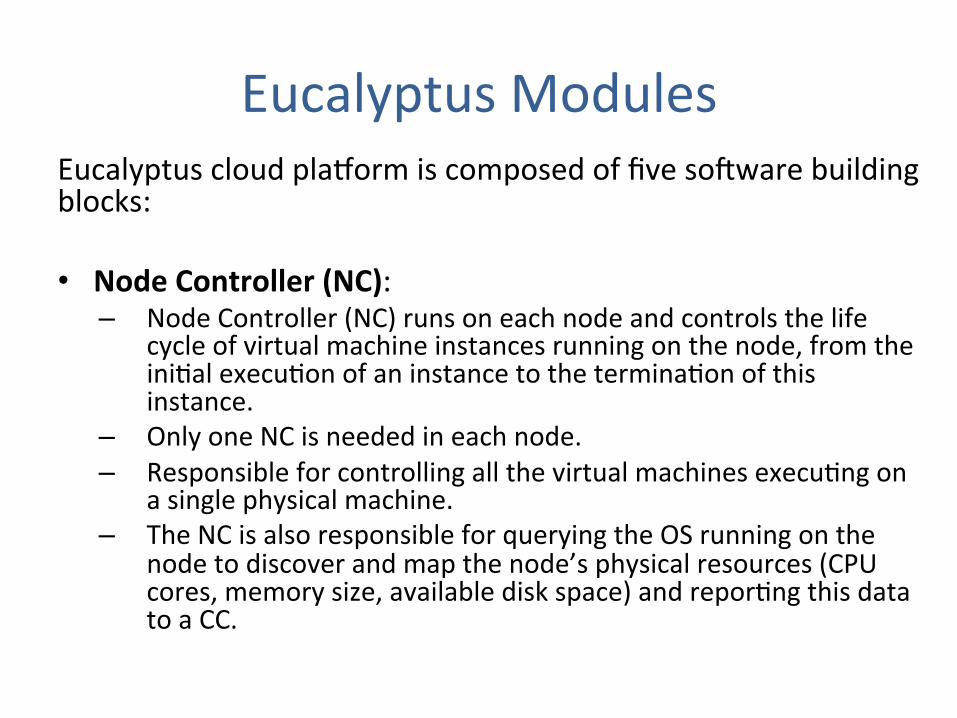
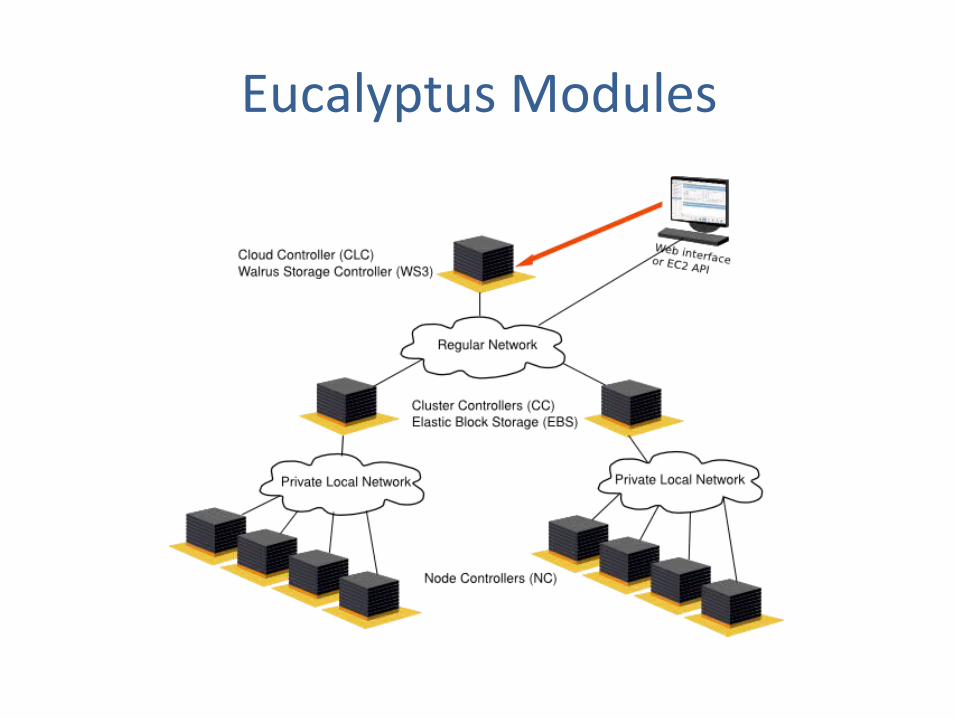
Eucalyptus Modules Eucalyptus cloud plaVorm is composed of five soSware building blocks: • Node Controller (NC): – Node Controller (NC) runs on each node and controls the life
cycle of virtual machine instances running on the node, from the iniJal execuJon of an instance to the terminaJon of this instance.
– Only one NC is needed in each node. – Responsible for controlling all the virtual machines execuJng on
a single physical machine. – The NC is also responsible for querying the OS running on the
node to discover and map the node’s physical resources (CPU cores, memory size, available disk space) and reporJng this data to a CC.
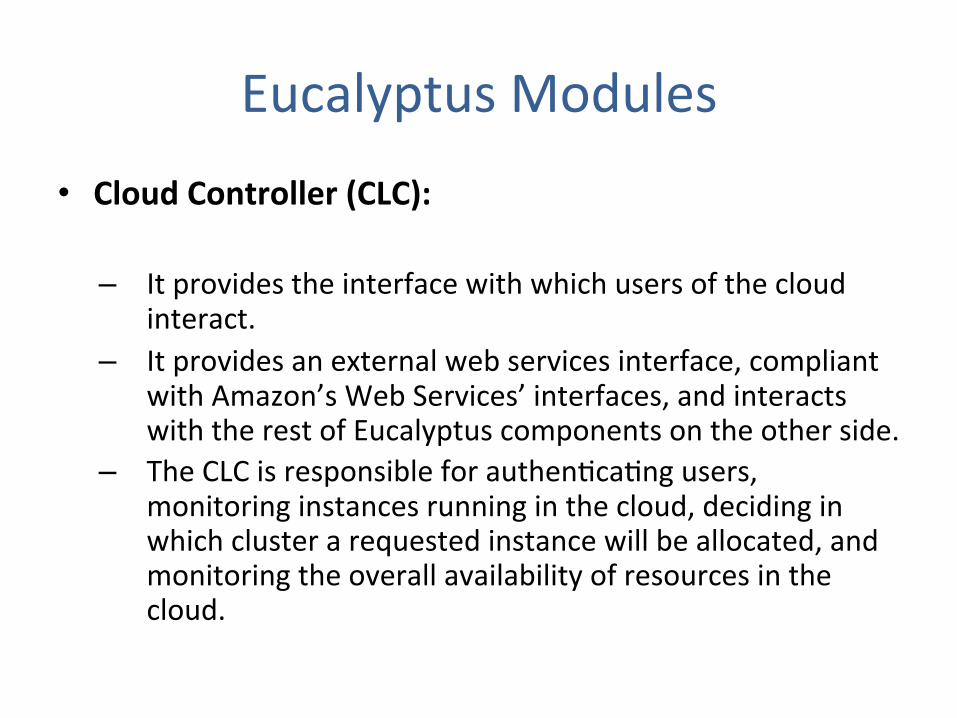
Eucalyptus Modules • Cloud Controller (CLC):
– It provides the interface with which users of the cloud interact.
– It provides an external web services interface, compliant with Amazon’s Web Services’ interfaces, and interacts with the rest of Eucalyptus components on the other side.
– The CLC is responsible for authenJcaJng users, monitoring instances running in the cloud, deciding in which cluster a requested instance will be allocated, and monitoring the overall availability of resources in the cloud.
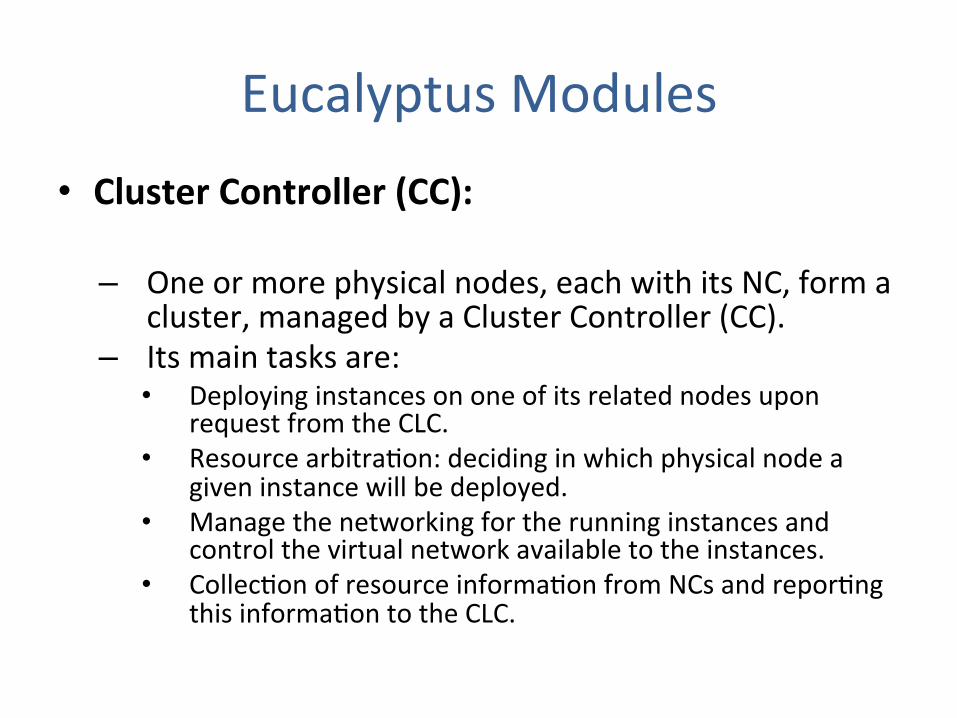
Eucalyptus Modules • Cluster Controller (CC):
– One or more physical nodes, each with its NC, form a cluster, managed by a Cluster Controller (CC).
– Its main tasks are: • Deploying instances on one of its related nodes upon
request from the CLC. • Resource arbitraJon: deciding in which physical node a
given instance will be deployed. • Manage the networking for the running instances and
control the virtual network available to the instances. • CollecJon of resource informaJon from NCs and reporJng
this informaJon to the CLC.
Eucalyptus Modules
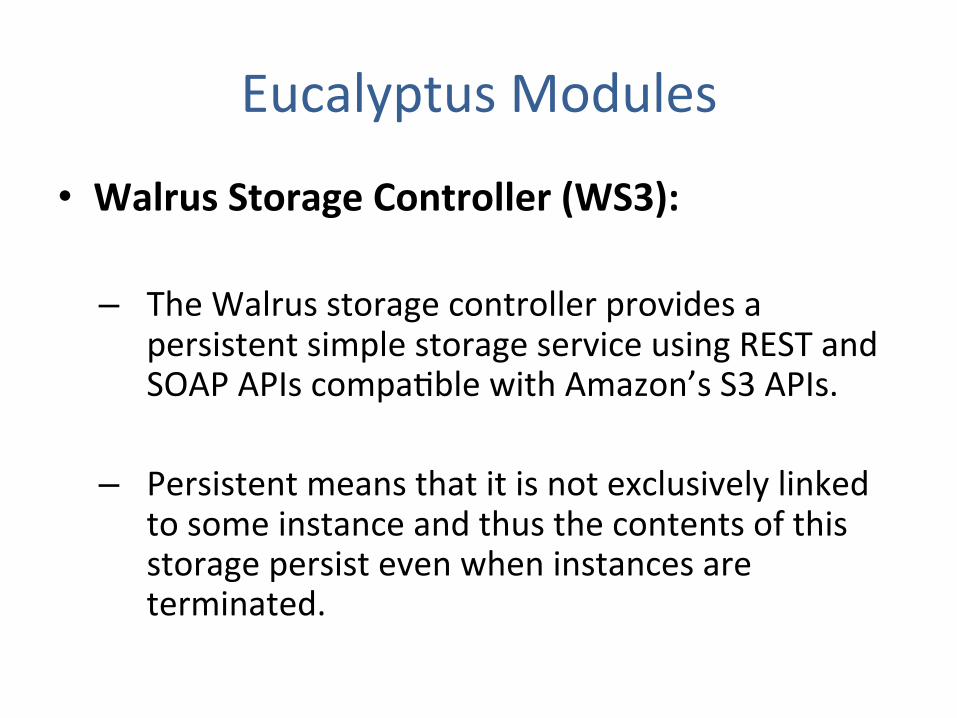
• Walrus Storage Controller (WS3):
– The Walrus storage controller provides a persistent simple storage service using REST and SOAP APIs compaJble with Amazon’s S3 APIs.
– Persistent means that it is not exclusively linked to some instance and thus the contents of this storage persist even when instances are terminated.
Eucalyptus Modules
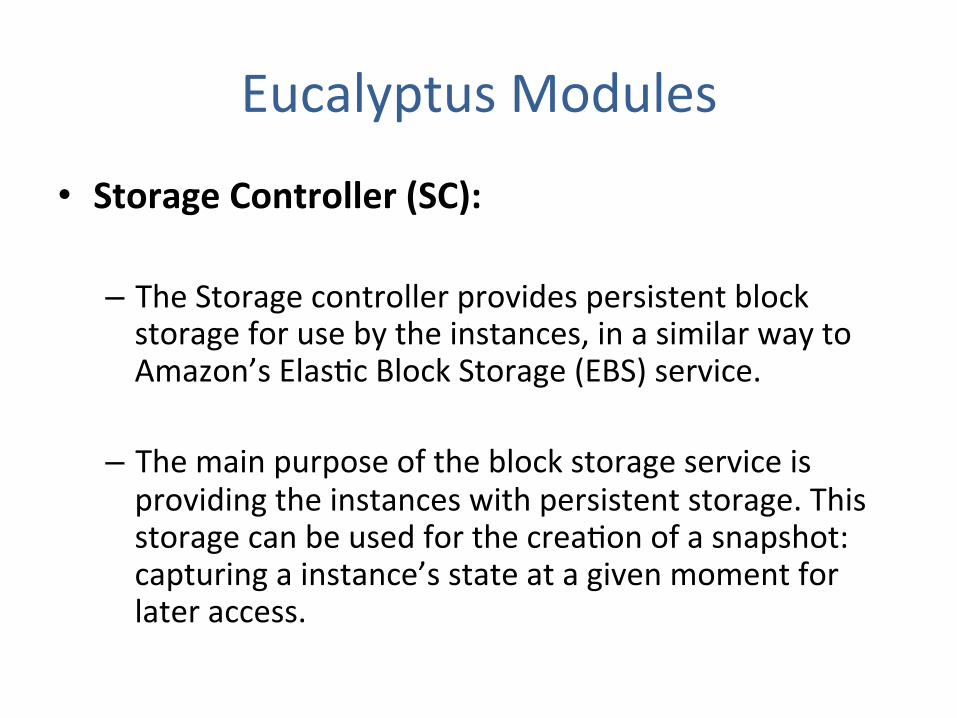
• Storage Controller (SC):
– The Storage controller provides persistent block storage for use by the instances, in a similar way to Amazon’s ElasJc Block Storage (EBS) service.
– The main purpose of the block storage service is providing the instances with persistent storage. This storage can be used for the creaJon of a snapshot: capturing a instance’s state at a given moment for later access.
Eucalyptus Modules
!"#$%&%'%()*
+,%$-./,0)%/)1.%$23$"1/-&45)1*6$7,0/,$0*$),%$'-0($/2'52(%()$23$!81()1$"()%.5.0*%$#&2196$,-*$
8%%($9%*0:(%9$-*$'291&-.$*%)$23$;$*0'5&%$%&%'%()*$),-)$/-($8%$%-*0&4$*/-&%9<
! #&219$#2().2&&%.$=#>#?
! @-&.1*$A)2.-:%$#2().2&&%.$=@AB?
! "&-*)0/$C&2/D$A)2.-:%$#2().2&&%.$="CA?
! #&1*)%.$#2().2&&%.$=##?
! E29%$#2().2&&%.$=E#?
"-/,$%&%'%()$0*$-/)0(:$-*$-($0(9%5%(9%()$7%8$*%.F0/%$),-)$%G52*%*$@%8$A%.F0/%$H%*/.05)02($
>-(:1-:%$=@AH>?$92/1'%()$9%30(0(:$),%$IJK$)2$0()%.-/)$70),$0)L$$K)$0*$-$)450/-&$7%8$*%.F0/%$
-./,0)%/)1.%L
!"#$!"#$%&'()"*$+,-)."/*"+0/1"2/(%)(3"2-$1"*-+"*$4$11()/'5"3$(*"+0$"6*+$)*$+7"8&+"("*$+,-)."
+0(+"/1"%$*$)(''5"(44$11/8'$"+-"+0$"&1$)1"-9"+0$"4'-&2:
!"#$%&!#'()#""*)
+,%$#&219$#2().2&&%.$=#>#?$0*$),%$'2*)$F0*08&%$%&%'%()$23$),%$"1/-&45)1*$-./,0)%/)1.%6$-*$0)$0*$
5.2F090(:$),%$0()%.3-/%$70),$7,0/,$1*%.*$23$),%$/&219$0()%.-/)L$$+,0*$0()%.3-/%$0*$/2'5.0*%9$23$-$
*)-(9-.9$AMIJ$8-*%9$IJK$'-)/,0(:$),%$I'-N2($"#O$IJK$=*%%$I'-N2($"#O$IJK$8%&27?6$-$
*0'5&%.$PQ1%.4$K()%.3-/%R$7,0/,$%1/-O22&*$-(9$"&-*)0/S2G$1*%*$-(9$-$).-90)02(-&$7%8$0()%.3-/%$
32.$90.%/)$1*%.$0()%.-/)02(L
!81()1$"()%.5.0*%$#&219$I./,0)%/)1.% T 777L/-(2(0/-&L/2'
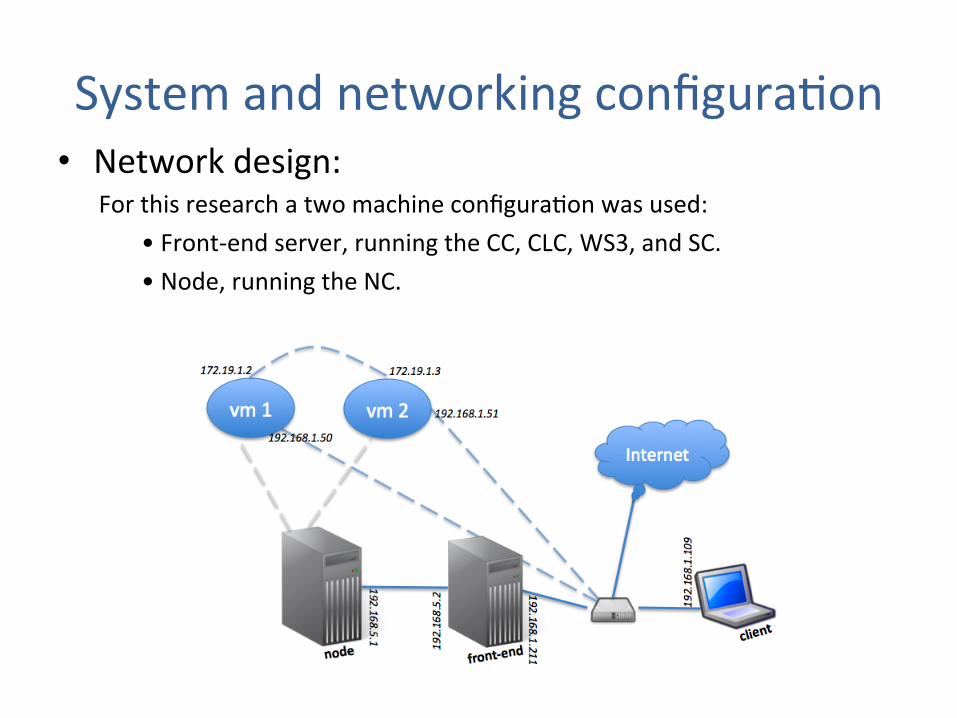
System and networking configuraJon • Network design:
For this research a two machine configuraJon was used: • Front-‐end server, running the CC, CLC, WS3, and SC. • Node, running the NC.
3.4.2 Network design
The networking as implemented is outlined in the text that follows. An overview of thisnetwork is shown in Figure 3.1.
Figure 3.1: Networking outline of the private cloud
The two servers (marked node and front-end in the Figure) were interconnected usingan ethernet crossover cable, creating a private network. The front-end had two ethernetinterfaces so that it was able to simultaneously access the private network and the localarea network of the lab (this later network will be called the public network). This publicnetwork in turn has access to the internet, but it is important to highlight that the nodeitself does not directly access to the internet. By configuring the routing tables of bothmachines appropriately, the node directs all of its traffic to and from the internet throughthe front-end. During the experiments, the clients of the cloud were located generally onthe public network. Additionally, we succesfully tested the ability of a machine connectedto the internet to access the cloud, launch virtual machines, and communicate with themfrom hosts attached to the internet.
The networking configuration and the resulting connectivity can be quite differentdepending on which Eucalyptus mode is used. There are four such modes and the maindistinguishing feature among them is the level of control and management features offeredto the cloud administrator (see Table 3.1). In increasing order of configuration features
30
System and networking configuraJon
• Two servers ( node and the front-‐end) are interconnected using Ethernet cable, creaJng a private network.
• The front-‐end is also connected to the local area network of the lab (public network).
• This public network in turn has access to internet.
• During the experiments, the clients of the cloud were located generally on the public network.
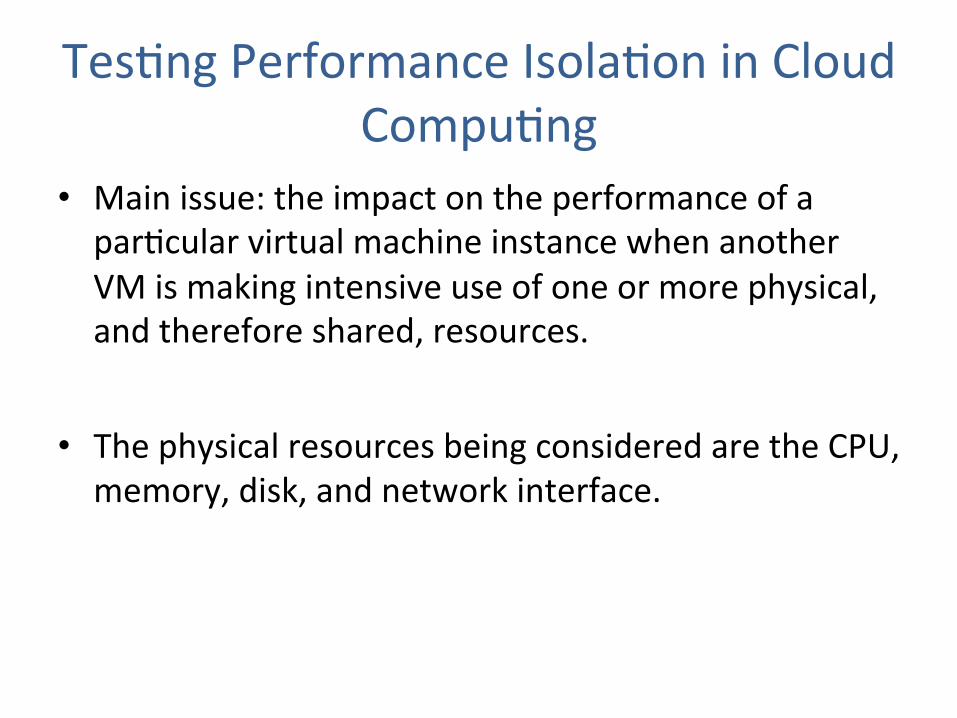
TesJng Performance IsolaJon in Cloud CompuJng
• Main issue: the impact on the performance of a parJcular virtual machine instance when another VM is making intensive use of one or more physical, and therefore shared, resources.
• The physical resources being considered are the CPU, memory, disk, and network interface.
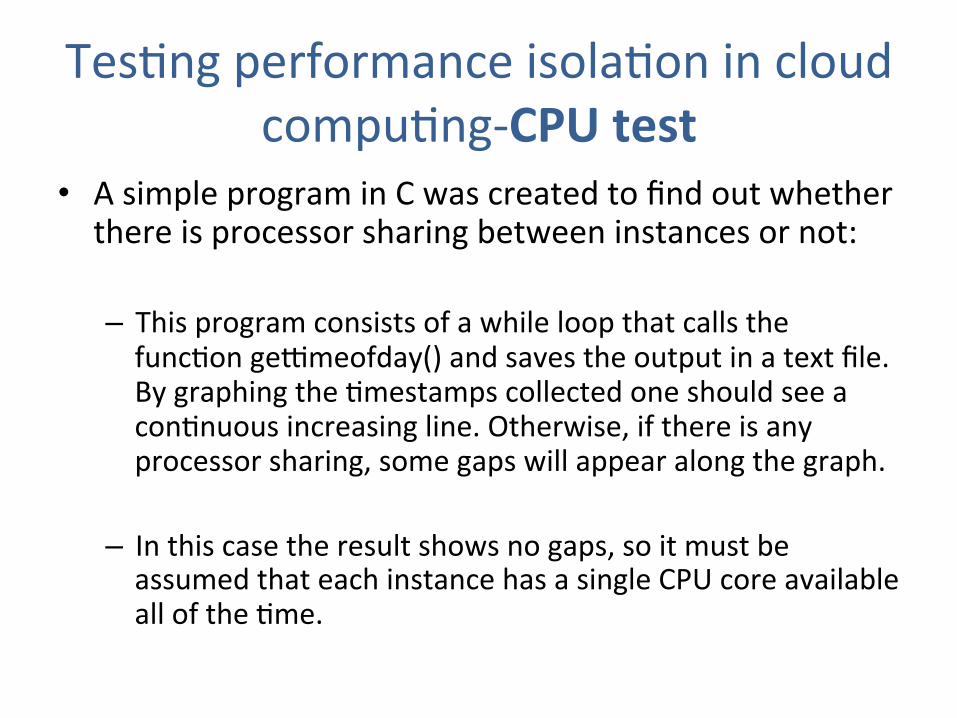
TesJng performance isolaJon in cloud compuJng-‐CPU test
• A simple program in C was created to find out whether there is processor sharing between instances or not:
– This program consists of a while loop that calls the funcJon gedmeofday() and saves the output in a text file. By graphing the Jmestamps collected one should see a conJnuous increasing line. Otherwise, if there is any processor sharing, some gaps will appear along the graph.
– In this case the result shows no gaps, so it must be assumed that each instance has a single CPU core available all of the Jme.
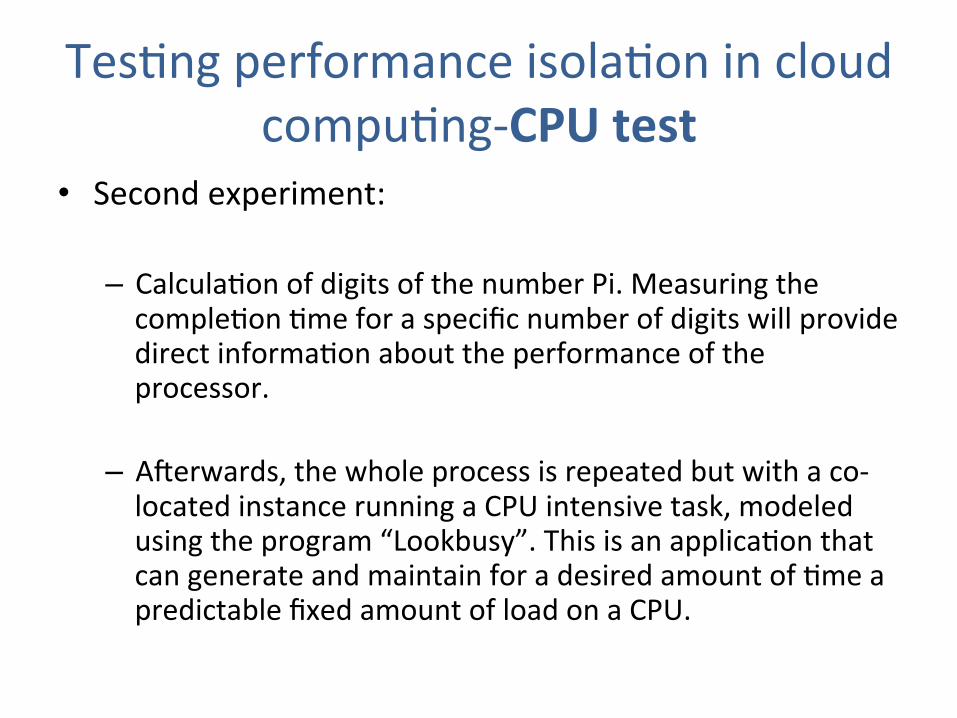
TesJng performance isolaJon in cloud compuJng-‐CPU test
• Second experiment:
– CalculaJon of digits of the number Pi. Measuring the compleJon Jme for a specific number of digits will provide direct informaJon about the performance of the processor.
– ASerwards, the whole process is repeated but with a co-‐located instance running a CPU intensive task, modeled using the program “Lookbusy”. This is an applicaJon that can generate and maintain for a desired amount of Jme a predictable fixed amount of load on a CPU.
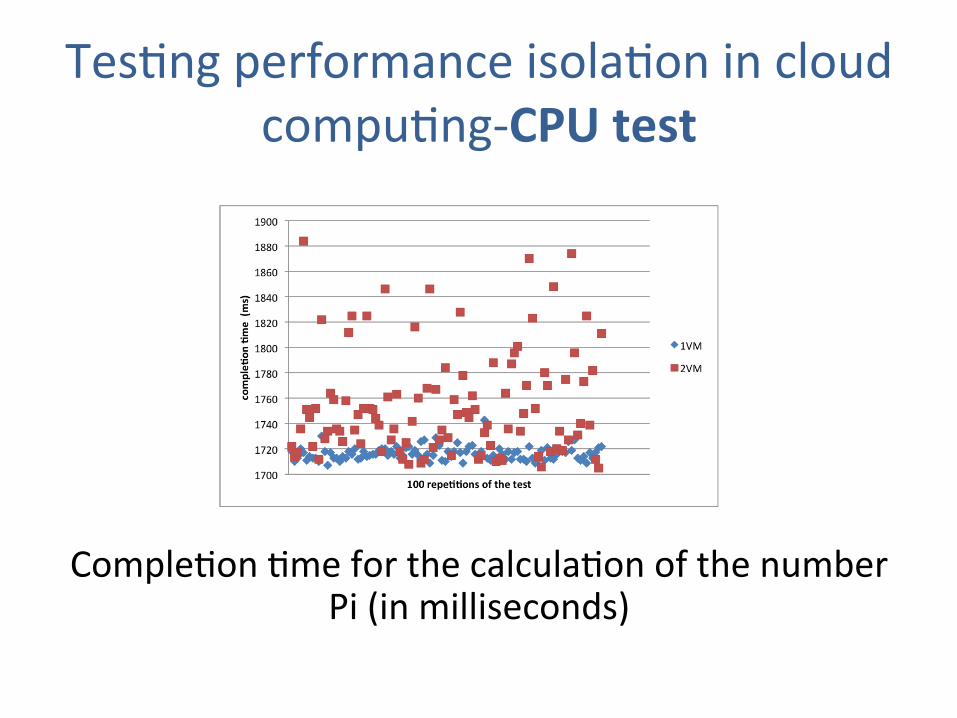
TesJng performance isolaJon in cloud compuJng-‐CPU test
CompleJon Jme for the calculaJon of the number
Pi (in milliseconds)
instance, idle otherwise, the benchmark is run 100 times, each time calculating 524288 digits
of the number Pi and obtaining 100 samples of the completion time.
Afterwards, the whole process is repeated but with a co-located instance running a
CPU intensive task, modeled using the program “Lookbusy” [13]. This is an application
that can generate and maintain for a desired amount of time a predictable fixed amount
of load on a CPU. Lookbusy is also a strictly CPU-bound task but, to ensure it actually
is, a simple verification is done: we measure the completion time of a run of the program.
It can be observed that the real time equals the user time, which means that there was
no I/O involved in the process. Given this check, the program is set to generate a 100%
CPU load. This will use all of the processor resources allocated to the background instance,
the “misbehaving” instance, to its maximum. Following this, another 100 samples of the
completion time for the calculation of the number Pi to the same number of digits as before
are collected and compared to the first set of samples. The results can be graphed in Figure
3.2:
Figure 3.2: Completion time for the calculation of the number Pi (in miliseconds)
Table 3.2: Numeric results of the cpu test
1 VM 2 VM
mean (ms) 1716,48 1754,90
stdev (ms) 5,39 41,47
stdev (%) 0,31 2,36
36
TesJng performance isolaJon in cloud compuJng-‐CPU test
• Mean Jme increases from 1716 ms (in case of single VM) to 1754 ms (in case of two VMs).
• As can be beier seen in the graph: there are several outliers, a great number of outliers for a set of samples of this size, leading to a standard deviaJon eight Jmes greater than the original.
TesJng performance isolaJon in cloud compuJng-‐Memory test
• The memory performance stress test is based upon a bandwidth test.
• The size of the RAM memory allocated to both instances is 512 MBytes.
• In this case the misbehaving instance simulates a RAM intensive task of another cloud user’s applicaJon resident in the same server.
TesJng performance isolaJon in cloud compuJng-‐Memory test
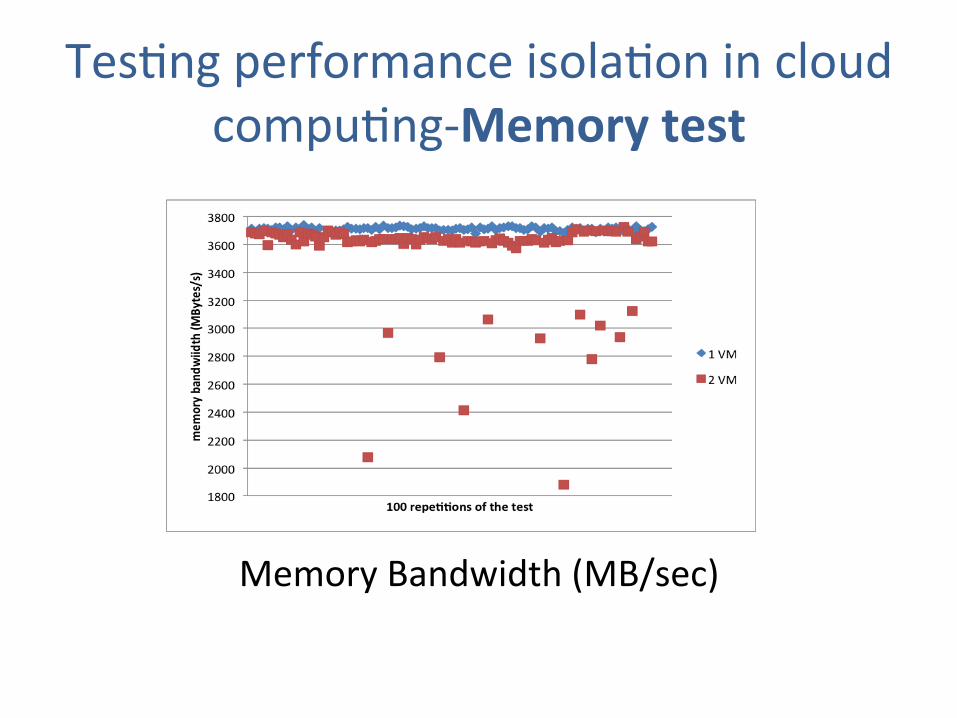
Memory Bandwidth (MB/sec) Figure 3.3: Memory bandwidth (in MB/s)
Table 3.3: Numeric results of the memory bandwidth test
1 VM 2 VMmean (MB/s) 3711,70 3540,68stdev (MB/s) 13,83 321,69
stdev (%) 0,37 9,09
As can be extracted from the results, this problem has a similar result as the case of theprocessor interference. There is again a decrease in the average throughput of the memory,in this case of less than 5%; which in most cases would not be a determinant factor. Abigger worry is the points far from the mean. The standard deviation, in presence of asecond virtual machine instance, is more than 20 times (or more than 9 percentage points)higher. This fact could be seen as a much worse tolerance of the memory than the processorto a background load. Because, while it is true that the glitches in memory throughputreach very low values, they go to even half of the mean bandwidth, they happen much morerarely than for the processor.
Currently, memory management techniques that apply to KVM-based virtual machinesare the same as those the Linux kernel that applies to any other process. The memory of avirtual machine is stored in memory as any other Linux process, managed by the standardLinux memory allocator. This is due to the fact that KVM is a Linux kernel extension.The kernel has a feature called Kernel Same-page Merging (KSM), that scans the memoryof each virtual machine, detects where virtual machines have identical memory pages and
38
TesJng performance isolaJon in cloud compuJng-‐Memory test
• There is again a decrease in the average throughput of the memory, from 3711 MB/s in case of 1VM to 3540 MB/s in case of 2VMs. – Currently, memory management techniques that apply to
KVM-‐based virtual machines are the same as those the Linux kernel.
– The kernel has a feature called Kernel Same-‐page Merging (KSM), that scans the memory of each virtual machine, detects where virtual machines have idenJcal memory pages and these into a single page shared between the virtual machines. This results in space saving given as it allows storing only a single copy of each page.
• The standard deviaJon, in presence of a second virtual machine instance, is more than 20 Jmes higher.
TesJng performance isolaJon in cloud compuJng-‐Disk I/O test
• In a virtualized environment, the physical server’s disk capacity and bandwidth is typically shared between compeJng VMs:
– The capacity is shared in a straighVorward way: each virtual machine
has a virtual disk image of a determined size that is allocated at the virtual machine starJng Jme. It does not change unJl the terminaJon of the virtual machine execuJon.
– the bandwidth of the disk is shared between all the resident VMs and there is currently no method of dividing this bandwidth or imposing limitaJons on its consumpJon by VMs
• Therefore, the assumpJon was that the disk I/O performance of one user would be interfered by another user’s VM with intensive disk I/O behavior.
TesJng performance isolaJon in cloud compuJng-‐Disk I/O test
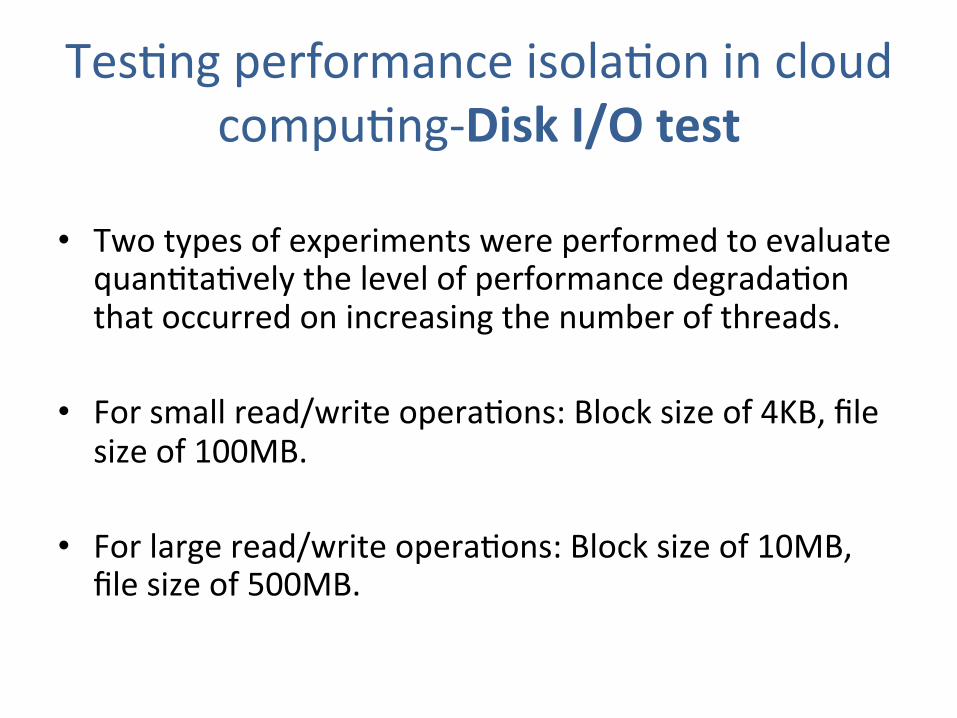
• Two types of experiments were performed to evaluate quanJtaJvely the level of performance degradaJon that occurred on increasing the number of threads.
• For small read/write operaJons: Block size of 4KB, file size of 100MB.
• For large read/write operaJons: Block size of 10MB, file size of 500MB.
TesJng performance isolaJon in cloud compuJng-‐Disk I/O test
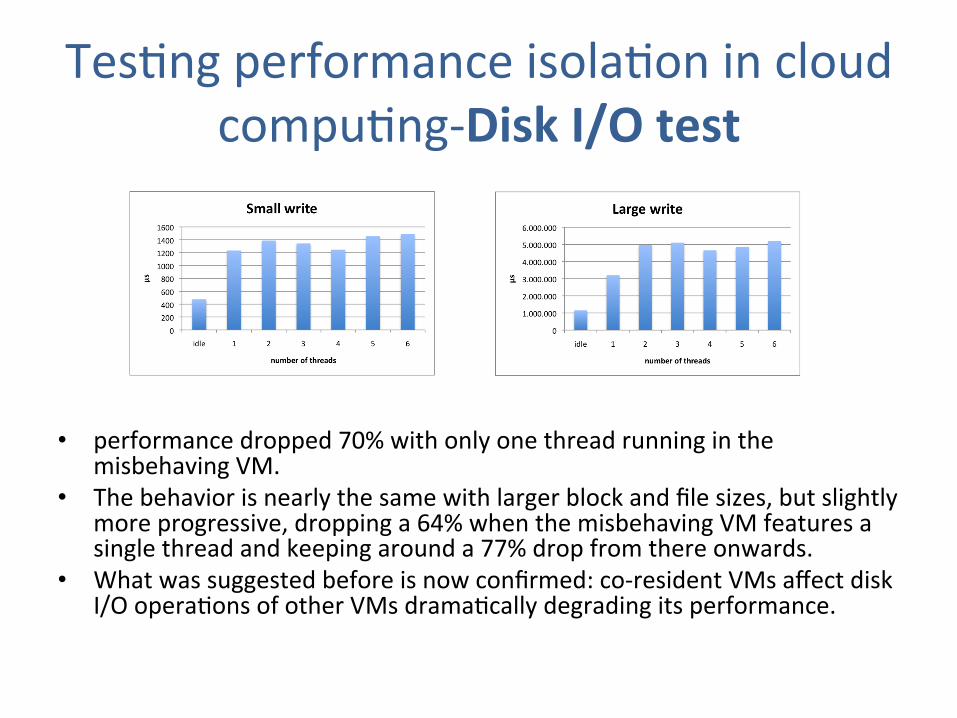
• performance dropped 70% with only one thread running in the misbehaving VM.
• The behavior is nearly the same with larger block and file sizes, but slightly more progressive, dropping a 64% when the misbehaving VM features a single thread and keeping around a 77% drop from there onwards.
• What was suggested before is now confirmed: co-‐resident VMs affect disk I/O operaJons of other VMs dramaJcally degrading its performance.
mance degradation that occurred. The first was the Iozone benchmark [51]. This is one
of the most widely used tools for filesystem benchmarking. It allows benchmarking any
possible disk operation, with selectable block size, file size, and number of threads running
the program. It is also capable of expressing results in throughput per operation or time
per operation. Three different kinds of measurements were obtained with Iozone. In each
of which results in throughput and time were calculated:
1. Small read/write operations. Block size of 4KB, file size of 100MB. One Iozone thread
on VM1 against varying number of threads in VM2. (1,2,3,4,5,6)
2. Large read/write operations. Block size of 10MB, file size of 500MB. One Iozone
thread on VM1 against varying number of threads in VM2. (1,2,3,4,5,6)
3. Small read/write operations. Block size of 4KB, file size of 50MB. Two Iozone threads
on VM1, against varying number of threads in VM2. (1,2,3,4,5,6,10,12)
In the case of the writing benchmark, with small operations (experiment 1) the performance
dropped 70% with only one thread running in the misbehaving VM. Although when the
number of threads increased, up to 6 threads, the degradation kept stable at that value,
reaching a maximum of 73%. The behaviour is nearly the same with larger block and file
sizes (experiment 2) but slightly more progressive, dropping a 64% when the misbehaving
VM features a single thread and keeping around a 77% drop from there onwards.
Figure 3.4: Small write operation Figure 3.5: Large write operation
A similar situations is observed reading in small blocks (4KB) from a relatively small file
size (100MB). This operation’s latency drops to the 45% of its peak performance (i.e. the
latency measured when there is not any other VM performing disk I/O operations), from
6 to an average of 11 microseconds. A completely different thing happened when reading
in large chunks from a larger file. Very little degradation is experienced, what is shocking
40
TesJng performance isolaJon in cloud compuJng-‐Network test
• Most popular hypervisors nowadays, e.g. KVM, Xen, do not feature any bandwidth sharing mechanism. Therefore, in current clouds, the network sharing system must be implemented by the network administrator.
• For this experiment: – For outgoing traffic, queuing discipline chosen is the Hierarchical Token Bucket (HTB).
– Incoming traffic uJlizes another methodology called ingress filtering or policing (i.e. basically dropping packets when the number of them received exceeds the bandwidth specified in the filter).
TesJng performance isolaJon in cloud compuJng-‐Network test
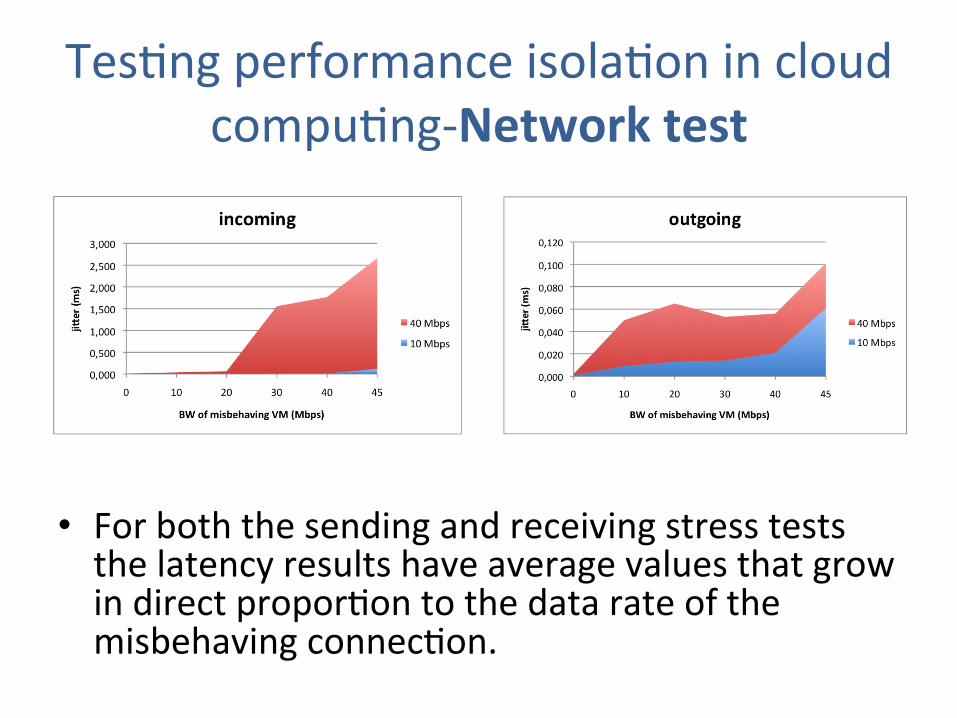
• For both the sending and receiving stress tests the latency results have average values that grow in direct proporJon to the data rate of the misbehaving connecJon.
Since this test showed the variation in the RTT that appears when there is a co-located
network intensive VM, further experiments in this direction were performed. Using Iperf,
a connection to the well-behaving machine was maintained while the other VM sent or
received flows of UDP packets, packet loss and jitter results were obtained. The test involves
incoming and outcoming packets and during each part of the experiment both VMs were
transmitting in the same direction as this is the case of most interference.
Figure 3.14 depicts the amount of jitter (which refers to the variability of the packet
latency across a network) for various combinations of data rates of both VMs. Overall,
jitter was quite proportional to the throughput of the competing VM. Although increasing
slightly, jitter remains low when the competing VM is sending or receiving at a fraction
of its fair-share of bandwidth, but when it uses all of its share, the jitter doubles in the
outgoing case and is almost two orders of magnitude higher in the incoming case. Both
cases show levels of jitters above what is normal for a small ethernet LAN. Nonetheless,
the fact that the incoming case reaches 2.5 ms of jitter at 40 Mbps is clearly an important
issue.
Figure 3.14: Jitter stress test results
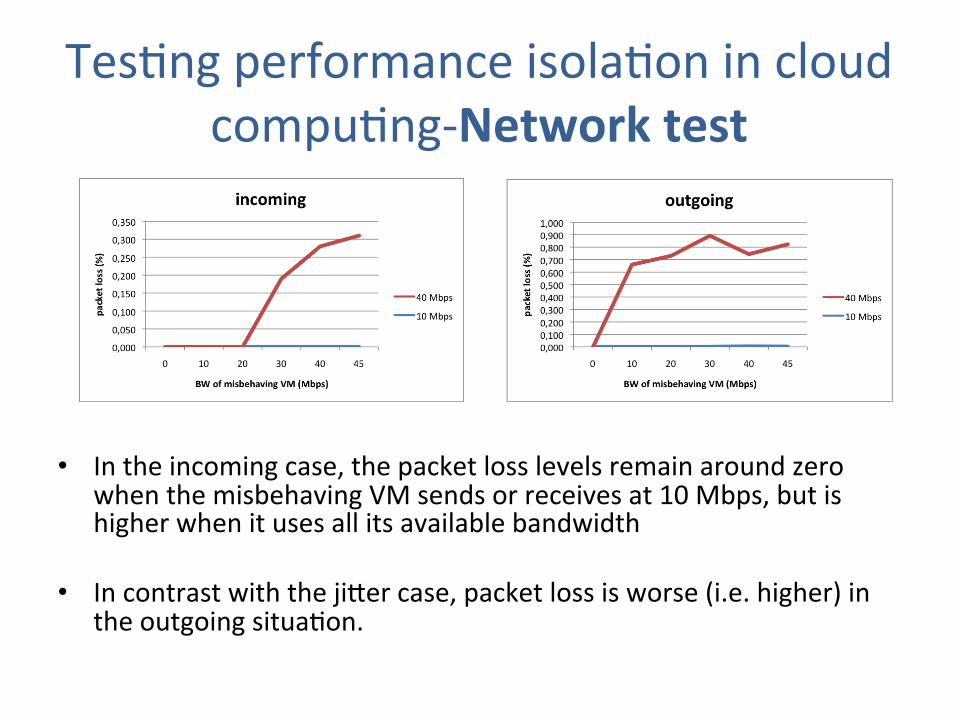
Likewise, packet loss levels remain around zero when the misbehaving VM sends or
receives at 10 Mbps, but is higher when it uses all its available bandwidth (see Figure 3.15).
In contrast with the jitter case, packet loss is worse (i.e. higher) in the outgoing situation.
Overall the levels of packet loss are not critical, but for a cloud service, with probably
packets being dropped along the way to the end-user, the levels of packet loss should be
kept minimum (preferably zero) inside the datacenter. Further discussion about this point
will be presented in the following chapter.
47
TesJng performance isolaJon in cloud compuJng-‐Network test
• In the incoming case, the packet loss levels remain around zero when the misbehaving VM sends or receives at 10 Mbps, but is higher when it uses all its available bandwidth
• In contrast with the jiier case, packet loss is worse (i.e. higher) in the outgoing situaJon.
Figure 3.15: Packet loss stress test results
48
SLA problem and applicaJon models • SLAs are the contracts negoJated between the two parJes that contain a
number of condiJons for the delivered quality of service, referred to as service level objecJves (SLO), and the corresponding compensaJons if these specified service levels are not met.
• The problem with current SLAs: – When a customer signs up to use a cloud the customers is not renJng a
parJcular machine, but rather is renJng capacity by the hour. – Customers have no way to truly know the type of computers their applicaJons
are running on
• To circumvent this, cloud providers supply customers with a number of performance metrics. For example Amazon’s EC2 Compute Unit (ECU).
• Performance metrics such as Amazon’s ECU in a mulJ-‐tenant cloud environment are not directly related to the CPU capacity of a specific processor.
SLA problem and applicaJon models
• There is a need for some sort of agreement between the cloud provider and the customer ensuring that the price paid for a specific amount of resources will lead to a performance that fulfills the user’s expectaJons.
• At present, the SLAs of all the major cloud providers follow the same paiern of condiJons and compensaJons, and focus, nearly exclusively, on availability of service, referring to the amount of Jme the service is up and responsive.
• E.g., Rackspace has 100% upJme. Unfortunately, if a business depends upon the 100% upJme guarantee it is likely to be disappointed, since the failure to provide this level of upJme simply leads to a payment by Rackspace which might not compensate the business for their loses due to not being able to operate for the period of Jme that the cloud is not available.
SLA problem and applicaJon models
• Last but not the least is who has the responsibility for both detecJng and noJfying the SLA violaJon.
• Today this is something that all cloud providers agree unanimously upon, this is the responsibility of the customer.
• This may be one of the biggest issues concerning the current state of cloud SLAs, the burden is put on the customer who, besides suffering because of the SLA violaJon, has to administraJvely prove that the violaJon of the SLA occurred.
SLA problem and applicaJon models
• Current methods range from simple semaphore-‐like indicators of the service status (i.e. up or down) to monitoring the use of resources (e.g. Amazon’s Cloudwatch).
• Some third-‐party companies have begun filling that gap, most notably CloudSleuth.
• Future cloud services’ SLAs should take on the problem of specifying performance, in such a way that the customer the knows limits between which its applicaJon performance may vary.
SLA problem and applicaJon models • A basic requirement for this is that the performance should be
mapped in measurable factors. For a cloud service these factors could be: – availability: The status of the service is defined as available when it can be reached and is operaJonal and responsive, and is measured as a percentage of Jme.
– response Jme: The response Jme is the delay between when a request is sent by the user and when the response is received, as measured in seconds to some stated precision.
– throughput: The amount of work a cloud instance can do in a given Jme, measured in served requests or transacJons per unit of Jme.
• Establishing bounds to these three parameters makes it straighVorward for the customer to be sure that their requirements will be met, thus successfully transferring the responsibility of maintaining performance levels to the cloud provider.
SLA problem and applicaJon models
• The SLA requirements and specificaJons should vary according to the type of applicaJons:
– Data-‐intensive: data access Jmes
– Latency-‐sensiJve: For a latency-‐sensiJve applicaJon to be hosted on the cloud the SLA requirements should be very specific about network performance, parJcularly with regard to fluctuaJons in bandwidth and delay.
– Mission-‐criJcal applicaJons: Customers willing to store mission-‐criJcal data in the cloud should look for specific level agreements on two parameters-‐ availability and durability
Conclusion • There is always a performance decrease due to co-‐located virtual machines running resource-‐intensive tasks.
• The drop in performance is slight for CPU and memory intensive workload and very significant for disk and network I/O intensive workloads.
• Variability of the measurements increases dramaJcally in every case when there is high background load.
Conclusion
• The current state of SLAs in cloud compuJng is inadequate and there is a need for fine-‐grained specificaJons about more performance parameters than simply availability.
• A framework including throughput, response Jme, and availability would be a good starJng point.

THANK YOU