cloning and sequencing of a ceuobiohydrolase gene...
TRANSCRIPT
CLONING AND SEQUENCING OF A CEUOBIOHYDROLASE GENE FROM
TRICHODERMA HARZ/ANUM FPJOBt
PATRICK GUILFOILE,* RON BURNS, Zu-Yr Gu, MATT AMUNDSON AND FU-HSIAN CHANG
ABSTRACT
A cbh1 cellobiohydrolase gene was cloned and sequenced from the fungus Trichoderma barzianum FP108. The cloning was performed by PCR amplification ofT harzianum genomic DNA, using PCR primers whose sequence was based on the cbh1 gene from Trichoderma reesei. The 3' end of the gene was isolated by inverse PCR; attempts to clone regions upstream of the 5' end of the gene were unsuccessful. Sequence comparisons sugge_st that this gene is closely related to cbb1 genes from other Trichoderma species. In particular, all catalytically important amino acids in the protein sequence deduced from the T barzianum cbb1 gene are conserved between species.
INTRODUCTION
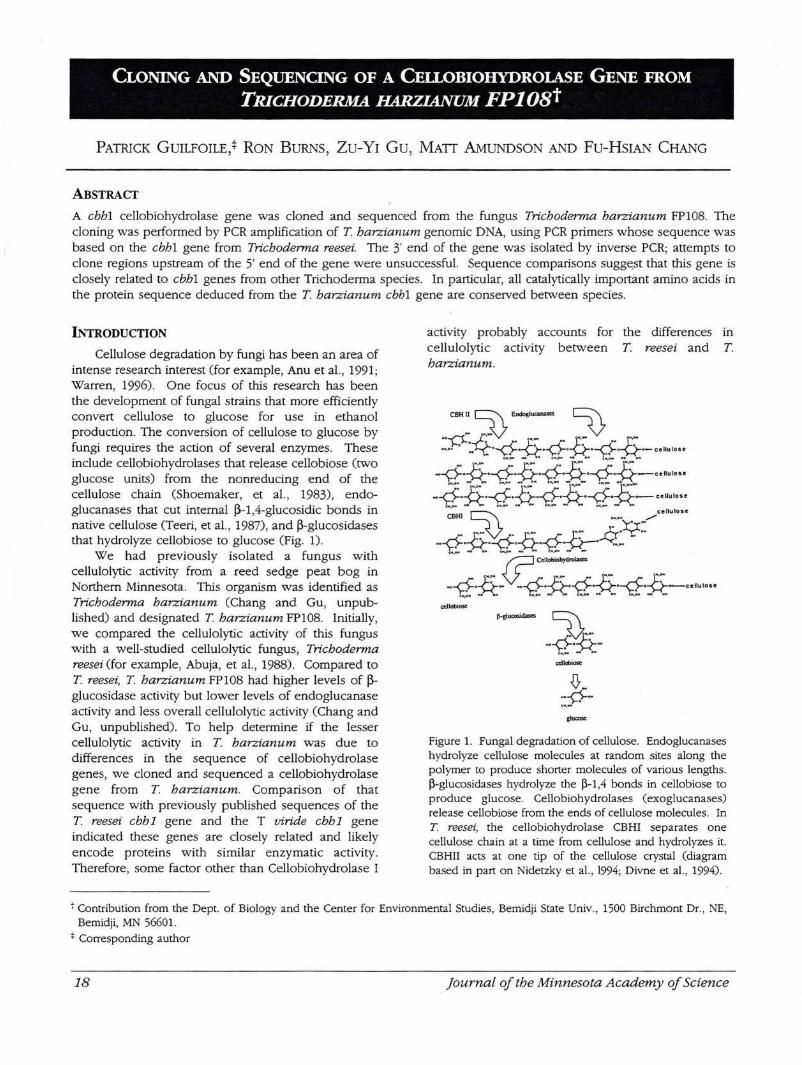
Cellulose degradation by fungi has been an area of intense research interest (for example, Anu eta!. , 1991 ; Warren, 1996). One focus of this research has been the development of fungal strains that more efficiently convert cellulose to glucose for use in ethanol production. The conversion of cellulose to glucose by fungi requires the action of several enzymes. These include cellobiohydrolases that release cellobiose (two glucose units) from the nonreducing end of the cellulose chain (Shoemaker, et a!. , 1983), endoglucanases that cut internal 13-1 ,4-glucosidic bonds in native cellulose (Teeri, eta!., 1987), and 13-glucosidases that hydrolyze cellobiose to glucose (Fig. 1).
We had previously isolated a fungus with cellulolytic activity from a reed sedge peat bog in Northern Minnesota. This organism was identified as Trichoderma harzianum (Chang and Gu, unpublished) and designated T harzianum FP108. Initially, we compared the cellulolytic activity of this fungus with a well-studied cellulolytic fungus, Trichoderma reesei (for example, Abuja, eta!., 1988). Compared to T reesei, T barzianum FP108 had higher levels of 13-glucosidase activity but lower levels of endoglucanase activity and less overall cellulolytic activity (Chang and Gu, unpublished). To help determine if the lesser cellulolytic activity in T harzianum was due to differences in the sequence of cellobiohydrolase genes, we cloned and sequenced a cellobiohydrolase gene from T barzianum. Comparison of that sequence with previously published sequences of the T reesei ebb 1 gene and the T viride ebb 1 gene indicated these genes are closely related and likely encode proteins with similar enzymatic activity. Therefore, some factor other than Cellobiohydrolase I
activity probably accounts for the differences in cellulolytic activity between T reesei and T harzianum.
.. ;fl~~ .. ~ .. r~ ~.·· • .. .1-..(."•-(')-•-Q •-Q-·~·-Q-·~·- cellulose --9:·P:·~·t.~~.~:~.~-· cellulose --¢:·-5-·~·-0-·-6·-5-·~·*-cellulose
........ - - cw, ......... '"·-- -coo,-- ... cellulose
CBHl ""'"" /
.r<: J:":· "'.r-<:.. J:::· Q- r:· ,o-·J?::: -""""t-·,- ·}.,..(""·~.r-·}.,..(""· • •"'""S-<" c.,-
CM, ... - - eoo.,Ooo OOO "" oo,ooo MO -
, .. ..?_ Cellobio~ - ... -"'*·-5-- --6·-&·-6·-&·~·-b--cellulose
,...... .... . .. c .. , ... - - ,.., ...... Oto coo,ooo - ...
cellobiose
jl-glucosidases c:::\ -~=---0-·v-
c .. , ... ... . ..
c::ellobiose
Figure 1. Fungal degradation of cellulose. Endoglucanases hydrolyze cellulose molecules at random sites along the polymer to produce shorter molecules of various lengths. ~-glucosidases hydrolyze the ~-1 ,4 bonds in cellobiose to produce glucose. Cellobiohydrolases (exoglucanases) release cellobiose from the ends of cellulose molecules. In T. reesei, the cellobiohydrolase CBHI separates one cellulose chain at a time from cellulose and hydrolyzes it. CBHII acts at one tip of the cellulose crystal (diagram based in part on Nidetzky et al. , 1994; Divne et al. , 1994).
t Contribution from the Dept. of Biology and the Center for Environmental Studies, Bemidji State Univ., 1500 Birchmont Dr., NE, Bemidji, MN 56601 .
* Corresponding author
18 journal of the Minnesota Academy of Science
MATERIALS AND METHODS
Genomic DNA Isolation: Genomic DNA was isolated from T. harzianum FP108 using the procedures of Raeder and Broda (1985).
PCR amplification and cloning of the T. harzianum cbh1 gene: 100 to 200 ng of genomic T harzianum DNA was used in a 50 IlL PCR reaction with 2.5 units of Taq DNA polymerase (Perkin-Elmer, Foster City, CA) 2.5 mM MgC12, 25 pmoles of each primer, 200 !lM each deoxynuclecotide triphosphate and 1 X PCR buffer (50 mM KCl and 10 mM Tris-HCl, pH 8.3). PCR was performed in a Perkin Elmer Model 480 thermocycler (Foster City, CA) for 35 cycles of 94" c for 30 sec., so· c for 30 sec., and n · c for 90 sec.
Both primers used in the PCR reaction included restriction enzyme sites to facilitate cloning, and were based on the T. reesei ebb 1 gene sequence (Shoemaker, et al., 1983). The primer sequences were:
Upstream primer 5'AAACTGCAGfCGACGTCATATGTATCGGAAGT
TGGCCGTC-3' Downstream primer 5'GCG TCTAGATT ACAGGCACTGAGAGTAGTA-3' The underlined sequence in the upstream primer
represents the translational start codon in the T reesei gene. The underlined sequence in the downstream primer represents the translational stop codon in the T. reesei gene . The italicized sequence in the upstream primer indicates a Pstl restriction enzyme site used for cloning; the italicized sequence in the downstream primer indicates a Xbal restriction enzyme site used for cloning.
The PCR products were purified by ultrafiltration (Millipore Ultrafree, Millipore, Bedford, MA) as directed by the manufacturer. Purified PCR products were digested with Pstl and Xbal (these sites were in the PCR primers) and run on a 0.7% TBE-agarose gel containing 0.5 !lg mL-1 ethidium bromide. The pBluescriptii KS plasmid (Stratagene, La Jolla, CA) was also digested with Pstl and Xbal and run on the same gel. The PCR products and pBluescript plasmid were isolated by electrophoresis to NA45 DEAE membrane
·(Schleicher and Schuell, Keene, NH) and eluted from the membrane in a buffered ammonium acetate solution (Guilfoile and Hutchinson, 1991).
The eluted DNA was resuspended in 11 IlL of sterile distilled water and ligated with the addition of 3 IlL 5X ligase buffer and 1 IlL T4 DNA ligase (Gibco/ BRL, Gaithersburg, MD). The ligation reaction was then incubated overnight at room temperature. E. coli DH5a cells (Gibco/ BRL, Gaithersburg, MD) were transformed with 7 IlL of the ligation mixture, using standard protocols, except that LB broth and LB agar were used instead of SOC broth and SOB agar (Sambrook et al., 1989, p 1.82). Colonies containing putative recombinant plasmids were grown overnight
Vol. 64, No. 1, 1999
in LB broth containing 150 !lg mL-1 ampicillin and plasmid DNA was isolated by an alkaline lysis procedure (Morelle, 1988). The DNA from recombinant plasmids containing the putative ebb 1 gene from T. harzianum was prepared using a large-scale column procedure (Qiagen Plasmid Midi kit, Qiagen, Chatsworth, CA) for DNA sequencing.
PCR amplification and cloning of the 3' end of the cbh1 gene: The region of DNA downstream of the 3' end of the ebb 1 gene was amplified by inverse PCR (Ochman, et al. , 1990). Genomic T. harzianum DNA was digested with Sau3A overnight at room temperature, precipitated with isopropanol and ammonium acetate, and resuspended in TE. About 250 ng ClJlL) of digested DNA was added to 10 IlL of 5X ligase buffer, 38 IlL of sterile distilled water, and 1 IlL T4 DNA ligase. The ligation mixture was then incubated overnight at room temperature. The PCR conditions were as described above except that the third part of each cycle was held for 2 min. The primers used were:
Upstream: 5'CCAGTCAGTAATGTAATAG-3' Downstream: 5'ACTCCAAGGTTATCTACT-3' These primers were chosen because they are
located 3' to the last Sau3A site in the chb1 gene. The upstream and downstream primers are complementary to opposite DNA strands, and they are oriented in such a way that they will amplify the entire region between the last Sau3A site in the chb1 gene and the first Sau3A site in the DNA located 3' to the cbh1 gene.
Purified PCR product (5 JlL containing about 500 pg) was added to 5 IlL (about 500 pg) of pUC19 that had been digested with Smal. Then, 3 JlL of 5X ligase buffer, 1!lL of T4 DNA ligase and 1JlL of Smal were added (to cleave plasmids that self-ligated) and the reaction mixture was incubated overnight. Transformation and plasmid isolation was as described above for the cbh1 gene. Despite numerous attempts, we were unable to clone the region upstream of the 5' end of the gene by inverse PCR or other methods.
DNA sequencing and analysis: Plasmids were sequenced by the dideoxy terminator method with Sequenase 2.0 (Amersham, Arlington Heights, IL) as directed by the manufacturer. At least two independent PCR products were sequenced from each region of the gene. The DNA sequences were analyzed using the software programs EDITSEQ, MAPDRA W, and MEGALIGN (DNASTAR, Madison, WI).
RESULTS
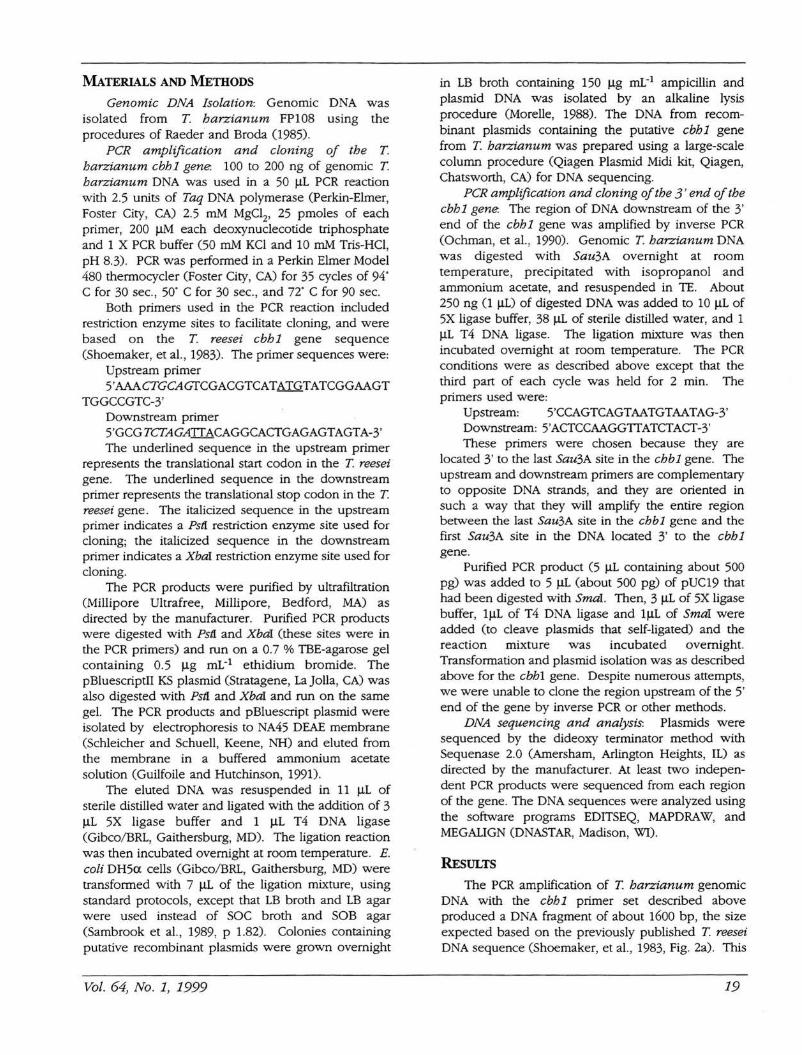
The PCR amplification of T. barzianum genomic DNA with the cbh1 primer set described above produced a DNA fragment of about 1600 bp, the size expected based on the previously published T reesei DNA sequence (Shoemaker, et al. , 1983, Fig. 2a). This
19
A
2027-
564-
B
1
1
2
2
1264
702
Figure 2. PCR products used for sequencing the cbh 1 gene from T harzianum. (A) the PCR product of the entire cbhl gene. Lane 1, J.... Hind!Il DNA marker. Lane 2, PCR product. The arrow indicates the PCR product in lane 2 that was cloned and sequenced. The numbers to the left of the photograph indicate the size of the DNA fragments (in bp) in the marker DNA. (B) The PCR product of the 3' end of the cbhl gene and downstream regions. Lane 1, PCR product. Lane 2, A. EstEll DNA marker. The arrow indicates the PCR product in lane 1 that was cloned and sequenced. The numbers to the right of the photograph indicate the size of DNA fragments (in bp) in the marker DNA.
DNA fragment was cloned into the pBluescript plasmid and sequenced (Fig. 2b). Inverse PCR produced a 600 bp product of the region beyond the 3' end of the gene. This PCR fragment was cloned into pUC19 and sequenced as well (Fig. 2b) .
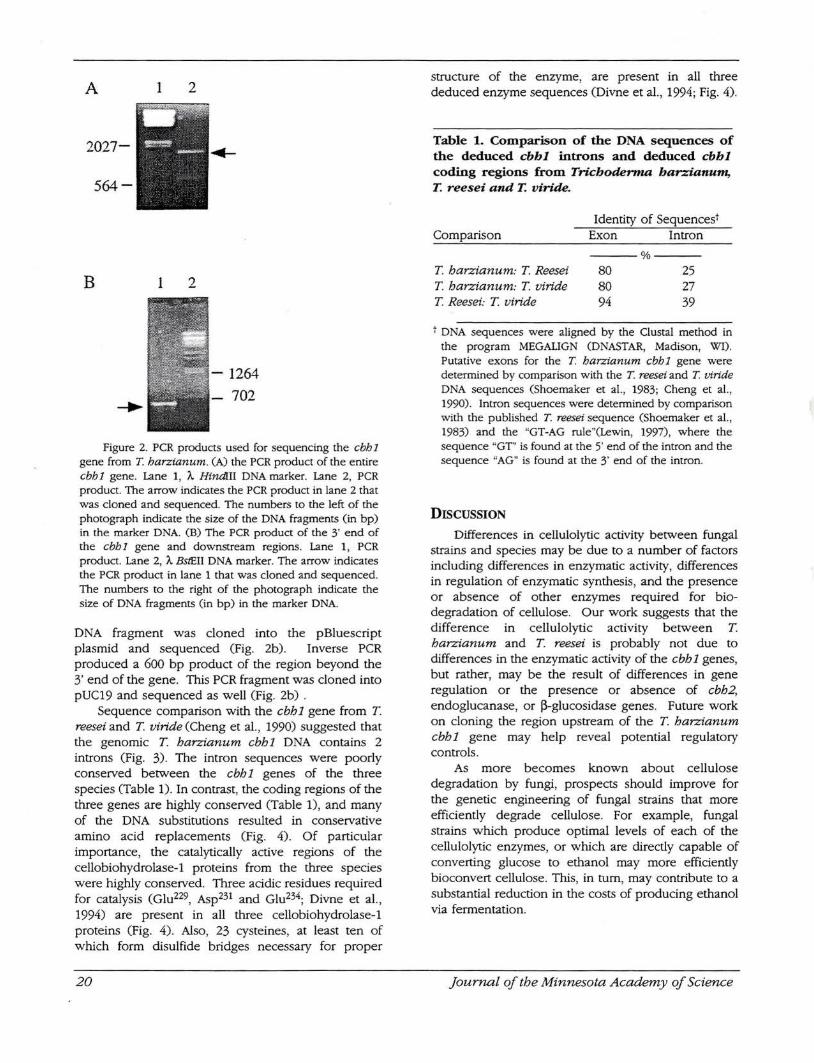
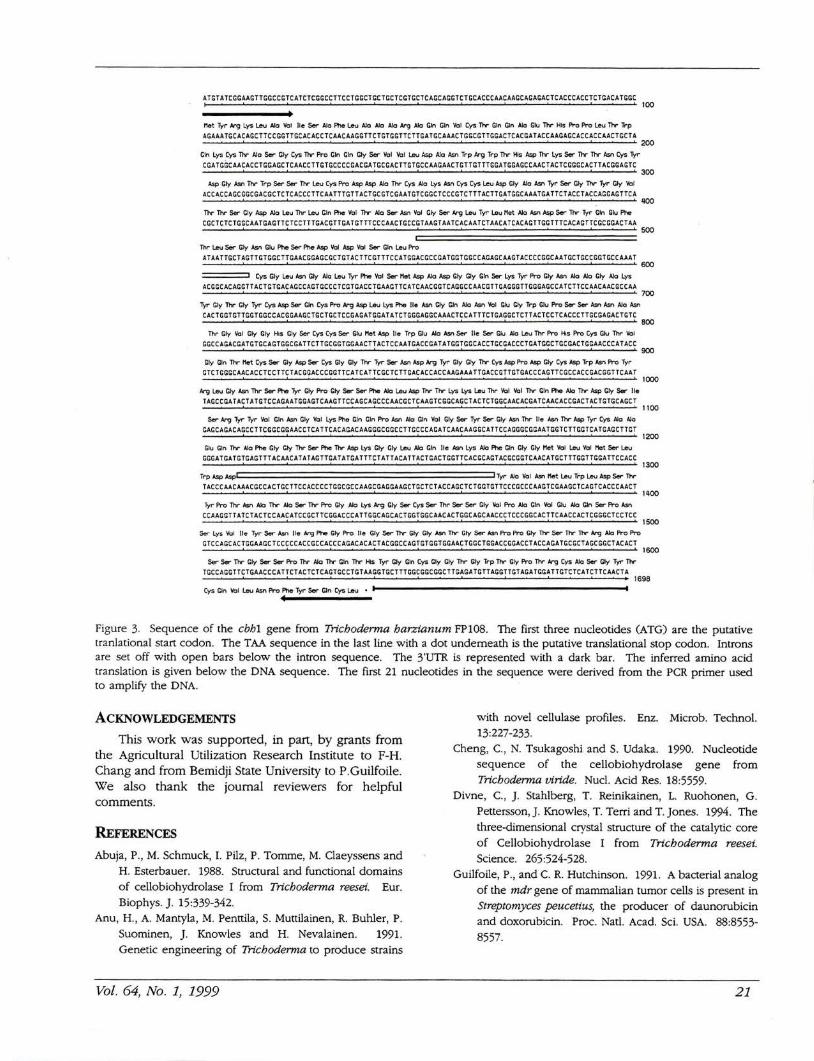
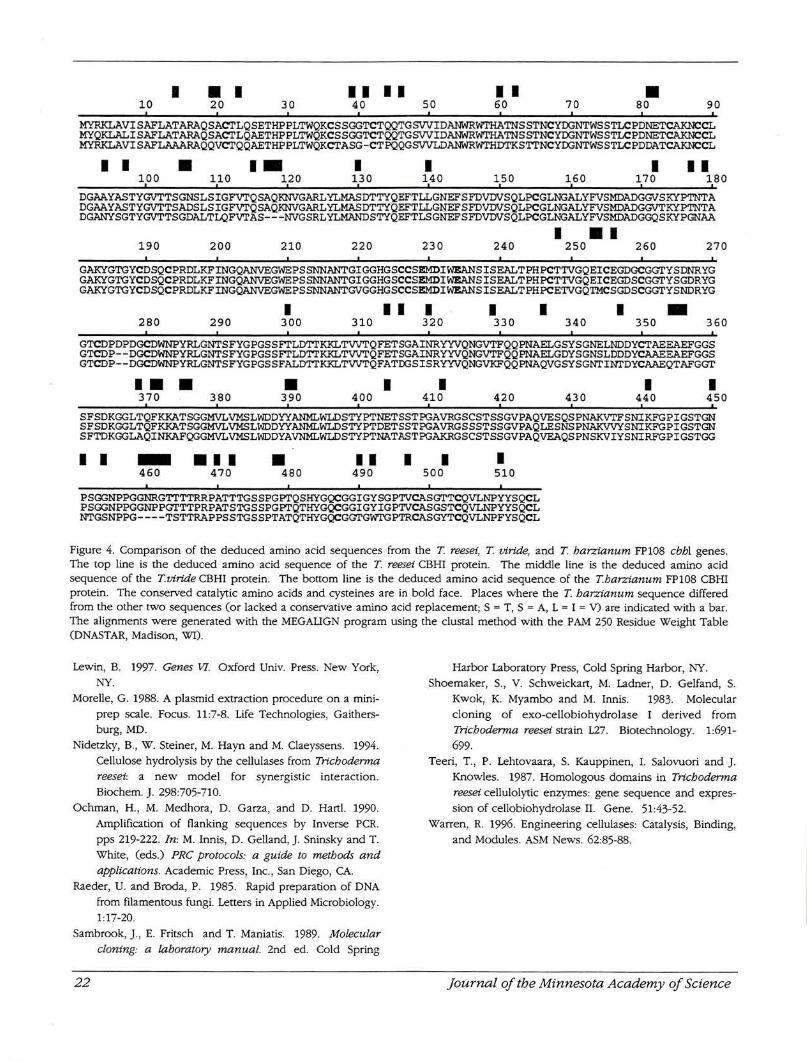
Sequence comparison with the ebb 1 gene from T reesei and T viride (Cheng eta!. , 1990) suggested that the genomic T barzianum ebb1 DNA contains 2 introns (Fig. 3). The intron sequences were poorly conserved between the ebb 1 genes of the three species (Table 1). In contrast, the coding regions of the three genes are highly conserved (Table 1), and many of the DNA substitutions resulted in conservative amino acid replacements (Fig. 4). Of particular importance, the catalytically active regions of the cellobiohydrolase-1 proteins from the three species were highly conserved. Three acidic residues required for catalysis (Glu229, Asp231 and Glu234; Divne et a!. , 1994) are present in all three cellobiohydrolase-1 proteins (Fig. 4). Also, 23 cysteines, at least ten of which form disulfide bridges necessary for proper
20
structure of the enzyme, are present in all three deduced enzyme sequences (Divne eta!., 1994; Fig. 4).
Table 1. Comparison of the DNA sequences of the deduced cbbl introns and deduced cbbl coding regions from Trichoderma barzianum, T. reesei and T. viride.
Comparison
T barzianum: T Reesei T barzianum: T viride T Reesei: T viride
Identity of Sequencest Exon Intron
----o/o ----
80 80 94
25 27 39
t DNA sequences were aligned by the Clustal method in the program MEGALIGN (DNASTAR, Madison, WI). Putative exons for the T harzianum ebb 1 gene were determined by comparison with the T reesei and T viride DNA sequences (Shoemaker et al., 1983; Cheng et a!. , 1990). Intron sequences were determined by comparison with the published T reesei sequence (Shoemaker et a!. , 1983) and the "GT-AG rule"(Lewin, 1997), where the sequence "GT"' is found at the 5' end of the intron and the sequence "AG" is found at the 3' end of the intron.
DISCUSSION
Differences in cellulolytic activity between fungal strains and species may be due to a number of factors including differences in enzymatic activity, differences in regulation of enzymatic synthesis, and the presence or absence of other enzymes required for biodegradation of cellulose. Our work suggests that the difference in cellulolytic actiVIty between T barzianum and T reesei is probably not due to differences in the enzymatic activity of the ebb 1 genes, but rather, may be the result of differences in gene regulation or the presence or absence of cbh2, endoglucanase, or ~-glucosidase genes. Future work on cloning the region upstream of the T. barzianum ebb1 gene may help reveal potential regulatory controls.
As more becomes known about cellulose degradation by fungi, prospects should improve for the genetic engineering of fungal strains that more efficiently degrade cellulose. For example, fungal strains which produce optimal levels of each of the cellulolytic enzymes, or which are directly capable of converting glucose to ethanol may more efficiently bioconvert cellulose. This, in tum, may contribute to a substantial reduction in the costs of producing ethanol via fermentation.
journal of the Minnesota Academy of Science
A TGT A TC GGAAGTT GG C C GTC A TC TCGGCCTTC C TGGCT GC T GCTCGTGCT CAGCAGGT C T GCACCCAACAAGCAGAGAC TCAC CCAC C TC T CACA TGGC
~~~~~~~h~-~~-~-~~~~~~~~~-~~-~~~~~ AGAAA TGCACAGC TTCCGG T TGCACACC TCAACAAGGTTCTG TGGTTC T TGA T GCAAAC T GGCGTTGGAC TC ACGA T ACC AAGAGCACC ACCAAC TGCT A
100
--~--~------~------~------~----~------~------~------~----~------~200
~~~~-~~~~~~~~~~~~--~~~~~--~~~~~~~~ C GA TGGCAACACC TGGAGC T C AACC TTG T GCC CC GA CGA TCCCAC TTG TGCCAACAACTG T TCTTTCCA TGGAGC CAAC T AC TC CCGCAC TT AC CGA G T C
-~~~~~~~~~~---~~~~~~~~-~-~~~~~~~~ AC CAC CACC GCC CAC GCTCTCACCC TTCAA TT TGTT AC TCC GTC GAA T CTCCCCT CCCCTC T TT ACT TGA TGGC AAA TGA T TCT ACC T ACCACCAGT TC A
~~~~-~~~~~~~~-~~~~~~~~~~~~-~~~~~~ CGCTCTCTGGCAATCAGTTCTCCTT TGACGTTGATGTTTCCCAACTGCCGT AAGT AATCACAATCTAACA TCACAGTTGCTTTCACAGTTCGCGGACT AA
~~~~~~-~~-~-~~~~~ AT AA T TCCT ACTT CT CCC TTGAAC GGAGCGCT CT ACT TCGT T TC CAT GCACGCC GA TCCT CCC C AGAGC AAC T AC CCC CGC AA TGCTCCC CGT CCC AAA T
~~~~~~~~-~~~-~-~~~~~~~~---~-~ ACGGC ACAGGT TACT G TGAC ACC CAC T CCC C T CGT GACC TCAAG T TCA TCAAC CG TC AGGC CAACGT T GAGGGTT GGGAGCCA TCT TCCAACAAC GC CAA
~~~~~~-~~~~~-~~-h-~~-~~~~~~~~~---c ACT GGTGTTGG T GGCCAC GGAAGC TG C T GC TCC GAGA TGGA T A TC TGGGAGGC AAACTC CAT TTCTGAGGCT CT TACT CC TC ACCC T TGC GAGAC TCTC
~~~~~-~~~~~~~-h~~~-~h~~~~~~-~~~~~ CCCC ACACGATC T CCA CTGCCGA TTCT TGCGC TGGAAC TT AC TC C AA T GACCGA T A TGGTCCCACCTGCCACC CT CA TGCC TCCGACTCCAAC CCA T AC C
~~~~~~~--~~~~~-~-~~~~~~-~-~~-~-~~ CTC T CCCCAAC AC CT C C T TC T AC GCAC CC CG T TC AT CAT TC GC TC TTCAC AC C AC C AACAAA T TCACC G TTCTCAC C CAC TT CCCCAC CCAC CGT TC AA T
~~~~~~-~~~~~~-~~-~~~~~~~~~~-~~-~-h T ACCC CAT ACT AT CT CCAGAA T CCAGT C AAC T TCCACCAGC CC AACGC TCAAC TC GCCAGC T AC TCTGGCAAC ACCA TCAAC AC CGAC T AC TG TGC ACC T
~~~~~~-~~~-~~~~-~~~-~~~-~h~~-~~-~ GACCACAC AGC C T TCGGC GGAACC TCA T T CAC AGAC AAGGCCGGC CT TCCCCACA TCAAC AAG GC A TT CC AGGCC GGAA TGG TC TTCG T CA TGAGC T TGT
·~~--~~-~-~-~~~~~~h-~~~~~~~~~~~~~ CGGATCATGTGAGTTT ACAACAT AT AGTTCATA TCA TTTCT A TT ACA TT ACTGACTGGTTCACCCAGTACCCCCTCAACATCCTTTCCTTCGA TTCCACC
~-- ~~~--~~~-~TACCCAACAAACGCCACTGCTTCCACCCCTGCCGCCAAGCCAGGAAGCTGCTCTACCAGCTCTCGTGTTCCCCCCCAAGTCGAAGCTCAGTCACCCAACT
~~~-~~~~~~~~~~~~~~~~-~~~~~~~~~~~CCAAG G T T A TC T AC TCC AAC A TC C CCTTCGGACCCA T T CGCAGCACTCG TGGCAAC ACT GGCAGC AACCC TCCCGGC AC TTCAACC ACTCCCCC T CC TCC
~~~h~--h~-~~h~--~~--~--~~~----~~-~ G TC CACC AC TCGAAGC T CCC CCAC C GC CACCCACACACAC T ACGGCC AG TGT GGT GCAACT GGC TGCACCGCACCT ACCACA T CCGCT ACC CGCT AC ACT
~~-~~-~~~~~~-~~~~~~-~~~~~~~~~~~~TGCCAGCT TCTGAACC CAT T CT AC TC T CACTGC CTGT AAGGTGCTT TCGCGGCGGC T TGAGA T CTT AGCTTC T ACA T GCA T TGTC TCA TC TTCAACT A
300
500
600
700
BOO
900
1000
1100
1200
1300
IQOO
1500
1600
1698
Cys Gin Vol~~~~ Ty• ~Gin Cys ~ • t----------------------
Figure 3. Sequence of the cbh1 gene from Trichoderma harzianum FP108. The first three nucleotides (ATG) are the putative tranlational start codon. The TAA sequence in the last line with a dot underneath is the putative translational stop codon. Introns are set off with open bars below the intron sequence. The 3'UTR is represented with a dark bar. The inferred amino acid translation is given below the DNA sequence. The first 21 nucleotides in the sequence were derived from the PCR primer used to amplify the DNA.
ACKNOWLEDGEMENTS
This work was supported, in part, by grants from the Agricultural Utilization Research Institute to F-H. Chang and from Bemidji State University to P.Guilfoile. We also thank the journal reviewers for helpful comments.
REFERENCES
Abuja, P., M. Schmuck, I. Pilz, P. Tomme, M. Claeyssens and H. Esterbauer. 1988. Structural and functional domains of cellobiohydrolase I from Trichoderma reesei. Eur. Biophys.]. 15:339-342.
Anu, H., A. Mantyla, M. Pennila, S. Muttilainen, R. Buhler, P. Suominen, ]. Knowles and H. Nevalainen. 1991. Genetic engineering of Trichoderma to produce strains
Vol. 64, No. 1, 1999
with novel cellulase profiles. Enz. Microb. Techno!. 13:227-233.
Cheng, C. , N. Tsukagoshi and S. Udaka. 1990. Nucleotide sequence of the cellobiohydrolase gene from Trichoderma viride. Nucl. Acid Res. 18:5559.
Divne, C., ]. Stahlberg, T. Reinikainen, L. Ruohonen, G. Pettersson,]. Knowles, T. Terri and T. Jones. 1994. The three-dimensional crystal structure of the catalytic core of Cellobiohydrolase I from Trichoderma reesei. Science. 265:524-528.
Guilfoile, P., and C. R. Hutchinson. 1991. A bacterial analog of the mdr gene of mammalian tumor cells is present in Streptomyces peucetius, the producer of daunorubicin and doxorubicin. Proc. Nat!. Acad. Sci. USA. 88:8553-8557.
21
I • I 20
I I I I I I 60 • 80 10 30 40 50 70 90
MYRKLAVISAFLATARAQSACTLQSETHPPLTWQKCSSGGTCTQQTGSVVIDANWRWTHATNSSTNCYDGNTWSSTLCPDNETCAKNCCL MYQKLALISAFLATARAQSACTLQAETHPPLTWQKCSSGGTCTQQTGSVVIDANWRWTHATNSSTNCYDGNTWSSTLCPDNETCAKNCCL MYRKLAVISAFLAAARAQQVCTQQAETHPPLTWQKCTASG-CTPQQGSVVLDANWRWTHDTKSTTNCYDGNTWSSTLCPDDATCAKNCCL
I I • 1• 100 110 120
I 130
I 140 150
I II 160 170 180
DGAAYASTYGVTTSGNSLSIGFVTQSAQKNVGARLYLMASDTTYQEFTLLGNEFSFDVDVSQLPCGLNGALYFVSMDADGGVSKYPTNTA DGAAYASTYGVTTSADSLSIGFVTQSAQKNVGARLYLMASDTTYQEFTLLGNEFSFDVDVSQLPCGLNGALYFVSMDADGGVTKYPTNTA DGANYSGTYGVTTSGDALTLQFVTAS---NVGSRLYLMANDSTYQEFTLSGNEFSFDVDVSQLPCGLNGALYFVSMDADGGQSKYPGNAA
I .I 190 200 210 220 230 240 250 260 270
GAKYGTGYCDSQCPRDLKFINGQANVEGWEPSSNNANTGIGGHGSCCSEMDIWEANSISEALTPHPCTTVGQEICEGDGCGGTYSDNRYG GAKYGTGYCDSQCPRDLKFINGQANVEGWEPSSNNANTGIGGHGSCCSEMDIWEANSISEALTPHPCTTVGQEICEGDSCGGTYSGDRYG GAKYGTGYCDSQCPRDLKFINGQANVEGWEPSSNNANTGVGGHGSCCSEMDIWEANSISEALTPHPCETVGQTMCSGDSCGGTYSNDRYG
I I I I I -280 290
I 300 310 320
I 330 340 350 360
GTCDPDPDGCDWNPYRLGNTSFYGPGSSFTLDTTKKLTVVTQFETSGAINRYYVQNGVTFQQPNAELGSYSGNELNDDYCTAEEAEFGGS GTCDP--DGCDWNPYRLGNTSFYGPGSSFTLDTTKKLTVVTQFETSGAINRYYVQNGVTFQQPNAELGDYSGNSLDDDYCAAEEAEFGGS GTCDP--DGCDWNPYRLGNTSFYGPGSSFALDTTKKLTVVTQFATDGSISRYYVQNGVKFQQPNAQVGSYSGNTINTDYCAAEQTAFGGT
I • • 370 380 • 390
I 400
I 410 420 430
I 440
I 450
SFSDKGGLTQFKKATSGGMVLVMSLWDDYYANMLWLDSTYPTNETSSTPGAVRGSCSTSSGVPAQVESQSPNAKVTFSNIKFGPIGSTGN SFSDKGGLTQFKKATSGGMVLVMSLWDDYYANMLWLDSTYPTDETSSTPGAVRGSSSTSSGVPAQLESNSPNAKVVYSNIKFGPIGSTGN SFTDKGGLAQINKAFQGGMVLVMSLWDDYAVNMLWLDSTYPTNATASTPGAKRGSCSTSSGVPAQVEAQSPNSKVIYSNIRFGPIGSTGG
I I -460 .II
470 • 480 I I I I I
490 500 510
PSGGNPPGGNRGTTTTRRPATTTGSSPGPTQSHYGQCGGIGYSGPTVCASGTTCQVLNPYYSQCL PSGGNPPGGNPPGTTTPRPATSTGSSPGPTQTHYGQCGGIGYIGPTVCASGSTCQVLNPYYSQCL NTGSNPPG----TSTTRAPPSSTGSSPTATQTHYGQCGGTGWTGPTRCASGYTCQVLNPFYSQCL
Figure 4. Comparison of the deduced amino acid sequences from the T reesei, T viride, and T harzianum FP108 cbh1 genes. The top line is the deduced amino acid sequence of the T. reesei CBHI protein. The middle line is the deduced amino acid sequence of the Tviride CBHI protein. The bottom line is the deduced amino acid sequence of the Tharzianum FP108 CBHI protein. The conserved catalytic amino acids and cysteines are in bold face. Places where the T harzianum sequence differed from the other two sequences (or lacked a conservative amino acid replacement; S = T, S = A, L = I = V) are indicated with a bar. The alignments were generated with the MEGAUGN program using the clustal method with the PAM 250 Residue Weight Table (DNASTAR, Madison, WI).
Lewin, B. 1997. Genes W. Oxford Univ. Press. New York, NY.
Morelle, G. 1988. A plasmid extraction procedure on a miniprep scale. Focus. 11 :7-8. Life Technologies, Gaithersburg, MD.
Nidetzky, B., W. Steiner, M. Hayn and M. Claeyssens. 1994. Cellulose hydrolysis by the cellulases from Trichoderma reesei: a new model for synergistic interaction. Biochem. ]. 298:705-710.
Ochman, H., M. Medhora, D. Garza, and D. Hartl. 1990. Amplification of flanking sequences by Inverse PCR. pps 219-222. In: M. Innis, D. Gelland, ]. Sninsky and T.
White, (eds.) PRC protocols: a guide to methods and applications. Academic Press, Inc., San Diego, CA.
Raeder, U. and Broda, P. 1985. Rapid preparation of DNA from filamentous fungi. Letters in Applied Microbiology. 1:17-20.
Sambrook, ]. , E. Fritsch and T. Maniatis. 1989. Molecular cloning: a laboratory manual. 2nd ed. Cold Spring
22
Harbor Laboratory Press, Cold Spring Harbor, NY. Shoemaker, S., V. Schweickart, M. Ladner, D. Gelfand, S.
Kwok, K. Myambo and M. Innis. 1983. Molecular cloning of exo-cellobiohydrolase I derived from Trichoderma reesei strain L27. Biotechnology. 1:691-699.
Teeri, T. , P. Lehtovaara, S. Kauppinen, I. Salovuori and ]. Knowles. 1987. Homologous domains in Trichoderma reesei cellulolytic enzymes: gene sequence and expression of cellobiohydrolase II. Gene. 51:43-52.
Warren, R. 1996. Engineering cellulases: Catalysis, Binding, and Modules. ASM News. 62:85-88.
journal of the Minnesota Academy of Science