clique para editar o título results mestre announcement clique para editar o … · 2017-05-12 ·...
TRANSCRIPT
Clique para editar o texto mestre
Clique para editar o título mestreClique para editar o texto mestre
RESULTS ANNOUNCEMENT1Q17
Conference Call / WebcastMay, 12th 2017
2
Disclaimer
FORWARD-LOOKING STATEMENTS:
DISCLAIMER
The presentation may contain forward-looking statements about future eventswithin the meaning of Section 27A of the Securities Act of 1933, as amended, andSection 21E of the Securities Exchange Act of 1934, as amended, that are not basedon historical facts and are not assurances of future results. Such forward-lookingstatements merely reflect the Company’s current views and estimates of futureeconomic circumstances, industry conditions, company performance and financialresults. Such terms as "anticipate", "believe", "expect", "forecast", "intend", "plan","project", "seek", "should", along with similar or analogous expressions, are used toidentify such forward-looking statements. Readers are cautioned that thesestatements are only projections and may differ materially from actual future resultsor events. Readers are referred to the documents filed by the Company with theSEC, specifically the Company’s most recent Annual Report on Form 20-F, whichidentify important risk factors that could cause actual results to differ from thosecontained in the forward-looking statements, including, among other things, risksrelating to general economic and business conditions, including crude oil and othercommodity prices, refining margins and prevailing exchange rates, uncertaintiesinherent in making estimates of our oil and gas reserves including recentlydiscovered oil and gas reserves, international and Brazilian political, economic andsocial developments, receipt of governmental approvals and licenses and our abilityto obtain financing.
We undertake no obligation to publicly update or revise any forward-lookingstatements, whether as a result of new information or future events or for any otherreason. Figures for 2017 on are estimates or targets.
All forward-looking statements are expressly qualified in their entirety by thiscautionary statement, and you should not place reliance on any forward-lookingstatement contained in this presentation.
In addition, this presentation also contains certain financial measures that are notrecognized under Brazilian GAAP or IFRS. These measures do not have standardizedmeanings and may not be comparable to similarly-titled measures provided by othercompanies. We are providing these measures because we use them as a measure ofcompany performance; they should not be considered in isolation or as a substitutefor other financial measures that have been disclosed in accordance with BrazilianGAAP or IFRS.
NON-SEC COMPLIANT OIL AND GAS RESERVES:
CAUTIONARY STATEMENT FOR US INVESTORS
We present certain data in this presentation, such as oil and gas resources, that weare not permitted to present in documents filed with the United States Securitiesand Exchange Commission (SEC) under new Subpart 1200 to Regulation S-K becausesuch terms do not qualify as proved, probable or possible reserves under Rule 4-10(a) of Regulation S-X.
3
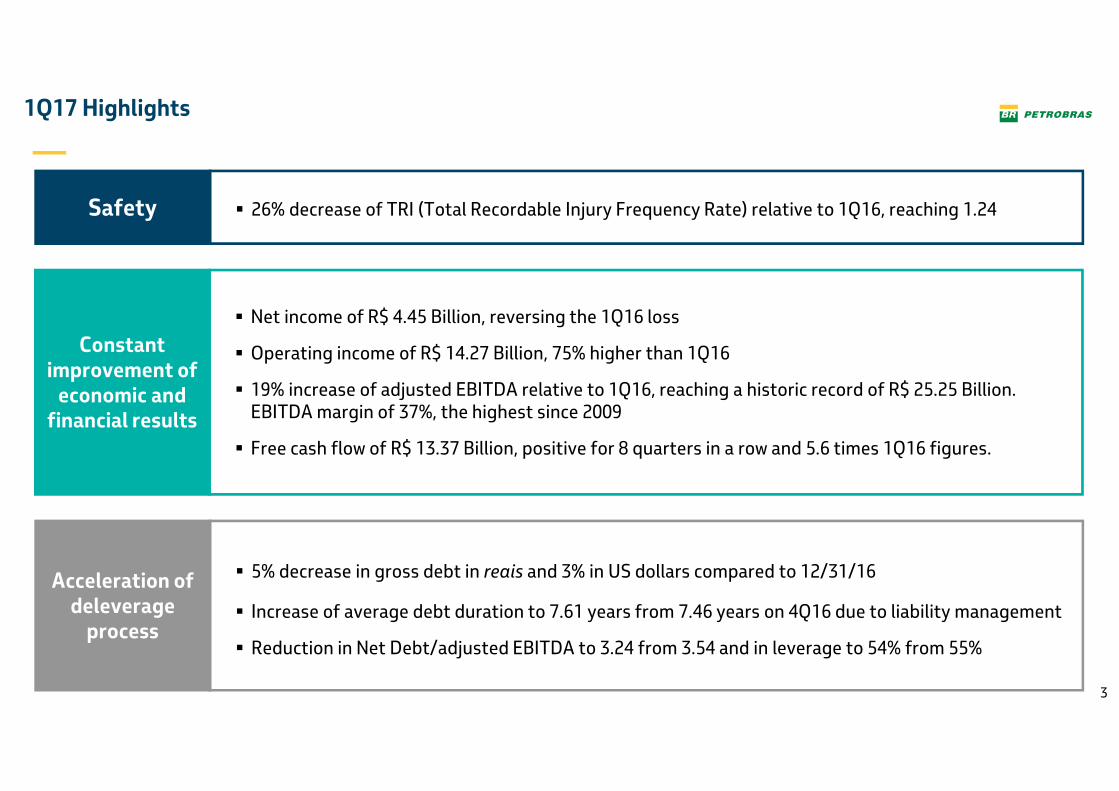
1Q17 Highlights
Constant improvement of
economic and financial results
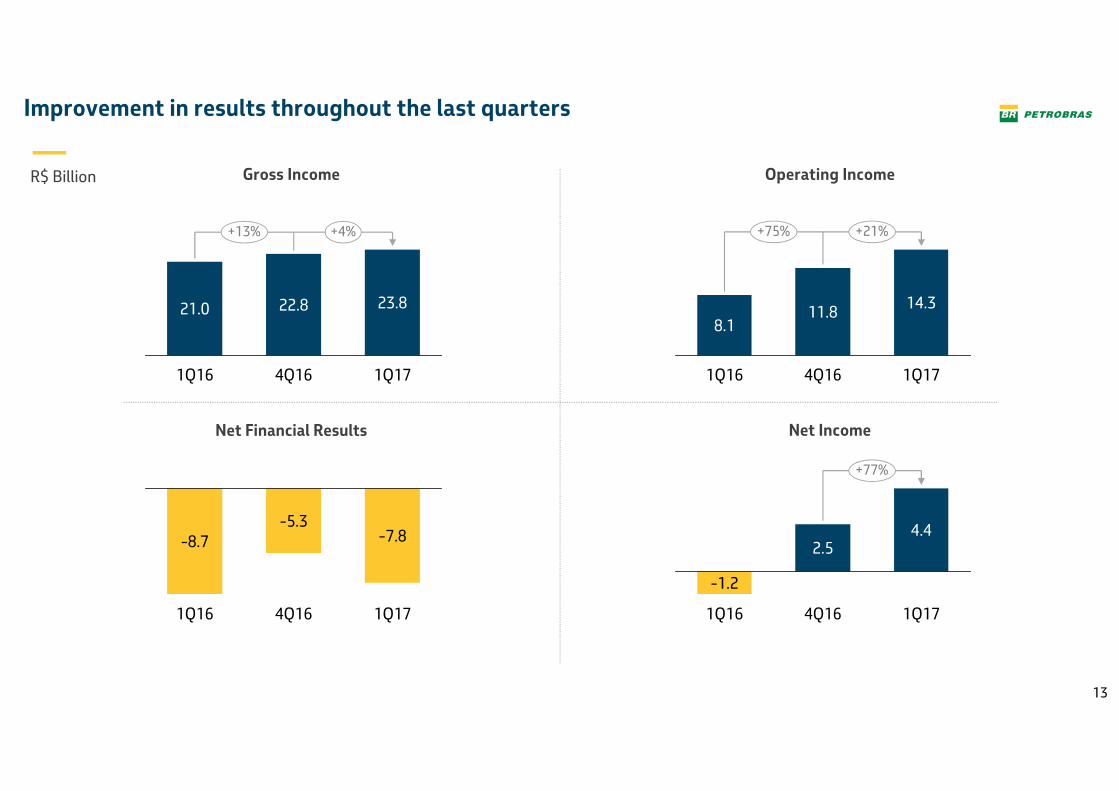
� Net income of R$ 4.45 Billion, reversing the 1Q16 loss
� Operating income of R$ 14.27 Billion, 75% higher than 1Q16
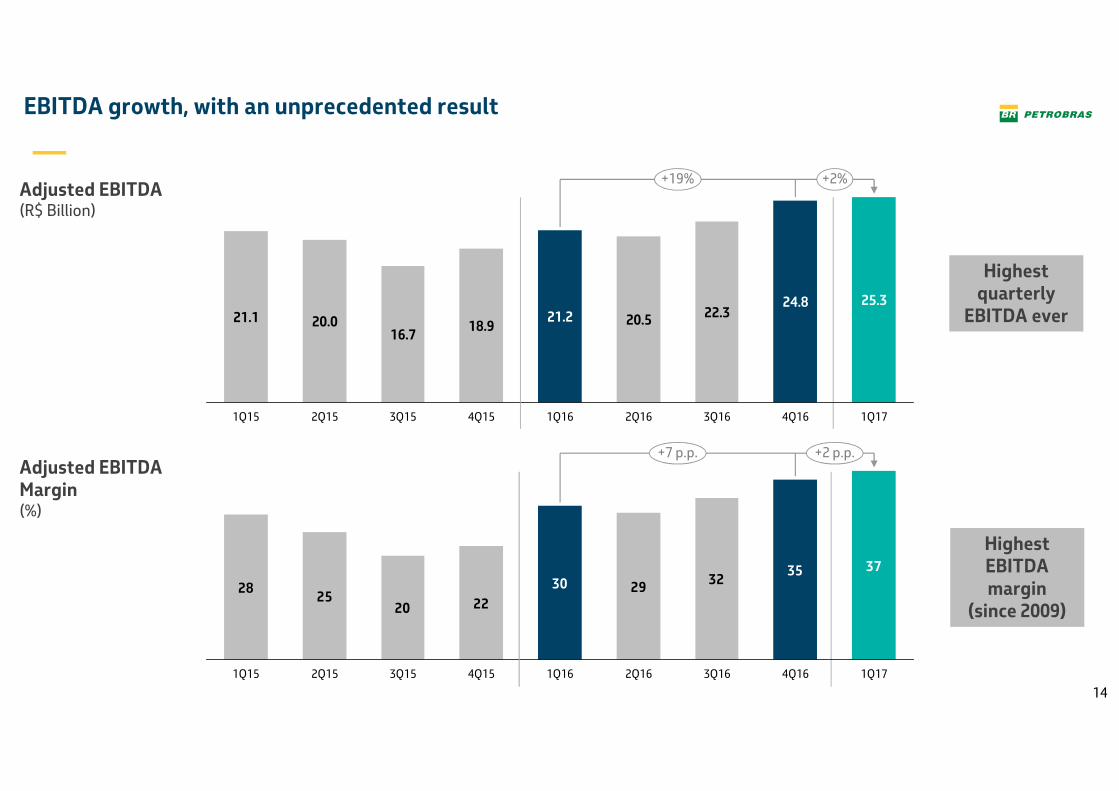
� 19% increase of adjusted EBITDA relative to 1Q16, reaching a historic record of R$ 25.25 Billion. EBITDA margin of 37%, the highest since 2009
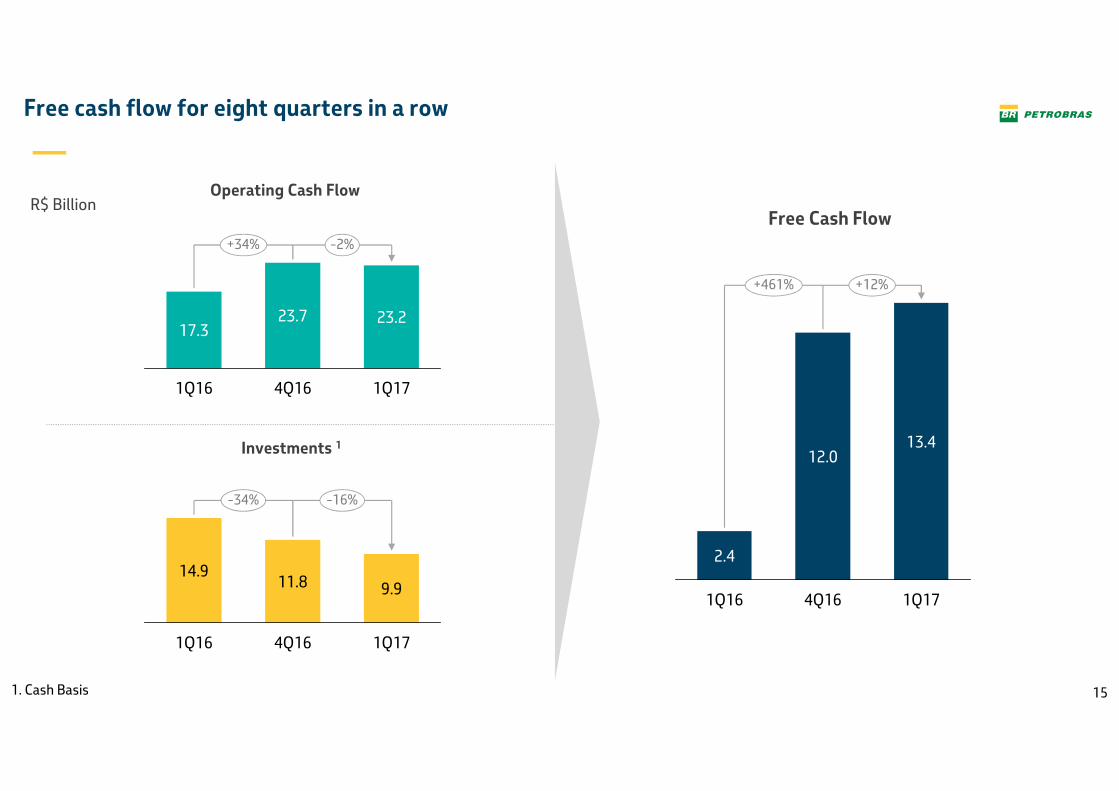
� Free cash flow of R$ 13.37 Billion, positive for 8 quarters in a row and 5.6 times 1Q16 figures.
Acceleration of deleverage
process
� 5% decrease in gross debt in reais and 3% in US dollars compared to 12/31/16
� Increase of average debt duration to 7.61 years from 7.46 years on 4Q16 due to liability management
� Reduction in Net Debt/adjusted EBITDA to 3.24 from 3.54 and in leverage to 54% from 55%
Safety � 26% decrease of TRI (Total Recordable Injury Frequency Rate) relative to 1Q16, reaching 1.24
4
1Q17 Highlights
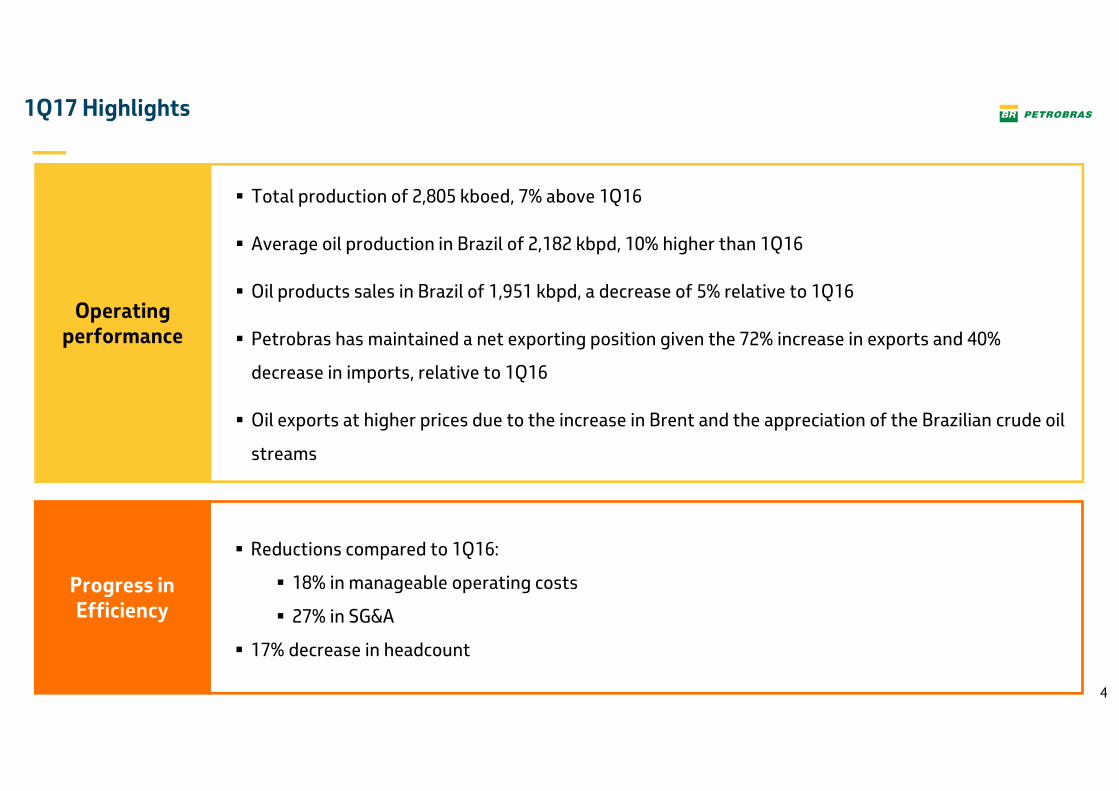
Progress in Efficiency
� Reductions compared to 1Q16:
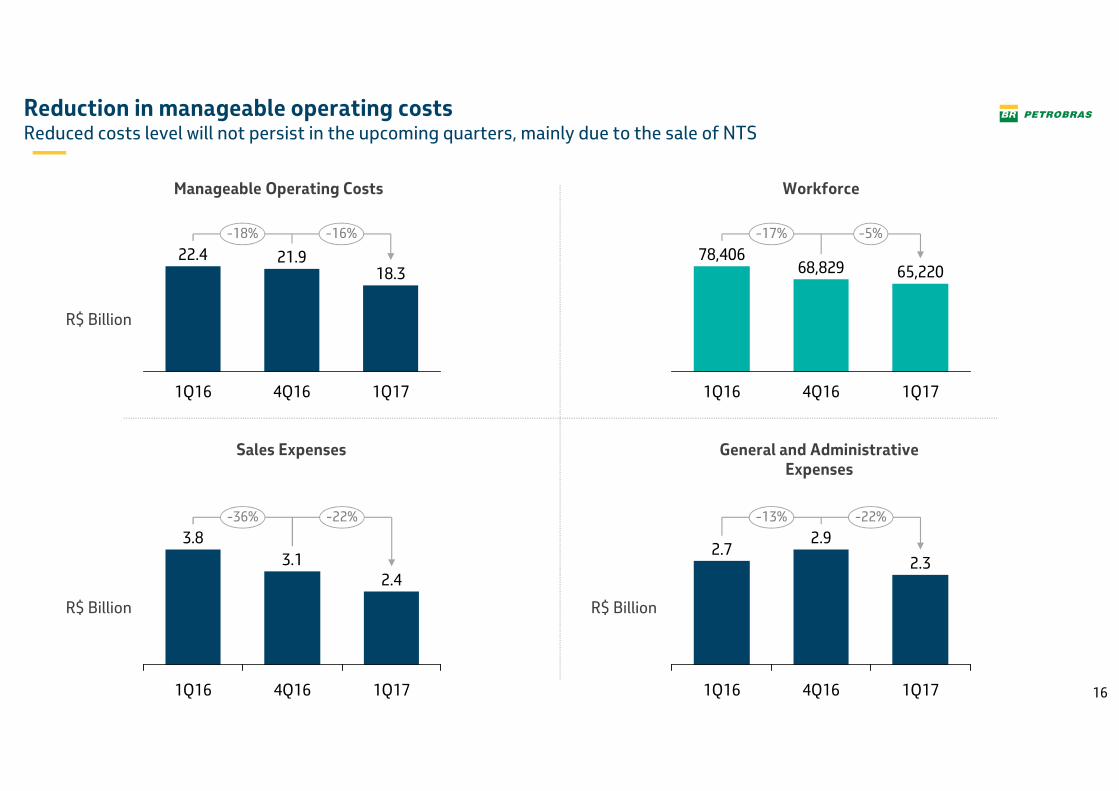
� 18% in manageable operating costs
� 27% in SG&A
� 17% decrease in headcount
Operating performance
� Total production of 2,805 kboed, 7% above 1Q16
� Average oil production in Brazil of 2,182 kbpd, 10% higher than 1Q16
� Oil products sales in Brazil of 1,951 kbpd, a decrease of 5% relative to 1Q16
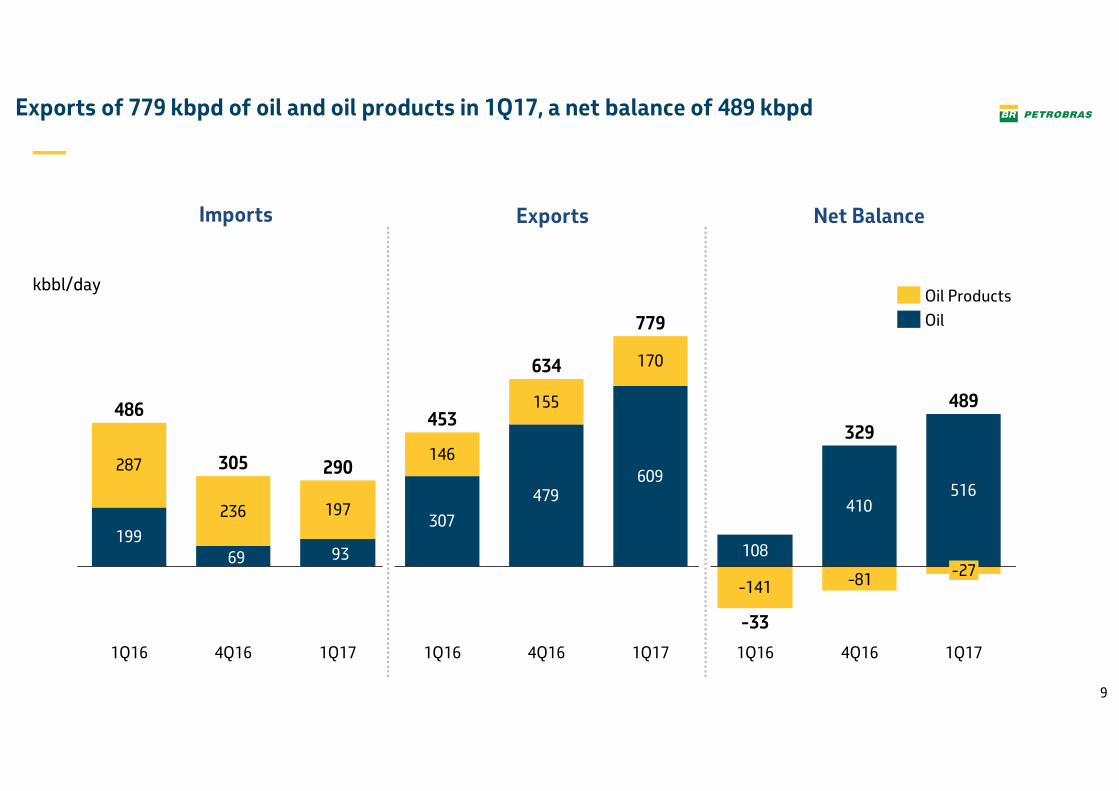
� Petrobras has maintained a net exporting position given the 72% increase in exports and 40%
decrease in imports, relative to 1Q16
� Oil exports at higher prices due to the increase in Brent and the appreciation of the Brazilian crude oil
streams

Clique para editar o texto mestre
Clique para editar o título mestreClique para editar o texto mestre
OPERATIONAL HIGHLIGHTS—
6
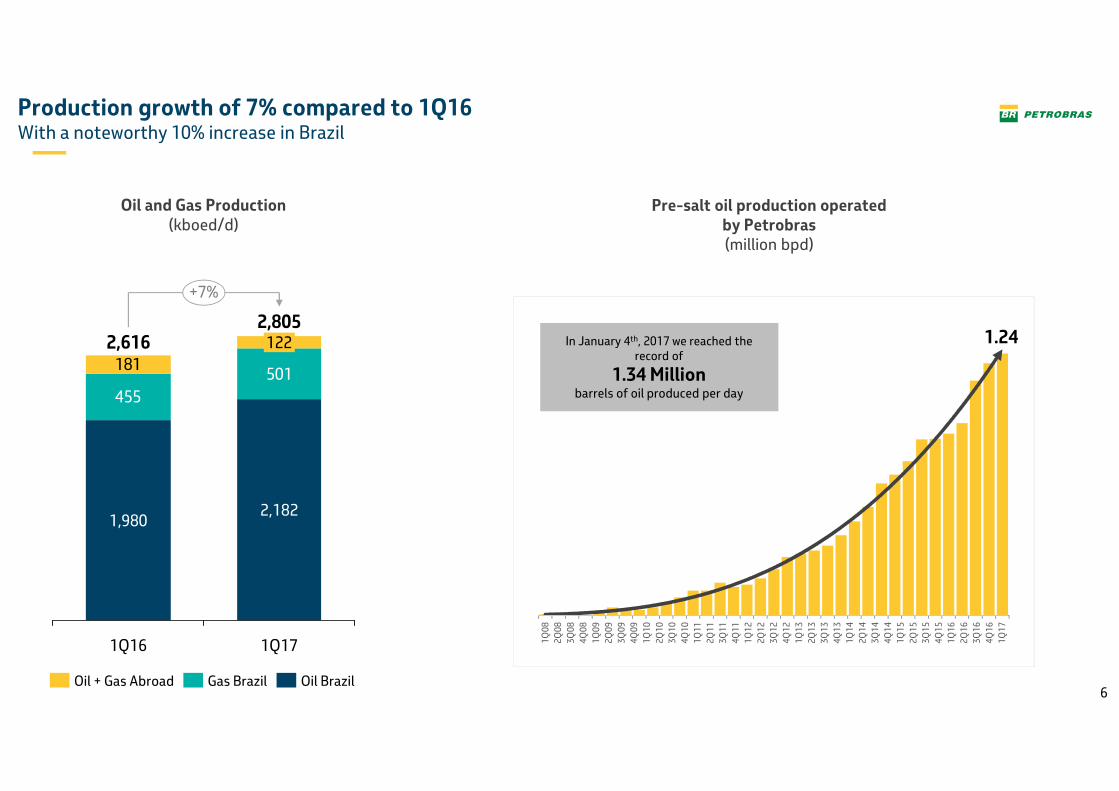
Production growth of 7% compared to 1Q16With a noteworthy 10% increase in Brazil
455
501181
+7%
1Q17
2,805
2,182
122
1Q16
2,616
1,980
Oil BrazilGas BrazilOil + Gas Abroad
Pre-salt oil production operated by Petrobras(million bpd)
1.24
3T
08
4T
08
1T
09
2T
09
3T
09
4T
09
1T
10
2T
10
3T
10
4T
10
1T
11
2T
11
3T
11
4T
11
1T
12
2T
12
3T
12
4T
12
1T
13
2T
13
3T
13
4T
13
1T
14
2T
14
3T
14
4T
14
1T
15
2T
15
3T
15
4T
15
1T
16
2T
16
3T
16
4T
16
1T
17
In January 4th, 2017 we reached the record of
1.34 Millionbarrels of oil produced per day
Oil and Gas Production(kboed/d)
1Q
08
2Q
08
3Q
08
4Q
08
1Q
09
2Q
09
3Q
09
4Q
09
1Q
10
2Q
10
3Q
10
4Q
10
1Q
11
2Q
11
3Q
11
4Q
11
1Q
12
2Q
12
3Q
12
4Q
12
1Q
13
2Q
13
3Q
13
4Q
13
1Q
14
2Q
14
3Q
14
4Q
14
1Q
15
2Q
15
3Q
15
4Q
15
1Q
16
2Q
16
3Q
16
4Q
16
1Q
17
7
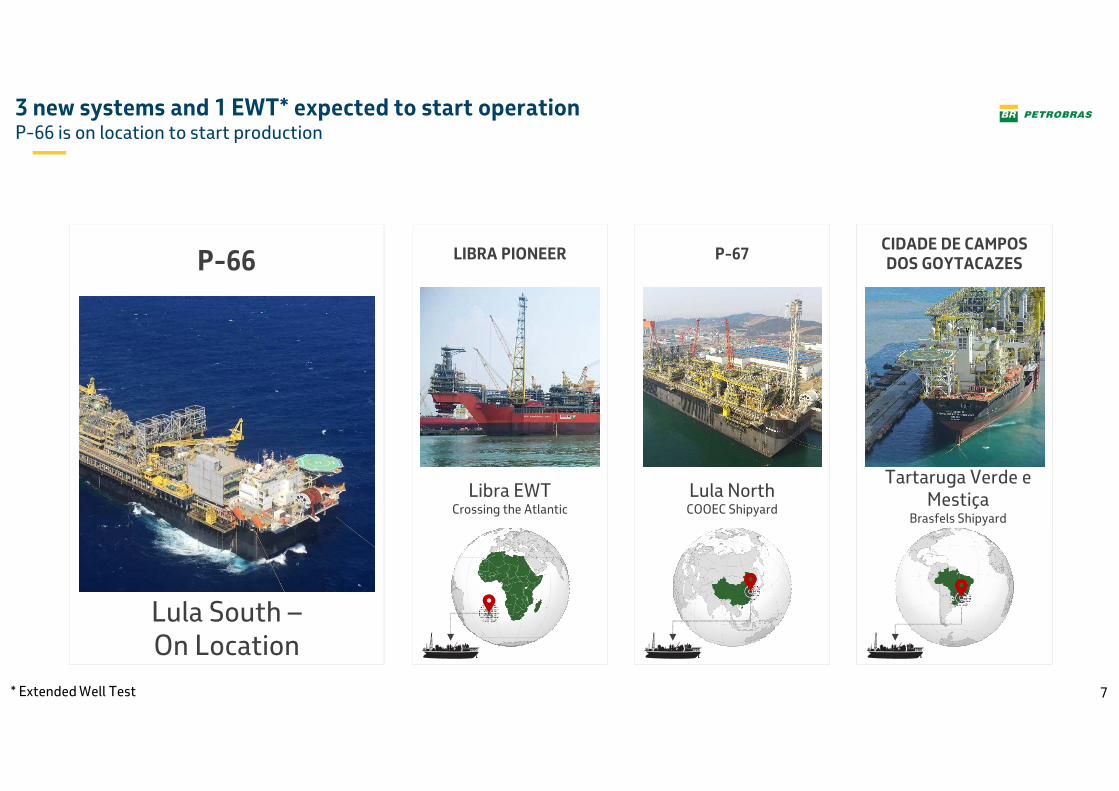
3 new systems and 1 EWT* expected to start operationP-66 is on location to start production
Lula South –On Location
P-66 LIBRA PIONEER
Libra EWTCrossing the Atlantic
P-67CIDADE DE CAMPOS DOS GOYTACAZES
Tartaruga Verde e Mestiça
Brasfels Shipyard
Lula NorthCOOEC Shipyard
* Extended Well Test
8
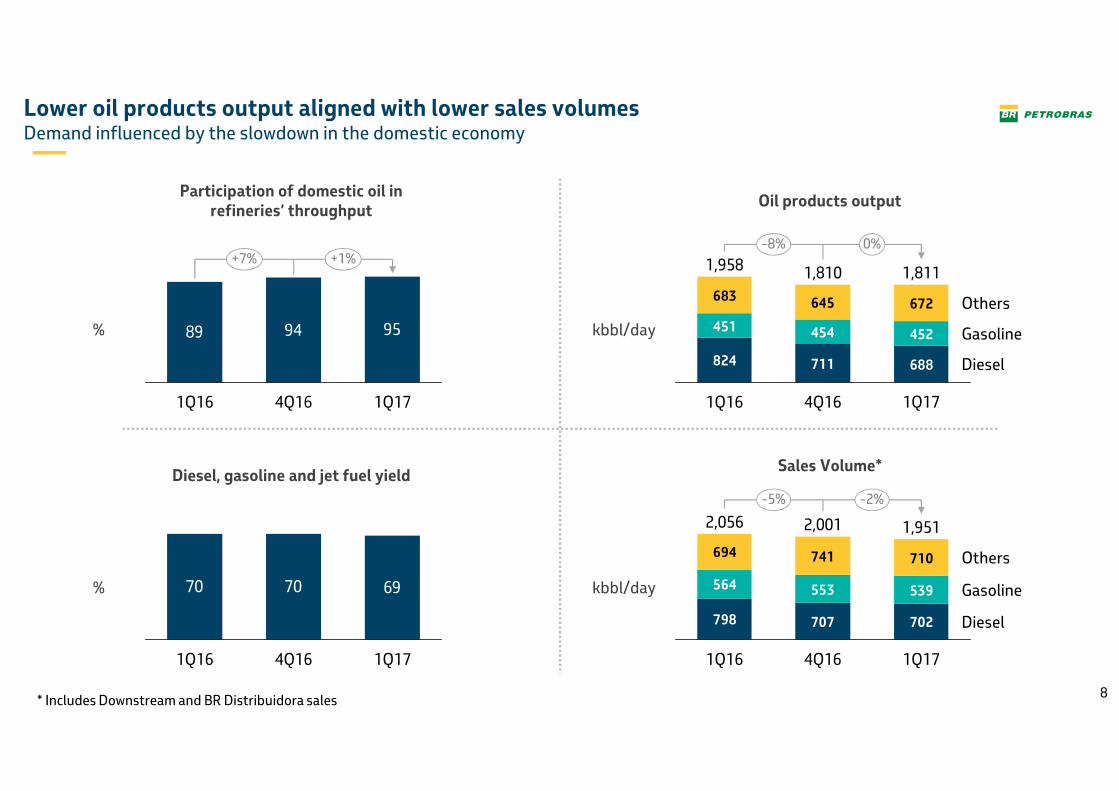
Lower oil products output aligned with lower sales volumesDemand influenced by the slowdown in the domestic economy
Oil products output
Sales Volume*Diesel, gasoline and jet fuel yield
Participation of domestic oil in refineries’ throughput
70 70 69
1Q174Q161Q16
798 707 702
564 553 539
694 741 710
1Q17
1,951
4Q16
2,001
1Q16
2,056
-5% -2%
Diesel
Gasoline
Others
89 94 95
4Q161Q16
+7% +1%
1Q17
%
* Includes Downstream and BR Distribuidora sales
% kbbl/day
824 711 688
451 454 452
683 645 672
0%
Diesel
Gasoline
Others
1Q17
1,811
-8%
4Q16
1,810
1Q16
1,958
kbbl/day
9
199307
479609
287
236 197
146
155
170
9369-81-141
516410
108
1Q16
453
1Q17
290
489
1Q17
779
4Q16
634
4Q16
305
1Q16
486
-27
4Q16
329
1Q16
-33
1Q17
Oil Products
Oil
Exports of 779 kbpd of oil and oil products in 1Q17, a net balance of 489 kbpd
Imports Exports Net Balance
kbbl/day
10
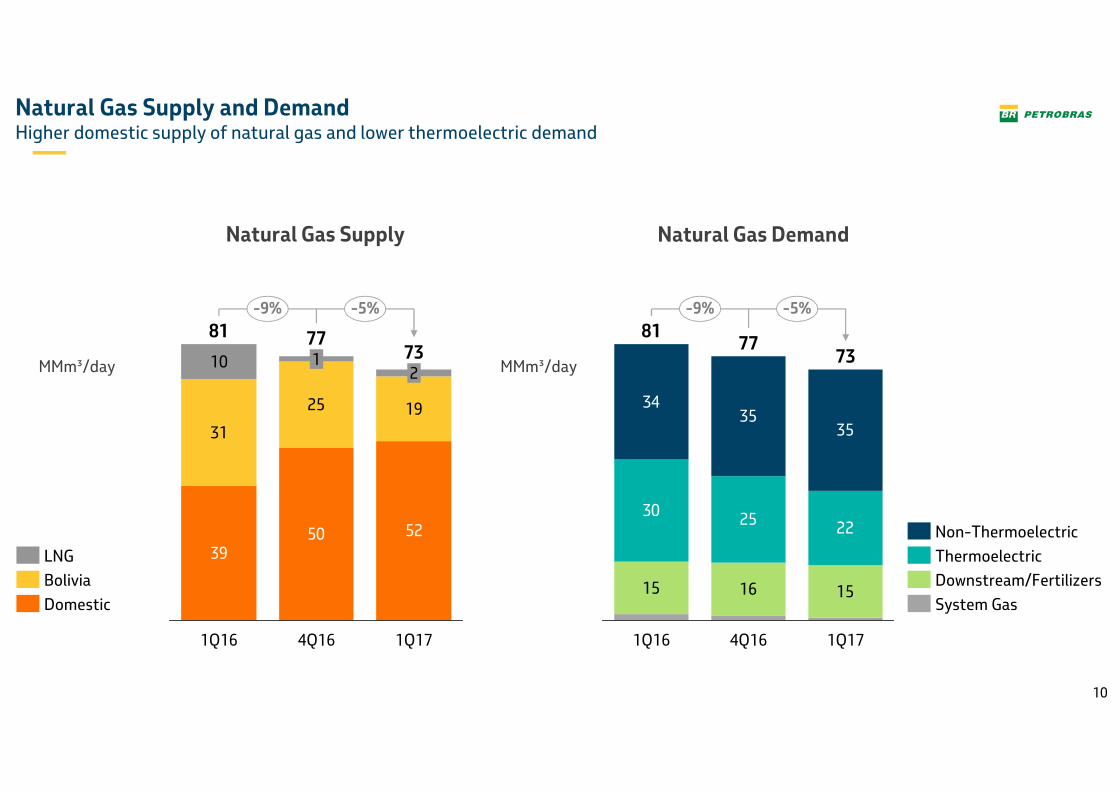
15 16 15
30 25 22
3435
35
77
1Q16
81
-5%-9%
1Q17
73
4Q16
3950 52
31
25 19
10
-5%
1
-9%
1Q17
732
4Q16
77
1Q16
81
System Gas
Non-Thermoelectric
Thermoelectric
Downstream/Fertilizers
Domestic
LNG
Bolivia
Natural Gas Supply and DemandHigher domestic supply of natural gas and lower thermoelectric demand
Natural Gas Supply Natural Gas Demand
MMm³/day MMm³/day
11
RESULTS—
12
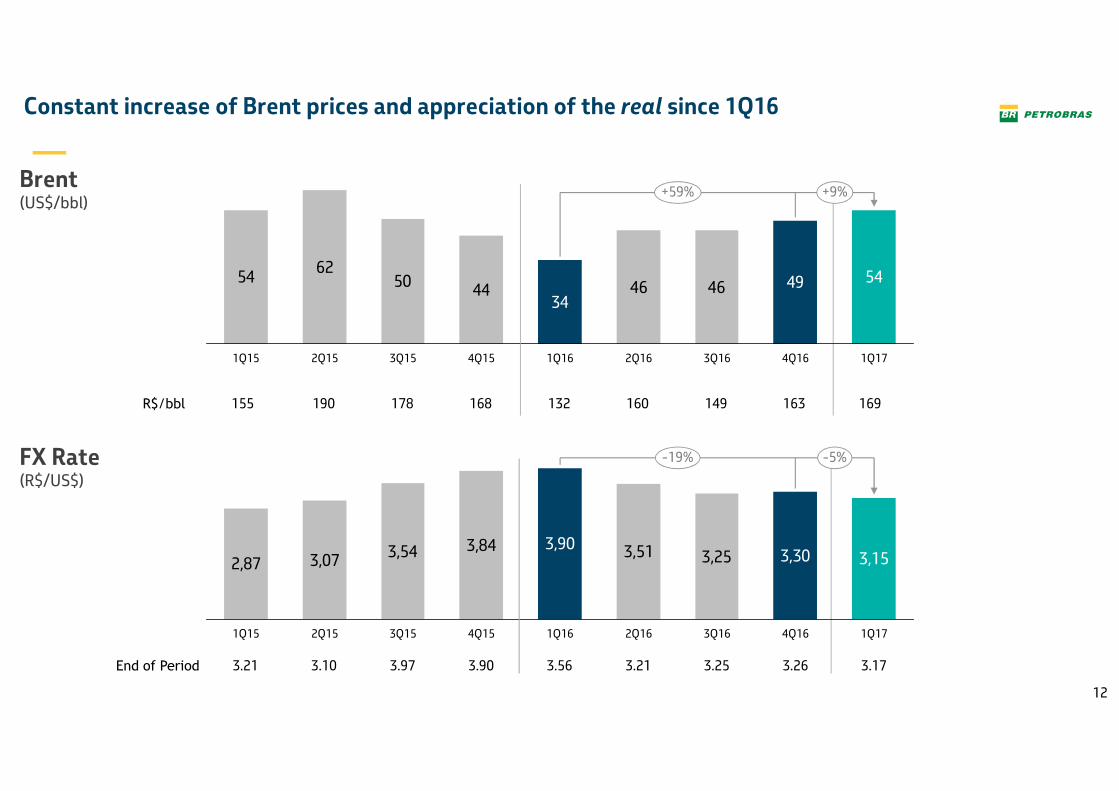
Constant increase of Brent prices and appreciation of the real since 1Q16
6250 44 46 46
544934
54
+59% +9%
1Q174Q163Q162Q161Q164Q153Q152Q151Q15
Brent(US$/bbl)
3,07 3,54 3,84 3,51 3,25 3,153,303,90
2,87
2Q151Q15 3Q15 4Q15 1Q16 2Q16 3Q16 4Q16 1Q17
-19% -5%FX Rate (R$/US$)
155 190 178 168 132 160 149 163 169R$/bbl
3.21 3.10 3.97 3.90 3.56 3.21 3.25 3.26 3.17End of Period
13
Improvement in results throughout the last quarters
Operating Income
Net IncomeNet Financial Results
Gross Income
-7.8
4Q16 1Q17
-5.3-8.7
1Q16
-1.2
2.5
4Q161Q16
4.4
+77%
1Q17
+21%
1Q17
+75%
4Q16
8.1
1Q16
11.814.3
1Q17
+13%
22.8
1Q16
21.0 23.8
+4%
4Q16
R$ Billion
14
EBITDA growth, with an unprecedented result
+19% +2%
1Q17
25.3
4Q16
24.8
3Q16
22.3
2Q16
20.5
1Q16
21.2
4Q15
18.9
3Q15
16.7
2Q15
20.0
1Q15
21.1
2825
20 2229
323735
30
+7 p.p. +2 p.p.
1Q174Q163Q162Q161Q164Q153Q152Q151Q15
Adjusted EBITDA(R$ Billion)
Adjusted EBITDA Margin(%)
Highestquarterly
EBITDA ever
HighestEBITDA margin
(since 2009)
15
Free cash flow for eight quarters in a row
Operating Cash Flow
Free Cash Flow
Investments 1
1Q16
14.9
-34% -16%
1Q17
9.9
4Q16
11.8
+461% +12%
1Q17
13.4
4Q16
12.0
1Q16
2.4
1Q16
17.3
+34% -2%
1Q17
23.2
4Q16
23.7
1. Cash Basis
R$ Billion
16
Reduction in manageable operating costsReduced costs level will not persist in the upcoming quarters, mainly due to the sale of NTS
Workforce
-22%-36%
1Q17
2.4
4Q16
3.1
1Q16
3.8
Sales Expenses
-5%-17%
1Q17
65,220
4Q16
68,829
1Q16
78,406
Manageable Operating Costs
-16%-18%
1Q17
18.3
4Q16
21.9
1Q16
22.4
General and AdministrativeExpenses
R$ Billion
R$ Billion R$ Billion
-22%-13%
1Q17
2.3
4Q16
2.9
1Q16
2.7
17
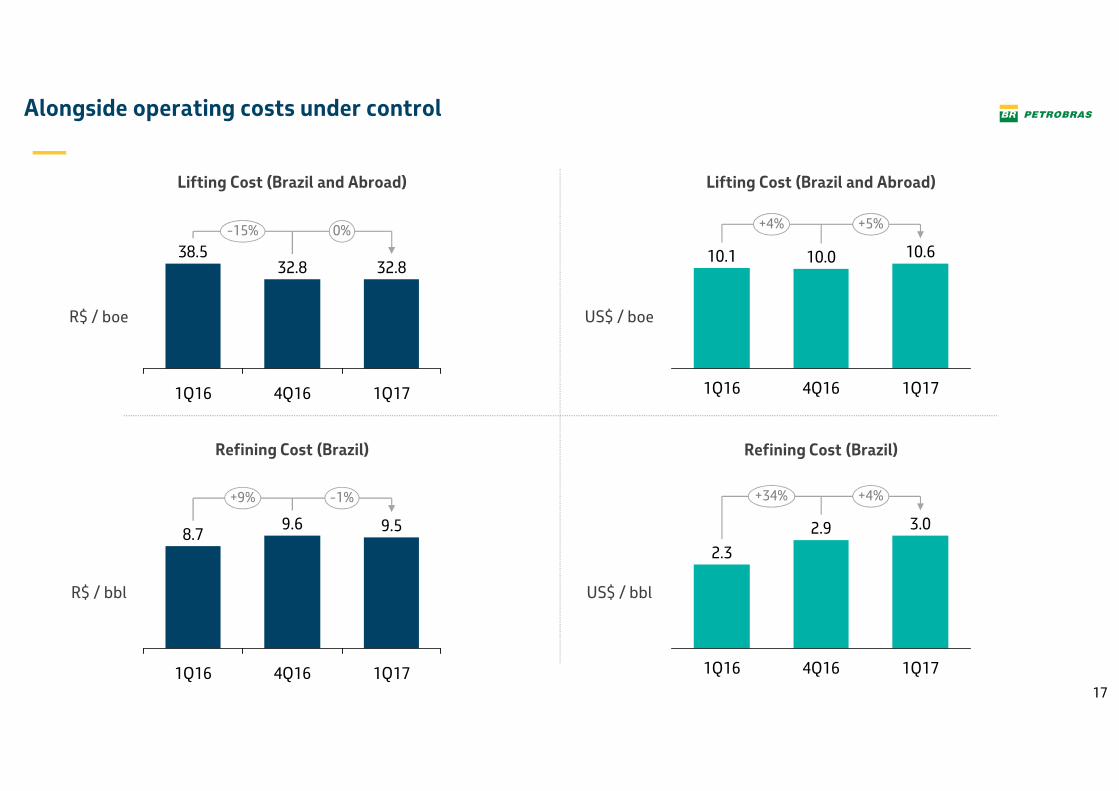
Alongside operating costs under control
Lifting Cost (Brazil and Abroad)
Refining Cost (Brazil) Refining Cost (Brazil)
+5%+4%
1Q17
10.6
4Q16
10.0
1Q16
10.1
4Q16
2.9
1Q16
2.3
+4%+34%
1Q17
3.0
0%-15%
1Q17
32.8
4Q16
32.8
1Q16
38.5
Lifting Cost (Brazil and Abroad)
R$ / boe
R$ / bbl
US$ / boe
US$ / bbl
-1%+9%
1Q17
9.5
4Q16
9.6
1Q16
8.7
18
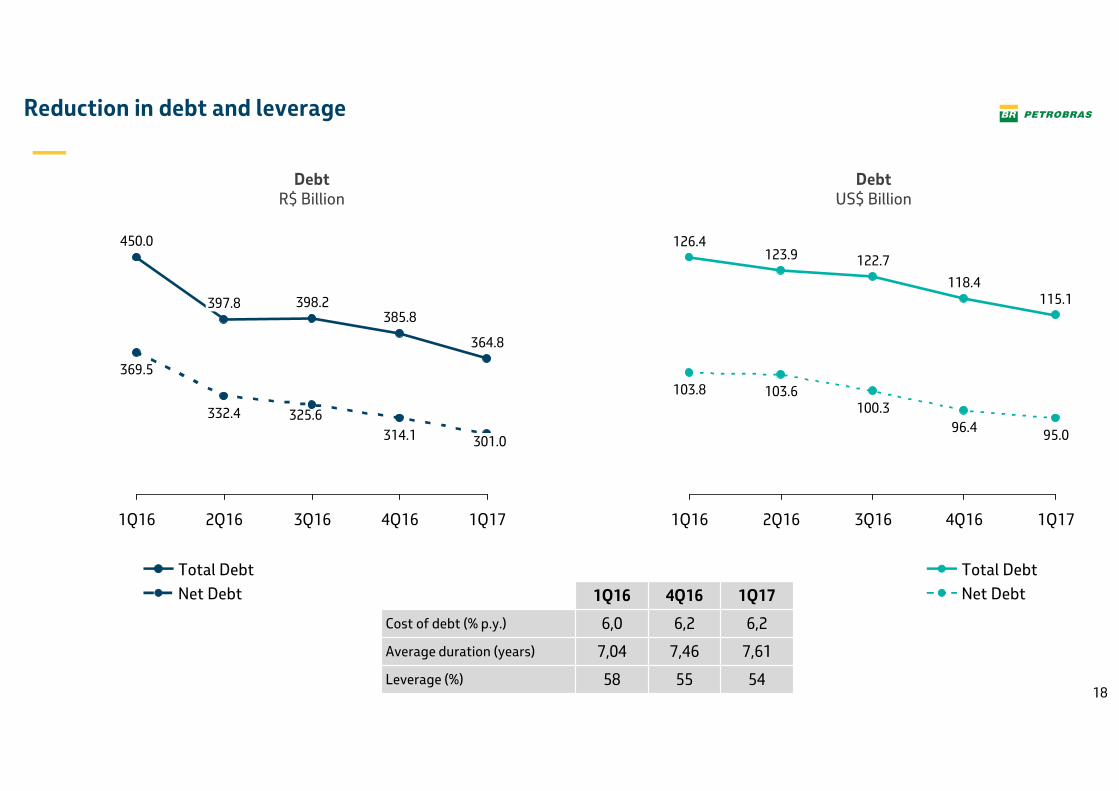
Reduction in debt and leverage
1Q17
301.0
364.8
4Q16
314.1
385.8
3Q16
325.6
398.2
2Q16
332.4
397.8
1Q16
369.5
450.0
1Q16 4Q16 1Q17
Cost of debt (% p.y.) 6,0 6,2 6,2
Average duration (years) 7,04 7,46 7,61
Leverage (%) 58 55 54
1Q17
95.0
115.1
4Q16
96.4
118.4
3Q16
100.3
122.7
2Q16
103.6
123.9
1Q16
103.8
126.4
Net Debt
Total Debt
Net Debt
Total Debt
DebtR$ Billion
DebtUS$ Billion
19
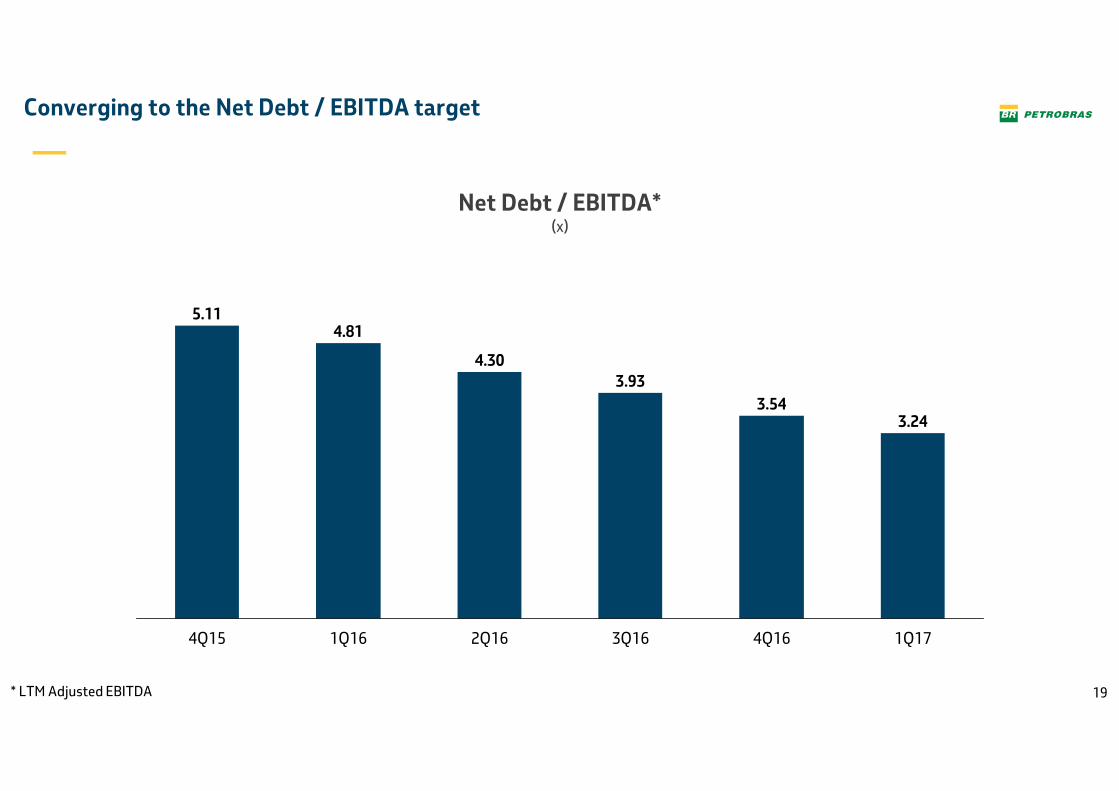
Converging to the Net Debt / EBITDA target
Net Debt / EBITDA*(x)
1Q17
3.24
4Q16
3.54
3Q16
3.93
2Q16
4.30
1Q16
4.81
4Q15
5.11
* LTM Adjusted EBITDA
20
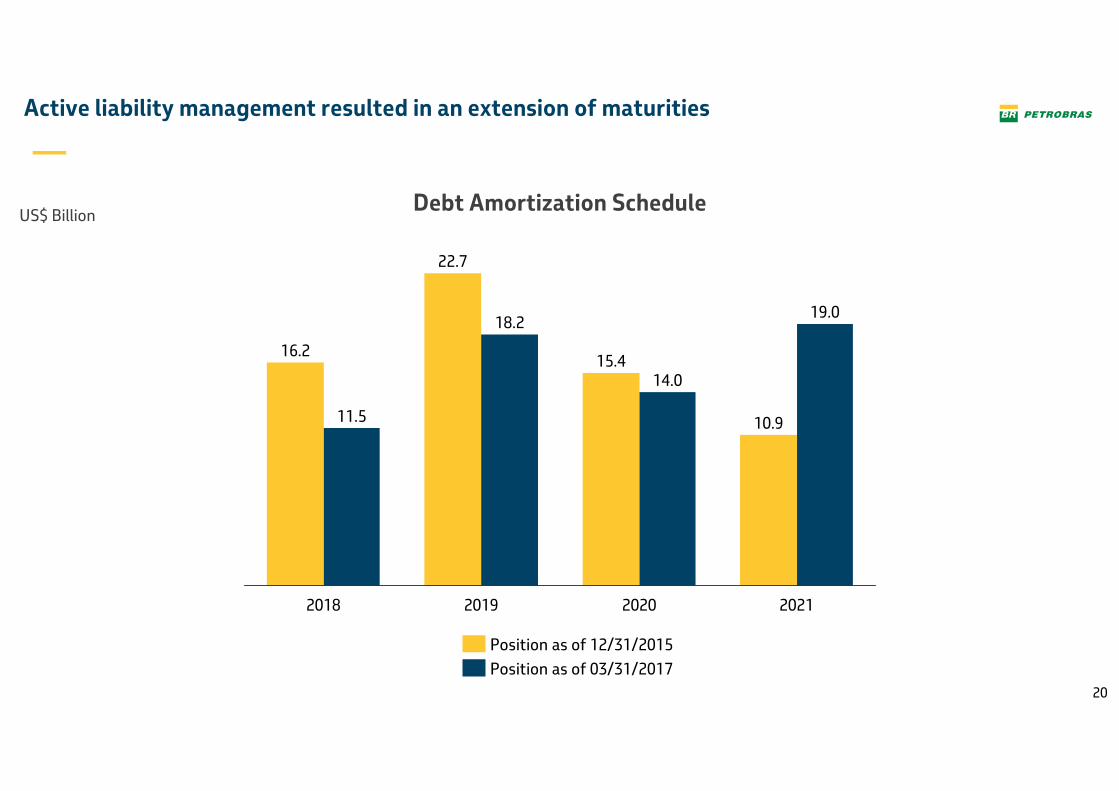
Active liability management resulted in an extension of maturities
US$ BillionDebt Amortization Schedule
10.9
19.0
2020
14.015.4
2019
18.2
22.7
2018
11.5
16.2
2021
Position as of 12/31/2015
Position as of 03/31/2017
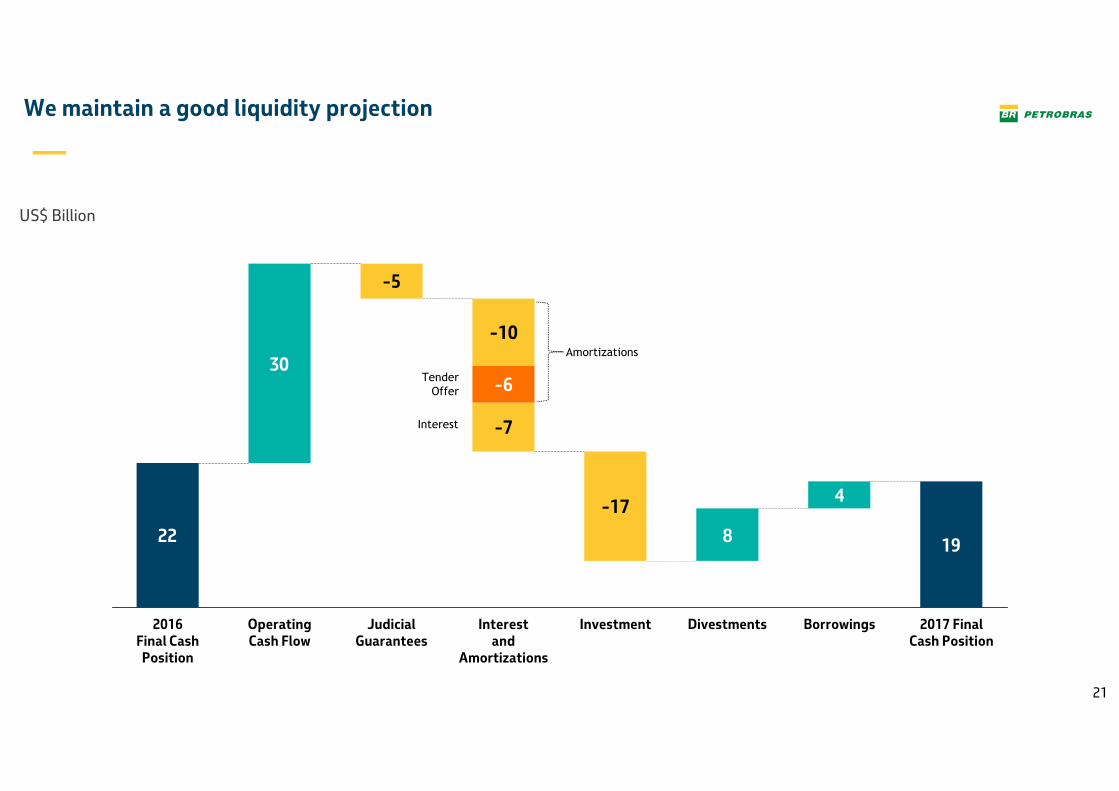
21
We maintain a good liquidity projection
US$ Billion
22
30
8
4
19
-17
Borrowings
-7
-6
Interestand
Amortizations
Divestments2016Final Cash Position
Operating Cash Flow
Judicial Guarantees
Investment 2017 Final Cash Position
-10
-5
Interest
Tender
Offer
Amortizations