clinico-biologic features of 5202 acute lymphoblastic ... features of 5202 acute lymphoblastic...
TRANSCRIPT

Clinico-biologic features of 5202 acute lymphoblastic leukemiapatients enrolled in the Italian AIEOP and GIMEMA Protocols andstratified in age-cohorts
by Sabina Chiaretti, Antonella Vitale, Giovanni Cazzaniga, Sonia Maria Orlando,Daniela Silvestri, Paola Fazi, Maria Grazia Valsecchi, Loredana Elia, Anna Maria Testi, Francesca Mancini, Valentino Conter, Geertruy te Kronnie,Felicetto Ferrara, Francesco Di Raimondo, Alessandra Tedeschi, Giuseppe Fioritoni,Francesco Fabbiano, Giovanna Meloni, Giorgina Specchia, Giovanni Pizzolo, Franco Mandelli, Anna Guarini, Giuseppe Basso, Andrea Biondi, and Robin Foa'
Haematologica 2013 [Epub ahead of print]
Citation: Chiaretti S, Vitale A, Cazzaniga G, Orlando SM, Silvestri D, Fazi P, Valsecchi MG, Elia L, Testi AM, Mancini F, Conter V, Te Kronnie G, Ferrara F, Di Raimondo F, Tedeschi A, Fioritoni G, Fabbiano F, Meloni G, Specchia G, Pizzolo G,Mandelli F, Guarini A, Basso G, Biondi A, and Foa' R. Clinico-biologic features of 5202acute lymphoblastic leukemia patients enrolled in the Italian AIEOP and GIMEMAProtocols and stratified in age-cohorts. Haematologica. 2013; 98:xxx doi:10.3324/haematol.2012.080432
Publisher's Disclaimer. E-publishing ahead of print is increasingly important for the rapid dissemination of science.Haematologica is, therefore, E-publishing PDF files of an early version of manuscripts thathave completed a regular peer review and have been accepted for publication. E-publishingof this PDF file has been approved by the authors. After having E-published Ahead of Print,manuscripts will then undergo technical and English editing, typesetting, proof correction andbe presented for the authors' final approval; the final version of the manuscript will thenappear in print on a regular issue of the journal. All legal disclaimers that apply to the journal also pertain to this production process.
Haematologica (pISSN: 0390-6078, eISSN: 1592-8721, NLM ID: 0417435, www.haemato-logica.org) publishes peer-reviewed papers across all areas of experimental and clinicalhematology. The journal is owned by the Ferrata Storti Foundation, a non-profit organiza-tion, and serves the scientific community with strict adherence to the principles of openaccess publishing (www.doaj.org). In addition, the journal makes every paper publishedimmediately available in PubMed Central (PMC), the US National Institutes of Health (NIH)free digital archive of biomedical and life sciences journal literature.
Official Organ of the European Hematology AssociationPublished by the Ferrata Storti Foundation, Pavia, Italy
www.haematologica.org
Early Release Paper
Support Haematologica and Open Access Publishing by becoming a member of the European Hematology Association (EHA)and enjoying the benefits of this membership, which include free participation in the online CME program
Copyright 2013 Ferrata Storti Foundation.Published Ahead of Print on May 28, 2013, as doi:10.3324/haematol.2012.080432.

1
Clinico-biologic features of 5202 acute lymphoblastic leukemia patients enrolled in the Italian
AIEOP and GIMEMA Protocols and stratified in age-cohorts
Short title for the running head: ALL features in different age cohorts
Sabina Chiaretti1, Antonella Vitale1, Gianni Cazzaniga2, Sonia Maria Orlando3, Daniela Silvestri4,
Paola Fazi3, Maria Grazia Valsecchi4, Loredana Elia1, Anna Maria Testi1, Francesca Mancini1,
Valentino Conter5, Geertruy te Kronnie6, Felicetto Ferrara7, Francesco Di Raimondo8,
Alessandra Tedeschi9, Giuseppe Fioritoni10, Francesco Fabbiano11, Giovanna Meloni1,
Giorgina Specchia12, Giovanni Pizzolo13, Franco Mandelli14, Anna Guarini1, Giuseppe Basso6,
Andrea Biondi2,4, and Robin Foà1
1Division of Hematology, Department of Cellular Biotechnologies and Hematology, “Sapienza”
University of Rome, Italy; 2Tettamanti Research Center, Pediatric Clinic, University of Milano-
Bicocca, Milan, Italy; 3GIMEMA Data center, GIMEMA Foundation, Rome, Italy; 4Medical
Statistics Unit, Department of Clinical Medicine and Prevention, University of Milano-Bicocca,
Milan, Italy; 5Department of Pediatrics, Ospedali Riuniti di Bergamo, Bergamo, Italy; 6Pediatric
Onco-hematology Clinic, University of Padua, Azienda Ospedaleria Universitaria, Padova, Italy; 7Division of Haematology and Stem Cell Transplantation Unit, Cardarelli Hospital, Naples, Italy; 8Department of Clinical and Molecular Bio-Medicine, Section of Hematology, Oncology and
Clinical Pathology, University of Catania, Italy; 9Department of Transfusion Medicine and
Division of Hematology, Niguarda Ca’ Granda Hospital, Milan, Italy; 10Department of
Hematology, Civic Hospital, Pescara, Italy; 11Institute of Hematology, Ospedali Riuniti Villa Sofia-
Cervello Hospital, Palermo, Italy; 12Hematology Section, Department of Pathological Anatomy,
University of Bari, Italy; 13Department of Medicine, Haematology Section, University Hospital of
Verona, Italy; 14GIMEMA, GIMEMA Foundation, Rome, Italy
Correspondence
Robin Foà, Division of Hematology, “Sapienza” University of Rome, Phone: +39-06-85795753;
Fax: +39-06-85795792. E-mail: [email protected]/[email protected]

2
Funding
This work was supported by Associazione Italiana per la Ricerca sul Cancro (AIRC) Special
Program Molecular Clinical Oncology, 5 x 1000, Milan, Italy; Ministero dell’Università e Ricerca
(MIUR), Fondo per gli Investimenti della Ricerca di Base (FIRB), Rome, Italy; Associazione
Italiana per la Ricerca sulla leucemia (AIL), Italy; Compagnia di San Paolo, Turin, Italy; Progetto
“Oncologia”, Ministero della Salute, Rome, Italy; Fondazione Cariplo, Milano, Italy, ENCCA
(European network of Cancer in Children and Adolescents).

3
ABSTRACT
Acute lymphoblastic leukemia shows marked differences in outcome between children and adults.
Since there is limited information on the distribution of clinico-biologic variables in different age
cohorts, we analyzed 5202 acute lymphoblastic leukemia patients enrolled in the Italian multicenter
AIEOP and GIMEMA protocols and stratified them in 9 age cohorts. The highest prevalence of
acute lymphoblastic leukemia was observed in children, although a second peak was recorded from
the 4th decade onwards. Interestingly, the lowest incidence was found in females between 14-40
years. Immunophenotypic characterization showed a B-lineage in 85.8% of patients: a pro-B stage,
associated to MLL/AF4 positivity, was more frequent in patients between 10-50 years. A T-lineage
(14.2%) was rare among small children and increased in 10-40 years patients. The BCR/ABL1
rearrangement increased progressively with age, starting from the 10-14 cohort and impacting for
52.7% of cases in the 6th decade. Similarly, the MLL/AF4 rearrangement constantly increased up to
the 5th decade, while the ETV6/RUNX1 rearrangement disappeared from the age of 30 onwards.
This study shows that adolescents and young adults are characterized by a male prevalence, greater
T-lineage acute lymphoblastic leuekmia percentage, an increase of poor prognostic molecular
markers with aging compared to children, and conclusively quantifies the progressive increase with
age of BCR/ABL+ patients, potentially manageable by targeted therapies.

4
INTRODUCTION
Acute lymphoblastic leukemia (ALL) is the most frequent neoplasm in children, whereas is
relatively rare in adults. Over the last decades, there has been a considerable improvement in the
outcome of children, with complete remission (CR) and long-term survival rates reaching 95% and
80% (1, 2), respectively. Contrariwise, in adults the survival rates generally do not exceed 40% (1,
4-6).
Several factors can explain this marked difference, including the more intensive regimens used in
children, comprising high dose methotrexate, asparaginase and reinduction therapy, less toxic
effects, a greater compliance to high doses of chemotherapy, and an increased “physician and parent
compliance” of pediatric oncologist/hematologists wards (7,8). As a proof of principle, several
studies (9-15) showed a superior outcome for adolescents and young adults (AYA) treated with
pediatric-like regimens. In adults, the most important risk factors rely on age and white blood cell
count (WBC), a pro-B ALL and poor prognosis molecular markers (6).
Some biologic characteristics are partly responsible for the different clinical scenario, like the
increased incidence of the BCR/ABL1 (16, 17) and MLL/AF4 transcripts, negatively impacting on
prognosis, and a decreased incidence of ETV6/RUNX1 rearrangement, associated with a favorable
outcome, in older patients (18). Only few studies have focused on a detailed analysis of the clinico-
biologic features among various age cohorts and usually took into account only few age groups in
heterogeneous populations.
In this study, we retrospectively evaluated the clinical-biological features of 5202 ALL patients,
enrolled in the Italian multicenter protocols AIEOP (Associazione Italiana di Ematologia ed
Oncologia Pediatrica) and GIMEMA (Gruppo Italiano Malattie EMatologiche dell’Adulto)
protocols for the treatment of pediatric and adult ALL. All patients were uniformly characterized at
presentation. Although comparison of outcome in the various age cohorts considered was not a
purpose of this study, event-free survival (EFS) was not different from that previously reported (2-
5): it decreased proportionally with aging and was below 50% in patients > 18 years, who, at the
time of data collection, were treated with non-intensive regimens (Supplementary Figure 1).
5
METHODS
Patients’ enrollment
Between April 1995 and June 2009, 5202 patients were included in the Italian pediatric (AIEOP)
and adult (GIMEMA) multicenter protocols, and evaluated for clinico-biologic features at
presentation. Of 3753 children, 1711 were enrolled in the ALL 95 and 2042 in the ALL 2000
AIEOP trials - designed for children with an age between 1-18 years; of 1449 adults, 457 were
enrolled in the GIMEMA LAL 0496 (age 14-60 years), 565 in the GIMEMA LAL 2000 (age 14-60
years), 385 in the GIMEMA LAL 0904 (age 15-60 years), and 42 in the GIMEMA LAL 1205
protocols; the latter protocol, enrolling patients >18 years harboring the BCR/ABL1 rearrangement,
was included because partly simultaneous to the LAL 0904; these trials were previously approved
by the local ethical committees.
All patients, parents or guardians gave their informed consent to blood/marrow collection and to
biologic analyses, in agreement with the Declaration of Helsinki.
For this study, patients were stratified into 9 age cohorts: 1-5, 5-10, 10-14, 14-18, 18-25, 25-30, 30-
40, 40-50, 50-60 years. Infants were excluded from the analysis.
Clinico-biologic features
Clinical parameters included gender, WBC count, platetet (Plt) count and hemoglobin (Hgb) levels,
mediastinal, spleen and liver enlargement, and central nervous system (CNS) involvement.
For WBC, Plt counts and Hgb levels, the following cut-points were considered: 50 x 109/L, 100 x
109/L and 10 g/dL, respectively.
Mediastinum, spleen and liver were considered enlarged if > 3 cm. CNS involvement was defined
as described (19).
ALL diagnosis was performed on May-Grumwald-Giemsa smears and immunophenotype: the latter
allowed defining the lineage derivation and degree of differentiation of the leukemic cells. The cut-
off for positivity was ≥ 20% for surface and 10% for intracytoplasmatic antigens.
B-lineage ALL (B-ALL) cases were subdivided into B1 (pro-B ALL, CD10-), B2 (common-ALL,
CD10+ and intracytoplasmic (cy) Igµ−) and B3 (pre-B ALL, CD10+ and cyIgµ+), and NC if not
further classified cases (cyIgµ not tested) (20).
T-lineage ALL (T-ALL) cases were subdivided into T1 (pro-T and pre-T ALL, cyCD3+ and
CD7+,CD2+ and/or CD5+ and/or CD8+, respectively); T2 (cortical T-ALL, CD1a+) and T3
(mature T-ALL, surface CD3+ and CD1a-) (20).

6
Molecular analysis of adults (21) included BCR/ABL1, E2A/PBX1, ETV6/RUNX1 and MLL
rearrangements (i.e. MLL/AF4 and MLL/ENL) screening for B-ALL patients, and BCR/ABL1 and
MLL rearrangements for T-ALL cases; SIL/TAL1, NUP298/RAP and NUP214/ABL1 were
investigated only in more recent trials, therefore, since data were not consistently available, were
not considered.
Children were screened for BCR/ABL1, ETV6/RUNX1, MLL/AF4 and partly for E2A/PBX1 (22).
Since karyotyping data were not uniformly available, this parameter was not considered.
Flow-cytometry and molecular analyses were centrally performed in 2 laboratories, one for
pediatric and the other for adult cases.
Statistical analysis
Patients’ characteristics were summarized by cross-tabulations (categorical variables) and quantiles
(ordinal factors). Non-parametric tests, as appropriate, were applied for comparisons between
groups (Pearson's χ2, Mantel-Haenszel χ2or Fisher Exact test for categorical variables, Mann-
Whitney or Kruskal-Wallis test for continuous variables). Analyses were performed using the SAS
v9.2 software; all tests were two-sided, accepting p ≤0.05 as statistically significant.
RESULTS
Incidence of ALL
The ALL distribution among the different age cohorts was evaluated (Figure 1A). The majority of
ALL cases was included within the 1-5 year age cohort (37% of the whole cohort) and
progressively decreased up to the 3rd decade; however, a slight increase in ALL was again recorded
starting from the 4th decade onwards (> 5% in the 30-40, 40-40 and 50-60 age groups).
Immunophenotye
Flow cytometry analysis revealed an overall prevalence of B-ALL in the whole cohort (85.8%),
while T-ALL was much less frequent (14.2%). The distribution of B- and T-ALL was of interest
(Table 1A, Figure 1B). An increase in the incidence of T-ALL was observed from the 10-14 age
cohort up to the 4th decade of life, with a tendency to decline thereafter. Conversely, B-ALLs were
less frequent in the same age framework (p<.0001).
When looking at the differentiation stage of B-ALL, the most significant (p<0.0001) finding was a
constant and significant increase in the percentage of pro-B up to the 5th decade of life: in small

7
children (age cohorts 1-5 and 5-10 years) the incidence of pro-B ALL was 3.27% and 3.88%, in
older children (10-14 years) and adolescents (14-18 years) it was 8.9% and 10.5%, while in adults it
was 17.58%, 13.92%, 17.89% and 18.78% for the 18-25, 25-30, 30-40, 40-50 age cohorts,
respectively (Supplementary Figure 2).
In T-ALL, a peak of pro-T/ pre-T ALL cases was recorded in the 5th and 6th decade, with an
incidence of 68.18% and 58.33% of cases, respectively; consistently, the percentage of cortical T-
ALL was very low in adults and young elderly (Supplementary Figure 3).
Gender distribution
The cohort evaluated included 2889 males and 2313 females, with a M/F ratio of 1.25. Gender
distribution was of interest: in fact, while there was an overall prevalence of the male gender in
almost all age cohorts, this phenomenon was particularly evident between the age of 14 and 40,
started to revert in the 5th decade of life and the females were prevalent over the age of 50 (p<.0001;
Figure 2A). Furthermore, a striking association was found between lineage derivation and gender,
T-ALL being more frequently diagnosed in male subjects: this association was statistically
significant up to the 4th decade of life (Figures 1B, 2A and 2B).
Hematologic parameters and correlation with immunophenotype
A WBC count >50 x 109/L was significantly less frequent in children, being recorded in 18.87%
and 16.34% of patients aged 1-5 and 5-10, while it progressively increased from pre-adolescence
onwards (p<.0001); a Plt count <100 x 109/L was more frequently detected in patients older than the
age of 30 years (p<.0001); finally, Hgb levels <10g/dL were more frequently detected in younger
patients and even more in small children (1-5 years, p<.0001) (Supplementary Figure 4A, Table
1B).
A WBC count >50 x 109/L was more frequently recorded in T-ALL than in B-ALL patients (53.41
% vs 16.56%, p<.0001), regardless of the age cohorts considered. However, in B-ALL a WBC
count >50 x 109/L was relatively rare up to 25 years, while it was more recurrent form 25 years
onwards. At variance, in T-ALL the scenario was almost opposite, with a WBC count >50 x 109/L
detected in > 45% of patients aged <30 years, and tended to decrease thereafter (p<.0001,
Supplementary Figure 4B).
Finally, a significantly higher percentage of cases with Plt count <100 x 109/L and Hgb levels
<10g/dL was observed in B-ALL compared to T-ALL (Plt count 70.12% vs 64.94% and Hgb levels
77.14% vs 42.94%; p=0.0053 and p<.0001, respectively, Supplementary Figure 4C and 4D).

8
Organ involvement
Organ involvement was considered; since reactive adenopathies are a frequent event in healthy
children, this parameter was not taken into account.
Mediastinal, spleen and liver enlargements were prevalently recorded in T-ALL (p<.0001). The first
two were more frequently detected between 10 and 25 years (p<.0001 and p=0.028, respectively;
Table 1B, Supplementary Table 1, Figure 3A and 3B), while liver enlargement decreased with age
(p<.0001; Table 1B, Supplementary Table 1 and Figure 3C).
Finally, CNS involvement was a rare event (2%) and was more frequently detected in T-ALL rather
than in B-ALL (5.95% vs 1.47%, p<0.0001); furthermore, in T-ALL, , it was associated with
hyperleukocytosis (p<0.0001). When patients were stratified according to age, a peak of CNS
positivity incidence was recorded in the groups aged 10-14, 25-30 and 50-60 (3.91%, 5% and
4.91%, respectively). Interestingly, if patients were stratified for both lineage derivation and age, in
T-ALL CNS positivity was a more frequent event in children, particularly in the age groups 5-10,
10-14 and 14-18 (8.67, 10.34 and 5.41%, respectively), and then progressively decreased, whereas
in B-ALL meningosis was more frequent in older patients, particularly in the 25-30 (5.48%) and 50-
60 age groups (5.56%) (Table 1B, Supplementary Table 1 and Figure 3D): notably, in the latter age
group, a significant association was found with the BCR/ABL1 rearrangement (10% of BCR/ ABL1
had a CNS involvement, p=0.028).
Molecular analysis in B-ALL
The overall frequency of molecular aberrations is reported in Table 1C and Figure 4.
ETV6/RUNX1 represented the most frequent alteration in small children (age cohorts 1-5: 26.14%;
5-10: 23.96%), being detected in more than 20% of cases; its incidence progressively decreased in
pre-adolescents, adolescents and young adults (age cohorts 10-14: 7.04%; 14-18: 4.71%; 18-25:
1.49%; 25-30: 1.41%), and disappeared in adults from 30 years onwards (p<.0001).
The E2A/PBX1 aberration was relatively infrequent, being detected in ≤7% of cases in all age-
cohorts. Its detection did not show a specific trend:, it was slightly higher in the 10-14 and 14-18
groups, reaching 7% and 5.7% respectively, but it showed no significant variation (p=0.06).
The MLL/AF4 rearrangement was virtually absent in the 1-5 and 5-10 age groups (0.48% and 0.7%,
respectively), while it progressively increased up to the 5th decade of life, being detected in 2.78%;
2.15%; 3.86%, 6.45%, 7.94% and 11.74% in the 10-14, 14-18, 18-25, 25-30, 30-40, 40-50 age
cohorts, respectively, and decreased again to 5.24% in the 50-60 age cohort (p<.0001).Finally, the

9
BCR/ABL1 rearrangement showed a striking behavior: in fact, it was very rare in small children
(1.68% and 2.79% in the 1-5 and 5-10 age groups, respectively), while it progressively increased
with age (age cohorts 10-14: 5.52%; 14-18: 5.81%; 18-25: 14.41%, 25-30: 26%; 30-40: 37.33%;
40-50: 42.86%) reaching a frequency of 52.74% in patients of the 50-60 age-group (p<.0001).
Correlation between molecular aberrations, WBC count and flow cytometry in B-ALL
To investigate if the presence of specific aberrations might influence the WBC count at
presentation, this parameter was correlated with the presence of the ETV6/RUNX1, E2A/PBX1,
MLL/AF4 and BCR/ABL1 rearrangements in the different age cohorts.
ETV6/RUNX1 was significantly associated to a lower WBC count when the whole cohort was
considered (p=0.0001); the same trend was also observed in the 1-5, 5-10, 10-14 and 14-18 age
groups, although it did not reach statistical significance. For the remaining groups, a statistical
analysis was not feasible due the small/absent number of positive cases (Supplementary Table 2).
The E2A/PBX1 rearrangement did not show any significant association with the WBC count,
neither in the global series nor in the various age cohorts (Supplementary Table 3).
At variance, the MLL/AF4 rearrangement was associated to a higher WBC count in almost all age
groups and in the whole cohort (p<0.0001, Supplementary Table 4).
Finally, the BCR/ABL1 rearrangement displayed a peculiar behavior (Supplementary Table 5): this
aberration was associated with a higher percentage of patients with a WBC >50 x 109/L in the
whole cohort (p<0.0001) and in younger children (1-5 years), adolescents and young adults (10-30)
and older patients (>50). There was no statistical association between BCR/ABL positivity and
WBC >50 x 109/L in the remaining age groups. The overall results are shown in Figure 5A.
Next, a correlation between molecular aberrations and flow cytometry was carried out
(Supplementary Tables 6-9). The ETV6/RUNX1 rearrangement was more frequently identified in
common ALL (Figure 5B): this association reached statistical significance when the whole cohort
was considered (p<.0001) and in the 1-5 age cohort (p=0.025; Supplementary Table 6). Similarly,
the E2A/PBX1 aberration was never detected in pro-B ALL cases, while it was more frequent in
pre-B ALL cases (Figure 5C); nevertheless, this finding was significant only when the whole cohort
was considered (p<0.0001), and in the 1-5, 5-10 and 18-25 age cohorts (p=0.013, 0.018 and 0.012,
respectively), probably because of the small number of positive cases in the other subgroups
(Supplementary Table 7).
Contrariwise, the MLL/AF4 rearrangement was detected almost exclusively in pro-B ALL cases
(Figure 5D).with a highly significant in every age cohort (Supplementary Table 8).

10
Finally, the BCR/ABL1 fusion product was rarely detected in pro-B ALL cases (Figure 5E): the
association between a non-pro-B stage and the presence of BCR/ABL transcript was statistically
significant when the whole cohort was considered (p=0.0017) and starting from the 4th decade of
life onwards, (p<0.0001, Supplementary Table 9).
DISCUSSION
ALL is a clinically and biologically heterogeneous disease affecting both children and adults with a
distinct incidence. According to the US-SEER (National Cancer Institue, Surveillance,
Epidemiology and End Results Program) (23), approximately 60.3% of ALL cases are diagnosed
under the age of 20; 10.3% between 20 and 34, 5.9% between 35 and 44, 6.7% between 45 and 54,
6.1% between 55 and 64, 5.0% between 65 and 74, 4.0% between 75 and 84 and 1.7% 85+ years of
age.
Since the clinical scenario differs profoundly among age groups, mostly in terms of outcome (1-6),
in this study we considered a data set that comprised a series of children and adults ALL to evaluate
the clinical, hematologic and biologic features at diagnosis among different age groups, subdivided
in 9 age cohorts, i.e. 1-5, 5-10, 10-14, 14-18, 18-25, 25-30, 30-40, 40-50,50-60 years.
Few previous studies have looked at these features in a prospective and uniform manner. In
pediatric cohorts it was shown that a hyperdyploid karyotype and the ETV6/RUNX1 aberration
decrease with age, whereas the presence of BCR/ABL1, as well as the increased incidence of T-
lineage ALL are more frequent in older children and young adults (7, 24, 25). A study on a
relatively small cohort of adult patients (36) reported that older patients (>60 years) have a
decreased male/female ratio, a decreased incidence of mediastinal involvement, adenopathy,
splenomegaly, a reduced median WBC count, as well as a lower percentage of T-lineage ALL in the
elderly.
The current study included 5202 patients (3753 children and 1449 adults) enrolled between 1995
and 2009 respectively in two and four consecutive multicenter Italian protocols for children
(AIEOP) and adults (GIMEMA). All cases were prospectively and uniformly characterized at the
time of diagnosis.
The highest peak of incidence was detected, as expected, in small children between 1 and 5 years;
the occurrence of the disease increased again from the 4th decade, reaching a steady percentage of
about 5.5%, as reported (26) and similar to the US-SEER data; in fact, in our cohort, the overall
percentage of ALL cases is 74% in patients aged < 18 years, 8.5% in cases between 18 and 30, and

11
6.2%, 5.5% and 5.3% in patients aged 30-40, 40-50 and 50-60 years, respectively. Patients ≥ 60
years were, at that time, eligible for only one protocol enrolling exclusively BCR/ABL1+ patients;
we thus cannot determine ALL incidence in these individuals, although it is likely that the
frequency of ALL further increases in the over sixties.
Gender distribution was remarkable: starting from the 10-14 age cohort there was a striking
decrease of the ALL rate in females; this tendency is evident up to the 4th decade of life, and
disappeared in the 50-60 years age cohort. This phenomenon seems to be associated with lineage
derivation: in fact, the incidence of ALL is higher in male adolescents and young adults with a T-
ALL and only to a lesser extent with a B-ALL. Although these data were partly known (27, 28), the
analysis on this broad cohort strongly suggests that the age related sex hormones levels may play a
“protective factor” in ALL initiation in females and leads to further investigate in a prospectively
the contribution of hormonal changes occurring during menarche and menopause.
Similarly, organ involvement was widely distributed: beyond mediastinal enlargement, frequently
detected in older children and young adults (age 10-25 years) and significantly associated with a T-
lineage phenotype, spleen and liver enlargement, also associated with a T-lineage phenotype, were
less frequent in older patients, in line with earlier reports (27, 29),thus suggesting a physiological
atrophy of lymphoid organ with aging. Also, consistent with published work (19, 30), CNS was a
rare event, more frequently found in adults than children. In children, it was more frequently
detected in T-ALL patients aged 5-18. The reason for the preferential contamination of CNS by
leukemic T cells in children is not clear, but it might be postulated that adhesion and/or metastatic
molecules are more expressed in pediatric leukemic T cells as opposed to adult leukemic T cells.
This hypothesis is corroborated, by the high levels of IL-15, a proinflammatory cytokine that
promotes T-cell proliferation, detected in childhood ALL with CNS involvement (31) Otherwise,
this peculiar behavior might be sustained by more invasive properties of pediatric T-ALL, as also
suggested by the association with a higher WBC count, liver and spleen enlargement observed in
pediatric, but not in adult T-ALL.
Immunophenotypic analysis confirmed the overall higher incidence of B-ALL vs T-ALL, but also
showed that T-ALL is significantly more frequent in patients whose age is comprised between 14
and 40 years, thus confirmingthat this immunophenotypic subset is more represented in adolescents
and young adults. Moreover, hyperleukocytosis (WBC >50 x 109/L) was infrequent in pediatric B-
ALL and tended to progressively increase with age in this group, whereas in T-ALL
hyperleukocytosis was less frequent in patients > 30. Furthermore, it also showed that in B-ALL
there is a progressive increase of pro-B cases up to the 5th decade of life, a finding significantly

12
associated to the presence of the MLL/AF4 rearrangement. Regarding to T-ALL, T1 cases were
instead more frequent detected in the 5th and 6th decades; this finding is of interest, since early T-
ALL cases tend to have a more unfavorable prognosis (32).
Molecular screening showed the complete disappearance of the ETV6/RUNX1 rearrangement and
the progressive increase of the BCR/ABL1 and MLL/AF4 fusion transcripts with age progression.
The ETV6/RUNX1 rearrangement disappearance with aging further supports the notion that this
ALL subset has indeed a prenatal origin, as indicated by neonatal blood spots or Guthrie cards
screening (33). Moreover, it is in agreement with the finding that a “second leukemogenic hit” must
occur during childhood in order to be leukemogenic (34, 35). It could be speculated that, upon
puberty, the pre-leukemic clone harboring the ETV6/RUNX1 rearrangement is physiologically
cleared out by other factors, such as hormonal changes or a normal degeneration of lymphoid
development.
In our analysis the MLL/AF4 rearrangement is virtually absent in the 1-5 age cohort and its
detection becomes more frequent with age, suggesting that the rearrangement detected in these
patients is probably different from that of infant ALL. To validate this hypothesis, the 1-5 age
cohort was further subdivided into single years and we did not detect an increased incidence of the
transcript in the 1-2 years age group (data not shown).
Given this distribution pattern, it is unlikely that the leukemogenic clone originates from in utero
conditions, as opposed to infant MLL-rearranged leukemias (36): it is intriguing to speculate that
infant MLL-rearranged leukemias require the concomitant presence of residual cord blood and/or
maternal cells to occur, whereas in the pediatric and adult MLL-rearranged leukemias these
“nurturing” cells are no more required. In line with this, previous gene expression profiling studies
have shown that infant MLL-rearranged leukemias share a common expression pattern with MLL-
germline infant leukemias (37).
Finally, the constant and progressively increase of the BCR/ABL1 rearrangements in older patients
indicates that the genomic instability associated with aging leads to the appearance of the leukemic
clone and the accumulation of additional oncogenic hits.
Overall, the variable incidence of the aforementioned lesions leads to hypothesize that in children
harboring ETV6/RUNX1 and, to a lesser extent, MLL/AF4 the driver event is prenatal, whereas in
BCR/ABL1+ ALL, more frequently detected in adults, the driver event occurs during life-time and
induces an overt leukemia only when several additional hits occur.
While ETV6/RUNX1+cases were generally characterized by a low WBC count in the whole cohort,
a striking association between WBC >50 x 109/L was found in all MLL/AF4 positive patients, but

13
not in all patients harboring the BCR/ABL1 rearrangement. This latter result, particularly evident in
patients aged 30 and 50 years, did not change if a different cut-off point was used (i.e. 30 x 109/L,
not shown). The fact that BCR/ABL1+ patients have a different clinical presentation is in line with
the well-documented biological heterogeneity of this subset at the transcriptional level (38, 39) and
with the presence of additional molecular lesions, such as IKZF1 deletions (40, 41).
Overall, this study - that represents the largest cohort of ALL cases broadly and uniformly
characterized throughout ages – confirms and extends previous results on the incidence and
distribution of clinico-biological characteristics (7, 16-18, 23-29). Furthermore, it provides at least
three important information. First, it conclusively shows that the AYA subset (14-30 year-old
patients) shows a higher occurrence of hyperleukocytosis, higher frequency of low platelet count
and a prevalence of male sex; biologically, this group is characterized by a greater percentage of T-
ALL, an increase of unfavorable prognosis aberrations, such as BCR/ABL1 and MLL/AF4, and the
virtual absence of ETV6/RUNX. Altogether, these data help to understand the worse outcome of this
age-group and support the use of more intensive regimens (9-15).
Second, it shows that the incidence of molecular aberrations varies with age progression.
Nevertheless, the clinical characteristics associated, i.e. lineage derivation, differentiation stage and
WBC counts do not change among the different age-cohorts, indicating that the most important
factor for leukemia initiation is represented by the biological mechanism/s responsible for the
emergence of the molecular lesion/s. Finally, it shows that MLL/AF4 and BCR/ABL1
rearrangements constantly increase with age. This is particularly relevant for the BCR/ABL1 fusion,
detected in 52.7% of the 50-60 year-old subgroup. Given the profound changes in the management
of Ph+ ALL following the advent of tyrosine kinase inhibitors (TKI) (42-45), also less fit patients
can nowadays be successfully treated. Indeed, the possibility of effectively treating patients with
TKI plus steroids without systemic chemotherapy (42, 45) makes this a most viable option for
elderly ALL patients, in whom the BCR/ABL1 rearrangement is frequently detected.
In conclusion, this large retrospective study on adult and pediatric ALL uniformly characterized at
presentation has allowed to better define the clinico-biologic features that characterize the various
age subgroups and helps to unravel the differences in clinical behavior and outcome, and provides
therapeutic indications for specific subgroups of patients.

14
Authorship and Disclosures
SC analyzed the data and wrote the manuscript, AV analyzed the data, GC performed molecular
screening and revised the manuscript; SMO, PF, DS, MGV generated the database and performed
statistical analysis, LE performed molecular screening, AMT provided clinical data, FM performed
cytomorphological analysis, VC provided clinical data, GTK performed molecular screening, FF
FDR, AT, GF, FF, GM, GS, GP, FM provided clinical data, AG, GB, AB and RF designed research
and critically revised the manuscript.
The authors have no conflicts to disclose.
REFERENCES
1. Silverman LB, Gelber RD, Dalton VK, Asselin BL, Barr RD, Clavell LA, et al. Improved
outcome for children with acute lymphoblastic leukemia: results of Dana-Farber Consortium
Protocol 91-01. Blood. 2001;97(5):1211-8.
2. Pui CH, Robison LL, Look AT. Acute lymphoblastic leukaemia. Lancet.
2008;371(9617):1030-43.
3. Annino L, Vegna ML, Camera A, Specchia G, Visani G, Fioritoni G, et al. Treatment of
adult acute lymphoblastic leukemia (ALL): long-term follow-up of the GIMEMA ALL 0288
randomized study. Blood. 2002;99(3):863-71.
4. Rowe JM, Buck G, Burnett AK, Chopra R, Wiernik PH, Richards SM, et al. Induction
therapy for adults with acute lymphoblastic leukemia: results of more than 1500 patients from the
international ALL trial: MRC UKALL XII/ECOG E2993. Blood. 2005;106(12):3760-7.
5. Thomas X, Boiron JM, Huguet F, Dombret H, Bradstock K, Vey N, et al. Outcome of
treatment in adults with acute lymphoblastic leukemia: analysis of the LALA-94 trial. J Clin Oncol.
2004;22(20):4075-8.
6. Bassan R, Hoelzer D. Modern therapy of acute lymphoblastic leukemia. J Clin Oncol.
2011;29(5):532-43.
7. Nachman J. Clinical characteristics, biologic features and outcome for young adult patients
with acute lymphoblastic leukaemia. Br J Haematol. 2005;130(2):166-73.
8. Seibel NL. Treatment of acute lymphoblastic leukemia in children and adolescents: peaks
and pitfalls. Hematology Am Soc Hematol Educ Program. 2008:374-380.

15
9. Boissel N, Auclerc MF, Lhéritier V, Perel Y, Thomas X, Leblanc T, Rousselot P, et al.
Should adolescents with acute lymphoblastic leukemia be treated as old children or young adults?
Comparison of the French FRALLE-93 and LALA-94 trials. J Clin Oncol. 2003;21(5):774-80.
10. de Bont JM, Holt B, Dekker AW, van der Does-van den Berg A, Sonneveld P, Pieters R, et
al. Significant difference in outcome for adolescents with acute lymphoblastic leukemia treated on
pediatric vs adult protocols in the Netherlands. Leukemia. 2004;18(12):2032-5.
11. Testi AM, Valsecchi MG, Conter V, Vignetti M, Paoloni F, Giona Fet al. Difference in
outcome of adolescents with Acute lymphoblastic leukemia (ALL) enrolled in pediatric (AIEOP)
and adult (GIMEMA) protocols (Abs). Blood. 2004;104,1954.
12. Barry E, DeAngelo DJ, Neuberg D, Stevenson K, Loh ML, Asselin BL, et al. Favorable
outcome for adolescents with acute lymphoblastic leukemia treated on Dana-Farber Cancer Institute
Acute Lymphoblastic Leukemia Consortium Protocols. J Clin Oncol. 2007;25(7):813-9.
13. Ribera JM, Oriol A, Sanz MA, Tormo M, Fernández-Abellán P, del Potro E, et al.
Comparison of the results of the treatment of adolescents and young adults with standard-risk acute
lymphoblastic leukemia with the Programa Español de Tratamiento en Hematología pediatric-based
protocol ALL-96. J Clin Oncol. 2008;26(11):1843-9.
14. Stock W, La M, Sanford B, Bloomfield CD, Vardiman JW, Gaynon P, et al. What
determines the outcomes for adolescents and young adults with acute lymphoblastic leukemia
treated on cooperative group protocols? A comparison of Children's Cancer Group and Cancer and
Leukemia Group B studies. Blood. 2008;112(5):1646-54.
15. Huguet F, Leguay T, Raffoux E, Thomas X, Beldjord K, Delabesse E, et al. Pediatric-
inspired therapy in adults with Philadelphia chromosome-negative acute lymphoblastic leukemia:
the GRAALL-2003 study. J Clin Oncol. 2009;27(6):911-8.
16. Burmeister T, Schwartz S, Bartram CR, Gökbuget N, Hoelzer D, Thiel E; GMALL study
group. et al. Patients' age and BCR-ABL frequency in adult B-precursor ALL: a retrospective
analysis from the GMALL study group. Blood. 2008;112(3):918-9.
17. Gleissner B, Gökbuget N, Bartram CR, Janssen B, Rieder H, Janssen JW, et al. Leading
prognostic relevance of the BCR-ABL translocation in adult acute B-lineage lymphoblastic
leukemia: a prospective study of the German Multicenter Trial Group and confirmed polymerase
chain reaction analysis. Blood. 2002;99(5):1536-43.
18. Harrison CJ. Cytogenetics of paediatric and adolescent acute lymphoblastic leukaemia. Br J
Haematol. 2009;144(2):147-56.

16
19. Bürger B, Zimmermann M, Mann G, Kühl J, Löning L, Riehm H, et al Diagnostic
cerebrospinal fluid examination in children with acute lymphoblastic leukemia: significance of low
leukocyte counts with blasts or traumatic lumbar puncture. J Clin Oncol. 2003;21(2):184-8.
20. Bene MC, Castoldi G, Knapp W, Ludwig WD, Matutes E, Orfao A, et al. Proposals for the
immunological classification of acute leukemias. European Group for the Immunological
Characterization of Leukemias (EGIL). Leukemia. 1995;9(10):1783-6.
21. Elia L, Mancini M, Moleti L, Meloni G, Buffolino S, Krampera M, et al. A multiplex
reverse transcriptase-polymerase chain reaction strategy for the diagnostic molecular screening of
chimeric genes: a clinical evaluation on 170 patients with acute lymphoblastic leukemia.
Haematologica. 2003;88(3):275-9.
22. van Dongen JJ, Macintyre EA, Gabert JA, Delabesse E, Rossi V, Saglio G, et al.
Standardized RT-PCR analysis of fusion gene transcripts from chromosome aberrations in acute
leukemia for detection of minimal residual disease. Report of the BIOMED-1 Concerted Action:
investigation of minimal residual disease in acute leukemia. Leukemia. 1999;13(12):1901-28.
23. National Cancer Institue, Surveillance, Epidemiology and End Results Program.
http://seer.cancer.gov/csr/gov/ 1975_2008. Visited on date 06/06/2012.
24. Chessels JM, Swansbury GJ, Reeves B, Bailey CC, Richards SM. Cytogenetics and
prognosis in childhood lymphoblastic leukaemia: results of MRC UKALL X. Medical Research
Council Working Party in Childhood Leukaemia. Br J Haematol. 1997;99(1):93-100.
25. Nachman JB. Adolescents with acute lymphoblastic leukemia: a new "age". Rev Clin Exp
Hematol. 2003;7(3):261-9.
26. Thomas X, Olteanu N, Charrin C, Lhéritier V, Magaud JP, Fiere D. Acute lymphoblastic
leukemia in the elderly: The Edouard Herriot Hospital experience. Am J Hematol. 2001;67(2):73-
83.
27. Larson RA. Acute lymphoblastic leukemia: Older patients and newer drugs. Hematology
Am Soc Hematol Educ Program. 2005:131-136.
28. Cartwright RA, Gurney KA, Moorman AV. Sex ratios and the risks of haematological
malignancies. Br J Haematol. 2002;118(4):1071-7.
29. Chessells JM, Hall E, Prentice HG, Durrant J, Bailey CC, Richards SM. The impact of age
on outcome in lymphoblastic leukaemia; MRC UKALL X and XA compared: a report from the
MRC Paediatric and Adult Working Parties. Leukemia. 1998; 12(4) 463-73.
30. Gökbuget N, Hoelzer D. Meningeosis leukaemica in adult acute lymphoblastic leukaemia. J
Neurooncol. 1998;38(2-3):167-180.

17
31. Cario G, Izraeli S, Teichert A, Rhein P, Skokowa J, Möricke A et al. High interleukin-15
expression characterizes childhood acute lymphoblastic leukemia with involvement of the CNS. J
Clin Oncol. 2007;25(30):4813-20.
32. Coustan-Smith E, Mullighan CG, Onciu M, Behm FG, Raimondi SC, Pei D, et al. Early T-
cell precursor leukaemia: a subtype of very high-risk acute lymphoblastic leukaemia. Lancet Oncol.
2009;10(2):147-56.
33. Greaves M. Childhood leukaemia. BMJ. 2002;324(7332):283-7.
34. Bateman CM, Colman SM, Chaplin T, Young BD, Eden TO, Bhakta M, et al. Acquisition of
genome-wide copy number alterations in monozygotic twins with acute lymphoblastic leukemia.
Blood. 2010;115(17):3553-8.
35. Anderson K, Lutz C, van Delft FW, Bateman CM, Guo Y, Colman SM, et al. Genetic
variegation of clonal architecture and propagating cells in leukaemia. Nature. 2011;469(7330):356-
61.
36. Gale KB, Ford AM, Repp R, et al. Backtracking leukemia to birth: identification of
clonotypic gene fusion sequences in neonatal blood spots. Proc Natl Acad Sci U S A.
1997;94(25):13950-4.
37. Stam RW, Schneider P, Hagelstein JA, van der Linden MH, Stumpel DJ, de Menezes RX, et
al. Gene expression profiling-based dissection of MLL translocated and MLL germline acute
lymphoblastic leukemia in infants. Blood. 2010;115(14):2835-44.
38. Haferlach T, Kohlmann A, Schnittger S, Dugas M, Hiddemann W, Kern W, et al. Global
approach to the diagnosis of leukemia using gene expression profiling. Blood. 2005;106(4):1189-
98.
39. Chiaretti S, Li X, Gentleman R, Vitale A, Wang KS, Mandelli F, et al. Gene expression
profiles of B-lineage adult acute lymphocytic leukemia reveal genetic patterns that identify lineage
derivation and distinct mechanisms of transformation. Clin Cancer Res. 2005;11(20):7209-19.
40. Martinelli G, Iacobucci I, Storlazzi CT, Vignetti M, Paoloni F, Cilloni D, et al. IKZF1
(Ikaros) deletions in BCR-ABL1-positive acute lymphoblastic leukemia are associated with short
disease-free survival and high rate of cumulative incidence of relapse: a GIMEMA AL WP report. J
Clin Oncol. 2009;27(31):5202-7.
41. Mullighan CG, Su X, Zhang J, Radtke I, Phillips LA, Miller CB, et al. Deletion of IKZF1
and prognosis in acute lymphoblastic leukemia. N Engl J Med. 2009;360(5):470-80.
42. Vignetti M, Fazi P, Cimino G, Martinelli G, Di Raimondo F, Ferrara F, et al. Imatinib plus
steroids induces complete remissions and prolonged survival in elderly Philadelphia chromosome-
18
positive patients with acute lymphoblastic leukemia without additional chemotherapy: results of the
Gruppo Italiano Malattie Ematologiche dell'Adulto (GIMEMA) LAL0201-B protocol. Blood.
2007;109(9):3676-8.
43. Bassan R, Rossi G, Pogliani EM, Di Bona E, Angelucci E, Cavattoni I, et al. Chemotherapy-
Phased Imatinib Pulses Improve Long-Term Outcome of Adult Patients With Philadelphia
Chromosome-Positive Acute Lymphoblastic Leukemia: Northern Italy Leukemia Group. J Clin
Oncol. 2010;28(22):3644-3652.
44. Ravandi F, O'Brien S, Thomas D, Faderl S, Jones D, Garris R, et al. First report of phase 2
study of dasatinib with hyper-CVAD for the frontline treatment of patients with Philadelphia
chromosome-positive (Ph+) acute lymphoblastic leukemia. Blood. 2010;116(12):2070-7.
45. Foà R, Vitale A, Vignetti M, Meloni G, Guarini A, De Propris MS, et al. Dasatinib as first-
line treatment for adult patients with Philadelphia chromosome-positive acute lymphoblastic
leukemia. Blood. 2011;118(25):6521-8.

19
Table 1A, 1B and 1C. Immunophenotypic features (A), clinical parameters (B) and molecular
features (C) among different age cohorts. Median counts and p-values are also indicated. Age cohorts (yrs) p
1-5 5-10 10-14 14-18 18-25 25-30 30-40 40-50 50-60
A. Immunophenotypic features B-lineage ALL
(%)
1793
(94.97)
932
(84.27)
397
(77.24)
259
(76.4)
224
(73.93)
103
(75.18)
235
(72.98)
254
(88.19)
245
(87.81) <.0001 T-lineage ALL
(%)
95
(5.03)
174
(15.73)
117
(22.76)
80
(23.6)
79
(26.07)
34
(24.82)
87
(27.02)
34
(11.81)
34
(12.19) B. Clinical parameters
WBC>50x109/L (%)
Median WBC count (Range)
359 (18.87)
12.59 (0.35-1000)
182 (16.34)
8.99
(0.01-761)
138 (26.74)
10.45 (0.18-940)
79 (23.24)
9.62
(0.2-708)
77 (25.50)
13.20
(0.5-848)
43 (31.16)
20.05
(0.8-321)
93 (28.97)
17.30
(0.4-700)
85 (29.62)
17.90
(0.4-872)
73 (26.16)
15.00
(0.5-597)
<.0001
Plts<100x109/L (%)
Median Plts count
(Range)
1352 (71.61)
47
(1-982)
685 (61.88)
72
(2-875)
320 (62.99)
73
(2.8-582)
236 (71.08)
54.5
(1-730)
201 (69.79)
56
(4-461)
92 (69.17)
48
(1.4-290)
232 (75.08)
48
(4-517)
217 (76.41)
46
(1-376)
216 (80)
37
(1-298)
<.0001
Hgb<10g/dL (%)
Median Hgb count
(Range)
1600 (84.75)
7.40
(2.3-15)
812 (73.35)
8.30
(3-15)
314 (61.57)
9.10
(1-17.1)
188 (57.32)
9.5
(2.9-16.8)
163 (62.45)
9
(3.4-16.7)
68 (55.28)
9.5
(3.1-17.5)
169 (59.93)
9.4
(3-17)
142 (57.26)
9.45
(4.3-16)
147 (62.82)
9.2
(4-16.6)
<.0001
Mediastinum enlargement
(%)
79
(4.16)
90
(8.11)
58
(11.26)
35
(10.74)
28
(11.07)
10
(8.93)
26
(9.59)
10
(4.12)
7
(3.14)
<.0001
Spleen enlargement
(%)
516
(27.26)
331
(29.79)
174
(33.92)
104
(32)
75
(30.99)
31
(27.43)
73
(28.85)
61
(26.18)
46
(21.9)
0.028
Liver enlargement
(%)
421
(22.25)
233
(20.92)
107
(20.86)
54
(16.93)
33
(14.29)
10
(8.85)
39
15.48
34
(14.19)
22
(10.33)
<.0001
CNS involvement
(%)
20
(1.05)
26
(2.34)
20
(3.91)
4
(1.29)
5
(2.36)
5
(5.0)
6
(2.58)
5
(2.5)
8
(4.91)
n.a.
C. Molecular features ETV6/RUNX1
(%)
337
(26.14)
162
(23.96)
20
(7.04)
8
(4.71)
2
(1.79)
1
(1.71)
0
(0)
0
(0)
0
(0)
<.0001
E2A/PBX1
(%)
14
(2.12)
13
(3.99)
8
(7.08)
6
(5.71)
6
(3.28)
1
(1.22)
10
(5.08)
5
(2.22%)
5
(2.26)
0.06
MLL/AF4
(%)
8
(0.48)
6
(0.70)
10
(2.78)
5
(2.15)
8
(3.86)
6
(6.45)
17
(7.94)
27
(11.74)
12
(5.24)
<.0001
BCR/ABL
(%)
28
(1.68)
24
(2.79)
20
(5.52)
14
(5.81)
32
(14.41)
26
(26)
84
(37.33)
102
(42.86)
125
(52.74)
<.0001

20
FIGURE LEGENDS
Figure 1. A. Percentage of the distribution of ALL among various age groups; B. Lineage
derivation in the various age cohorts. B-ALL: grey line; T-ALL: black line.
Figure 2. Gender distribution. A. Gender distribution analysis among age cohorts. The analysis
reveals a decreased incidence of females between 14 and 50 years. The grey line represents females,
the black line males. B. Gender distribution and lineage derivation among different age groups. The
grey continuous line represents B-ALL females, the grey dotted line B-ALL males, the black
continuous line T-ALL males and the black dotted line T-ALL females.
Figure 3. Organ involvement among age cohorts in the whole cohort (continuous line) and
stratified according to the lineage derivation (B-ALL: dashed line, T-ALL: dotted line). A:
mediastinal involvement; B: spleen involvement; C: liver involvement; D: CNS involvement.
Figure 4. Incidence of the molecular aberrations in different age cohorts of B-ALL patients. A
significant decrease of ETV6/RUNX1 is observed with age progression, while BCR/ABL and
MLL1/AF4 rearrangements are more frequent in adults.
Figure 5. Hyperleukocytosis and stage of differentiation of B-ALL analyzed on the basis of the
molecular aberrations. A. Percentage of cases with hyperleukocytosis (WBC >50 x 109/L) in
ETV6/RUNX1+ (black bar), E2A/PBX1+ (dark grey bar), MLL1/AF4+ (light grey bar) and
BCR/ABL+ (white bar) cases. B-E. Stage of differentiation within the different molecular
aberrations (B: ETV6/RUNX1; C: E2A/PBX1+; D: MLL1/AF4; E: BCR/ABL+); the black bars
indicate a pro-B ALL, the light grey bars a common ALL and the dark grey bar a pre-B ALL.
Detailed p-values are provided in Supplementary Tables 2-9.


Supplementary Table 1. Organ involvement among various age cohorts; percentages are also provided within B- and T-ALL cohorts; p-value is also indicated.
Age cohorts (yrs) p 1-5 5-10 10-14 14-18 18-25 25-30 30-40 40-50 50-60
Mediastinum enlargement (%)
4.16 8.11 11.26 10.74 11.07 8.93 9.59 4.12 3.14 <.0001
B-ALL (%) 1.73 1.29 1.26 1.61 0.53 1.16 0 1.40 0 n.a. T-ALL (%) 49.27 43.10 45.3 40.79 41.54 34.62 33.77 25 26.92 0.19
Spleen enlargement (%) 27.26 29.79 33.92 32 30.99 27.43 28.85 26.18 21.9 0.028
B-ALL (%) 25.56 26.42 29.29 26.91 26.55 25.58 27.22 24.51 23.78 0.90 T-ALL (%) 57.89 48.84 50.43 49.33 43.08 33.33 32.88 37.93 8.00 0.0003
Liver enlargement (%) 22.25 20.92 20.86 16.93 14.29 8.85 15.48 14.19 10.33 <.0001
B-ALL (%) 21.26 19.64 17.93 15.66 10.59 5.88 13.48 15.00 10.58 <.0001 T-ALL (%) 41.05 28.74 31.3 21.74 24.59 17.86 20.27 14.29 8.33 0.006
CNS involvement 1.05 2.34 3.91 1.29 2.36 5.0 2.58 2.5 4.91 n.a.
B-ALL (%) 0.95 1.07 2.03 0. 1.81 5.48 2.98 2.86 5.56 n.a. T-ALL (%) 3.19 8.67 10.34 5.41 4.35 3.70 1.54 0.00 0.00 n.a.
n.a. = not applicable since Chi-Square might not represent a valid test since some subgroups have expected counts less than five and Fisher test is not doable because the software cannot computed exact values.

Supplementary Table 2. Association between ETV6/RUNX1 rearrangement and WBC
Whole cohort
Age cohort: 1-5 yrs ETV6/RUNX1
ETV6/RUNX1
Negative Positive p
Negative Positive p WBC
<50x109/L 2136 462 Chi-Square
0.0001
WBC <50x109/L 775 284
Chi-Square 0.2377 WBC
>50x109/L 533 68
WBC >50x109/L 177 53
Age cohort: 5-10 yrs
Age cohort: 10-14 yrs
ETV6/RUNX1
ETV6/RUNX1 Negative Positive p
Negative Positive p WBC
<50x109/L 452 150 Chi-Square
0.098
WBC <50x109/L 214 17
Fisher test 1 WBC >50x109/L 62 12
WBC >50x109/L 50 3
Age cohort: 14-18 yrs
Age cohort: 18-25 yrs
ETV6/RUNX1
ETV6/RUNX1 Negative Positive p
Negative Positive p WBC
<50x109/L 131 8 Fisher test
0.3534
WBC <50x109/L 104 2
Fisher test 1 WBC >50x109/L 31 0
WBC >50x109/L 28 0
Age cohort: 25-30 yrs
Age cohort: 30-40 yrs
ETV6/RUNX1
ETV6/RUNX1
Negative Positive p
Negative Positive p WBC
<50x109/L 50 1
Fisher test 1
WBC <50x109/L 121 0
Not applicable WBC
>50x109/L 20 0
WBC >50x109/L 50 0
Age cohort: 40-50 yrs
Age cohort: 50-60 yrs
ETV6/RUNX1
ETV6/RUNX1
Negative Positive p
Negative Positive p WBC
<50x109/L 140 0 Not
applicable
WBC <50x109/L 149 0
Not applicable WBC
>50x109/L 64 0
WBC >50x109/L 51 0

Supplementary Table 3. Association between E2A/PBX1 rearrangement and WBC count in B-ALL.
Whole cohort
Age cohort: 1-5 yrs
E2A/PBX1
E2A/PBX1
Negative Positive p
Negative Positive p
WBC <50x109/L 1597 54
Chi-square 0.83
WBC <50x109/L 515 9
Fisher test 0.179 WBC
>50x109/L 442 14
WBC >50x109/L 131 5
Age cohort: 5-10 yrs
Age cohort: 10-14 yrs
E2A/PBX1
E2A/PBX1
Negative Positive p
Negative Positive p
WBC <50x109/L 277 11
Fisher test 0.654
WBC <50x109/L 74 6
Fisher test 1 WBC >50x109/L 36 2
WBC >50x109/L 31 2
Age cohort:14-18 yrs
Age cohort:18-25 yrs
E2A/PBX1
E2A/PBX1
Negative Positive p
Negative Positive p
WBC <50x109/L 80 5
Fisher test 1
WBC <50x109/L 143 5
Fisher test 1 WBC >50x109/L 19 1
WBC >50x109/L 33 1
Age cohort:25-30 yrs
Age cohort:30-40 yrs
E2A/PBX1
E2A/PBX1
Negative Positive p
Negative Positive p
WBC <50x109/L 60 1
Fisher test 1
WBC <50x109/L 136 9
Fisher test 0.4603 WBC
>50x109/L 21 0
WBC >50x109/L 51 1
Age cohort: 40-50 yrs
Age cohort:50-60 yrs
E2A/PBX1
E2A/PBX1
Negative Positive p
Negative Positive p
WBC <50x109/L 152 3
Fisher test 0.6363
WBC <50x109/L 160 5
Fisher test 0.3331 WBC
>50x109/L 64 2
WBC >50x109/L 56 0

Supplementary Table 4. Association between MLL/AF4 rearrangement and WBC count in B-ALL.
Whole cohort
Age cohort: 1-5 yrs
MLL/AF4
MLL/AF4
Negative Positive p Negative Positive p
WBC <50x109/L 3360 28
Chi-square <0.0001
WBC <50x109/L 1394 2
Fisher Test 4.085E-04 WBC
>50x109/L 635 71 WBC
>50x109/L 271 6
Age cohort: 5-10 yrs Age cohort: 10-14 yrs
MLL/AF4
MLL/AF4
Negative Positive p
Negative Positive p
WBC <50x109/L 770 0
Fisher Test 9.34E-07
WBC <50x109/L 296 1
Fisher Test 8.058E-07 WBC
>50x109/L 81 6
WBC >50x109/L 54 9
Age cohort: 14-18 yrs
Age cohort: 18-25 yrs
MLL/AF4
MLL/AF4
Negative Positive p
Negative Positive p
WBC <50x109/L 190 2
Fisher Test 0.0393
WBC <50x109/L 167 1
Fisher Test 3.09E-05 WBC
>50x109/L 38 3
WBC >50x109/L 31 7
Age cohort: 25-30 yrs
Age cohort: 30-40 yrs
MLL/AF4
MLL/AF4
Negative Positive p
Negative Positive p
WBC <50x109/L 69 2
Fisher Test 0.0264
WBC <50x109/L 158 2 Fisher Test
1.87E-08 WBC >50x109/L 18 4
WBC >50x109/L 39 15
Age cohort: 40-50 yrs
Age cohort: 50-60 yrs
MLL/AF4
MLL/AF4
Negative Positive p
Negative Positive p
WBC <50x109/L 151 11
Chi-Square 0.0003
WBC <50x109/L 165 7
Fisher Test 0.1787 WBC
>50x109/L 51 16
WBC >50x109/L 52 5

Supplementary Table 5. Association between BCR/ABL rearrangement and WBC count in B-ALL.
Whole cohort
Age cohort: 1-5 yrs
BCR/ABL
BCR/ABL
Negative Positive p
Negative Positive p
WBC <50x109/L 3140 296 Chi-square
<0.0001
WBC <50x109/L 1381 12
Fisher Test 9.61E-07 WBC
>50x109/L 557 158
WBC >50x109/L 260 16
Age cohort: 5-10 yrs
Age cohort: 10-14 yrs BCR/ABL
BCR/ABL
Negative Positive p
Negative Positive p
WBC <50x109/L 753 19
Fisher Test 0.0859
WBC <50x109/L 289 9
Fisher Test 1.078E-04 WBC
>50x109/L 82 5
WBC >50x109/L 53 11
Age cohort: 14-18 yrs
Age cohort: 18-25 yrs
BCR/ABL
BCR/ABL
Negative Positive p
Negative Positive p
WBC <50x109/L 193 7
Fisher Test 0.0035
WBC <50x109/L 159 21
Chi-Square 0.0128 WBC
>50x109/L 34 7
WBC >50x109/L 30 11
Age cohort: 25-30yrs
Age cohort: 30-40yrs
BCR/ABL
BCR/ABL
Negative Positive p
Negative Positive p
WBC <50x109/L 60 16
Chi-Square 0.0447
WBC <50x109/L 109 60
Chi-Square 0.3241 WBC
>50x109/L 14 10
WBC >50x109/L 32 24
Age cohort: 40-50yrs
Age cohort: 50-60 yrs
BCR/ABL
BCR/ABL
Negative Positive p
Negative Positive p
WBC <50x109/L 100 68
Chi-Square 0.2986
WBC <50x109/L 96 84
Chi-Square 0.0009 WBC
>50x109/L 36 33
WBC >50x109/L 16 41
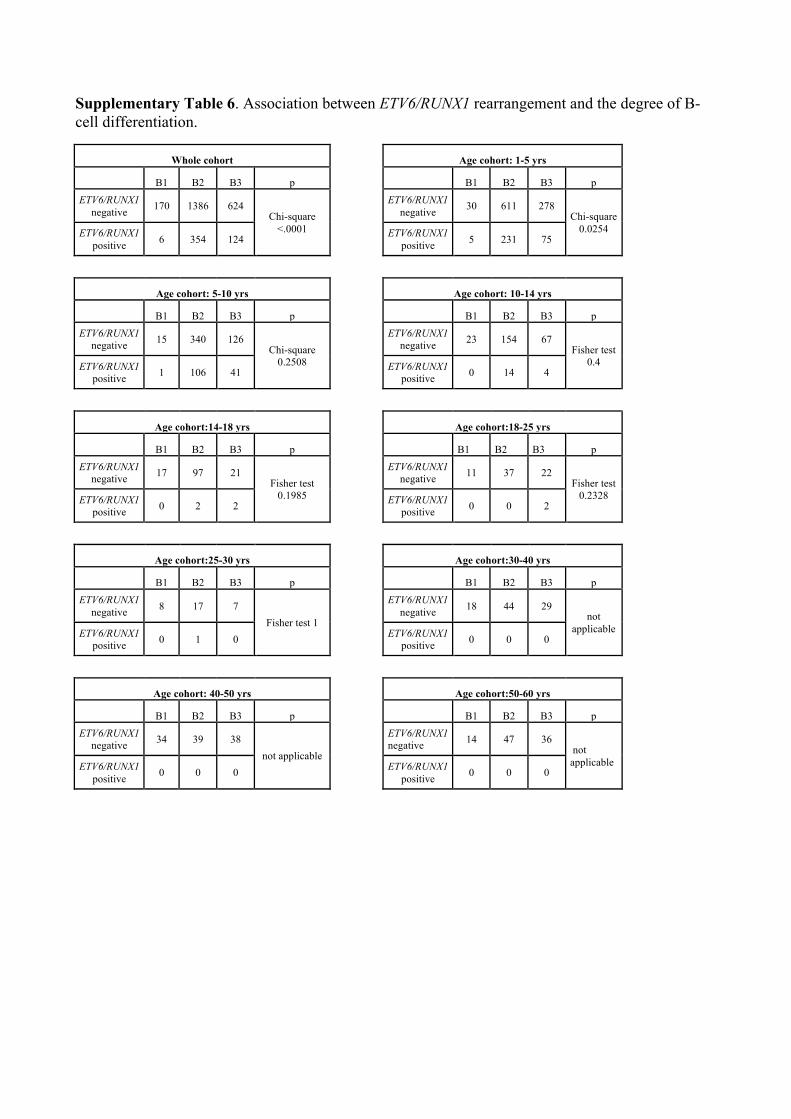
Supplementary Table 6. Association between ETV6/RUNX1 rearrangement and the degree of B-cell differentiation.
Whole cohort
Age cohort: 1-5 yrs
B1 B2 B3 p
B1 B2 B3 p ETV6/RUNX1
negative 170 1386 624 Chi-square
<.0001
ETV6/RUNX1 negative 30 611 278
Chi-square 0.0254 ETV6/RUNX1
positive 6 354 124
ETV6/RUNX1 positive 5 231 75
Age cohort: 5-10 yrs
Age cohort: 10-14 yrs
B1 B2 B3 p
B1 B2 B3 p ETV6/RUNX1
negative 15 340 126 Chi-square
0.2508
ETV6/RUNX1 negative 23 154 67
Fisher test 0.4 ETV6/RUNX1
positive 1 106 41
ETV6/RUNX1 positive 0 14 4
Age cohort:14-18 yrs
Age cohort:18-25 yrs
B1 B2 B3 p
B1 B2 B3 p ETV6/RUNX1
negative 17 97 21 Fisher test
0.1985
ETV6/RUNX1 negative 11 37 22
Fisher test 0.2328 ETV6/RUNX1
positive 0 2 2
ETV6/RUNX1 positive 0 0 2
Age cohort:25-30 yrs
Age cohort:30-40 yrs
B1 B2 B3 p
B1 B2 B3 p ETV6/RUNX1
negative 8 17 7 Fisher test 1
ETV6/RUNX1 negative 18 44 29
not applicable ETV6/RUNX1
positive 0 1 0
ETV6/RUNX1 positive 0 0 0
Age cohort: 40-50 yrs
Age cohort:50-60 yrs
B1 B2 B3 p
B1 B2 B3 p ETV6/RUNX1
negative 34 39 38 not applicable
ETV6/RUNX1 negative 14 47 36
not applicable ETV6/RUNX1
positive 0 0 0
ETV6/RUNX1 positive 0 0 0

Supplementary Table 7. Association between E2A/PBX1 rearrangement and the degree
of B-cell differentiation.
Whole cohort
Age cohort: 1-5 yrs
B1 B2 B3 p
B1 B2 B3 p
E2A/PBX1 negative 161 784 552
Chi-square <.0001
E2A/PBX1 negative 19 351 241
Chi-square 0.0125 E2A/PBX1
positive 0 12 39 E2A/PBX1 positive 0 3 11
Age cohort: 5-10 yrs
Age cohort: 10-14 yrs
B1 B2 B3 p B1 B2 B3 p
E2A/PBX1 negative 10 167 108
Chi-square 0.0184
E2A/PBX1 negative 11 39 46
Fisher test 0.476
E2A/PBX1 positive 0 3 10
E2A/PBX1 positive 0 2 6
Age cohort: 14-18 yrs Age cohort: 18-25 yrs
B1 B2 B3 p
B1 B2 B3 p
E2A/PBX1 negative 11 32 20 Fisher test
0.2896
E2A/PBX1 negative
23 41 26 Fisher test
0.0119 E2APBX1 positive 0 1 3
E2A/PBX1 positive
0 0 4
Age cohort: 25-30 yrs Age cohort: 30-40 yrs
B1 B2 B3 p
B1 B2 B3 p
E2A/PBX1 negative 10 19 8
not applicable
E2A/PBX1 negative 25 47 28 Fisher test
0.4456
E2APBX1 positive 0 0 0 E2A/PBX1
positive 0 1 2
Age cohort: 40-50 yrs Age cohort: 50-60 yrs
B1 B2 B3 p B1 B2 B3 p E2A/PBX1 negative 34 41 37 Fisher test
0.6384 E2A/PBX1 negative 18 47 38 Fisher test
1
E2APBX1 positive 0 1 2
E2APBX1 positive 0 1 1

Supplementary Table 8. Association between MLL/AF4 rearrangement and the degree
of B-cell differentiation.
Whole cohort
Age cohort: 1-5 yrs
B1 B2 B3 p
B1 B2 B3 p
MLL/AF4 negative 188 2242 910
Chi-square <.0001
MLL/AF4 negative 47 1110 432
Fisher test 3.21E-07 MLL/AF4
positive 68 3 5
MLL/AF4 positive 5 1 2
Age cohort: 5-10 yrs Age cohort: 10-14 yrs
B1 B2 B3 p
B1 B2 B3 p
MLL/AF4 negative 25 565 206
Fisher test 3.05E-07
MLL/AF4 negative 21 218 91
Fisher test 2.04E-07 MLL/AF4
positive 5 1 0
MLL/AF4 positive 7 1 1
Age cohort: 14-18 yrs Age cohort: 18-25 yrs
B1 B2 B3 p B1 B2 B3 p
MLL/AF4 negative 17 131 35
Fisher test 1.42E-05
MLL/AF4 negative 27 49 30
Fisher Test 0.0387 MLL/AF4
positive 5 0 0
MLL/AF4 positive 3 0 0
Age cohort: 25-30 yrs Age cohort: 30-40 yrs
B1 B2 B3 p B1 B2 B3 p
MLL/AF4 negative 5 24 8
Fisher test 0.0006269
MLL/AF4 negative 20 50 29
Fisher test 1.42E-06 MLL/AF4
positive 5 0 1 MLL/AF4 positive 11 0 1
Age cohort: 40-50 yrs Age cohort: 50-60 yrs
B1 B2 B3 p B1 B2 B3 p
MLL/AF4 negative 14 44 39 Chi-square
MLL/AF4 negative 12 51 40
Fisher test 1.58E-06 MLL/AF4
positive 20 0 0 <.0001 MLL/AF4 positive 7 0 0

Supplementary Table 9. Association between BCR/ABL rearrangement and the
degree of B-cell differentiation.
Whole cohort Age cohort: 1-5 yrs
B1 B2 B3 p B1 B2 B3 p
BCR/ABL negative 259 2105 832
Chi-square 0.0017
BCR/ABL negative 51 1088 425
Chi-square 0.9805 BCR/ABL
positive 8 148 82
BCR/ABL positive 1 19 8
Age cohort: 5-10 yrs Age cohort: 10-14 yrs
B1 B2 B3 p B1 B2 B3 p
BCR/ABL negative 30 554 200
Chi-square 0.5384
BCR/ABL negative 29 208 87
Fisher test 0.5746 BCR/ABL
positive 0 16 4
BCR/ABL positive 0 12 5
Age cohort:14-18 yrs Age cohort: 18-25 yrs
B1 B2 B3 p B1 B2 B3 p
BCR/ABL negative 23 124 34
Fisher test 0.653
BCR/ABL negative 30 41 26
Fisher test 0.3316 BCR/ABL
positive 0 8 1
BCR/ABL positive 2 9 4
Age cohort: 25-30 yrs Age cohort: 30-40 yrs
B1 B2 B3 p B1 B2 B3 p
BCR/ABL negative 11 20 7
Fisher test 0.2599
BCR/ABL negative 34 30 16
Chi-square <.0001 BCR/ABL
positive 0 5 2 BCR/ABL positive 0 22 14
Age cohort: 40-50 yrs Age cohort: 50-60 yrs
B1 B2 B3 p B1 B2 B3 p
BCR/ABL negative 34 23 23
Chi-square <.0001
BCR/ABL negative 17 17 14
Chi-square 0.0001 BCR/ABL
positive 2 23 17
BCR/ABL positive
3 34 27

Legends to Supplementary Figures
Supplementary Figure 1. EFS in the whole population analyzed, stratified according to the age
groups.
Supplementary Figure 2. Differentiation stages of B-ALL in the different age cohorts analyzed
(pro-B ALL: black bars; common ALL: light grey bar; pre-B ALL: dark grey bar). A significant
increase in the percentage of pro-B up to the 5th decade of life is observed (p<0.0001).
Supplementary Figure 3. Differentiation stages of T-ALL in the different age cohorts analyzed,
(pro-T & pre-T ALL: black bars; cortical T-ALL: light grey bar; mature T-ALL: dark grey bar). A
significant increase of T1 ALL is recorded in the 5th and 6th decade (p=0.0018).
Supplementary Figure 4. Hematologic parameters in the different age cohorts. A. White blood
count (black line), platelet count (light grey) and hemoglobin levels (dark grey) among different age
cohorts. B. Percentage of hyperleukocytosis (cut-point >50 x 109/L) in the different age cohorts
analyzed, stratified for lineage derivation (B-ALL: grey bars; T-ALL: black bars). A higher
percentage of hyperleukocytosis is evident in T-lineage ALL. C. Distribution of Plt count <100 x
109/L in the different age cohorts analyzed, stratified for lineage derivation (B-ALL: grey bars; T-
ALL: black bars). A significantly higher percentage of cases with Plt count <100 x 109/L is
observed in B-ALL. D. Distribution of percentage of Hgb levels <10g/dL in the different age
cohorts analyzed, stratified for lineage derivation (B-ALL: grey bars; T-ALL: black bars). A
significantly higher percentage of cases with Hgb levels <10g/dL is observed in B-ALL.

Supplementary Figure 1
Supplementary Figure 2.

Supplementary Figure 3.
Supplementary Figure 4.
