clinical interpretation guide - zeiss · 5 vfi controls zeiss forum glaucoma workplace enables you...
TRANSCRIPT
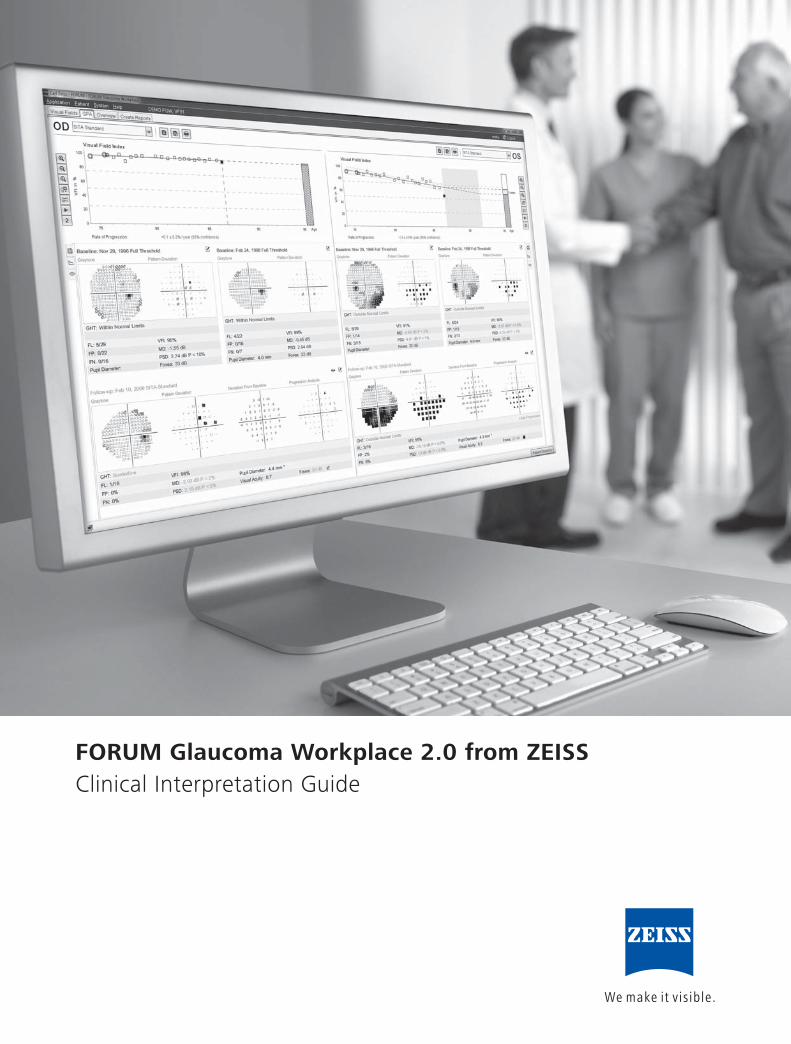
FORUM Glaucoma Workplace 2.0 from ZEISSClinical Interpretation Guide
For years, doctors have asked for the operational capability to analyze data
from their Humphrey® Field Analyzer (HFA™) using a Mac or PC. They
have also requested greater integration of HFA and CIRRUS™ analysis data
in a single report. Based on this feedback, ZEISS developed the FORUM®
Glaucoma Workplace.
This new workplace application allows doctors to change baselines for
Guided Progression Analysis™ (GPA™) and generate HFA reports using a Mac
or PC. They can also combine structure and function test data into a single
integrated report.
ZEISS FORUM Glaucoma Workplace analysis reports offer qualitative and
quantitative information in an easy-to-read format. This interpretation guide
explains various areas of each report and the valuable information they
provide for a doctor's clinical assessment. The guide is intended to provide
basic information only; it is not intended to replace the User Manual.
ZEISS FORUM Glaucoma
Workplace 2.0
3
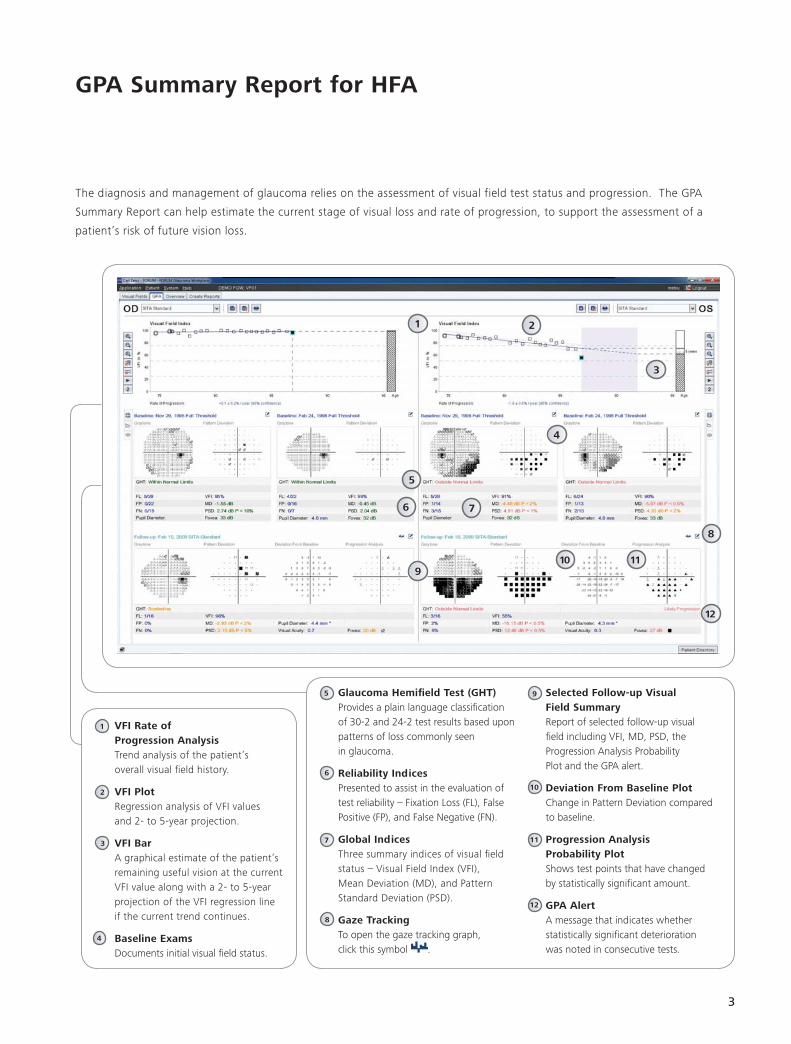
Selected Follow-up Visual Field SummaryReport of selected follow-up visual fi eld including VFI, MD, PSD, the Progression Analysis Probability Plot and the GPA alert.
Deviation From Baseline PlotChange in Pattern Deviation compared to baseline.
Progression Analysis Probability PlotShows test points that have changed by statistically signifi cant amount.
GPA AlertA message that indicates whether statistically signifi cant deterioration was noted in consecutive tests.
VFI Rate of Progression AnalysisTrend analysis of the patient’s overall visual fi eld history.
VFI PlotRegression analysis of VFI values and 2- to 5-year projection.
VFI BarA graphical estimate of the patient’s remaining useful vision at the current VFI value along with a 2- to 5-year projection of the VFI regression line if the current trend continues.
Baseline ExamsDocuments initial visual fi eld status.
3
GPA Summary Report for HFA
The diagnosis and management of glaucoma relies on the assessment of visual field test status and progression. The GPA
Summary Report can help estimate the current stage of visual loss and rate of progression, to support the assessment of a
patient’s risk of future vision loss.
1 2
3
5
6
4
2
1
7
8
9
12
Glaucoma Hemifi eld Test (GHT)Provides a plain language classifi cation of 30-2 and 24-2 test results based upon patterns of loss commonly seen in glaucoma.
Reliability Indices Presented to assist in the evaluation of test reliability – Fixation Loss (FL), False Positive (FP), and False Negative (FN).
Global Indices Three summary indices of visual fi eld status – Visual Field Index (VFI), Mean Deviation (MD), and Pattern Standard Deviation (PSD).
Gaze TrackingTo open the gaze tracking graph, click this symbol .
5 9
10
11 7
6
8
12
4
10 11
4
Understanding the GPA Summary Electronic Report
GPA uses the Visual Field Index™ (VFI™), a
summary measurement of a patient’s visual fi eld
status expressed as a percent of a normal age-
adjusted visual fi eld.
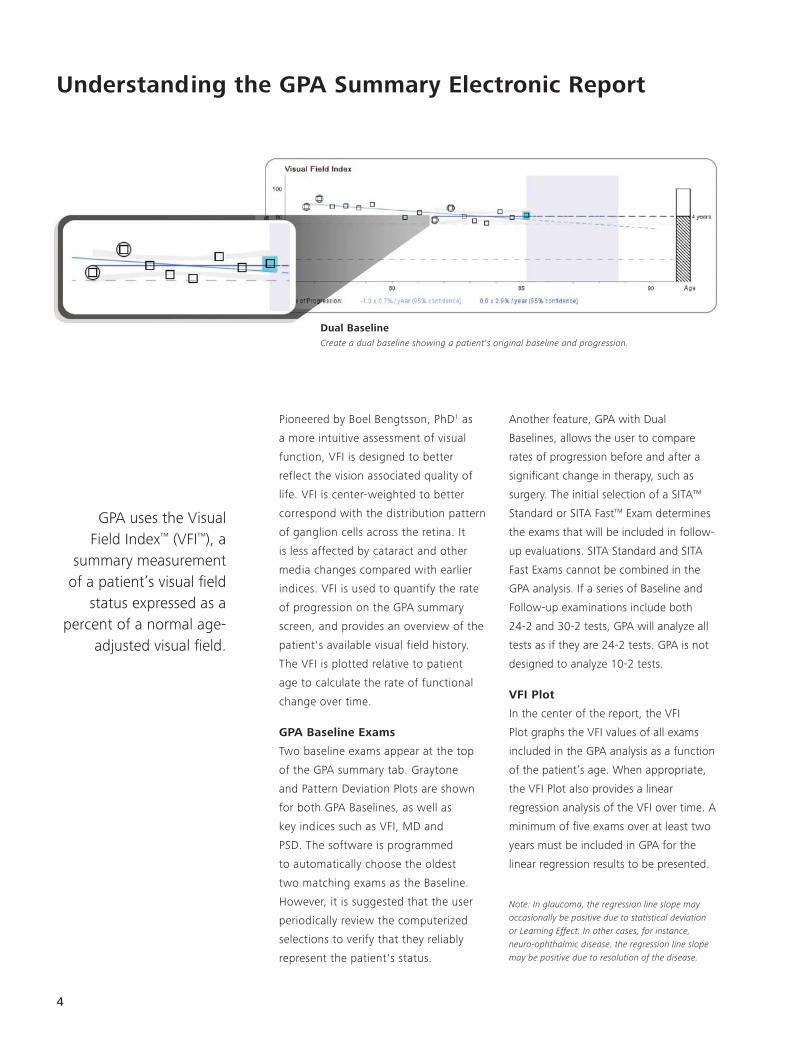
Dual BaselineCreate a dual baseline showing a patient's original baseline and progression.
Pioneered by Boel Bengtsson, PhD1 as
a more intuitive assessment of visual
function, VFI is designed to better
reflect the vision associated quality of
life. VFI is center-weighted to better
correspond with the distribution pattern
of ganglion cells across the retina. It
is less affected by cataract and other
media changes compared with earlier
indices. VFI is used to quantify the rate
of progression on the GPA summary
screen, and provides an overview of the
patient's available visual field history.
The VFI is plotted relative to patient
age to calculate the rate of functional
change over time.
GPA Baseline Exams
Two baseline exams appear at the top
of the GPA summary tab. Graytone
and Pattern Deviation Plots are shown
for both GPA Baselines, as well as
key indices such as VFI, MD and
PSD. The software is programmed
to automatically choose the oldest
two matching exams as the Baseline.
However, it is suggested that the user
periodically review the computerized
selections to verify that they reliably
represent the patient's status.
Another feature, GPA with Dual
Baselines, allows the user to compare
rates of progression before and after a
signifi cant change in therapy, such as
surgery. The initial selection of a SITA™
Standard or SITA Fast™ Exam determines
the exams that will be included in follow-
up evaluations. SITA Standard and SITA
Fast Exams cannot be combined in the
GPA analysis. If a series of Baseline and
Follow-up examinations include both
24-2 and 30-2 tests, GPA will analyze all
tests as if they are 24-2 tests. GPA is not
designed to analyze 10-2 tests.
VFI Plot
In the center of the report, the VFI
Plot graphs the VFI values of all exams
included in the GPA analysis as a function
of the patient’s age. When appropriate,
the VFI Plot also provides a linear
regression analysis of the VFI over time. A
minimum of fi ve exams over at least two
years must be included in GPA for the
linear regression results to be presented.
Note: In glaucoma, the regression line slope may occasionally be positive due to statistical deviation or Learning Effect. In other cases, for instance, neuro-ophthalmic disease, the regression line slope may be positive due to resolution of the disease.
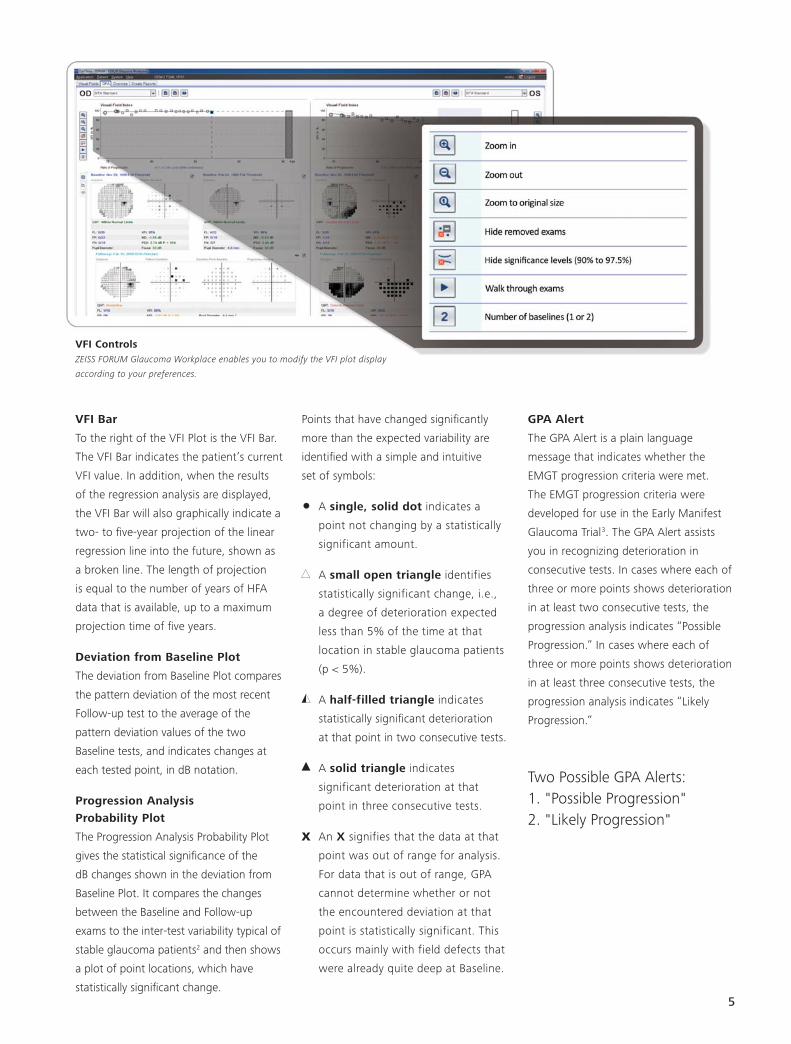
5
VFI ControlsZEISS FORUM Glaucoma Workplace enables you to modify the VFI plot display
according to your preferences.
VFI Bar
To the right of the VFI Plot is the VFI Bar.
The VFI Bar indicates the patient’s current
VFI value. In addition, when the results
of the regression analysis are displayed,
the VFI Bar will also graphically indicate a
two- to fi ve-year projection of the linear
regression line into the future, shown as
a broken line. The length of projection
is equal to the number of years of HFA
data that is available, up to a maximum
projection time of fi ve years.
Deviation from Baseline Plot
The deviation from Baseline Plot compares
the pattern deviation of the most recent
Follow-up test to the average of the
pattern deviation values of the two
Baseline tests, and indicates changes at
each tested point, in dB notation.
Progression Analysis
Probability Plot
The Progression Analysis Probability Plot
gives the statistical signifi cance of the
dB changes shown in the deviation from
Baseline Plot. It compares the changes
between the Baseline and Follow-up
exams to the inter-test variability typical of
stable glaucoma patients2 and then shows
a plot of point locations, which have
statistically signifi cant change.
Points that have changed signifi cantly
more than the expected variability are
identifi ed with a simple and intuitive
set of symbols:
A single, solid dot indicates a
point not changing by a statistically
significant amount.
A small open triangle identifies
statistically significant change, i.e.,
a degree of deterioration expected
less than 5% of the time at that
location in stable glaucoma patients
(p < 5%).
A half-filled triangle indicates
statistically signifi cant deterioration
at that point in two consecutive tests.
A solid triangle indicates
significant deterioration at that
point in three consecutive tests.
X An X signifies that the data at that
point was out of range for analysis.
For data that is out of range, GPA
cannot determine whether or not
the encountered deviation at that
point is statistically significant. This
occurs mainly with field defects that
were already quite deep at Baseline.
GPA Alert
The GPA Alert is a plain language
message that indicates whether the
EMGT progression criteria were met.
The EMGT progression criteria were
developed for use in the Early Manifest
Glaucoma Trial3. The GPA Alert assists
you in recognizing deterioration in
consecutive tests. In cases where each of
three or more points shows deterioration
in at least two consecutive tests, the
progression analysis indicates “Possible
Progression.” In cases where each of
three or more points shows deterioration
in at least three consecutive tests, the
progression analysis indicates “Likely
Progression.”
Two Possible GPA Alerts:1. "Possible Progression" 2. "Likely Progression"
6
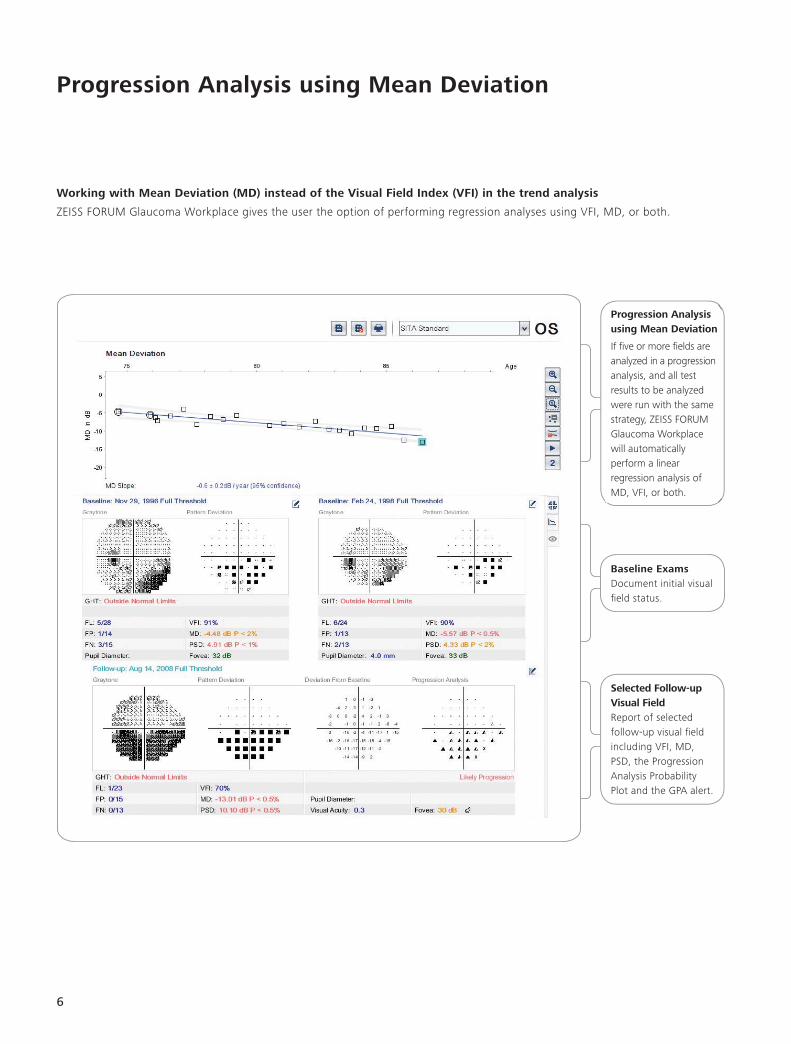
Working with Mean Deviation (MD) instead of the Visual Field Index (VFI) in the trend analysis
ZEISS FORUM Glaucoma Workplace gives the user the option of performing regression analyses using VFI, MD, or both.
Progression Analysis using Mean Deviation
If fi ve or more fi elds are analyzed in a progression analysis, and all test results to be analyzed were run with the same strategy, ZEISS FORUM Glaucoma Workplace will automatically perform a linear regression analysis of MD, VFI, or both.
Selected Follow-up Visual Field Report of selected follow-up visual fi eld including VFI, MD, PSD, the Progression Analysis Probability Plot and the GPA alert.
Baseline ExamsDocument initial visual fi eld status.
Progression Analysis using Mean Deviation
7
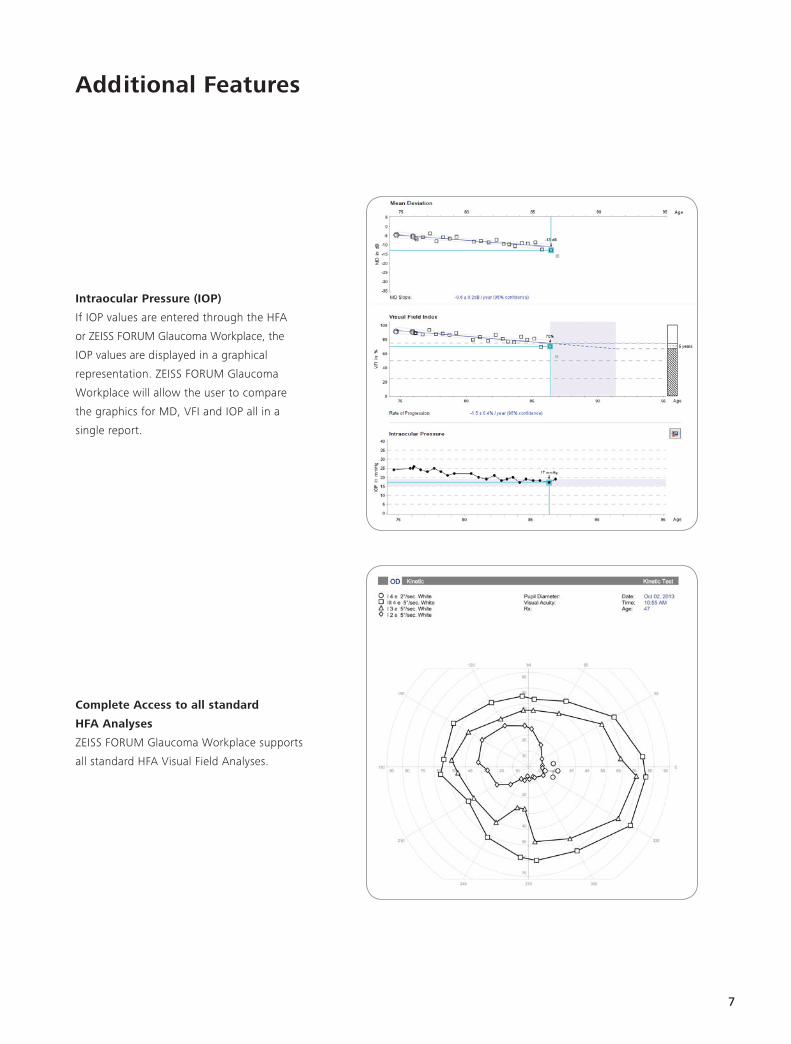
Intraocular Pressure (IOP)
If IOP values are entered through the HFA
or ZEISS FORUM Glaucoma Workplace, the
IOP values are displayed in a graphical
representation. ZEISS FORUM Glaucoma
Workplace will allow the user to compare
the graphics for MD, VFI and IOP all in a
single report.
Complete Access to all standard
HFA Analyses
ZEISS FORUM Glaucoma Workplace supports
all standard HFA Visual Field Analyses.
Additional Features
8
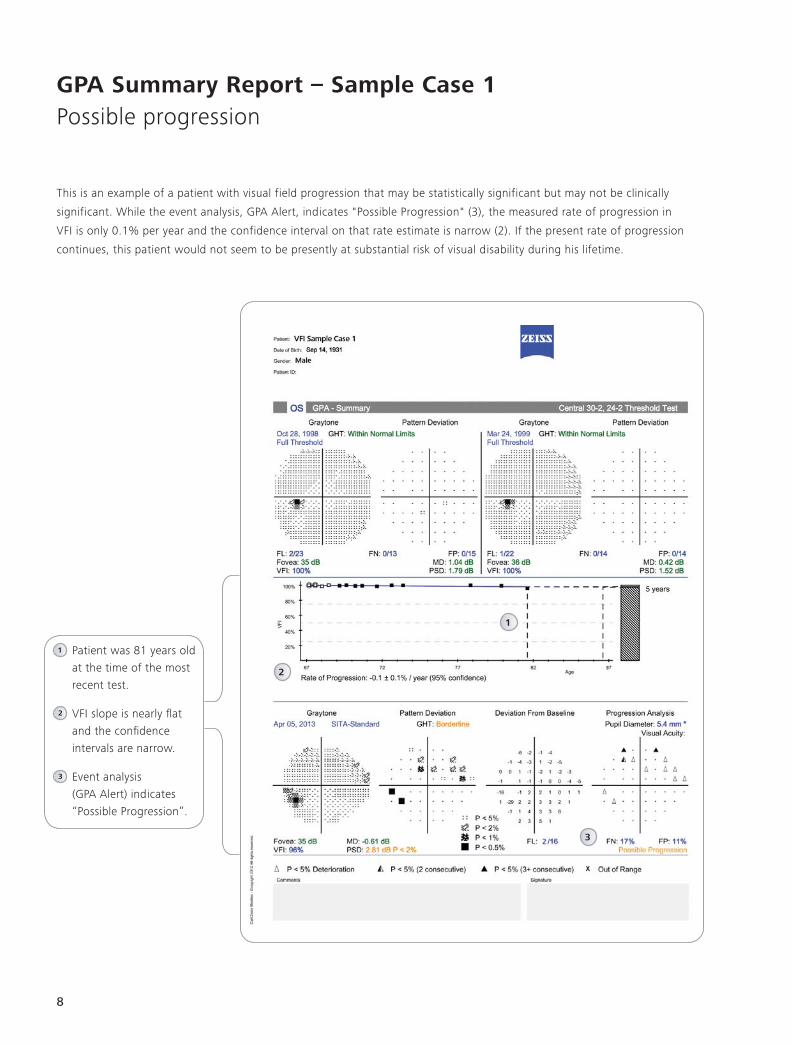
Patient was 81 years old
at the time of the most
recent test.
VFI slope is nearly fl at
and the confi dence
intervals are narrow.
Event analysis
(GPA Alert) indicates
“Possible Progression”.
GPA Summary Report – Sample Case 1Possible progression
This is an example of a patient with visual field progression that may be statistically significant but may not be clinically
significant. While the event analysis, GPA Alert, indicates "Possible Progression" (3), the measured rate of progression in
VFI is only 0.1% per year and the confidence interval on that rate estimate is narrow (2). If the present rate of progression
continues, this patient would not seem to be presently at substantial risk of visual disability during his lifetime.
1
2
2
1
3
3
9
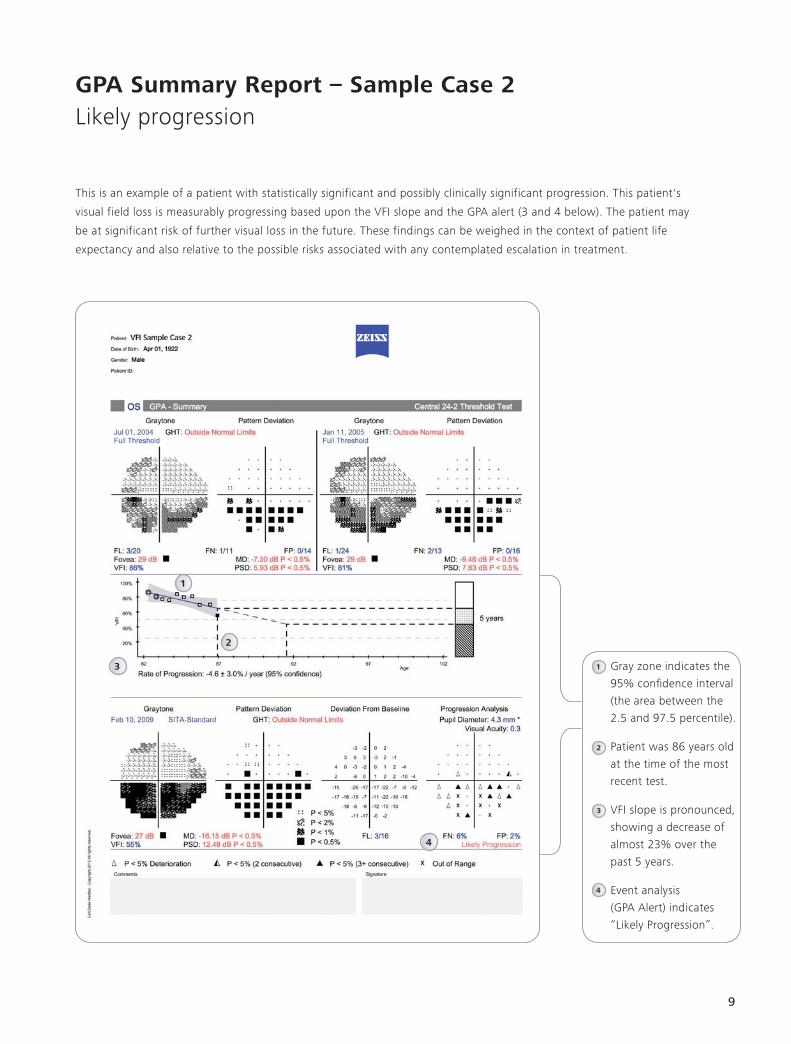
Gray zone indicates the
95% confi dence interval
(the area between the
2.5 and 97.5 percentile).
Patient was 86 years old
at the time of the most
recent test.
VFI slope is pronounced,
showing a decrease of
almost 23% over the
past 5 years.
Event analysis
(GPA Alert) indicates
“Likely Progression”.
GPA Summary Report – Sample Case 2Likely progression
2
1
3
4
2
1
3
4
This is an example of a patient with statistically significant and possibly clinically significant progression. This patient's
visual field loss is measurably progressing based upon the VFI slope and the GPA alert (3 and 4 below). The patient may
be at significant risk of further visual loss in the future. These findings can be weighed in the context of patient life
expectancy and also relative to the possible risks associated with any contemplated escalation in treatment.
10
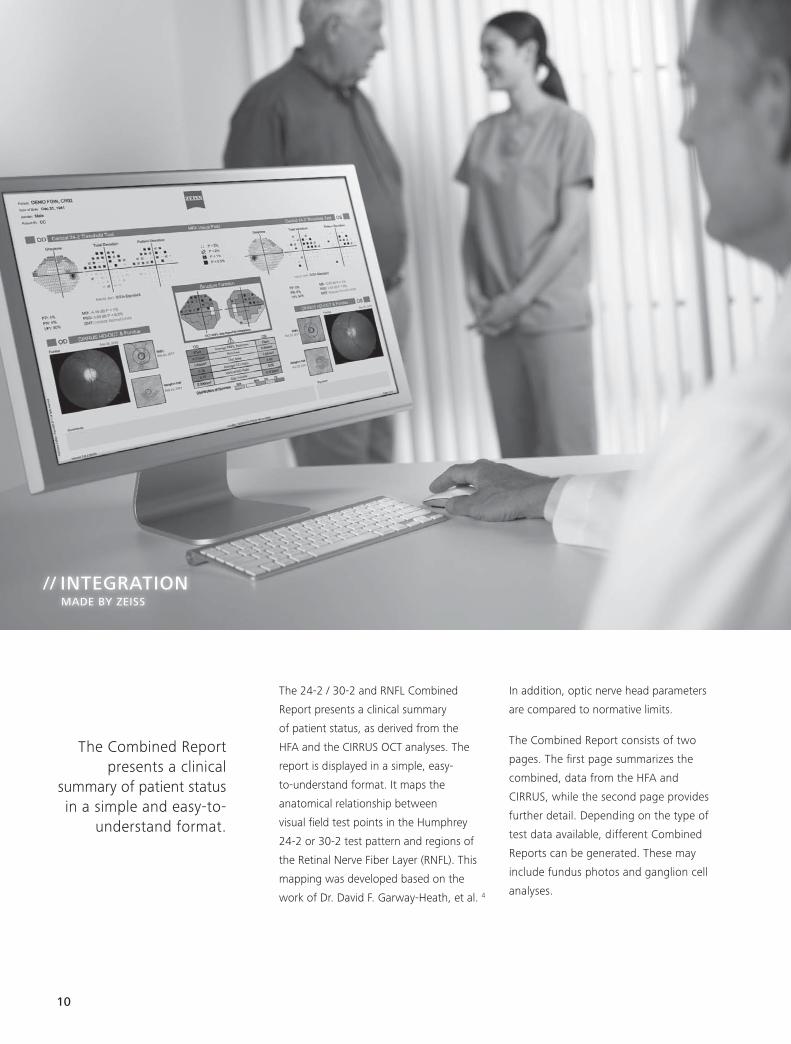
The 24-2 / 30-2 and RNFL Combined
Report presents a clinical summary
of patient status, as derived from the
HFA and the CIRRUS OCT analyses. The
report is displayed in a simple, easy-
to-understand format. It maps the
anatomical relationship between
visual fi eld test points in the Humphrey
24-2 or 30-2 test pattern and regions of
the Retinal Nerve Fiber Layer (RNFL). This
mapping was developed based on the
work of Dr. David F. Garway-Heath, et al. 4
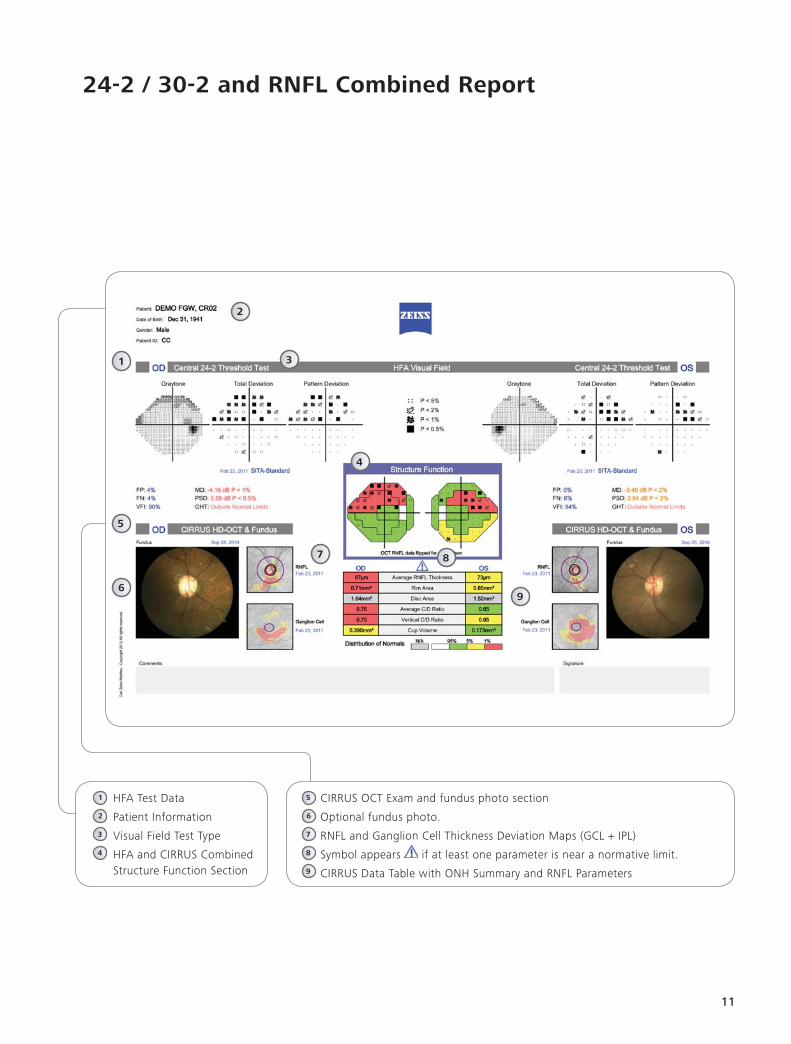
In addition, optic nerve head parameters
are compared to normative limits.
The Combined Report consists of two
pages. The fi rst page summarizes the
combined, data from the HFA and
CIRRUS, while the second page provides
further detail. Depending on the type of
test data available, different Combined
Reports can be generated. These may
include fundus photos and ganglion cell
analyses.
The Combined Report presents a clinical
summary of patient status in a simple and easy-to-
understand format.
// INTEGRATION MADE BY ZEISS
11
24-2 / 30-2 and RNFL Combined Report
1 3
2
4
6
5
7 8
9
CIRRUS OCT Exam and fundus photo section
Optional fundus photo.
RNFL and Ganglion Cell Thickness Deviation Maps (GCL + IPL)
Symbol appears if at least one parameter is near a normative limit.
CIRRUS Data Table with ONH Summary and RNFL Parameters
5
6
7
8
9
HFA Test Data
Patient Information
Visual Field Test Type
HFA and CIRRUS Combined Structure Function Section
1
2
3
4
12
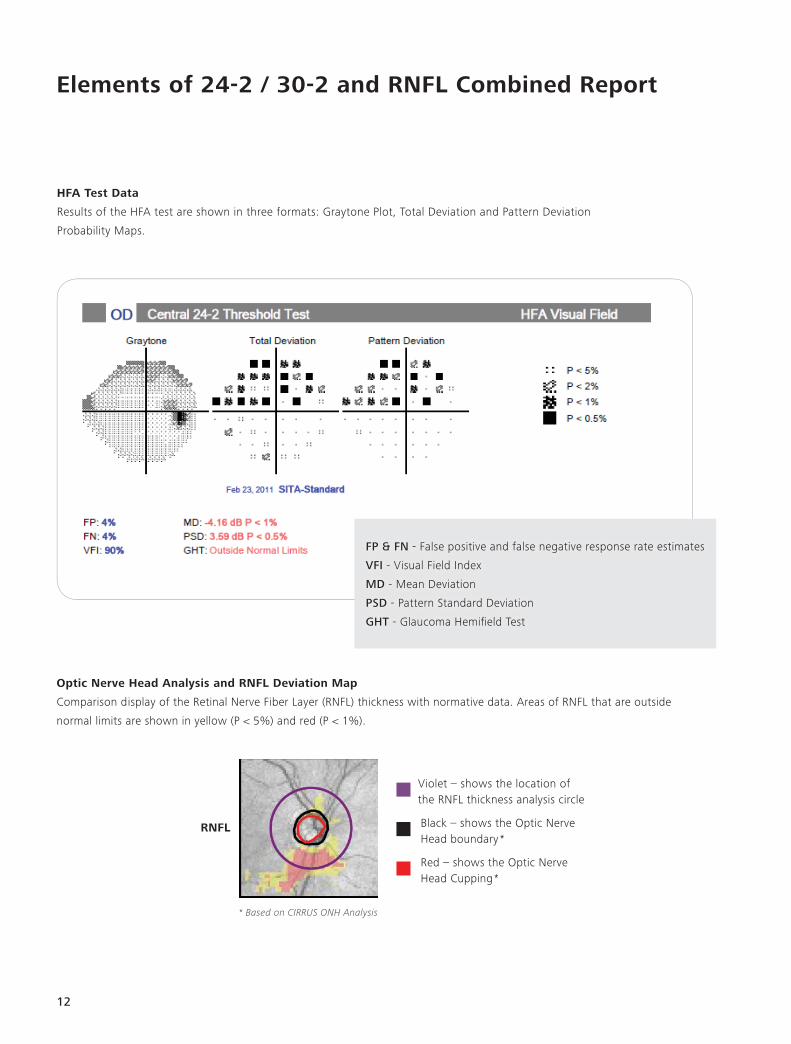
Elements of 24-2 / 30-2 and RNFL Combined Report
HFA Test Data
Results of the HFA test are shown in three formats: Graytone Plot, Total Deviation and Pattern Deviation
Probability Maps.
Optic Nerve Head Analysis and RNFL Deviation Map
Comparison display of the Retinal Nerve Fiber Layer (RNFL) thickness with normative data. Areas of RNFL that are outside
normal limits are shown in yellow (P < 5%) and red (P < 1%).
FP & FN - False positive and false negative response rate estimates
VFI - Visual Field Index
MD - Mean Deviation
PSD - Pattern Standard Deviation
GHT - Glaucoma Hemifi eld Test
* Based on CIRRUS ONH Analysis
• Violet – shows the location of the RNFL thickness analysis circle
• Black – shows the Optic Nerve Head boundary*
• Red – shows the Optic Nerve Head Cupping*
RNFL
13
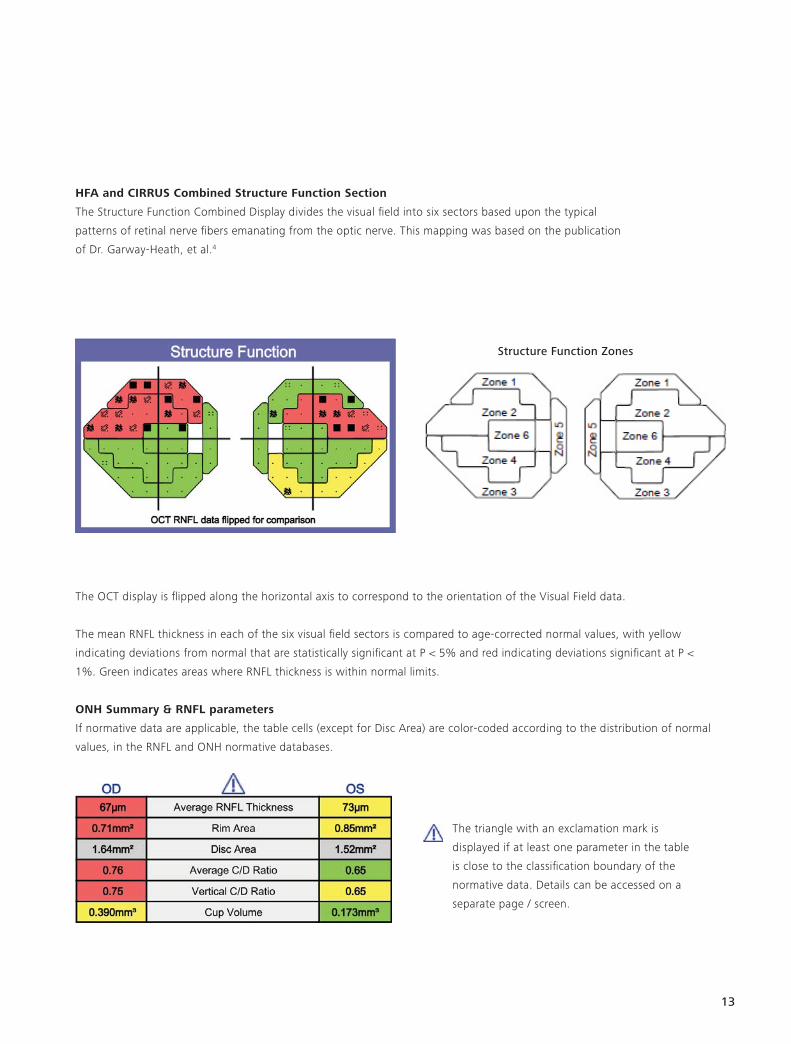
HFA and CIRRUS Combined Structure Function Section
The Structure Function Combined Display divides the visual fi eld into six sectors based upon the typical
patterns of retinal nerve fi bers emanating from the optic nerve. This mapping was based on the publication
of Dr. Garway-Heath, et al.4
The OCT display is fl ipped along the horizontal axis to correspond to the orientation of the Visual Field data.
The mean RNFL thickness in each of the six visual fi eld sectors is compared to age-corrected normal values, with yellow
indicating deviations from normal that are statistically signifi cant at P < 5% and red indicating deviations signifi cant at P <
1%. Green indicates areas where RNFL thickness is within normal limits.
ONH Summary & RNFL parameters
If normative data are applicable, the table cells (except for Disc Area) are color-coded according to the distribution of normal
values, in the RNFL and ONH normative databases.
Structure Function Zones
The triangle with an exclamation mark is
displayed if at least one parameter in the table
is close to the classifi cation boundary of the
normative data. Details can be accessed on a
separate page / screen.
14
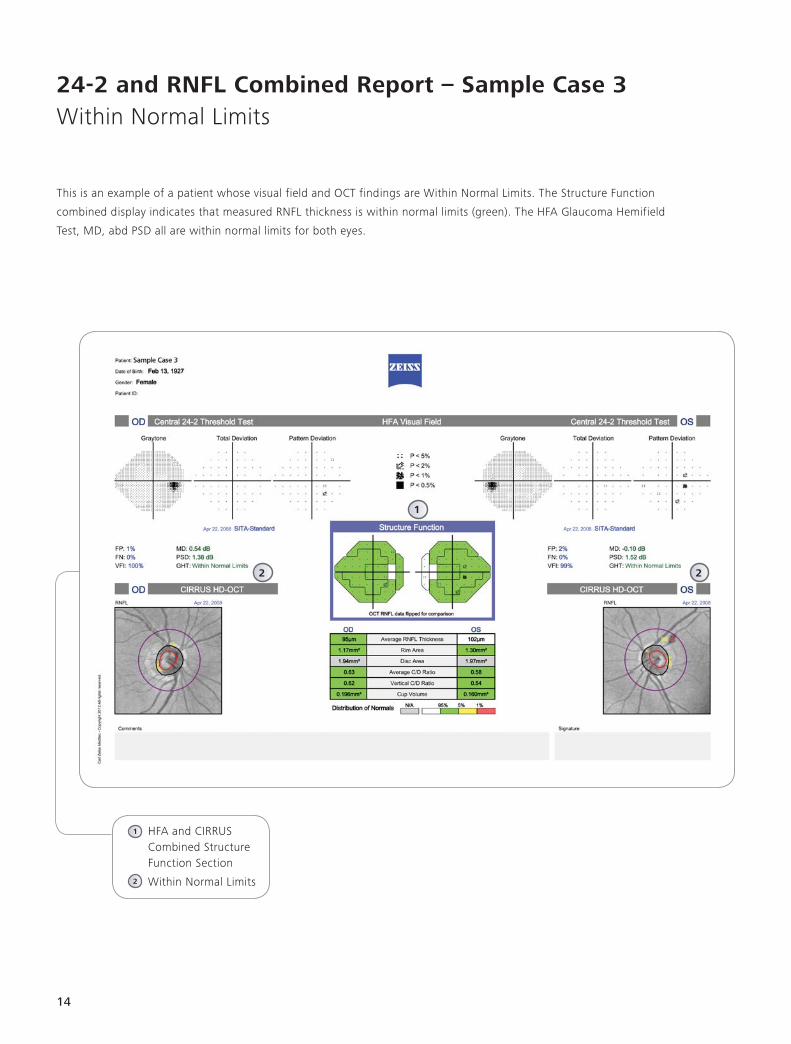
24-2 and RNFL Combined Report – Sample Case 3Within Normal Limits
2 2
HFA and CIRRUS Combined Structure Function Section
Within Normal Limits
1
2
1
This is an example of a patient whose visual field and OCT findings are Within Normal Limits. The Structure Function
combined display indicates that measured RNFL thickness is within normal limits (green). The HFA Glaucoma Hemifield
Test, MD, abd PSD all are within normal limits for both eyes.
15
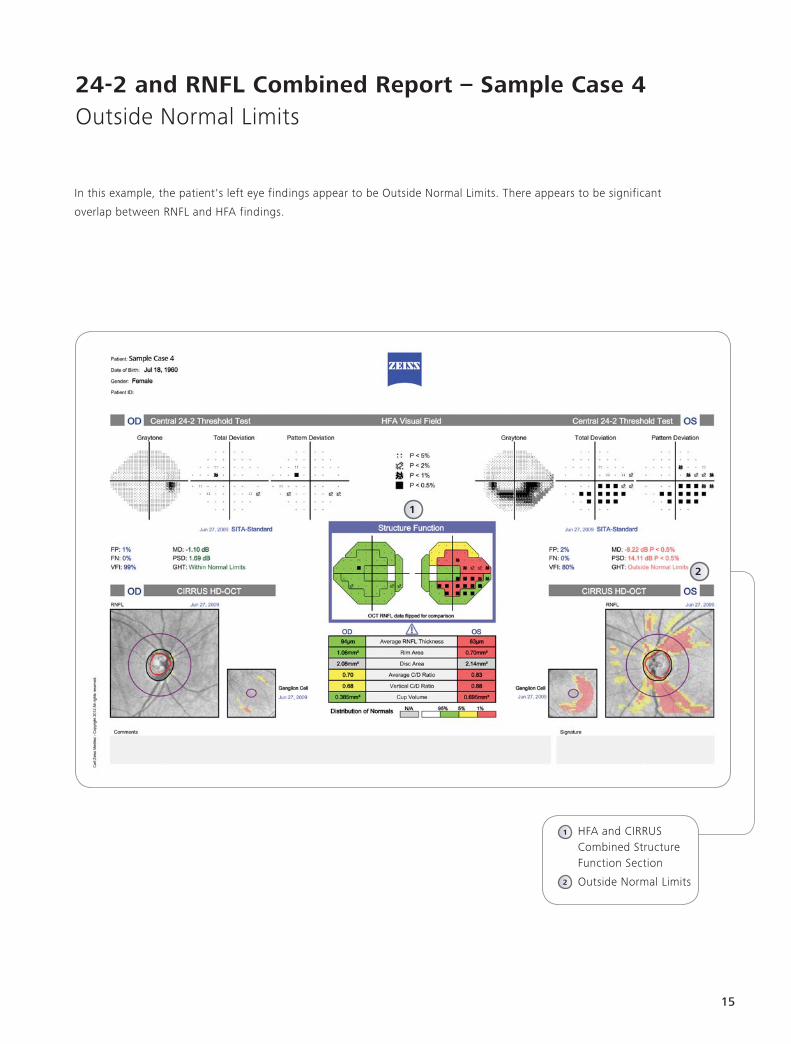
24-2 and RNFL Combined Report – Sample Case 4Outside Normal Limits
HFA and CIRRUS Combined Structure Function Section
Outside Normal Limits
1
2
2
1
In this example, the patient's left eye findings appear to be Outside Normal Limits. There appears to be significant
overlap between RNFL and HFA findings.
16
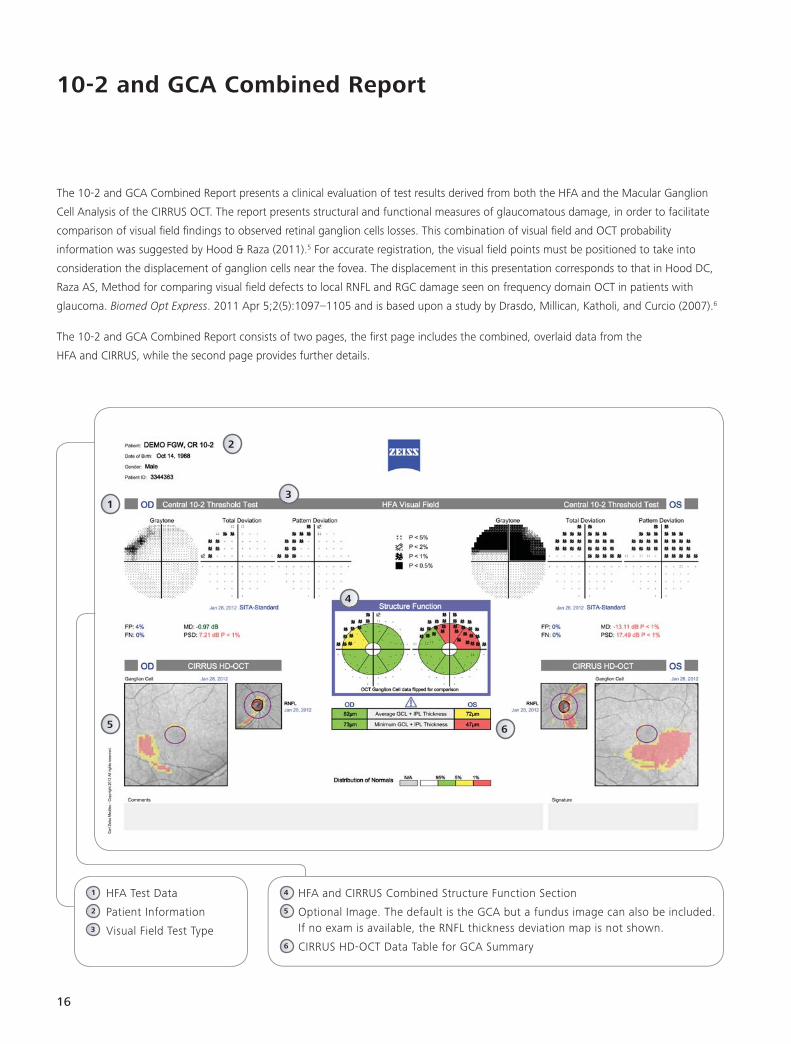
10-2 and GCA Combined Report
HFA and CIRRUS Combined Structure Function Section
Optional Image. The default is the GCA but a fundus image can also be included. If no exam is available, the RNFL thickness deviation map is not shown.
CIRRUS HD-OCT Data Table for GCA Summary
4
5
6
5
4
6
1 3
2
HFA Test Data
Patient Information
Visual Field Test Type
1
2
3
The 10-2 and GCA Combined Report presents a clinical evaluation of test results derived from both the HFA and the Macular Ganglion
Cell Analysis of the CIRRUS OCT. The report presents structural and functional measures of glaucomatous damage, in order to facilitate
comparison of visual fi eld fi ndings to observed retinal ganglion cells losses. This combination of visual fi eld and OCT probability
information was suggested by Hood & Raza (2011).5 For accurate registration, the visual fi eld points must be positioned to take into
consideration the displacement of ganglion cells near the fovea. The displacement in this presentation corresponds to that in Hood DC,
Raza AS, Method for comparing visual fi eld defects to local RNFL and RGC damage seen on frequency domain OCT in patients with
glaucoma. Biomed Opt Express. 2011 Apr 5;2(5):1097–1105 and is based upon a study by Drasdo, Millican, Katholi, and Curcio (2007).6
The 10-2 and GCA Combined Report consists of two pages, the fi rst page includes the combined, overlaid data from the
HFA and CIRRUS, while the second page provides further details.
17
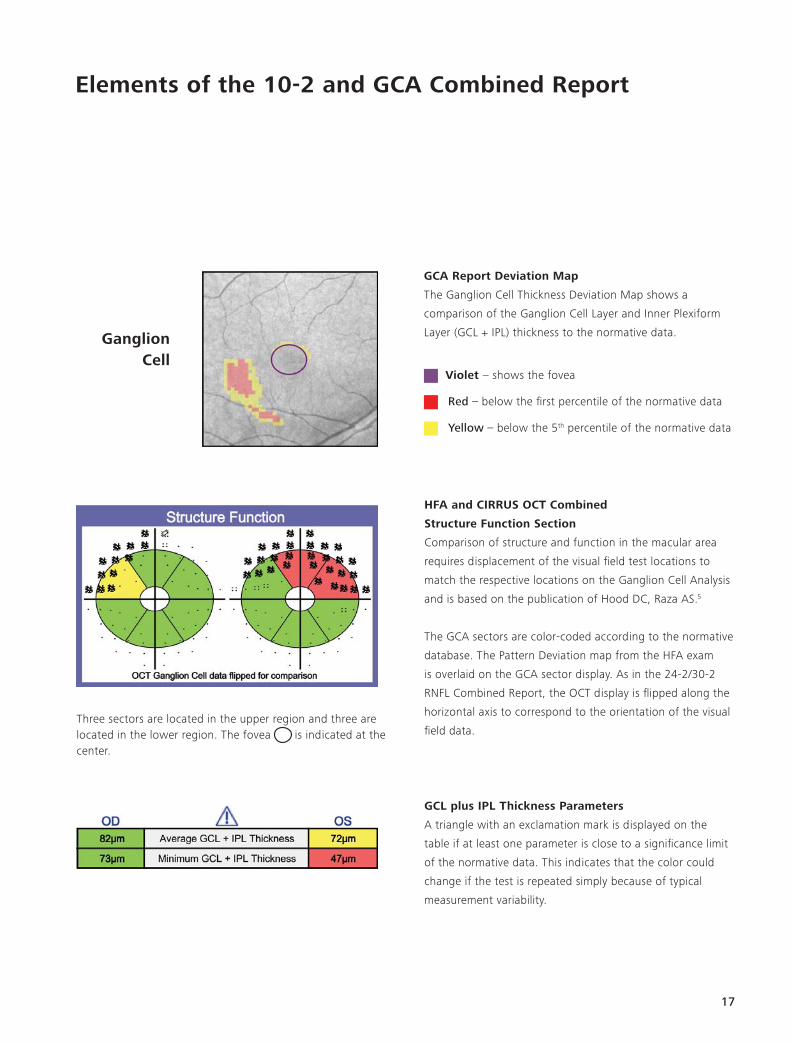
Ganglion Cell
• Violet – shows the fovea
• Red – below the fi rst percentile of the normative data
• Yellow – below the 5th percentile of the normative data
GCA Report Deviation Map
The Ganglion Cell Thickness Deviation Map shows a
comparison of the Ganglion Cell Layer and Inner Plexiform
Layer (GCL + IPL) thickness to the normative data.
HFA and CIRRUS OCT Combined
Structure Function Section
Comparison of structure and function in the macular area
requires displacement of the visual fi eld test locations to
match the respective locations on the Ganglion Cell Analysis
and is based on the publication of Hood DC, Raza AS.5
The GCA sectors are color-coded according to the normative
database. The Pattern Deviation map from the HFA exam
is overlaid on the GCA sector display. As in the 24-2/30-2
RNFL Combined Report, the OCT display is fl ipped along the
horizontal axis to correspond to the orientation of the visual
fi eld data.
GCL plus IPL Thickness Parameters
A triangle with an exclamation mark is displayed on the
table if at least one parameter is close to a signifi cance limit
of the normative data. This indicates that the color could
change if the test is repeated simply because of typical
measurement variability.
Elements of the 10-2 and GCA Combined Report
Three sectors are located in the upper region and three are located in the lower region. The fovea is indicated at the center.
18
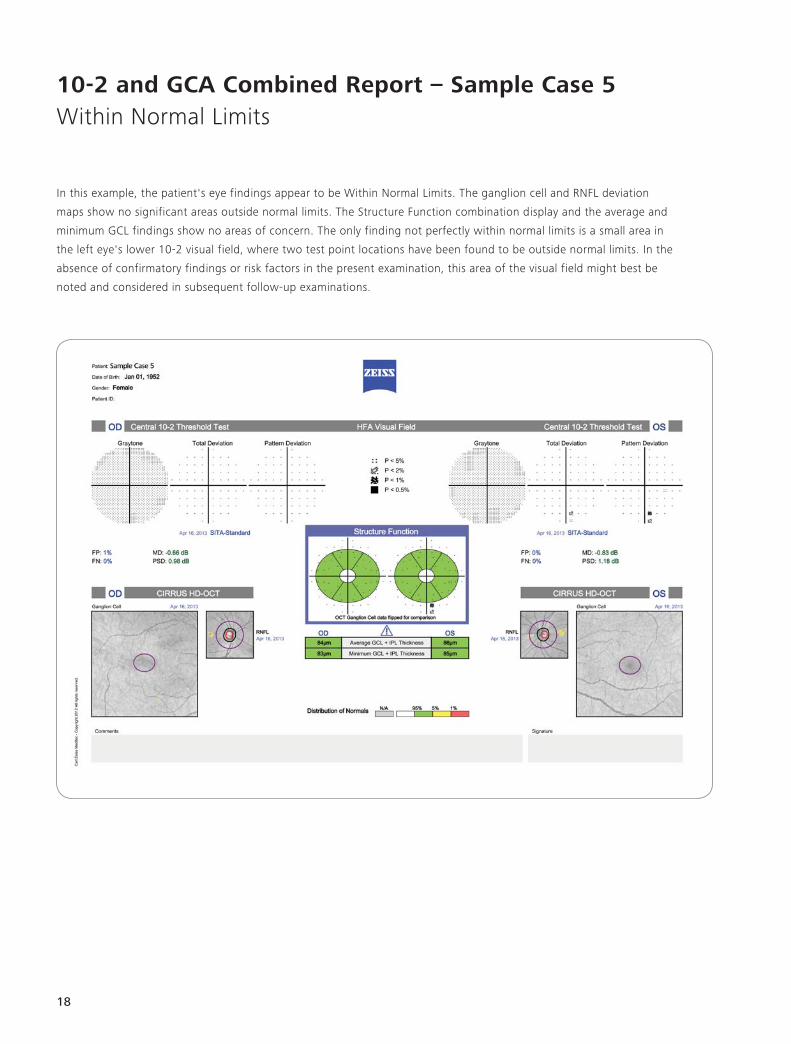
10-2 and GCA Combined Report – Sample Case 5Within Normal Limits
In this example, the patient's eye findings appear to be Within Normal Limits. The ganglion cell and RNFL deviation
maps show no significant areas outside normal limits. The Structure Function combination display and the average and
minimum GCL findings show no areas of concern. The only finding not perfectly within normal limits is a small area in
the left eye's lower 10-2 visual field, where two test point locations have been found to be outside normal limits. In the
absence of confirmatory findings or risk factors in the present examination, this area of the visual field might best be
noted and considered in subsequent follow-up examinations.
19
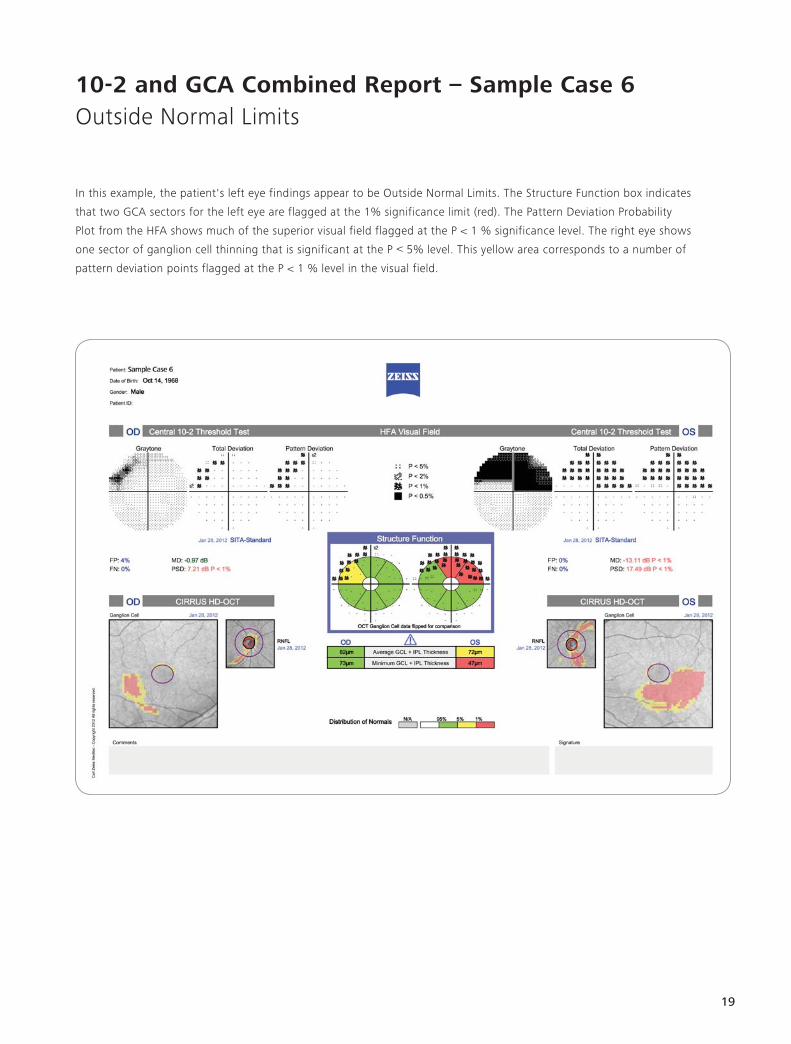
10-2 and GCA Combined Report – Sample Case 6Outside Normal Limits
In this example, the patient's left eye findings appear to be Outside Normal Limits. The Structure Function box indicates
that two GCA sectors for the left eye are flagged at the 1% significance limit (red). The Pattern Deviation Probability
Plot from the HFA shows much of the superior visual field flagged at the P < 1 % significance level. The right eye shows
one sector of ganglion cell thinning that is significant at the P < 5% level. This yellow area corresponds to a number of
pattern deviation points flagged at the P < 1 % level in the visual field.
20
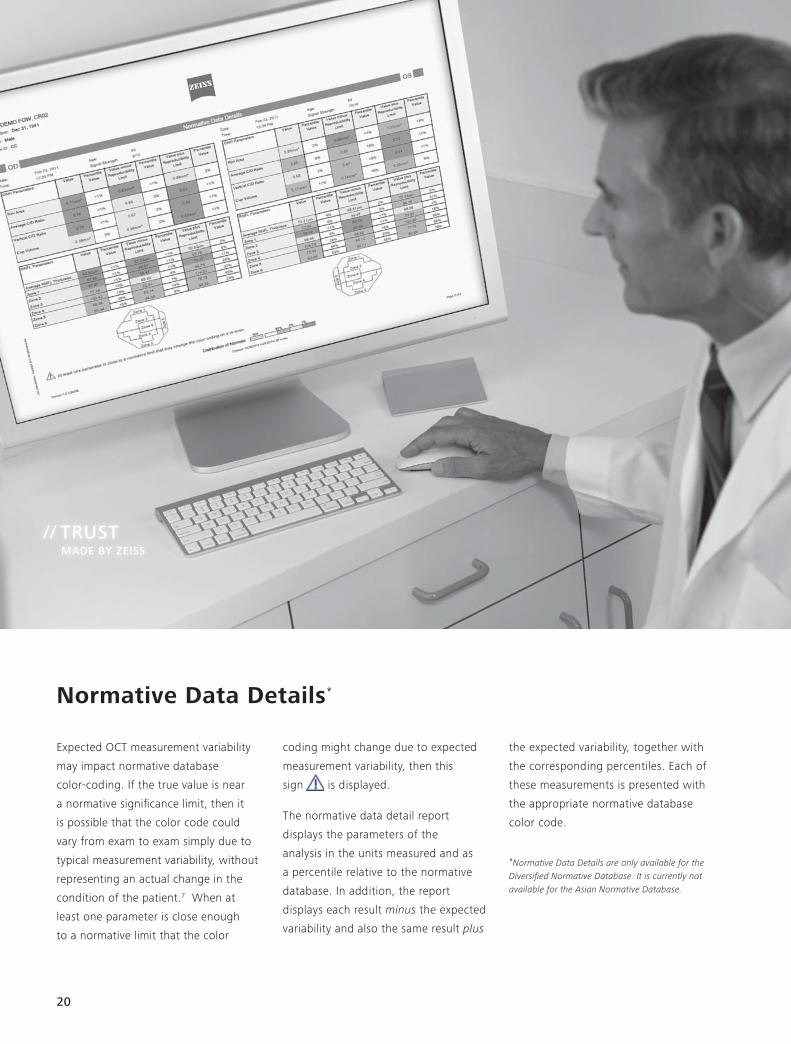
coding might change due to expected
measurement variability, then this
sign is displayed.
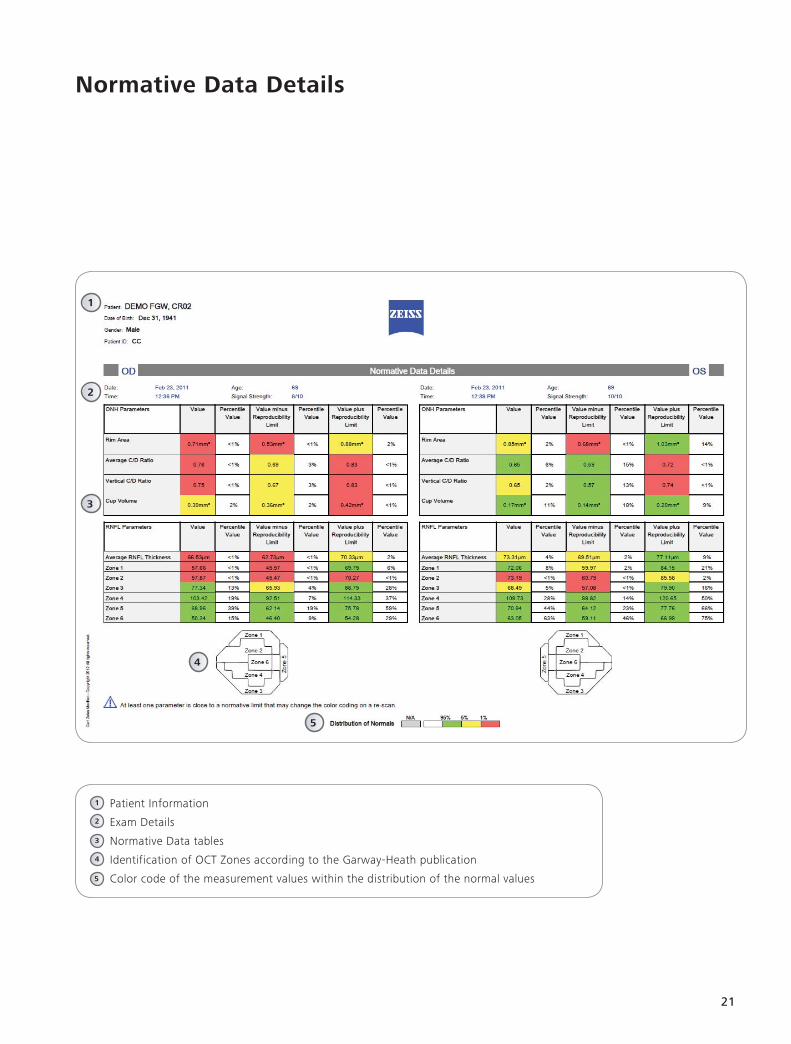
The normative data detail report
displays the parameters of the
analysis in the units measured and as
a percentile relative to the normative
database. In addition, the report
displays each result minus the expected
variability and also the same result plus
Expected OCT measurement variability
may impact normative database
color-coding. If the true value is near
a normative signifi cance limit, then it
is possible that the color code could
vary from exam to exam simply due to
typical measurement variability, without
representing an actual change in the
condition of the patient.7 When at
least one parameter is close enough
to a normative limit that the color
the expected variability, together with
the corresponding percentiles. Each of
these measurements is presented with
the appropriate normative database
color code.
*Normative Data Details are only available for the Diversifi ed Normative Database. It is currently not available for the Asian Normative Database.
Normative Data Details*
// TRUST MADE BY ZEISS
21
1
2
3
4
Normative Data Details
Patient Information
Exam Details
Normative Data tables
Identification of OCT Zones according to the Garway-Heath publication
Color code of the measurement values within the distribution of the normal values
1
2
3
4
5
5
22
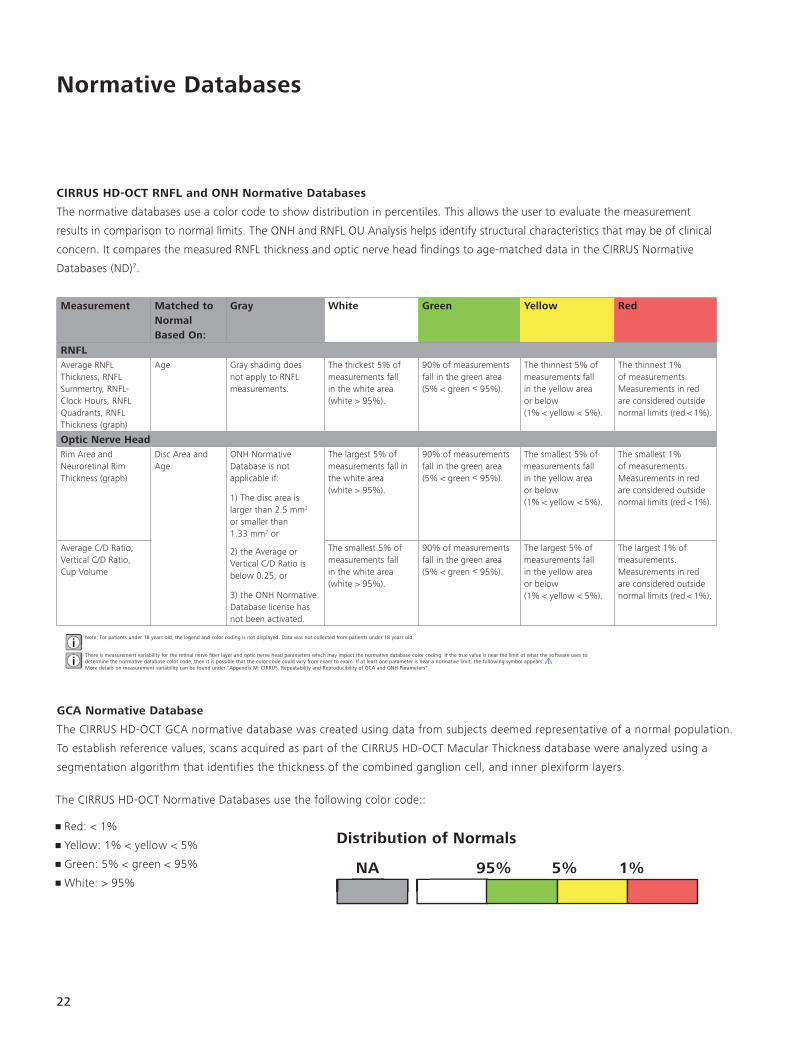
CIRRUS HD-OCT RNFL and ONH Normative Databases
The normative databases use a color code to show distribution in percentiles. This allows the user to evaluate the measurement
results in comparison to normal limits. The ONH and RNFL OU Analysis helps identify structural characteristics that may be of clinical
concern. It compares the measured RNFL thickness and optic nerve head fi ndings to age-matched data in the CIRRUS Normative
Databases (ND)7.
Distribution of Normals
NA 95% 5% 1%
Normative Databases
GCA Normative Database
The CIRRUS HD-OCT GCA normative database was created using data from subjects deemed representative of a normal population.
To establish reference values, scans acquired as part of the CIRRUS HD-OCT Macular Thickness database were analyzed using a
segmentation algorithm that identifies the thickness of the combined ganglion cell, and inner plexiform layers.
Measurement Matched to Normal Based On:
Gray White Green Yellow Red
RNFLAverage RNFL Thickness, RNFL Summertry, RNFL-Clock Hours, RNFL Quadrants, RNFL Thickness (graph)
Age Gray shading does not apply to RNFL measurements.
The thickest 5% of measurements fall in the white area (white > 95%).
90% of measurements fall in the green area (5% < green < 95%).
The thinnest 5% of measurements fall in the yellow areaor below (1% < yellow < 5%).
The thinnest 1% of measurements. Measurements in red are considered outside normal limits (red < 1%).
Optic Nerve HeadRim Area and Neuroretinal Rim Thickness (graph)
Disc Area and Age
ONH Normative Database is not applicable if:
1) The disc area is larger than 2.5 mm2 or smaller than 1.33 mm2 or
The largest 5% of measurements fall in the white area (white > 95%).
90% of measurements fall in the green area (5% < green < 95%).
The smallest 5% of measurements fallin the yellow areaor below (1% < yellow < 5%).
The smallest 1% of measurements. Measurements in red are considered outside normal limits (red < 1%).
Average C/D Ratio, Vertical C/D Ratio, Cup Volume
2) the Average or Vertical C/D Ratio is below 0.25, or
3) the ONH Normative Database license has not been activated.
The smallest 5% of measurements fall in the white area (white > 95%).
90% of measurements fall in the green area (5% < green < 95%).
The largest 5% of measurements fall in the yellow area or below (1% < yellow < 5%).
The largest 1% of measurements. Measurements in red are considered outside normal limits (red < 1%).
There is measurement variability for the retinal nerve fi ber layer and optic nerve head parameters which may impact the normative database color coding. If the true value is near the limit of what the software uses to determine the normative database color code, then it is possible that the color code could vary from exam to exam. If at least one parameter is near a normative limit, the following symbol appears: More details on measurement variability can be found under "Appendix M: CIRRUS: Repeatability and Reproducibility of GCA and ONH Parameters"
Note: For patients under 18 years old, the legend and color coding is not displayed. Data was not collected from patients under 18 years old.
Distribution
NA
The CIRRUS HD-OCT Normative Databases use the following color code::
• Red: < 1%
• Yellow: 1% < yellow < 5%
• Green: 5% < green < 95%
• White: > 95%
23
1 Bengtsson B, Heijl A. A visual fi eld index for calculation of glaucoma rate of progression. Am J Ophthalmol, Feb 2008; 145(2):343-53.
2 Arnalich-Montiel F, Casas-Llera P, Muñoz-Negrete FJ, Rebolleda G. Performance of glaucoma progression analysis software in a glaucoma population. Graefes Arch Clin Exp Ophthalmol, Mar 2009;247(3):391-7. Epub 2008 Nov 4.
3 Leske MC, Heijl A, Hyman L, Bengtsson B. Early Manifest Glaucoma Trial: design and baseline data. Ophthalmology, Nov 1999;106(11):2144–53.
4 Garway-Heath DF, Poinoosawmy D, Fitzke FW, Hitchings, RA. Mapping the visual fi eld to the optic disc in normal tension glaucoma eyes. Ophthalmology, Oct 2000;107(10):1809-15.
5 Hood DC, Raza AS. Method for comparing visual fi eld defects to local RNFL and RGC damage seen on frequency domain OCT in patients with glaucoma. Biomed Opt Express, May 2011;2(5):1097-1105.
6 Drasdo N, Millican CL, Katholi CR, Curcio CA. The length of Henle fi bers in the human retina and a model of ganglion receptive fi eld density in the visual fi eld. Vision Res, 2007 Oct;47(22):2901-11.
7 Normative Databases are optional features of CIRRUS HD-OCT that may not be available in all countries. If the feature is available in your country and it is not activated, please contact your local representative of Carl Zeiss Meditec for assistance.
FGW
.570
5
CZ-1
1/20
13
The
cont
ents
of t
he b
roch
ure
may
diff
er fr
om th
e cu
rrent
sta
tus
of a
ppro
val o
f the
pro
duct
in y
our c
ount
ry. P
leas
e co
ntac
t our
regi
onal
repr
esen
tativ
e fo
r mor
e in
form
atio
n. S
ubje
ct to
cha
nge
in
desig
n an
d sc
ope
of d
elive
ry a
nd a
s a
resu
lt of
ong
oing
tech
nica
l dev
elop
men
t. Hu
mph
rey,
HFA,
CIR
RUS,
FOR
UM, G
uide
d Pr
ogre
ssio
n An
alys
is, G
PA, V
isual
Fie
ld In
dex,
VFI
, SIT
A, S
ITA
Fast
, and
ST
ATPA
C ar
e ei
ther
trad
emar
ks o
r reg
ister
ed tr
adem
arks
of C
arl Z
eiss
. ©
201
3 by
Car
l Zei
ss M
edite
c, In
c. A
ll co
pyrig
hts
rese
rved
.
Carl Zeiss Meditec, Inc.5160 Hacienda DriveDublin, CA 94568USAwww.meditec.zeiss.com
Carl Zeiss Meditec AGGoeschwitzer Str. 51-5207745 JenaGermanywww.meditec.zeiss.com/forum
CIRRUS HD-OCTHumphrey Field Analyzer FORUM Glaucoma Workplace
Carl Zeiss Meditec AGGoeschwitzer Str. 51-5207745 JenaGermany www.meditec.zeiss.com
0297 0297