climate variability and irrigation water use joel o. paz extension agrometeorologist biological and...
Post on 19-Dec-2015
216 views
TRANSCRIPT

Climate Variability and Climate Variability and Irrigation Water UseIrrigation Water Use
Joel O. PazExtension Agrometeorologist
Biological and Agricultural Engineering DepartmentThe University of Georgia
Griffin, GA
SWGA Water Summit XIVJune 17, 2008
Albany, GA

Climate Variability2-3 months
Inter-annual
Decadal
Climate ChangeSeveral decades
50+ years
Centuries

Changing Ocean TemperatureChanging Ocean Temperature
Impacts our climate here in the U.S. and across the globe
Image courtesy of NOAA Earth Science Laboratory

• El Niño is one phase of an oscillation in ocean temperatures and atmospheric pressure in the eastern Pacific Ocean that can steer weather systems in the southeastern US and elsewhere.
• El Niño is considered the warm phase of the oscillation.
• La Niña (sometimes known as El Viejo) is the opposite atmospheric pattern from El Niño.
El Niño-Southern Oscillation (ENSO)El Niño-Southern Oscillation (ENSO)

SST and DroughtSST and Drought
Modeling work has now Modeling work has now attributed the attributed the major North American droughtsmajor North American droughts of the last of the last century-and-a-half to global circulation century-and-a-half to global circulation anomalies anomalies forced by tropical SSTsforced by tropical SSTs with the with the tropical oceans playing an important, and tropical oceans playing an important, and probably dominant role.probably dominant role.
Bulletin of the American Meteorological Society (BAMS), October 2007

SST since 1950SST since 1950
El Niño
La Niña
neutral

ENSO Impacts in the SoutheastENSO Impacts in the Southeast
La Niña
• Dry Fall, Winter, and Spring• Greatly increases Atlantic hurricanes• Increases tornadoes in the deep south• Greatly increases wildfire risks
EL Niño
• Very wet winter and spring• Greatly reduces Atlantic hurricanes• Decreases tornadoes in the tornado alley
Neutral ENSO phase increases the risk of severe freezes by 3:1 odds.

Southeast Climate ConsortiumSoutheast Climate ConsortiumMembers
National Oceanic-Atmospheric Administration
USDA Risk Management AgencyUSDA Cooperative State Research, Extension and Education Service
Funding Support

Southeast Climate ConsortiumSoutheast Climate Consortium
Mission:Mission:To use advances in climate sciences, To use advances in climate sciences, including improved capabilities to forecast including improved capabilities to forecast seasonal climate, to provide scientifically seasonal climate, to provide scientifically sound information and decision support sound information and decision support tools for agriculture, forestry, and water tools for agriculture, forestry, and water resources management in the resources management in the Southeastern USA. Southeastern USA.

Management DecisionsManagement Decisions Variety selectionVariety selection Planting datesPlanting dates Acreage allocationAcreage allocation Amount and type of crop insuranceAmount and type of crop insurance MarketingMarketing Purchase inputsPurchase inputs

Analysis of HistoricalAnalysis of HistoricalWeather DataWeather Data
Year: 1 2 3 4 5 6 7 8 9 10 11 12 13 14 15 …16

Analysis of HistoricalAnalysis of HistoricalWeather DataWeather Data
Year: 1 2 3 4 5 6 7 8 9 10 11
Neutral
12 13 14 15
El NiñoEl Niño La NiñaLa Niña
…16

Neutral
El NiñoEl Niño
La NiñaLa Niña
Location ShiftLocation Shift
La Niña
El Niño

Regional Crop Yield MapRegional Crop Yield Map

Climate InformationClimate Informationand and
Crop SimulationCrop Simulation

Application: Crop SimulationApplication: Crop Simulation
Historical weather data
ENSO Phases
Planting dates
Soil types
Select AL, FL, GAcounties
Crop SimulationModels
Yield
Total amount of
irrigation
No. of irrigationevents

292296283Georgia
212215204Florida
282286264Alabama
La NiñaNeutralEl NiñoState
292296283Georgia
212215204Florida
282286264Alabama
La NiñaNeutralEl NiñoState
Average cumulative irrigation (mm) during the peanut growing season under
different ENSO phases
Pooled data:
Planting dates (9)Soil types (3 per county)

CDF : Irrigation AmountCDF : Irrigation Amount
0.00
0.10
0.20
0.30
0.40
0.50
0.60
0.70
0.80
0.90
1.00
0 50 100 150 200 250 300 350 400 450 500
Irrigation Amount (mm)
Pro
bab
ility
El Niño
Worth County

CDF : Irrigation AmountCDF : Irrigation Amount
0.00
0.10
0.20
0.30
0.40
0.50
0.60
0.70
0.80
0.90
1.00
0 50 100 150 200 250 300 350 400 450 500
Irrigation Amount (mm)
Pro
bab
ility
El Niño
Neutral
Worth County

CDF : Irrigation AmountCDF : Irrigation Amount
0.00
0.10
0.20
0.30
0.40
0.50
0.60
0.70
0.80
0.90
1.00
0 50 100 150 200 250 300 350 400 450 500
Irrigation Amount (mm)
Pro
bab
ility
El Niño
Neutral
La Niña
Worth County

CDF : Irrigation AmountCDF : Irrigation AmountCalhoun County
0.00
0.10
0.20
0.30
0.40
0.50
0.60
0.70
0.80
0.90
1.00
0 50 100 150 200 250 300 350 400 450 500
Irrigation Amount (mm)
Pro
bab
ility
El Niño
Neutral
La Niña

Irrigation AmountIrrigation Amount
-20
-15
-10
-5
0
5
10
15
20
25
30
35
Planting Date
Ch
an
ge
in Ir
rig
ati
on
Am
ou
nt
(%)
El Niño
Neutral
La Niña
Georgia
Apr 16 Apr 23 May 1 May 8 May 15 May 22 May 29 June 5

La Niña
1200
1300
1400
1500
1600
1700
1800
1900
2000
Apr 16 Apr 23 May 1 May 8 May 15 May 22 May 29 June 5 June 12
Planting Date
Yie
ld (
kg
/ha
)Best window
Simulated Peanut YieldSimulated Peanut YieldNon-IrrigatedNon-Irrigated

El Niño
1200
1300
1400
1500
1600
1700
1800
1900
2000
Apr 16 Apr 23 May 1 May 8 May 15 May 22 May 29 June 5 June 12
Planting Date
Yie
ld (
kg
/ha
)
Simulated Peanut YieldSimulated Peanut YieldNon-IrrigatedNon-Irrigated

1200
1300
1400
1500
1600
1700
1800
1900
2000
Apr 16 Apr 23 May 1 May 8 May 15 May 22 May 29 June 5 June 12
Planting Date
Yie
ld (
kg
/ha
)El Niño
La Niña
Simulated Peanut YieldSimulated Peanut YieldNon-IrrigatedNon-Irrigated

AgClimate WebsiteAgClimate Websitehttp://www.agclimate.org

AgClimate ToolsAgClimate Tools

Simulated Crop YieldSimulated Crop Yield
• Select 1 planting date
• Compare ENSO phases

Simulated Crop YieldSimulated Crop Yield

County Yield DatabaseCounty Yield Database

For additional climate information For additional climate information visit visit www.agclimate.orgwww.agclimate.org
For current weatherFor current weather
visit visit www.georgiaweather.netwww.georgiaweather.net
Dr. Joel Paz UGA BAE Dept

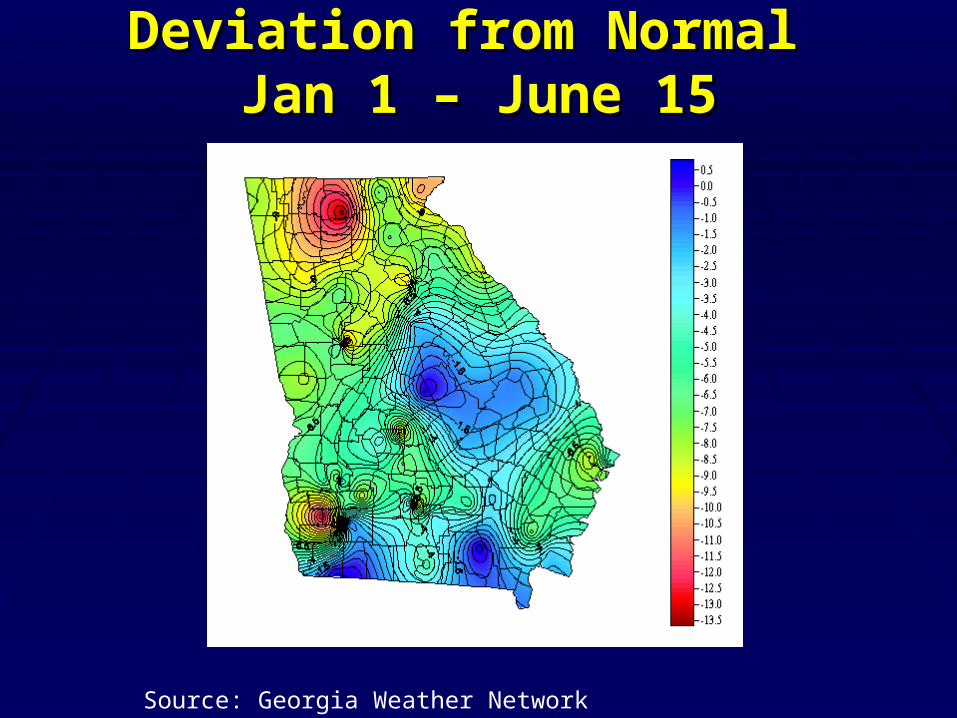
Deviation from Normal Deviation from Normal Jan 1 – June 15Jan 1 – June 15
Source: Georgia Weather Network (www.georgiaweather.net)